2014 economic background - hkeconomy.gov.hk · the debt market 5.15 - 5.17 the stock and...
TRANSCRIPT

2014 ECONOMIC BACKGROUND AND
2015 PROSPECTS
ECONOMIC ANALYSIS DIVISION ECONOMIC ANALYSIS AND BUSINESS FACILITATION UNIT
FINANCIAL SECRETARY’S OFFICE GOVERNMENT OF THE
HONG KONG SPECIAL ADMINISTRATIVE REGION
February 2015

CONTENTS
Paragraphs CHAPTER 1 : OVERVIEW OF ECONOMIC PERFORMANCE IN 2014
Overall situation 1.1 - 1.3 The external sector 1.4 - 1.6 The domestic sector 1.7 - 1.8 The labour sector 1.9 The asset markets 1.10 - 1.11 Inflation 1.12 - 1.13 GDP by major economic sector 1.14 - 1.16 Other economic developments 1.17 - 1.22 Box 1.1 An update on retail sales trends and performance Box 1.2 Diffusion indices on small and medium-sized enterprises (an update)
CHAPTER 2 : ECONOMIC OUTLOOK FOR 2015 AND THE MEDIUM TERM
Major external developments 2.1 Global economic outlook 2.2 - 2.8 Monetary conditions 2.9 - 2.10 World inflation and global commodity prices 2.11 - 2.13 Exchange rates and price competitiveness 2.14 - 2.16 Major sources of uncertainty 2.17 - 2.18 Outlook for the Hong Kong economy in 2015 2.19 - 2.23 Medium-term outlook for the Hong Kong economy 2.24 - 2.29 Box 2.1 Deflation risks in selected economies Box 2.2 Oil price fluctuations and its impact on the global economy
CHAPTER 3 : THE EXTERNAL SECTOR
Goods trade Total exports of goods 3.1 - 3.5 Imports of goods 3.6 Services trade Exports of services 3.7 Imports of services 3.8 Goods and services balance 3.9 Other developments 3.10 - 3.12 CHAPTER 4 : DEVELOPMENTS IN SELECTED SECTORS
Property 4.1 - 4.15 Land 4.16 - 4.17 Tourism 4.18 - 4.20 Logistics 4.21 - 4.23 Transport 4.24 - 4.25 Energy and Environment 4.26 - 4.27 Box 4.1 The Long Term Housing Strategy Box 4.2 Characteristics of cross-boundary trip makers

CHAPTER 5 : THE FINANCIAL SECTOR
Interest rates and exchange rates 5.1 - 5.5 Money supply and banking sector 5.6 - 5.14 The debt market 5.15 - 5.17 The stock and derivatives markets 5.18 - 5.24 Fund management and investment funds 5.25 Insurance sector 5.26 Highlights of policy and market developments 5.27 CHAPTER 6 : THE LABOUR SECTOR
Overall labour market situation 6.1 Labour force and total employment 6.2 - 6.3 Profile of unemployment 6.4 - 6.7 Profile of underemployment 6.8 Profile of employment in establishments 6.9 - 6.10 Vacancies 6.11 - 6.14 Wages and earnings 6.15 - 6.19 Highlights of recent labour-related measures and policy developments
6.20 - 6.23
Box 6.1 Labour market adjustments under different economic cycles
CHAPTER 7 : PRICES
Consumer prices 7.1 - 7.3 Costs of factor inputs and import prices 7.4 - 7.5 Output prices 7.6 GDP deflator 7.7 Box 7.1 Recent movements of food and commodity prices in the international markets
CALENDAR OF EVENTS OF SIGNIFICANCE FOR THE HONG KONGECONOMY IN 2014 STATISTICAL APPENDIX

1
CHAPTER 1 : OVERVIEW OF ECONOMIC PERFORMANCE IN 2014 Summary
The Hong Kong economy grew only modestly in 2014 by 2.3%, down from 2.9% in 2013, as the slow global economic recovery weighed on exports of goods, tourist spending slackened, and domestic demand also weakened. Year-on-year economic growth stayed modest through the four quarters.
Total exports of goods grew slightly in 2014, confined by subdued global demand conditions, particularly those in Europe and Japan. The performance was rather unsteady during the year, with momentum faltering again in the fourth quarter, and the performance diverged across markets.
Exports of services eased visibly to grow only marginally in 2014, marking the slowest growth since 2009. The main drag stemmed from a fall-off in visitor spending on big-ticket items, though a high base of comparison was also partly to blame. Meanwhile, other services exports remained generally lacklustre, also affected by subdued global demand.
The domestic sector also softened in growth momentum in 2014. Private consumption expenditure saw only moderate growth. Investment expenditure slackened to a slight decline, mainly due to sluggish machinery and equipment acquisition, which more than offset the rebound in building and construction activity.
The labour market remained in a state of full employment. Total employment growth continued to outpace that of labour force, with the seasonally adjusted unemployment rate still staying low at 3.3% in the fourth quarter. Wages and earnings attained further moderate growth.
The stock markets worldwide were rather volatile during 2014. The local stock market started the year soft, but rallied successively since mid-March. After hitting a six-year high in early September, the stock market fell back amid increasing concern about the global economic outlook and the spill-over from the oil price slump, though still finished the year slightly higher. The local property market staged a revival since the second quarter, with both trading volume and flat prices picking up.
Underlying inflation followed an easing trend in 2014, thanks primarily to mild global inflation and also receding domestic cost pressures. For 2014 as a whole, underlying inflation averaged 3.5%, down further from 4.0% in 2013.

2
Overall situation
1.1 The Hong Kong economy remained on a modest expansion path in 2014, with real GDP growth staying below the past ten-year trend for the third consecutive year. Six years after the outbreak of the global financial crisis, slow global economic recovery still reigned, and the pace remained highly uneven. The US economy gained more traction, prompting the Federal Reserve (Fed) to end its asset purchases in October. In stark contrast, the central banks in the eurozone and Japan pursued further easing to fend off deflation risks and jump-start their ailing economies. Major emerging market economies also saw growth slowdown, with divergence in performance, featured by a steady Mainland economy and general resilience in the rest of emerging Asia, as opposed to the notable deceleration in Russia and Brazil. Meanwhile, heightened geopolitical tensions in Eastern Europe and the Middle East, coupled with diverging monetary policies among major central banks, agitated the global financial markets, placing further constraints on the expansion of international economic activity. As such, Hong Kong’s goods exports only achieved a meagre growth in 2014. Moreover, exports of services eased visibly, reflecting mainly weaker visitor spending, while the domestic sector concurrently slowed in growth momentum. However, the labour market held largely stable and employment attained further moderate growth. Thanks to mild imported inflation and receding local cost pressures, underlying inflation trended lower in 2014, marking the third consecutive year of easing. 1.2 For 2014 as a whole, Gross Domestic Product (GDP)(1) expanded by 2.3% in real terms, slower than the 2.9% growth in 2013 and the annual average growth of 3.9% in the past decade. In terms of the quarterly profile, the year-on-year growth rate of real GDP slowed to 2.6% and 1.8% respectively in the first and second quarters, followed by a rebound to 2.7% in the third quarter, before moderating to 2.2% in the fourth quarter. On a seasonally adjusted quarter-to-quarter comparison(2), the performance was rather unsteady. Having risen by 0.5% in the first quarter, real GDP edged down by 0.2% in the second quarter, and then rebounded visibly by 1.4% in the third quarter, before seeing growth easing back to 0.4% in the fourth quarter. 1.3 Economic growth momentum of Hong Kong softened in the fourth quarter of 2014, in part because goods exports decelerated again to barely grow, in tandem with worsening global business sentiment in the manufacturing sector, as deflation risks in Europe and Japan built up and slowdown in some major emerging economies continued. The more volatile financial and

3
currency markets spurred by the monetary policy divergence and oil price slump exacerbated the external headwinds. In the quarter, the local economy also experienced some disruptions to economic activities imparted by the “Occupy Movement”, with retail sales and restaurant receipts showing a renewed slackening and the number of non-Mainland visitors reverting to a decline. Yet, the labour market remained remarkably stable and Mainland visitor arrivals continued to grow notably, helping the economy to expand modestly further in the midst of the choppy external environment.
-6
-4
-2
0
2
4
6
8
10
2005 2006 2007 2008 2009 2010 2011 2012 2013 2014
Rate of change in real terms
Diagram 1.1 : The Hong Kong economy showed modest growth in 2014
Percent(a) Annual profile
Q12010
Q12011
Q12012
Q12013
Q12014
-4
-2
0
2
4
6
8
10
Year-on-year rate of changein real terms
Percent
Seasonally adjusted quarter-to-quarterrate of change in real terms
(b) Quarterly profile

4
The external sector 1.4 Total exports of goods compiled under the GDP accounting framework grew by a meagre 1.0% in real terms in 2014, following a rise of 6.5% in 2013. Excluding the distortions by the wild fluctuations in exports of non-monetary gold, export growth of goods stayed modest in 2014, moderating somewhat from the previous year. Exports to the US fared better among advanced markets, logging moderate growth for the year with acceleration in the fourth quarter, as the economy there picked up steam since the second quarter. Exports to Japan fell notably, and those to EU relapsed to a decline in the second half, as their import demand was held down by their subdued economic conditions and the notable depreciation of their currencies against the US dollar. The performance of other markets also diverged, with exports to the Mainland and newly industrialised economies saw modest to moderate growth, but those to India and some ASEAN markets picked up to show notable growth. 1.5 In terms of quarterly profile on a year-on-year basis, merchandise exports after excluding non-monetary gold in real terms reverted from a 0.3% decline in the first quarter to 4.3% and 4.8% growth respectively in the second and third quarters, before relapsing to a 0.4% decline in the final quarter. Similarly, the seasonally adjusted quarter-to-quarter comparison indicated that merchandise exports after excluding non-monetary gold in real terms contracted in the first quarter, resumed growth in the second and third quarters, yet fell back in the fourth quarter. 1.6 Exports of services slowed markedly in 2014, rising only by 0.5% in real terms for the whole year, denoting the slowest growth since 2009. The main drag stemmed from the setback in exports of travel services, as a marked decline in visitor spending on big-ticket items took its toll against a high base of comparison, even though the drag lessened in the second half of the year. Exports of financial and other business services also decelerated somewhat, while exports of trade-related services remained lacklustre, both growing only mildly for 2014 as a whole. Exports of transportation services showed some relative improvement, thanks to vibrant growth in cross-boundary passenger flows.
5
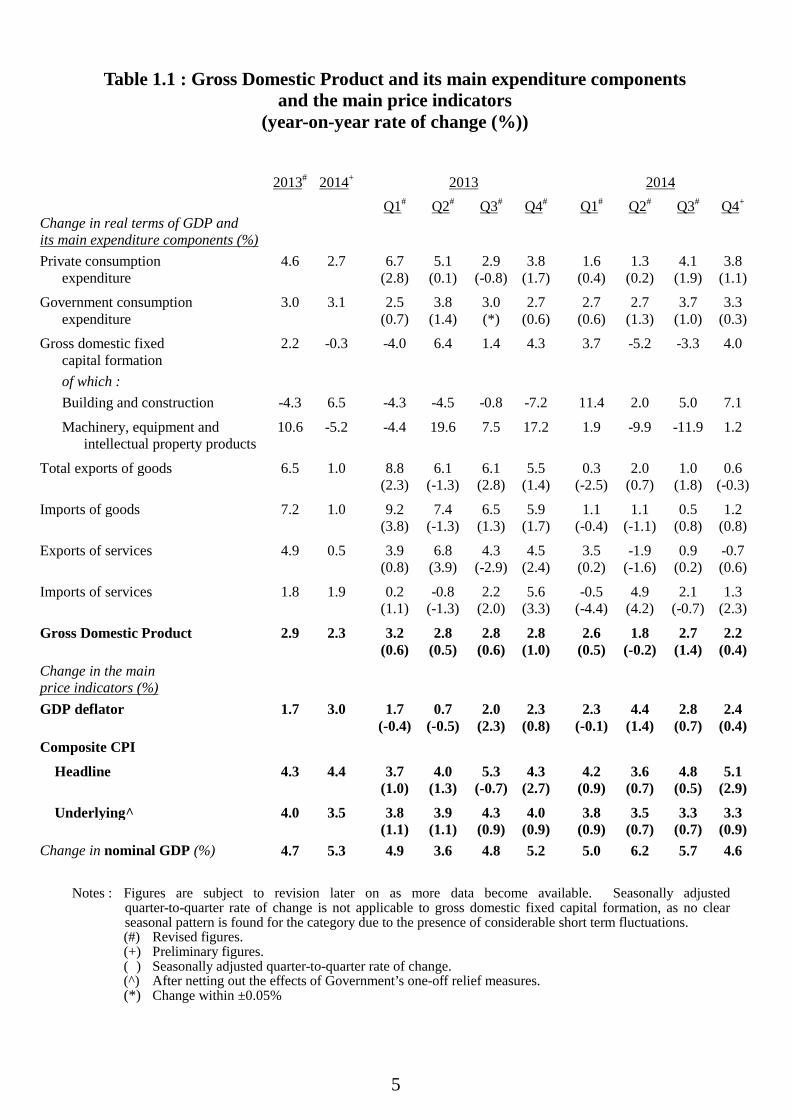
Table 1.1 : Gross Domestic Product and its main expenditure components and the main price indicators
(year-on-year rate of change (%))
2013# 2014+
2013
2014
Q1# Q2# Q3# Q4#
Q1# Q2# Q3# Q4+
Change in real terms of GDP and its main expenditure components (%)
Private consumption 4.6 2.7
6.7 5.1 2.9 3.8
1.6 1.3 4.1 3.8 expenditure (2.8) (0.1) (-0.8) (1.7) (0.4) (0.2) (1.9) (1.1)
Government consumption 3.0 3.1
2.5 3.8 3.0 2.7
2.7 2.7 3.7 3.3 expenditure (0.7) (1.4) (*) (0.6) (0.6) (1.3) (1.0) (0.3)
Gross domestic fixed 2.2 -0.3
-4.0 6.4 1.4 4.3
3.7 -5.2 -3.3 4.0 capital formation of which : Building and construction -4.3 6.5 -4.3 -4.5 -0.8 -7.2 11.4 2.0 5.0 7.1
Machinery, equipment and 10.6 -5.2
-4.4 19.6 7.5 17.2
1.9 -9.9 -11.9 1.2 intellectual property products
Total exports of goods 6.5 1.0
8.8 6.1 6.1 5.5
0.3 2.0 1.0 0.6 (2.3) (-1.3) (2.8) (1.4) (-2.5) (0.7) (1.8) (-0.3)
Imports of goods 7.2 1.0
9.2 7.4 6.5 5.9
1.1 1.1 0.5 1.2 (3.8) (-1.3) (1.3) (1.7) (-0.4) (-1.1) (0.8) (0.8)
Exports of services 4.9 0.5
3.9 6.8 4.3 4.5
3.5 -1.9 0.9 -0.7 (0.8) (3.9) (-2.9) (2.4) (0.2) (-1.6) (0.2) (0.6)
Imports of services 1.8 1.9
0.2 -0.8 2.2 5.6
-0.5 4.9 2.1 1.3 (1.1) (-1.3) (2.0) (3.3) (-4.4) (4.2) (-0.7) (2.3)
Gross Domestic Product 2.9 2.3
3.2 2.8 2.8 2.8
2.6 1.8 2.7 2.2 (0.6) (0.5) (0.6) (1.0) (0.5) (-0.2) (1.4) (0.4) Change in the main price indicators (%)
GDP deflator 1.7 3.0
1.7 0.7 2.0 2.3
2.3 4.4 2.8 2.4 (-0.4) (-0.5) (2.3) (0.8) (-0.1) (1.4) (0.7) (0.4) Composite CPI
Headline 4.3 4.4
3.7 4.0 5.3 4.3
4.2 3.6 4.8 5.1 (1.0) (1.3) (-0.7) (2.7) (0.9) (0.7) (0.5) (2.9)
Underlying^ 4.0 3.5
3.8 3.9 4.3 4.0
3.8 3.5 3.3 3.3 (1.1) (1.1) (0.9) (0.9) (0.9) (0.7) (0.7) (0.9) Change in nominal GDP (%) 4.7 5.3 4.9 3.6 4.8 5.2 5.0 6.2 5.7 4.6
Notes : Figures are subject to revision later on as more data become available. Seasonally adjusted
quarter-to-quarter rate of change is not applicable to gross domestic fixed capital formation, as no clear seasonal pattern is found for the category due to the presence of considerable short term fluctuations.
(#) Revised figures. (+) Preliminary figures. (+) Seasonally adjusted quarter-to-quarter rate of change. (^) After netting out the effects of Government’s one-off relief measures. (*) Change within ±0.05%

6
The domestic sector 1.7 Domestic demand slowed somewhat in 2014. Private consumption expenditure (PCE) grew modestly by 2.7% in real terms in 2014, down from the 4.6% growth in the preceding year, with the moderation concentrated in the first half in tandem with the meagre economic growth. PCE saw some relative improvement in the second half of the year, underpinned by the faster employment growth, while such incidental factors as positive wealth effects and the launch of new smartphone models also provided support. Separately, government consumption expenditure grew at a steady pace of 3.1% in real terms in 2014, broadly the same as the 3.0% growth in 2013.
Table 1.2 : Consumer spending by major component(a)
(year-on-year rate of change in real terms (%))
Of which :
Total consumer
spending in the domestic
market(a) Food Durables Non-
durables Services
Residents’ expenditure
abroad Visitor
spending
Private consumption expenditure(b)
2013 Annual 6.7 4.6 6.8 15.4 3.4 6.5 17.3 4.6
H1 9.0 4.0 14.2 19.6 4.6 2.6 22.7 5.9
H2 4.6 5.3 0.4 11.6 2.3 10.3 12.7 3.4
Q1 8.8 4.2 27.8 12.3 4.4 5.1 17.9 6.7 Q2 9.2 3.7 -0.3 26.9 4.9 0.2 27.6 5.1 Q3 4.8 5.2 -0.7 12.8 2.4 6.6 15.0 2.9 Q4 4.4 5.4 1.3 10.5 2.1 14.2 10.6 3.8 2014 Annual 1.6 1.8 5.3 -2.0 2.5 3.2 -2.5 2.7
H1 0.9 3.4 0.1 -2.6 2.2 3.2 -0.7 1.4
H2 2.3 0.3 10.4 -1.4 2.9 3.3 -4.3 4.0
Q1 3.5 3.1 4.0 6.3 2.2 -1.9 9.8 1.6 Q2 -1.6 3.6 -5.2 -10.4 2.2 8.4 -10.6 1.3 Q3 2.4 1.5 4.6 -0.1 3.4 3.4 -4.6 4.1 Q4 2.3 -0.9 14.9 -2.5 2.5 3.2 -4.1 3.8
Notes : (a) Consumer spending in the domestic market comprises both local consumer and visitor spending, which are not separable from the survey data.
(b) Private consumption expenditure is obtained by deducting visitor spending from the total consumer spending in the domestic market, and adding back residents’ expenditure abroad.

7
Box 1.1 An update on retail sales trends and performance
The retail sector is important to the Hong Kong economy. The industry directly contributed 4.3% to Hong Kong’s GDP in 2013 and some 330 000 jobs, equivalent to 9% of total employment, in the first three quarters of 2014. This box article provides a brief analysis on the recent trends of retail sales with a focus on volume movement by outlet type, as well as an update of Box 1.2 in the Half-yearly Economic Report 2014 which covered the retail sales performance up to the second quarter of 2014.
Retail sales exhibited much resilience during the global financial crisis of 2008-2009 and expanded rapidly in the post-crisis years. Overall sales volume attained a cumulative growth of 63.1% from 2009 to 2014. Analysed by retail outlet, “electrical goods and photographic equipment, and miscellaneous consumer durable goods” saw the fastest increase in business volume, followed by “jewellery, watches and clocks, and valuable gifts”, “medicines and cosmetics”, and department stores. The strength of sales in these outlet types suggests that, apart from improved local consumer sentiment amid the generally favourable job market conditions and the Government’s various measures to support the domestic economy in recent years, sustained vibrancy in inbound tourism also played a key role. However, retail sales growth weakened to a mere 0.6% in volume terms in 2014, substantially slower than the average annual growth of 12.8% in 2010-2013. The notable decline in the sales of luxury items in 2014 was the major contributory factor (Chart 1).
The quarterly profile in Chart 2 revealed that retail sales saw wide fluctuations in 2014. The 4.7% moderate year-on-year growth in the first quarter was followed by a 7.2% plunge in the second quarter. Retail sales then rebounded modestly by 1.4% in the third quarter, and picked up somewhat to a 3.1% growth in the final quarter of 2014.
The plunge in the second quarter of 2014 was related to luxury items, mainly as a result of the high base caused by the spike of gold sales to visitors in 2013 amid the sharp correction in gold prices. Such drag on overall retail sales lessened somewhat in the third and fourth quarters. Moreover, despite the sustained rapid increases in visitor arrivals, sales growth in department stores and medicines and cosmetics also moderated in 2014. All these conceivably reflected some changes in tourists’ spending profile. In the latter part of 2014, there was a surge in the sales of electrical and electronic goods, thanks to the launch of new smartphones, supporting retail sales in the fourth quarter.
0
100
200
300
400
500
600
50
100
150
200
250
300
350
2005 2006 2007 2008 2009 2010 2011 2012 2013 2014
All retail outlets Food, alcoholic drinks & tobacco
Supermarkets Clothing, footwear & allied products
Medicines and cosmetics Department stores
Jewellery, watches & clocks, & valuable gifts Others
Electrical goods & photo. equipment,& miscellaneous consumer durable goods (RHS)
Chart 1 : After surging in the post-crisis years, retail sales slowed in 2014Volume index (2005=100) Volume index (2005=100)

8
Box 1.1 (Cont’d)
The monthly profile in Chart 3 can help explain the subtlety in retail sales movements in the latter part of 2014, when the “Occupy Movement” was in progress. As mentioned above, the sales performance of the luxury items and electrical and electronic goods accounted for much of the volatility in overall retail sales over the course of 2014. Excluding these volatile components to better reflect the underlying local consumption strength, retail sales, after maintaining some moderate volume growth in the first eight months of 2014, slowed visibly to a modest growth of 1.0% in September and declined by 1.4% in October. Conceivably, such a sharp turn in the underlying growth trend of retail sales partly reflected the weaker consumer sentiment amid the disruptions caused by the “Occupy Movement”. Such underlying retail sales reverted to grow by 2.9% in November but declined again by 1.5% in December.
Retail sales performance in the period ahead will depend mainly on the future developments in inbound tourism, external environment, and local job conditions. Given the various uncertainties, the Government will continue to closely monitor the situation.
5.7 5.2 5.7 6.1 6.67.8
12.613.5
11.7
7.0
4.2
-2.3
-5.4 -5.3
-1.8
10.0
15.813.6
15.616.716.6
21.719.5
16.4
10.7
7.24.2
6.9
13.815.0
7.0 6.94.7
-7.2
1.43.1
-10
-5
0
5
10
15
20
25
30
35
Q1 Q2 Q3 Q4 Q1 Q2 Q3 Q4 Q1 Q2 Q3 Q4 Q1 Q2 Q3 Q4 Q1 Q2 Q3 Q4 Q1 Q2 Q3 Q4 Q1 Q2 Q3 Q4 Q1 Q2 Q3 Q4 Q1 Q2 Q3 Q4
2006 2007 2008 2009 2010 2011 2012 2013 2014
Electrical goods & photo. equipment,& miscellaneous consumer durable goods
Jewellery, watches & clocks, & valuable gifts
Department stores Clothing, footwear & allied products
Food, alcoholic drinks & tobacco Medicines and cosmetics
Supermarkets Others
All retail outlets
Chart 2 : Retail sales growth was dampened by luxury items in mid-year but was supported by boost to sales in electrical and electronic products in late 2014
Contribution to year-on-year growth in retail sales volume (%)
Note: Others include: fuels; motor vehicles and parts; furniture and fixtures; books, newspapers, stationery and gifts; chinese drugs and herbs; optical shops; and other consumer goods, not elsewhere classified.
-40
-30
-20
-10
0
10
20
30
40
50
60
-10
-5
0
5
10
15
Jan + Feb Mar Apr May Jun Jul Aug Sep Oct Nov Dec
All retail outlets (LHS)
Jewellery, watches & clocks, & valuable gifts (RHS) - (i)
Electrical goods & photo. equipment, & miscellaneous consumerdurable goods (RHS) - (ii)
Chart 3 : Retail sales performance was disrupted in October 2014Year-on-year rate of change in volume terms (%) Year-on-year rate of change in volume terms (%)
All retail outlets (excl. (i) and (ii)) (LHS)

9
1.8 Overall investment spending in terms of gross domestic fixed capital formation dipped by 0.3% in real terms in 2014, the first decline since 2009. The decline was due to subdued machinery and equipment acquisition, which fell by 5.2% in real terms. While a high base of comparison after brisk growth in the preceding three years was to blame, its weak performance to a certain extent might have also been associated with the subpar growth of the economy. This was broadly in line with the more cautious business sentiment among large enterprises as indicated by the latest Quarterly Business Tendency Survey, as well as the sluggish business situation suggested by the diffusion indices on small and medium-sized enterprises (SMEs) (see Box 1.2 for details of the consultation on SMEs). Nevertheless, overall building and construction activity staged a solid rebound of 6.5% in real terms in 2014, as public infrastructure works re-accelerated to show notable growth, and private sector building and construction activity also picked up from the lull in the previous year.
Q12010
Q12011
Q12012
Q12013
Q12014
-8
-6
-4
-2
0
2
4
6
8
10
12
Year-on-year rate of change in real terms
Seasonally adjusted quarter-to-quarter
rate of change in real terms
Q12010
Q12011
Q12012
Q12013
Q12014
-25
-20
-15
-10
-5
0
5
10
15
20
25
30
35
Expenditure on machinery, equipmentand intellectual property products
Expenditure on building and construction
Year-on-year rate of change in real terms (%)
Overall investment expenditure
Diagram 1.2 : Private consumption grew modestly in 2014
Diagram 1.3 : Investment spendingslackened in 2014
Percent

10
Box 1.2
Diffusion indices on small and medium-sized enterprises (an update)
To gain a better understanding of the current situation of business receipts, employment and credit access for small and medium-sized enterprises (SMEs)(1), an ad-hoc consultation exercise has been conducted by the Census and Statistics Department on behalf of the Economic Analysis and Business Facilitation Unit since late November 2008. In the recent past, the exercise has been conducted on a sample panel of around 400 SMEs. This note provides a further update of the results reported in Box 1.2 in the Third Quarter Economic Report 2014.
A set of diffusion indices is compiled to indicate the general directions of change in the respondents’ views on business receipts, employment and new export orders versus the preceding month. The percentage of SMEs reporting tight access to credit is also reported. While the findings should be interpreted with considerable caution given the coverage and nature of the consultation exercise, they can serve as a rough indicator to enable high frequency monitoring of SMEs’ situation.
The overall situation on business receipts of the SMEs consulted, as gauged by the set of diffusion indices, indicated that the views among SMEs remained rather cautious in January 2015, with the overall reading at 48.8, still a notch lower than the boom-bust threshold of 50 (Table 1). Nevertheless, the recent indices indeed represented some relative improvement in business sentiment from the trough in October 2014, reflecting that the negative impacts of the “Occupy Movement” gradually waned. Analysed by sector, the diffusion indices showed that both restaurants and wholesale trade, with indices concerned standing at 50.0, fared better among the domestic segments in January 2015, while retail trade and business services were relatively weak. On the external front, the readings for the import/export trade and logistics sectors stabilised somewhat of late, but both only stood at the neutral mark of 50.0 in January 2015, as the external environment had yet to show discernible improvement. As regards the employment situation, the feedback from SMEs suggested a broadly stable development in recent months (Table 2).
Specifically for the import/export trade sector, SMEs’ views on new export orders were sought separately to help gauge the likely export performance in the near term. The diffusion index on new export orders rebounded from the low level in October 2014 and then eased back slightly to 50.0 in January 2015, a sign that the external demand conditions would remain rather sluggish.
The proportion of SMEs reporting tight credit access fell back to a low level of 0.8% in January 2015, attributable mainly to the generally accommodative monetary conditions and the Government’s continued efforts to support SMEs through various loan guarantee schemes.
(1) Manufacturing enterprises with fewer than 100 employees and non-manufacturing enterprises with fewer
than 50 employees are regarded as SMEs in Hong Kong.

11
Box 1.2 (Cont’d)
Table 1 : Diffusion indices^ on business receipts
Notes : (^) The diffusion index is computed by adding the percentage of SMEs reporting “up” to one
half of the percentage of SMEs reporting “same”. A diffusion index reading above 50 indicates that the business condition is generally favourable, whereas an index below 50 indicates otherwise. Respondents were requested to exclude seasonal effects in reporting their views.
(*) Weighted average using total number of SMEs in individual sectors as weights.
2014 2015Jan Feb Mar Apr May Jun Jul Aug Sep Oct Nov Dec Jan
ocal segments Restaurants 48.1 47.2 47.2 46.3 47.2 45.3 47.1 48.1 47.1 38.2 46.1 52.0 50.0 Real estate 42.4 42.4 54.5 48.5 48.5 43.9 47.0 47.0 46.9 40.6 54.7 45.3 48.5 Retail trade 47.4 49.1 47.4 48.2 47.7 46.9 46.1 48.4 48.0 40.3 43.9 48.8 47.5 Wholesale trade 44.7 44.7 50.0 50.0 44.7 39.5 36.8 44.4 41.7 33.3 44.4 44.4 50.0 Business services 47.0 51.6 51.6 53.1 50.0 46.9 48.4 48.4 45.3 45.2 46.8 48.4 45.6
xternal segments Import/export trade 47.9 48.3 48.7 49.6 48.4 49.2 48.8 49.6 49.2 42.6 47.9 50.8 50.0 Logistics 47.2 50.0 50.0 47.2 47.2 47.2 47.2 44.4 47.2 36.1 41.7 41.7 50.0
ll the above sectors* 47.0 48.2 49.2 49.3 48.0 47.0 47.0 48.3 47.6 41.0 46.7 48.9 48.8
Table 2 : Diffusion indices on employment situation
Note : (*) Weighted average using total number of SMEs in individual sectors as weights.
2014 2015Jan Feb Mar Apr May Jun Jul Aug Sep Oct Nov Dec Jan
Local segments Restaurants 49.1 49.1 49.1 49.1 49.1 48.1 49.0 50.0 48.0 46.1 50.0 49.0 49.2 Real estate 50.0 50.0 50.0 48.5 47.0 48.5 50.0 50.0 50.0 50.0 51.6 50.0 48.5 Retail trade 49.6 50.4 49.1 50.5 49.6 49.6 49.6 50.4 50.0 49.2 50.8 49.6 49.6 Wholesale trade 50.0 50.0 50.0 52.6 47.4 47.4 47.4 52.8 50.0 50.0 50.0 50.0 50.0 Business services 50.0 50.0 51.6 50.0 48.4 50.0 50.0 53.1 50.0 46.8 50.0 50.0 50.0
External segments Import/export trade 50.4 50.4 49.6 50.4 48.4 50.4 49.2 50.0 50.0 49.2 50.0 50.0 50.0 Logistics 50.0 50.0 50.0 50.0 50.0 52.8 50.0 50.0 47.2 50.0 47.2 50.0 47.1
All the above sectors* 50.0 50.2 49.7 50.3 48.6 49.8 49.3 50.6 49.8 48.9 50.2 49.8 49.6
Table 3 : Diffusion index on current new export orders 2014 2015Jan Feb Mar Apr May Jun Jul Aug Sep Oct Nov Dec Jan
rt/export trade 49.2 48.3 49.6 50.0 49.6 49.2 49.6 50.4 50.0 44.7 46.7 51.3 50.0
Impo
Table 4 : Percentage of SMEs reporting tight current access to credit
Note : (*) Weighted average using total number of SMEs in individual sectors as weights.
2014 2015Jan Feb Mar Apr May Jun Jul Aug Sep Oct Nov Dec Jan
All selected sectors* 1.5 1.8 0.9 0.9 1.1 1.1 0.8 0.8 0.8 0.8 0.8 1.0 0.8
L
E
A

12
The labour sector 1.9 The labour market held generally tight in 2014. Total employment on average grew moderately by 0.9% in 2014, bringing the annual average to another all-time high of 3 760 600. On the back of the firm labour demand, the seasonally adjusted unemployment rate stayed at relatively low levels throughout the year. After hitting a 16-year low of 3.1% in the first quarter, the seasonal adjusted unemployment rate went up marginally in the following months, to 3.3% in the three-months ending July, and stayed stable at this level through the rest of the year, indicating that the economy was still in a state of full employment. The underemployment rate likewise hovered at low levels, at 1.6% in the fourth quarter. Nominal wages and earnings sustained broad-based and moderate growth in 2014. The asset markets 1.10 The local stock market continued to fluctuate during 2014. Dented by the shifting sentiment on emerging markets amid Fed’s tapering, concerns over Mainland’s economic slowdown and geopolitical tensions surrounding Eastern Europe, the local stock market came under pressure in the first quarter, reaching a low of 21 182 on 20 March 2014. But it gained support subsequently and rallied upon the signs of revival in the US economy, continued steadiness of the Mainland economy, expectations of the Shanghai-Hong Kong Stock Connect, and the continued accommodative stance by the Fed. After hitting a six-year high of 25 318 on 3 September 2014, the Hang Seng Index lost ground again on jitters about global economic outlook and oil price slump, closing the year at 23 605, slightly higher than at end-2013 by 1.3%. In 2014, the average daily turnover rose markedly in the second half of the year, giving an average of $69.5 billion for the whole year. Fund-raising activity also picked up in 2014, with total IPO funds raised amounting to $227.7 billion, rising remarkably from $169.0 billion in 2013. Therefore, Hong Kong ranked as the world’s second largest IPO centre in 2014 for the second consecutive year, just after New York. 1.11 The residential property market, after staying quiet in the first quarter of 2014, staged a revival in the rest of the year, as interest rates stayed low while successive launch of large primary projects by developers at a discount relative to the secondary markets also helped release the pent-up demand. Transaction volume rebounded notably from a low level by 26% in 2014, having declined in the preceding three years. Overall flat prices in December 2014 were 13% higher than a year earlier. The revival of the property market indicates that the bubble risks for the housing market remain

13
prominent. Indeed, overall flat prices in December exceeded the 1997 peak by 61%, with the housing affordability ratio worsening to 58% in the fourth quarter of 2014, well above the long-term average of 47% over 1994-2013. Likewise, flat rentals increased at a slightly faster pace during the second half of the year, leading to a cumulative gain of 6% during 2014, up from that of 3% during 2013. As regards commercial property, increases in shop and office rentals both slowed to 4% during 2014, as against the corresponding increases of 7% and 8% during 2013. Inflation 1.12 Consumer price inflation followed an easing trend in 2014. Netting out the effects of the Government’s one-off relief measures, underlying consumer price inflation retreated to 3.5% in 2014, down successively from 5.3% in 2011, 4.7% in 2012 and 4.0% in 2013. Such moderation mainly reflected the milder imported inflation and receding local cost pressures during the year. In particular, increases in the private housing rental component continued to ease as earlier moderation in fresh-letting private residential rentals fed through. Moreover, commercial rentals rose at a low single-digit rate, while the growth in labour costs was rather steady, both helping to contain local cost pressures. Headline consumer price inflation, which is under the influence of the Government’s one-off relief measures, edged up to 4.4% in 2014 from 4.3% in 2013. Higher headline inflation compared with the underlying figure was mainly caused by the lower base effect created by the Government’s payment of public housing rentals in September 2013, the depletion of the Government’s one-off electricity charge subsidy by households in the latter half of 2014, as well as the end of rates concession in October. 1.13 The GDP deflator increased by 3.0% in 2014, up from the 1.7% increase in 2013. Within this, domestic demand deflator registered a faster increase, as prices for investment spending reversed the decline in the previous year to show a moderate increase, offsetting the slower increase in prices for consumption expenditure. The terms of trade in 2014 showed little change from the previous year.
14
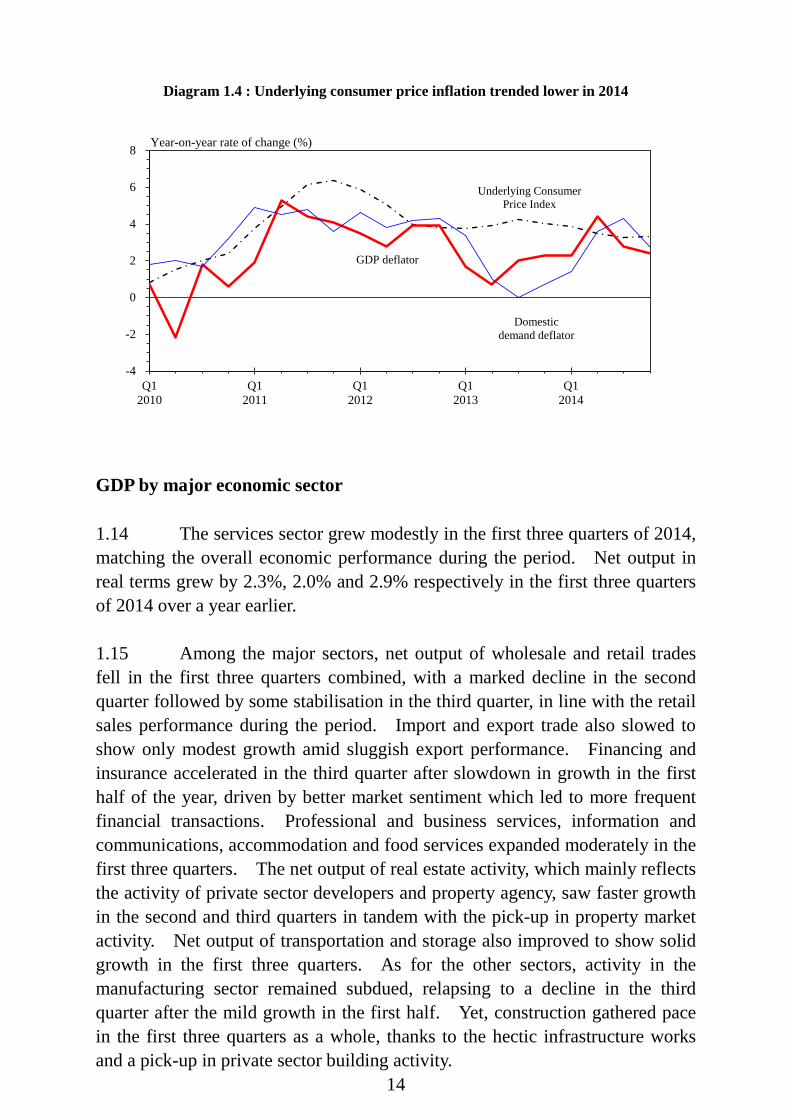
GDP by major economic sector 1.14 The services sector grew modestly in the first three quarters of 2014, matching the overall economic performance during the period. Net output in real terms grew by 2.3%, 2.0% and 2.9% respectively in the first three quarters of 2014 over a year earlier. 1.15 Among the major sectors, net output of wholesale and retail trades fell in the first three quarters combined, with a marked decline in the second quarter followed by some stabilisation in the third quarter, in line with the retail sales performance during the period. Import and export trade also slowed to show only modest growth amid sluggish export performance. Financing and insurance accelerated in the third quarter after slowdown in growth in the first half of the year, driven by better market sentiment which led to more frequent financial transactions. Professional and business services, information and communications, accommodation and food services expanded moderately in the first three quarters. The net output of real estate activity, which mainly reflects the activity of private sector developers and property agency, saw faster growth in the second and third quarters in tandem with the pick-up in property market activity. Net output of transportation and storage also improved to show solid growth in the first three quarters. As for the other sectors, activity in the manufacturing sector remained subdued, relapsing to a decline in the third quarter after the mild growth in the first half. Yet, construction gathered pace in the first three quarters as a whole, thanks to the hectic infrastructure works and a pick-up in private sector building activity.
Q12010
Q12011
Q12012
Q12013
Q12014
-4
-2
0
2
4
6
8 Year-on-year rate of change (%)
Underlying Consumer Price Index
Diagram 1.4 : Underlying consumer price inflation trended lower in 2014
Domesticdemand deflator
GDP deflator
15
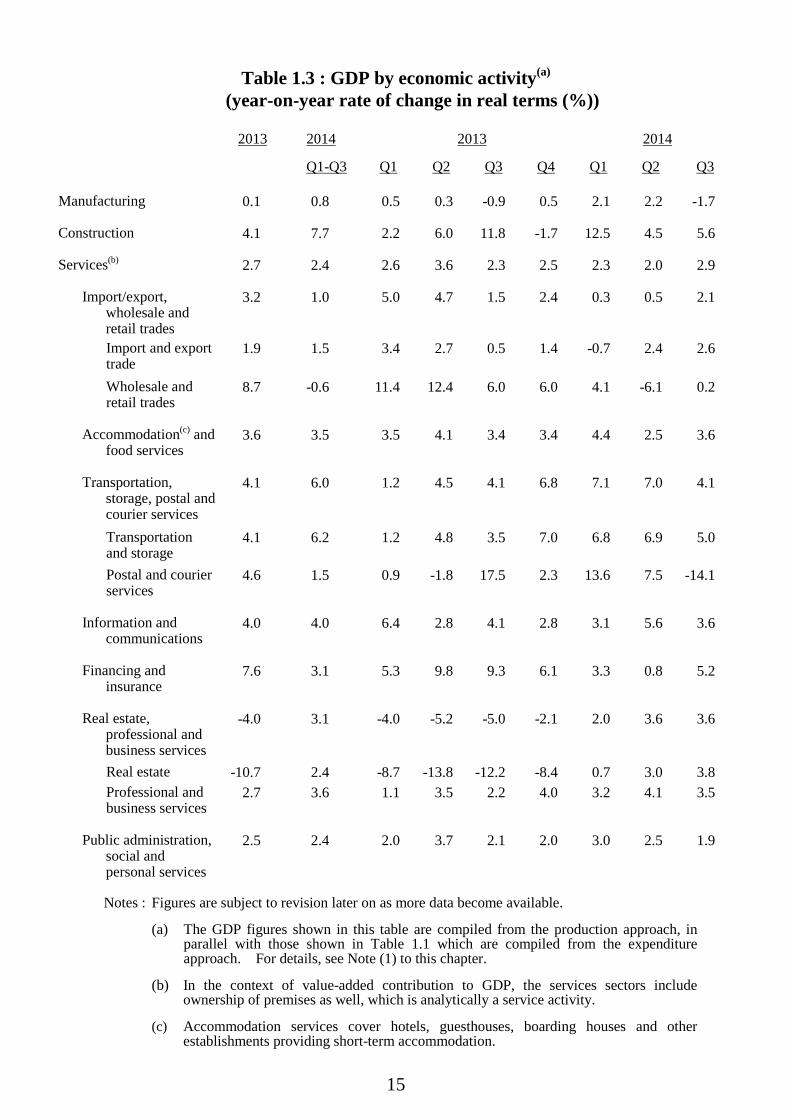
Table 1.3 : GDP by economic activity(a) (year-on-year rate of change in real terms (%))
2013 2014 2013 2014
Q1-Q3 Q1
Q2 Q3 Q4 Q1 Q2 Q3
Manufacturing
0.1 0.8 0.5 0.3 -0.9 0.5 2.1 2.2 -1.7
Construction
4.1 7.7 2.2 6.0 11.8 -1.7 12.5 4.5 5.6
Services(b)
2.7 2.4 2.6 3.6 2.3 2.5 2.3 2.0 2.9
Import/export, wholesale and retail trades
3.2 1.0 5.0 4.7 1.5 2.4 0.3 0.5 2.1
Import and export trade
1.9 1.5 3.4 2.7 0.5 1.4 -0.7 2.4 2.6
Wholesale and retail trades
8.7 -0.6 11.4 12.4 6.0 6.0 4.1 -6.1 0.2
Accommodation(c) and food services
3.6 3.5 3.5 4.1 3.4 3.4 4.4 2.5 3.6
Transportation, storage, postal and courier services
4.1 6.0 1.2 4.5 4.1 6.8 7.1 7.0 4.1
Transportation and storage
4.1 6.2 1.2 4.8 3.5 7.0 6.8 6.9 5.0
Postal and courier services
4.6 1.5 0.9 -1.8 17.5 2.3 13.6 7.5 -14.1
Information and communications
4.0 4.0 6.4 2.8 4.1 2.8 3.1 5.6 3.6
Financing and insurance
7.6 3.1 5.3 9.8 9.3 6.1 3.3 0.8 5.2
Real estate, professional and business services
-4.0 3.1 -4.0 -5.2 -5.0 -2.1 2.0 3.6 3.6
Real estate -10.7 2.4 -8.7 -13.8 -12.2 -8.4 0.7 3.0 3.8 Professional and business services
2.7 3.6 1.1 3.5 2.2 4.0 3.2 4.1 3.5
Public administration, social and personal services
2.5 2.4 2.0 3.7 2.1 2.0 3.0 2.5 1.9
Notes : Figures are subject to revision later on as more data become available.
(a) The GDP figures shown in this table are compiled from the production approach, in parallel with those shown in Table 1.1 which are compiled from the expenditure approach. For details, see Note (1) to this chapter.
(b) In the context of value-added contribution to GDP, the services sectors include ownership of premises as well, which is analytically a service activity.
(c) Accommodation services cover hotels, guesthouses, boarding houses and other establishments providing short-term accommodation.
16
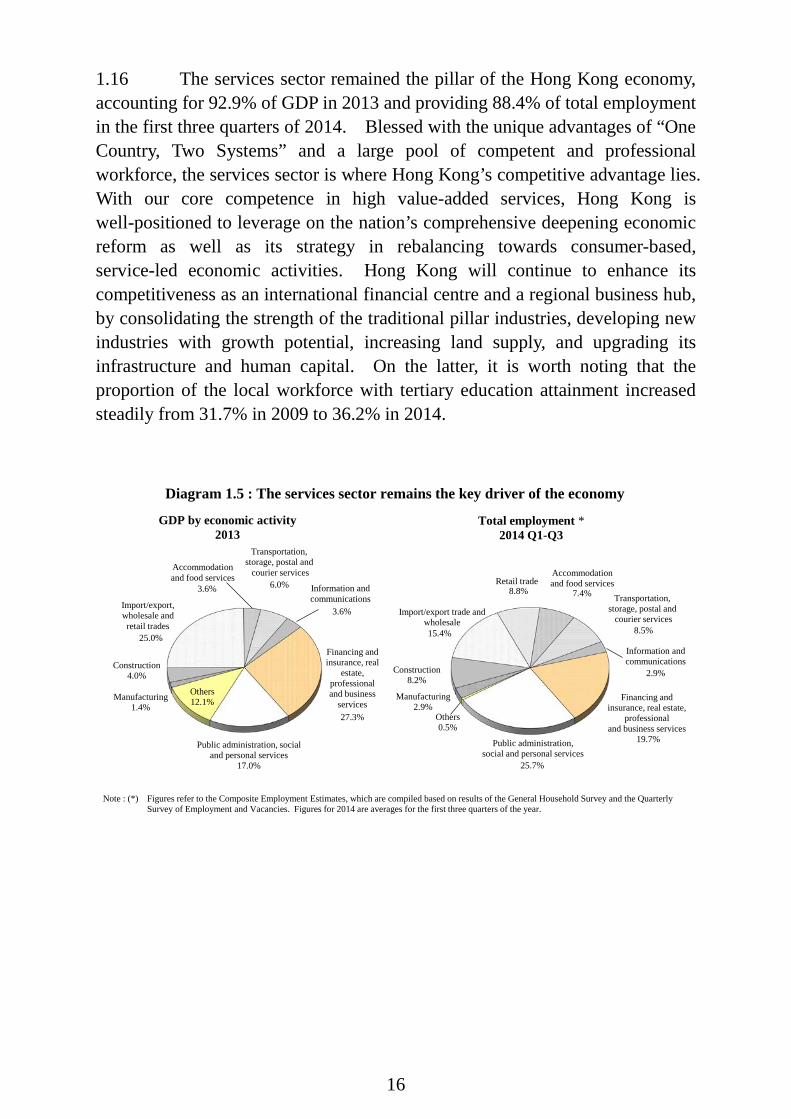
1.16 The services sector remained the pillar of the Hong Kong economy, accounting for 92.9% of GDP in 2013 and providing 88.4% of total employment in the first three quarters of 2014. Blessed with the unique advantages of “One Country, Two Systems” and a large pool of competent and professional workforce, the services sector is where Hong Kong’s competitive advantage lies. With our core competence in high value-added services, Hong Kong is well-positioned to leverage on the nation’s comprehensive deepening economic reform as well as its strategy in rebalancing towards consumer-based, service-led economic activities. Hong Kong will continue to enhance its competitiveness as an international financial centre and a regional business hub, by consolidating the strength of the traditional pillar industries, developing new industries with growth potential, increasing land supply, and upgrading its infrastructure and human capital. On the latter, it is worth noting that the proportion of the local workforce with tertiary education attainment increased steadily from 31.7% in 2009 to 36.2% in 2014.
Manufacturing1.4%
Construction4.0%
25.0%
3.6% 6.0%
3.6%
27.3%
Public administration, social and personal services
17.0%
Others12.1% Manufacturing
2.9%
Construction8.2%
15.4%
8.8% 7.4%
8.5%
2.9%
19.7%
25.7%
Others0.5%
Import/export trade and wholesale
Information and communications
Transportation,storage, postal and
courier services
Retail tradeAccommodationand food services
Public administration, social and personal services
Financing andinsurance, real estate,
professionaland business services
Financing and insurance, real
estate, professional and business
services
Diagram 1.5 : The services sector remains the key driver of the economy
GDP by economic activity2013
Total employment *2014 Q1-Q3
Figures refer to the Composite Employment Estimates, which are compiled based on results of the General Household Survey and the Quarterly Survey of Employment and Vacancies. Figures for 2014 are averages for the first three quarters of the year.
Note : (*)
Information and communications
Transportation,storage, postal and
courier servicesAccommodationand food services
Import/export, wholesale and retail trades

17
Other economic developments 1.17 As an international financial centre and business hub, Hong Kong serves as an ideal platform in connecting Asia with the rest of the world, and is well-positioned to tap the opportunities created by the nation’s sustained development and economic reforms. To further enhance our competitiveness, the 2014-15 Budget unveiled a series of measures alongside ongoing capital works, aiming at raising the efficiency in the flows of people, goods, capital and information, providing an enabling environment for innovation and technology industries to grow, consolidating the core competence of the four pillar industries, and helping SMEs in coping with various challenges. 1.18 The Agreement between the Mainland and Hong Kong on Achieving Basic Liberalisation of Trade in Services in Guangdong (the Agreement) was signed under the framework of the Mainland and Hong Kong Closer Economic Partnership Arrangement (CEPA) in December. The Agreement, to be implemented on 1 March 2015, would not only bring new opportunities to our service providers and enhance the competitiveness of the services industries of the two places, but also set a model for basic liberalisation of trade in services in the Mainland by end-2015. Besides, at the Tenth Pan-Pearl River Delta (PPRD) Regional Co-operation and Development Forum and Trade Fair in October, the “Joint Declaration on Deepening PPRD Regional Co-operation (2015-2025)” was signed, which put forward a blueprint for strengthening PPRD regional co-operation in the coming decade. 1.19 Apart from the Mainland, the Government constantly strives to foster trade linkages with other economies, especially emerging markets. In July 2014, Hong Kong entered into formal negotiations with the ASEAN for a Free Trade Agreement (FTA), and with some World Trade Organisation members on the Environmental Goods Agreement. Besides, the FTA with Chile took effect in October, extending our reach to Central and South American markets. Furthermore, a Mutual Recognition Arrangement (MRA) on the Authorised Economic Operators between Singapore and Hong Kong Customs was signed in June. Similar MRAs with the Mainland signed earlier became operational in May for road cargo and in September for air and sea cargo, as did the one for Korea in August. Such customs facilitation should bring business opportunities to the import, export and logistics industries. Separately, Hong Kong signed avoidance of double taxation agreements with Korea, South Africa and United Arab Emirates in 2014, bringing the total number of similar facilitative tax agreements to 32.

18
1.20 On financial development, the Government works proactively to forge new co-operation and interaction so as to breed new opportunities in international finance. In September, the sukuk under the Government Bond Programme was successfully launched, signifying the world’s first USD-denominated sukuk originated by an AAA-rated government. The success of the issue demonstrated the capability of Hong Kong’s fund-raising platform for sukuk issuance, which should help advance the development of Islamic finance here. Separately, under the support of the Central Government, the Shanghai-Hong Kong Stock Connect pilot programme was launched in November. The pilot program allows Mainland investors who satisfy the eligibility criteria to trade eligible stocks listed on the Stock Exchange of Hong Kong (SEHK) through the Shanghai Stock Exchange (SSE) subject to quotas and some other criteria. At the same time, it also allows Hong Kong and overseas investors to trade eligible stocks listed on the SSE through the SEHK directly, subject to quotas and some other criteria. Its implementation helped enhance the two-way flows between offshore Renminbi (RMB) market in Hong Kong and the Mainland, and reinforce Hong Kong’s status as a leading offshore RMB business centre and international financial centre. 1.21 To explore ways to make more comprehensive fiscal planning to cope with the ageing population and the Government’s other long-term commitments, the Working Group on Long-Term Fiscal Planning released a report in March, with assessments on the current state of Hong Kong’s public finances and projections of the Government’s long-term fiscal positions. The Working Group recommended a combination of strategies, including containing expenditure growth, preserving the revenue base and saving for future generations, to cope with the fiscal challenges ahead. 1.22 The Chief Executive delivered the 2015 Policy Address in January 2015, unveiling measures to develop the economy, increase housing supply and harness the potential of Hong Kong people, alongside other initiatives in poverty alleviation, elderly care, environmental protection, health care, education and youth development. Strengthening economic ties with both the Mainland and other trading
partners plays an integral role in Hong Kong economic development. The Government will continue efforts to further open up the Mainland market with a view to achieving basic liberalisation of trade in services with the Mainland by end-2015, and actively work with Guangdong to explore new modes of co-operation and maximise development opportunities for Hong Kong people and enterprises in response to the proposed Guangdong Pilot Free Trade Zone covering Nansha, Qianhai and Hengqin. Besides, new

19
Economic and Trade Offices would also be opened in the Asian region. To foster diversity in the industries and enhance the competitiveness of the
economy, the Government will, among other things, set aside $500 million to prepare for establishment of the Insurance Authority, and establish a new maritime industry body to promote Hong Kong’s maritime services industry. The Government will provide further funding support for private sector research and development projects and the development of the creative industries, and has proposed a new agricultural policy and introduced measures to support the related developments.
Infrastructure investments are key to raise our long-term economic capacity
to grow and improve the connectivity of people and goods with the rest of the world. In this regard, the Government will support the Airport Authority to implement the three-runway system project, take forward development projects of Lantau Island, and press ahead the capital work at the former airport site to complement the hotel development in the adjacent areas.
On housing, the Government is determined to avert the demand-supply
imbalance progressively, by making available more land for housing and commercial development, and achieving the Government’s 10-year housing target of 480 000 units.
To address the challenges brought about by demographic change, a new
five-prong strategy was announced, including plans to extend the retirement age, nurture local manpower, attract talent from outside Hong Kong, and help women and the underprivileged to enter the workforce. On poverty alleviation, the Government will introduce the Low-Income Working Family Allowance, and extend the short-term food assistance service. More resources will also be provided to strengthen support for families and children in dire need. On retirement protection, the Government will set aside $50 billion to provide for future needs in offering protection for needy citizens after retirement, and also continue to improve Mandatory Provident Fund arrangements.
20
Notes : (1) The Gross Domestic Product (GDP) is an overall measure of net output produced
within an economy in a specified period, such as a calendar year or a quarter, before deducting the consumption of fixed capital. In accordance with the expenditure approach to its estimation, GDP is compiled as total final expenditures on goods and services (including private consumption expenditure, government consumption expenditure, gross domestic fixed capital formation, changes in inventories, and exports of goods and services), less imports of goods and services.
(2) The seasonally adjusted quarter-to-quarter GDP series, by removing the variations that
occur at about the same time and in about the same magnitude each year, provides another perspective for discerning the trend, particularly in regard to turning points. A detailed examination reveals the presence of seasonality in the overall GDP and in some of its main components, including private consumption expenditure, government consumption expenditure, exports of goods, imports of goods, exports of services, and imports of services. However, due to the presence of considerable short-term fluctuations, no clear seasonal pattern is found in gross domestic fixed capital formation. Therefore, the seasonally adjusted series of GDP is compiled separately at the overall level, rather than summing up from its main components.

21
CHAPTER 2 : ECONOMIC OUTLOOK FOR 2015 AND THE MEDIUM TERM
Summary
• Global economic growth is likely to remain moderate in 2015, with uneven performance across regions. Among the advanced economies, the US is expected to gather further traction, while the eurozone and Japan will still need to overcome structural impediments in order to gain momentum. Among the major emerging market economies, the growth outlook for Russia and Brazil is lacklustre. In contrast, the Mainland economy, though also affected by the unsteady external environment, should continue with a growth pace that is envy to many major economies. India and some other Asian economies with stronger fundamentals should also be relatively resilient.
• The global outlook is, however, still subject to considerable uncertainties,
with risks tilted towards the downside. Of particular note are the different and varying monetary policy stances of major central banks on the back of the uneven recovery in the advanced economies. Global financial volatility is bound to increase as interest rate expectations change, with potential significant implications for capital flows, exchange rates, asset prices and liquidity conditions. The global economic growth may also be dragged by the eurozone and Japan, which are facing increasing deflation risks and still struggling to spur and sustain recovery. While the recent plunge in oil prices should help economies which are net oil importers, it could have notable repercussions for some oil-exporting economies. Furthermore, the elevated geopolitical tensions in Eastern Europe and the Middle East remain a cause of concern.
• Hong Kong’s exports of goods will still be rather weak, constrained by the
unsteady and rather feeble external environment in 2015. The strength of the US dollar against other major currencies may also weigh on our export growth. Yet, there is some upside potential if domestic demand in Asia, in particular the Mainland, strengthens to support regional trade flows, or if the US economy picks up faster than expected. Meanwhile, Hong Kong’s exports of services should see a somewhat better outlook, supported by further expansions of inbound tourism and cross-border financial and commercial activities.

22
• Locally, private consumption expenditure should show further growth, on the back of a resilient labour market and rising incomes, more so if the asset markets were to remain supportive. The outlook for investment is a bit more uncertain, being prone to possible shifts in business sentiment amid a still-highly unsteady global economic environment. For 2015, there is also an additional source of uncertainty surrounding the local political disputes.
• The Hong Kong economy is projected to grow by 1-3% in 2015, compared
to the 2.3% growth in 2014 and the average annual growth of 3.9% in the past ten years. A two-percentage-point range is adopted for the GDP growth forecast, mainly reflecting the various uncertainties surrounding the global growth prospects.
• On inflation outlook, consumer price pressures should remain tame this
year. With global inflation easing and the soft international commodity prices, imported inflation is expected to remain benign. Local cost pressures look set to moderate, given the expected slow economic growth and the moderated commercial rental cost increases. Overall, underlying Composite CPI is forecast to increase by an average of 3% in 2015, lower than that of 3.5% in 2014, signifying the fourth consecutive year of easing.
• The medium-term outlook for the Hong Kong economy will still be affected
by the “new normal” in the global economy, which would likely see growth slower than that before the global financial crisis of 2008. The demographic challenges will also feature more visibly towards the end of the medium term. Against these, however, the Mainland will remain our main source of growth opportunities, manifesting through the trade, investment and financial channels. The Government’s continued investment in education and training as well as in infrastructure will help to uplift Hong Kong’s competitiveness. The trend GDP growth rate in real terms is forecast at 3.5% per annum from 2016 to 2019. The trend rate of underlying consumer price inflation is forecast at 3% per annum.

23
Major external developments 2.1 The near-term outlook for the Hong Kong economy in 2015 will depend much on the external environment, which is challenging and fraught with uncertainties. Several key external developments will affect our trade performance, GDP growth and inflation. First, global economic growth is likely to stay mediocre. While the US economy is seeing signs of strengthening, many other advanced economies, as well as some emerging market economies, are still struggling to gain momentum. Second, the global monetary conditions would become more volatile in 2015. The different policy directions among the major central banks could have significant repercussions for capital flows, exchange rates and asset prices. The timing and pace of interest rate hikes in the US remain a major source of uncertainty, which could induce wild fluctuations in global financial markets from time to time, thereby affecting consumption and investment sentiments. Third, the sharp decline in oil prices since mid-2014 and the softening of other commodity prices should help to lower world inflation. The oil price plunge would benefit the net oil-importing economies, while hurting the net oil-exporting economies, including those already weakened by geopolitical tensions. Other commodity-exporting economies are also likely to see dimmer prospects. Fourth, wilder fluctuations in exchange rate movements are to be expected, given an unsteady external environment. The strength of the US dollar against other major currencies, if continued, may also affect the price competitiveness of our exports in 2015. The following provides a more detailed analysis of the major external developments. Global economic outlook 2.2 The US economy is the bright spot among advanced economies. Real GDP grew by 2.4% in 2014, slightly improved from 2.2% in 2013. Growth gained traction after the second quarter of last year, supported by stronger private sector activity and milder fiscal adjustment. The improving labour market conditions also led the US Federal Reserve (Fed) to end asset purchases in October last year. The outlook for the US in 2015 is widely expected to improve further, as evidenced by the relatively optimistic GDP growth forecasts put out by analysts and international organisations. However, uncertainties still abound. Despite a general fall in the jobless rate to 5.7% in January 2015 and the sustained solid pace of job creation, a continued improvement in earnings growth has yet to be seen. With the core inflation rate still staying low amid a benign global inflation outlook, the timing of the first interest rate hike is still highly uncertain and remains data driven. The more

24
fragile economic situation elsewhere, coupled with a stronger US dollar, may also restrain its export growth. The risks of political disputes over fiscal issues may also resurface given the expiration of the debt ceiling suspension in March 2015. 2.3 The growth prospects in Europe have been, and will continue to be, a key concern. The European Central Bank (ECB) cut its policy interest rates to historic lows and introduced further monetary easing in 2014, underscoring sluggish growth, elevated unemployment, and rising deflation risks in the eurozone. The region’s growth will likely be constrained for an extended period if the structural problems facing the weaker eurozone members, including high debt levels, fragile fiscal positions and market rigidities, are not properly addressed. The enlarged quantitative easing by the ECB, while helping to fend off deflation risks, may not lend much support to growth if it is not accompanied by structural reforms in the eurozone. The surprise move by Switzerland in January 2015 to slash the cap on its currency against the euro, the sustained political tensions in Eastern Europe, and the recent political struggle over conditions of Greece’s bailout programme are clear indications of the fragility and fluid situation in Europe, with clear risks to global financial stability, as well as to the global economic prospects. 2.4 The outlook of Japanese economy does not look promising too. The economy fell back into recession in the third quarter of 2014 after the sales tax hike in April battered consumption spending, prompting the Bank of Japan to expand its asset purchase programme further. Whether the monetary easing measures, the additional fiscal stimulus and the weakness of the yen would help revive Japan’s growth remains to be seen. Going forward, Japan would still be confronted with the challenge of bolstering growth while maintaining fiscal sustainability. Moreover, Japan has yet to push through structural reforms, the third pillar of “Abenomics”, to tackle the problems of an ageing population and certain market rigidities in order to unleash growth potential. 2.5 In a nutshell, the uneven economic performance among the advanced economies is expected to remain in 2015. Growth of the advanced economies as a whole would likely be led by the US. In January 2015, the International Monetary Fund (IMF) projected that GDP growth of the advanced economies would pick up from 1.8% in 2014 to 2.4% in 2015. This relatively benign scenario is predicated on the assumptions that the Fed’s interest rate normalisation would not hamper the US economic recovery, that the central banks’ varying monetary policies would not derail the global recovery, and that Europe and Japan would not stay stagnant due to their structural impediments.

25
2.6 Major emerging economies showed varying degrees of slowdown in growth last year. Russia’s economy was hit by the oil price slump and geopolitical tensions, while Brazil’s economy faced fiscal issues and structural bottlenecks. In contrast, emerging market economies in Asia remained relatively resilient. Going into 2015, lacklustre growth in some major advanced economies could continue to depress global and regional trade flows, the impact of which would be particularly pronounced for export-dependent Asian economies. Major central banks’ policy actions may also threaten the macroeconomic and financial stability of some emerging economies as volatility of capital flows, currencies and asset prices would heighten. Yet, the Asian emerging market economies are expected to perform better than their counterparts in the rest of the world, thanks to their sounder fundamentals and continuing efforts to reorient their economies towards more domestically-driven growth.
-4
-2
0
2
4
6
8
10
12
1999 2000 2001 2002 2003 2004 2005 2006 2007 2008 2009 2010 2011 2012 2013 2014 2015*
World
Source : Note :
Advanced economies
Emerging and developing Asia
Diagram 2.1 : The Asian region is likely to grow faster than the advanced economies in 2015
Real rate of change (%)
IMF World Economic Outlook Update, January 2015.(*) Forecasts from the IMF.
2.7 For the Mainland economy, growth momentum moderated slightly over the course of last year after a prolonged period of rapid expansion, amid the gradual transition to the “new normal”. While export growth was dented by the sluggish performance of the advanced markets, consumption and investment demand continued to expand at a robust pace, consistent with the strategy of shifting the sources of growth towards domestic demand. The unsteady global recovery, if carried forward into 2015, could entail a less supportive external environment for the Mainland’s export growth prospect. Yet, given the Mainland’s abundant policy room for manoeuvring, this year’s economic growth is still expected to outperform other major economies, providing support

26
to the region. The year 2015 marks the final year of the Mainland’s 12th Five Year Plan, and the economy should be able to meet the 7% trend growth target set for the period 2011 - 2015. As the Mainland economy is geared towards a more sustainable and balanced growth path, the Central Government will sustain its efforts to render support to the Mainland’s domestic demand and to enlarge the role of the services sector in the economy. Institutional reforms, which are conducive to improving the business environment, promoting innovation-driven growth and enhancing growth potential, will continue. In January, the IMF projected the Mainland economy to grow by 6.8% in 2015, after a 7.4% expansion in 2014. For emerging and developing Asia as a whole, the IMF projected an economic growth of 6.4% in 2015, similar to that in 2014. 2.8 Overall, the IMF in January projected that the world economy would grow by 3.5% in 2015, improving only marginally from 3.3% in 2014, hinging mainly on the expected acceleration in US economic growth. The IMF highlighted the downside risks related to shifts in sentiment and volatility in global financial markets, especially in emerging market economies and those oil exporters hit by lower oil prices, as well as to the stagnation and low inflation in the eurozone and Japan.
Table 2.1 : Growth forecasts for major economies in 2015
2014*
(%)
2015
IMF*
(%)
Private sector forecast^
(%) World (PPP## weighted) 3.3 3.5 - Advanced economies 1.8 2.4 -
US 2.4# 3.6 3.2 Eurozone 0.8 1.2 1.1
Japan 0.1 0.6 1.2 Emerging market and developing economies
4.4 4.3 -
Emerging and developing Asia 6.5 6.4 -
Mainland China 7.4# 6.8 7.0 India 5.8 6.3 6.3
Middle East and North Africa
2.8
3.3
-
Notes : (*) World Economic Outlook Update, IMF, January 2015. (^) Average forecast as at January 2015. (-) Not available. (#) Actual figures. (##) PPP refers to purchasing power parity.
27
Monetary conditions 2.9 Given the uneven global growth prospects, especially among the advanced economies, monetary policy actions of major central banks in 2015 could become more diverse or capricious, thereby further complicating the global monetary conditions and macroeconomic situation. While the US Fed is poised to pursue monetary policy normalisation eventually, the central banks in Europe and Japan have enlarged their monetary easing and may roll out further measures over the course of 2015. The timing and pace of these policy actions, including the prospective interest rate hike in the US, are subject to a high degree of uncertainty, contingent on how the economic conditions evolve. Further complicating the situation is the recent plunge in oil prices and the lower inflation outlook worldwide it entails, including that in the US. As such, global financial markets would be increasingly sensitive to incoming data. Increased volatility in financial markets and swings in market sentiment amid an environment of still-abundant liquidity could induce abrupt changes in capital flows and exchange rate movements, increasing the downside risks to economies with weaker fundamentals. The wider-than-usual fluctuations in asset prices could also hurt consumption and investment sentiments. 2.10 In a globalised world where financial markets are interlinked, a crisis elsewhere in the world could potentially have devastative spill-over effects on Asia, including Hong Kong. The currency crisis in Russia in the latter part of last year as a result of the oil price slump was a case in point, though the contagion effects had fortunately been contained as of the present moment. There is thus a strong need to stay vigilant to the fast-changing global monetary conditions and their possible adverse repercussions. World inflation and global commodity prices 2.11 Inflationary pressures eased across most economies over the past year amid weaker-than-expected global economic growth and falling international commodity and energy prices. As global growth is expected to stay sub-par in 2015, with some economies facing rising deflation risks (see Box 2.1 for details) and international commodity and energy prices tending to soften, global inflation is likely to remain low in the near term.

28
2.12 The drastic fall in oil prices since mid-2014 is particularly noteworthy, as it could also impact on the real side of the global economy (see Box 2.2 for details). Oil prices plummeted by more than 40% during the second half of 2014 and stayed at rather low levels in entering 2015. While the oil price slump should benefit consumers and lower production costs in the net oil-importing economies, it adds to the deflation risks in such economies as the eurozone and Japan, at least in terms of lower headline inflation. For some oil exporters with weak fundamentals, the oil price plunge would weaken their external positions and exert pressures on their currencies, as what happened to Russia in late 2014. This would remain a potential threat to the stability of the global economy.
2.13 The international prices of other non-petroleum commodities also saw varying degrees of decline in 2014 and are likely to stay soft in 2015. For instance, global food prices fell by 4% in 2014, according to the Food and Agriculture Organization (FAO) of the United Nations. The softening of commodity prices, whilst conducive to lower global inflation, is also an indication of the cautious market sentiment on global economic outlook. Despite the recent developments, the risks of large commodity price fluctuations remain. A sharp escalation of the geopolitical situation in the Middle East could possibly cause disruptions to global oil supplies and feed-through into a notable rebound in oil prices. Likewise, international food prices could also be sensitive to adverse supply shocks arising from unfavourable weather conditions.
20
40
60
80
100
120
140
160
180
200
220
240
260
1/02 7/02 1/03 7/03 1/04 7/04 1/05 7/05 1/06 7/06 1/07 7/07 1/08 7/08 1/09 7/09 1/10 7/10 1/11 7/11 1/12 7/12 1/13 7/13 1/14 7/14 1/15
Index (2005=100)
Diagram 2.2 : International commodity prices declined over the past year, yet sharp swings cannot be ruled out amid the global liquidity glut
FoodAgricultural raw materials
Fuel (energy)
Note : Indices as depicted refer to IMF's commodity price indices.
Metal
29
Box 2.1
Deflation risks in selected economies
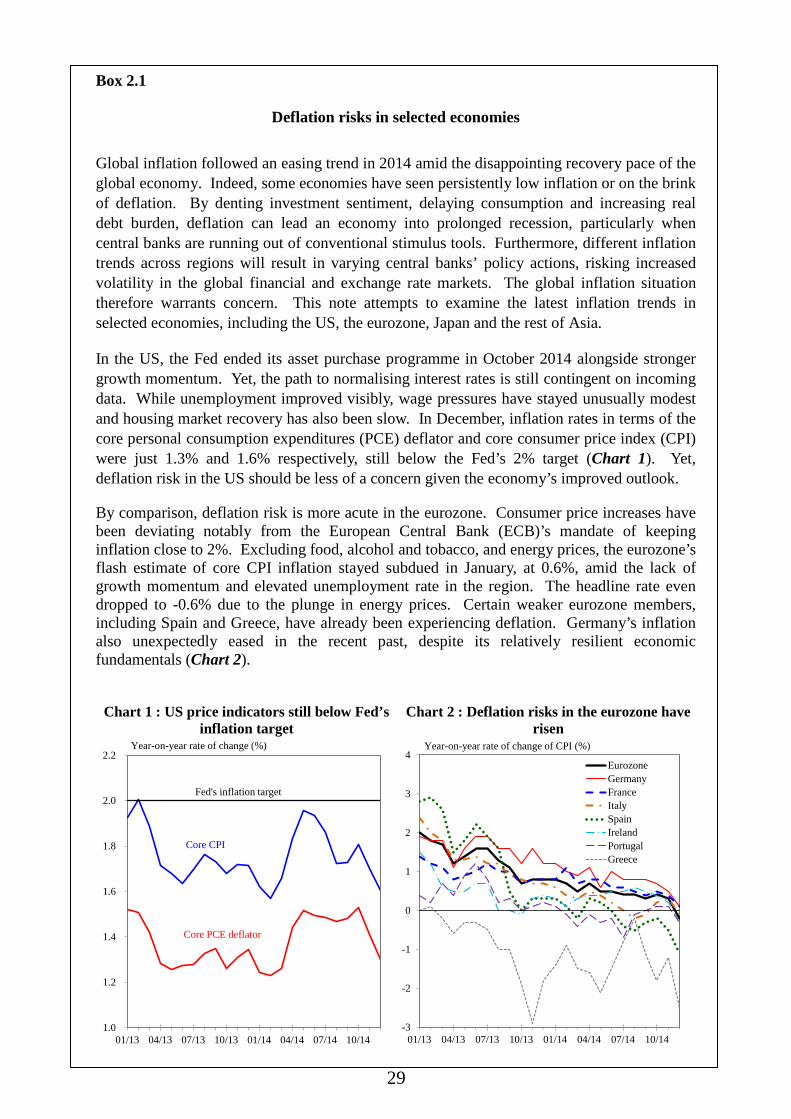
Global inflation followed an easing trend in 2014 amid the disappointing recovery pace of the global economy. Indeed, some economies have seen persistently low inflation or on the brink of deflation. By denting investment sentiment, delaying consumption and increasing real debt burden, deflation can lead an economy into prolonged recession, particularly when central banks are running out of conventional stimulus tools. Furthermore, different inflation trends across regions will result in varying central banks’ policy actions, risking increased volatility in the global financial and exchange rate markets. The global inflation situation therefore warrants concern. This note attempts to examine the latest inflation trends in selected economies, including the US, the eurozone, Japan and the rest of Asia.
In the US, the Fed ended its asset purchase programme in October 2014 alongside stronger growth momentum. Yet, the path to normalising interest rates is still contingent on incoming data. While unemployment improved visibly, wage pressures have stayed unusually modest and housing market recovery has also been slow. In December, inflation rates in terms of the core personal consumption expenditures (PCE) deflator and core consumer price index (CPI) were just 1.3% and 1.6% respectively, still below the Fed’s 2% target (Chart 1). Yet, deflation risk in the US should be less of a concern given the economy’s improved outlook.
By comparison, deflation risk is more acute in the eurozone. Consumer price increases have been deviating notably from the European Central Bank (ECB)’s mandate of keeping inflation close to 2%. Excluding food, alcohol and tobacco, and energy prices, the eurozone’s flash estimate of core CPI inflation stayed subdued in January, at 0.6%, amid the lack of growth momentum and elevated unemployment rate in the region. The headline rate even dropped to -0.6% due to the plunge in energy prices. Certain weaker eurozone members, including Spain and Greece, have already been experiencing deflation. Germany’s inflation also unexpectedly eased in the recent past, despite its relatively resilient economic fundamentals (Chart 2).
Chart 1 : US price indicators still below Fed’s
inflation target Chart 2 : Deflation risks in the eurozone have
risen
1.0
1.2
1.4
1.6
1.8
2.0
2.2
01/13 04/13 07/13 10/13 01/14 04/14 07/14 10/14
Year-on-year rate of change (%)
Fed's inflation target
Core CPI
Core PCE deflator
-3
-2
-1
0
1
2
3
4
01/13 04/13 07/13 10/13 01/14 04/14 07/14 10/14
EurozoneGermanyFranceItalySpainIrelandPortugalGreece
Year-on-year rate of change of CPI (%)

30
Box 2.1 (Cont’d)
To reinvigorate the economy and bring inflation back to the target, the ECB cut its key interest rates to record lows in June and September 2014, and started its covered bond and asset-backed securities purchase programmes since October. However, these measures failed to reverse the course of the region’s inflation. On 22 January 2015, the ECB announced further easing measures, and expanded its purchase programmes for asset-backed securities and covered bonds. It remains to be seen whether this can fend off deflation risk.
In Japan, the fight against deflation by means of “Abenomics” has also run into difficulties, with consumer price inflation easing again in recent months. Apart from the recent plunge in oil prices, also accountable were the waning effects of the expansionary macroeconomic policies launched since 2013 as well as the weakened demand following the consumption tax hike in April 2014, which led Japan’s economy into recession in the second and third quarters of 2014. The Bank of Japan (BOJ) rolled out further monetary easing measures in late October in an attempt to ward off deflation risk and revive the economy. Japan’s inflation was 0.5% in December after excluding the effect of the consumption tax hike, well below the BOJ’s target of attaining 2% inflation (Chart 3).
As to other Asian economies, inflationary pressures in most of them have also been receding along with the recent declines in commodity prices and the sluggish global economy (Chart 4). In the Mainland economy, while producer prices have been falling, consumer price inflation still registered a mild increase, albeit easing further. Also, Singapore’s negative headline inflation rates in November and December were due mainly to temporary factors. Compared to the eurozone economies, most Asian economies have relatively sound fundamentals and continue to sustain solid expansion, and therefore the risks of falling into the deflationary trap should not be significant.
Chart 3 : Japan’s underlying inflation is still below BOJ’s target
Chart 4 : Inflation in many other Asian economies has also eased in recent periods
-2
-1
0
1
2
3
4
01/13 04/13 07/13 10/13 01/14 04/14 07/14 10/14
Year-on-year rate of change (%)
CPI inflation(excluding the effect of consumption tax hike)
CPI inflation
-1
0
1
2
3
4
5
6
7
8
9
10
01/13 04/13 07/13 10/13 01/14 04/14 07/14 10/14 01/15
Hong Kong (underlying inflation)Mainland ChinaKoreaTaiwanSingaporeIndonesiaMalaysiaPhilippines
Year-on-year rate of change (%)
BOJ's price stability target
In sum, the deflation risks in economies across the globe are uneven, with the threats to the eurozone and Japan being most severe. The recent oil price slump also complicated the picture. Hong Kong’s underlying inflation is currently around 3% and deflation risk is low. However, the unevenness of deflation risks in major economies would reinforce the trend of varying monetary policies among them, with potential destabilising repercussions on global financial and exchange rate markets. We need to closely monitor these developments.

31
Box 2.2
Oil price fluctuations and its impact on the global economy
International crude oil prices fell drastically since the latter half of 2014. While volatility in oil prices is not uncommon from past experience, such sharp fall in oil prices is still unprecedented and unusual (Chart 1). This note attempts to examine the possible reasons behind the latest plunge in oil prices and to highlight its impacts on the global economic situation.
Chart 1 : The recent plunge in oil prices is unprecedented and unusual
0
20
40
60
80
100
120
140
160
1970
1972
1974
1976
1978
1980
1982
1984
1986
1988
1990
1992
1994
1996
1998
2000
2002
2004
2006
2008
2010
2012
2014
US$ per barrel
2015
Price of Brent crude
Possible reasons behind the oil price plunge from a supply-demand perspective
Simultaneous changes to factors determining the global demand and supply of oil have possibly contributed to the recent slump in oil prices: Demand-side factors: Demand growth for oil has been rather subdued. As can be
clearly seen from Chart 2, oil consumption is indeed highly related to the global economic sentiment. World industrial production slowed down alongside the below-trend growth of the global economy after the Global Financial Crisis of 2008, thereby reducing the demand for oil. It should also be noted that the strengthening of the US dollar over the course of 2014, to a certain extent, has also put some downward pressure on the dollar prices of commodities including crude oil.

32
Box 2.2 (Cont’d)
Chart 2 : Lower oil demand amid weaker global industrial activity
Q1
2001Q1
2003Q1
2005Q1
2007Q1
2009Q1
2011Q1
2013Q1
2015
-14
-12
-10
-8
-6
-4
-2
0
2
4
6
8
10
12
14
-6
-5
-4
-3
-2
-1
0
1
2
3
4
5
6
World oil consumption (LHS)
World industrial production (RHS)
Year-on-year rate of change (%) Year-on-year rate of change in real terms (%)Fore-cast
Supply-side factors: The global oil supply has been increasing visibly in recent
periods. The production of the Organization of the Petroleum Exporting Countries (OPEC) was rather stable at high levels (Chart 3(a)). This, coupled with the announcement of keeping their production ceiling unchanged in end-November 2014, has supported market expectations that oil supply will remain abundant relative to demand in the foreseeable future. Concurrently, Russia’s oil production also expanded modestly. Those of the US surged in tandem with the spectacular growth in shale oil production, thanks to massive investments incentivised by high oil prices in recent years and the subsequent technological breakthrough (Chart 3(b)).
Chart 3 : Abundant global oil supply given OPEC’s unchanged production ceiling and US’
increased shale oil production
0
5 000
10 000
15 000
20 000
25 000
30 000
35 000
01/07 01/08 01/09 01/10 01/11 01/12 01/13 01/14 0
1 000
2 000
3 000
4 000
5 000
6 000
01/07 01/08 01/09 01/10 01/11 01/12 01/13 01/14 01/15
(b) Shale oil production in the USThousand barrels per dayThousand barrels per day
(a) Crude oil production in selected economies
US
Russia
OPEC

33
Box 2.2 (Cont’d) Impact on the global real economy
The recent plunge in international oil prices will not only affect the global inflation outlook (as mentioned in Box 2.1), but will also have potential impacts on the global economy, with likely polarised real impacts among countries. For net oil-importing countries, comprising many advanced and Asian economies, lower oil prices could be conducive to bolstering economic growth, as consumers will have more household income to spend, and firms will face lower production costs, and hence better profit prospects. For net oil-exporting countries, a sharp decline in oil prices will dampen investment and capital flows on oil-related activity and cut export revenues, which will eventually translate into a reduction in their government revenues. Those with weaker fundamentals, fragile external positions, and dependent on oil revenues to fund their fiscal budgets will be particularly vulnerable, weighing on growth and posing downward pressures on their currencies, as was the case with Russia in late 2014 (Chart 4).
Chart 4 : Net oil-importing countries would likely benefit from the recent oil price adjustments
-8 000-7 000-6 000-5 000-4 000-3 000-2 000-1 000
01 0002 0003 0004 0005 0006 0007 0008 000
Saud
i Ara
bia
Rus
sia
Uni
ted
Ara
bEm
irate
s Iraq
Nig
eria
Kuw
ait
Ven
ezue
la
Ang
ola
Mex
ico
Iran
Alg
eria
Qat
ar
East
ern
Euro
pe(e
xcl.
Rus
sia)
Indo
nesi
a
Vie
tnam
Aus
tralia
Mal
aysi
a
Bra
zil
Uni
ted
Kin
gdom
Sing
apor
e
Fran
ce
Ger
man
y
Kor
ea
Japa
n
Indi
a
Mai
nlan
d C
hina
Uni
ted
Stat
es
Net oil importers
Net oil exporters
Thousand barrels per day in 2013
Concluding remarks
Whilst lower oil prices could be beneficial to the economic growth of those net oil importers, the future path of oil prices remains highly uncertain. A sharp disruption to oil supply from the elevated geopolitical tensions in the Middle East or a sudden change in the amount of oil production by OPEC could escalate oil prices markedly. Hence, the possibility of a rebound should not be ruled out. The recent price slump has added uncertainties to the already volatile global economic and financial situation. A further downturn in oil prices may lead to growing bankruptcies or defaults of oil producing companies. Possible contagion risks via the financial channels to international financial markets and the global economy need to be watched over.
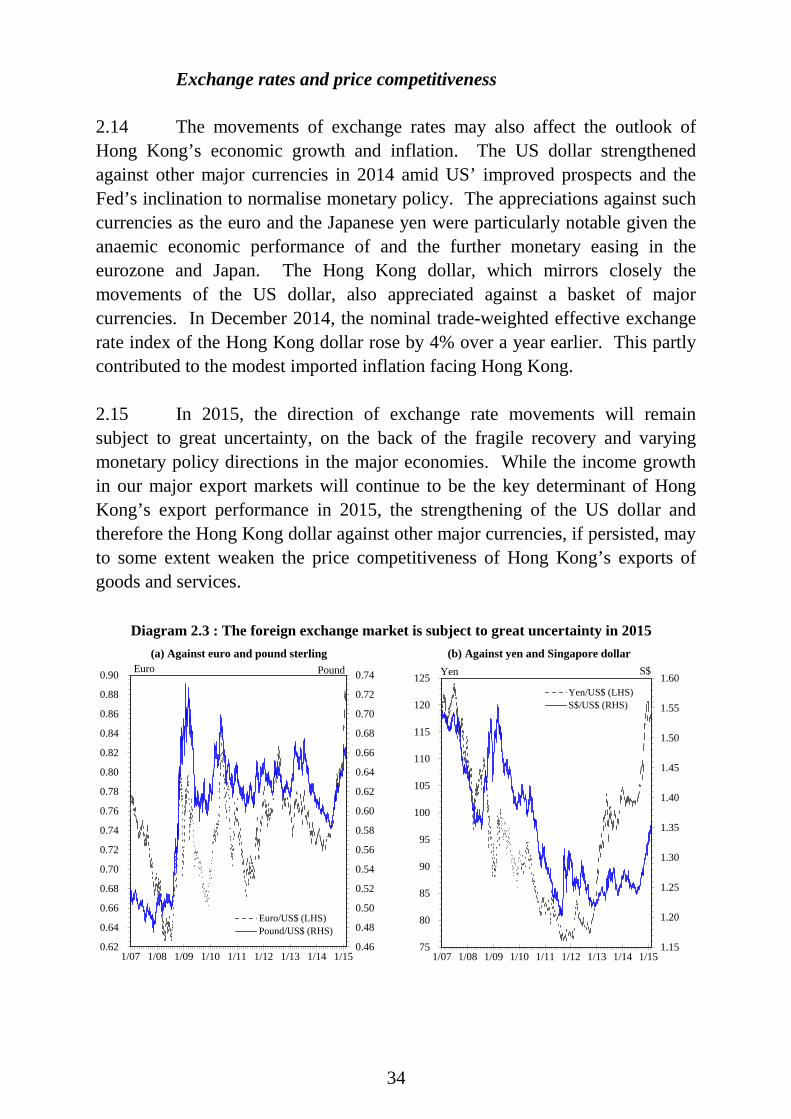
34
Exchange rates and price competitiveness 2.14 The movements of exchange rates may also affect the outlook of Hong Kong’s economic growth and inflation. The US dollar strengthened against other major currencies in 2014 amid US’ improved prospects and the Fed’s inclination to normalise monetary policy. The appreciations against such currencies as the euro and the Japanese yen were particularly notable given the anaemic economic performance of and the further monetary easing in the eurozone and Japan. The Hong Kong dollar, which mirrors closely the movements of the US dollar, also appreciated against a basket of major currencies. In December 2014, the nominal trade-weighted effective exchange rate index of the Hong Kong dollar rose by 4% over a year earlier. This partly contributed to the modest imported inflation facing Hong Kong. 2.15 In 2015, the direction of exchange rate movements will remain subject to great uncertainty, on the back of the fragile recovery and varying monetary policy directions in the major economies. While the income growth in our major export markets will continue to be the key determinant of Hong Kong’s export performance in 2015, the strengthening of the US dollar and therefore the Hong Kong dollar against other major currencies, if persisted, may to some extent weaken the price competitiveness of Hong Kong’s exports of goods and services.
0.46
0.48
0.50
0.52
0.54
0.56
0.58
0.60
0.62
0.64
0.66
0.68
0.70
0.72
0.74
0.62
0.64
0.66
0.68
0.70
0.72
0.74
0.76
0.78
0.80
0.82
0.84
0.86
0.88
0.90
1/07 1/08 1/09 1/10 1/11 1/12 1/13 1/14 1/15
Euro/US$ (LHS)Pound/US$ (RHS)
1.15
1.20
1.25
1.30
1.35
1.40
1.45
1.50
1.55
1.60
75
80
85
90
95
100
105
110
115
120
125
1/07 1/08 1/09 1/10 1/11 1/12 1/13 1/14 1/15
Yen/US$ (LHS)S$/US$ (RHS)
Diagram 2.3 : The foreign exchange market is subject to great uncertainty in 2015(a) Against euro and pound sterling (b) Against yen and Singapore dollar
Pound S$YenEuro
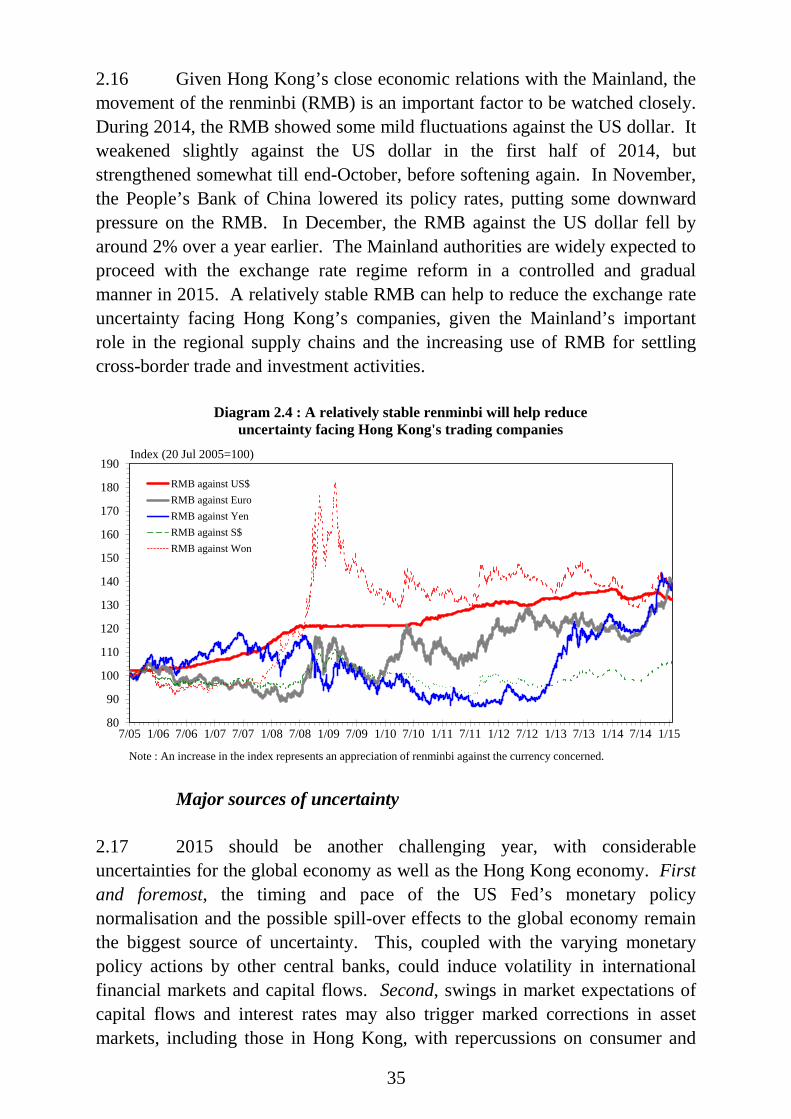
35
2.16 Given Hong Kong’s close economic relations with the Mainland, the movement of the renminbi (RMB) is an important factor to be watched closely. During 2014, the RMB showed some mild fluctuations against the US dollar. It weakened slightly against the US dollar in the first half of 2014, but strengthened somewhat till end-October, before softening again. In November, the People’s Bank of China lowered its policy rates, putting some downward pressure on the RMB. In December, the RMB against the US dollar fell by around 2% over a year earlier. The Mainland authorities are widely expected to proceed with the exchange rate regime reform in a controlled and gradual manner in 2015. A relatively stable RMB can help to reduce the exchange rate uncertainty facing Hong Kong’s companies, given the Mainland’s important role in the regional supply chains and the increasing use of RMB for settling cross-border trade and investment activities.
Major sources of uncertainty 2.17 2015 should be another challenging year, with considerable uncertainties for the global economy as well as the Hong Kong economy. First and foremost, the timing and pace of the US Fed’s monetary policy normalisation and the possible spill-over effects to the global economy remain the biggest source of uncertainty. This, coupled with the varying monetary policy actions by other central banks, could induce volatility in international financial markets and capital flows. Second, swings in market expectations of capital flows and interest rates may also trigger marked corrections in asset markets, including those in Hong Kong, with repercussions on consumer and
80
90
100
110
120
130
140
150
160
170
180
190
7/05 1/06 7/06 1/07 7/07 1/08 7/08 1/09 7/09 1/10 7/10 1/11 7/11 1/12 7/12 1/13 7/13 1/14 7/14 1/15
RMB against US$RMB against EuroRMB against YenRMB against S$RMB against Won
Index (20 Jul 2005=100)
Diagram 2.4 : A relatively stable renminbi will help reduceuncertainty facing Hong Kong's trading companies
Note : An increase in the index represents an appreciation of renminbi against the currency concerned.

36
investment sentiments. Third, economic conditions in some major advanced economies remain fragile. The fluid situation in the eurozone, with dim economic prospects and lingering deflation risks, was further complicated by such issues as Greece’s debt problem and geopolitical tensions in Eastern Europe. Fourth, some major emerging market economies, such as Russia and Brazil, already saw visible growth deceleration of late, and this weak trend is expected to extend well into 2015. More worryingly, emerging market economies with weaker external positions and less robust fundamentals could be destabilised by the more volatile global monetary conditions, with possible spill-over effects on the rest of the world. Fifth, the oil price plunge last year was unusual. Its impacts on Russia and other net oil exporters are still evolving. Sixth, the geopolitical tensions in various regions linger on and remain a concern. 2.18 On the positive side, if the US economy were to show stronger growth momentum in conjunction with the Fed’s effective communication about the monetary policy, the negative impacts on global economic and financial stability would likely lessen during the course of its interest rate normalisation. Likewise, if the monetary stimulus measures in Europe and Japan are effective, or if their plans on structural reforms can be implemented in more concrete terms, consumption and investment sentiments will strengthen to support growth in these economies. Also, there could be some upside potential to the global economic outlook if the economic performance of the Mainland and other emerging Asian economies turns out to be better than expected. Outlook for the Hong Kong economy in 2015 2.19 Hong Kong’s economic performance, as always, hinges on global economic and financial conditions. On the external front, the performance of Hong Kong’s exports of goods has been mostly lacklustre amid the fragile global recovery in the aftermath of the Global Financial Crisis. In 2015, the export outlook remains rather bleak. The subdued growth in the eurozone and Japan will remain the major hindrance to global economic expansion, weighing on global trade flows. The weak demand conditions of some advanced economies will likely cast an adverse impact on production and trading activities in Asian economies, including the Mainland, with some possible spill-overs to Hong Kong. Also, the strength of US dollar will not bode well for our overall export competitiveness, and in particular, the distinct weakness of the euro and yen will directly curtail our exports to Europe and Japan. Yet, better prospects for the US economy and the sounder economic fundamentals in Asia in general should hopefully provide some cushion against the headwinds in

37
other parts of the global economy. There may also be some upside potential if the US economy were to pick up faster than expected, to the benefit of Asia’s trade flows.
-16
-12
-8
-4
0
4
8
12
16
20
24
-4
-2
0
2
4
6
2000 2002 2004 2006 2008 2010 2012 2014 2015*-30
-20
-10
0
10
20
30
40
38
42
46
50
54
58
62
66
2005 2006 2007 2008 2009 2010 2011 2012 2013 2014 2015
Index
World economic growth
rate (LHS)
Hong Kong's PMI shiftedforward by two months
(LHS)
Hong Kong'stotal exports
(RHS)
Hong Kong's total exports (RHS)
Real rate of change (%)
Diagram 2.5 : Hong Kong's exports of goods will continue to hinge on global economic conditions in 2015
Year-on-year rate of change (%)Real rate of change (%)
Note : (*) Forecasts from the IMF World Economic Outlook Update, January 2015.
f h
-6
-4
-2
0
2
4
6
-24
-20
-16
-12
-8
-4
0
4
8
12
16
20
24
2002 2004 2006 2008 2010 2012 2014
Hong Kong's exports to the US (LHS)US GDP (RHS)
-6
-4
-2
0
2
4
6
8
10
12
14
16
-18
-12
-6
0
6
12
18
24
30
36
42
48
2002 2004 2006 2008 2010 2012 2014
Hong Kong's exports to Asia (excluding Japan) (LHS)Emerging and developing Asia's GDP (RHS)
2015*
Diagram 2.6 : Regional trade is likely to be supported by the steady growth of the Mainland economy
(a) United States (b) AsiaReal rate of change (%)Rate of change (%) Real rate of change (%)Rate of change (%)
Note : (*) Forecasts from the IMF World Economic Outlook Update, January 2015.
2015*

38
2.20 Exports of services look relatively more promising and should see better growth outlook in 2015 after a rather weak year in 2014. Exports of travel services are likely to show some improvement as the continued visible increase in visitors from the Mainland should provide solid support to inbound tourism. As to other services exports, exports of financial and business services will continue to benefit from the expansion of fund-raising and cross-border financial activities. On the other hand, in face of the choppy global trading environment, the outlook for exports of trade-related services and transportation services is not as promising, and growth will likely be modest at best. Yet, on balance, overall services exports should still stage a relative improvement this year.
30
35
40
45
50
55
0
200
400
600
800
1,000
1,200
1,400
1,600
1,800
2,000
2,200
1997 2004 2009 2014
Hong Kong's total exports to Mainland (LHS)
Hong Kong's imports from Mainland (LHS)
% share of total trade with Mainland in Hong Kong's total trade (RHS)
(a) Merchandise trade
HK$Bn Percent
20
25
30
35
40
45
50
55
60
65
70
75
80
0
10
20
30
40
50
60
70
80
90
100
1997 2004 2009 2014
Visitor arrivals from Mainland (LHS)
Hong Kong resident departures to Mainland (LHS)
% share of visitor arrivals from Mainland in total incoming visitors (RHS)
(b) Visitor arrivals from Mainland and Hong Kong resident departures to Mainland
PercentNumber (million)
Diagram 2.7 : Economic links with the Mainland are important for Hong Kong
15
20
25
30
35
40
45
50
55
60
65
0
5
10
15
20
25
30
1997 2004 2009 2014
Total (LHS)
Mainland enterprises (LHS)
% share of Mainlandenterprises (RHS)
(c) Market capitalisation of Mainland enterprises in the Hong Kong stock market
(end-year figures)
HK$Tn Percent
0
10
20
30
40
50
60
70
80
1998 2003 2008 2013
Hong Kong's inward direct investment from Mainland
Mainland's foreign direct investment from Hong Kong
(d) Mainland's foreign direct investment from Hong Kong and Hong Kong's inward direct
investment from Mainland
US$Bn

39
2.21 Given the rather unpromising outlook for the external sector in 2015, this year’s growth driver of our economy has to rely on the domestic sector, which has shown much resilience over the past years, helping to cushion the economy against the adverse external shocks. Although domestic demand slowed in 2014 following a prolonged period of below-trend GDP growth, private consumption expenditure should be able to hold up and see further growth in 2015, on the back of a resilient labour market and rising incomes, and more so, if asset market conditions were to remain supportive. The outlook for investment expenditure, on the other hand, is a bit more uncertain. In face of a still-highly unsteady global economic environment, investment could continue to see volatility during the year, especially if interest rate outlook remained uncertain, and if local political disputes were to linger on. Indeed, the results of the latest Quarterly Business Tendency Survey on large enterprises and a consultation exercise on small and medium-sized enterprises (SMEs) both indicated that business sentiment about the near-term outlook remained rather cautious, though hiring sentiment stayed robust of late. Public construction works look set for further expansion, and hopefully would be able to provide a more stable growth source for overall investment in 2015.
-4
-3
-2
-1
0
1
2
3
4
-15
-10
-5
0
5
10
15
2004 2005 2006 2007 2008 2009 2010 2011 2012 2013 2014
Private consumption expenditure (LHS)Total employment (RHS)
Diagram 2.8 : Private consumption should see further growth as supported by steady employment conditions in the near term
Year-on-year rate of change in real terms (%) Year-on-year rate of change (%)

40
-30
-24
-18
-12
-6
0
6
12
18
24
30
36
-10
-8
-6
-4
-2
0
2
4
6
8
10
12
2004 2005 2006 2007 2008 2009 2010 2011 2012 2013 2014
PCE (LHS)
Residential flat price(RHS)
-80
-60
-40
-20
0
20
40
60
80
100
120
-10
-5
0
5
10
15
2004 2005 2006 2007 2008 2009 2010 2011 2012 2013 2014
Diagram 2.9 : Consumer sentiment could hold up further if asset market conditions stayed supportive
(a) Housing wealth
PCE (LHS)
(b) Equity wealth
Equity wealth(RHS)
Year-on-year rate of changein real terms (%)
Year-on-yearrate of change (%)
Year-on-year rate of changein real terms (%)
Year-on-yearrate of change (%)
-18-15-12-9-6-30369121518
-60-50-40-30-20-10
0102030405060
2008 2009 2010 2011 2012 2013 2014 2015
Expected change in business situation (LHS)
Net balance indicates the direction of expected change in business situation versus preceding quarter. It refers to thedifference in percentage points between the proprotion of establishments choosing "better" over that choosing"worse". A positive sign indicates a likely upward trend while a negative sign, a likely downward trend.
Note : (*)
Net balance* (% point)
Domestic demand growth (RHS)
Diagram 2.10 : Business sentiment remained cautious about the near-term outlook
Year-on-year rate of change in real terms (%)

41
2.22 Taking into account the likely subdued performance of external demand and the relative resilient domestic demand, the Hong Kong economy is projected to expand by 1-3% in 2015, after the 2.3% growth in 2014 and compared to the average annual growth of 3.9% in the past ten years. The official forecast adopts a two-percentage-point range in view of the prevailing uncertainties surrounding the already-modest prospects for the global economy and the expected heightened volatility in global monetary conditions. Needless to say, downside risks still abound from the external front. Abrupt changes to the global economic and financial conditions stemming from the different monetary policy stances of major central banks could trigger corrections in asset markets, in turn adversely denting consumption and investment sentiments. Moreover, the austere global economic environment could impact severely on some emerging market economies with weak fundamentals and thereby derail the global recovery. Nonetheless, there may be some upside potential to the forecast if global growth turns out to be stronger than expected, particularly if Asian economies are more resilient than envisaged despite the sluggishness in the advanced economies. For comparison, the prevailing forecasts by the private sector analysts for Hong Kong’s economic growth in 2015 mostly fall within the range of 2.1-3.3%, averaging around 2.7%.
-5
-4
-3
-2
-1
0
1
2
3
4
5
-30
-20
-10
0
10
20
30
2008 2009 2010 2011 2012 2013 2014 2015
Business expectation on employment (LHS)
Notes : (*)
(#)
Net balance* (% point)
Employment growth# (RHS)
Diagram 2.11 : Hiring sentiment stayed positive
Net balance indicates the direction of expected change in number of persons engaged versus preceding quarter. Itrefers to the difference in percentage points between the proportion of establishments choosing "up" over thatchoosing "down". A positive sign indicates a likely upward trend while a negative sign, a likely downward trend.Employment in private sector.
Year-on-year rate of change (%)

42
2.23 Underlying inflation in Hong Kong fell further from 4.0% in 2013 to 3.5% in 2014. Price pressures will likely remain modest in 2015 amid the sub-par local economic growth and soft imported inflation. Externally, imported inflation looks set to remain tame, thanks to lower global inflation and soft international commodity prices. Locally, the moderate increases in commercial rentals during most of 2014, as well as the steady wage cost pressures, are both conducive to lower inflation pressures in 2015. Granting no unpleasant upside surprises in international commodity prices, underlying Composite CPI is forecast to increase by 3% for 2015 as a whole, down further from the 3.5% increase in 2014. Taking into account the effects of the Government’s one-off measures, headline Composite CPI is forecast to increase by 3.5% in 2015, after 4.4% in 2014. The GDP deflator is forecast to rise by 1.5%, taking into account the expected slower increases in prices from both the local and external fronts.
-6
-4
-2
0
2
4
6
8
10
2005 2006 2007 2008 2009 2010 2011 2012 2013 2014 2015*
GDP
10-year trend growth (2005-2014)
Diagram 2.12 : Economy expected to grow moderately further, but uncertainties still abound
Real rate of change (%)
Note : (*) Mid-point of the range forecast. (Forecast)

43
Forecast rate of change in 2015 (%) Gross Domestic Product (GDP) Real GDP 1 to 3 Nominal GDP 2.5 to 4.5 Per capita GDP in real terms 0.2 to 2.1 Per capita GDP at current market prices HK$315,200-321,400
(US$40,400-41,200) Composite Consumer Price Index Headline Underlying
3.5 3
GDP Deflator 1.5
Forecast on Hong Kong’s GDP growth in 2015 recently made by other selected parties
(%) The University of Hong Kong 2.3 to 3.3 Average forecast by private sector analysts#
2.7
Note : (#) Forecast GDP growth rates by private sector analysts mostly fall between 2.1% and 3.3%.
-8
-6
-4
-2
0
2
4
6
8
2005 2006 2007 2008 2009 2010 2011 2012 2013 2014 2015
HeadlineComposite CPI
Diagram 2.13 : Inflation is expected to ease further in 2015
Rate of change (%)
(Forecast)
GDP deflator
UnderlyingComposite CPI
44
Medium-term outlook for the Hong Kong economy 2.24 The Hong Kong economy will continue to face a challenging external environment over the medium term, as the monetary policy normalisation in the advanced economies will be a long drawn-out process and as most advanced economies are expected to stay at low gear under the “new normal”. Considerable scope remains for structural reforms in the eurozone and Japan to improve labour market conditions, enhance growth and boost competitiveness. Furthermore, the prevailing sovereign debt and fiscal sustainability issues as well as problems of population ageing will continue to trouble many advanced economies beyond the near term. 2.25 As to emerging market economies, their performance will be constrained by the developments in the advanced economies. Those relying on export-led growth will be affected more. Moreover, those economies with high degrees of external vulnerabilities and less resilient financial systems may find themselves more prone to sharp fluctuations of asset prices and capital flows amid the varying monetary policy stances among major central banks. Nevertheless, emerging market economies in Asia should continue to outperform their counterparts in the rest of the world, given their stronger fundamentals. 2.26 The possibility of a prolonged period of slow growth in the advanced economies underscores the importance of deepening our economic integration with the Mainland as part of our growth strategy. With the Mainland economy shifting towards a more sustainable growth path, it will still outpace other major economies, presenting Hong Kong with extensive growth opportunities. Specifically, Hong Kong is well-positioned to leverage on the opportunities brought about by the Mainland’s national strategy of rebalancing growth towards domestic demand and the services sector. In the coming years, further opening-up of the Mainland economy and the enactment of institutional reforms will likely increase demand for high-end services, particularly in the area of financial and professional services which Hong Kong possesses competitive edge. In this regard, the Government will constantly strive to strengthen economic ties with the Mainland through the CEPA and other regional co-operation platforms. Besides, further progress will be made to enhance Hong Kong’s status as the leading offshore RMB business centre and premier asset management hub amid the internationalisation of the RMB. Separately, in face of the highly uncertain external environment, the Government will continue to proactively forge economic ties with new and emerging markets.

45
2.27 Locally, the Government is committed to maintaining Hong Kong’s competitiveness and sustaining longer-term economic development. As Hong Kong is moving towards a high value-added, knowledge-based economy, the Government will strive to consolidate our competitive edge in pillar industries and provide support to new growth areas. The Government will continue to upgrade human capital and infrastructure to increase Hong Kong’s productivity and competitiveness. Large-scale ongoing infrastructure works will also lend support to domestic demand. In sum, taking into account the challenges in the external and domestic fronts, the economy is expected to attain a trend growth of 3.5% per annum from 2016 to 2019. 2.28 It is worth noting that population ageing remains an imminent challenge to our medium to longer-term economic growth, as labour force growth may stagnate after 2018. Such demographic changes will also have significant implications on our public expenses, especially on healthcare and social welfare. While the 2015 Policy Address has announced a more proactive population policy with a view to boosting labour force at source, it is still important for the Government to exercise fiscal prudence, so as to preserve our ability to meet the upcoming various challenges to our economy. In particular, sufficient public resources must be ensured for infrastructure and human capital investment to drive the economy and also to tackle social issues through various programmes.
2.29 Inflationary pressures are likely to remain moderate over the medium term. Slower global growth under the “new normal” will lower the risks of global inflation. Locally, the productivity gain should help to alleviate some of the local cost pressures. Also important is the Government’s incessant efforts to increase land and housing supply, which should bring about a better balance between demand and supply in the property market, helping to ease the upward pressures on rental costs in the coming years. Taking all these developments into account, the trend rate of change in the underlying CCPI in Hong Kong from 2016 to 2019 is forecast at 3% per annum. However, there are still upside risks, including the possibility of sharp fluctuations in food and energy prices arising from adverse supply shocks. Uncertainties about global economic and monetary conditions may also increase the volatility of international commodity prices. Furthermore, if global growth is stronger than expected and major central banks delay their response to the rise in inflation pressures, global inflation may accelerate faster than expected, with repercussions on Hong Kong’s inflation.

46
6.5
3.2 2.9
3.5
0
1
2
3
4
5
6
7
8
2003-2006 2007-2010 2011-2014 2016-2019
Diagram 2.14 : Medium term trend growth likely to be moderate
Trend GDP growth rate (%)
47
CHAPTER 3 : THE EXTERNAL SECTOR Summary
The external trading environment remained lacklustre in 2014, as the global economy improved only slowly. While the US economy has strengthened during the year, the eurozone economy still lacked momentum and Japan’s economy even slipped into technical recession. Emerging market economies also slowed down by varying degrees, with emerging Asia faring relatively better. Besides, the monetary policy divergence among major central banks, geopolitical tensions in various regions and the oil price plunge all added headwinds to the financial and foreign exchange markets, exacerbating the already unsteady external environment.
Hong Kong’s merchandise exports showed only modest growth in 2014, up 2.1% in real terms(1) for the year as a whole. Growth momentum weakened noticeably again in the fourth quarter, after some pick-up in the preceding two quarters. While the US market improved, exports to the EU and Japan faltered, a reflection of the marked growth divergence among these advanced economies. Meanwhile, exports to Asia also exhibited a mixed performance, with the Indian and ASEAN markets faring visibly better.
Exports of services eased visibly during the year, and attained only a slight growth for 2014 as a whole. The key drag was the distinct slackening in exports of travel services, due mainly to a notable decline in visitor spending on big-ticket items amid a high base of comparison. The performance of other services exports was also mediocre. Exports of trade-related services remained lacklustre during most of the year given the subpar global trade performance. Exports of financial and other business services grew only mildly as lingering external uncertainties hampered expansion in cross-border commercial activity and financial flows. Transportation services fared slightly better and attained modest growth on the back of flourishing passenger flows.
Hong Kong has proactively promoted trade and investment relations with its economic partners. The negotiation of Free Trade Agreement (FTA) between Hong Kong and the ASEAN officially launched in July 2014, and the FTA with Chile came into effect in October. Separately, the Agreement between the Mainland and Hong Kong on Achieving Basic Liberalisation of Trade in Services in Guangdong was signed in December, which will not only help Hong Kong service providers to tap the Guangdong market, but also set a model for basic liberalisation of trade in services in the Mainland.

48
Goods trade Total exports of goods 3.1 The overall trading environment in 2014 remained subdued, held back by the slow global economic recovery. Hong Kong’s merchandise exports (comprising re-exports and domestic exports) grew modestly by 2.1% in real terms for 2014 as a whole, slightly below the 2.8% growth in 2013. During the course of the year, merchandise export performance showed large fluctuations, dipping 0.3% year-on-year in the first quarter, followed by increases of 4.3% and 4.8% respectively in the second and third quarters, yet with a relapse back to a 0.4% decline in the fourth quarter, mirroring the weak start of the global economy and the softer regional trade flows at the end of the year. On a seasonally adjusted quarter-to-quarter basis, merchandise exports contracted by 4.0% in the first quarter, rebounding by 3.8% and 2.4% in the second and third quarters, and then fell by 3.2% in the fourth quarter. 3.2 Global economic growth in 2014 was weaker than expected. The International Monetary Fund had marked down its growth forecast successively, and recently estimated global growth in 2014 at 3.3%, same as in 2013. The global economy had a weak start, with notable contraction in the US economy in the first quarter amid disruptions caused by unusually cold weather. While the US economy regained momentum subsequently, the eurozone economy stagnated, being besieged by a myriad of structural problems and the geopolitical tensions in Eastern Europe. Worse still, Japan’s economy lost steam after the sales tax hike in April. Emerging markets also encountered economic slowdown, yet the Mainland and most emerging Asian economies fared better. As the US economy gradually gained traction, the Federal Reserve ended its asset purchases in October, in sharp contrast to the further easing to fend off deflation risks by central banks in Japan and the eurozone. On top of a weak external environment, the uncertainties arising from pronounced divergence of monetary policy stance among major central banks, geopolitical tensions in Eastern Europe and the Middle East as well as the plunge in oil prices also heightened financial market and exchange rate volatility, further restraining global trade expansion. 3.3 Re-exports(2), the mainstay of overall merchandise exports and accounting for 98.5% of total exports by value, grew modestly by 2.1% in real terms in 2014, slightly slower than the 3.0% growth in 2013. Domestic exports, constituting the remaining 1.5% of total exports, rebounded by 5.0% in real terms in 2014, reversing the declines in the previous three years.
49
Table 3.1 : Total exports of goods, re-exports and domestic exports
(year-on-year rate of change (%))
Total exports of goods
Re-exports Domestic exports
In value terms
In real terms(a)
Change in prices
In value terms
In real terms(a)
Change in prices
In value terms
In real terms(a)
Change in prices
2013 Annual
3.6 2.8 1.3 3.8 3.0 1.3 -7.6 -9.4 2.2
Q1 4.0 4.0 (-1.0) 0.6 4.0 4.2 (-0.9) 0.5 -0.9 -4.5 (-4.7) 4.2 Q2 2.4 2.4 (-1.1) 0.4 2.6 2.6 (-1.0) 0.4 -7.9 -10.1 (-5.8) 2.3 Q3 3.3 2.0 (1.9) 1.7 3.6 2.2 (1.9) 1.7 -11.9 -12.9 (0.9) 1.8 Q4
4.8 3.1 (3.1) 2.4 5.0 3.3 (3.1) 2.4 -8.5 -9.4 (1.3) 0.6
2014 Annual 3.2 2.1 2.0 3.2 2.1 2.0 1.7 5.0 -0.3
Q1 0.7 -0.3 (-4.0) 1.7 0.7 -0.4 (-4.1) 1.7 -1.1 3.7 (7.5) -1.2 Q2 4.8 4.3 (3.8) 1.8 4.8 4.1 (3.8) 1.9 8.3 11.8 (2.0) * Q3 5.8 4.8 (2.4) 2.2 5.9 4.7 (2.5) 2.2 3.1 5.8 (-4.2) 1.0 Q4 1.2 -0.4 (-3.2) 2.2 1.3 -0.4 (-3.2) 2.3 -3.7 -1.6 (-6.5) -1.0
Notes : ( ) Seasonally adjusted quarter-to-quarter rate of change. (*) Change of less than 0.05%. (a) The growth rates here are not strictly comparable with those in the GDP accounts in
Table 1.1, due to differences in coverage and methodology.

50
Q12009
Q12010
Q12011
Q12012
Q12013
Q12014
-40
-30
-20
-10
0
10
20
30
40 -8
-6
-4
-2
0
2
6
8
4
Trade-weightedreal EERI *
(RHS)
Total import demand inHong Kong's
major markets #(LHS)
Hong Kong's total exportsof goods (LHS)
Diagram 3.1 : Merchandise exports were still restrained by a slow-growing global economy in 2014
Year-on-year rate of change (%) Year-on-year rate of change (%)
Notes : Total exports of goods as depicted refer to the year-on-year rate of change in real terms, while
total import demand in Hong Kong’s major markets as depicted refers to the year-on-year rate of change in US dollar terms in the aggregate import demand in Asia, the United States and the European Union taken together.
(*) The real EERI in this graph is inverted in scale for easier comprehension. A positive
change denotes real appreciation of the Hong Kong dollar.
(#) Import demand figure for the fourth quarter of 2014 is based on statistics for October and November 2014.
Q12009
Q12010
Q12011
Q12012
Q12013
Q12014
-50
-40
-30
-20
-10
0
10
20
30
40
50 Percent
Re-exports
(a) Year-on-year rate of changein real terms
Totalexports
of goods
Q12009
Q12010
Q12011
Q12012
Q12013
Q12014
-30
-25
-20
-15
-10
-5
0
5
10
15
20
25 Percent
(b) Seasonally adjusted quarter-to-quarterrate of change in real terms
Re-exportsTotal
exportsof goods
Diagram 3.2 : Re-exports grew modestly while domestic exports rebounded in 2014
Domestic exports
Domestic exports

51
India$94.2 billion
(2.6%)
Rest of Asia$268.9 billion
(7.3%)
Singapore$59.9 billion
(1.6%)Taiwan
$79.3 billion(2.2%)
Korea$62.4 billion
(1.7%) Japan$131.5 billion
(3.6%)
EU$343.1 billion
(9.3%)
United States$341.5 billion(9.3%)
Q12009
Q12010
Q12011
Q12012
Q12013
Q12014
-30-25-20-15-10-505
1015202530354045
Total exports to Asia
Total exports to non-Asia
Total exports toall markets
Year-on-year rate of change in nominal terms (%)
Diagram 3.3 : Asian markets continued to feature prominently in Hong Kong's exports
Others$313.0 billion
(8.5%)
Mainland of China$1,979.0 billion
(53.9%)
Total exports of goods in 2014: $3,672.8 billion
Table 3.2 : Total exports of goods by major market (year-on-year rate of change in real terms (%))
2013 2014 Annual Q1 Q2 Q3 Q4 Annual Q1 Q2 Q3 Q4 Mainland of China 4.9 8.5 6.3 2.8 2.8 0.5 -2.9 4.5 3.6 -3.3 United States -4.3 -5.0 -8.0 -1.0 -3.6 2.9 3.9 3.1 0.4 4.6 European Union -0.6 -5.4 -2.5 2.7 2.4 0.6 1.2 4.3 -0.4 -2.1 Japan -6.3 -4.9 -5.5 -8.3 -6.2 -4.3 -2.1 -1.5 -5.1 -8.2 India 7.7 0.3 8.0 6.7 16.8 17.1 7.6 17.4 37.9 5.3 Taiwan -6.1 14.2 -12.1 -7.6 -13.9 2.1 -5.9 0.2 13.5 0.8 Korea 6.3 0.5 2.0 4.5 18.6 0.1 1.8 4.5 7.0 -11.4 Singapore 2.5 5.2 0.2 -0.9 6.2 2.4 6.8 -0.6 2.9 0.9 Overall* 2.8 4.0 2.4 2.0 3.1 2.1 -0.3 4.3 4.8 -0.4
Note : (*) The growth rates here are not strictly comparable with those in the GDP accounts in Table 1.1, due to differences in coverage and methodology.

52
3.4 Analysed by major market, the US performed relatively better among major advanced markets in 2014, notching a moderate growth in real terms for the whole year, marking the first annual increase since 2010, as the final demand there was recuperating alongside solid job gains and falls in unemployment rate. The EU market, though posting a marginal growth for the whole year, faltered again to show a year-on-year decline in the second half of 2014. The relapse reflected the continued affliction of structural issues in the eurozone economy amid the heightened geopolitical tensions in Eastern Europe. Exports to Japan continued to sag, with the decline widening in the second half, as Japan’s economy was struggling to recover from the recession induced by the sales tax hike in April. Apart from adverse impacts from the ailing economy, the flagging performance of exports to Japan and the EU in the second half was also partly attributable to the notable depreciation of the euro and the Japanese yen against the US dollar, which dampened import demand in these two markets. 3.5 The performance of the other markets was also mixed in 2014. Exports to such emerging markets as Brazil and Russia declined, reflecting the notable slowdown of their economies. On the other hand, the Asian markets as a whole expanded mildly further in 2014 in overall terms. Yet, the performance within the region also showed considerable divergence. Exports to the Mainland grew slightly by 0.5% in real terms, partly reflecting the growth slowdown of industrial activity there, and the growth of higher-income Asian markets, including Korea, Taiwan and Singapore, was also modest, ranging from 0.1% to 2.4%. On the other hand, exports to some ASEAN economies picked up to notable growth, led by exports of raw materials and semi-manufactures and capital goods in the second half, conceivably upon inventory replenishment after a period of weak trade flows. Exports to India, our fifth largest market after Japan (counting the EU as one single entity), also saw phenomenal growth, mirroring the strengthening of economic sentiment following India’s national election in April.

53
-50
-40
-30
-20
-10
0
10
20
30
40
Q12009
Q12010
Q12011
Q12012
Q12013
Q12014
-25
-20
-15
-10
-5
0
5
10
15
20Year-on-year rate of change (%)
HK$ / Euro(RHS) Hong Kong's
total exports to EU (RHS)
Year-on-year rate of change (%)
-25
-20
-15
-10
-5
0
5
10
15
20
25
30
35
Q12009
Q12010
Q12011
Q12012
Q12013
Q12014
-50
-40
-30
-20
-10
0
10
20
30
40
50
60
70
Hong Kong's total exports to Mainland
of China (RHS)
Year-on-year rate of change (%)
Mainland of China'simport demand
(LHS)
HK$ / RMB (RHS)
Year-on-year rate of change (%)
Diagram 3.4 : Exports to the Mainland rose only modestly in 2014, being affected by slower
industrial activity growth there
EU's import demand(LHS)
Diagram 3.5 : Exports to the EU slowed successively over the course of 2014
Q12009
Q12010
Q12011
Q12012
Q12013
Q12014
-30
-25
-20
-15
-10
-5
0
5
10
15
20
25 Year-on-year rate of change (%)
Hong Kong'stotal exports
to US
US' import demand
Q12009
Q12010
Q12011
Q12012
Q12013
Q12014
-25
-20
-15
-10
-5
0
5
10
15
20
25
30 Year-on-year rate of change (%)
Hong Kong'stotal exports
to Japan
HK$ / Yen
Diagram 3.7 : Exports to Japan faltered further in 2014
Japan'simport demand
Diagram 3.6 : Exports to the US strengthened up during 2014

54
Q12009
Q12010
Q12011
Q12012
Q12013
Q12014
-60
-40
-20
0
20
40
60
80
HK$ / INR
Hong Kong'stotal exports to
India
India'simport demand
Year-on-year rate of change (%)
Q12009
Q12010
Q12011
Q12012
Q12013
Q12014
-40
-30
-20
-10
0
10
20
30
40
50
60
70Year-on-year rate of change (%)
Hong Kong'stotal exports to
Taiwan
Taiwan'simport demand
Diagram 3.8 : Exports to India posted appreciable growth in 2014
Diagram 3.9 : Exports to Taiwan saw some improvement after a weak start
HK$ / NT$
Q12009
Q12010
Q12011
Q12012
Q12013
Q12014
-40
-30
-20
-10
0
10
20
30
40 Year-on-year rate of change (%)Hong Kong's
total exports to Korea
Korea's importdemand
Diagram 3.10 : Exports to Korea weakened considerably towards the year-end
HK$ / Won
Q12009
Q12010
Q12011
Q12012
Q12013
Q12014
-40
-30
-20
-10
0
10
20
30 Year-on-year rate of change (%)
HK$ / S$
Hong Kong'stotal exports to
Singapore
Singapore'simport demand
Diagram 3.11 : Exports to Singapore grew only modestly
55
Imports of goods 3.6 Imports of goods rose moderately by 2.8% in real terms in 2014, slightly down from the 3.9% increase in 2013, as a result of the slower increases in both retained imports and import intake related to re-exports. Retained imports, which accounted for over one-quarter of total imports, grew by 4.6% in real terms in 2014, lower than the 6.3% increase in the preceding year. Analysed by end-use category, the deceleration in retained imports in 2014 was mainly driven by the notable declines in capital goods, reflecting the subdued investment expenditure during most of the year. Retained imports of fuels also fell, partly due to the weak demand from cargo transportation. On the other hand, retained imports of consumer goods and foodstuffs attained solid growth, as local consumption expanded further, though inventory replenishment might also have helped. Retained imports of raw materials and semi-manufactures reversed three consecutive years of declines and reported a notable gain.
Table 3.3 : Imports of goods and retained imports (year-on-year rate of change (%))
Imports of goods
Retained imports(a)
In value terms
In real terms
Change in prices
In value terms
In real terms
Change in prices
2013 Annual
3.8 3.9 0.9 4.5 6.3 0.6
Q1 4.9 5.0 (-0.5) 1.1 8.1 7.1 (0.7) 3.7 Q2 3.5 4.2 (-0.3) 0.2 6.6 8.1 (1.4) 0.4 Q3 2.6 2.8 (1.5) 0.6 0.8 4.4 (0.4) -1.2 Q4
4.3 4.0 (3.1) 1.5 3.4 5.9 (2.8) *
2014 Annual
3.9 2.8 1.9 5.8 4.6 1.7
Q1 2.1 1.1 (-2.7) 2.1 5.8 4.8 (0.9) 3.1 Q2 4.5 3.7 (2.4) 2.0 3.7 2.6 (-1.1) 2.4 Q3 5.7 4.1 (1.9) 2.4 5.0 2.3 (0.3) 2.7 Q4 3.2 2.2 (-0.3) 1.3 8.4 8.7 (7.2) -1.0 Notes : (a) Based on the results of the Annual Survey of Re-export Trade conducted by the
Census and Statistics Department, re-export margins by individual end-use category are estimated and adopted for deriving the value of imports retained for use in Hong Kong.
( ) Seasonally adjusted quarter-to-quarter rate of change.
(*) Change of less than 0.05%.

56
Q12009
Q12010
Q12011
Q12012
Q12013
Q12014
-30
-20
-10
0
10
20
30
40
50
60 Percent
Retainedimports
Importsof goods
(a) Year-on-year rate of changein real terms
Q12009
Q12010
Q12011
Q12012
Q12013
Q12014
-20
-15
-10
-5
0
5
10
15
20
25
30 Percent
(b) Seasonally adjusted quarter-to-quarterrate of change in real terms
Retainedimports
Importsof goods
Diagram 3.12 : Both imports and retained imports grew moderately in 2014
Table 3.4 : Retained imports by end-use category (year-on-year rate of change in real terms (%))
Consumer goods
Foodstuffs
Capital goods
Raw materials and
semi-manufactures
Fuels
2013 Annual
2.9 9.3 22.3 -3.3 0.2
Q1 4.7 12.0 -3.1 12.3 7.6 Q2 1.3 1.3 38.7 -0.8 -5.4 Q3 9.5 12.1 16.8 -9.1 -5.9 Q4
-3.0 11.6 32.7 -13.1 5.2
2014 Annual
8.4 5.4 -6.5 13.3 -6.2
Q1 4.0 1.9 6.1 9.7 -8.5 Q2 7.9 12.8 -11.5 6.5 -2.3 Q3 9.9 6.3 -16.0 11.9 -8.1 Q4 11.7 2.0 -1.4 27.2 -5.7
57
Services trade Exports of services
3.7 Exports of services registered only modest growth, at a mere 0.5% in real terms in 2014, visibly down from the 4.9% growth in 2013. The main drag was the distinct slackening of exports of travel services, as visitor spending on luxury items fell off amid a high base of comparison. With waning base effects and support brought by the sustained double-digit growth in visitor arrivals, the decline in exports of travel services narrowed somewhat in the second half and lessened its drag on overall exports of services. The performance of other services exports was also mediocre in 2014. Exports of trade-related services (comprising mainly offshore trade activities) grew modestly during most of 2014 amid tepid regional trade flows. Deterred by continued uncertainties in the global economy, exports of financial and other business services attained only mild growth. Transportation services fared slightly better, reversing the declines in the past two years and resumed a modest growth, thanks largely to the vibrant passenger flows which offset the weakness in cargo throughput.
Financial andbusiness services
$237.1 billion(22.0%)
Travel services$297.6 billion
(27.6%)
Q12009
Q12010
Q12011
Q12012
Q12013
Q12014
-10
-5
0
5
10
15
20Percent
Diagram 3.14 : Exports of servicesattained modest growth in 2014
Diagram 3.13 : Major service groups accounted for similar shares of Hong Kong's services
exports, reflecting a diversified base
Exports of services in 2014:$1,076.9 billion
Transportationservices
$245.6 billion(22.8%)
Seasonally adjustedquarter-to-quarter
rate of change in real terms
Trade-relatedservices
$296.6 billion(27.5%)
Year-on-yearrate of changein real terms

58
Table 3.5 : Exports of services by major service group (year-on-year rate of change in real terms (%))
Exports
of services
Of which :
Trade-related services(a)
Transportation services
Travel services(b)
Financial and
business services
2013 Annual
4.9 0.7 -1.9 18.2 2.2
Q1 3.9 (0.8) 2.2 -4.5 19.0 -1.3 Q2 6.8 (3.9) 1.3 -4.3 28.8 2.2 Q3 4.3 (-2.9) -0.2 -0.2 15.9 2.7 Q4
4.5 (2.4) *. 1.7 11.3 5.7
2014 Annual
0.5 1.3 2.5 -2.6 1.4
Q1 3.5 (0.2) -0.2 1.4 9.9 1.8 Q2 -1.9 (-1.6) 1.5 3.7 -10.7 0.2 Q3 0.9 (0.2) 2.7 2.6 -4.6 4.0 Q4 -0.7 (0.6) 0.8 2.0 -4.1 -0.6
Notes : (a) Comprising mainly offshore trade. (b) Comprising mainly inbound tourism receipts. ( ) Seasonally adjusted quarter-to-quarter rate of change. (*) Change of less than 0.05%.
Imports of services
3.8 Imports of services grew by 1.9% in real terms in 2014, further to a 1.8% growth in 2013. Imports of travel services outpaced other major services imports and grew moderately, underpinned largely by the avid interest of local residents to travel abroad for recreation and other purposes amid stable labour market conditions. The weakening of major currencies against the US dollar also raised the appetite for overseas travel. Imports of transportation services and trade-related services grew only mildly in 2014, broadly in line with the sluggish trading environment. Meanwhile, imports of financial and other business services also grew modestly in 2014.

59
Trade-relatedservices
$33.8 billion(7.0%)
Diagram 3.15 : Travel services had the largest share in imports of services
Q12009
Q12010
Q12011
Q12012
Q12013
Q12014
-15
-10
-5
0
5
10
15
20 Percent
Diagram 3.16 : Imports of services grew modestly in 2014
Year-on-yearrate of changein real terms
Imports of services in 2014:$481.2 billion
Seasonally adjustedquarter-to-quarter
rate of change in real terms
Financial andbusiness services
$132.8 billion(27.6%)
Travel services$171.5 billion
(35.6%)
Transportationservices
$143.0 billion(29.7%)
Table 3.6 : Imports of services by major service group (year-on-year rate of change in real terms (%))
Of which :
Imports of services
Travel
services(+)
Transportation
services
Trade-related
services
Financial and business services
2013 Annual
1.8 6.3 -2.8 -3.6 3.1
Q1 0.2 (1.1) 5.8 -7.0 -0.4 1.3 Q2 -0.8 (-1.3) 1.1 -5.6 -3.7 4.1 Q3 2.2 (2.0) 5.5 -0.8 -4.9 3.8 Q4
5.6 (3.3) 12.6 2.6 -4.7 3.3
2014 Annual
1.9 3.8 0.3 1.1 1.4
Q1 -0.5 (-4.4) -2.8 -0.7 0.8 2.1 Q2 4.9 (4.2) 10.7 1.9 2.5 1.1 Q3 2.1 (-0.7) 4.2 0.4 1.7 1.2 Q4 1.3 (2.3) 3.5 -0.7 -0.2 1.0 Notes : (+) Comprising mainly outbound travel spending. ( ) Seasonally adjusted quarter-to-quarter rate of change.

60
Goods and services balance 3.9 Given the sluggish merchandise export performance and the steady expansion of import demand, goods deficit widened slightly in 2014 while services surplus also increased marginally. As a result, the combined goods and services account was largely in balance in 2014, showing a small surplus of $3 billion (equivalent to 0.1% of the total value of imports of goods and services). The respective figures for 2013 were $13 billion and 0.3%.
Table 3.7 : Goods and services balance
($ billion at current market prices)
Total exports Imports Trade balance
Goods Services
Goods
Services
Goods
Services
Combined
As % of imports
2013
Annual 3,816 1,058 4,395 467 -579 591 13 0.3
Q1 872 254 1,024 114 -152 140 -12 -1.1 Q2 929 247 1,100 107 -171 139 -32 -2.6 Q3 1,000 271 1,117 118 -117 153 36 2.9 Q4
1,015 286 1,153 128 -138 159 21 1.6
2014 Annual 3,879 1,077 4,472 481 -593 596 3 0.1 Q1 871 266 1,029 114 -158 151 -7 -0.6 Q2 950 245 1,111 116 -162 129 -32 -2.6 Q3 1,027 279 1,148 124 -121 155 34 2.6 Q4 1,031 288 1,183 127 -152 160 8 0.6
Note : Figures may not add up exactly to the total due to rounding. Other developments 3.10 Economic collaborations between Hong Kong and the Mainland made further progress in 2014. At the Tenth Pan-Pearl River Delta (PPRD) Regional Co-operation and Development Forum and Trade Fair in October, the “Joint Declaration on Deepening PPRD Regional Co-operation (2015 - 2025)” was signed, which put forward a blueprint for strengthening PPRD regional co-operation in the coming decade. In December, the Agreement between the Mainland and Hong Kong on Achieving Basic Liberalisation of Trade in Services in Guangdong (the Agreement) was signed, to be implemented on 1 March 2015. This is a subsidiary agreement concluded under the framework of the Mainland and Hong Kong Closer Economic Partnership Arrangement (CEPA). The Agreement achieves basic liberalisation of trade in services in Guangdong with Hong Kong, thereby bringing new opportunities to our service providers and enhancing the competitiveness of the services industries of the
61
two places. Besides, the Agreement also sets a model for basic liberalisation of trade in services in the Mainland by end-2015. 3.11 Apart from the Mainland, the Government also strives to reduce trade barriers in other markets, especially new and emerging markets. In this regard, the formal negotiations with the ASEAN for a Free Trade Agreement (FTA) as well as the negotiations with some other World Trade Organisation (WTO) Members for the Environmental Goods Agreement were commenced in July 2014, which would facilitate export trade and investment in related areas if agreements are reached. Separately, an FTA between Hong Kong and Chile took effect in October, expanding Hong Kong’s existing FTA network from the Asia-Pacific and European regions to the Americas. The FTA should help Hong Kong companies to explore new opportunities in the Chilean market, which is not only an emerging market with promising potentials in itself but also serves as a gateway to tap Central and South American markets. 3.12 Reflecting our staunch support for free trade, Hong Kong became the first WTO Member joining the Trade Facilitation Agreement (TFA) in December 2014. The TFA was a multilateral agreement concluded by the Ninth WTO Ministerial Conference in December 2013, which will come into force upon acceptance by two-thirds of the WTO Members. Its implementation would make cross-border trade easier, help reduce costs and improve efficiency for both business and governments. Separately, the Mutual Recognition Arrangement (MRA) between the Mainland and Hong Kong customs became operational for road cargoes in May, and MRAs with Singapore and Korea were also signed in June and August respectively, which provide accredited entities clearance facilitation for the goods traded. To facilitate cross-border investment flows, Hong Kong signed avoidance of double taxation agreements with Korea, South Africa and United Arab Emirates in 2014, bringing the total number of similar facilitative tax agreements to 32.

62
Notes : (1) Changes in merchandise exports and imports in real terms are derived by discounting
the effect of price changes from changes in the value of the trade aggregates. Estimates of price changes for the trade aggregates are based on changes in unit values, which do not take into account changes in the composition or quality of the goods traded, except for some selected commodities for which specific price indices are available. The real growth figures reported here are based on the constant price measures adopted for compiling the external trade quantum index numbers. They are not strictly comparable with the real trade aggregates under GDP (reported in Chapter 1) which are based on the chain volume measures using the preceding-year prices as weights for aggregating the components. In addition, non-monetary gold is recorded as a separate item in the statistics of merchandise trade and not included in the trade aggregates reported in Chapter 3, but is included in the trade aggregates under GDP in accordance to the international compilation standard.
(2) Re-exports are those goods which have previously been imported into Hong Kong and
are subsequently exported without having undergone in Hong Kong any manufacturing processes which change permanently the shape, nature, form or utility of the goods.

63
CHAPTER 4 : DEVELOPMENTS IN SELECTED SECTORS
Summary The residential property market was relatively soft in the first quarter of
2014, but has revived since April and stayed generally buoyant for the rest of the year. Tight demand-supply balance in the near term, coupled with the continued low interest rate environment, has rendered support to the market expectation that flat prices would remain firm, and saw many end-users rushing to buy in both the primary and secondary markets. Trading activities rebounded, while overall flat prices surged by a total of 13% during the year.
Raising flat supply through increasing land supply is the Government’s top
policy priority in facilitating the healthy development of the property market. Reflecting the Government’s sustained efforts, total flat supply in the coming three to four years rose to a record high of 74 000 units. The Government promulgated the new Long Term Housing Strategy in December 2014 to put forward a new strategic direction and lay down guiding principles for housing policies.
The commercial and industrial property markets have also turned more active since the second quarter. For the year as a whole, prices and rentals recorded moderate gains in general. Trading activities showed some pick-up from the lows in the first quarter, though they were still at subdued levels by historical standards.
Overall visitor arrivals registered a notable growth of 12.0% to 60.8 million in 2014, with Mainland visitors remaining the major impetus to growth. The performance of non-Mainland markets was generally tepid, with visitor arrivals registering a decline in the fourth quarter. Total visitor spending showed a modest decrease, conceivably due to a cut in spending on luxurious items like jewellery.
Amid the unstable external environment, the logistics sector was generally subdued. Total container throughput edged down by 0.3% to 22.3 million twenty-foot equivalent units in 2014. Air freight throughput fared slightly better.
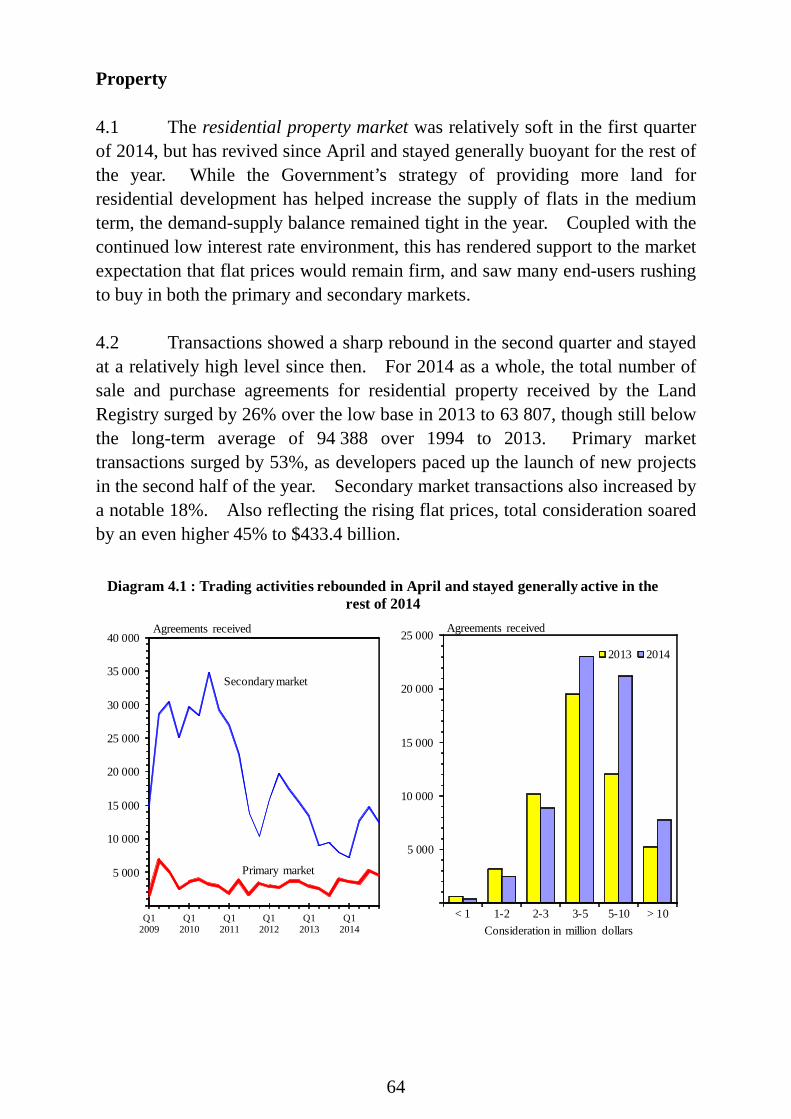
64
Property 4.1 The residential property market was relatively soft in the first quarter of 2014, but has revived since April and stayed generally buoyant for the rest of the year. While the Government’s strategy of providing more land for residential development has helped increase the supply of flats in the medium term, the demand-supply balance remained tight in the year. Coupled with the continued low interest rate environment, this has rendered support to the market expectation that flat prices would remain firm, and saw many end-users rushing to buy in both the primary and secondary markets. 4.2 Transactions showed a sharp rebound in the second quarter and stayed at a relatively high level since then. For 2014 as a whole, the total number of sale and purchase agreements for residential property received by the Land Registry surged by 26% over the low base in 2013 to 63 807, though still below the long-term average of 94 388 over 1994 to 2013. Primary market transactions surged by 53%, as developers paced up the launch of new projects in the second half of the year. Secondary market transactions also increased by a notable 18%. Also reflecting the rising flat prices, total consideration soared by an even higher 45% to $433.4 billion.
5 000
10 000
15 000
20 000
25 000
< 1 1-2 2-3 3-5 5-10 > 10
2013 2014
Agreements received
Primary market
Consideration in million dollarsQ1
2009Q1
2010Q1
2011Q1
2012Q1
2013Q1
2014
5 000
10 000
15 000
20 000
25 000
30 000
35 000
40 000Agreements received
Secondary market
Primary market
Diagram 4.1 : Trading activities rebounded in April and stayed generally active in the rest of 2014

65
4.3 In tandem with the rebound in trading activities, flat prices have also reverted from a modest decline in the first quarter to sustained increases since the second quarter. Comparing December 2014 with a year earlier, overall flat prices surged by 13%, with most of the gains occurring during the second half. The increase was led by small/medium-sized flats, the prices of which soared by 14%. By comparison, prices of large flats went up by a less rapid 6%. In the primary market, while most developers continued to adopt a relatively conservative pricing strategy in launching new projects, the concessions and discounts offered gradually narrowed through the year along with the improving market sentiment. 4.4 The leasing market has also revived since the second quarter. Overall flat rentals in December rose by 6% over a year earlier. Analysed by size, rentals of small/medium-sized and large flats increased by 7% and 2% respectively. Reflecting the relative movements of flat prices and rentals, the average rental yield for residential property edged down further from 2.8% a year earlier to a record low of 2.7% in December 2014.
2009 2010 2011 2012 2013 201450
60
70
80
90
100
110
120
130
140
150
160 Large flats All flats Small/medium-sized flats
Index (Oct 1997=100)(b) Rentals
Introduction of SSD
Introduction ofBSD
Introduction of DSD
2009 2010 2011 2012 2013 201450
60
70
80
90
100
110
120
130
140
150
160
170 Large flats All flats Small/medium-sized flats
Index (Oct 1997=100)(a) Prices
Introduction of Special Stamp Duty
(SSD)
Introduction of Buyer's Stamp Duty
(BSD)
Introduction of Double Stamp Duty (DSD)
Diagram 4.2 : Flat prices and rentals reverted to sustained increases after a modest decline in the first quarter
Note : Residential property price index pertains to secondary market transactions only. Large flats refer to those with a saleable area of atleast 100 m2, and small/medium-sized flats with a saleable area of less than 100 m2.
4.5 Raising flat supply through increasing land supply is the Government’s top policy priority in facilitating the healthy development of the property market. Combining the various sources (including Government land sale, railway property development projects, the Urban Renewal Authority’s projects and private re-development/development projects), the aggregate private housing land supply in the financial year 2014/15 is estimated to have a
66
capacity of providing about 20 000 flats, exceeding the annual target of making available private housing land for 18 800 flats. This is a record high since the Government introduced the private housing land supply target in 2010. Reflecting the Government’s sustained efforts, the total supply of flats in the coming few years (comprising unsold flats of completed projects, flats under construction but not yet sold and flats on disposed sites where construction can start any time) rose from 71 000 units as estimated at end-2013 to a record high of 74 000 units as estimated at end-2014. In addition, another 15 000 units could be added to the total supply after the conversion of a number of residential sites into “disposed sites” and the completion of tendering of some sites in the months ahead. 4.6 Yet the demand-supply balance remained tight in the year. Gross completions of private residential flats jumped by 90% to 15 700 units in 2014. After netting out demolition, the net completions of 13 200 was much lower than the take-up of 16 500 units(1), and the vacancy rate thus fell further from 4.1% at end-2013 to 3.8% at end-2014, well below the long-term average of 5.0% over 1994-2013. For 2015 and 2016, the Rating and Valuation Department forecasted completions at 13 000 units and 20 000 units respectively(2), compared with the annual average of 19 600 units per annum over 1994-2013. 4.7 As it takes time to increase supply, the Government has put in significant efforts to manage demand and reduce the possible risks to financial stability arising from an exuberant property market(3). These measures have yielded notable results. On speculative activities, the number of short-term resale (comprising confirmor transactions and resale within 24 months after assignment) declined further to an average of 78 cases per month or 1.3 % of total transactions in 2014, well below the monthly average of 2 661 cases or 20.0% in January to November 2010 (i.e. the period before the introduction of the Special Stamp Duty). Reflecting the effects of the Buyer’s Stamp Duty, purchases by non-local individuals and non-local companies stayed low at an average of 107 cases per month or 1.8% of total transactions in 2014, much lower than the monthly average of 365 cases or 4.5% in January to October 2012. As to mortgage lending, the average loan-to-value ratio of new mortgages was 55% in 2014, below the average of 64% in January to October 2009 before the first round of macro-prudential measures for residential property mortgage lending was introduced by the Hong Kong Monetary Authority.
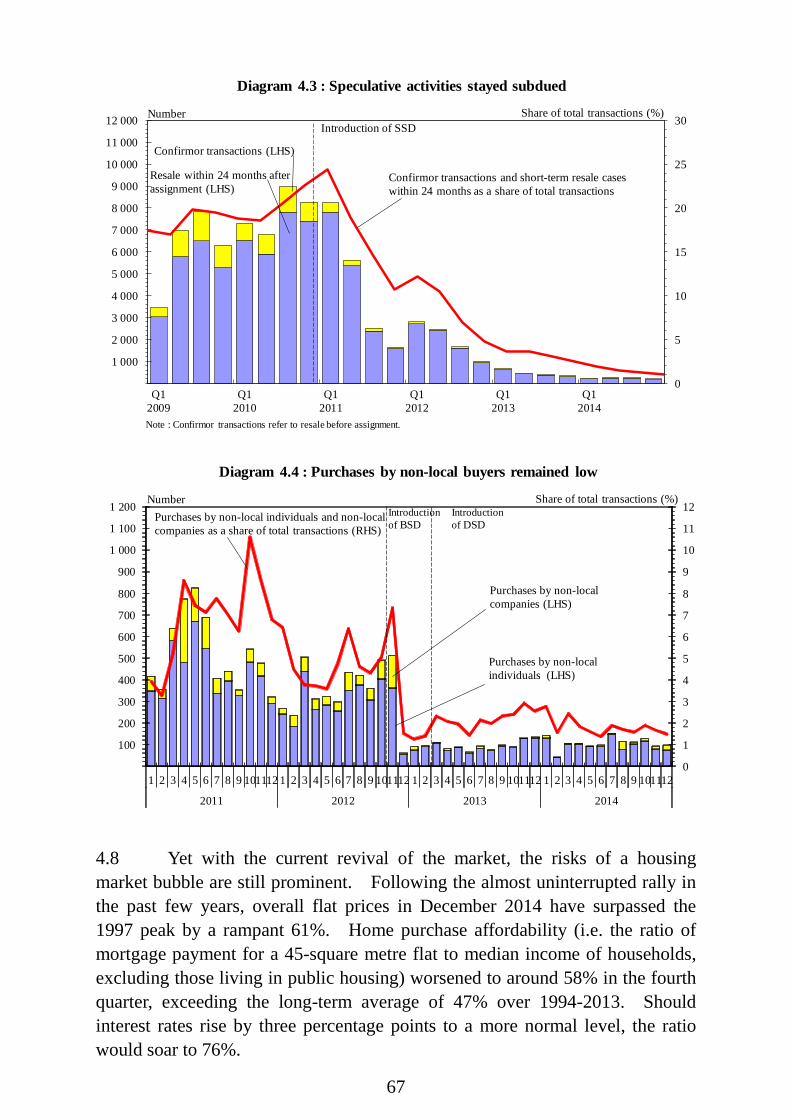
67
0
5
10
15
20
25
30
1 000
2 000
3 000
4 000
5 000
6 000
7 000
8 000
9 000
10 000
11 000
12 000
Q12009
Q12010
Q12011
Q12012
Q12013
Q12014
Number
Diagram 4.3 : Speculative activities stayed subdued
Share of total transactions (%)
Resale within 24 months after assignment (LHS)
Confirmor transactions (LHS)
Confirmor transactions and short-term resale cases within 24 months as a share of total transactions
Introduction of SSD
Note : Confirmor transactions refer to resale before assignment.
0
1
2
3
4
5
6
7
8
9
10
11
12
100
200
300
400
500
600
700
800
900
1 000
1 100
1 200
1 2 3 4 5 6 7 8 9 101112 1 2 3 4 5 6 7 8 9 101112 1 2 3 4 5 6 7 8 9 101112 1 2 3 4 5 6 7 8 9 101112
2011 2012 2013 2014
Purchases by non-local individuals and non-localcompanies as a share of total transactions (RHS)
Purchases by non-local individuals (LHS)
Purchases by non-local companies (LHS)
Number Share of total transactions (%)
Diagram 4.4 : Purchases by non-local buyers remained low
Introductionof BSD
Introduction of DSD
4.8 Yet with the current revival of the market, the risks of a housing market bubble are still prominent. Following the almost uninterrupted rally in the past few years, overall flat prices in December 2014 have surpassed the 1997 peak by a rampant 61%. Home purchase affordability (i.e. the ratio of mortgage payment for a 45-square metre flat to median income of households, excluding those living in public housing) worsened to around 58% in the fourth quarter, exceeding the long-term average of 47% over 1994-2013. Should interest rates rise by three percentage points to a more normal level, the ratio would soar to 76%.

68
94 95 96 97 98 99 00 01 02 03 04 05 06 07 08 09 10 11 12 13 140
10
20
30
40
50
60
70
80
90
100Repayment-income ratio ̂(%)
Diagram 4.5 : The mortgage payment to income ratio rose further
93
1994-2013 average
58
Note : (^) The ratio of mortgage payment for a 45m2 flat (assuming 70% loan-to-value ratio and tenor of 20 years) to median income of households (excluding those living in public housing).
4.9 Looking forward, while the US Federal Reserve has concluded its asset purchase programme in October 2014, the timing and pace of the interest rate hike remain uncertain and would largely hinge on upcoming economic data. Meanwhile, the central banks of the eurozone and Japan have rolled out further monetary easing measures in view of the subdued economic growth with increasing deflationary pressure. With increasingly divergent monetary policy stance among the major central banks, there are potential risks of even greater global financial volatilities and abrupt changes in the direction of fund flows. Also, monetary policy making worldwide has been further complicated by the recent oil price slump. As a result, the property market may experience considerable fluctuations as sentiment, interest rate expectation and international fund flow shift along with developments of the various factors. 4.10 The Government promulgated the new LTHS in December 2014 to put forward a new strategic direction and lay down guiding principles for housing policies. Guided by the vision of helping all households in Hong Kong to gain access to adequate and affordable housing, the Government has adopted a supply-led strategy and set the long term housing supply target at 480 000 units for the ten-year period from 2015-16 to 2024-25, with the public-private split of 60:40. The housing supply target will be reviewed every year to take account of changes in circumstances (Box 4.1).
69
Box 4.1
The Long Term Housing Strategy
Recognising that housing is the most critical of all livelihood issues in Hong Kong, the Government is determined to address the housing problems with the help of a new Long Term Housing Strategy (LTHS). In September 2012, the Government appointed the LTHS Steering Committee to advise the Government on the formulation of a new LTHS. The Steering Committee subsequently consulted the public for three months from September to December 2013. Based on the recommendations made by the Steering Committee and the public views collected, the Government promulgated the new LTHS in December 2014, as summarised below.
(I) Vision and principles The vision of the LTHS is to help all households in Hong Kong gain access to adequate and affordable housing. On this premise, it seeks to achieve changes progressively in accordance with the principles of “supply-led” and “flexible” : On “supply-led”, as it takes years to prepare land and build housing units on it, the
Government would anticipate demand and plan for land supply. The Government would also, based on objective projections of long term demand, systematically plan for public housing construction and make land available for private housing development.
On “flexible”, learning lessons from the experience of the upheavals in the property market after the 1998 LTHS and the impact of the marked changes in policies subsequently, forward plans and construction programmes should be adjusted regularly, on the basis of regular reviews of the long term demand projections that reflect changes in circumstances.
(II) Strategies
The LTHS sets out the following strategies :
(1) Plan early for land supply for production of both public and private housing, with the assistance of a new housing demand projection model. The Government has adopted the methodology recommended by the LTHS Steering
Committee to project long term housing demand. The methodology takes into account the projected net increase in the number of households, those who will be displaced by redevelopment, those who are inadequately housed, and other miscellaneous factors to project the number of new housing units required over a period of ten years.
(2) Update the projection of long term housing demand and work out a rolling ten-year
housing supply target every year. In December 2014, the Government updated the projection of long term housing
demand for the 10-year period from 2015-16 to 2024-25. Based on this, the long term housing supply target is now set at 480 000 units, with the public-private split of 60:40. Accordingly, the public housing supply target will be 290 000 units, comprising 200 000 public rental housing (PRH) units and 90 000 subsidised sale flats, whereas the private housing supply target will be 190 000 units.
(3) Provide PRH units to serve as a “safety net” for the grassroots who cannot afford
private rental housing. Maintain the target of providing first flat offer to general applicants (i.e. family and
elderly one-person applicants) at about three years on average.

70
Box 4.1 (Cont’d) Allocate PRH flats in a fair and rational manner while ensuring the rational use of
PRH resources.
(4) Provide Home Ownership Scheme (HOS) flats and other forms of subsidised sale flats to enable the lower to middle-income households to meet their home ownership aspirations. Introduce supplementary schemes of subsidised sale flats where appropriate. Leverage the private sector’s capacity to supplement the Government’s efforts in
providing subsidised sale flats. Facilitate circulation by allowing more people to have access to subsidised sale flats,
either with or without premium paid.
(5) Maintain the healthy and stable development of the private housing market through securing a stable supply of land and implementation of demand-side management measures as and when necessary. Adopt a multi-pronged strategy comprising short, medium and long term measures
to continually expand land resources through optimal use of developed land and the development of new land and new towns.
Enhance efficiency in land and housing supply through streamlining the procedures and enhancing the land administration mechanism.
Consider adjusting existing demand-side management measures or putting in place new measures as and when necessary with reference to a series of indicators and changes in the local and global economic situations.
The new LTHS is a major milestone in Hong Kong’s housing policy. Going forward, the Government will review the long term housing demand projection and the rolling ten-year housing supply target on an annual basis, and announce the results by the end of each financial year. The Government will also strive to secure the required land, manpower, and financial resources to achieve the projected supply target with the support of the community.
71
4.11 In the 2015 Policy Address, the Chief Executive announced various initiatives on housing, and land planning and development. To further improve the housing ladder, as a pilot scheme the Government will identify suitable public rental housing flats under construction for sale to Green Form applicants at prices lower than those of Home Ownership Scheme (HOS) flats. In addition, it will vigorously explore ways to further leverage the private sector’s capacity to assist in increasing and accelerating the supply of subsidised sale flats. As to long term land planning and development, the Government will take forward various projects, such as the Kwu Tung North and Fanling North New Development Areas (NDAs). It would also undertake planning and engineering or feasibilities studies, including Hung Shui Kiu NDA, Lung Kwu Tan reclamation at Tuen Mun, underground space development, and the New Territories North. 4.12 Likewise, the commercial and industrial property markets have also turned more active since the second quarter. For the year as a whole, prices and rentals recorded moderate gains in general. Trading activities showed some pick-up from the lows in the first quarter, though they were still at subdued levels by historical standards. 4.13 Sale prices of retail shop space rose by 8% between December 2013 and December 2014, while rentals increased by a modest 4%. Yet the average rental yield stayed at 2.4% in December 2014, little changed from a year earlier. Notwithstanding the rebound starting the second quarter, for 2014 as a whole transactions for retail shop space still fell by 28% to 3 100 cases(4). As to demand-supply balance, the take-up of 15 500 m2 for retail shop space in 2014 was much lower than the completion of 57 100 m2. Yet after netting out demolition, the vacancy rate only edged up from 7.2% at end-2013 to 7.3% at end-2014, still much below the long-term average of 8.7% over 1994-2013. 4.14 Overall prices for office space recorded a moderate gain of 4% between December 2013 and December 2014. Within the total, prices of Grade A, B and C office space went up by 1%, 4% and 1% respectively. Overall office rentals likewise rose by 4%, with those of Grade A, B and C office space increasing by 3%, 5% and 8% respectively. Reflecting the relative movements of prices and rentals, the average rental yields for Grade A and B office space, at 2.9% in December 2014, were little changed from a year earlier, while that for Grade C office space edged up from 2.8% to 2.9%. Meanwhile, transactions fell by 25% against a high base of comparison to 1 300 cases in 2014. In 2014, the take-up and completion of office space were 153 400 m2 and 103 600 m2 respectively. The vacancy rate thus declined from 7.0% at end-2013 to 6.3% at end-2014, well below the long-term average of 10.2% over

72
1994-2013. 4.15 Sale prices and rentals of flatted factory space rose by 6% and 8% respectively between December 2013 and December 2014. As a result, the average rental yield edged up from 2.8% to 2.9% over the period. While trading activities rebounded in the second quarter and remained generally steady thereafter, for 2014 as a whole transactions still shrank by 30% to 3 000 cases. As to demand-supply balance, there was a negative take-up of 13 300 m2 for flatted factory space in 2014 and a completion of 35 600 m2. Yet after taking into account demolition, the vacancy rate declined from 5.8% at end-2013 to 5.6% at end-2014, sharply below the long-term average of 8.2% over 1994-2013.
2009 2010 2011 2012 2013 2014100
150
200
250
300
350
400
450
500
550
600
650
700Office spaceRetail shop spaceFlatted factory space
Index (1999=100)(a) Prices
Introductionof DSD
2009 2010 2011 2012 2013 201480
100
120
140
160
180
200
220Office spaceRetail shop spaceFlatted factory space
Index (1999=100)(b) Rentals
Introductionof DSD
Diagram 4.6 : Prices and rentals of non-residential properties recorded moderate gains

73
2 000
4 000
6 000
8 000
10 000
Office space Commercial space Flatted factory space
201220132014
Number
Diagram 4.7 : Transactions for commercial and industrial properties were still at subdued levels by historical standards
Land 4.16 Thirty eight sites with a total area of about 36.9 hectares were disposed in 2014, fetching a land premium of about $51.7 billion. Among these sites, there were 28 residential sites, one residential and commercial/hotel site, one commercial/office site, one commercial/office/hotel site, one commercial site, one hotel site, and five sites for other uses. The tender exercises for four residential sites in Sha Tin, Kwai Chung, Beacon Hill and Tuen Mun, one business site in Kwai Chung, one commercial/office site in Kwun Tong, and one industrial site in Kwai Chung also commenced towards the end of the year. 4.17 Regarding exchange of land, seven sites with a total area of about 1.5 hectares were approved in 2014, of which three were residential sites. As to lease modifications, a total of 91 sites were approved. Tourism 4.18 Overall visitor arrivals registered a notable growth of 12.0% to 60.8 million in 2014, though this already represented a visible deceleration from the surge over the past few years. However, preliminary indicators suggested that visitor spending showed a modest decrease, conceivably due to a cut in spending on luxurious items like jewellery. Analysed by major market,

74
Mainland visitors continued to be the main impetus to growth, surging by 16.0% to 47.2 million and accounting for 77.7% of the total. By comparison, the performance of other markets was tepid. Dragged by a decline in the fourth quarter, visitors from short-haul markets only went up by 0.7% in 2014 while those from long-haul markets even edged down by 0.5%(5).
0
5
10
15
20
25
30
35
40
45
50
55
60
65
All markets Mainland Short-haul markets Long-haul markets
201220132014
Number of trips (Mn)
Diagram 4.8 : Mainland market remained the growth driver of inbound tourism
Note : See note (5) at the end of this chapter for the definition of short-haul and long-haul markets.
4.19 Analysed by the length of stay, same-day visitor arrivals grew by a notable 15.5% and overnight visitor arrivals by a less rapid 8.2%. As growth in same-day visitors continued to outpace that of overnight visitors, the share of same-day visitors rose further from 52.7% in 2013 to 54.4% in 2014, while that of overnight visitors declined from 47.3% to 45.6%.
75
Q12009
Q12010
Q12011
Q12012
Q12013
Q12014
-15
-10
-5
0
5
10
15
20
25
30
35 Overnight visitors
Same-day visitors
Year-on-year rate of change (%)
Diagram 4.9 : Growth in same-day vistiors continued to outpace that in overnight visitors
4.20 The average hotel room occupancy rate remained high at 90% in 2014. The average achieved hotel room rate rose by a modest 1.8% to $1,473(6). Logistics 4.21 Amid the unstable external environment, the logistics sector was generally subdued. Total container throughput edged down by 0.3% to 22.3 million twenty-foot equivalent units (TEUs) in 2014. Within the laden container throughput, transhipment declined by 1.8% while direct shipment rose by 1.9%. Meanwhile, the value of trade handled at the Hong Kong port edged down by 0.7%, and its share in total trade shrank further from 23.1% in 2013 to 22.2% in 2014.

76
0
5
10
15
20
25
30
2010 2011 2012 2013 2014
River vessels Ocean vessels
(a) Total container throughputby mode of transport
0
5
10
15
20
25
30
2010 2011 2012 2013 2014
Transhipment Direct shipment
(b) Laden container throughputby mode of shipment
Diagram 4.10 : Container throughput recorded marginal decline
TEUs (Mn)TEUs (Mn)
* *
Note : (*) Total container throughput for 2014 is the preliminary estimate by Hong Kong Port Development Council. Its breakdown by mode of transport and the laden container throughput by mode of shipment are crudely estimated from the profile in the first ten months of 2014.
4.22 Air freight throughput fared slightly better, registering an accelerated growth of 6.0% to 4.4 million tonnes in 2014. In parallel, the value of trade by air increased by 7.3%, and its share in total trade rose from 37.4% to 38.8%.
0
400
800
1,200
1,600
2,000
2,400
2,800
3,200
3,600
2010 2011 2012 2013 2014
(b) Value of trade handled by air*
0
800
1 600
2 400
3 200
4 000
4 800
2010 2011 2012 2013 2014
(a) Air cargo volume
Diagram 4.11 : Air cargo throughput and value of trade handled by air rose further
Tonne ('000) $Bn
Note : (*) Not including transhipment. 4.23 In December 2014 the Government released the findings of the Study on the Strategic Development Plan for Hong Kong Port 2030 and the Preliminary Feasibility Study (PFS) for Container Terminal 10 (CT10) at Southwest Tsing Yi. The study findings project that container throughput
77
would continue to grow in the coming years, and in order to cope with the projected growth, the handling capacity of the existing container terminals and related infrastructural facilities need to be enhanced. In light of these findings, the Government would continue to work with the trade and follow up on the various enhancement measures for improving the existing container terminals and port facilities in a pragmatic and progressive manner. Transport 4.24 Traffic flows for most major modes of transport grew further in 2014. Air passenger traffic increased by another 5.8% to 63.4 million, and water-borne passenger trips by 2.1% to 28.4 million. As for land-based cross-boundary traffic, passenger trips rose by 4.9% to 219.0 million, while average daily vehicle movements declined by 2.1% to 41 675 (Box 4.2). 4.25 The West Island Line of the Mass Transit Railway (MTR) commenced operation in December 2014. This 3-kilometre extension to the MTR Island Line comprises three new stations. The HKU and Kennedy Town stations have already been opened, and the Sai Ying Pun Station is expected to come into service in the first quarter of 2015. The extension would reduce travelling time for commuters and further strengthen the efficiency and connectivity of the public transport network of Hong Kong.

78
Box 4.2 Characteristics of cross-boundary trip makers
To provide a better understanding of the increasingly frequent cross-boundary travel activities, the Planning Department has been conducting regular surveys since 1999 to collect information on characteristics of cross-boundary trips and demographic profiles of trip makers. The latest survey, the eighth of the series and entitled Cross-boundary Travel Survey 2013/14 (the Survey), was conducted in the first quarter of 2014, and the report was released in December 2014. This article summarises the results of the Survey.
Reflecting the closer socio-economic ties and more frequent interaction between Hong Kong and the Mainland, cross-boundary passenger trips between the two places recorded a sharp increase over the past few decades. These trips reached a daily average of 604 900 in 2014(1), representing an increase of 8% over 2011 and a sharp 113% over 1999. Yet trips made by different types of trip maker recorded varied performance. Trips made by people living in Hong Kong declined by 8% from 2011 to 314 200 in 2014. Its share also shrank from 60.8% to 51.9% over the period, though it still accounted for the largest share of cross-boundary trips. On the other hand, trips made by Hong Kong residents living in the Mainland and visitors from the Mainland increased noticeably, by 16% to 82 400 and 43% to 195 800 respectively. In parallel, their respective shares rose further to 13.6% and 32.4%. Meanwhile, trips made by people living in places other than Hong Kong and the Mainland, which accounted for only 2.1% of the total, dropped by 6% to 12 400. The major purposes of these trips (e.g. leisure, work, business) are analysed in the ensuing paragraphs.
100 000
200 000
300 000
400 000
500 000
600 000
700 000
1999 2001 2003 2006 2007 2009 2011 2014
Average daily passenger trips
Chart 1: Average Daily Passenger Trips between Hong Kong and the Mainland by Passenger Type
Visitors from theMainland
People Living inOther Places
Hong KongResidents Livingin the MainlandPeople Living inHong Kong
Notes : Figures in brackets refer to the percentage share of average daily passenger trips between Hong Kong and the Mainland.Figures may not add up due to rounding.
382 800
448 100
490 900504 600
562 400
604 900
284 600
333 200
(51.9%)
(13.6%)
(32.4%)
(2.1%)
(60.8%)
(12.6%)
(24.3%)
(2.3%)
(67.9%)
(10.5%)
(18.7%)
(2.9%)
(71.2%)
(10.1%)
(15.6%)
(3.1%)
(73.5%)
(8.6%)
(14.6%)
(3.4%)
(78.2%)
(9.5%)
(10.2%)
(2.1%)
(82.7%)
(9.9%)
(5.3%)
(2.1%)
(84.3%)
(6.6%)
(4.1%)
(5.0%)
(1) Figures on cross-boundary passenger trips in this box article refer to the daily average in the two-week
survey period, unless otherwise specified. The survey was done in February-March 2014, while in previous years it was conducted in around November.
79
Box 4.2 (Cont’d)
People living in Hong Kong
Among the cross-boundary passenger trips made by people living in Hong Kong, leisure remained the most common purpose (42.0% of total) in 2014, though the absolute number of such trips continued to decline, by 21% from 2011. Conceivably, the decrease in price competitiveness amid the appreciation of Renminbi and the general increase in cost of living in the Pearl River Delta (especially Shenzhen) in the past few years has made the Mainland a relatively less attractive destination for Hong Kong tourists.
Meanwhile, trips for visiting relatives and friends accounted for 27.1% of cross-boundary passenger trips made by people living in Hong Kong. Business trips and trips for work took up another 18.6% and 7.1% respectively.
Hong Kong residents living in the Mainland
The Survey showed that “schooling” overtook “work” as the main purpose of cross-boundary passenger trips made by Hong Kong residents living in the Mainland. Such trips jumped by 67% over 2011 to 28 600 in 2014, and their share in the total soared from 24.3% to 34.8%. In parallel, the number of frequent trip-makers (i.e. usually travelled to Hong Kong at least once a week) that were students soared by 60% over the period. These coincided with the surge in the number of babies born to Mainland women in Hong Kong in the earlier years, some of whom have come back to Hong Kong for education. On the other hand, the share of trips for the purpose of work shrank to 26.3%. Trips for the purpose of leisure, visiting relatives and friends, and business accounted for 14.7%, 10.6% and 5.4% respectively.
Mainland visitors
Underpinned by the Individual Visit Scheme (IVS), leisure continued to be the dominant purpose of cross-boundary passenger trips made by Mainland visitors. The number of leisure trips jumped by another 42% over 2011 to 134 600 in 2014, equivalent to 68.7% of the total. The remaining Mainland visitor trips were for visiting friends and relatives (15.4% of the total), business (9.0%), transit (1.6%) and work (1.0%). Facilitated by the one-year multiple-entry IVS, the number of frequent leisure trip-makers from the Mainland jumped by 97% over 2011 to 121 700 persons. Within these frequent trip-makers, 9.8% travelled to Hong Kong four times or more each week, up from 6.9% in 2011.

80
Energy and Environment 4.26 In the 2015 Policy Address, the Chief Executive pledged to launch a public consultation on the long-term development of the electricity market and its regulatory framework after the expiry of the current Scheme of Control Agreements with the two power companies in 2018. Separately, stepping up its effort in energy conservation, the Government has set a new target of 5% saving in electricity consumption for Government buildings under comparable operating conditions in the coming five years. 4.27 The Chief Executive also announced several other measures related to environmental protection in the Policy Address. The Government would report on the proposed framework for the quantity-based municipal solid waste charging in 2015, in light of the recommendations by the Council for Sustainable Development(7) and experience from the pilot scheme. Also, the Government would introduce a Recycling Fund to promote the sustainable development of the recycling industry. Moreover, the Government would introduce legislative proposals on the implementation of the Producer Responsibility Scheme on Waste Electrical and Electronic Equipment.

81
Notes : (1) Take-up figures represent the net increase in the number of units occupied. The
figures are arrived at by adding the completions in that year to the vacancy figures at the beginning of the year, then subtracting the year’s demolition and the year-end vacancy figures. Take-up should not be confused with the sales of new developments, and it bears no direct relationship to the number of units sold by developers. Negative take-up means that there is a decrease in the number of units occupied (i.e. property previously occupied was released during the year and remained vacant at the year-end).
(2) Forecast completions in 2015 and 2016 are preliminary figures only, and are subject to
revision upon the availability of more data. (3) For details of the measures promulgated in 2010, see Box 3.1 in the First Quarter
Economic Report 2010, Box 3.1 in the Third Quarter Economic Report 2010 and note (2) at the end of Chapter 4 in the 2010 Economic Background and 2011 Prospects. For details of the measures promulgated in 2011, see note (2) at the end of Chapter 3 in the Half-yearly Economic Report 2011 and Box 3.1 in the Third Quarter Economic Report 2011. For details of the measures promulgated in 2012, see Box 3.1 in the Third Quarter Economic Report 2012 and Box 4.1 in the 2012 Economic Background and 2013 Prospects. For details of the measures promulgated in 2013, see Box 4.2 in the 2012 Economic Background and 2013 Prospects and Box 3.1 in the First Quarter Economic Report 2013. For details of the measures promulgated in 2014, see Box 4.1 in the 2013 Economic Background and 2014 Prospects.
(4) The figures on transaction and vacancy rate refer to commercial space, which
comprises retail premises and other premises designed or adapted for commercial use but excludes purpose-built office space.
(5) Short-haul markets refer to North Asia, South and Southeast Asia, Taiwan and Macao,
but excluding the Mainland, while long-haul markets refer to the Americas, Europe, Africa, the Middle East, Australia, New Zealand and South Pacific. In 2014, visitor arrivals from the Mainland, short-haul and long-haul markets accounted for respective shares of 78%, 15% and 8% of total visitors.
(6) The figures on hotel room occupancy and achieved room rate do not include tourist
guesthouses. (7) In December 2014, the Council for Sustainable Development submitted a report to the
Government on the public engagement process on municipal solid waste charging, putting forward recommendations on general policy directions with a view to reducing community waste at source and promoting the sustainable development of Hong Kong. The report suggests implementing waste charging in both the domestic sector and the commercial-industrial sector in one go, and covers the four key issues deliberated during the public engagement process, namely charging mechanism, coverage of charging scheme, charging level and recycling.

82
CHAPTER 5 : THE FINANCIAL SECTOR# Summary The low interest rate environment in Hong Kong continued in 2014 amid
the ongoing accommodative monetary policy in the United States. The Hong Kong dollar interbank interest rates and retail level interest rates remained at low levels.
The Hong Kong dollar exchange rate moved within a narrow range of $7.750-7.766 per US dollar in 2014. The strong-side Convertibility Undertaking was repeatedly triggered between July and early August due to strong inflow of funds to meet the commercial and equity-related demand for the Hong Kong dollar, leading to an increase in the Aggregate Balance.
The Hong Kong dollar monetary aggregates expanded at a slightly faster pace in 2014. Meanwhile, total loans and advances increased at a moderated yet still visible pace.
The local stock market exhibited much volatility in 2014, along with the changes in external economic environment and developments on the policy front during the year. The Hang Seng Index (HSI) rallied starting May, but showed a marked correction in September and October amid renewed concerns over a slowdown in global economic recovery. The HSI closed at 23 605 at end-2014, only 1.3% higher than at end-2013. Trading activities were lacklustre in the first half of the year, but picked up noticeably in the second half.
__________ (#) This chapter is jointly prepared by the Hong Kong Monetary Authority (HKMA) and
the Economic Analysis Division.

83
Interest rates and exchange rates 5.1 The low interest rate environment in Hong Kong continued in 2014 amid the ongoing accommodative monetary policy in the United States. With the Federal Funds Target Rate staying at 0-0.25%, the Base Rate under the Discount Window operated by the HKMA held unchanged at 0.5%(1). The Hong Kong dollar interbank interest rates (HIBOR) also remained at low levels. The overnight HIBOR edged down from 0.08% at end-2013 to 0.05% at end-2014, while the three-month HIBOR stayed unchanged at 0.38%. 5.2 The Hong Kong dollar and US dollar yield curves flattened during 2014, with a decline in yields in the long tenor though a rise in the medium tenor (i.e. 2 to 3 years to maturity). As the decline in Hong Kong dollar long tenor yields was smaller than that in its US dollar counterparts, the negative yield spread between 10-year Exchange Fund Notes and 10-year US Treasury Notes narrowed from 74 basis points at end-2013 to 31 basis points at end-2014. Over the same period, the Hong Kong dollar yields showed a small decline in the short tenor while the US dollar yields remained steady. The yield spread between 6-month Exchange Fund Bills and 6-month US Treasury Bills therefore turned from a positive four basis points to a negative six basis points.
0.0
0.5
1.0
1.5
2.0
2.5
3.0
3.5
1M 3M 6M 1Y 2Y 3Y 5Y 7Y 10Y
Diagram 5.1 : The Hong Kong dollar and US dollar yield curves flattened during 2014
Percent per annum
Spread of yield between Exchange Fund Bills/Notesand US Treasuries at end-2014 :6-month Time to Maturity : -6 basis points5-year Time to Maturity : -21 basis points10-year Time to Maturity : -31 basis points
Time to Maturity
US Treasuries (end-2014)
Exchange FundBills/Notes(end-2013)
US Treasuries(end-2013)
Exchange FundBills/Notes(end-2014)
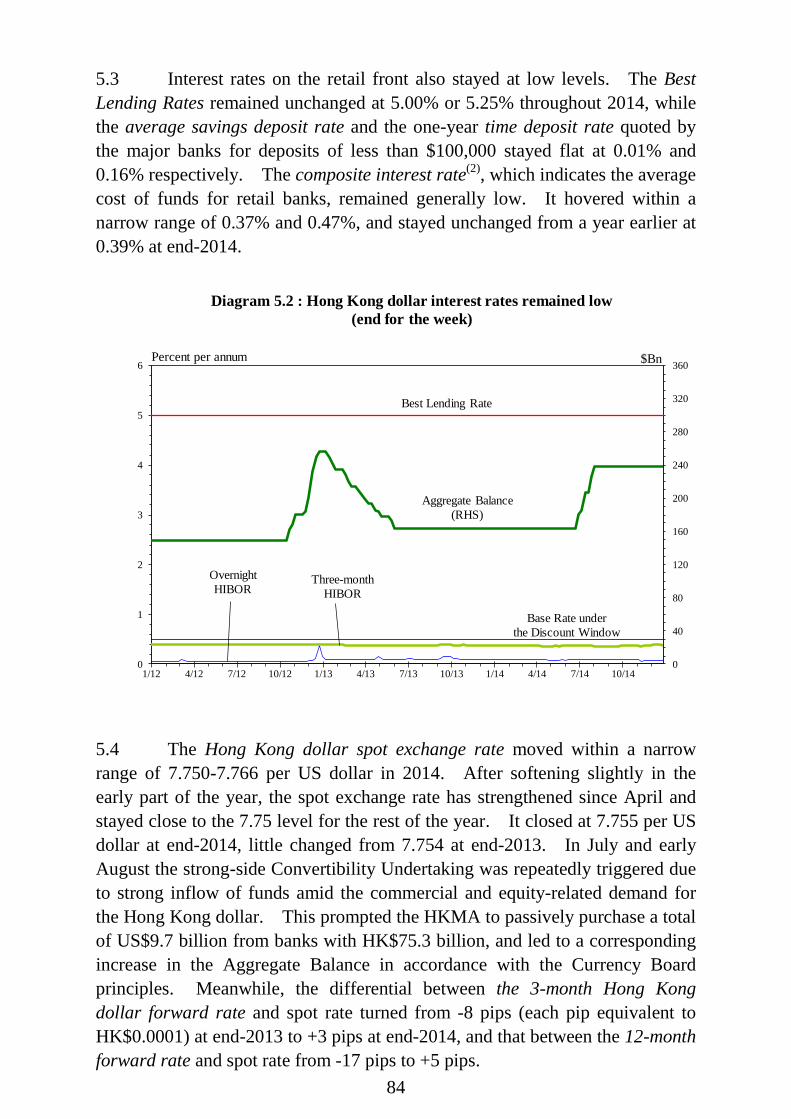
84
5.3 Interest rates on the retail front also stayed at low levels. The Best Lending Rates remained unchanged at 5.00% or 5.25% throughout 2014, while the average savings deposit rate and the one-year time deposit rate quoted by the major banks for deposits of less than $100,000 stayed flat at 0.01% and 0.16% respectively. The composite interest rate(2), which indicates the average cost of funds for retail banks, remained generally low. It hovered within a narrow range of 0.37% and 0.47%, and stayed unchanged from a year earlier at 0.39% at end-2014.
0
40
80
120
160
200
240
280
320
360
0
1
2
3
4
5
6
1/12 4/12 7/12 10/12 1/13 4/13 7/13 10/13 1/14 4/14 7/14 10/14
Diagram 5.2 : Hong Kong dollar interest rates remained low (end for the week)
Percent per annum $Bn
Best Lending Rate
Three-monthHIBOR
Aggregate Balance (RHS)
Overnight HIBOR
Base Rate under the Discount Window
5.4 The Hong Kong dollar spot exchange rate moved within a narrow range of 7.750-7.766 per US dollar in 2014. After softening slightly in the early part of the year, the spot exchange rate has strengthened since April and stayed close to the 7.75 level for the rest of the year. It closed at 7.755 per US dollar at end-2014, little changed from 7.754 at end-2013. In July and early August the strong-side Convertibility Undertaking was repeatedly triggered due to strong inflow of funds amid the commercial and equity-related demand for the Hong Kong dollar. This prompted the HKMA to passively purchase a total of US$9.7 billion from banks with HK$75.3 billion, and led to a corresponding increase in the Aggregate Balance in accordance with the Currency Board principles. Meanwhile, the differential between the 3-month Hong Kong dollar forward rate and spot rate turned from -8 pips (each pip equivalent to HK$0.0001) at end-2013 to +3 pips at end-2014, and that between the 12-month forward rate and spot rate from -17 pips to +5 pips.

85
5.5 Under the Linked Exchange Rate system, movements in the Hong Kong dollar exchange rate against other currencies closely followed those of the US dollar. As the US dollar strengthened against most major currencies during 2014, including the Japanese yen, euro and pound sterling, the trade-weighted Hong Kong dollar Nominal and Real Effective Exchange Rate Indices(3) rose by 4.0% and 7.6% respectively.
7.55
7.60
7.65
7.70
7.75
7.80
7.85
7.90
1/12 7/12 1/13 7/13 1/14 7/14
HK$/US$spot rate
HK$/US$twelve-month forward rate
HK$/US$three-month forward rate
HK$/US$
85
90
95
100
105
110
115
1/10 1/11 1/12 1/13 1/14
Index (Jan 2010=100)
Nominal EERI
Real EERI
Diagram 5.3 : Hong Kong dollar stayed close to 7.75 per US dollar during most of 2014
(end for the week)
Diagram 5.4 : The trade-weighted nominal and real EERIs both rose in 2014
(average for the month)
Linked Rate/Convertibility Zone*
Note : (*) The shaded area represents the Convertibility Zonethat was introduced in May 2005 as part of the threerefinements to the Linked Exchange Rate System.
Money supply and banking sector 5.6 The Hong Kong dollar monetary aggregates expanded at a slightly faster pace in 2014. The seasonally adjusted Hong Kong dollar narrow money supply (HK$M1) grew by 11.7% over a year earlier to $1,112 billion at end-2014, and the broad money supply (HK$M3) by 9.0% to $5,236 billion(4). Over the same period, total deposits with authorised institutions (AIs)(5) increased by 9.7% to $10,074 billion, with Hong Kong dollar deposits and foreign currency deposits growing by 9.3% and 10.1% respectively.

86
Q12010
Q12011
Q12012
Q12013
Q12014
-20
-10
0
10
20
30
40
50
60
70Percent
Position at end-2014 :$1,112 billion
Year-on-yearrate of change
Quarter-to-quarterrate of change
(a) HK$M1^(seasonally adjusted)
Diagram 5.5 : The monetary aggregates expanded slightly faster in 2014
Q12010
Q12011
Q12012
Q12013
Q12014
-20
-10
0
10
20
30
40
50
60
70
(b) HK$M3#^
Percent
Year-on-yearrate of change
Quarter-to-quarterrate of change
Position at end-2014 :$5,236 billion
Notes : (^) Figures refer to the positions at end of period. Notes : (#) Adjusted to include foreign currency swap deposits.
Table 5.1 : Hong Kong dollar money supply and total money supply
M1 M2 M3 % change during the quarter HK$^ Total HK$(a) Total HK$(a) Total 2013 Q1 4.5 1.0 0.1 1.1 0.1 1.1 Q2 2.6 2.7 # 1.9 0.1 1.9 Q3 1.0 3.9 4.6 5.5 4.6 5.5 Q4 1.1 1.8 0.9 3.4 0.9 3.4 2014 Q1 2.5 0.8 1.4 0.9 1.4 0.9 Q2 4.7 6.9 5.7 4.5 5.7 4.5 Q3 2.8 3.1 1.4 2.9 1.4 3.0 Q4 1.3 1.8 0.3 0.9 0.3 0.9 Total amount at end-2014 ($Bn) 1,112 1,708 5,226 11,012 5,236 11,050
% change over a year earlier 11.7 13.0 9.0 9.5 9.0 9.6
Notes : (^) Seasonally adjusted.
(a) Adjusted to include foreign currency swap deposits.
(#) Change of less than ±0.05%.

87
5.7 Growth in total loans and advances decelerated noticeably through the year, from a quarter-on-quarter increase of 5.7% in the first quarter to 0.9% in the fourth quarter. Yet for the year as a whole, there was still a visible growth of 12.7% to $7,276 billion at end-2014. Among the total, Hong Kong dollar loans and foreign currency loans expanded by 10.9% and 14.9% respectively. Reflecting the relative movements in loans and deposits, the loan-to-deposit ratios picked up in early 2014 and then levelled off. The loan-to-deposit ratio for Hong Kong dollar rose from 82.1% at end-2013 to 83.3% at end-2014, and the loan-to-deposit ratio for foreign currency from 59.5% to 62.1%. 5.8 Loans for use in Hong Kong (including trade finance) increased by 12.1% over a year earlier to $5,075 billion at end-2014, and loans for use outside Hong Kong by 14.2% to $2,201 billion. Within the former, loans to most economic sectors recorded visible growth. On the back of a pick-up in fund-raising and trading activities in the equity market, loans to financial concerns and stockbrokers rose notably by 19.5% and 65.7% respectively. Loans for purchase of residential property rose by an accelerated 8.4% alongside a generally active property market, while loans to building, construction, property development and investment grew by 6.8%. Loans to manufacturing and wholesale and retail trade surged by 25.0% and 13.3% respectively. Yet trade finance declined by 1.4%, dragged by a marked decline in the fourth quarter.

88
Table 5.2 : Loans and advances
All loans and advances for use in Hong Kong Loans to :
Building, Whole- construction, All loans sale property Purchase and advances Total
% change and development of for use loans during Trade Manu- retail and residential Financial Stock- outside and the quarter finance facturing trade investment property(a) concerns brokers Total(b) Hong Kong(c) advances 2013 Q1 19.3 2.5 1.1 -0.7 1.7 5.1 26.3 3.1 2.9 3.0 Q2 23.9 9.3 8.8 4.2 1.3 3.3 17.3 7.0 4.3 6.3 Q3 7.9 4.4 6.7 4.3 0.5 3.5 125.5 3.6 8.5 5.0 Q4 -9.8 0.8 1.6 -0.8 0.3 6.5 -53.2 -0.5 4.3 0.9 2014 Q1 12.4 7.4 5.5 2.7 1.0 12.0 38.2 6.6 3.7 5.7 Q2 2.4 6.7 5.4 1.6 2.1 3.3 68.1 4.4 1.7 3.6 Q3 0.2 7.2 7.9 0.8 2.3 1.2 -38.8 1.4 3.3 1.9 Q4 -14.5 1.8 -5.6 1.5 2.8 2.0 16.5 -0.7 4.8 0.9 Total amount at end-2014 ($Bn)
543 271 474 1,062 1,030 390 51 5,075 2,201 7,276
% change over a year earlier
-1.4 25.0 13.3 6.8 8.4 19.5 65.7 12.1 14.2 12.7
Notes : Some loans have been reclassified. As such, the figures are not strictly comparable with those of previous quarters. Figures might not add up to the corresponding totals due to rounding.
(a) Figures also include loans for the purchase of flats under the Home Ownership Scheme, Private Sector Participation Scheme and Tenants Purchase Scheme, in addition to those for the purchase of private residential flats.
(b) Loans to individual sectors may not add up to all loans and advances for use in Hong Kong, as some sectors are not included.
(c) Also include loans where the place of use is not known. 5.9 The Hong Kong banking sector remains resilient. The Hong Kong incorporated AIs were well capitalised, with the total capital adequacy ratio staying high at 16.4% at end-September 2014. So far no AIs have encountered difficulties in complying with the statutory minimum ratios required by the HKMA under Basel III(6). 5.10 The HKMA conducted a consultation on the proposal for establishing and implementing a local regulatory and supervising framework for systemically important AIs in Hong Kong during March to May. Widely supported by the industry, the HKMA is in the process of developing a new Supervisory Policy Manual module. Separately, HKMA has been working on the implementation of the second phase of the Basel III standards which encompass the liquidity coverage ratio, the capital buffers (i.e. the “capital conservation buffer”, the “countercyclical capital buffer”, and for systemically important banks, the “higher loss absorbency requirements”), and the
89
requirements for disclosure by banks that are associated with these standards as well as the Basel III Leverage Ratio. To this end, legislative changes (in the form of amendments to the Banking (Capital) Rules and a new set of Banking (Liquidity) Rules) have been introduced for taking effect on 1 January 2015. Preparation of draft amendments to the Banking (Disclosure) Rules is likewise in progress, which are targeted to take effect at the AIs’ first interim or annual financial period ending in 2015. 5.11 The HKMA continues to monitor closely AIs’ management of credit and liquidity risks, funding strategy, mortgage lending, Mainland-related business, and other areas of supervisory concerns to ensure the resilience of the banking sector against shocks in the external and domestic macro-financial environment. The Stable Funding Requirement (SFR), which requires AIs to hold sufficient stable funds to support their lending business, came into effect in January 2014. To streamline the SFR’s operation and alleviate AI’s reporting burden, some refinements of the SFR were announced in November 2014 for taking effect in January 2015. These included, among others, a change in loan filter from banks with loan book exceeding $5 billion and annualised year-to-date loan growth exceeding 20% to AIs with total loans of at least $10 billion and annualised average loan growth in the latest eight quarters exceeding 15%, and a change in the frequency of review and report submission from a monthly to a quarterly basis. 5.12 Asset quality of the local banking sector remained good. The ratio of classified loans to total loans declined from 0.48% at end-2013 to 0.43% at end-September 2014. The delinquency ratio for credit card lending remained at a low level by historical standards, though edging up from 0.20% at end-2013 to 0.22% at end-September 2014. The delinquency ratio for residential mortgage loans stayed low at 0.03% at end-2014.

90
Table 5.3 : Asset quality of retail banks* (as % of total loans)
As at end of period Pass loans Special mention loans Classified loans (gross)
2013 Q1 98.32 1.22 0.46 Q2 98.42 1.11 0.47 Q3 98.25 1.27 0.48 Q4 98.33 1.20 0.48 2014 Q1 98.42 1.12 0.46 Q2 98.50 1.05 0.46 Q3 98.53 1.04 0.43
Notes : Due to rounding, figures may not add up to 100.
(*) Period-end figures relate to Hong Kong offices and overseas branches. Loans and advances are classified into the following categories: Pass, Special Mention, Substandard, Doubtful and Loss. Loans in the substandard, doubtful and loss categories are collectively known as “classified loans”.
5.13 Offshore renminbi (RMB) business registered further notable expansion in 2014. RMB trade settlement transactions handled by banks in Hong Kong surged by 63% to RMB6,258 billion in 2014. Reflecting the strong need for RMB financing, outstanding RMB bank loans soared by 63% over a year earlier to RMB188 billion at end-2014. While the issuance of RMB bonds expanded sharply by 69% to RMB197 billion in 2014, the outstanding amount of RMB bonds grew by 23% over a year earlier to RMB381 billion at end-2014. Meanwhile, total RMB deposits (including customer deposits and outstanding certificates of deposit) increased by 10% to RMB1,158 billion. 5.14 The HKMA introduced several measures to strengthen Hong Kong’s market infrastructure for offshore RMB business development in the fourth quarter. In October, seven banks were designated by the HKMA as Primary Liquidity Providers. With access to a dedicated repo facility provided by the HKMA, the Primary Liquidity Providers pledged to expand their market-making activities in Hong Kong for various offshore market instruments, and use the Hong Kong platform in promoting their global offshore RMB business. In November, the HKMA started offering intraday RMB funds to authorised institutions participating in RMB business in Hong Kong, which helps banks to better manage their RMB liquidity and facilitates efficient payment flows. Separately, the daily RMB conversion limit for Hong Kong residents was removed in early November, making it more convenient for Hong Kong residents to participate in RMB financial transactions.
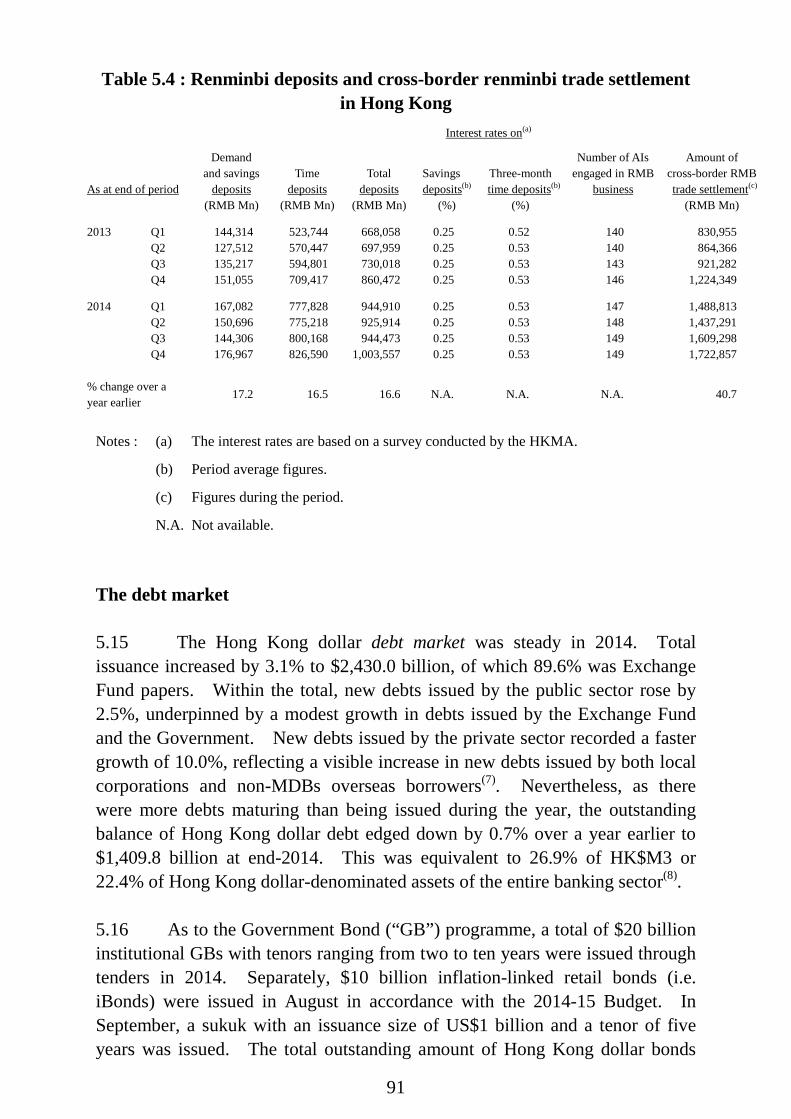
91
Table 5.4 : Renminbi deposits and cross-border renminbi trade settlement in Hong Kong
Interest rates on(a)
Number of AIs
engaged in RMB business
Amount of cross-border RMB trade settlement(c) As at end of period
Demand and savings
deposits Time
deposits Total
deposits Savings deposits(b)
Three-month time deposits(b)
(RMB Mn) (RMB Mn) (RMB Mn) (%) (%) (RMB Mn) 2013 Q1 144,314 523,744 668,058 0.25 0.52 140 830,955 Q2 127,512 570,447 697,959 0.25 0.53 140 864,366 Q3 135,217 594,801 730,018 0.25 0.53 143 921,282 Q4 151,055 709,417 860,472 0.25 0.53 146 1,224,349 2014 Q1 167,082 777,828 944,910 0.25 0.53 147 1,488,813 Q2 150,696 775,218 925,914 0.25 0.53 148 1,437,291 Q3 144,306 800,168 944,473 0.25 0.53 149 1,609,298 Q4 176,967 826,590 1,003,557 0.25 0.53 149 1,722,857 % change over a year earlier 17.2 16.5 16.6 N.A. N.A. N.A. 40.7
Notes : (a) The interest rates are based on a survey conducted by the HKMA.
(b) Period average figures.
(c) Figures during the period.
N.A. Not available. The debt market 5.15 The Hong Kong dollar debt market was steady in 2014. Total issuance increased by 3.1% to $2,430.0 billion, of which 89.6% was Exchange Fund papers. Within the total, new debts issued by the public sector rose by 2.5%, underpinned by a modest growth in debts issued by the Exchange Fund and the Government. New debts issued by the private sector recorded a faster growth of 10.0%, reflecting a visible increase in new debts issued by both local corporations and non-MDBs overseas borrowers(7). Nevertheless, as there were more debts maturing than being issued during the year, the outstanding balance of Hong Kong dollar debt edged down by 0.7% over a year earlier to $1,409.8 billion at end-2014. This was equivalent to 26.9% of HK$M3 or 22.4% of Hong Kong dollar-denominated assets of the entire banking sector(8). 5.16 As to the Government Bond (“GB”) programme, a total of $20 billion institutional GBs with tenors ranging from two to ten years were issued through tenders in 2014. Separately, $10 billion inflation-linked retail bonds (i.e. iBonds) were issued in August in accordance with the 2014-15 Budget. In September, a sukuk with an issuance size of US$1 billion and a tenor of five years was issued. The total outstanding amount of Hong Kong dollar bonds
92
under the Government Bond (“GB”) Programme was $96.5 billion at end-2014. This comprised 12 institutional issues totaling $66.5 billion and three retail issues (iBonds) totaling $30 billion.
5.17 In December 2014 the HKMA announced two measures to further promote the development of the local Hong Kong dollar bond market. First, the issuance of Exchange Fund Notes (EFNs) and GBs were streamlined to minimise overlap in tenors, so as to establish a single benchmark yield curve. Specifically, with effect from January 2015, the HKMA has stopped new issuance of EFNs of tenors of three years or above, though it will issue additional EFNs of these tenors to replace those maturing as necessary. New issuance of two-year GBs has ceased at the same time. New issuances of GBs will only be for tenors of three years and above, and the amount of these GBs will be suitably increased to meet investors’ demand for longer term high-quality Hong Kong dollar bonds. Second, the HKMA introduced a discount facility for GBs so as to provide greater flexibility for banks to manage liquidity. The facility provides up to a total of $10 billion overnight liquidity against a sale and repurchase of GBs. The HKMA would obtain funding from the market to maintain the size of the Aggregate Balance as needed.

93
Table 5.5 : New issuance and outstanding value of Hong Kong dollar debt securities ($Bn)
Exchange
Fund paper
Statutory bodies/government-owned corporations
Govern-ment
Public sector total AIs(a)
Local corporations
Non-MDBs overseas
borrowers(b)
Private sector total MDBs(b) Total
New Issuance
2013 Annual 2,123.4 10.7 30.0 2,164.1 143.0 25.6 23.1 191.7 0.9 2,356.8 Q1 508.9 3.5 7.0 519.4 32.5 11.6 6.1 50.3 0.0 569.7 Q2 537.6 5.0 13.0 555.6 39.5 2.2 7.5 49.2 0.0 604.7 Q3 532.0 1.1 7.0 540.1 43.2 6.6 2.4 52.2 0.9 593.2 Q4 545.0 1.1 3.0 549.1 27.8 5.2 7.1 40.0 0.0 589.1 2014 Annual 2,177.3 9.6 30.8 2,217.7 127.1 33.3 50.5 210.9 1.3 2,430.0 Q1 525.4 2.5 7.5 535.4 33.3 9.8 13.3 56.4 1.3 593.1 Q2 539.5 0.2 3.8 543.5 23.2 6.5 20.6 50.3 0.0 593.8 Q3 533.6 4.9 16.5 555.1 32.2 8.3 5.6 46.2 0.0 601.3 Q4 578.7 2.1 3.0 583.8 38.4 8.7 10.9 58.0 0.0 641.8 % change in 2014 over 2013
2.5 -9.5 2.7 2.5 -11.1 30.1 118.5 10.0 42.2 3.1
Outstanding (as at end of period)
2013 Q1 708.6 45.7 72.0 826.4 249.7 123.0 145.8 518.5 10.2 1,355.1 Q2 750.1 43.2 85.0 878.3 250.9 117.0 149.0 516.9 9.9 1,405.0 Q3 750.6 40.1 88.5 879.2 248.1 122.9 148.1 519.2 10.4 1,408.7 Q4 751.2 39.8 91.5 882.5 250.1 127.9 148.7 526.7 10.2 1,419.4 2014 Q1 751.5 40.1 95.5 887.1 249.0 130.4 150.9 530.3 11.1 1,428.4 Q2 752.0 37.1 98.5 887.6 228.9 124.4 148.1 501.5 6.9 1,395.9 Q3 752.2 41.5 105.0 898.7 223.0 132.3 142.5 497.8 6.9 1,403.4 Q4 752.6 41.0 98.0 891.6 232.8 137.6 141.7 512.1 6.1 1,409.8 % change over a year earlier
0.2 2.9 7.1 1.0 -6.9 7.6 -4.7 -2.8 -40.3 -0.7
Notes : Figures may not add up to the corresponding totals due to rounding and may be subject to revisions.
(a) AIs : Authorised institutions.
(b) MDBs : Multilateral Development Banks.

94
The stock and derivatives markets 5.18 The local stock market exhibited much volatility in 2014, along with the changes in external economic environment and developments on the policy front during the year. Supported by the announcement of the Shanghai-Hong Kong Stock Connect, as well as improved global economic growth and ongoing accommodative monetary policy in the United States, the Hang Seng Index (HSI) rallied starting May, and reached a high of 25 318 in early September. It showed a marked correction in the ensuing months, in tandem with the global stock market slide amid renewed concerns over a slowdown in global economic recovery. The HSI closed at 23 605 at end-2014, only 1.3% higher than at end-2013. The market capitalisation made a modest gain of 4.3% to reach $25.1 trillion in parallel. According to the World Federation of Exchanges, the local stock market was the seventh largest stock exchange in the world and third largest in Asia(9). 5.19 Trading activities were lacklustre in the first half of 2014, but picked up noticeably in the second half. For the year as a whole, average daily turnover in the securities market rose to $69.5 billion, 11% higher than in 2013. Trading of derivatives products(10) also increased. The average daily trading volume of futures and options expanded by 8.2%, though performance of different products varied. Trading of stock options and H-share Index Futures grew by 21.1% and 4.1% respectively, while trading of HSI futures and HSI options shrank by 13.9% and 13.7% respectively. Meanwhile, the average daily trading value of securitised derivatives products recorded a modest growth of 6.0%, within which the 13.3% rise in trading of derivative warrants more than offset the 4.3% decline in trading of callable bull/bear contracts.

95
0
2,000
4,000
6,000
8,000
10,000
12,000
14,000
16,000
18,000
20,000
22,000
24,000
26,000
0
20
40
60
80
100
120
140
160
Q12010
Q12011
Q12012
Q12013
Q12014
Market capitalisation* (RHS)Average daily turnover (LHS)
Diagram 5.7 : Market capitalisation made a modest gain while trading activities
increased
50
100
150
200
1/12 7/12 1/13 7/13 1/14 7/14
S & P 500 Index
FTSE 100 Index
Topix Index (Tokyo)
MSCI Asia ex. Japan Index
Hang Seng Index
Performance in 2014 :HSI : +1.3% Topix : +8.1% S&P : +11.4% FTSE : -2.7%MSCI Asia ex Jp : +2.2%
Index#(end-2011=100)
Diagram 5.6 : The local stock market exhibited much volatility in 2014
$Bn $Bn
Notes : (#) Position at end of month. Note : (*) Position at end of quarter.
Table 5.6 : Average daily turnover of derivatives products
of the Hong Kong market
Hang Seng Index futures
Hang Seng Index
options
H-shares Index futures
Stock options
Total futures and
options traded*
Derivative warrants ($Mn)
Callable bull/bear contracts
($Mn)
Total securitised derivatives
traded ($Mn)^
2013 Annual 80 247 35 252 85 538 249 295 532 905 7,309 5,202 12,510 Q1 82 570 38 464 77 111 278 115 552 686 10,268 6,032 16,301 Q2 91 137 43 304 87 653 256 162 563 658 7,150 5,433 12,583 Q3 78 192 31 109 87 853 217 169 503 305 6,190 5,250 11,441 Q4 69 587 28 614 89 157 247 867 514 398 5,783 4,138 9,920 2014 Annual 69 098 30 440 89 005 301 797 579 676 8,277 4,980 13,257 Q1 71 607 28 842 92 576 274 757 554 700 7,077 5,090 12,167 Q2 64 897 28 810 77 613 251 375 496 449 6,404 4,074 10,478 Q3 66 730 29 887 79 181 304 098 556 968 9,791 5,290 15,081 Q4 73 141 34 162 106 657 374 821 696 281 9,709 5,426 15,135 % change in 2014 Q4 over 2013 Q4
5.1 19.4 19.6 51.2 35.4 67.9 31.2 52.6
% change in 2014 over 2013
-13.9 -13.7 4.1 21.1 8.2 13.3 -4.3 6.0
Notes : (*) Turnover figures for individual futures and options are in number of contracts, and may not add up to the total futures and options traded as some products are not included.
(^) Comprising derivative warrants and callable bull/bear contracts.

96
5.20 Fund raising activities showed notable growth in 2014, with most of the activities occurring in the second half. For 2014 as a whole, total equity capital raised, comprising new share floatations and post-listing arrangements on the Main Board and the Growth Enterprise Market (GEM)(11), surged by 147% to a record-high of $935.8 billion. Within the total, the amount of funds raised through initial public offerings rose by a sharp 34.8% to $227.7 billion. Hong Kong’s global ranking in the amount of funds raised through IPO remained unchanged at the second place in 2014. 5.21 Mainland enterprises continued to play a dominant role in the Hong Kong stock market. A total of 876 Mainland enterprises (including 202 H-share companies, 133 “Red Chips” companies and 541 private enterprises) were listed on the Main Board and GEM, accounting for 50% of the total number of listed companies and 60% of total market capitalisation at end-2014. Mainland-related stocks accounted for 71% of equity turnover and 74% of total equity fund raised in the Hong Kong stock exchange in 2014. 5.22 The Shanghai-Hong Kong Stock Connect, a pilot programme for establishing mutual stock market access between Shanghai and Hong Kong(12), was announced in April and subsequently launched on 17 November 2014. The aggregate quota was initially set at RMB 300 billion for Northbound trading and RMB 250 billion for Southbound trading. The programme would strengthen the strategic co-operation and interaction between the two securities markets and enhance Hong Kong’s position as an offshore RMB centre. 5.23 The Hong Kong Exchanges and Clearing Limited (HKEx) has extended the closing time of its After-hours Futures Trading (AHFT) from 11:00 pm to 11:45 pm since 3 November 2014. The arrangement will further strengthen market participants’ capability to hedge or adjust their position in response to latest news and overseas events. Separately, the HKEx introduced its first Asia commodities contracts, namely London Aluminium Mini Futures, London Zinc Mini Futures and London Copper Mini Futures, in December. Denominated in RMB, these commodity contracts will help enhance both the availability of asset classes and the range of RMB products in the Hong Kong financial market, thereby promoting the further development of Hong Kong as an offshore RMB centre. 5.24 In November, the HKMA and the Securities and Futures Commission (SFC) published their conclusions on the joint consultation on the draft Securities and Futures (Over-the-counter (OTC) Derivative Transactions – Reporting and Record Keeping) Rules (the Reporting Rules), which set out the

97
precise ambit and details of the reporting and related record keeping obligations under the OTC derivative regulatory regime. The HKMA and the SFC have conducted further joint consultation on specific matters in relation to the reporting and related record keeping obligations in November 2014. They are finalising the first batch of subsidiary legislation for tabling before the Legislative Council. This would mark an important step of the new OTC derivative regulatory regime and would help increase the transparency of the OTC derivative market. Fund management and investment funds 5.25 Performance of the fund management business was generally solid in 2014. The aggregate net asset value of the approved constituent funds under the Mandatory Provident Fund (MPF) schemes(13) rose notably by 9.9% over a year earlier to $565.0 billion at end-2014. The gross retail sales of mutual funds also went up by 9.4% to US$77.7 billion(14) for the year. Meanwhile, the amount of net assets managed by retail hedge funds declined(15). Insurance sector 5.26 The insurance sector(16) recorded accelerated growth in the third quarter of 2014. Gross premium income from long-term business surged by 27.6% over a year earlier, within which premium income from non-investment linked plans rose by a sharp 30.4% and that from investment-linked plans by 12.7%. As to general business, gross premium and net premium rose by 9.7% and 8.5% respectively.

98
Table 5.7 : Insurance business in Hong Kong* ($Mn)
General business Premium for long-term business^
Gross
premium Net
premium Underwriting
profit
Individual life and annuity
(non-linked)
Individual life and annuity (linked)
Other individual business
Non-retirement scheme group
business
All long-term business
Gross premium
from long-term business
and general business
2013 Annual 42,120 29,179 3,038 73,015 19,132 156 285 92,588 134,708 Q1 12,359 8,759 657 17,527 4,919 36 53 22,535 34,894 Q2 10,428 7,446 864 17,570 5,597 40 61 23,268 33,696 Q3 10,512 7,314 671 18,910 3,831 40 50 22,831 33,343 Q4 8,821 5,660 846 19,008 4,785 40 121 23,954 32,775 2014 Q1 12,551 8,668 902 23,770 3,387 39 180 27,376 39,927 Q2 10,642 7,697 636 23,191 4,210 40 53 27,494 38,136 Q3 11,534 7,936 853 24,652 4,317 47 120 29,136 40,670 % change in 2014 Q3 over 2013 Q3
9.7 8.5 27.1 30.4 12.7 17.5 140 27.6 22.0
Notes : (*) Figures are based on provisional statistics of the Hong Kong insurance industry.
(^) Figures refer to new business only. Retirement scheme business is excluded. Highlights of policy and market developments 5.27 The Stamp Duty (Amendment) Bill 2014 was gazetted in December 2014 and subsequently introduced to the Legislative Council. The bill seeks to waive stamp duty for the transfer of shares or units of all exchange traded funds (ETFs) with their registers of holders maintained in Hong Kong. Previously only ETFs that track indices comprising not more than 40% Hong Kong stocks could enjoy stamp duty waiver. Through reducing the transaction costs of ETFs, the proposed waiver would further enhance the development and trading of ETFs and strengthen Hong Kong’s position as a leading international financial centre.
Notes : (1) Prior to 9 October 2008, the Base Rate was set at either 150 basis points above the
prevailing US Federal Funds Target Rate (FFTR) or the average of the five-day moving averages of the overnight and one-month HIBORs, whichever was higher. Between 9 October 2008 and 31 March 2009, this formula for determination of the Base Rate was temporarily changed by reducing the spread of 150 basis points above the prevailing FFTR to 50 basis points and by removing the other leg relating to the moving averages of the relevant interbank interest rates. After a review of the

99
appropriateness of the new Base Rate formula, the narrower 50 basis point spread over the FFTR was retained while the HIBOR leg was re-instated in the calculation of the Base Rate after 31 March 2009.
(2) In December 2005, the HKMA published a new data series on composite interest rate,
reflecting movement in various deposit rates, interbank and other interest rates to closely track the average cost of funds for banks. The published data enable the banks to keep track of changes in funding cost and thus help improve interest rate risk management in the banking sector.
(3) The trade-weighted Nominal Effective Exchange Rate Index (EERI) is an indicator of
the overall exchange value of the Hong Kong dollar against a fixed basket of other currencies. Specifically, it is a weighted average of the exchange rates of the Hong Kong dollar against some 15 currencies of its major trading partners, with the weights adopted being the respective shares of these trading partners in the total value of merchandise trade for Hong Kong during 2009 and 2010.
The Real EERI of the Hong Kong dollar is obtained by adjusting the Nominal EERI
for relative movements in the seasonally adjusted consumer price indices of the respective trading partners.
(4) The various definitions of the money supply are as follows: M1 : Notes and coins with the public, plus customers’ demand deposits with
licensed banks.
M2 : M1 plus customers’ savings and time deposits with licensed banks, plus negotiable certificates of deposit (NCDs) issued by licensed banks, held outside the monetary sector as well as short-term Exchange Fund placements of less than one month.
M3 : M2 plus customers’ deposits with restricted licence banks and deposit-taking
companies, plus NCDs issued by such institutions and held outside the monetary sector.
Among the various monetary aggregates, more apparent seasonal patterns are found in HK$M1, currency held by the public, and demand deposits.
(5) AIs include licensed banks, restricted licence banks and deposit-taking companies.
At end-2014, there were 159 licensed banks, 21 restricted licence banks and 23 deposit-taking companies in Hong Kong. Altogether, 203 AIs (excluding representative offices) from 31 countries and territories (including Hong Kong) had a presence in Hong Kong.
(6) Basel III was introduced by the Basel Committee in December 2010 (and subsequently
revised in June 2011) to strengthen the resilience of banks and banking systems in the light of lessons drawn from the global financial crisis. It tightens the definition of regulatory capital and increases the minimum common equity requirement from 2% to 4.5% of risk-weighted assets and the Tier 1 capital from 4% to 6% (with the total capital ratio remaining at 8%); requires banks to hold a Capital Conservation Buffer of 2.5% during good times and a Countercyclical Capital Buffer in the range of 0% to 2.5% (or higher at national discretion) at times of excessive credit growth, both to be met by common equity. It introduces a supplementary leverage ratio as a backstop to risk-weighted capital measures and enhances the transparency of the capital base. In addition, Basel III introduces two liquidity standards i.e. the Liquidity Coverage Ratio (LCR) to promote short term liquidity resilience and the Net Stable Funding Ratio

100
(NSFR) to encourage more stable funding structures. The LCR has already been in place since 1 January 2015 with a minimum required level of 60%, which is to be stepped up by 10 percentage points annually until achieving 100% by 1 January 2019. The NSFR is scheduled to take effect from 1 January 2018. The revision to the standard concluded in October 2014. The first phase of Basel III standards, which covers revised minimum capital requirements calculated based on a stricter definition of capital base and a wider risk coverage, took effect in Hong Kong with the amendments to the Banking (Capital) Rules (by way of the Banking (Capital) (Amendment) Rules 2012) coming into operation since 1 January 2013. To implement the Basel Committee’s disclosure requirements associated with these standards, amendments were introduced in the Banking (Disclosure) Rules (by way of the Banking (Disclosure) (Amendment) Rules 2013) which took effect from 30 June 2013.
(7) The figures for private sector debt may not represent a full coverage of all the
Hong Kong dollar debt paper issued. (8) Assets of the banking sector include notes and coins, amount due from AIs in Hong
Kong as well as from banks abroad, loans and advances to customers, negotiable certificates of deposit (NCDs) held, negotiable debt instruments other than NCDs held, and other assets. Certificates of indebtedness issued by Exchange Fund and the counterpart bank notes issued are nevertheless excluded.
(9) The ranking is made by the World Federation of Exchanges, a global trade association
for the securities exchange industry. Its membership comprises 64 securities exchanges, covering almost all globally recognised stock exchanges.
(10) At end-2014, there were 80 classes of stock options contracts and 41 classes of stock
futures contracts. (11) At end-2014, there were 1 548 and 204 companies listed on the Main Board and GEM
respectively. (12) For details, see 4.25 and footnote (13) of chapter 4 in the First Quarter Economic
Report 2014. (13) At end-2014, there were 19 approved trustees. On MPF products, 35 master trust
schemes, two industry schemes and one employer sponsored scheme, comprising altogether 458 constituent funds, were approved by the Mandatory Provident Fund Schemes Authority. A total of 271 000 employers, 2.51 million employees and 208 000 self-employed persons have participated in MPF schemes.
(14) These figures are obtained from the Sales and Redemptions Survey conducted by the
Hong Kong Investment Funds Association on their members, and cover only the active authorised funds that have responded to the survey. At end-2014, the survey covered a total of 1 177 active authorised funds.
(15) At end-2014, there were three SFC-authorised retail hedge funds with combined net
asset size of US$163 million. The amount of net assets under management dropped by 36.6% over a year earlier, and represented an increase of 1.9% of that at end-2002, the year when the hedge funds guidelines were first issued.
(16) At end-2014, there were 158 authorised insurers in Hong Kong. Within this total, 44
were engaged in long-term insurance business, 95 in general insurance business, and 19 in composite insurance business. These authorised insurers came from 23 countries and territories (including Hong Kong).
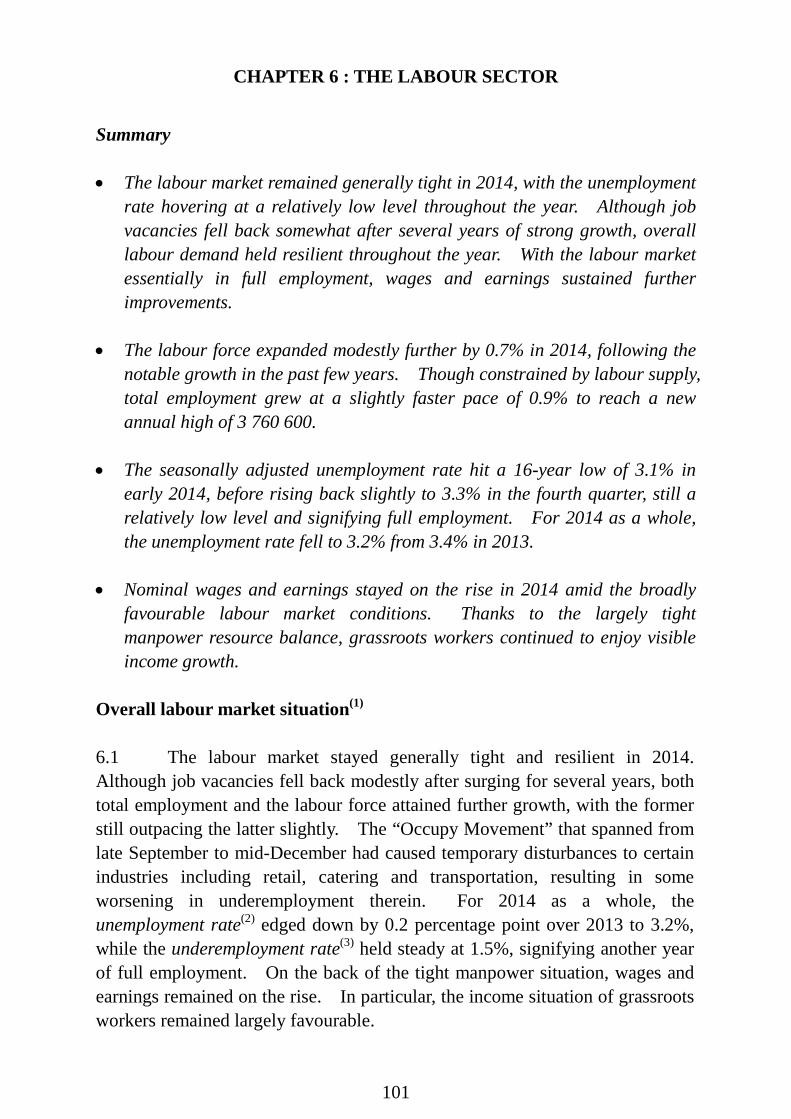
101
CHAPTER 6 : THE LABOUR SECTOR
Summary • The labour market remained generally tight in 2014, with the unemployment
rate hovering at a relatively low level throughout the year. Although job vacancies fell back somewhat after several years of strong growth, overall labour demand held resilient throughout the year. With the labour market essentially in full employment, wages and earnings sustained further improvements.
• The labour force expanded modestly further by 0.7% in 2014, following the notable growth in the past few years. Though constrained by labour supply, total employment grew at a slightly faster pace of 0.9% to reach a new annual high of 3 760 600.
• The seasonally adjusted unemployment rate hit a 16-year low of 3.1% in early 2014, before rising back slightly to 3.3% in the fourth quarter, still a relatively low level and signifying full employment. For 2014 as a whole, the unemployment rate fell to 3.2% from 3.4% in 2013.
• Nominal wages and earnings stayed on the rise in 2014 amid the broadly favourable labour market conditions. Thanks to the largely tight manpower resource balance, grassroots workers continued to enjoy visible income growth.
Overall labour market situation(1) 6.1 The labour market stayed generally tight and resilient in 2014. Although job vacancies fell back modestly after surging for several years, both total employment and the labour force attained further growth, with the former still outpacing the latter slightly. The “Occupy Movement” that spanned from late September to mid-December had caused temporary disturbances to certain industries including retail, catering and transportation, resulting in some worsening in underemployment therein. For 2014 as a whole, the unemployment rate(2) edged down by 0.2 percentage point over 2013 to 3.2%, while the underemployment rate(3) held steady at 1.5%, signifying another year of full employment. On the back of the tight manpower situation, wages and earnings remained on the rise. In particular, the income situation of grassroots workers remained largely favourable.

102
Q1 Q2 Q3 Q4 Q1 Q2 Q3 Q4 Q1 Q2 Q3 Q4 Q1 Q2 Q3 Q4 Q1 Q2 Q3 Q4 Q1 Q2 Q3 Q42009 2010 2011 2012 2013 2014
Seasonally adjustedunemployment rate 5.2 5.3 5.4 5.0 4.6 4.6 4.2 3.9 3.5 3.6 3.2 3.3 3.4 3.2 3.3 3.2 3.5 3.3 3.4 3.2 3.1 3.2 3.3 3.3
Underemploymentrate 2.1 2.3 2.4 2.3 2.2 2.0 1.9 1.8 1.8 1.8 1.8 1.4 1.6 1.4 1.6 1.5 1.6 1.6 1.5 1.4 1.3 1.5 1.5 1.6
Long-termunemployment rate 1.1 1.4 1.7 1.6 1.5 1.4 1.1 1.0 0.9 0.9 0.8 0.7 0.8 0.8 0.8 0.7 0.9 0.7 0.7 0.7 0.6 0.6 0.6 0.6
0
1
2
3
4
5
6
Diagram 6.1 : The labour market remained generally tight in 2014
Percent
Seasonally adjustedunemployment rate
Underemployment rate
Long-term unemployment rate
UnderemploymentrateLong-termunemployment rateAnnual averageunemployment rate 5.3 4.3 3.4 3.3 3.4 3.2#
Note: # Provisional figure. Labour force and total employment 6.2 The labour force(4) expanded modestly by 0.7% in 2014 to 3 886 100, after recording visible growth for three years in a row. Apart from the constraint from a mild growth in the working-age population (i.e. land-based non-institutional population aged 15 and above), the pace of entry into the labour force also slowed, especially so during the first half of the year. For 2014 as a whole, the labour force participation rate fell marginally to 61.1%, after rising successively in the past few years. On the quarterly profile, the labour force was virtually stagnant in the first two quarters of 2014 over a year earlier, before picking up to a moderate growth in the latter half of the year. 6.3 On the demand side, total employment(5) grew further by 0.9% to reach a new annual high of 3 760 600 in 2014. Conceivably, its pace of growth was held back by labour supply, with the quarterly profile exhibiting similar pattern as characterised by meagre growth in the first half of the year and a moderate pick-up in the latter quarters. Worthy to note is that employment growth actually outpaced labour supply growth for most quarters, suggesting tight labour demand-supply balance during most of the year.
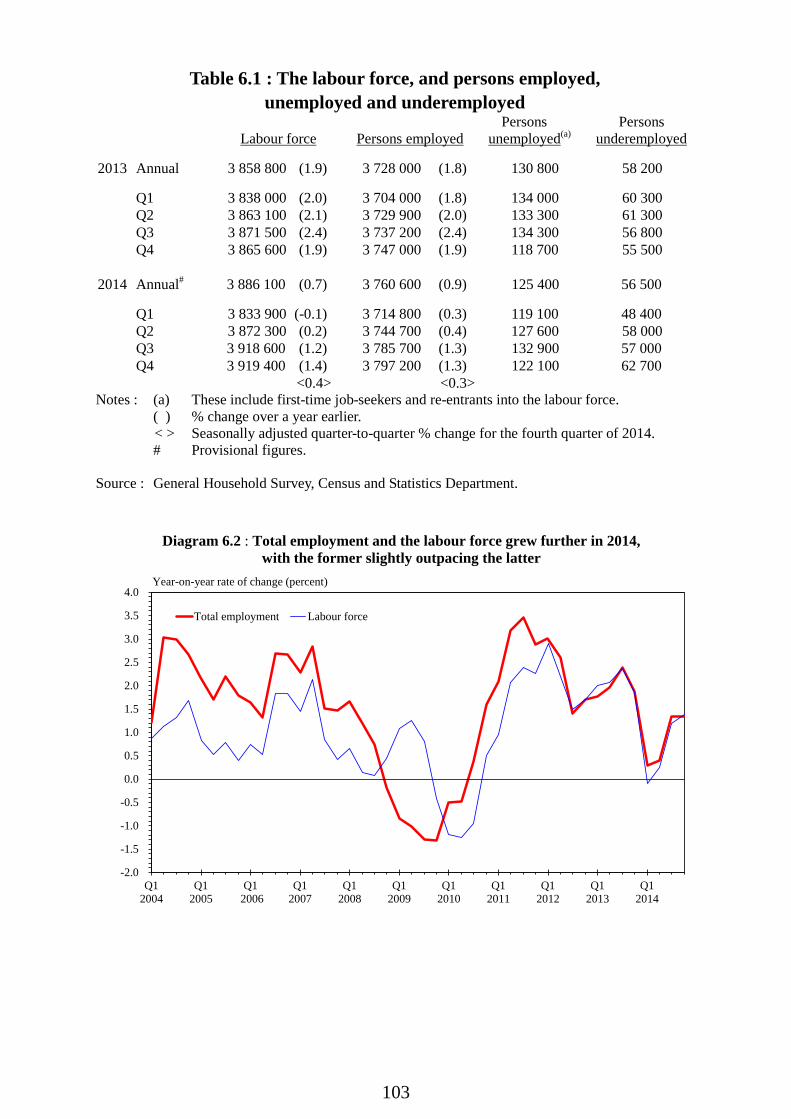
103
Table 6.1 : The labour force, and persons employed, unemployed and underemployed
Labour force
Persons employed
Persons unemployed(a)
Persons underemployed
2013 Annual 3 858 800 (1.9) 3 728 000 (1.8) 130 800 58 200 Q1 3 838 000 (2.0) 3 704 000 (1.8) 134 000 60 300 Q2 3 863 100 (2.1) 3 729 900 (2.0) 133 300 61 300 Q3 3 871 500 (2.4) 3 737 200 (2.4) 134 300 56 800 Q4 3 865 600 (1.9) 3 747 000 (1.9) 118 700 55 500 2014 Annual# 3 886 100 (0.7) 3 760 600 (0.9) 125 400 56 500 Q1 3 833 900 (-0.1) 3 714 800 (0.3) 119 100 48 400 Q2 3 872 300 (0.2) 3 744 700 (0.4) 127 600 58 000 Q3 3 918 600 (1.2) 3 785 700 (1.3) 132 900 57 000 Q4 3 919 400 (1.4) 3 797 200 (1.3) 122 100 62 700 <0.4> <0.3> Notes : (a) These include first-time job-seekers and re-entrants into the labour force. ( ) % change over a year earlier.
< > Seasonally adjusted quarter-to-quarter % change for the fourth quarter of 2014. # Provisional figures. Source : General Household Survey, Census and Statistics Department.
Q12004
Q12005
Q1 2006
Q12007
Q12008
Q12009
Q12010
Q12011
Q12012
Q12013
Q12014
-2.0
-1.5
-1.0
-0.5
0.0
0.5
1.0
1.5
2.0
2.5
3.0
3.5
4.0
Total employment Labour force
Year-on-year rate of change (percent)
Diagram 6.2 : Total employment and the labour force grew further in 2014, with the former slightly outpacing the latter
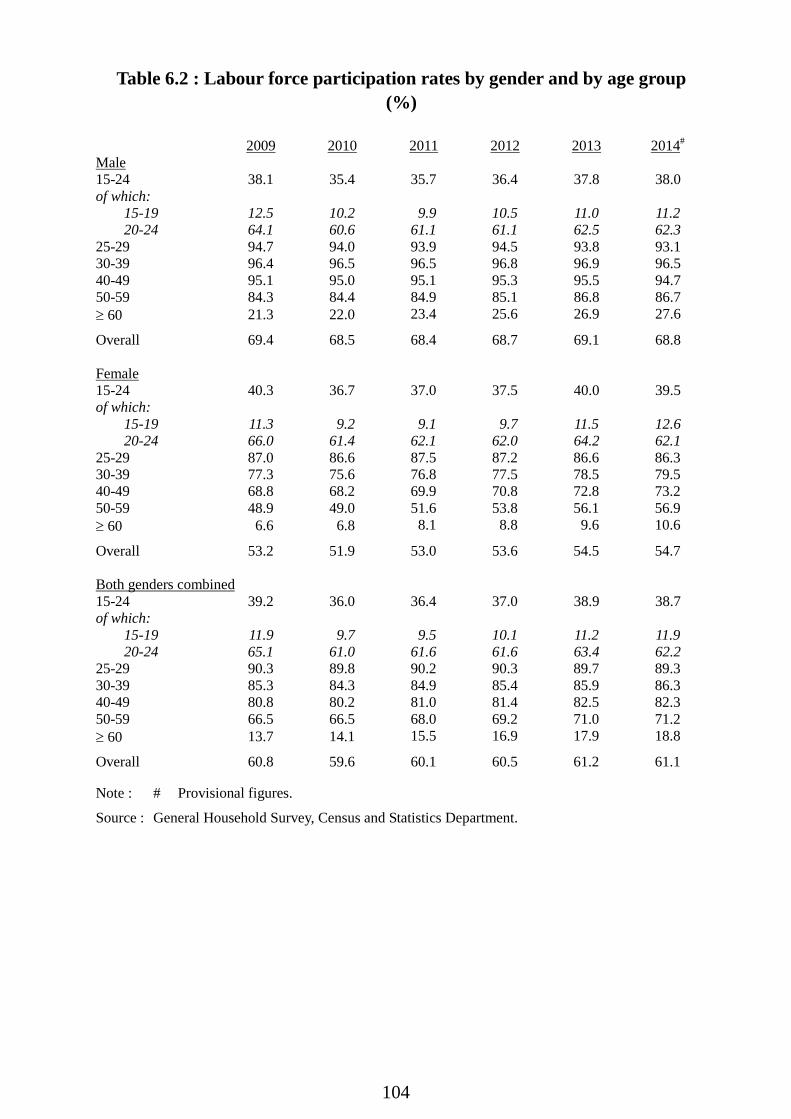
104
Table 6.2 : Labour force participation rates by gender and by age group (%)
2009 2010 2011 2012 2013 2014#
Male 15-24 38.1 35.4 35.7 36.4 37.8 38.0 of which:
15-19 12.5 10.2 9.9 10.5 11.0 11.2 20-24 64.1 60.6 61.1 61.1 62.5 62.3
25-29 94.7 94.0 93.9 94.5 93.8 93.1 30-39 96.4 96.5 96.5 96.8 96.9 96.5 40-49 95.1 95.0 95.1 95.3 95.5 94.7 50-59 84.3 84.4 84.9 85.1 86.8 86.7 ≥ 60 21.3 22.0 23.4 25.6 26.9 27.6 Overall 69.4 68.5 68.4 68.7 69.1 68.8 Female 15-24 40.3 36.7 37.0 37.5 40.0 39.5 of which:
15-19 11.3 9.2 9.1 9.7 11.5 12.6 20-24 66.0 61.4 62.1 62.0 64.2 62.1
25-29 87.0 86.6 87.5 87.2 86.6 86.3 30-39 77.3 75.6 76.8 77.5 78.5 79.5 40-49 68.8 68.2 69.9 70.8 72.8 73.2 50-59 48.9 49.0 51.6 53.8 56.1 56.9 ≥ 60 6.6 6.8 8.1 8.8 9.6 10.6 Overall 53.2 51.9 53.0 53.6 54.5 54.7 Both genders combined 15-24 39.2 36.0 36.4 37.0 38.9 38.7 of which:
15-19 11.9 9.7 9.5 10.1 11.2 11.9 20-24 65.1 61.0 61.6 61.6 63.4 62.2
25-29 90.3 89.8 90.2 90.3 89.7 89.3 30-39 85.3 84.3 84.9 85.4 85.9 86.3 40-49 80.8 80.2 81.0 81.4 82.5 82.3 50-59 66.5 66.5 68.0 69.2 71.0 71.2 ≥ 60 13.7 14.1 15.5 16.9 17.9 18.8 Overall 60.8 59.6 60.1 60.5 61.2 61.1 Note : # Provisional figures. Source : General Household Survey, Census and Statistics Department.

105
Profile of unemployment 6.4 Reflecting a tight manpower balance, the unemployment rate fell to a low level of 3.2% for 2014 as a whole, down by 0.2 percentage point from 3.4% in 2013. The average number of unemployed persons likewise fell by 5 300 over 2013 to 125 400 in 2014. These suggested that the labour market remained in a state of full employment in 2014. 6.5 Comparing 2014 with 2013, the unemployment situation improved across many sectors, with more notable declines in the unemployment rate seen in financing and insurance, and food and beverage service activities (down by 1.0 and 0.6 percentage point respectively). Analysed by skill segment, the unemployment rate for both higher- and lower-skilled workers fell slightly, by 0.2 and 0.1 percentage point respectively to 1.7% and 3.5%. As regards the low paying sectors(6) as a whole, the unemployment rate edged down from 3.1% in 2013 to 3.0% in 2014, signifying a tightening of manpower balance therein. Analysed by age profile, the unemployment rate fell across all age groups, except for those aged 60 and above. 6.6 In terms of the quarterly profile, the seasonally adjusted unemployment rate hit a 16-year low of 3.1% in the first quarter, signifying an extremely tight labour market. It then rose back slightly to 3.3% in the third quarter, and held steady at this low level in the fourth quarter. The unemployment rates of the higher- and lower-skilled segments, though exhibiting different quarterly trends, both stayed at relatively low levels throughout the year. Comparing the fourth quarter of 2014 with a year earlier to net out seasonal influences, more noticeable increases in the unemployment rate were seen in the information and communications, and accommodation services sectors, while more apparent declines were noted in the financing and insurance, and food and beverage service activities sectors. Analysed by occupational category, more discernible increases in the unemployment rate were seen among associate professionals and those engaged in elementary occupations, while more notable decreases were observed among plant and machine operators and assemblers, and managers and administrators. As for other socio-economic attributes, more visible rises in the unemployment rate were observed among persons aged 60 and above, and those with post-secondary education, offsetting the declines seen among workers aged 25-29 and those with secondary education. Yet for the former two groups, their unemployment rates remained at a low level of around 3% in the fourth quarter of 2014 despite the year-on-year increases.
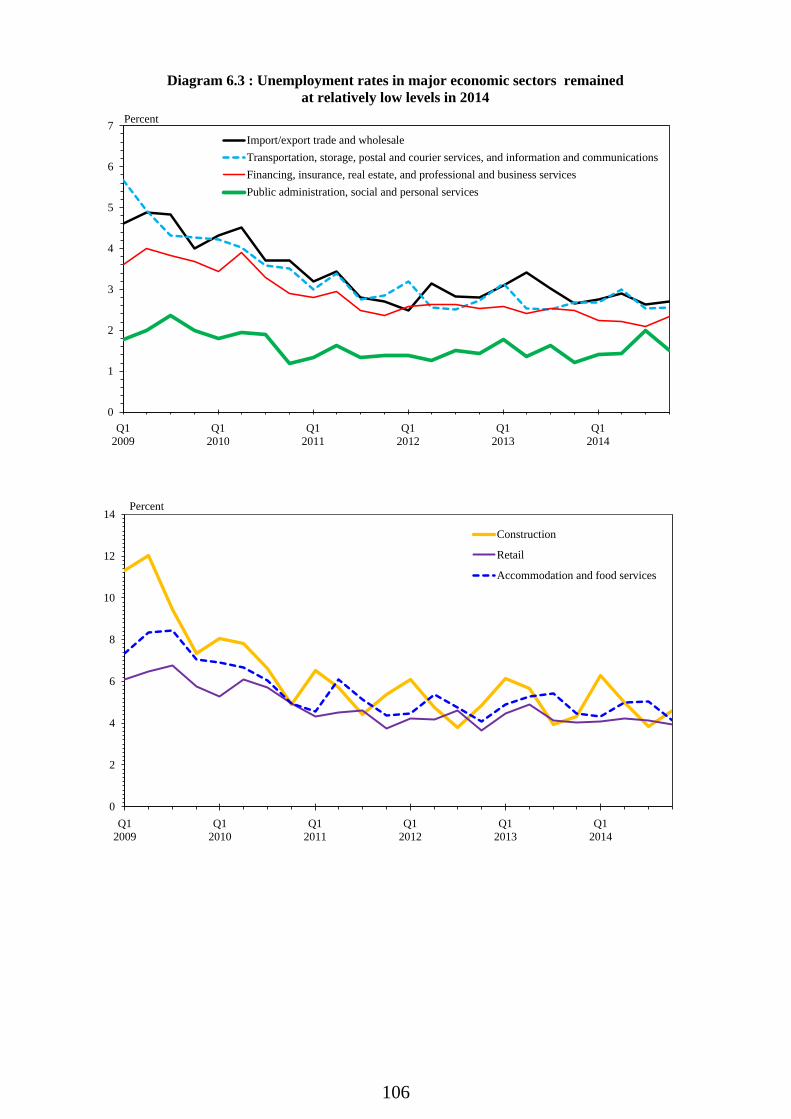
106
Q12009
Q12010
Q12011
Q12012
Q12013
Q12014
0
1
2
3
4
5
6
7Import/export trade and wholesaleTransportation, storage, postal and courier services, and information and communicationsFinancing, insurance, real estate, and professional and business servicesPublic administration, social and personal services
Percent
Diagram 6.3 : Unemployment rates in major economic sectors remainedat relatively low levels in 2014
Q12009
Q12010
Q12011
Q12012
Q12013
Q12014
0
2
4
6
8
10
12
14
Construction
Retail
Accommodation and food services
Percent

107
Table 6.3 : Unemployment rate by major economic sector 2013 2014 Annual Q1 Q2 Q3 Q4 Annual# Q1 Q2 Q3 Q4 Import/export trade and wholesale
3.1 3.1 3.4 3.0 2.7 2.7 2.7 2.9 2.6 2.7
Retail 4.4 4.5 4.9 4.1 4.1 4.1 4.1 4.2 4.1 3.9 Accommodation and food services
5.1 4.9 5.3 5.4 4.5 4.6 4.3 5.0 5.1 4.1
Transportation, storage, postal and courier services
2.6 3.1 2.4 2.2 2.8 2.7 2.9 3.2 2.4 2.1
Information and communications
3.0 3.2 2.9 3.4 2.5 2.7 2.0 2.3 2.9 3.7
Financing and insurance
2.5 2.8 2.4 2.7 2.3 1.5 1.5 1.5 1.8 1.4
Real estate 2.3 2.4 1.8 2.4 2.5 2.6 2.8 3.0 2.0 2.6 Professional and business services
2.5 2.5 2.6 2.4 2.6 2.5 2.5 2.3 2.4 2.8
Public administration, social and personal services
1.5 1.8 1.4 1.6 1.2 1.6 1.4 1.4 2.0 1.5
Manufacturing 3.2 3.7 3.3 2.8 2.4 3.3 3.3 3.7 3.2 3.2 Construction 5.1 6.1 5.6 4.0 4.3 4.9 6.3 5.0 3.9 4.6 Overall 3.4 3.5 3.4 3.5 3.1 3.2 3.1 3.3 3.4 3.1 (3.5) (3.3) (3.4) (3.2) (3.1) (3.2) (3.3) (3.3) Notes : ( ) Seasonally adjusted unemployment figures. # Provisional figures. Source : General Household Survey, Census and Statistics Department.

108
Q12004
Q12005
Q1 2006
Q12007
Q12008
Q12009
Q12010
Q12011
Q12012
Q12013
Q12014
0
1
2
3
4
5
6
7
8
9
Diagram 6.4 : The annual unemployment rates of both higher-skilled and lower-skilled workers edged down in 2014
Percent
Unemployment rate of lower-skilled workers
Unemployment rate of higher-skilled workers
Seasonally adjustedunemployment rate
Table 6.4 : Unemployment rate* by skill segment
2013 2014 Annual Q1 Q2 Q3 Q4 Annual# Q1 Q2 Q3 Q4 Higher-skilled segment 1.9 2.2 1.9 1.8 1.6 1.7 1.6 1.6 1.7 1.8 Managers and administrators
1.6 1.9 1.7 1.3 1.5 1.2 1.5 0.8 1.1 1.3
Professionals 1.5 1.9 1.5 1.4 1.4 1.4 1.1 0.9 1.7 1.7 Associate professionals 2.2 2.5 2.2 2.3 1.8 2.0 1.8 2.2 1.9 2.2 Lower-skilled segment^ 3.6 3.8 3.7 3.4 3.2 3.5 3.6 3.6 3.5 3.2 Clerical support workers
3.1 3.1 2.9 3.5 2.9 3.0 2.7 3.3 3.2 2.7
Service and sales workers
4.4 4.5 4.5 4.3 4.0 4.2 4.1 4.3 4.7 3.7
Craft and related
workers 4.8 5.7 5.4 3.6 4.4 4.6 5.9 4.1 3.8 4.7
Plant and machine
operators and assemblers
1.9 1.8 1.8 2.1 2.2 1.8 2.6 1.9 1.4 1.3
Elementary occupations 3.1 3.4 3.4 3.0 2.7 3.2 3.2 3.6 3.0 3.0 Notes : * Not seasonally adjusted, and not including first-time job-seekers and re-entrants into the
labour force. ^ Including other occupations. # Provisional figures. Source : General Household Survey, Census and Statistics Department.
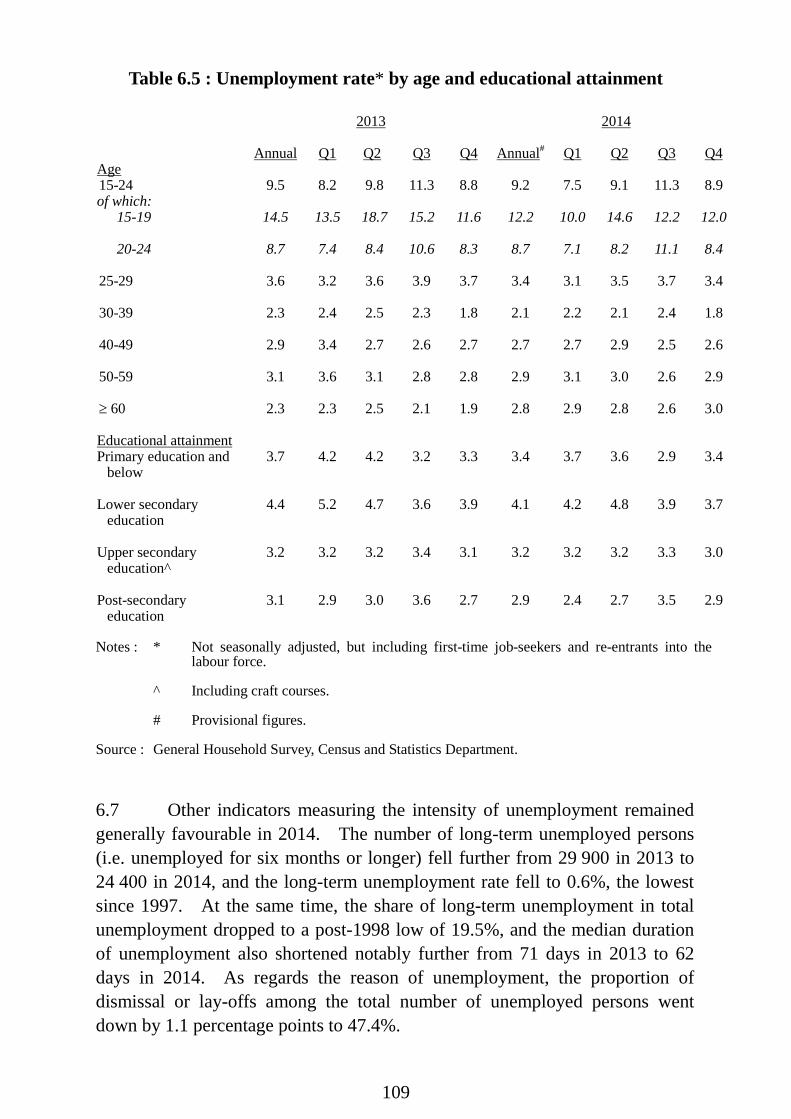
109
Table 6.5 : Unemployment rate* by age and educational attainment 2013 2014 Annual Q1 Q2 Q3 Q4 Annual# Q1 Q2 Q3 Q4 Age 15-24 9.5 8.2 9.8 11.3 8.8 9.2 7.5 9.1 11.3 8.9 of which:
15-19 14.5 13.5 18.7 15.2 11.6 12.2 10.0 14.6 12.2 12.0 20-24 8.7 7.4 8.4 10.6 8.3 8.7 7.1 8.2 11.1 8.4
25-29 3.6 3.2 3.6 3.9 3.7 3.4 3.1 3.5 3.7 3.4 30-39 2.3 2.4 2.5 2.3 1.8 2.1 2.2 2.1 2.4 1.8 40-49 2.9 3.4 2.7 2.6 2.7 2.7 2.7 2.9 2.5 2.6 50-59 3.1 3.6 3.1 2.8 2.8 2.9 3.1 3.0 2.6 2.9 ≥ 60 2.3 2.3 2.5 2.1 1.9 2.8 2.9 2.8 2.6 3.0 Educational attainment
Primary education and below
3.7 4.2 4.2 3.2 3.3 3.4 3.7 3.6 2.9 3.4
Lower secondary
education 4.4 5.2 4.7 3.6 3.9 4.1 4.2 4.8 3.9 3.7
Upper secondary
education^ 3.2 3.2 3.2 3.4 3.1 3.2 3.2 3.2 3.3 3.0
Post-secondary
education 3.1 2.9 3.0 3.6 2.7 2.9 2.4 2.7 3.5 2.9
Notes : * Not seasonally adjusted, but including first-time job-seekers and re-entrants into the
labour force. ^ Including craft courses. # Provisional figures. Source : General Household Survey, Census and Statistics Department. 6.7 Other indicators measuring the intensity of unemployment remained generally favourable in 2014. The number of long-term unemployed persons (i.e. unemployed for six months or longer) fell further from 29 900 in 2013 to 24 400 in 2014, and the long-term unemployment rate fell to 0.6%, the lowest since 1997. At the same time, the share of long-term unemployment in total unemployment dropped to a post-1998 low of 19.5%, and the median duration of unemployment also shortened notably further from 71 days in 2013 to 62 days in 2014. As regards the reason of unemployment, the proportion of dismissal or lay-offs among the total number of unemployed persons went down by 1.1 percentage points to 47.4%.
110
Profile of underemployment 6.8 The underemployment situation held broadly stable for 2014 as a whole. The number of underemployed persons decreased slightly by 1 700 over 2013 to 56 500, while the underemployment rate remained at a low level of 1.5% for the third consecutive year. Similar to unemployment, the underemployment situation improved early in the year, with the underemployment rate hitting a low of 1.3% in the first quarter, and then rose back gradually to 1.6% in the fourth quarter, still a relatively low level. For the latest trend, in the fourth quarter of 2014, apart from the construction sector, those sectors possibly susceptible to the temporary disturbances caused by the “Occupy Movement”, including retail, accommodation and food services, and transportation, witnessed more visible rises in the underemployment rate on both quarter-to-quarter and year-on-year comparisons. Analysed by occupational category, the underemployment rate for both the higher- and lower-skilled segments rose during the fourth quarter, with more noticeable increases seen among craft and related workers and service and sales workers.

111
Box 6.1 Labour market adjustments under different economic cycles
The demand for labour is a derived demand, in the sense that firms’ demand for labour is driven by the demand for their products. When the economy is expanding, the aggregate demand for labour is expected to rise if output growth is faster than the increase in labour productivity. In contrast, during a recession or a slowdown, the aggregate demand for labour will decline as businesses set to scale back their productions. In face of a reduction in the derived labour demand, some firms may choose to lay off or freeze employees’ wages to reduce the payroll expenses. However, many employers recognise that lay off may not be the most cost-effective way of adjustment considering the hiring and firing costs thus entailed, especially at times of still uncertain economic outlook. Some employers, therefore, may offer their workers sabbaticals or slash the amount of overtime, i.e. adjust the latter’s hours of work. Exactly how firms would adjust their manpower requirements very much depends on factors like their cost structures and the degree of capital-labour substitutability etc at the micro-level. At the macro-level, how responsive employment could adjust hinges on the flexibility of labour market, which is typically shaped by a number of institutional factors in the labour market, including employment protection legislation, taxation, and labour and welfare policies alike. Indeed, the Hong Kong economy went through a few recessions from 1996 to 2014, during which our labour market was inevitably adversely affected. By examining the labour market adjustments under different economic cycles, one can observe how the hours of work interplay with employment in the adjustment process. Chart 1 shows the year-on-year rates of change in total employment (EMP), average working hours of employed persons (AWH) and real Gross Domestic Product (GDP) during the period. Four recessions are identified, namely, (1) the 1998-1999 recession after the Asian Financial Crisis; (2) the burst of "IT bubbles" in 2001; (3) the outbreak of Severe Acute Respiratory Syndrome (SARS) in 2003 and (4) the Global Financial Crisis (GFC) in 2008-2009. It can be noted that during the periods just before the recessions, AWH shortened in tandem with the slow-down in economic activities. During the recession periods (2), (3) and (4), the loss in labour input was mainly driven by the drop in AWH. In comparison, the magnitude of EMP adjustment was smaller, which in turn helped partly relieve the upward pressure of unemployment rate. This observation suggests that employers appear to be quite reluctant to lay off workers immediately after economic activities slowed, probably partly because downsizing is often more difficult than adjusting the hours of work of existing staff. In general, corporate retrenchments or significant job losses only come into place when the weakness of demand for output protracts. When the Hong Kong economy began to recover (i.e. periods after recessions), AWH usually adjusted ahead, and to a greater magnitude, than EMP. Conceivably, this reflects employers’ still cautious hiring sentiment when the economy just regains some momentum. Instead, they prefer to extend the working hours of existing staff as transitional measures to cope with the revival of business activities. Such arrangement allows firms more flexibility in managing their operating costs while consolidating their business performances during the early phase of economic recovery. Total employment only picks up after economic recovery gains traction, followed by visible declines in average working hours and unemployment rate. From Chart 1, it can also been seen that increases in AWH were particularly notable in 2004 and 2010 when the economy rebounded from SARS outbreak and GFC respectively, followed by remarkable employment gains throughout the periods during 2004-2008 and after 2011. With employment growth apace, average working hours dropped in tandem.
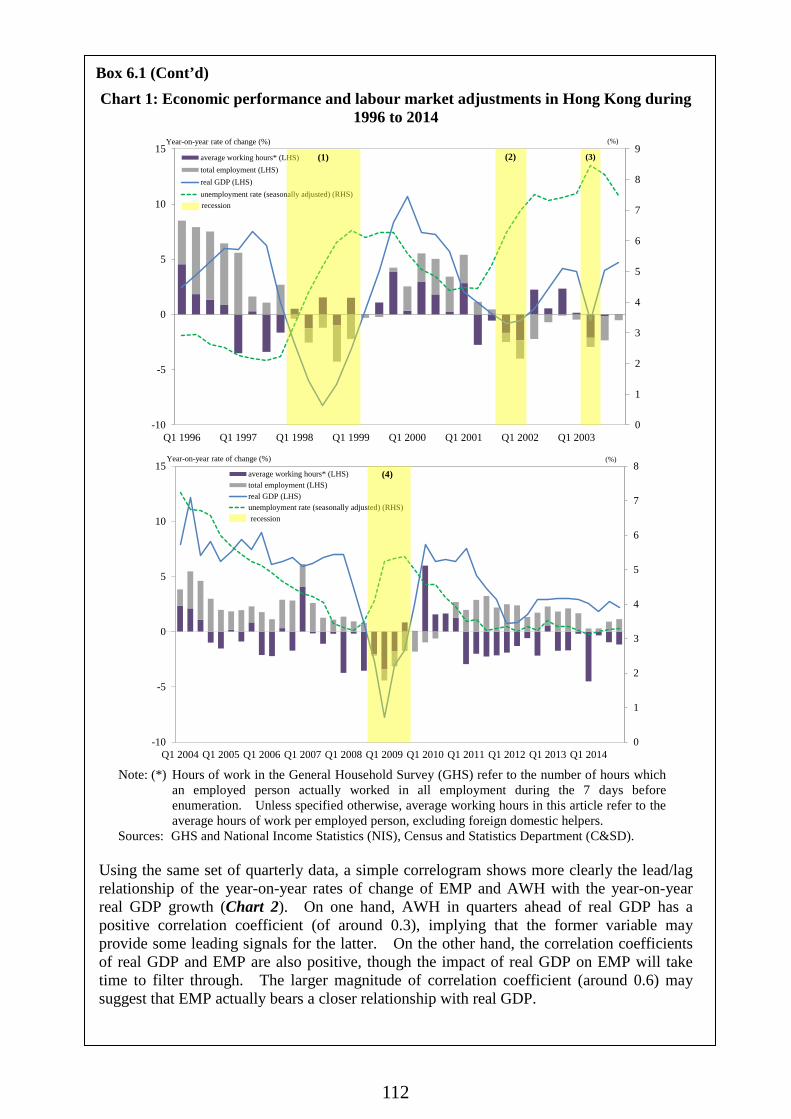
112
Box 6.1 (Cont’d) Chart 1: Economic performance and labour market adjustments in Hong Kong during
1996 to 2014
0
1
2
3
4
5
6
7
8
9
-10
-5
0
5
10
15
Q1 1996 Q1 1997 Q1 1998 Q1 1999 Q1 2000 Q1 2001 Q1 2002 Q1 2003
average working hours* (LHS)total employment (LHS)real GDP (LHS)unemployment rate (seasonally adjusted) (RHS)
(1) (2) (3)
Year-on-year rate of change (%)
recession
(%)
0
1
2
3
4
5
6
7
8
-10
-5
0
5
10
15
Q1 2004 Q1 2005 Q1 2006 Q1 2007 Q1 2008 Q1 2009 Q1 2010 Q1 2011 Q1 2012 Q1 2013 Q1 2014
average working hours* (LHS)total employment (LHS)real GDP (LHS)unemployment rate (seasonally adjusted) (RHS)
(4)
Year-on-year rate of change (%)
recession
(%)
Note: (*) Hours of work in the General Household Survey (GHS) refer to the number of hours which
an employed person actually worked in all employment during the 7 days before enumeration. Unless specified otherwise, average working hours in this article refer to the average hours of work per employed person, excluding foreign domestic helpers.
Sources: GHS and National Income Statistics (NIS), Census and Statistics Department (C&SD).
Using the same set of quarterly data, a simple correlogram shows more clearly the lead/lag relationship of the year-on-year rates of change of EMP and AWH with the year-on-year real GDP growth (Chart 2). On one hand, AWH in quarters ahead of real GDP has a positive correlation coefficient (of around 0.3), implying that the former variable may provide some leading signals for the latter. On the other hand, the correlation coefficients of real GDP and EMP are also positive, though the impact of real GDP on EMP will take time to filter through. The larger magnitude of correlation coefficient (around 0.6) may suggest that EMP actually bears a closer relationship with real GDP.

113
Box 6.1 (Cont’d) Chart 2: Cross-correlogram of the year-on-year rates of change in EMP and AWH
with real GDP growth (1996 – 2014)
-0.6
-0.4
-0.2
0
0.2
0.4
0.6
0.8
-4 -3 -2 -1 0 1 2 3 4
EMP (t+i) AWH (t+i)
i
Source: Author’s calculation based on GHS and NIS, C&SD.
Further analysis based on the empirical results of Granger causality test at Table 1 also shows that the two labour market indicators in question are quite responsive to the change in economic output. Specifically, one lag of AWH is a statistically significant predictor of real GDP, whereas up to four lags of real GDP are useful in predicting the change in EMP. Moreover, as shown in Chart 1, average working hours would tend to shorten when the employment keeps growing. Echoing this observation, it is also noted that past values of EMP (up to three lags) are also statistically significant in predicting AWH.
Table 1: Granger Causality Wald Test Results AWH Granger causes real GDP real GDP Granger causes AWH chi-square statistics chi-square statistics 1 lag 6.01 ** 1.02 2 lags 2.44 3.74 3 lags 1.42 5.55 4 lags 3.69 5.79 real GDP Granger causes EMP EMP Granger causes real GDP chi-square statistics chi-square statistics 1 lag 11.22 ** 1.54 2 lags 17.43 ** 1.06 3 lags 22.61 ** 0.39 4 lags 27.22 ** 0.22 EMP Granger causes AWH AWH Granger causes EMP chi-square statistics chi-square statistics 1 lag 3.33 * 8.00 ** 2 lags 7.66 ** 1.90 3 lags 7.22 * 2.11 4 lags 6.18 6.88
Note: ** and * denote statistical significance at 5% and 10% significance levels respectively. Source: Author’s estimates based on GHS and NIS, C&SD.

114
Box 6.1 (Cont’d) The above observations suggest that the adjustment to labour demand shocks in Hong Kong encompassed both adjustments to employment and hours of work. Although the local labour market mainly adjusts through changes in employment, the hours of work flexibly going up and down in response to the cyclical conditions also plays a crucial role, i.e. as a lubricant to temporarily cushion the adverse impact of economic shocks on the labour market. It is worth noting that the Hong Kong economy displayed strong resilience in the past decade or so, with swift recovery of output and then job creation. All these no doubt owe much to the flexibility of labour market, it being the cornerstone of our long-term competitiveness as well as our resilience through different economic cycles.

115
Profile of employment in establishments 6.9 The quarterly statistics collected from private sector establishments on employment, vacancies, wages and payroll are available only up to September 2014, and hence had not fully reflected the potential impacts of the “Occupy Movement”. To bring the analysis more up-to-date, attempts have been made wherever possible by drawing reference to information from supplementary sources. 6.10 Total employment in private sector establishments expanded steadily further by 2.2% over a year earlier, hitting an all-time high of 2 764 700 in September 2014. Except for the secular downtrend in manufacturing employment (down 1.2% year-on-year), employment growth was across the board. More visible job gains were seen in construction sites (covering manual workers only) (up 12.7%) as well as some social and personal services sectors such as art, entertainment, recreation and other services (up 5.4%), education (up 4.4%), and human health services (up 3.7%). Yet with the moderation in domestic demand, employment growth slowed in some sectors in September, including retail, accommodation services, financing and insurance, and professional and business services. Analysed by establishment size, employment in large enterprises and small and medium-sized enterprises (SMEs)(7) grew by 2.4% and 1.8% year-on-year respectively, with the former contributing about 60% of the total job gain. Taking the first nine months of 2014 together, total employment in private sector establishments increased by 2.0% year-on-year, further to the 1.9% growth for 2013 as a whole. As for the civil service, employment increased by 0.9% in September 2014, and by 1.1% in the first nine months of 2014 over the same period last year. Vacancies 6.11 Job vacancies however eased back somewhat in September 2014. The number of private sector vacancies went down by 3.8% over a year earlier to 75 360. For the first nine months of 2014, job vacancies in the private sector fell modestly by 1.5% year-on-year, after recording several years of double-digit growth.

116
Table 6.6 : Employment by major economic sector 2013 2014 Annual average Mar Jun Sep Dec Mar Jun Sep Import/export trade
and wholesale 554 200
(-0.4) 558 000
(0.1) 554 400
(-0.7) 551 600
(-0.7) 552 800
(-0.3) 552 900
(-0.9) 554 100
(-0.1) 554 400
(0.5) Retail 265 000
(2.3) 262 700
(2.3) 264 800
(2.1) 264 800
(1.9) 267 700
(2.9) 270 000
(2.8) 271 900
(2.7) 269 800
(1.9) Accommodation(a) and
food services 276 400
(1.5) 275 600
(2.4) 276 200
(1.4) 275 900
(0.8) 277 800
(1.3) 281 200
(2.0) 283 200
(2.5) 283 000
(2.6) Transportation, storage,
postal and courier services
170 000 (2.0)
168 100 (1.5)
169 300 (1.6)
171 000 (2.5)
171 600 (2.6)
171 700 (2.1)
174 500 (3.1)
175 400 (2.6)
Information and
communications 101 300
(5.1) 98 400
(3.3) 101 100
(5.4) 102 600
(5.2) 103 200
(6.2) 102 900
(4.6) 103 500
(2.4) 104 800
(2.2) Financing, insurance,
real estate, professional and business services
683 400 (2.5)
676 100 (2.1)
678 300 (2.1)
685 200 (2.6)
693 800 (3.4)
693 300 (2.5)
694 000 (2.3)
694 600 (1.4)
Social and personal
services 462 400
(2.7) 458 600
(3.2) 461 000
(2.3) 463 800
(2.9) 466 100
(2.6) 475 600
(3.7) 480 000
(4.1) 482 500
(4.0) Manufacturing 103 700
(-3.0) 104 000
(-3.7) 103 400
(-4.0) 103 900
(-2.7) 103 700
(-1.5) 103 500
(-0.5) 102 200
(-1.1) 102 600
(-1.2) Construction sites
(manual workers only) 79 300 (11.2)
77 800 (10.1)
82 500 (15.1)
76 800 (6.3)
80 100 (13.4)
78 600 (1.0)
79 700 (-3.4)
86 500 (12.7)
All establishments
surveyed in the private sector(b)
2 706 400 (1.9)
2 689 700 (1.9)
<0.9>
2 701 600 (1.7)
<0.4>
2 706 500 (1.7)
<0.3>
2 727 900 (2.4)
<0.7>
2 740 700 (1.9)
<0.5>
2 754 200 (1.9)
<0.5>
2 764 700 (2.2)
<0.5> Civil service(c) 161 400
(1.3) 160 700
(0.9) 160 900
(1.1) 161 500
(1.5) 162 400
(1.7) 162 800
(1.4) 162 800
(1.2) 163 000
(0.9)
Notes : Employment figures enumerated from business establishments, as obtained from the Quarterly Survey of Employment and Vacancies, are somewhat different from those enumerated from households, as obtained from the General Household Survey. This is mainly due to difference in sectoral coverage: while the former survey covers selected major sectors, the latter survey covers all sectors in the economy.
(a) Accommodation services sector covers hotels, guesthouses, boarding houses and other establishments providing short term accommodation.
(b) The total figures on private sector employment cover also employment in mining and quarrying; and in electricity and gas supply, and waste management, besides employment in the major sectors indicated above.
(c) These figures cover only those employed on civil service terms of appointment. Judges, judicial officers, ICAC officers, locally engaged staff working in the Hong Kong Economic and Trade Offices outside Hong Kong, and other government employees such as non-civil service contract staff are not included.
( ) % change over a year earlier.
< > Seasonally adjusted quarter-to-quarter % change.
Sources : Quarterly Survey of Employment and Vacancies, Census and Statistics Department. Quarterly Employment Survey of Construction Sites, Census and Statistics Department.

117
6.12 Analysed by economic sector, except for a further sizable gain in construction sites (covering manual workers only) (up 73.1% year-on-year), vacancies saw broad-based easing in September 2014. More noticeable declines in vacancies were observed in information and communications (down 21.8%), import/export trade and wholesale (down 16.7%), and financing and insurance (down 16.5%). Indeed, vacancy growth in some domestic-oriented sectors, notably retail (up 0.6%) and accommodation services (up 0.1%), also decelerated upon the weaker consumption market during the year. Meanwhile, vacancies in both higher- and lower-skilled segments decreased, by 2.5% and 4.2% year-on-year respectively. The former was solely dragged by an 8.1% decline in job openings for associate professionals, while the latter was mainly attributed to clerical support workers (down 16.3%) and service and sales workers (down 7.9%). Taking the first nine months of 2014 together, higher-skilled vacancies dropped by 13.7% over a year earlier, while lower-skilled ones grew modestly by 3.7%. Analysed by the size of establishments, vacancies in SMEs fell by 14.0% year-on-year in September 2014, while that in large enterprises increased by 5.2%. As regards the civil service, the number of job openings went up by 11.4% year-on-year to 7 430. 6.13 Analysing the number of job openings in private sector establishments relative to that of job-seekers, the ratio of job vacancies per 100 unemployed persons was 57 in September 2014, down slightly from 62 in June 2014 and 58 recorded a year earlier. In terms of skill segment, the ratio for higher-skilled jobs rose from the year-ago level of 82 to 86, while that for lower-skilled jobs fell from 68 to 64 over the same period. The latter decline was mainly attributable to service and sales workers and clerical support workers. Analysed by economic sector, manpower shortages remained apparent in human health services, accommodation services, and financing and insurance, for which the corresponding ratios exceeded 100. The vacancy rate, measured in terms of the percentage of job vacancies to total employment opportunities, stood at 2.7% for private sector establishments in September 2014, 0.1 percentage point lower than a year earlier. More visible decreases were seen in information and communication, financing and insurance, and social and personal services over the period.

118
Table 6.7 : Vacancies by major economic sector
Number of vacancies 2013 2014 Vacancy
rate in Sep 2014
Annual average Mar Jun Sep Dec Mar Jun Sep
Economic sector (%) Import/export trade
and wholesale 9 810 (15.3)
10 440 (16.7)
10 120 (10.7)
10 140 (23.1)
8 540 (10.9)
9 210 (-11.8)
8 150 (-19.4)
8 450 (-16.7)
1.5
Retail 8 760
(10.9) 9 400 (15.0)
8 120 (17.8)
9 190 (2.6)
8 310 (9.9)
9 680 (2.9)
8 810 (8.4)
9 240 (0.6)
3.3
Accommodation(a) and
food services 14 460 (20.2)
15 550 (40.9)
12 970 (5.7)
14 360 (11.0)
14 960 (26.1)
17 600 (13.2)
15 800 (21.8)
15 550 (8.2)
5.2
Transportation, storage,
postal and courier services
3 750 (13.9)
3 620 (13.1)
4 100 (20.3)
3 640 (2.8)
3 630 (20.4)
4 180 (15.7)
4 040 (-1.6)
3 380 (-7.1)
1.9
Information and
communications 2 690 (13.3)
2 680 (8.2)
3 050 (28.3)
3 020 (40.2)
2 000 (-19.6)
2 570 (-4.2)
2 650 (-13.1)
2 360 (-21.8)
2.2
Financing, insurance,
real estate, professional and business services
17 710 (10.0)
17 510 (8.2)
17 950 (8.1)
18 450 (16.6)
16 910 (7.3)
17 820 (1.8)
18 210 (1.4)
17 810 (-3.5)
2.5
Social and personal
services 16 190
(6.7) 17 330
(6.2) 17 690
(7.3) 15 620
(5.4) 14 130
(8.2) 11 620 (-32.9)
16 600 (-6.1)
13 930 (-10.8)
2.8
Manufacturing 2 590
(-5.5) 2 600 (-9.1)
2 680 (-9.8)
2 700 (14.1)
2 390 (-13.9)
3 200 (23.2)
3 580 (33.7)
2 880 (6.6)
2.7
Construction sites
(manual workers only) 1 050 (63.1)
930 (39.6)
1 030 (74.3)
890 (73.2)
1 350 (67.9)
1 630 (75.1)
1 540 (49.8)
1 530 (73.1)
1.7
All establishments
surveyed in the private sector(b)
77 180 (12.1)
80 170 (14.6) <6.7>
77 860 (9.9)
<-0.3>
78 300 (12.7) <2.8>
72 380 (11.2)
<1.4>
77 790 (-3.0)
<-6.6>
79 720 (2.4)
<5.0>
75 360 (-3.8)
<-2.8>
2.7
Civil service(c) 6 520
(2.7) 6 220 (5.8)
6 980 (10.0)
6 670 (1.1)
6 190 (-5.5)
6 350 (2.0)
7 270 (4.2)
7 430 (11.4)
4.4
Notes : Vacancy rate refers to the ratio of vacancies to total employment opportunities (actual employment plus vacancies).
(a) Accommodation services sector covers hotels, guesthouses, boarding houses and other establishments providing short term accommodation.
(b) The total figures on private sector vacancies cover also vacancies in mining and quarrying; and in electricity and gas supply, and waste management, besides vacancies in the major sectors indicated above.
(c) These figures cover only vacancies for those staff to be employed on civil service terms of appointment.
( ) % change over a year earlier.
< > Seasonally adjusted quarter-to-quarter % change.
Sources : Quarterly Survey of Employment and Vacancies, Census and Statistics Department.
Quarterly Employment Survey of Construction Sites, Census and Statistics Department.

119
Q32004
Q32005
Q32006
Q32007
Q32008
Q32009
Q32010
Q32011
Q32012
Q32013
Q32014
0
20
40
60
80
100
120
140
160
180
200
(a) By economic sector
ManufacturingImport/export trade and wholesaleRetailAccommodation and food servicesTransportation and storageFinancing, insurance, real estate, prof. & business servicesSocial and personal services
Ratio of the number of job vacancies to that of 100 unemployed persons
Q32004
Q32005
Q32006
Q32007
Q32008
Q32009
Q32010
Q32011
Q32012
Q32013
Q32014
0
20
40
60
80
100
120
140
160
180
200
(b) By occupation
Managers and administrators, and professionals andassociate professionalsClerical support workers
Service and sales workers
Elementary occupations
Ratio of the number of job vacancies to that of 100 unemployed persons
Diagram 6.5 : Manpower shortages remained apparent in certain sectors
6.14 The vacancy registration figures compiled by the Labour Department (LD), notwithstanding its smaller sample size, may provide some hints on the latest developments in the labour market. In the fourth quarter of 2014, the average number of private sector job vacancies posted by LD increased moderately by 2.2% year-on-year to around 104 700 per month. For 2014 as a whole, the monthly average number of private sector vacancies edged up by 0.3% over 2013 to a record high of 101 700.

120
Wages and earnings 6.15 In tandem with generally tight labour market conditions, wages and earnings growth remained on the rise in 2014. Wage index, which covers regular payment to employees at the supervisory level or below, rose by 4.0% year-on-year in September, or 4.2% taking the first nine months of 2014 together. These compared to the rise of 4.7% for 2013 as a whole. After adjusting for inflation(8), real wages fell by 2.4% in the first nine months of 2014. Yet this was mainly attributable to a spike in headline inflation in September 2014, which in turn reflected the distortion from a lower base of comparison amid the Government’s payment of public housing rentals in the same month of 2013. 6.16 Nominal wage index increased across all economic sectors and occupations in September 2014. More notable increases were observed in personal services (up 8.3%) and professional and business services (up 5.9%), as well as among service workers (up 6.2%). 6.17 Labour earnings(9), as measured by the index of payroll per person engaged in the private sector, likewise posted a further year-on-year increase of 3.4% in the third quarter of 2014. Taking the first three quarters of 2014 together, nominal labour earnings rose by 4.4%, compared to 5.4% for 2013 as a whole. After discounting inflation which was subject to similar distortion in the headline inflation rate in September, there was a real growth of 0.2% in the first three quarters of 2014. 6.18 Nominal payroll rose in almost all major sectors in the third quarter of 2014. More notable increases were seen in professional and business services (up 6.1%) and financing and insurances (up 5.7%). However, some moderation in payroll growth was observed in retail (up 2.3%) and real estate (up 3.1%).

121
Q12009
Q12010
Q12011
Q12012
Q12013
Q12014
-8
-6
-4
-2
0
2
4
6
8
10
12
(a) Year-on-year rate of changein nominal terms
Payroll index
Wage index
Percent
Q12009
Q12010
Q12011
Q12012
Q12013
Q12014
-8
-6
-4
-2
0
2
4
6
8
10
12
(b) Year-on-year rate of changein real terms
Payroll index
Wage index
Percent
Diagram 6.6 : Nominal wages and earnings sustained further growth in 2014
Note: The real declines of wages and earnings in the third quarter of 2014 were mainly attributable to the larger
year-on-year increases in the headline Consumer Price Indices, which in turn reflected the distortion arising from the Government’s one-off relief measures.
6.19 More recent statistics compiled from the General Household Survey, though not strictly comparable to those from the business establishment surveys, showed that in the fourth quarter of 2014, the average monthly employment earnings(10) of full-time employees engaged in elementary occupations (excluding foreign domestic helpers) posted a year-on-year nominal increase of 7.0%. For 2014 as a whole, preliminary estimates suggested that their average employment earnings rose appreciably further by around 7% in nominal terms and 1% in real terms. These suggested that labour market conditions remained largely favourable for grassroots workers. For the overall income situation, the median monthly household income (excluding foreign domestic helpers) sustained further growth in all quarters of 2014, and rose by 6.0% year-on-year in the fourth quarter, translating into a real increase of 0.9% after discounting inflation.

122
Highlights of recent labour-related measures and policy developments 6.20 LD regularly organises large-scale job fairs in different locations, canvassing vacancies from various industries for application by job-seekers on the spot. In 2014, LD organised 19 large-scale job fairs. 584 participating organisations offered over 48 000 vacancies from the retail, catering, transport and other industries. There were also 14 training bodies joining the job fairs to introduce job training courses and receive applications on the spot. Apart from large-scale job fairs, district-based job fairs are organised at LD’s Job Centres from time to time to assist job-seekers in finding employment. Recruitment activities are also staged by catering and retail employers at the two industry-based recruitment centres regularly for interviewing job-seekers on the spot. Moreover, to strengthen employment services to residents living in remote areas, LD set up a job centre in Tung Chung in October 2014 to facilitate job-seekers in the region in obtaining employment services and save their travelling expenses. 6.21 LD has enhanced its collaboration with employers and various organisations to launch pilot projects under the Youth Employment and Training Programme to provide young people with appropriate pre-employment training, workplace attachment, on-the-job training and employment support services. Targeted at different groups of young people, six pilot projects have been launched in 2014 making available about 760 training places. 6.22 The Standard Working Hours Committee (SWHC) was appointed in April 2013 for a term of three years. Up to end-December 2014, SWHC has held nine meetings. The two working groups on “Working Hours Consultation” and “Working Hours Study” respectively conducted a large-scale public consultation and a dedicated working hours survey in 2014. With reference to the findings in these two aspects, SWHC will continue to conduct in-depth discussion on directions of working hours policy options, with a view to building consensus and identifying the way forward. 6.23 On completion of a new round of review of the Statutory Minimum Wage (SMW) rate, the Minimum Wage Commission (MWC) submitted its recommendation report on 31 October 2014. The Chief Executive in Council has accepted MWC’s recommendation to raise the SMW rate from its prevailing level of $30 per hour to $32.5 per hour, up by $2.5 or 8.3%. Subject to the approval of the Legislative Council, the revised SMW rate will come into force on 1 May 2015.

123
Notes : (1) Labour force statistics enumerated from the General Household Survey are statistics
which involve the use of the population figures in the compilation process. The statistics of the three-month periods of November 2012 – January 2013 to October – December 2013 have been revised to take into account the final end-2013 population estimates and those of November 2013 – January 2014 to April – June 2014 have been revised to incorporate the latest information.
The classification of occupation adopted by the Census and Statistics Department
follows the International Standard Classification of Occupations (ISCO), which is used to classify the occupation of an employed person or the previous occupation of an unemployed person. After the implementation of the new ISCO, 2008 (ISCO-08), the General Household Survey has been enhanced to adopt the ISCO-08 in compiling labour force statistics by occupation, with statistics backcasted to the quarter of January to March 2011. Starting from the reference quarter of January to March 2011, all the labour force statistics by occupation, unless otherwise specified, are compiled based on the ISCO-08.
(2) For a person aged 15 or above to be classified as unemployed, he or she should:
(a) not have a job and not be performing any work for pay or profit during the reference period (i.e. seven days before enumeration); and (b) be available for work during the reference period; and (c) be seeking work during the 30 days before enumeration.
Notwithstanding the above, the following types of persons are also considered
unemployed: (a) persons without a job, having sought work but not available for work because of temporary sickness; (b) persons without a job, available for work but not having sought work because they will take up new jobs or start business at a subsequent date, or expect to return to their original jobs; and (c) discouraged workers not having sought work because they believe work is not available to them.
Even at full employment, some frictional unemployment is bound to exist as workers
move between jobs in order to obtain better terms of employment. The precise level of unemployment which can be described as purely frictional varies amongst economies, depending on the structure and characteristics of their labour markets.
The seasonally adjusted series is compiled using the X-12 ARIMA method, which is a
standard method applied in compiling seasonally adjusted statistical data series. (3) The main criteria for an employed person aged 15 or above to be classified as
underemployed are: involuntarily working less than 35 hours during the reference period (i.e. seven days before enumeration), and either available for additional work during the reference period or seeking additional work during the 30 days before enumeration.
Following these criteria, employed persons taking no-pay leave due to slack work
during the reference period are also classified as underemployed if they had worked less than 35 hours or were on leave for the entire reference period.
(4) The labour force, or the economically active population, is defined to include all
persons aged 15 or above who either were engaged in productive work during the reference period (i.e. seven days before enumeration) or would otherwise have been engaged in productive work but were unemployed.

124
(5) Figures enumerated from household data. The employed population is defined here to
include those persons aged 15 or above who performed work for pay or profit or had a formal job attachment during the reference period (i.e. seven days before enumeration).
(6) The low paying sectors as identified by the Minimum Wage Commission include:
(i) retail (including supermarkets and convenience stores, and other retail stores); (ii) restaurants (including Chinese restaurants, non-Chinese restaurants, fast food cafes, and Hong Kong style tea cafes); (iii) estate management, security and cleaning services (including real estate maintenance management, security services, cleaning services and membership organisations); (iv) other low paying sectors, including - elderly homes; - laundry and dry cleaning services; - hairdressing and other personal services; - local courier services; and - food processing and production.
(7) Manufacturing enterprises with fewer than 100 employees and non-manufacturing enterprises with fewer than 50 employees are regarded as small and medium-sized enterprises (SMEs) in Hong Kong. Yet, establishments with the same main business registration number (BRN) and engaging in activities of the same industry sector are grouped into one business unit for the purpose of calculating the number of SMEs. Thus, a business with a lot of small chain stores each employing a small number of employees will be considered as a single large enterprise, instead of separate SMEs.
(8) Different consumer price indices are used for compiling the real indices of labour
earnings and wages, taking into account their relevance to the respective occupation coverage. Specifically, the Composite CPI, being an indicator of overall consumer prices, is taken as the price deflator for earnings received by employees at all levels of the occupational hierarchy. The CPI(A), being an indicator of consumer prices for the relatively low expenditure group, is taken as the price deflator for wages in respect of employees engaged in occupations up to the supervisory level.
(9) In addition to wages, which include all regular and guaranteed payments like basic pay
and stipulated bonuses and allowances, earnings also cover overtime pay and other non-guaranteed or irregular bonuses and allowances, except severance pay and long service payment. Because of this difference, as well as the difference in sectoral and occupational coverage, the movements in average earnings, as measured by payroll per person engaged, do not necessarily match closely with those in wage rates.
(10) The average (mean) monthly employment earnings are easily affected by extreme
values in the survey sample, more so when reckoned for higher-end workers. They should therefore be interpreted with caution, in particular when they are compared over time.
125
CHAPTER 7 : PRICES
Summary
Underlying inflation followed an easing trend in 2014, as domestic cost pressures moderated, while imported inflation remained tame. The increase in underlying Composite Consumer Price Index (Composite CPI)(1), which nets out the effects of the Government’s one-off relief measures to more accurately reflect the underlying inflation trend, eased to 3.5% in 2014, from 4.0% in 2013. Meanwhile, the headline Composite CPI rose by 4.4% in 2014, broadly the same as that in 2013.
Domestic price pressures remained largely contained in 2014. The milder increases in fresh-letting private residential rentals since 2013 continued to feed through to the CPI. Meanwhile, the year-on-year rises in shop and office rentals were rather moderate during most of the year, and labour costs showed steady increases.
External price pressures were tame in 2014, helping to contain local inflation, thanks to softer international food and commodity prices and the modest inflation in major import sources. Weaker-than-expected global economic recovery and the depreciations of some major currencies against the US dollar also contributed to alleviate external price pressures.
In the near term, the upside risks to CPI inflation should be limited, as the lag effects from the earlier moderation in domestic rental increases feed through, and as international food and commodity prices are also likely to remain benign. Yet, potential risks of a rebound in international commodity prices arising from adverse supply shocks or changes in global economic and monetary conditions should not be ruled out.
Consumer prices 7.1 Underlying consumer price inflation continued on an easing trend in 2014, reflecting moderate local cost pressures and benign imported inflation. Locally, the year-on-year increase in the private housing rental component of the Composite CPI tapered further as the milder increases in fresh-letting rentals in earlier quarters successively fed through. Meanwhile, the increases in shop and office rentals were still rather moderate, albeit picking up modestly in the latter part of 2014. This, together with largely steady labour costs, helped relieve some of the local business cost pressures. Externally, import prices rose at a modest pace this year, thanks to softer international energy and raw material prices. Lower inflation worldwide, including those in Hong
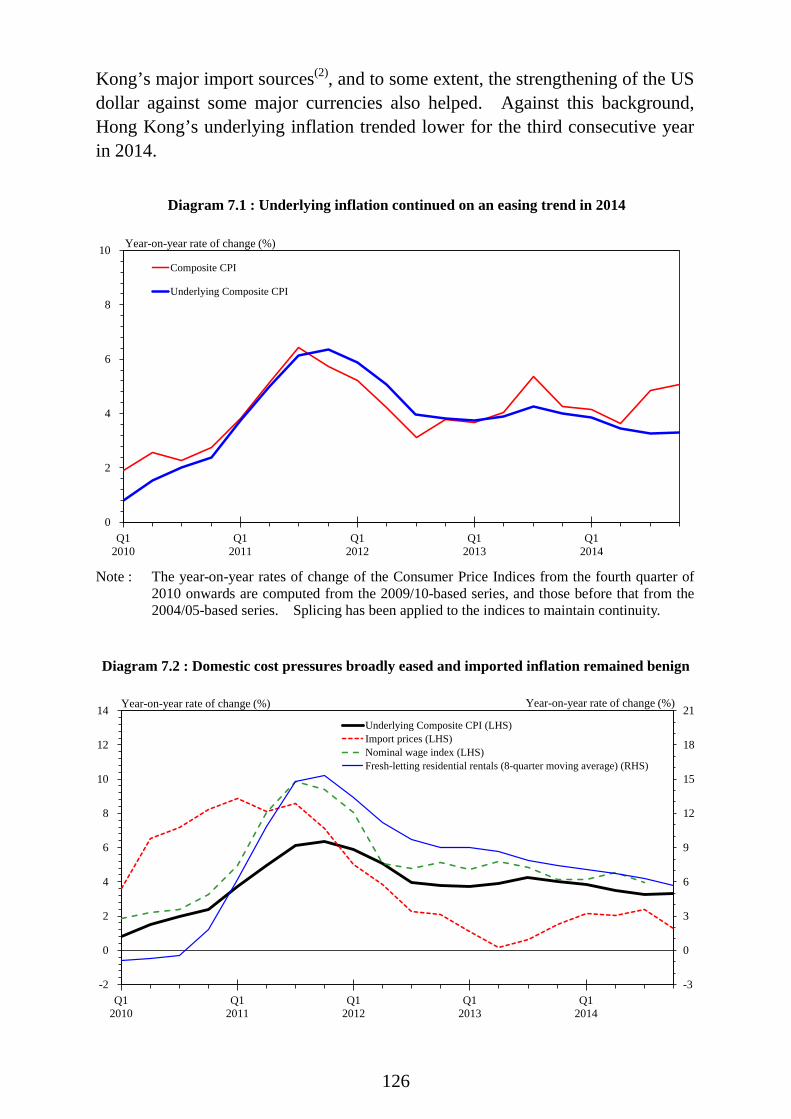
126
Kong’s major import sources(2), and to some extent, the strengthening of the US dollar against some major currencies also helped. Against this background, Hong Kong’s underlying inflation trended lower for the third consecutive year in 2014.
Note : The year-on-year rates of change of the Consumer Price Indices from the fourth quarter of
2010 onwards are computed from the 2009/10-based series, and those before that from the 2004/05-based series. Splicing has been applied to the indices to maintain continuity.
Q12010
Q12011
Q12012
Q12013
Q12014
0
2
4
6
8
10Composite CPI
Underlying Composite CPI
Year-on-year rate of change (%)
Diagram 7.1 : Underlying inflation continued on an easing trend in 2014
-3
0
3
6
9
12
15
18
21
Q12010
Q12011
Q12012
Q12013
Q12014
-2
0
2
4
6
8
10
12
14Underlying Composite CPI (LHS)Import prices (LHS)Nominal wage index (LHS)Fresh-letting residential rentals (8-quarter moving average) (RHS)
Year-on-year rate of change (%) Year-on-year rate of change (%)
Diagram 7.2 : Domestic cost pressures broadly eased and imported inflation remained benign

127
7.2 Underlying consumer price inflation, which nets out the effects of the Government’s one-off relief measures to more genuinely reflect the underlying inflation trend, receded gradually over the course of 2014, from 3.8% in the first quarter to 3.5% in the second quarter, and slightly further to 3.3% in both the third and fourth quarters. For 2014 as a whole, the underlying inflation averaged 3.5%, down further from 4.0% in 2013. Headline consumer price inflation, as measured by the rate of change in the Composite CPI, averaged 4.4% in 2014, broadly the same as that in 2013. The more visible rebound since September was due in part to a temporary lower base of comparison resulting from the Government’s payment of public housing rentals in September 2013, and in part to the ending of the Government’s rates concession in October 2014. Also relevant was the gradual depletion of the Government’s one-off electricity charge subsidy by some households during the period.

128
Table 7.1 : Consumer Price Indices (year-on-year rate of change (%))
Composite CPI CPI(A) CPI(B) CPI(C)
Underlying(a) Headline
2013 Annual 4.0 4.3 5.1 4.1 3.8
H1 3.8 3.9 4.4 3.6 3.5
H2 4.1 4.8 5.8 4.5 4.1
Q1 3.8 3.7 4.2 3.5 3.3
Q2 3.9 4.0 4.6 3.8 3.6
Q3 4.3 5.3 7.3 4.6 4.2
Q4 4.0 4.3 4.4 4.4 4.1
2014 Annual 3.5 4.4 5.6 4.2 3.5
H1 3.7 3.9 4.0 4.0 3.7
H2 3.3 5.0 7.1 4.4 3.4
Q1 3.8 4.2 4.3 4.3 3.9
Q2 3.5 3.6 3.8 3.8 3.5
Q3 3.3 4.8 7.2 4.1 3.3
Q4 3.3 5.1 7.0 4.6 3.4
(seasonally adjusted quarter-to-quarter rate of change (%))
2013 Q1 1.1 1.0 1.1 1.0 1.0
Q2 1.1 1.3 1.3 1.2 1.2
Q3 0.9 -0.7 -3.4 0.4 0.9
Q4 0.9 2.7 5.5 1.7 1.0
2014 Q1 0.9 0.9 1.1 0.9 0.8
Q2 0.7 0.7 0.7 0.7 0.7
Q3 0.7 0.5 -0.2 0.9 0.8
Q4 0.9 2.9 5.4 2.0 1.1
Note : (a) Underlying consumer price inflation is calculated by netting out the effects of all
relevant one-off measures introduced since 2007, including the waiver and Government’s payment of public housing rentals, rates concession, suspension and subsequent abolition of Employees Retraining Levy, and subsidies for household electricity charges.

129
7.3 On a year-on-year basis, the prices for most of the major components in the underlying Composite CPI recorded slower increases in 2014. Food and private housing rentals continued to be the main contributors to inflation, accounting for slightly more than three-quarters of the increase in the underlying Composite CPI in 2014. Local food inflation (including costs of dining out) stayed relatively steady amid retreating global food prices and slower inflation in the Mainland, and averaged 4.1% in 2014, slightly lower than 4.4% in 2013. The increase in the private housing rental component narrowed further, from 6.0% in 2013 to 5.2% in 2014, reflecting the progressive feed-through of slower increases in fresh-letting residential rentals during 2013. Meanwhile, the prices of many other components also registered milder increases in 2014 alongside slower economic growth and still-tame import prices. Yet, the prices of alcoholic drinks and tobacco saw visible year-on-year rises, upon the increases in cigarette prices following the announcement of the tobacco duty hike in the Budget in February 2014. On the other hand, the prices of durable goods continued their secular downtrend.
-3
0
3
6
9
12
15
18
Jan2010
Jan2011
Jan2012
Jan2013
Jan2014
-2
0
2
4
6
8
10
12
Underlying CCPI - private housingrentals (LHS)
Fresh-letting residential rentals(24-month moving average) (RHS)
Q12010
Q12011
Q12012
Q12013
Q12014
0
5
10
15Underlying CCPI - foodNominal wage indexMainland's food inflation
Year-on-year rate of change (%)Year-on-year rate of change (%)
Year-on-year rate of change (%)
Diagram 7.3 : Food and private housing rental components of the underlying CCPI(a) Food inflation held broadly steady in 2014 (b) Milder increases in fresh-letting rentals
continued to feed through
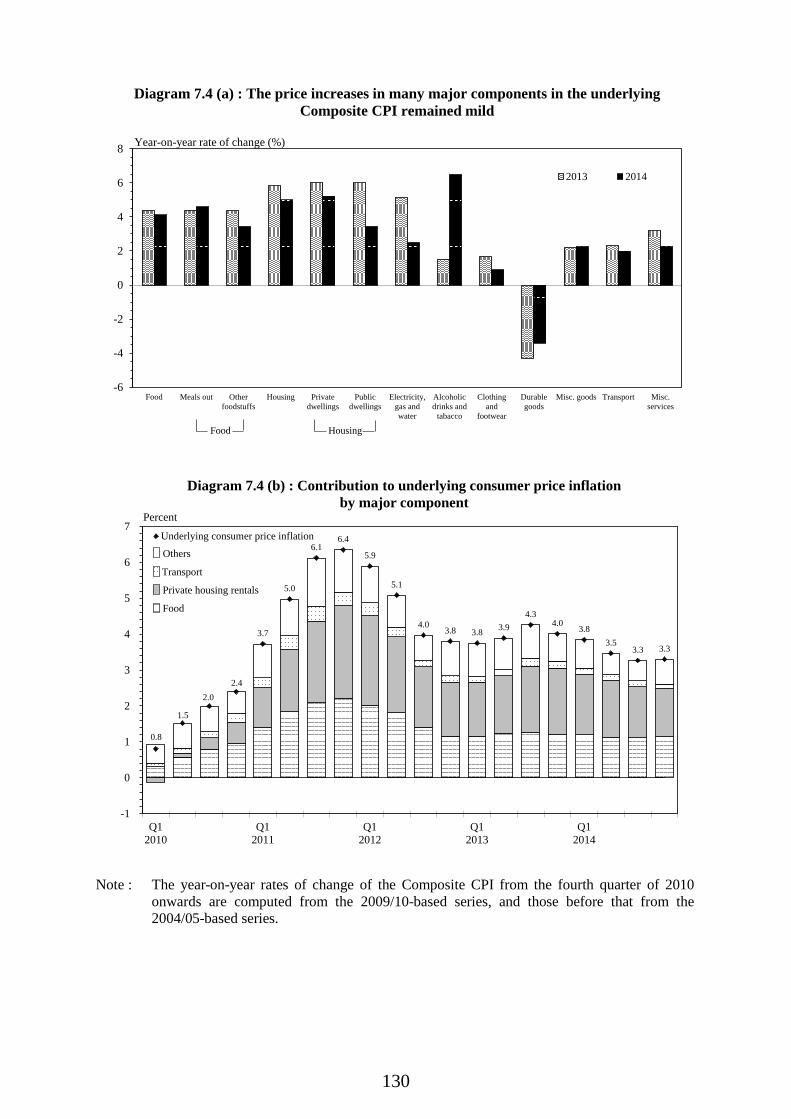
130
Note : The year-on-year rates of change of the Composite CPI from the fourth quarter of 2010
onwards are computed from the 2009/10-based series, and those before that from the 2004/05-based series.
0.8
1.5
2.0 2.4
3.7
5.0
6.1 6.4
5.9
5.1
4.0 3.8 3.8 3.9
4.3 4.0
3.8 3.5
3.3 3.3
-1
0
1
2
3
4
5
6
7
Q12010
Q12011
Q12012
Q12013
Q12014
Diagram 7.4 (b) : Contribution to underlying consumer price inflationby major component
Underlying consumer price inflation
Percent
Food
Private housing rentals
Transport
Others
-6
-4
-2
0
2
4
6
8
Food Meals out Otherfoodstuffs
Housing Privatedwellings
Publicdwellings
Electricity,gas andwater
Alcoholicdrinks and
tabacco
Clothingand
footwear
Durablegoods
Misc. goods Transport Misc.services
2013 2014
Diagram 7.4 (a) : The price increases in many major components in the underlying Composite CPI remained mild
Year-on-year rate of change (%)
Food Housing
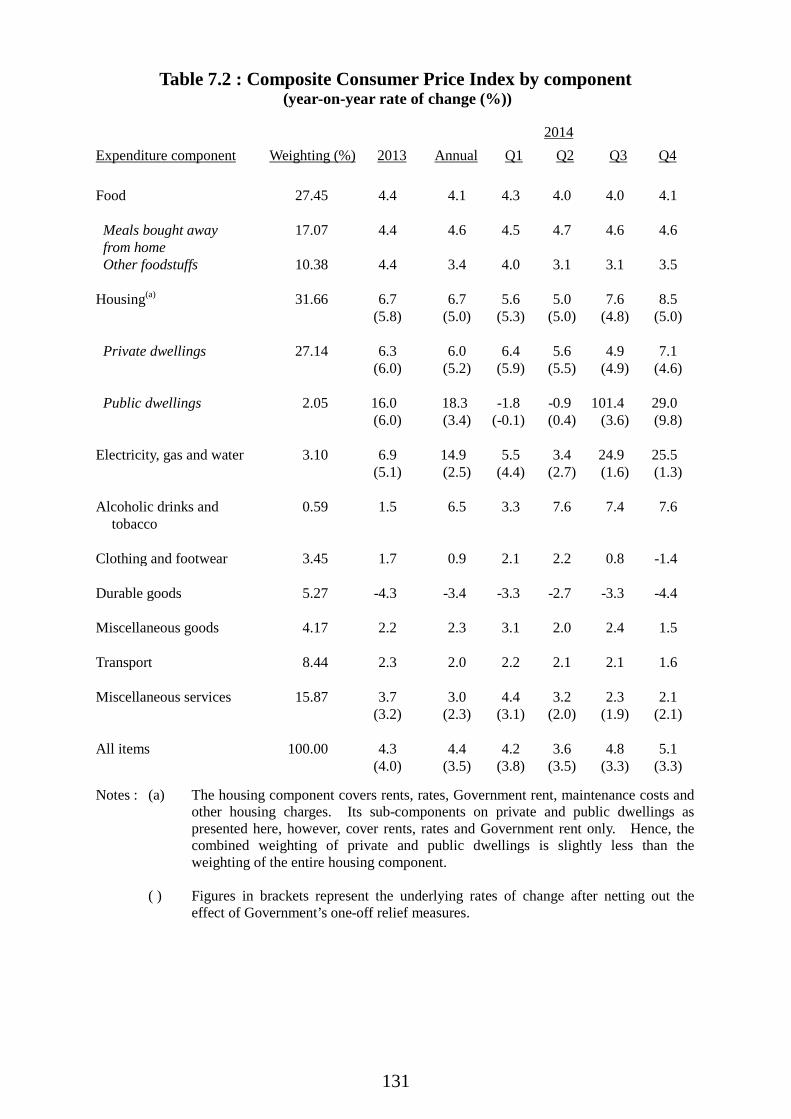
131
Table 7.2 : Composite Consumer Price Index by component (year-on-year rate of change (%))
2014 Expenditure component Weighting (%) 2013 Annual Q1 Q2 Q3 Q4 Food 27.45 4.4 4.1 4.3 4.0 4.0 4.1 Meals bought away from home
17.07 4.4 4.6 4.5 4.7 4.6 4.6
Other foodstuffs 10.38 4.4 3.4 4.0 3.1 3.1 3.5 Housing(a) 31.66 6.7 6.7 5.6 5.0 7.6 8.5 (5.8) (5.0) (5.3) (5.0) (4.8) (5.0) Private dwellings 27.14 6.3 6.0 6.4 5.6 4.9 7.1 (6.0) (5.2) (5.9) (5.5) (4.9) (4.6) Public dwellings 2.05 16.0 18.3 -1.8 -0.9 101.4 29.0
(6.0) (3.4) (-0.1) (0.4) (3.6) (9.8) Electricity, gas and water 3.10 6.9 14.9 5.5 3.4 24.9 25.5 (5.1) (2.5) (4.4) (2.7) (1.6) (1.3) Alcoholic drinks and
tobacco 0.59 1.5 6.5 3.3 7.6 7.4 7.6
Clothing and footwear 3.45 1.7 0.9 2.1 2.2 0.8 -1.4 Durable goods 5.27 -4.3 -3.4 -3.3 -2.7 -3.3 -4.4 Miscellaneous goods 4.17 2.2 2.3 3.1 2.0 2.4 1.5 Transport 8.44 2.3 2.0 2.2 2.1 2.1 1.6 Miscellaneous services 15.87 3.7 3.0 4.4 3.2 2.3 2.1
(3.2) (2.3) (3.1) (2.0) (1.9) (2.1)
All items 100.00 4.3 4.4 4.2 3.6 4.8 5.1 (4.0) (3.5) (3.8) (3.5) (3.3) (3.3)
Notes : (a) The housing component covers rents, rates, Government rent, maintenance costs and
other housing charges. Its sub-components on private and public dwellings as presented here, however, cover rents, rates and Government rent only. Hence, the combined weighting of private and public dwellings is slightly less than the weighting of the entire housing component.
( ) Figures in brackets represent the underlying rates of change after netting out the
effect of Government’s one-off relief measures.

132
Box 7.1
Recent movements of food and commodity prices in the international markets
International commodity prices are often subject to huge volatility, easily affected by a number of changing factors such as economic outlook, global monetary conditions, policy changes in the suppliers, weather conditions, and other factors influencing the demand-supply balance of the commodities. Among various commodity prices, those of food and, to a lesser extent, oil, can have a direct bearing on Hong Kong’s inflation. This note describes the recent movements of global food and commodity prices, and discusses their possible implications for Hong Kong’s imported inflation.
Recent trend of global food prices
According to the Food and Agriculture Organization of the United Nations (FAO) and the International Monetary Fund (IMF), global food prices were generally on a downward trend in 2013 but registered a jump on entering 2014, plausibly due to the extreme weather conditions in the US in the first quarter. Global food prices headed south again shortly afterwards, and continued to fall towards the end of 2014, as global food production was found to be abundant relative to demand given the rather disappointing global economic recovery (Chart 1). For 2014 as a whole, the FAO Food Price Index went down by an average of 3.8%.
According to the FAO’s latest report on food outlook(1), despite the decline in overall food price index, the latest supply/demand conditions in different food markets still exhibit considerable variations. Specifically, global cereal supply/demand balance is forecast to further loosen alongside the visible increases in wheat and maize production, with inventories expected to reach a new record high. On the other hand, there could be some price pressure for rice, which is the main staple food in Hong Kong, due to slightly deteriorated crop prospects amid erratic weather conditions. The global meat supply is also projected to grow only modestly because of supply side constraints and trade restrictions, thereby providing some support to the meat price. As to sugar and fish, the global supply conditions are still favourable relative to demand. (1) Food Outlook, Biannual Report on Global Food Markets (October 2014 issue), FAO.
80
100
120
140
160
180
200
1/09 7/09 1/10 7/10 1/11 7/11 1/12 7/12 1/13 7/13 1/14 7/14
FAO and IMF food price indicesFAO food price index
IMF food price index
Index (Jan 2009 = 100)Chart 1 : Global food prices generally continued the easing trend in 2013 and 2014
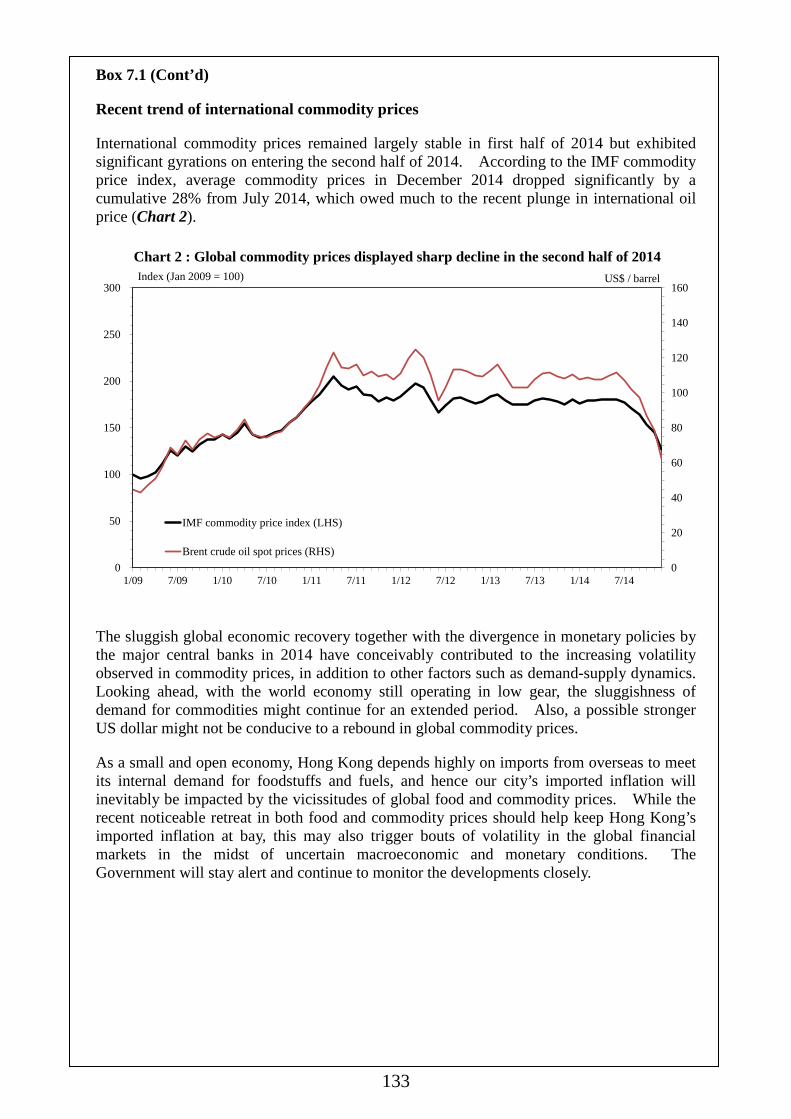
133
Box 7.1 (Cont’d)
Recent trend of international commodity prices
International commodity prices remained largely stable in first half of 2014 but exhibited significant gyrations on entering the second half of 2014. According to the IMF commodity price index, average commodity prices in December 2014 dropped significantly by a cumulative 28% from July 2014, which owed much to the recent plunge in international oil price (Chart 2).
The sluggish global economic recovery together with the divergence in monetary policies by the major central banks in 2014 have conceivably contributed to the increasing volatility observed in commodity prices, in addition to other factors such as demand-supply dynamics. Looking ahead, with the world economy still operating in low gear, the sluggishness of demand for commodities might continue for an extended period. Also, a possible stronger US dollar might not be conducive to a rebound in global commodity prices.
As a small and open economy, Hong Kong depends highly on imports from overseas to meet its internal demand for foodstuffs and fuels, and hence our city’s imported inflation will inevitably be impacted by the vicissitudes of global food and commodity prices. While the recent noticeable retreat in both food and commodity prices should help keep Hong Kong’s imported inflation at bay, this may also trigger bouts of volatility in the global financial markets in the midst of uncertain macroeconomic and monetary conditions. The Government will stay alert and continue to monitor the developments closely.
0
20
40
60
80
100
120
140
160
0
50
100
150
200
250
300
1/09 7/09 1/10 7/10 1/11 7/11 1/12 7/12 1/13 7/13 1/14 7/14
IMF commodity price index (LHS)
Brent crude oil spot prices (RHS)
Index (Jan 2009 = 100) US$ / barrel
Chart 2 : Global commodity prices displayed sharp decline in the second half of 2014

134
Costs of factor inputs and import prices
7.4 Domestic cost pressures were largely contained in 2014. Upward pressures on shop rentals lessened alongside the moderation in growth of retail sales, albeit with a slight pick-up in the fourth quarter. The year-on-year rises in office rentals were likewise moderate. Meanwhile, labour cost increases also went slightly slower, when compared to 2013.
Q12010
Q12011
Q12012
Q12013
Q12014
-2
0
2
4
6
8
10
12
14
16
18Overall import pricesImport prices of foodstuffsImport prices of capital goodsImport prices of consumer goodsImport prices of raw materials
Year-on-year rate of change (%)
and semi-manufactures
Diagram 7.5 : Domestic cost pressures stayed contained in 2014, while import price pressures remained tame
(a) Commercial rentals and labour cost (b) Import prices by selected end-use category
Jan2012
Jan2013
Jan2014
0
5
10
15
20Nominal wage indexOffice rental indexShop rental index
Year-on-year rate of change (%)
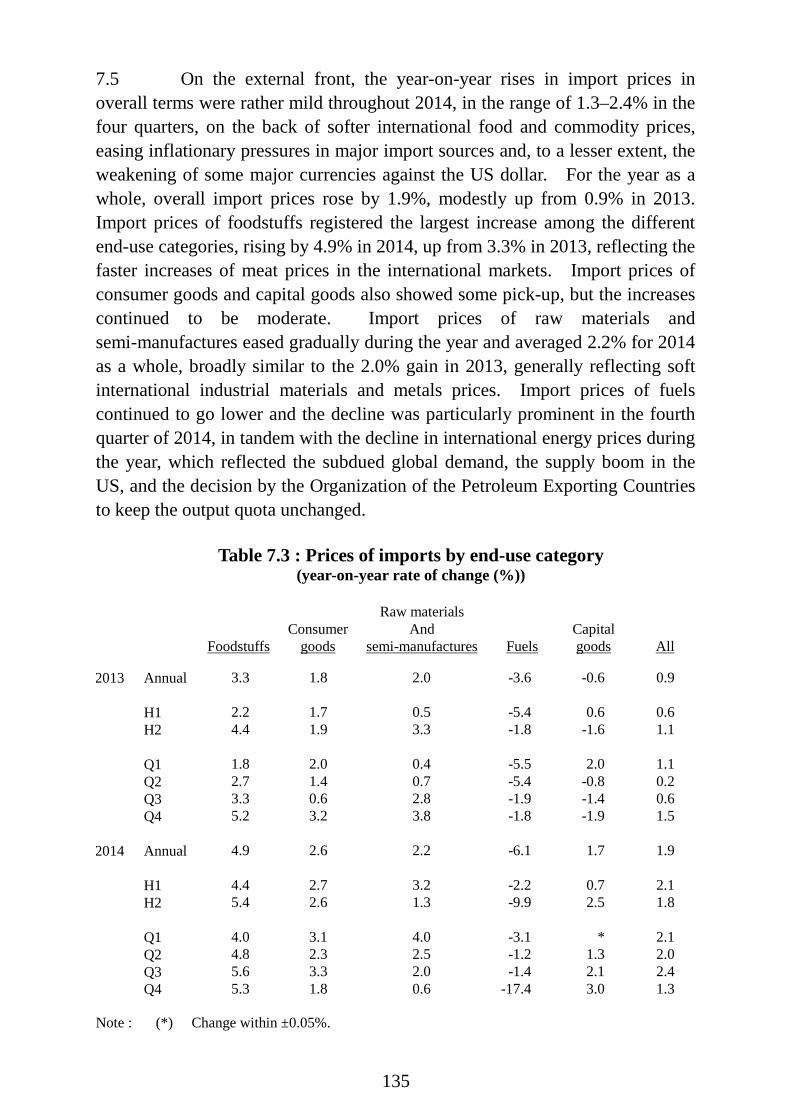
135
7.5 On the external front, the year-on-year rises in import prices in overall terms were rather mild throughout 2014, in the range of 1.3–2.4% in the four quarters, on the back of softer international food and commodity prices, easing inflationary pressures in major import sources and, to a lesser extent, the weakening of some major currencies against the US dollar. For the year as a whole, overall import prices rose by 1.9%, modestly up from 0.9% in 2013. Import prices of foodstuffs registered the largest increase among the different end-use categories, rising by 4.9% in 2014, up from 3.3% in 2013, reflecting the faster increases of meat prices in the international markets. Import prices of consumer goods and capital goods also showed some pick-up, but the increases continued to be moderate. Import prices of raw materials and semi-manufactures eased gradually during the year and averaged 2.2% for 2014 as a whole, broadly similar to the 2.0% gain in 2013, generally reflecting soft international industrial materials and metals prices. Import prices of fuels continued to go lower and the decline was particularly prominent in the fourth quarter of 2014, in tandem with the decline in international energy prices during the year, which reflected the subdued global demand, the supply boom in the US, and the decision by the Organization of the Petroleum Exporting Countries to keep the output quota unchanged.
Table 7.3 : Prices of imports by end-use category (year-on-year rate of change (%))
Foodstuffs
Consumer
goods
Raw materials And
semi-manufactures
Fuels
Capital goods
All
2013 Annual 3.3 1.8 2.0 -3.6 -0.6 0.9 H1 2.2 1.7 0.5 -5.4 0.6 0.6 H2 4.4 1.9 3.3 -1.8 -1.6 1.1 Q1 1.8 2.0 0.4 -5.5 2.0 1.1 Q2 2.7 1.4 0.7 -5.4 -0.8 0.2 Q3 3.3 0.6 2.8 -1.9 -1.4 0.6 Q4 5.2 3.2 3.8 -1.8 -1.9 1.5 2014 Annual 4.9 2.6 2.2 -6.1 1.7 1.9 H1 4.4 2.7 3.2 -2.2 0.7 2.1 H2 5.4 2.6 1.3 -9.9 2.5 1.8 Q1 4.0 3.1 4.0 -3.1 * 2.1 Q2 4.8 2.3 2.5 -1.2 1.3 2.0 Q3 5.6 3.3 2.0 -1.4 2.1 2.4 Q4 5.3 1.8 0.6 -17.4 3.0 1.3 Note : (*) Change within ±0.05%.

136
-4
0
4
8
12
16
Q12010
Q12011
Q12012
Q12013
Q12014
-16
-12
-8
-4
0
4
Import-weighted nominal effective exchange rateindex of the Hong Kong dollar (LHS, inverted)Prices of imports of consumer goods (RHS)
Year-on-year rate of change (%)
Year-on-year rate of change (%)
-20
0
20
40
60
Q12010
Q12011
Q12012
Q12013
Q12014
-10
0
10
20
30Mainland's retail price index for food items (LHS)
Prices of imports of foodstuffs (LHS)
FAO food price index (RHS)
Year-on-yearrate of change (%)
Diagram 7.6 : Import prices by end-use category
Year-on-yearrate of change (%)
(a) Imported food inflation picked up somewhat in 2014 (b) Import prices of consumer goods rose slightly faster
An increase in the nominal EERI indicates strengthening of the Hong Kong dollar. The y-axis of nominal EERI in this graph is inverted for easier comprehension.
Note :
-5
0
5
10
15
Q12010
Q12011
Q12012
Q12013
Q12014
-20
0
20
40
60CRB spot index (LHS)Prices of imports of raw materials
Year-on-year rate of change (%)
and semi-manufactures (RHS)
Year-on-year rate of change (%)
Q12010
Q12011
Q12012
Q12013
Q12014
-40
-20
0
20
40
60
80North Sea BrentPrices of imports of fuels
Year-on-year rate of change (%)
(c) Import prices of raw materials decelerated alongside softer international commodity prices
(d) Import prices of fuels continued to decline

137
Output prices
7.6 Output prices, as measured by the Producer Price Indices(3), displayed rather diverse movements across sectors in the first three quarters of 2014. Output prices for the manufacturing sector reverted to show a modest year-on-year increase in the third quarter of 2014, having declined since the second quarter of 2013. This was mainly attributable to higher output prices for “metal, computer, electronic and optical products, machinery and equipment”. Among the services sectors, output prices for accommodation services increased further amid fast increases in visitor arrivals. The year-on-year increases in output prices for land transport and courier services in the first three quarters were moderate, alongside some pick-up in trade flows during the second and third quarters. Output prices for air transport and water transport reverted back to increases in the third quarter, after declining in the first half of 2014. Separately, output prices for telecommunications services stayed on a downtrend, reflecting the continued adoption of cost-saving technologies and intense competition.
Table 7.4 : Producer Price Indices for the manufacturing sector
and selected services sectors (year-on-year rate of change (%))
2013
2014
Industry group
Annual Q1 Q2 Q3 Q4 Q1-Q3 Q1 Q2 Q3
Manufacturing
-3.1 0.6 -2.4 -5.2 -5.5 -1.9 -6.2 -0.4 1.3
Selected services sectors(a)
Accommodation services
2.4 2.5 2.8 1.7 2.6 3.3 2.2 3.9 4.0
Land transport
1.7 0.6 1.0 2.4 2.7 2.8 2.5 3.0 2.9
Water transport
-2.5 7.3 -14.8 1.8 -1.9 -0.4 -2.9 -0.6 2.5
Air transport
1.0 4.0 -2.4 0.1 2.5 -0.1 -0.6 -1.8 1.9
Telecommunications
-1.9 -1.6 -1.8 -1.7 -2.6 -3.5 -2.9 -3.4 -4.2
Courier services 2.7 2.7 3.1 3.3 1.8 1.4 1.9 1.4 0.9 Note : (a) Producer Price Indices for other services sectors are not available, due to the
difficulties involved in defining and delineating the various types of services and hence in measuring their respective price changes. This is particularly so for such sectors as banking and insurance, where the producers often do not charge their customers explicitly.

138
GDP deflator 7.7 As a broad measure of the overall change in prices in the economy, the GDP deflator(4) rose by 3.0% in 2014, up from a 1.7% increase in 2013. Within the GDP deflator, the terms of trade(5) was virtually unchanged in 2014. Taking out the external components, the domestic demand deflator rose by 3.0% in 2014, up from the 1.2% increase in 2013, largely reflecting a much narrower decline in prices for machinery and equipment.
Q12010
Q12011
Q12012
Q12013
Q12014
-4
-2
0
2
4
6
GDP deflatorDomestic demand deflator
Year-on-year rate of change (%)
(a) GDP deflator rose moderately in 2014
Q12010
Q12011
Q12012
Q12013
Q12014
-4
-2
0
2
4
6
GDP deflatorTerms of trade in goods and services
Year-on-year rate of change (%)
Diagram 7.7 : GDP deflator
(b) Terms of trade stayed virtually unchanged
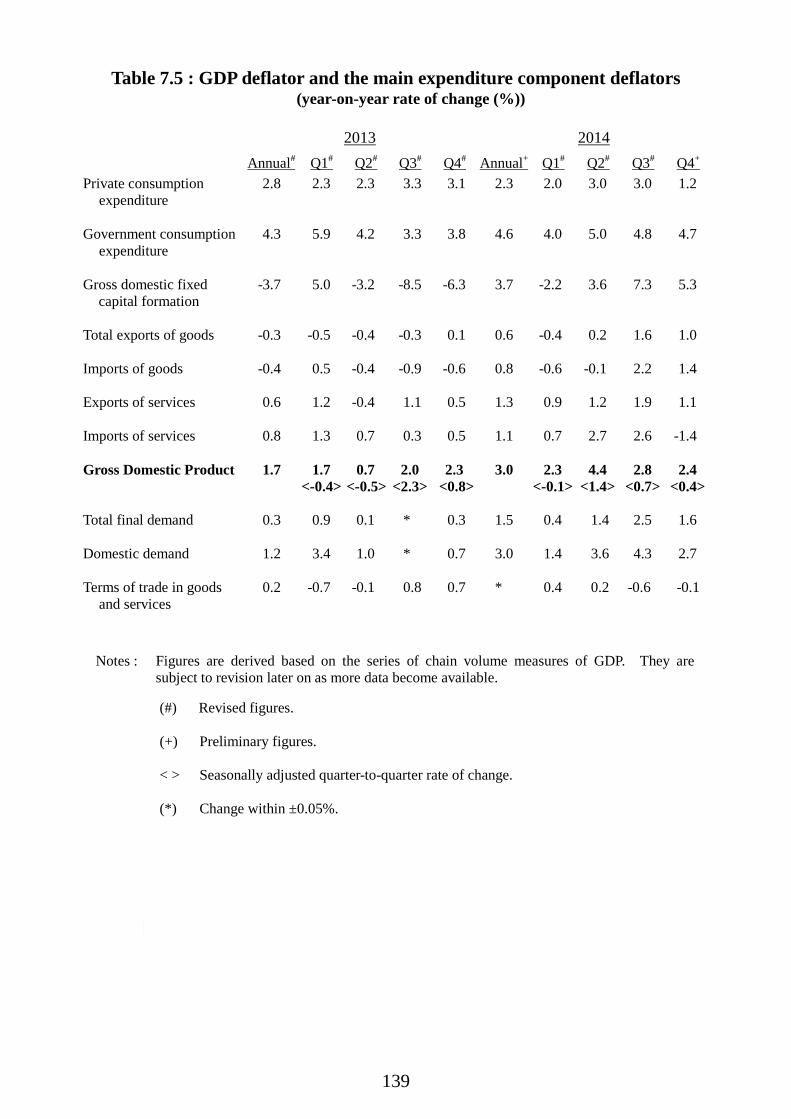
139
Table 7.5 : GDP deflator and the main expenditure component deflators (year-on-year rate of change (%))
2013 2014 Annual# Q1# Q2# Q3# Q4# Annual+ Q1# Q2# Q3# Q4+
Private consumption expenditure
2.8 2.3 2.3 3.3 3.1 2.3 2.0 3.0 3.0 1.2
Government consumption expenditure
4.3 5.9 4.2 3.3 3.8 4.6 4.0 5.0 4.8 4.7
Gross domestic fixed capital formation
-3.7 5.0 -3.2 -8.5 -6.3 3.7 -2.2 3.6 7.3 5.3
Total exports of goods
-0.3 -0.5 -0.4 -0.3 0.1 0.6 -0.4 0.2 1.6 1.0
Imports of goods
-0.4 0.5 -0.4 -0.9 -0.6 0.8 -0.6 -0.1 2.2 1.4
Exports of services
0.6 1.2 -0.4 1.1 0.5 1.3 0.9 1.2 1.9 1.1
Imports of services
0.8 1.3 0.7 0.3 0.5 1.1 0.7 2.7 2.6 -1.4
Gross Domestic Product
1.7 1.7 <-0.4>
0.7 <-0.5>
2.0 <2.3>
2.3 <0.8>
3.0 2.3 <-0.1>
4.4 <1.4>
2.8 <0.7>
2.4 <0.4>
Total final demand
0.3 0.9 0.1 * 0.3 1.5 0.4 1.4 2.5 1.6
Domestic demand
1.2 3.4 1.0 * 0.7 3.0 1.4 3.6 4.3 2.7
Terms of trade in goods and services
0.2 -0.7 -0.1 0.8 0.7 * 0.4 0.2 -0.6 -0.1
Notes : Figures are derived based on the series of chain volume measures of GDP. They are subject to revision later on as more data become available.
(#) Revised figures. (+) Preliminary figures.
< > Seasonally adjusted quarter-to-quarter rate of change. (*) Change within ±0.05%.

140
Notes : (1) The Consumer Price Indices (A), (B) and (C) are compiled by reference to the average
expenditure patterns for different groups of households as obtained from the Household Expenditure Survey. Then, by aggregating the expenditure patterns of all the households covered by the above three indices, a Composite CPI is compiled.
The expenditure ranges of the households covered in the 2009/10-based CPIs are shown
below:
Approximate proportion of households covered
Average monthly expenditure range during Oct 2009 to Sep 2010
(%) ($) CPI(A) 50 4,500 to 18,499 CPI(B) 30 18,500 to 32,499 CPI(C) 10 32,500 to 65,999
The weightings of the various components in the 2009/10-based CPIs are as follows:
Expenditure component
Composite CPI
CPI(A)
CPI(B)
CPI(C)
(%) (%) (%) (%) Food 27.45 33.68 27.16 20.87 Meals bought away from
home 17.07 19.23 17.90 13.55
Other foodstuffs 10.38 14.45 9.26 7.32 Housing 31.66 32.19 31.43 31.36 Private dwellings 27.14 24.78 28.13 28.45 Public dwellings 2.05 5.49 0.72 -- Maintenance costs and
other housing charges 2.47 1.92 2.58 2.91
Electricity, gas and water 3.10 4.36 2.84 2.03 Alcoholic drinks and
tobacco 0.59 0.91 0.56 0.29
Clothing and footwear 3.45 2.60 3.45 4.39 Durable goods 5.27 3.73 5.73 6.39 Miscellaneous goods 4.17 3.87 4.17 4.49 Transport 8.44 7.22 8.35 9.93 Miscellaneous services
15.87 11.44 16.31 20.25
All items 100.00 100.00 100.00 100.00
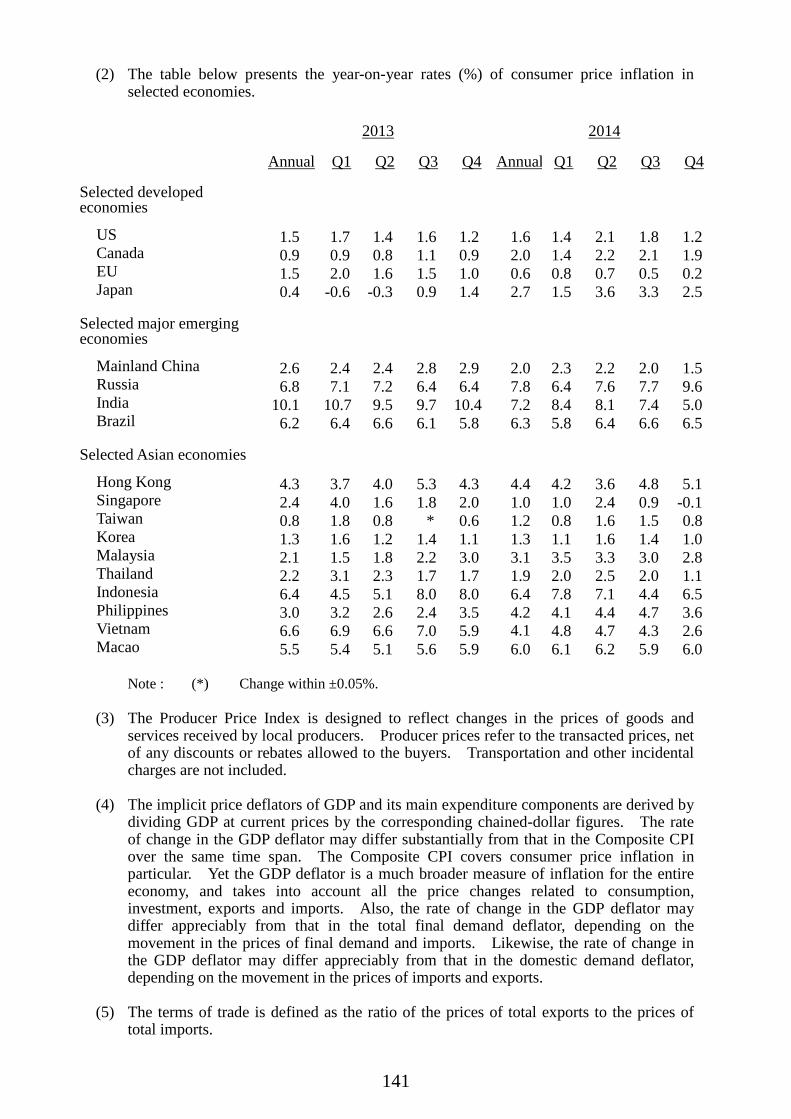
141
(2) The table below presents the year-on-year rates (%) of consumer price inflation in selected economies.
2013 2014
Annual Q1 Q2 Q3 Q4 Annual Q1 Q2 Q3 Q4
Selected developed economies
US 1.5 1.7 1.4 1.6 1.2 1.6 1.4 2.1 1.8 1.2 Canada 0.9 0.9 0.8 1.1 0.9 2.0 1.4 2.2 2.1 1.9 EU 1.5 2.0 1.6 1.5 1.0 0.6 0.8 0.7 0.5 0.2 Japan 0.4 -0.6 -0.3 0.9 1.4 2.7 1.5 3.6 3.3 2.5
Selected major emerging economies
Mainland China 2.6 2.4 2.4 2.8 2.9 2.0 2.3 2.2 2.0 1.5 Russia 6.8 7.1 7.2 6.4 6.4 7.8 6.4 7.6 7.7 9.6 India 10.1 10.7 9.5 9.7 10.4 7.2 8.4 8.1 7.4 5.0 Brazil 6.2 6.4 6.6 6.1 5.8 6.3 5.8 6.4 6.6 6.5
Selected Asian economies
Hong Kong 4.3 3.7 4.0 5.3 4.3 4.4 4.2 3.6 4.8 5.1 Singapore 2.4 4.0 1.6 1.8 2.0 1.0 1.0 2.4 0.9 -0.1 Taiwan 0.8 1.8 0.8 * 0.6 1.2 0.8 1.6 1.5 0.8 Korea 1.3 1.6 1.2 1.4 1.1 1.3 1.1 1.6 1.4 1.0 Malaysia 2.1 1.5 1.8 2.2 3.0 3.1 3.5 3.3 3.0 2.8 Thailand 2.2 3.1 2.3 1.7 1.7 1.9 2.0 2.5 2.0 1.1 Indonesia 6.4 4.5 5.1 8.0 8.0 6.4 7.8 7.1 4.4 6.5 Philippines 3.0 3.2 2.6 2.4 3.5 4.2 4.1 4.4 4.7 3.6 Vietnam 6.6 6.9 6.6 7.0 5.9 4.1 4.8 4.7 4.3 2.6 Macao 5.5 5.4 5.1 5.6 5.9 6.0 6.1 6.2 5.9 6.0
Note : (*) Change within ±0.05%. (3) The Producer Price Index is designed to reflect changes in the prices of goods and
services received by local producers. Producer prices refer to the transacted prices, net of any discounts or rebates allowed to the buyers. Transportation and other incidental charges are not included.
(4) The implicit price deflators of GDP and its main expenditure components are derived by
dividing GDP at current prices by the corresponding chained-dollar figures. The rate of change in the GDP deflator may differ substantially from that in the Composite CPI over the same time span. The Composite CPI covers consumer price inflation in particular. Yet the GDP deflator is a much broader measure of inflation for the entire economy, and takes into account all the price changes related to consumption, investment, exports and imports. Also, the rate of change in the GDP deflator may differ appreciably from that in the total final demand deflator, depending on the movement in the prices of final demand and imports. Likewise, the rate of change in the GDP deflator may differ appreciably from that in the domestic demand deflator, depending on the movement in the prices of imports and exports.
(5) The terms of trade is defined as the ratio of the prices of total exports to the prices of
total imports.

142
Calendar of Events of Significance for the Hong Kong Economy in 2014
1 Jan The liberalisation measures under Supplement X to the Mainland and Hong Kong Closer
Economic Partnership Arrangement (CEPA) came into effect. Inclusive of measures in Supplement X, there are 403 liberalisation measures for trade in services, enabling Hong Kong service suppliers to have preferential access to the Mainland market. The number of products with rules of origin agreed under CEPA was increased to 1 788. New regulatory regime on electronic trading of securities came into effect requiring market intermediaries to ensure electronic trading activities do not pose undue risks to the market.
6 Jan The Government announced the tendering of 10-year Government Bonds, totalling $1 billion, through the re-opening of an existing 10-year Government Bond issue under the Institutional Bond Issuance Programme of the Government Bond Programme.
7 Jan The Financial Services and the Treasury Bureau (FSTB), the Hong Kong Monetary Authority (HKMA), the Securities and Futures Commission (SFC) and the Insurance Authority jointly launched the 3-month first stage of public consultation on establishing an effective resolution regime for financial institutions, including financial market infrastructures, in Hong Kong.
14 Jan The Heritage Foundation and the Wall Street Journal released the 2014 Index of Economic Freedom. Hong Kong was rated the freest economy in the world for the 20th consecutive year.
15 Jan The Chief Executive (CE) presented the 2014 Policy Address, formulating strategic directions and measures to support those in need, nurture the next generation and underpin Hong Kong’s economic future, including: (a) introduction of the Low-income Working Family Allowance, with aims to relieve
the financial burden of low-income working families not receiving Comprehensive Social Security Assistance (CSSA) (especially those with children), as well as to promote self-reliance and upward social mobility;
(b) establishment of the Lantau Development Advisory Committee to advise the Government on the economic and social development strategy for Lantau to capitalise on the benefits brought by major infrastructure projects in the area, so as to meet Hong Kong’s long-term needs while balancing between development and conservation;
(c) accepting the recommendation of the Steering Committee of the Long Term Housing Strategy to increase land and housing supply;
(d) increasing the number of Economic and Trade Offices in the Mainland and the rest of Asia to enhance our liaison work and tap new markets, and commence formal negotiations for a Hong Kong-ASEAN Free Trade Agreement (FTA);
(e) following up on recommendations from the Financial Services Development Council to strengthen Hong Kong’s position as an international financial centre; and
(f) earmarking $1 billion for setting up a Recycling Fund to promote the sustainable development of the local recycling industry.
23 – 25 Jan CE led a trade delegation to Fujian, to enhance the trade’s understanding about the latest
business environment and investment opportunities in Fujian and to facilitate exchanges

143
and co-operation between the enterprises of both places. During the visit, he called on the leaders of the Government of the Fujian Province, the Fuzhou Municipal Government and the Xiamen Municipal Government.
24 Jan The SFC authorised the world’s first physical Renminbi Qualified Foreign Institutional Investor (RQFII) bond exchange-traded fund (ETF) tracking an onshore Mainland government bond index. The SFC held its first Regulatory Forum on the theme “New perspectives on the future of regulation in the aftermath of the Global Financial Crisis”, attracting close to 500 senior leaders from the financial industry, government, regulatory and professional bodies and academia.
10 Feb The Government announced the tendering of 5-year Government Bonds, totalling $3 billion, under the Institutional Bond Issuance Programme of the Government Bond Programme.
13 Feb The Customs and Excise Department (C&ED) and Korea Customs signed an arrangement whereby the Authorized Economic Operator (AEO) programmes of the signatories will be mutually recognised, enabling the AEOs to enjoy clearance facilitation for their goods traded between the two sides.
17 Feb The SFC authorised the first RQFII A-share ETF managed by a subsidiary of a Mainland securities company.
22 Feb The Stamp Duty (Amendment) Ordinance 2014 was passed by the Legislative Council to enhance the Special Stamp Duty and introduce the Buyer’s Stamp Duty to combat short-term speculative activities on residential properties and accord priority to the home ownership needs of Hong Kong permanent residents in the midst of the tight housing supply situation, with a view to ensuring healthy and stable development of the residential property market.
26 Feb The Financial Secretary (FS) delivered the Budget for the financial year 2014-15, unveiling a package of measures to boost Hong Kong’s economy and sharpen the city’s competitive edge, and improve people’s livelihood, and outlining the Government's long-term financial planning strategy. To strengthen Hong Kong’s competitiveness and efficiency, FS proposed a comprehensive strategy, not only to improve flows of people, goods, capital and information, but also for enhancing Hong Kong’s quality of life and position as an international hub. In promoting the economy, FS proposed a range of measures to maintain a favourable business environment and to open up more markets for enterprises, including measures to support innovation and technology industry, further develop Hong Kong’s four pillar industries, and strengthen support for small and medium-sized enterprises in the areas of financing, market expansion, brand building and productivity enhancement. FS proposed to increase investment in people, and to specifically strengthen life planning, vocational education and training for the youth, to ensure that Hong Kong has the suitable manpower to support social and economic development. In caring for people’s livelihood, substantial resources were allocated for elderly services and healthcare services. In addition, FS put forward a package of relief measures, including extra allowance to recipients of the CSSA and other social security schemes,

144
paying rent for public housing tenants, and the following measures: (a) reduce 2013-14 profits tax, salaries tax and tax under personal assessment by 75%,
subject to a ceiling of $10,000 per case; (b) increase the basic and additional allowances for maintaining dependent parents or
grandparents; (c) increase the deduction ceiling for elderly residential care expenses for parents or
grandparents; and (d) waive rates for the first two quarters of 2014-15, subject to a ceiling of $1,500 per
quarter for each rateable property. Based on the Working Group on Long-Term Fiscal Planning's report, FS proposed several measures to ensure the sustainability of public finances in three main areas, namely containing expenditure growth, preserving the revenue base and saving for the future. FS proposed that Hong Kong could consider setting up a savings scheme to prepare for the future, taking reference from the experience of other economies; with a view to taking early action to address the possible structural deficit when public finances are still healthy. The 2013 Economic Background and 2014 Prospects were published along with the 2014-15 Budget. Real Gross Domestic Product (GDP) growth in 2014 was forecast to be 3-4%, while the headline and underlying Composite Consumer Price Indices (CPI) were forecast to average 4.6% and 3.7% respectively. The Government announced the tendering of 2-year Government Bonds, totalling $3.5 billion, through the re-opening of an existing 3-year Government Bond issue under the Institutional Bond Issuance Programme of the Government Bond Programme.
27 Feb The Government announced the 2014-15 Land Sale Programme (LSP). The LSP included 34 residential sites (capable of providing about 15 500 flats), seven commercial/business sites and one hotel site. The SFC launched a consultation on the future regulation of alternative liquidity pools (ALPs, also known as alternative trading systems and dark pools).
28 Feb The Stamp Duty (Amendment) Ordinance 2014 was published in the Gazette. The law has retrospective effect from 27 October 2012. The Ordinance extended the property holding period for charging Special Stamp Duty (“SSD”) from 24 months to 36 months and increased the SSD rates. It also introduced the Buyer’s Stamp Duty on the transactions of residential properties. The SFC authorised the first RQFII money market fund.
1 Mar The Hong Kong Mortgage Corporation Limited extended the application period of the special 80% loan guarantee product offered at a concessionary level of guarantee fee under its Small and Medium Enterprise (SME) Financing Guarantee Scheme for one year until 28 February 2015, as one of the measures announced in the 2014-15 Budget to provide enhanced support for our enterprises.
3 Mar The Working Group on Long-Term Fiscal Planning completed a fiscal sustainability appraisal on the public finances in Hong Kong and released its report. The new Companies Ordinance commenced operation to provide a modernised legal framework for the incorporation and operation of companies in Hong Kong. Its

145
objectives are to enhance corporate governance, ensure better regulation, facilitate business and modernise the law with a view to strengthening Hong Kong’s competitiveness as an international commercial and financial centre.
10 Mar The Chief Secretary for Administration (CS) and the Vice-Governor of Guangdong Province co-chaired the 19th Working Meeting of the Hong Kong/Guangdong Co-operation Joint Conference in Hong Kong. At the meeting, the two sides signed the detailed 2014 Work Plan for Hong Kong-Guangdong Co-operation, and discussed the implementation strategy. The Hong Kong International Airport (HKIA) won an Air Cargo Award of Excellence under the “Airports Asia – 1 million or more tonnes” category. The Award is organised annually by Air Cargo World.
16 Mar The Investment Promotion and Protection Agreement between Hong Kong and Finland entered into force. The agreement will facilitate investment and trade flows between Hong Kong and Finland, benefiting the economic development of both places.
19 Mar The Environment Bureau (ENB) launched a 3-month public consultation on the Future Fuel Mix for Electricity Generation. Two fuel mix options were put forward, i.e. (a) to import more electricity through purchase from the Mainland power grid, and (b) to use more natural gas for local generation, to solicit public views. The Inland Revenue (Amendment) (No. 3) Bill 2013 was enacted by the Legislative Council to provide 50% reduction in profits tax for captive insurers on their insurance business of offshore risks. The concession takes effect from the year of assessment 2013/14 onwards.
25 Mar The Hong Kong Special Administrative Region (HKSAR) Government and the Government of the United States of America signed an Agreement for the Exchange of Information relating to Taxes.
26 Mar The Securities and Futures (Amendment) Ordinance 2014 was enacted by the Legislative Council to provide for a regulatory framework for the over-the-counter derivative market in Hong Kong to meet the relevant commitments of the Group of Twenty. The Loans (Amendment) Ordinance 2014, which enables the Government to issue Islamic bond (sukuk) under the Government Bond Programme, was enacted by the Legislative Council.
31 Mar The Airport Authority (AA) set profit record of $6.45 billion for the financial year ended 31 March 2014. The Government announced the tendering of 3-year Government Bonds, totalling $3 billion, under the Institutional Bond Issuance Programme of the Government Bond Programme.
1 Apr The $100 million Maritime and Aviation Training Fund was launched to support the manpower development of the maritime and aviation sectors over a period of five years.
9 Apr An International Monetary Fund (IMF) staff mission to Hong Kong endorsed the Government’s proactive policies to reinforce the resilience of the economy and the financial system, and reiterated that the Linked Exchange Rate System was the best arrangement for Hong Kong.
146
9 – 10 Apr CE attended the Boao Forum for Asia Annual Conference 2014 in Hainan.
10 Apr The SFC and the China Securities Regulatory Commission (CSRC) jointly announced
their approval in principle for the development of the Shanghai-Hong Kong Stock Connect pilot scheme.
14 Apr The HKMA and Bank Negara Malaysia (Central Bank of Malaysia), supported by the Treasury Markets Association (TMA), jointly organised an Islamic finance conference in Hong Kong to promote sukuk as a viable financing and investment instrument amongst business and financial community from Hong Kong and China.
24 Apr Development Bureau (DEVB) signed the “Memorandum of Cooperation on Engagement of Hong Kong Consultancy Firms on Pilot Basis in the Supervision Work for Foreign Aid Construction Projects” with the Ministry of Commerce to promote Hong Kong consultancy firms’ participation in the supervision work for Mainland’s foreign aid construction projects.
24 – 25 Apr FS attended the Fourth Economic and Financial Forum in Beijing.
25 Apr The Insurance Companies (Amendment) Bill 2014 was gazetted. The Bill provides for the establishment of an independent Insurance Authority and a statutory licensing regime for insurance intermediaries to replace the existing self-regulatory system.
28 Apr Hong Kong’s credit rating agency (CRA) regime was recognised by the European Commission as equivalent to the regime in the European Union (EU). This allows smaller CRAs in Hong Kong to apply for EU certification and enables their ratings to be used by EU financial institutions for regulatory purposes.
30 Apr The Government announced a switch tender of 10-year Government Bonds of an additional amount of $0.8 billion, through the re-opening of an existing Government Bond issue and early redemption of another existing Government bond issue under the Institutional Bond Issuance Programme of the Government Bond Programme. The SFC published a circular containing a set of guidance on internal product approval process applicable to product providers of SFC-authorised products under the SFC Products Handbook, covering the entire chain from inception of the product to post-sale; and reminding product providers to consider investors’ interests as part of the product-design process.
8 May The European Commission published its 16th annual report on Hong Kong, which continued to affirm the co-operation between the EU and Hong Kong in areas including trade, investment, and dialogue on issues of mutual interest, as well as recognise Hong Kong’s strategic importance as a trading and investment partner for the EU.
10 – 16 May CE visited Sweden and Belgium and met with political and business leaders there including leaders of the European Commission. During the visit, he also visited leading academic institutes in the fields of medical research and technology.
14 May The Ministry of Finance of the People’s Republic of China announced the tendering in Hong Kong of a total of RMB7 billion 3-year RMB Bonds, RMB4 billion 5-year RMB Bonds, RMB1 billion 7-year RMB Bonds, RMB1 billion 10-year RMB Bonds, RMB0.5 billion 15-year RMB Bonds and RMB0.5 billion 20-year RMB Bonds of the Central People’s Government.

147
16 May The Government released the preliminary GDP figures for the first quarter of 2014.
Hong Kong’s economic growth remained moderate at 2.5% year-on-year in real terms. While merchandise exports were sluggish amid slow improvements in the advanced markets, services exports and the domestic sector kept expanding, thereby maintaining the labour market in a state of full employment. In the May update of the economic forecast for 2014, the forecast growth rate in real terms of GDP was maintained at 3-4%. The forecast rates of increase in the headline and underlying Composite CPI were also maintained at 4.6% and 3.7% respectively.
22 May The Second Hong Kong – Australia Renminbi Trade and Investment Dialogue (Dialogue), facilitated by the HKMA, Australian Treasury, and the Reserve Bank of Australia (RBA) was held to discuss on how corporates, financial institutions, and investors can take advantage of the latest policy developments to strengthen Renminbi (RMB) trade and investment links with Mainland China, as well as to make use of offshore RMB capital markets to meet their funding and investment needs. The dialogue was attended by over 130 representatives from corporates and financial institutions.
23 May The IMF published the report on the Financial System Stability Assessment under the Financial Sector Assessment Programme which commended Hong Kong's financial system as very well regulated and resilient and acknowledged that Hong Kong's financial sector was one of the largest and most developed in the world, ranking first in the World Economic Forum Financial Development Index. The report noted that the quality of micro-prudential and macro-prudential oversight in Hong Kong - including the intensity of supervision, comprehensiveness of risk assessment, active use of macroprudential policies - had helped ensure the system’s resilience to the 2008 global financial crisis. The IMF also recognised that Hong Kong had developed a set of multi-currency financial market infrastructure, which was highly-sophisticated and supported by effective oversight and supervision.
28 May The Government announced the consultation conclusions on the legislative proposals to improve Hong Kong’s corporate insolvency law.
1 Jun The maximum level of relevant income for making Mandatory Provident Fund (MPF) mandatory contributions was increased from $25,000 to $30,000 per month.
6 Jun The SFC authorised the first Islamic balanced fund pursuant to the mutual recognition agreement between the SFC and the Securities Commission Malaysia signed in 2009.
11 Jun The Hong Kong Housing Authority (HA) launched the sale of 85 Home Ownership Scheme (HOS) flats in Tin Lee Court, Tai O and one rescinded flat in Tin Chung Court, Tin Shui Wai. Some 12 400 applications were received and all flats were sold by 16 September.
12 Jun The Mandatory Provident Fund Schemes Authority (MPFA) and the HKMA launched the E-Payment for the MPF Transfer system. The system made use of the HKMA’s Hong Kong dollar Real Time Gross Settlement (RTGS) system to automate payments for the transfer of MPF accrued benefits between trustees, which shortened the time needed for the transfers, and enhances the accuracy and efficiency of the transfer process.
13 Jun The Securities and Futures and Companies Legislation (Uncertificated Securities Market Amendment) Bill 2014, which sought to provide for a legal framework to enable the

148
introduction of an uncertificated securities market regime, was published in the Gazette.
20 Jun The Government launched a public consultation on proposals to improve Hong Kong's regulatory regime for listed entity auditors.
24 Jun The Enhanced Competency Framework (ECF) for private wealth management (PWM) practitioners was launched. The ECF was a non-statutory framework that sets out an enhanced level of core competence and on-going professional development of PWM practitioners who undertake customer-facing roles. It was developed by a Task Force led by the HKMA and comprising representatives from the Private Wealth Management Association (PWMA), Hong Kong Institute of Bankers (HKIB), Hong Kong Securities and Investment Institute (HKSI) and TMA. The FSTB and the MPFA jointly launched a three-month public consultation on the introduction of a “core fund” as the default fund of each MPF scheme, so as to further help scheme members make MPF investment decision that is line with the long-term retirement savings objective and to drive down MPF fees.
27 Jun The C&ED and the Singapore Customs signed a Mutual Recognition Arrangement to enable the respective Customs accredited companies to enjoy clearance facilitation for their goods imported from or exported to the other side. Hong Kong was ranked the world’s fourth largest recipient of Foreign Direct Investment (FDI) flows in 2013, according to the World Investment Report 2014 released by the United Nations Conference on Trade and Development. Hong Kong continued to be the second largest FDI recipient in Asia (after Mainland China) for 16 consecutive years. The Government announced the tendering of 5-year Government Bonds, totalling $2 billion, through the re-opening of an existing 5-year Government Bond issue under the Institutional Bond Issuance Programme of the Government Bond Programme.
2 Jul The Mandatory Provident Fund Schemes (Amendment) Bill 2014 was introduced into the Legislative Council. The Bill includes the major proposal of providing scheme members with more flexibility in withdrawing MPF accrued benefits, as well as other amendments to streamline the administrative procedures of MPF schemes and enable MPFA to take more effective enforcement actions to protect scheme members’ interests.
8 Jul Hong Kong and some World Trade Organization (WTO) Members launched the negotiation on the Environmental Goods Agreement. The HKSAR Government and the Government of the Republic of Korea signed an Agreement for the Avoidance of Double Taxation and the Prevention of Fiscal Evasion with respect to Taxes on Income.
10 Jul Hong Kong and the Association of Southeast Asian Nations (ASEAN) launched the negotiation of a FTA. The FTA will enhance trade and investment flows between ASEAN and Hong Kong, generate new opportunities for businesses, and boost economic growth in the longer term.
17 – 18 Jul FS attended the seventh Hong Kong Macao Co-operation High Level Meeting in Macao to review the progress and future direction of co-operation between the two places.
18 Jul The HKMA and the SFC began a one-month consultation on the detailed requirements relating to the mandatory reporting and related record keeping obligations under the new

149
over-the-counter (OTC) derivatives regime reflected in the Securities and Futures (Amendment) Ordinance 2014, which was enacted by the Legislative Council in April 2014. The requirements aim to enhance financial market stability by increasing transparency in the OTC derivatives market.
22 Jul The SFC concluded a consultation on amendments to the Code on Real Estate Investment Trusts (REITs), introducing greater flexibility for REITs to invest in property development activities and financial instruments. The revised Code on REITs was gazetted and came into effect on 29 August.
24 Jul The Education Bureau (EDB) launched a new “Study Subsidy Scheme for Designated Professions/Sectors” to subsidise up to 1 000 students per cohort starting from the 2015/16 academic year to pursue designated full-time locally-accredited self-financing undergraduate programmes in selected disciplines to nurture talents to meet Hong Kong’s social and economic needs. The Scheme will be made available to three cohorts of students starting from the 2015/16 academic year and then be subject to a review on its effectiveness.
25 Jul The Stamp Duty (Amendment) (No. 2) Ordinance 2014 was published in the Gazette. The law has retrospective effect from 23 February 2013. The Ordinance increased the ad valorem stamp duty (“AVD”) rates on transactions for both residential and non-residential properties and advanced the timing for charging AVD on non-residential property transactions from the conveyance on sale to the agreement for sale.
28 Jul The HKMA and Bank of Thailand (BOT) jointly launched the new cross-border payment-versus-payment (PvP) link between Hong Kong’s US Dollar RTGS system and Thailand’s Thai Baht RTGS system (BAHTNET). The PvP link eliminated settlement risk in foreign exchange transactions between the US Dollars and Thai Baht by ensuring the simultaneous delivery of US Dollars in Hong Kong and Thai Baht in Thailand. The Government announced the tendering of 10-year Government Bonds, totalling $1 billion, under the Institutional Bond Issuance Programme of the Government Bond Programme.
30 Jul – 1 Aug
FS visited Singapore to strengthen economic and trade ties between Hong Kong and Singapore.
7 Aug The Government announced the subscription and allocation results of the fourth inflation-linked retail bond, or iBond, issued under the retail part of the Government Bond Programme. A total of 488 170 valid applications were received for a total of $28.8 billion in principal amount. The iBond, with the final amount totalled $10 billion and a tenor of three years, was issued on 11 August and listed on SEHK on 12 August.
15 Aug The Government released the preliminary GDP figures for the second quarter of 2014. The Hong Kong economy slowed down further to a mere 1.8% year-on-year growth in real terms, marking the slowest growth since the third quarter of 2012. The weak performance was mainly weighed down by a fall-off in tourist spending and a concurrent slowdown in domestic demand. In the August update of the economic forecast for 2014, the forecast growth rate in real terms of GDP was revised downward to 2-3%. The forecast rates of increase in the headline and underlying Composite CPI were revised downward to 4.4% and 3.5% respectively.

150
17 – 22 Aug The 40th APEC Transport Working Group Meeting was held in Hong Kong. Over 230 delegates from 19 APEC economics and organisations attended the meeting to discuss a wide range of issues covering the safety, security, resilience and sustainability of transportation system in the Asia-Pacific Region.
18 Aug HKIA was named the world’s best airport for the fourth time in the “Best Travel Poll” conducted by online travel magazine Smart Travel Asia.
22 Aug The HKSAR Government and the Governments of the Kingdom of Denmark; the Faroes; Greenland; Iceland; the Kingdom of Norway; and the Kingdom of Sweden signed the Agreements for the Exchange of Information relating to Tax Matters respectively. The SFC published supplemental consultation conclusions reaffirming that initial public offering sponsors are subject to existing statutory civil and criminal liability for defective prospectuses.
25 Aug The Government announced the tendering of 2-year Government Bonds, totalling $3.5 billion, through the re-opening of an existing 5-year Government Bond issue under the Institutional Bond Issuance Programme of the Government Bond Programme.
1 Sep The Urban Renewal Authority awarded tender for joint venture development of the Kwun Tong Town Centre Redevelopment Scheme (Development Area 2 and 3), the largest project ever undertaken by the Authority. When completed, the project will provide 1 700 residential units as well as much improved transport and other community facilities in the district centre. The Government established the $1 billion Qualifications Framework (QF) Fund with a view to supporting different schemes or initiatives for the sustainable development and implementation of QF. The Steering Committee on QF Fund was also established to advise the Secretary for Education on the policy, strategy and administration of the QF Fund.
11 Sep The Government made a successful inaugural issuance of sukuk, with an issuance size of US$1 billion and a tenor of 5 years, under the Government Bond Programme. The HKMA acted as the Government’s representative in the sukuk offering. It was the world’s first US dolloar-denominated sukuk originated by an AAA-rated government. The sukuk saw strong demand from global investors, recording oversubscription of 4.7 times. Pricing at a spread of 23 basis points over the corresponding yield of US Treasuries, it represented the tightest spread ever achieved on a benchmark US dollar issuance from an Asian (ex-Japan) government.
12 Sep The FSTB and the HKMA jointly issued a consultation paper on the proposed enhancements to the Deposit Protection Scheme (DPS) to accelerate the process of making deposit compensation to depositors when a bank fails.
15 Sep Hong Kong indicated to the Organisation for Economic Cooperation and Development its support for implementing the new global standard on automatic exchange of financial account information on tax matters.
16 Sep A three-month consultation on a proposed Risk-based Capital framework for the insurance industry was launched to invite comments from interested parties, especially the insurance industry and professional bodies.

151
17 Sep The Transport and Housing Bureau announced the Railway Development Strategy 2014, recommending that seven new railway projects be completed in the planning horizon up to 2031 having regard to transport demand, cost-effectiveness and the development needs of New Development Areas and other developments.
18 Sep The C&ED signed a Supplement to Co-operation Agreement with the General Administration of Customs to enhance the clearance facilitation measures for wine entering the Mainland through Hong Kong.
25 Sep The SFC concluded a consultation on proposed amendments to the professional investor regime. Under the amendments, intermediaries are not allowed to be exempt from various fundamental Code of Conduct requirements when serving individual professional investors, and intermediaries are to adopt principles-based criteria to assess whether exemptions to such requirements apply when they serve corporate professional investors.
1 Oct The RMB Clearing Bank in Hong Kong extended its operating hours from 15 hours (HKT 8:30am - 11:30pm) to 20.5 hours (HKT 8:30 am - 5:00 am of the next day).
5 – 13 Oct FS attended the Annual Meeting of the IMF/World Bank held in Washington DC as a member of the Chinese delegation. He also visited New York, Boston and Washington DC to strengthen Hong Kong’s economic ties with the US.
6 Oct The HKMA launched the Coin Collection Programme and two “Coin Carts” started to collect coins from members of public in various districts on a rotation basis. Users can choose to exchange their spare coins for banknotes or adding value to Octopus card. The coins collected will be re-circulated to meet public demand, making circulation more efficient and reducing the need for minting new coins.
7 Oct Hong Kong remained the freest economy in the world, according to the 2014 Annual Report on the Economic Freedom of the World jointly released by the Fraser Institute of Canada, CATO Institute of the US and nearly 90 independent research and educational institutes around the world.
9 Oct The FTA between Hong Kong and Chile entered into force.
12 – 13 Oct The HKSAR co-hosted the 10th Pan-Pearl River Delta Region Co-operation and Development Forum and Trade Fair (the PPRD Forum) jointly with Guangdong Province and Macao SAR. CE led a HKSAR delegation to attend the PPRD Forum and chaired the Chief Executive Joint Conference. The Conference had discussions on issues relating to "commerce and trade" and "urbanisation", and agreed to strengthen commerce and trade co-operation between the Mainland provinces/regions and Hong Kong.
14 Oct
The HKMA co-organised the Hong Kong Thailand Renminbi Business Forum with the BOT in Bangkok to strengthen collaboration between Hong Kong and Thailand on the development of RMB business, and to raise awareness in the private sector about the use of RMB for cross-border trade settlement and investment.
16 Oct The HKSAR Government and the Government of the Republic of South Africa signed an Agreement for the Avoidance of Double Taxation and the Prevention of Fiscal Evasion with respect to Taxes on Income.
17 Oct The 3.2 km Nam Fung Tunnel of South Island Line (East) connecting Admiralty and Ocean Park stations was broken through.

152
20 – 23 Oct
FS attended the APEC Finance Ministers’ Meeting in Beijing and met with his counterparts.
24 Oct The Government launched the Pilot Scheme for Arbitration on Land Premium to facilitate agreement on land premium payable for lease modification or land exchange applications, with the objective of expediting land supply for housing and other uses. The Banking (Capital) (Amendment) Rules 2014 and the Banking (Liquidity) Rules were gazetted, facilitating the second phase of Basel III requirements to take effect on 1 January 2015. The requirements will further bolster the resilience of banks and the banking system against financial shocks and bring Hong Kong on par with the latest international regulatory standards. The Government announced the tendering of 3-year Government Bonds, totalling $3 billion, under the Institutional Bond Issuance Programme of the Government Bond Programme.
28 Oct The HKMA and Banque de France signed a Memorandum of Understanding with respect to strengthening co-operation on RMB business development in Hong Kong and Paris.
28 Oct – 1 Nov
FS, on behalf of CE, conducted a four-day visit to Paris, Milan and London to attend a number of trade promotional activities, including the "Think Asia, Think Hong Kong" events organised by Hong Kong Trade Development Council (HKTDC).
29 Oct The HKMA, together with Paris EUROPLACE and the HKTDC, organised a seminar on “Renminbi Internationalisation: A New Era” in Paris as part of the “Think Asia, Think Hong Kong” promotion programme organised by HKTDC. HKIA won the Industry Choice Award under the “Asia Pacific Airport of the Year” category at the Payload Asia Awards 2014.
29 Oct – 1 Nov
The ENB, together with the HKTDC, co-organised the Eco Expo Asia 2014. The main theme of the Expo was “Green Technologies: Green Building, Energy Saving & Waste Reduction”. It attracted more than 300 exhibitors from 22 countries and regions.
31 Oct The FSTB and HKMA released the consultation conclusions in connection with the proposed regulatory framework for stored value facilities (SVF) and retail payment systems (RPS) in Hong Kong. 41 submissions from industry players, public bodies, business and professional organisations and other stakeholders were received. The HKMA was admitted as a member of The South-East Asian Central Banks (SEACEN) Centre, a grouping of 20 central banks and monetary authorities in the Asia-Pacific region with a focus on research and training. It aims to facilitate co-operation and promote a better understanding of the financial, monetary, banking and economic development matters which are of interest to its members and to the region as a whole. The Minimum Wage Commission submitted its recommendation report to CE in Council on completion of a new round of review of the Statutory Minimum Wage rate.
3 Nov The HKMA designated seven banks as Primary Liquidity Providers (PLPs) for offshore RMB market in Hong Kong (i.e. CNH market). These designated PLPs have pledged to expand their market-making activities in Hong Kong for various CNH instruments,

153
and use the Hong Kong platform in promoting their global offshore RMB business.
3 – 5 Nov FS led a government delegation to visit Beijing and met with Central Government officials responsible for financial and monetary matters to discuss issues of mutual concern.
6 Nov CE and the Governor of Guangdong Province co-chaired the 17th Plenary of the Hong Kong/Guangdong Co-operation Joint Conference in Guangzhou. At the plenary meeting, both sides reviewed the progress of Hong Kong-Guangdong co-operation over the past year and set the directions for future co-operation. Both sides agreed that the focus of next year should be placed on further promoting the liberalisation of trade in services between Hong Kong and Guangdong and strengthening future co-operation in a number of key areas.
7 Nov The Pacific Economic Co-operation Council published its State of the Region Report 2014-2015. The Report recognised Hong Kong as one of the economies most highly integrated with the Asia-Pacific region. The Environmental Impact Assessment report on the “Expansion of HKIA into a three-runway system” was approved and the project was granted the relevant Environmental Permit by Director of Environmental Protection.
8 – 12 Nov CE attended the Asia-Pacific Economic Cooperation (APEC) 2014 Leaders’ Week and other related meetings in Beijing. During his stay in Beijing, CE met with APEC leaders to exchange views on issues of mutual concern and took the opportunity to call on central ministries.
10 Nov The HKMA introduced a RMB intraday liquidity facility of up to RMB10 billion to Authorized Institutions participating in RMB business (Participating AIs) in Hong Kong to assist them in managing their RMB liquidity and to promote efficient payment flows in Hong Kong. Participating AIs may initiate a sale and repurchase (repo) transaction with the HKMA to obtain intraday RMB funds to meet RMB payments flows.
12 Nov HKIA was voted the “Best Airport in China” by readers of renowned travel publication Business Traveller China for the eighth time in the past nine years. The AA released its second sustainability report entitled “Sustaining our Capacity – Addressing Emerging Constraints”. The report explains how HKIA continues to support the sustainable development of Hong Kong despite faster-than-forecast air traffic growth putting pressure on the operating capacity of the existing two-runway system. The private-sector led London-Hong Kong Forum to promote co-operation on the development of international RMB business convened for its fourth meeting in London. Forum participants agreed to continue their work and step-up engagement in a number of areas, with the aim of further enhancing the breadth and depth of the offshore RMB market and promoting international RMB business, noting that increasing awareness and education continue to be key themes in all areas.
13 Nov The Ministry of Finance announced the tendering in Hong Kong of a total of RMB4 billion 3-year Bonds, RMB3 billion 5-year Bonds and RMB2 billion 10-year Bonds of the Central People’s Government.
13 – 19 Nov FS attended the G20 summit in Brisbane as a member of the Chinese delegation. He also visited Brisbane and Sydney to strengthen Hong Kong’s economic ties with

154
Australia.
14 Nov The Government released the preliminary GDP figures for the third quarter of 2014. The Hong Kong economy regained some momentum and grew by 2.7% in real terms over a year earlier, underpinned by a relative improvement in both services exports and private consumption. In the November update of the economic forecast for 2014, the forecast growth rate of GDP in real terms was revised to 2.2%. The forecast rates of increase in the headline and underlying Composite CPI were revised downward to 4.3% and 3.4% respectively.
17 Nov The Shanghai-Hong Kong Stock Connect has launched officially. With the launch of Stock Connect, institutional and retail investors in Hong Kong and from overseas would be able to invest directly in eligible Mainland A-shares while eligible Mainland investors could invest in eligible Hong Kong stocks. The RMB conversion limit for Hong Kong residents of RMB20,000 per day was removed on the same day.
18 – 19 Nov The Government and HKTDC jointly hosted the Fourth Asian Logistics and Maritime Conference, attracting over 1 680 business leaders and industry practitioners from 32 countries and regions.
19 – 21 Nov Hong Kong was commended for its open and free trade policies as well as its active and constructive role in strengthening the WTO and the multilateral trading system in the WTO's Trade Policy Review of Hong Kong, China.
21 Nov The Government removed the licensing and notification requirements for all textiles imports and exports.
24 – 27 Nov The 51st Conference of Directors General of Civil Aviation, Asia and Pacific Regions organised by the International Civil Aviation Organization and hosted by Civil Aviation Department (CAD) was held at the CAD Headquarters, discussing issues pertaining to the various aspects of civil aviation.
25 Nov CS led the HKSAR Government delegation to attend the first meeting of the Inter-ministries Joint Conference on the Promotion of the Development of Qianhai, Nansha and Hengqin in Guangdong, chaired by the National Development and Reform Commission, in Beijing, exchanging views on the development of Nansha, Hengqin and Qianhai. EDB launched a new “Hong Kong Scholarship for Excellence Scheme” to support local students to pursue studies in world renowned universities outside Hong Kong with a view to grooming a top cadre of talents with global vision, international network and world-class education. The Scheme will benefit three cohorts of students, with initially up to 100 students per cohort, starting from the 2015/16 academic year and then be subject to a review on its effectiveness. HKIA’s Midfield Concourse topped out, marking a milestone for the airport’s Midfield development project.
25 – 27 Nov CE visited Korea and met with the President of Korea, and other political and business leaders there to exchange views on a wide range of issues. The visit has a focus on the development of the creative industry and innovation and technology industry of Korea.
27 Nov The People’s Bank of China and the HKMA renewed the currency swap agreement, with

155
a size of RMB400 billion, for a term of another three years. The Working Group on Intellectual Property Trading (the Working Group) led by the Secretary for Commerce and Economic Development completed deliberations on the specific policies and support measures under the Strategic Framework, and plans to submit a report with recommendations to the Government in early 2015.
28 Nov The HKMA and the SFC published their conclusions on a joint public consultation on the mandatory reporting and related record keeping obligations under the new OTC derivatives transactions regime.
29 Nov The Commission on Poverty announced the updated poverty line and the poverty situation in Hong Kong in 2013. There had been a marked improvement in the poverty situation in 2013 when compared with that of 2012. After recurrent cash policy interventions, the poor population in Hong Kong decreased from 1.02 million in 2012 to 0.97 million in 2013, while the poverty rate dropped from 15.2% to 14.5%. Both were at the record-low level in the last five years covered by the analysis.
1 Dec
Retail sales statistics for October 2014 were released, indicating that retail sales performance was affected by the “Occupy Movement”. The Commerce and Economic Development Bureau launched “Retail Technology Adoption Assistance Scheme for Manpower Demand Management” (ReTAAS), in partnership with the Hong Kong Productivity Council, to help the industry enhance productivity and alleviate manpower shortage.
4 – 5 Dec As part of the overall strategy in promoting the development of Hong Kong as a premier IP trading hub in the region, the Government has continued to co-organise the Business of Intellectual Property Asia Forum (BIP Asia) with the HKTDC and the Hong Kong Design Centre to elevate the event to a more strategic level. Launched in 2011, BIP Asia has now become an annual flagship IP event in the region.
5 Dec CE visited Huizhou and attended the 13th HK-Pearl River Delta Industrial and Commercial Circle Goodwill Gathering 2014. During the visit, CE called on leaders of the Huizhou Municipal Government. The Stamp Duty (Amendment) Bill 2014, which sought to implement the stamp duty waiver for the transfer of shares or units of all exchange traded funds as proposed in the 2014-15 Budget, was published in the Gazette.
6 – 12 Dec FS led a business delegation to Saudi Arabia and the United Arab Emirates to explore emerging business opportunities in the Middle East market and to showcase Hong Kong’s Islamic finance platform to Islamic economies.
7 Dec CE visited Qianhai Shenzhen-Hong Kong Modern Service Industry Co-operation Zone and attended the opening ceremony of the Qianhai Shenzhen-Hong Kong Youth Innovation and Entrepreneur Hub.
8 Dec Hong Kong was the first of the 160 WTO Members to join the Agreement on Trade Facilitation (TFA), which sets out binding obligations for all WTO Members to improve and harmonise their import/export and customs procedures. The HKMA announced two measures to further promote local Hong Kong dollar bond market development, including streamlining of tenors of bonds issued under the
156
Exchange Fund Bills and Notes Programme and the Hong Kong Government Bond Programme, and the introduction of discount facility for Hong Kong Government Bonds.
11 Dec The HKSAR Government and the Government of the United Arab Emirates signed an Agreement for the Avoidance of Double Taxation and the Prevention of Fiscal Evasion with respect to Taxes on Income. The SFC concluded the consultation on amendments to publication requirements under the Code on Unit Trusts and Mutual Funds, which give public funds greater flexibility in determining the means for making public their offer and redemption prices, net asset values and notices of dealing suspension.
12 Dec The 2.6 km tunnel section of Kwun Tong Line Extension connecting Yaumatei and Whampoa stations was broken through.
14 Dec HKIA achieved passenger volume record by handling 60 million passengers in 2014.
15 Dec The ENB launched the Carbon Footprint Repository (CFR), in the form of a dedicated website, to enable listed companies in Hong Kong to disclose their carbon footprints and share successful stories on carbon management and practices. The Government launched a public consultation on Voluntary Health Insurance Scheme (VHIS), which proposed to regulate individual indemnity hospital insurance products in the market. The Government launched a public consultation on Regulation of Private Healthcare Facilities, which proposed to introduce a robust and comprehensive regulatory regime for private healthcare facilities.
16 Dec The Council for Sustainable Development submitted its report on the public engagement process on municipal solid waste charging to the Government setting out its recommendations on the four key issues identified during the public engagement process, namely charging mechanism, coverage of charging scheme, charging level, and recycling. The Government announced the Long Term Housing Strategy (LTHS), which is the first long-term strategy document on housing since 1998. The new LTHS sets out three major strategies: (1) to build more public rental housing (PRH) units and to ensure the rational use of PRH resources; (2) to provide more subsidised sale flats, expand the forms of subsidised home ownership and facilitate the market circulation of existing flats; and (3) to stabilise the residential property market through steady land supply and implementation of demand management measures, and to promote good sales and tenancy practices for private residential properties. Based on the latest projection, the Government adopted a new total housing supply target of 480 000 units for the 10-year period from 2015-16 to 2024-25 with a public-private split of 60:40.
18 Dec The HKSAR Government and Ministry of Commerce signed, under the framework of CEPA, the Agreement between the Mainland and Hong Kong on Achieving Basic Liberalisation of Trade in Services in Guangdong, under which the Mainland has opened up 153 services trade sub-sectors in Guangdong, accounting for 95.6% of all its services trade sub-sectors, in Guangdong, to the Hong Kong services industry. The breadth and depth of liberalisation surpass the previous measures for early and pilot implementation in Guangdong.

157
24 Dec The Banking (Disclosure) (Amendment) Rules 2014 to introduce disclosure requirements associated with the second phase of Basel III requirements for authorised institutions were gazetted.
28 Dec The West Island Line (with the exception of Sai Ying Pun Station) was commissioned. This railway line is an extension of the Island Line to the Western District, with three stations at Kennedy Town, HKU and Sai Ying Pun.
30 Dec The HA launched the pre-sale of the first batch of 2 160 new HOS flats which are expected to be completed in 2016-17. The new HOS flats are located in Tsuen Wan, Tsing Yi, Sha Tin and Yuen Long.
31 Dec The number of visitors to Hong Kong in 2014 reached 60.8 million, setting a new record.


159
Table Page1. Gross Domestic Product by expenditure component (at current market prices) 160-161
2. 162-163
3. Gross Domestic Product by economic activity (at current prices) 164
4. 165
5. 166-167
6. Balance of Payments by major component (at current prices) 168
7. 169
7a. 170
8. Total exports of goods by market (in value terms) 171
9. Imports of goods by source (in value terms) 172
10. Retained imports of goods by end-use category (in value terms) 172
11. Exports and imports of services by component (at current market prices) 173
11a. 174
12. Incoming visitors by source 175
13. Property market 176-177
14. 178-179
15. Monetary aggregates 180-181
16. Rates of change in business receipts indices for services industries/domains 182
17. Labour force characteristics 183
18. Employment in selected major industries 184
19. Number of manual workers engaged at building and construction sites 185
20. Rates of change in indices of payroll per person engaged by selected industry section 186
21. Rates of change in wage indices by selected industry section 187
22. 188
23. 189
24. Rates of change in prices 190-191
25. Rates of change in Composite Consumer Price Index 192-193
26. 194-195
Statistical Appendix
Property prices and rentals
Rates of change in chain volume measures of Gross Domestic Product byexpenditure component (in real terms)
Rates of change in chain volume measures of Gross Domestic Product by economicactivity (in real terms)
Goods and services trade based on the change of ownership principle
Exports and imports of services based on the change of ownership principle bycomponent (at current market prices)
Monthly wage level and distribution analysed by industry section : all businessundertakings
Hourly wage level and distribution analysed by industry section : all businessundertakings
Goods and services trade (at current market prices)
Rates of change in implicit price deflators of GDP and its main expenditurecomponents
Value added and employment statistics of the Four Key Industries and other selectedindustries

160
($Mn)
2005 2006 2007 2008 2009 2010
Private consumption expenditure 811,654 868,691 982,368 1,026,482 1,013,615 1,090,234Government consumption expenditure 130,566 131,837 138,967 148,017 152,512 157,371Gross domestic fixed capital formation 302,152 337,153 340,356 350,796 339,552 386,852 of which:
Building and construction 105,993 106,268 111,776 127,312 123,746 139,249 Machinery, equipment and intellectual property products 176,269 214,093 204,083 198,633 191,568 209,568
Changes in inventories -4,761 -2,129 12,841 8,480 22,941 37,522
Total exports of goods& 2,251,744 2,467,357 2,698,850 2,843,998 2,500,143 3,068,444
Imports of goods& 2,311,091 2,576,340 2,852,522 3,024,089 2,702,966 3,395,057
Exports of services& 496,985 566,416 664,100 720,837 672,794 829,044
Imports of services& 265,124 289,634 334,204 367,034 339,346 398,078
GDP 1,412,125 1,503,351 1,650,756 1,707,487 1,659,245 1,776,332
Per capita GDP ($) 207,263 219,240 238,676 245,406 237,960 252,887
GNI 1,419,589 1,538,864 1,703,567 1,807,994 1,709,007 1,813,928
Per capita GNI ($) 208,359 224,419 246,312 259,851 245,096 258,240
Total final demand 3,988,340 4,369,325 4,837,482 5,098,610 4,701,557 5,569,467Total final demand excluding re-exports(a) 2,243,119 2,436,589 2,697,292 2,836,222 2,687,437 3,058,027
Domestic demand 1,239,611 1,335,552 1,474,532 1,533,775 1,528,620 1,671,979 Private 1,062,587 1,163,262 1,297,607 1,342,889 1,327,688 1,449,592 Public 177,024 172,290 176,925 190,886 200,932 222,387
External demand 2,748,729 3,033,773 3,362,950 3,564,835 3,172,937 3,897,488
Table 1 : Gross Domestic Product by expenditure component(at current market prices)
Definition of Terms :
Total final demand = private consumption expenditure + government consumption expenditure + gross domestic fixed capital formation + changes in inventories + total exports of goods + exports of services
Private sector domestic demand = private consumption expenditure + gross domestic fixed capital formation by the private sector + changes in inventories
Public sector domestic demand = government consumption expenditure + gross domestic fixed capital formation by the public sector
Domestic demand = private sector domestic demand + public sector domestic demand
External demand = total exports of goods + exports of services
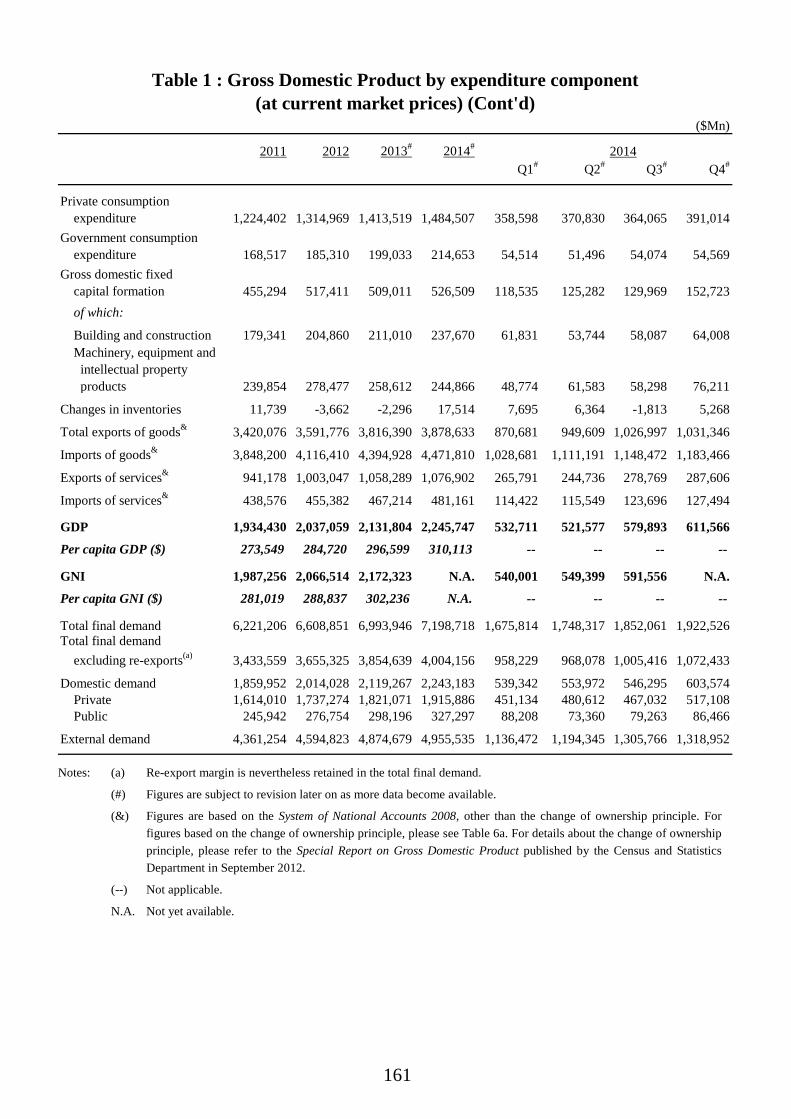
161
($Mn)
2011 2012 2013# 2014# 2014Q1# Q2# Q3# Q4#
Private consumption expenditure 1,224,402 1,314,969 1,413,519 1,484,507 358,598 370,830 364,065 391,014Government consumption expenditure 168,517 185,310 199,033 214,653 54,514 51,496 54,074 54,569Gross domestic fixed capital formation 455,294 517,411 509,011 526,509 118,535 125,282 129,969 152,723 of which:
Building and construction 179,341 204,860 211,010 237,670 61,831 53,744 58,087 64,008 Machinery, equipment and intellectual property products 239,854 278,477 258,612 244,866 48,774 61,583 58,298 76,211
Changes in inventories 11,739 -3,662 -2,296 17,514 7,695 6,364 -1,813 5,268
Total exports of goods& 3,420,076 3,591,776 3,816,390 3,878,633 870,681 949,609 1,026,997 1,031,346
Imports of goods& 3,848,200 4,116,410 4,394,928 4,471,810 1,028,681 1,111,191 1,148,472 1,183,466
Exports of services& 941,178 1,003,047 1,058,289 1,076,902 265,791 244,736 278,769 287,606
Imports of services& 438,576 455,382 467,214 481,161 114,422 115,549 123,696 127,494
GDP 1,934,430 2,037,059 2,131,804 2,245,747 532,711 521,577 579,893 611,566
Per capita GDP ($) 273,549 284,720 296,599 310,113 -- -- -- --
GNI 1,987,256 2,066,514 2,172,323 N.A. 540,001 549,399 591,556 N.A.
Per capita GNI ($) 281,019 288,837 302,236 N.A. -- -- -- --
Total final demand 6,221,206 6,608,851 6,993,946 7,198,718 1,675,814 1,748,317 1,852,061 1,922,526Total final demand excluding re-exports(a) 3,433,559 3,655,325 3,854,639 4,004,156 958,229 968,078 1,005,416 1,072,433
Domestic demand 1,859,952 2,014,028 2,119,267 2,243,183 539,342 553,972 546,295 603,574 Private 1,614,010 1,737,274 1,821,071 1,915,886 451,134 480,612 467,032 517,108 Public 245,942 276,754 298,196 327,297 88,208 73,360 79,263 86,466
External demand 4,361,254 4,594,823 4,874,679 4,955,535 1,136,472 1,194,345 1,305,766 1,318,952
Table 1 : Gross Domestic Product by expenditure component(at current market prices) (Cont'd)
Notes: (a) Re-export margin is nevertheless retained in the total final demand.
(#) Figures are subject to revision later on as more data become available.
(&) Figures are based on the System of National Accounts 2008, other than the change of ownership principle. For figures based on the change of ownership principle, please see Table 6a. For details about the change of ownership principle, please refer to the Special Report on Gross Domestic Product published by the Census and Statistics Department in September 2012.
(--) Not applicable.
N.A. Not yet available.

162
(%)
2005 2006 2007 2008 2009 2010
Private consumption expenditure 3.5 6.1 8.6 1.9 0.2 6.1Government consumption expenditure -2.6 0.9 3.2 2.0 2.3 3.4Gross domestic fixed capital formation 4.0 7.1 3.2 1.4 -3.5 7.7 of which:
Building and construction -7.6 -7.1 -0.3 6.8 -5.5 5.7 Machinery, equipment and intellectual property products 12.1 18.2 2.5 * -2.2 6.5
Total exports of goods& 10.4 9.3 7.0 1.9 -12.5 17.3
Imports of goods& 8.0 9.2 8.8 1.8 -9.5 18.1
Exports of services& 11.6 10.0 14.3 5.0 0.4 14.7
Imports of services& 7.6 8.4 12.1 5.8 -5.0 11.1
GDP 7.4 7.0 6.5 2.1 -2.5 6.8
Per capita GDP 6.9 6.3 5.6 1.5 -2.7 6.0
RGNI 4.3 6.7 8.2 3.3 -4.6 3.6
Per capita RGNI 3.9 6.0 7.3 2.7 -4.8 2.9
Total final demand 7.8 8.4 8.2 2.2 -6.8 13.6Total final demand excluding re-exports(a) 5.6 7.4 7.9 1.7 -2.6 10.4
Domestic demand 2.0 6.1 7.8 1.4 0.5 7.1 Private 3.4 7.6 8.9 1.2 -0.1 6.6 Public -5.7 -2.8 0.6 3.2 4.5 10.2
External demand 10.6 9.4 8.4 2.5 -9.9 16.8
Table 2 : Rates of change in chain volume measures of Gross Domestic Productby expenditure component (in real terms)
Notes: (a) Re-export margin is nevertheless retained in the total final demand.
(#) Figures are subject to revision later on as more data become available.
(&) Figures are based on the System of National Accounts 2008, other than the change of ownership principle. For figures based on the change of ownership principle, please see Table 6a. For details about the change of ownership principle, please refer to the Special Report on Gross Domestic Product published by the Census and Statistics Department in September 2012.
(--) Not applicable.
(*) Change within ±0.05%.
N.A. Not yet available.
(^) Average annual rate of change for the 10-year period 2003-2013.
(~) Average annual rate of change for the 5-year period 2008-2013.

163
(%)
2011 2012 2013# 2014# 2014
Q1# Q2# Q3# Q4#
10 years2004 to
2014#
5 years2009 to
2014#
Private consumption expenditure 8.4 4.1 4.6 2.7 1.6 1.3 4.1 3.8 4.6 5.2Government consumption expenditure 2.5 3.6 3.0 3.1 2.7 2.7 3.7 3.3 2.1 3.1Gross domestic fixed capital formation 10.2 6.8 2.2 -0.3 3.7 -5.2 -3.3 4.0 3.8 5.2 of which:
Building and construction 15.7 7.2 -4.3 6.5 11.4 2.0 5.0 7.1 1.4 6.0 Machinery, equipment and intellectual property products 12.3 10.2 10.6 -5.2 1.9 -9.9 -11.9 1.2 6.3 6.7
Total exports of goods& 3.5 1.9 6.5 1.0 0.3 2.0 1.0 0.6 4.4 5.9
Imports of goods& 4.7 3.0 7.2 1.0 1.1 1.1 0.5 1.2 5.0 6.6
Exports of services& 5.5 2.2 4.9 0.5 3.5 -1.9 0.9 -0.7 6.8 5.4
Imports of services& 3.5 1.9 1.8 1.9 -0.5 4.9 2.1 1.3 4.8 4.0
GDP 4.8 1.7 2.9 2.3 2.6 1.8 2.7 2.2 3.9 3.7
Per capita GDP 4.1 0.5 2.4 1.6 -- -- -- -- 3.2 2.9
RGNI 4.8 -0.2 3.9 N.A. 2.8 4.2 3.2 N.A. 3.4^ 1.4~
Per capita RGNI 4.1 -1.3 3.4 N.A. -- -- -- -- 2.7^ 0.8~
Total final demand 4.7 2.5 5.5 1.4 1.4 1.5 1.3 1.5 4.6 5.5Total final demand excluding re-exports(a) 5.6 3.2 4.5 1.8 1.7 1.5 1.5 2.3 4.5 5.1
Domestic demand 6.5 3.9 3.9 2.8 2.3 2.3 2.1 4.2 4.2 4.8
Private 6.7 3.6 3.9 2.4 1.4 2.2 1.9 3.8 4.4 4.6 Public 5.5 5.8 3.9 5.2 7.5 2.5 2.9 7.2 2.9 6.1External demand 3.9 1.9 6.2 0.9 1.0 1.2 1.0 0.3 4.8 5.8
Table 2 : Rates of change in chain volume measures of Gross Domestic Productby expenditure component (in real terms) (Cont'd)
Average annualrate of change:

164
2009 2010 2011
$Mn%
share $Mn%
share $Mn%
share $Mn%
share $Mn%
share
Agriculture, fishing, mining and quarrying 1,090 0.1 948 0.1 944 * 1,114 0.1 1,225 0.1
Manufacturing 28,714 1.8 30,410 1.8 30,578 1.6 30,600 1.5 30,156 1.4
Electricity, gas and water supply, and waste management 35,032 2.2 34,486 2.0 33,877 1.8 35,382 1.8 35,119 1.7
Construction 50,264 3.2 56,531 3.3 65,484 3.4 73,445 3.6 83,288 4.0
Services 1,466,724 92.7 1,614,922 93.0 1,770,166 93.1 1,872,498 93.0 1,947,729 92.9Import/export, wholesale and retail trades 370,226 23.4 413,308 23.8 492,900 25.9 511,537 25.4 523,647 25.0Accommodation (a) and food services 48,789 3.1 56,418 3.2 66,421 3.5 72,044 3.6 75,413 3.6Transportation, storage, postal and courier services 99,208 6.3 137,941 7.9 120,034 6.3 120,609 6.0 125,465 6.0Information and communications 47,893 3.0 55,024 3.2 62,952 3.3 70,866 3.5 76,145 3.6
Financing and insurance 255,900 16.2 283,752 16.3 305,282 16.1 319,312 15.9 345,952 16.5Real estate, professional and business services 173,903 11.0 188,476 10.8 213,987 11.3 232,416 11.5 225,667 10.8Public administration, social and personal services 288,109 18.2 295,257 17.0 313,585 16.5 337,678 16.8 356,274 17.0
Ownership of premises 182,696 11.5 184,745 10.6 195,005 10.3 208,036 10.3 219,166 10.4
GDP at basic prices 1,581,824 100.0 1,737,298 100.0 1,901,049 100.0 2,013,038 100.0 2,097,517 100.0
Taxes on products 54,689 -- 68,707 -- 69,401 -- 63,575 -- 75,314 --
Statistical discrepancy (%) 1.4 -- -1.7 -- -1.9 -- -1.9 -- -1.9 --
GDP at current market prices 1,659,245 -- 1,776,332 -- 1,934,430 -- 2,037,059 -- 2,131,804 --
Table 3 : Gross Domestic Product by economic activity(at current prices)
2013#2012
Notes: Individual figures may not add up exactly to the total due to rounding.
(a) Accommodation services cover hotels, guesthouses, boarding houses and other establishments providing short term accommodation.
(#) Figures are subject to revision later on as more data become available.
(--) Not applicable.
(*) Less than 0.05%.
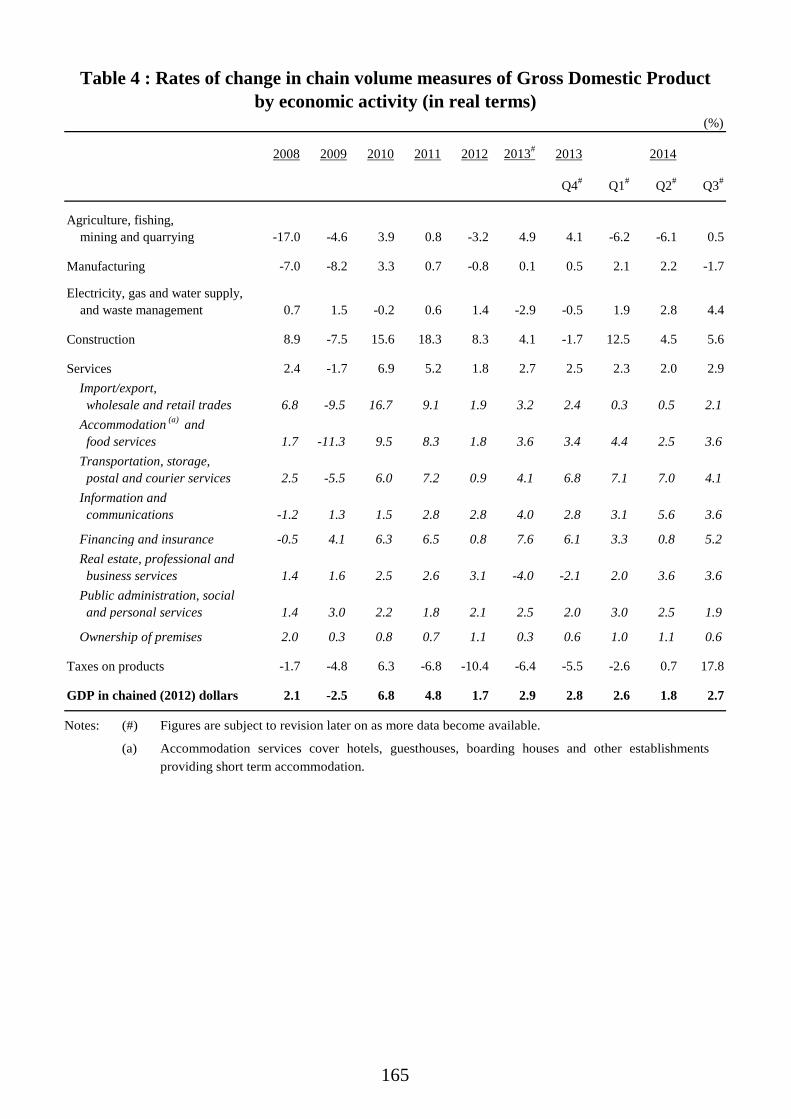
165
(%)
2008 2009 2010 2011 2012 2013# 2013 2014
Q4# Q1# Q2# Q3#
Agriculture, fishing, mining and quarrying -17.0 -4.6 3.9 0.8 -3.2 4.9 4.1 -6.2 -6.1 0.5
Manufacturing -7.0 -8.2 3.3 0.7 -0.8 0.1 0.5 2.1 2.2 -1.7
Electricity, gas and water supply, and waste management 0.7 1.5 -0.2 0.6 1.4 -2.9 -0.5 1.9 2.8 4.4
Construction 8.9 -7.5 15.6 18.3 8.3 4.1 -1.7 12.5 4.5 5.6
Services 2.4 -1.7 6.9 5.2 1.8 2.7 2.5 2.3 2.0 2.9Import/export, wholesale and retail trades 6.8 -9.5 16.7 9.1 1.9 3.2 2.4 0.3 0.5 2.1Accommodation (a) and food services 1.7 -11.3 9.5 8.3 1.8 3.6 3.4 4.4 2.5 3.6Transportation, storage, postal and courier services 2.5 -5.5 6.0 7.2 0.9 4.1 6.8 7.1 7.0 4.1Information and communications -1.2 1.3 1.5 2.8 2.8 4.0 2.8 3.1 5.6 3.6
Financing and insurance -0.5 4.1 6.3 6.5 0.8 7.6 6.1 3.3 0.8 5.2Real estate, professional and business services 1.4 1.6 2.5 2.6 3.1 -4.0 -2.1 2.0 3.6 3.6Public administration, social and personal services 1.4 3.0 2.2 1.8 2.1 2.5 2.0 3.0 2.5 1.9
Ownership of premises 2.0 0.3 0.8 0.7 1.1 0.3 0.6 1.0 1.1 0.6
Taxes on products -1.7 -4.8 6.3 -6.8 -10.4 -6.4 -5.5 -2.6 0.7 17.8
GDP in chained (2012) dollars 2.1 -2.5 6.8 4.8 1.7 2.9 2.8 2.6 1.8 2.7
Table 4 : Rates of change in chain volume measures of Gross Domestic Productby economic activity (in real terms)
Notes: (#) Figures are subject to revision later on as more data become available.
(a) Accommodation services cover hotels, guesthouses, boarding houses and other establishments providing short term accommodation.

166
$Bn% share
in total(1) $Bn% share
in total(1) $Bn% share
in total(1) $Bn% share
in total(1) 2011 2012 2013#
Value added at current prices
Four Key Industries 1,014.1 58.4 1,112.8 58.5 1,166.8 58.0 1,212.5 57.8 9.7 4.9 3.9Financial services 283.8 16.3 305.3 16.1 319.3 15.9 346.0 16.5 7.6 4.6 8.3
Tourism 74.6 4.3 86.2 4.5 94.6 4.7 105.9 5.0 15.5 9.7 11.9
Trading and logistics 439.6 25.3 485.4 25.5 495.4 24.6 500.5 23.9 10.4 2.0 1.0Professional services and other producer services(2) 216.1 12.4 235.9 12.4 257.6 12.8 260.2 12.4 9.1 9.2 1.0
Other selected industries (3) 143.8 8.3 161.2 8.5 175.9 8.7 190.6 9.1 12.1 9.1 8.3Cultural and creative industries 77.6 4.5 89.6 4.7 97.8 4.9 106.1 5.1 15.4 9.3 8.4
Medical services 26.1 1.5 27.4 1.4 29.5 1.5 32.4 1.5 4.9 7.5 10.1
Education services 17.5 1.0 20.0 1.1 22.6 1.1 24.2 1.2 13.9 13.1 7.1Innovation and technology 11.8 0.7 12.4 0.7 13.4 0.7 14.7 0.7 5.1 8.5 9.8Testing and certification services 5.2 0.3 5.4 0.3 5.8 0.3 6.0 0.3 4.1 8.6 3.2
Environmental industries 5.6 0.3 6.5 0.3 6.8 0.3 7.1 0.3 16.3 3.6 5.2Nominal GDP at basic prices 1,737.3 100.0 1,901.0 100.0 2,013.0 100.0 2,097.5 100.0 9.4 5.9 4.2
Table 5 : Value added and employment statistics of the Four Key Industriesand other selected industries
2010 2011 2012 2013#Annual percentage
change (%)
Notes: Individual figures may not add up exactly to the total due to rounding.
(1) Refers to percentage share in nominal GDP at basic prices. Such GDP figure is slightly different from the commonly used one, i.e. valued at current market prices, in which taxes on products are included.
(2) Other producer services refer to producer services other than financial services, tourism, trading and logistics and professional services.
(3) The other selected industries reflect the direct contribution of these industries in the private sector only. Some of them are service domains straddling across different industries. For example, “innovation and technology” activities may exist in any industry and organisation. The term “industry” is used to denote the aggregate of the economic activities concerned for easy general understanding.
(4) Since innovation and technology involves significant non-routine activities, persons engaged in these activities are measured by the volume of labour input to innovation and technology in full-time equivalent terms (in terms of man-years).
(5) Figures refer to Composite Employment Estimates.
(#) Figures are subject to revision later on as more data become available.

167
Number('000)
% sharein total
Number('000)
% sharein total
Number('000)
% sharein total
Number('000)
% sharein total 2011 2012 2013#
Employment
Four Key Industries 1 670.1 48.0 1 706.0 47.7 1 727.6 47.2 1 764.2 47.3 2.1 1.3 2.1Financial services 216.7 6.2 226.3 6.3 228.8 6.3 231.7 6.2 4.4 1.1 1.3
Tourism 215.1 6.2 235.9 6.6 250.9 6.9 269.7 7.2 9.7 6.3 7.5
Trading and logistics 778.2 22.4 774.4 21.6 764.9 20.9 767.2 20.6 -0.5 -1.2 0.3Professional services and other producer services(2) 460.1 13.2 469.4 13.1 483.0 13.2 495.6 13.3 2.0 2.9 2.6
Other selected industries (3) 406.7 11.7 420.7 11.8 435.0 11.9 450.3 12.1 3.4 3.4 3.5Cultural and creative industries 189.4 5.4 192.9 5.4 200.4 5.5 207.5 5.6 1.8 3.9 3.6
Medical services 73.5 2.1 76.3 2.1 79.0 2.2 82.1 2.2 3.8 3.5 4.0
Education services 66.5 1.9 70.7 2.0 73.1 2.0 74.9 2.0 6.3 3.4 2.5Innovation and technology(4) 28.8 0.8 29.3 0.8 30.2 0.8 32.0 0.9 1.5 3.3 5.8Testing and certification services 12.4 0.4 13.1 0.4 12.8 0.3 13.1 0.4 5.8 -2.5 2.4
Environmental industries 36.1 1.0 38.4 1.1 39.5 1.1 40.7 1.1 6.3 3.1 2.9
Total employment(5) 3 478.6 100.0 3 579.5 100.0 3 657.1 100.0 3 728.5 100.0 2.9 2.2 2.0
Table 5 : Value added and employment statistics of the Four Key Industriesand other selected industries (Cont'd)
2010 2011 2012 2013#Annual percentage
change (%)

168
($Mn)
2009 2010 2011 2012 2013# 2013 2014
Q4# Q1# Q2# Q3#
Current account(a) 164,001 124,369 107,513 32,151 32,180 28,125 -4,210 -9,338 40,196
Goods 103,008 25,564 -58,203 -146,729 -216,592 -31,523 -78,912 -84,698 -23,493
Services 27,617 78,789 132,681 169,760 229,129 52,121 72,281 52,303 57,091
Primary income 49,762 37,596 52,826 29,455 40,519 12,615 7,290 27,822 11,663
Secondary income -16,386 -17,580 -19,791 -20,336 -20,876 -5,087 -4,869 -4,765 -5,065
Capital and financial account(a) -144,532 -88,838 -113,242 -67,664 -86,308 -54,203 29,922 -11,997 -69,064
Capital account -3,021 -4,436 -2,021 -1,433 -1,609 -75 -67 -168 -35
Financial account -141,511 -84,402 -111,220 -66,231 -84,699 -54,128 29,989 -11,829 -69,029 Financial non-reserve assets 470,987 -25,257 -24,437 122,658 -26,810 -9,352 62,173 392 -1,008
Direct investment -28,421 -122,026 1,868 -102,623 -50,250 59,287 -82,302 83,000 -230,273
Portfolio investment -310,083 -442,460 -10,979 -31,592 -386,077 -141,088 -11,476 -53,545 245,436
Financial derivatives 24,560 18,677 20,884 15,208 54,661 9,653 18,052 23,815 12,597
Other investment 784,930 520,552 -36,210 241,665 354,856 62,795 137,899 -52,878 -28,769
Reserve assets -612,498 -59,145 -86,783 -188,889 -57,890 -44,775 -32,185 -12,221 -68,021
Net errors and omissions -19,470 -35,530 5,729 35,513 54,128 26,078 -25,712 21,336 28,868
Overall Balance of Payments 612,498 59,145 86,783 188,889 57,890 44,775 32,185 12,221 68,021
Table 6 : Balance of Payments by major component(at current prices)
Notes: Individual figures may not add up exactly to the total due to rounding.
(a) In accordance with the accounting rules adopted in compiling Balance of Payments, a positive value for the balance figure in the current account represents a surplus whereas a negative value represents a deficit. In the capital and financial account, a positive value indicates a net financial inflow while a negative value indicates a net outflow. As increases in external assets are debit entries and decreases are credit entries, a negative value for the reserve assets represents a net increase while a positive value represents a net decrease.
(#) Figures are subject to revision later on as more data become available.
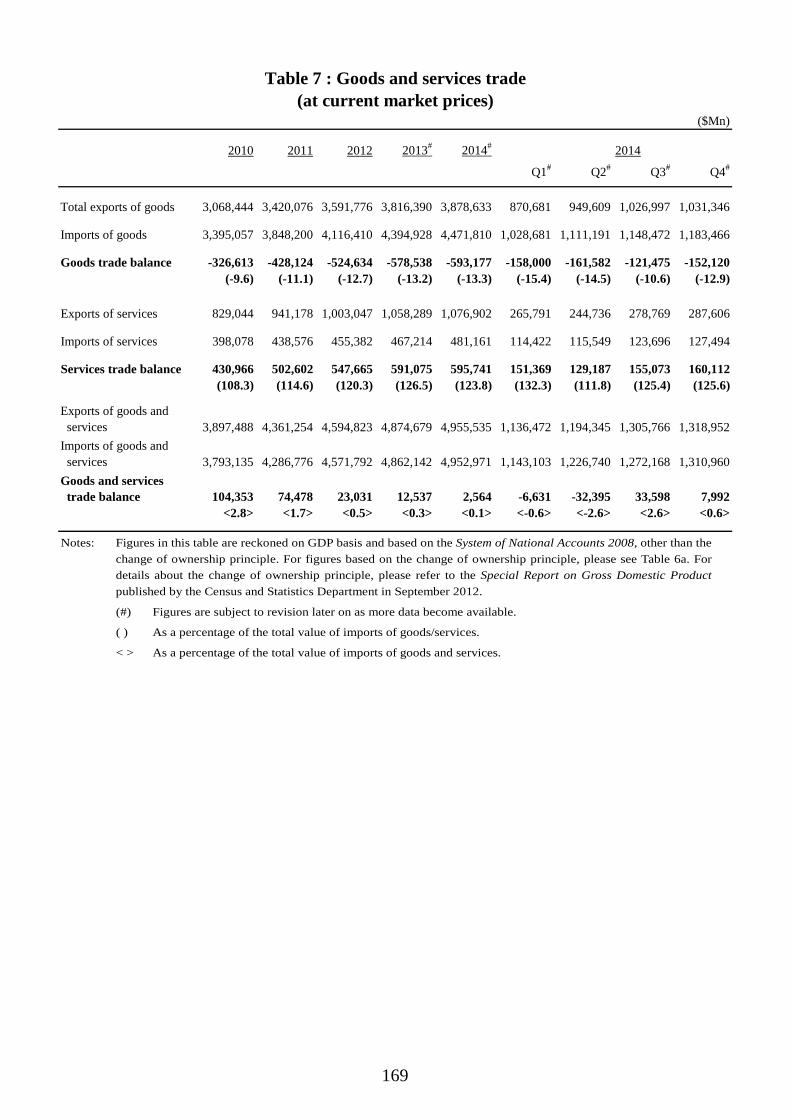
169
($Mn)
2010 2011 2012 2013# 2014# 2014
Q1# Q2# Q3# Q4#
Total exports of goods 3,068,444 3,420,076 3,591,776 3,816,390 3,878,633 870,681 949,609 1,026,997 1,031,346
Imports of goods 3,395,057 3,848,200 4,116,410 4,394,928 4,471,810 1,028,681 1,111,191 1,148,472 1,183,466
Goods trade balance -326,613 -428,124 -524,634 -578,538 -593,177 -158,000 -161,582 -121,475 -152,120(-9.6) (-11.1) (-12.7) (-13.2) (-13.3) (-15.4) (-14.5) (-10.6) (-12.9)
Exports of services 829,044 941,178 1,003,047 1,058,289 1,076,902 265,791 244,736 278,769 287,606
Imports of services 398,078 438,576 455,382 467,214 481,161 114,422 115,549 123,696 127,494
Services trade balance 430,966 502,602 547,665 591,075 595,741 151,369 129,187 155,073 160,112(108.3) (114.6) (120.3) (126.5) (123.8) (132.3) (111.8) (125.4) (125.6)
Exports of goods and services 3,897,488 4,361,254 4,594,823 4,874,679 4,955,535 1,136,472 1,194,345 1,305,766 1,318,952Imports of goods and services 3,793,135 4,286,776 4,571,792 4,862,142 4,952,971 1,143,103 1,226,740 1,272,168 1,310,960Goods and services trade balance 104,353 74,478 23,031 12,537 2,564 -6,631 -32,395 33,598 7,992
<2.8> <1.7> <0.5> <0.3> <0.1> <-0.6> <-2.6> <2.6> <0.6>
Table 7 : Goods and services trade(at current market prices)
Notes: Figures in this table are reckoned on GDP basis and based on the System of National Accounts 2008, other than the change of ownership principle. For figures based on the change of ownership principle, please see Table 6a. For details about the change of ownership principle, please refer to the Special Report on Gross Domestic Product published by the Census and Statistics Department in September 2012.
(#) Figures are subject to revision later on as more data become available.
( ) As a percentage of the total value of imports of goods/services.
< > As a percentage of the total value of imports of goods and services.

170
2010 2011 2012 2013# 2014# 2014
Q1# Q2# Q3# Q4#
At current market prices ($Mn)
Total exports of goods 3,021,492 3,406,765 3,632,957 3,926,059 4,028,458 899,748 974,133 1,069,763 1,084,814
Imports of goods 2,995,928 3,464,968 3,779,686 4,142,651 4,261,122 978,660 1,058,831 1,093,256 1,130,375
Goods trade balance 25,564 -58,203 -146,729 -216,592 -232,664 -78,912 -84,698 -23,493 -45,561(0.9) (-1.7) (-3.9) (-5.2) (-5.5) (-8.1) (-8.0) (-2.1) (-4.0)
Exports of services 625,719 710,716 764,026 812,345 822,834 210,799 192,007 209,317 210,711
Imports of services 546,930 578,035 594,266 583,216 587,606 138,518 139,704 152,226 157,158
Services trade balance 78,789 132,681 169,760 229,129 235,228 72,281 52,303 57,091 53,553(14.4) (23.0) (28.6) (39.3) (40.0) (52.2) (37.4) (37.5) (34.1)
Exports of goods and services 3,647,211 4,117,481 4,396,983 4,738,404 4,851,292 1,110,547 1,166,140 1,279,080 1,295,525
Imports of goods and services 3,542,858 4,043,003 4,373,952 4,725,867 4,848,728 1,117,178 1,198,535 1,245,482 1,287,533
Goods and services trade balance 104,353 74,478 23,031 12,537 2,564 -6,631 -32,395 33,598 7,992
<2.9> <1.8> <0.5> <0.3> <0.1> <-0.6> <-2.7> <2.7> <0.6>
Rates of change in real terms (%)
Total exports of goods 18.0 4.6 3.3 8.2 2.0 2.1 3.5 1.5 1.1
Imports of goods 19.9 6.7 4.6 9.9 2.2 3.2 2.7 1.0 1.9
Exports of services 15.3 5.7 2.7 5.9 0.2 4.5 -2.8 0.3 -1.2
Imports of services 10.0 -0.2 2.2 -1.9 -0.2 -2.9 1.6 1.0 -0.4
Table 7a : Goods and services trade based on the change of ownership principle
Notes: Figures in this table are reckoned on GDP basis and based on the System of National Accounts 2008.
Statistics on goods and services trade presented in this table provide supplementary information for analysis of international trade in goods and services, compiled using the change of ownership principle in recording goods sent abroad for processing and merchanting under the System of National Accounts 2008. The statistics are consistent with the goods and services statistics in the current account of Hong Kong's Balance of Payments. For details about the change of ownership principle, please refer to the Special Report on Gross Domestic Product published by the Census and Statistics Department in September 2012.
(#) Figures are subject to revision later on as more data become available.
( ) As a percentage of the total value of imports of goods/services.
< > As a percentage of the total value of imports of goods and services.
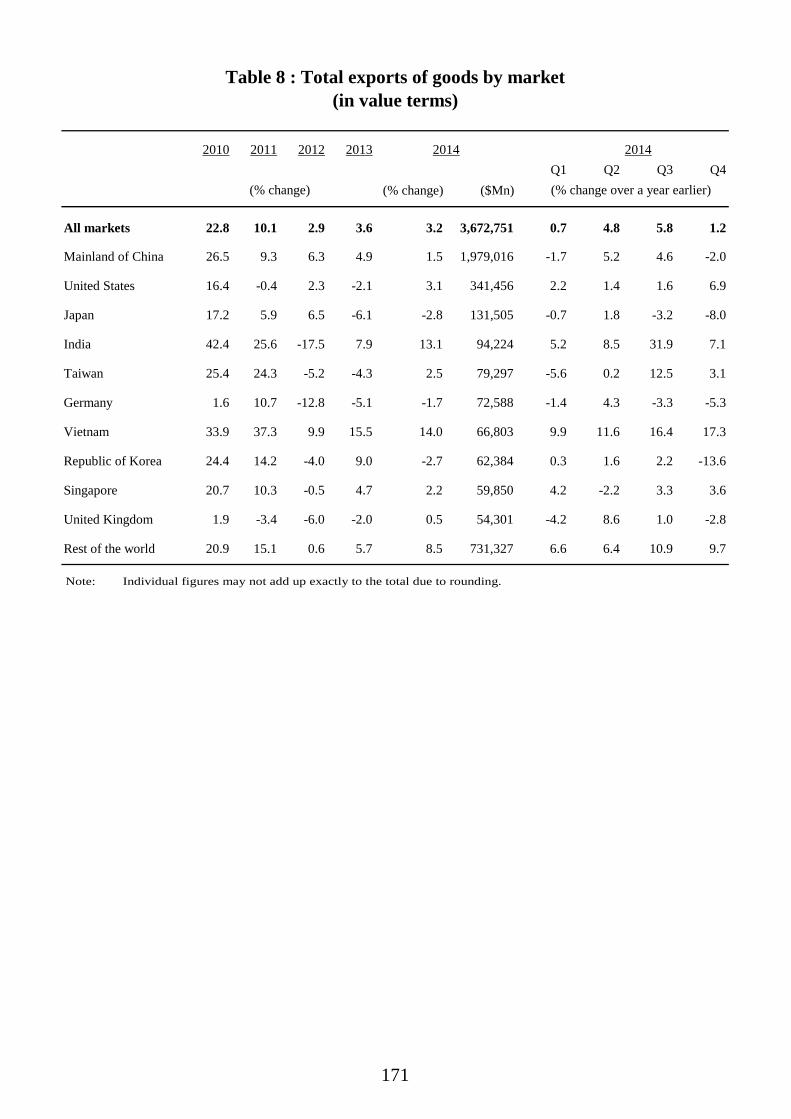
171
2010 2011 2012 2013 2014Q1 Q2 Q3 Q4
(% change) ($Mn)
All markets 22.8 10.1 2.9 3.6 3.2 3,672,751 0.7 4.8 5.8 1.2
Mainland of China 26.5 9.3 6.3 4.9 1.5 1,979,016 -1.7 5.2 4.6 -2.0
United States 16.4 -0.4 2.3 -2.1 3.1 341,456 2.2 1.4 1.6 6.9
Japan 17.2 5.9 6.5 -6.1 -2.8 131,505 -0.7 1.8 -3.2 -8.0
India 42.4 25.6 -17.5 7.9 13.1 94,224 5.2 8.5 31.9 7.1
Taiwan 25.4 24.3 -5.2 -4.3 2.5 79,297 -5.6 0.2 12.5 3.1
Germany 1.6 10.7 -12.8 -5.1 -1.7 72,588 -1.4 4.3 -3.3 -5.3
Vietnam 33.9 37.3 9.9 15.5 14.0 66,803 9.9 11.6 16.4 17.3
Republic of Korea 24.4 14.2 -4.0 9.0 -2.7 62,384 0.3 1.6 2.2 -13.6
Singapore 20.7 10.3 -0.5 4.7 2.2 59,850 4.2 -2.2 3.3 3.6
United Kingdom 1.9 -3.4 -6.0 -2.0 0.5 54,301 -4.2 8.6 1.0 -2.8
Rest of the world 20.9 15.1 0.6 5.7 8.5 731,327 6.6 6.4 10.9 9.7
Table 8 : Total exports of goods by market(in value terms)
2014
(% change over a year earlier)(% change)
Note: Individual figures may not add up exactly to the total due to rounding.
172
2010 2011 2012 2013 2014Q1 Q2 Q3 Q4
(% change) ($Mn)
All sources 25.0 11.9 3.9 3.8 3.9 4,219,046 2.1 4.5 5.7 3.2
Mainland of China 22.4 10.9 8.5 5.5 2.3 1,986,964 -2.4 2.9 5.0 3.1
Taiwan 28.0 7.2 1.6 6.9 14.7 300,278 11.3 14.7 19.7 12.6
Japan 30.4 3.4 -2.2 -8.1 0.9 288,891 2.3 6.2 -0.5 -3.7
Singapore 35.9 7.2 -3.2 * 5.8 260,801 0.2 11.5 10.3 1.9
United States 26.0 18.0 -3.3 7.4 * 219,599 4.2 2.3 -0.7 -4.5
Republic of Korea 29.8 12.2 2.4 3.4 10.6 175,537 7.8 11.3 7.2 15.8
Malaysia 24.5 5.1 -6.0 4.7 16.7 102,191 25.7 30.6 11.3 3.9
India 36.5 20.6 -5.5 6.7 10.0 96,088 1.0 1.8 12.4 28.1
Thailand 32.5 0.3 -4.8 6.4 13.7 88,132 19.2 10.8 14.7 10.7
Switzerland 26.3 51.7 -0.7 -1.7 2.7 79,291 2.6 2.6 3.4 2.3
Rest of the world 19.2 20.2 5.8 3.8 0.9 621,274 5.4 -3.3 2.4 -0.6
2010 2011 2012 2013 2014Q1 Q2 Q3 Q4
(% change) ($Mn)
Overall 27.3 17.3 3.0 4.5 5.8 1,168,291 5.8 3.7 5.0 8.4
Foodstuffs 17.0 18.8 5.1 14.7 9.8 144,710 5.0 15.6 11.7 7.9
Consumer goods 33.8 36.0 5.9 1.0 8.6 290,822 4.3 5.0 15.1 10.0
Raw materials and semi-manufactures 32.3 0.2 -6.5 11.4 14.7 391,421 20.9 8.4 11.3 19.5
Fuels 33.8 21.9 -4.2 -2.7 -10.9 117,726 -10.0 -2.1 -8.5 -21.6
Capital goods 12.9 27.3 19.0 -1.5 -4.8 220,017 -6.6 -9.3 -14.1 8.3
2014
(% change) (% change over a year earlier)
(% change)
Table 9 : Imports of goods by source(in value terms)
Table 10 : Retained imports of goods by end-use category(in value terms)
2014
(% change over a year earlier)
Notes: Individual figures may not add up exactly to the total due to rounding. (*) Change within ±0.05%.
Note: Individual figures may not add up exactly to the total due to rounding.

173
2010 2011 2012 2013# 2014Q1# Q2# Q3# Q4#
(% change) ($Mn)
Exports of services 23.2 13.5 6.6 5.5 1.8 1,076,902 4.4 -0.7 2.9 0.5
Transportation 26.3 7.8 -0.6 -2.5 1.3 245,631 0.2 2.8 3.0 -0.9
Travel 35.6 28.4 15.8 17.7 -1.4 297,603 10.2 -9.1 -3.1 -3.1
Trade-related 18.0 11.0 3.9 2.1 3.3 296,611 1.5 3.4 5.0 3.0
Other services 16.4 10.1 9.0 4.6 4.5 237,057 4.7 2.4 7.7 3.0
Imports of services 17.3 10.2 3.8 2.6 3.0 481,161 0.2 7.7 4.8 -0.1
Transportation 20.7 14.3 2.3 -1.4 1.8 143,048 -0.3 5.2 3.7 -1.7
Travel 11.9 9.8 5.2 5.7 4.2 171,494 -2.7 12.8 6.2 0.9
Trade-related 21.6 1.1 1.7 -2.7 3.0 33,805 2.9 4.6 4.2 1.1
Other services 19.5 8.7 4.6 4.8 2.7 132,814 3.3 4.3 4.2 -0.1
Net exports of services 29.2 16.6 9.0 7.9 0.8 595,741 7.9 -7.2 1.4 0.9
(% change over a year earlier)(% change)
Table 11 : Exports and imports of services by component(at current market prices)
2014#
Notes: Individual figures may not add up exactly to the total due to rounding.
Figures are based on the System of National Accounts 2008, other than the change of ownership principle. For figures based on the change of ownership principle, please see Table 10a. For details about the change of ownership principle, please refer to the Special Report on Gross Domestic Product published by the Census and Statistics Department in September 2012.
(#) Figures are subject to revision later on as more data become available.

174
2010 2011 2012 2013# 2014Q1# Q2# Q3# Q4#
(% change) ($Mn)
Exports of services 24.8 13.6 7.5 6.3 1.3 822,834 5.2 -1.8 2.2 -0.4
Transportation 26.3 7.8 -0.6 -2.5 1.3 245,631 0.2 2.8 3.0 -0.9
Travel 35.6 28.4 15.8 17.7 -1.4 297,603 10.2 -9.1 -3.1 -3.1
Other services 16.2 8.1 8.3 3.5 4.3 279,600 4.3 2.5 7.3 3.0
Imports of services 15.5 5.7 2.8 -1.9 0.8 587,606 -2.5 3.9 3.3 -1.5
Transportation 20.7 14.3 2.3 -1.4 1.8 143,048 -0.3 5.2 3.7 -1.7
Travel 11.9 9.8 5.2 5.7 4.2 171,494 -2.7 12.8 6.2 0.9
Other services 15.1 0.1 1.9 -6.0 -1.8 273,064 -3.4 -2.4 1.4 -2.7
(% change)
Table 11a : Exports and imports of services based on the change of ownershipprinciple by component (at current market prices)
2014#
(% change over a year earlier)
Notes: Individual figures may not add up exactly to the total due to rounding.
Statistics on exports and imports of services presented in this table provide supplementary information for analysis of international trade in goods and services, compiled using the change of ownership principle in recording goods sent abroad for processing and merchanting under the System of National Accounts 2008. The statistics are consistent with the goods and services statistics in the current account of Hong Kong's Balance of Payments. For details about the change of ownership principle, please refer to the Special Report on Gross Domestic Product published by the Census and Statistics Department in September 2012.
(#) Figures are subject to revision later on as more data become available.

175
2010 2011 2012 2013 2014 2014Q1 Q2 Q3 Q4
('000)
All sources 36 030.3 41 921.3 48 615.1 54 298.8 60 838.8 14 698.0 13 831.2 16 129.9 16 179.7
Mainland of China 22 684.4 28 100.1 34 911.4 40 745.3 47 247.7 11 406.7 10 416.1 12 839.5 12 585.3
South and Southeast Asia 3 500.9 3 751.1 3 651.8 3 718.0 3 614.8 846.6 973.6 791.4 1 003.2
Taiwan 2 164.8 2 148.7 2 088.7 2 100.1 2 031.9 491.1 500.7 555.3 484.8
Europe 1 757.8 1 801.3 1 867.7 1 893.7 1 863.3 481.5 454.1 404.1 523.6
United States 1 171.4 1 212.3 1 184.8 1 109.8 1 130.6 264.4 296.6 262.3 307.2
Japan 1 316.6 1 283.7 1 254.6 1 057.0 1 078.8 274.4 254.0 285.7 264.8
Others 3 434.5 3 623.9 3 656.1 3 674.9 3 871.9 933.4 936.1 991.5 1 010.9
(% change over a year earlier)
All sources 21.8 16.4 16.0 11.7 12.0 15.3 9.6 11.2 12.1
Mainland of China 26.3 23.9 24.2 16.7 16.0 20.1 11.8 13.8 18.2
South and Southeast Asia 21.3 7.1 -2.6 1.8 -2.8 3.4 0.1 -2.4 -10.1
Taiwan 7.7 -0.7 -2.8 0.5 -3.2 -4.7 2.4 -2.0 -8.5
Europe 9.1 2.5 3.7 1.4 -1.6 -0.3 -1.5 -0.5 -3.7
United States 9.5 3.5 -2.3 -6.3 1.9 -2.2 4.1 6.7 -0.5
Japan 9.3 -2.5 -2.3 -15.7 2.1 2.6 7.1 5.4 -5.9
Others 20.3 5.5 0.9 0.5 5.4 5.2 8.2 8.6 0.1
Table 12 : Incoming visitors by source
Note: Individual figures may not add up exactly to the total due to rounding.

176
2005 2006 2007 2008 2009 2010 2011
Residential property(a) (in units) 17 321 16 579 10 471 8 776 7 157 13 405 9 449Commercial property 145 291 368 390 235 189 197
of which :Office space 34 108 320 341 151 124 155Other commercial premises(b) 111 183 48 49 84 65 42
Industrial property(c) 17 27 16 78 3 21 105of which :Industrial-cum-office premises 4 0 0 4 0 0 0Conventional flatted factory space 0 0 16 70 3 21 32Storage premises(d) 13 27 0 4 0 0 73
Production of public housing(in units)Rental housing flats(e) 24 691 4 430 4 795 22 759 19 021 6 385 17 787Subsidised sales flats(e) 0 0 2 010 2 200 370 1 110 0
Residential property 550.7 706.7 900.0 530.0 546.8 570.5 580.6Commercial property 481.9 468.4 327.5 147.7 178.3 158.4 133.6Industrial property(f) 35.1 23.9 103.5 106.6 97.1 34.3 109.3Other properties 408.0 199.2 207.7 212.8 253.2 459.2 232.7Total 1 475.8 1 398.2 1 538.6 997.1 1 075.4 1 222.4 1 056.2
Residential property(g) 103 362 82 472 123 575 95 931 115 092 135 778 84 462Primary market 15 994 13 986 20 123 11 046 16 161 13 646 10 880Secondary market 87 368 68 486 103 452 84 885 98 931 122 132 73 582
Selected types of non-residential properties(h)
Office space 3 431 2 874 4 129 2 845 2 521 3 591 3 071Other commerical premises 7 143 4 402 5 490 4 149 5 359 7 639 5 980Flatted factory space 6 560 7 409 9 072 5 741 5 554 8 206 7 619
Table 13 : Property market
Completion of new property by the private sector('000 m2 of internal floor area)
Building plans with consent to commence work in the private sector('000 m2 of usable floor area)
Agreements for sale and purchase of property(Number)
Notes: Individual figures may not add up exactly to the total due to rounding. (a) Figures before 2002 cover all completed residential premises to which either temporary or full Occupation
Permits have been granted, as well as village type houses issued with Letters of Compliance. Property developments subject to a Consent Scheme need a Certificate of Compliance, Consent to Assign or Consent to Lease in addition to an Occupation Permit before the premises can be individually assigned. Village-type housing units are excluded as from 2002 and units issued with temporary Occupation Permits are also excluded as from 2004 onwards.
Residential premises here pertain to private residential units, excluding units built under the Private Sector Participation Scheme (PSPS), Home Ownership Scheme (HOS), Buy or Rent Option, Mortgage Subsidy Scheme, Sandwich Class Housing Scheme, Urban Improvement Scheme (UIS) and Flat-for-Sale Scheme. Figures from 2004 onwards also cover those private flats converted from subsidised flats.
(b) These include retail premises and other premises designed or adapted for commercial use, with the exception of purpose-built offices. Car-parking space and commercial premises built by the Hong Kong Housing Authority and the Hong Kong Housing Society are excluded.
(c) These include industrial-cum-office premises, but exclude specialised factory buildings which are developed mainly for own use.
(d) These include storage premises at the container terminals and the airport.

177
2012 2013 2014 2014Q1 Q2 Q3 Q4
Residential property(a) (in units) 10 149 8 254 15 719 2 879 4 653 4 652 3 535Commercial property 226 161 161 77 11 7 66
of which :Office space 136 123 104 58 0 2 44Other commercial premises(b) 90 39 57 19 11 5 22
Industrial property(c) 170 85 116 16 9 11 80of which :Industrial-cum-office premises 0 0 0 0 0 0 0Conventional flatted factory space 46 85 36 16 9 11 0Storage premises(d) 123 0 80 0 0 0 80
Production of public housing(in units)Rental housing flats(e) 9 778 20 898 N.A. 3 566 990 0 N.A.Subsidised sales flats(e) 0 0 N.A. 0 0 0 N.A.
Residential property 796.4 816.0 N.A. 77.7 206.7 161.2 N.A.Commercial property 210.2 309.5 N.A. 43.3 100.4 128.6 N.A.Industrial property(f) 70.7 138.1 N.A. 0.0 20.8 0.0 N.A.Other properties 428.9 136.4 N.A. 68.7 48.3 36.1 N.A.Total 1 506.1 1 400.1 N.A. 189.7 376.2 325.9 N.A.
Residential property(g) 81 333 50 676 63 807 10 788 16 011 19 962 17 046Primary market 12 968 11 046 16 857 3 595 3 352 5 295 4 615Secondary market 68 365 39 630 46 950 7 193 12 659 14 667 12 431
Selected types of non-residential properties(h)
Office space 3 269 1 685 1 268 205 276 463 324Other commerical premises 7 282 4 305 3 095 671 838 890 696Flatted factory space 9 731 4 271 2 996 596 683 904 813
Table 13 : Property market (Cont'd)
Completion of new property by the private sector('000 m2 of internal floor area)
Building plans with consent to commence work in the private sector('000 m2 of usable floor area)
Agreements for sale and purchase of property(Number)
Notes: (e) The series, sourced from the Housing Authority's housing production figures, exhaustively cover all housing (cont'd) production and to count projects (including surplus HOS projects) which undergo transfer of usage at the time of
disposal and according to their actual usage. Moreover, surplus HOS courts and blocks pending disposal are excluded from production statistics until they are disposed. Rental and sales flats projects of the Housing Society are included.
(f) These include multi-purpose industrial premises designed also for office use. (g) The figures are derived from sale and purchase agreements of domestic units received for registration for the
relevant periods. They generally relate to transactions executed up to four weeks prior to their submission for registration. Sales of domestic units refer to sale and purchase agreements with payment of stamp duty. These statistics do not include sales of units under the Home Ownership Scheme, the Private Sector Participation Scheme and the Tenants Purchase Scheme except those after payment of premium. Primary sales generally refer to sales from developers. Secondary sales refer to sales from parties other than developers.
(h) Timing of the figures for non-residential properties is based on the date on which the sale and purchase agreement is signed, which may differ from the date on which the agreement is received for registration.
N.A. Not yet available.

178
2005 2006 2007 2008 2009 2010 2011
(Index (1999=100))
Property price indices :Residential flats(a) 92.0 92.7 103.5 120.5 121.3 150.9 182.1
Office space 133.0 139.3 165.5 199.0 179.8 230.4 297.9
Shopping space 149.3 153.5 172.5 192.2 193.1 257.2 327.4
Flatted factory space 125.0 158.5 199.5 235.9 216.3 284.4 385.0
Property rental indices(b) :
Residential flats 86.5 91.6 101.8 115.7 100.4 119.7 134.0
Office space 96.4 117.4 131.9 155.5 135.7 147.6 169.9
Shopping space 100.5 104.3 111.8 116.2 110.9 122.9 134.3
Flatted factory space 82.6 91.0 100.5 109.3 99.4 108.9 118.6
(% change)
Property price indices :Residential flats(a) 17.9 0.8 11.7 16.4 0.7 24.4 20.7
Office space 33.9 4.7 18.8 20.2 -9.6 28.1 29.3
Shopping space 25.1 2.8 12.4 11.4 0.5 33.2 27.3
Flatted factory space 41.1 26.8 25.9 18.2 -8.3 31.5 35.4
Property rental indices(b) :
Residential flats 11.3 5.9 11.1 13.7 -13.2 19.2 11.9
Office space 23.4 21.8 12.4 17.9 -12.7 8.8 15.1
Shopping space 8.3 3.8 7.2 3.9 -4.6 10.8 9.3
Flatted factory space 6.9 10.2 10.4 8.8 -9.1 9.6 8.9
Table 14 : Property prices and rentals
Notes: (a) Figures pertain to prices of existing flats traded in the secondary market, but not new flats sold in the primary market.
(b) All rental indices shown in this table have been adjusted for concessionary leasing terms such as provision of refurbishment, granting of rent-free periods, and waiver of miscellaneous charges, if known.
For residential property, changes in rentals cover only new tenancies for which rentals are freshly determined. For non-residential property, changes in rentals cover also lease renewals upon which rentals may be revised.
(#) Figures for non-residential property are provisional.
(+) Provisional figures.

179
2012 2013 2014 2014Q1 Q2 Q3# Q4+
(Index (1999=100))
Property price indices :Residential flats(a) 206.2 242.4 256.8 244.2 247.6 261.3 274.0
Office space 334.7 409.8 423.3 417.2 420.8 425.4 429.7
Shopping space 420.5 506.8 520.6 505.5 513.7 523.4 539.8
Flatted factory space 489.8 655.4 668.2 653.2 662.4 672.8 684.6
Property rental indices(b) :
Residential flats 142.6 154.5 159.4 155.3 156.6 160.9 164.9
Office space 188.3 204.1 213.5 209.1 212.2 215.7 216.8
Shopping space 151.3 165.5 172.9 169.3 172.5 174.2 175.6
Flatted factory space 131.9 147.3 159.9 153.9 158.2 162.6 164.7
(% change over a year earlier)
Property price indices :Residential flats(a) 13.2 17.6 5.9 2.8 2.7 6.4 11.7
Office space 12.4 22.4 3.3 4.2 2.7 2.4 3.8
Shopping space 28.4 20.5 2.7 0.8 0.9 2.5 6.7
Flatted factory space 27.2 33.8 2.0 2.6 0.7 0.3 4.4
Property rental indices(b) :
Residential flats 6.4 8.3 3.2 2.4 2.0 3.3 5.2
Office space 10.8 8.4 4.6 6.2 4.3 3.8 4.2
Shopping space 12.7 9.4 4.5 5.5 4.1 3.6 4.6
Flatted factory space 11.2 11.7 8.6 9.5 8.3 7.8 8.5
Table 14 : Property prices and rentals (Cont'd)

180
2005 2006 2007 2008 2009 2010 2011
(as at end of period)Hong Kong dollar money supply ($Mn)
M1 348,248 387,909 454,342 491,115 671,241 730,093 794,726M2(a) 2,329,669 2,777,679 3,281,017 3,239,857 3,587,717 3,866,788 4,046,216M3(a) 2,345,838 2,795,545 3,300,500 3,261,306 3,604,843 3,878,193 4,055,404
Total money supply ($Mn)M1 434,684 491,648 616,709 645,833 901,819 1,017,227 1,127,320M2 4,379,057 5,054,332 6,106,348 6,268,058 6,602,310 7,136,271 8,057,530M3 4,407,188 5,089,741 6,139,758 6,300,751 6,626,843 7,156,260 8,081,079
Deposit ($Mn)HK$ 2,131,579 2,568,283 3,075,042 3,033,980 3,373,595 3,617,183 3,740,240Foreign currency 1,936,322 2,188,993 2,793,856 3,024,004 3,007,445 3,245,081 3,851,020Total 4,067,901 4,757,275 5,868,898 6,057,984 6,381,040 6,862,265 7,591,260
Loans and advances ($Mn)HK$ 1,797,350 1,917,437 2,184,705 2,354,755 2,401,323 2,824,445 3,160,002Foreign currency 514,637 550,392 776,971 930,883 887,160 1,403,281 1,920,659Total 2,311,987 2,467,828 2,961,676 3,285,638 3,288,483 4,227,726 5,080,661
Trade-weighted 112.6 111.1 106.3 100.7 101.9 99.5 94.6Import-weighted 114.1 112.6 107.6 101.3 102.2 99.2 93.9Export-weighted 110.9 109.6 104.8 100.1 101.6 99.8 95.4
(% change)Hong Kong dollar money supply
M1 -15.6 11.4 17.1 8.1 36.7 8.8 8.9M2(a) 5.5 19.2 18.1 -1.3 10.7 7.8 4.6M3(a) 5.7 19.2 18.1 -1.2 10.5 7.6 4.6
Total money supplyM1 -10.3 13.1 25.4 4.7 39.6 12.8 10.8M2 5.1 15.4 20.8 2.6 5.3 8.1 12.9M3 5.2 15.5 20.6 2.6 5.2 8.0 12.9
DepositHK$ 5.6 20.5 19.7 -1.3 11.2 7.2 3.4Foreign currency 4.8 13.0 27.6 8.2 -0.5 7.9 18.7Total 5.2 16.9 23.4 3.2 5.3 7.5 10.6
Loans and advancesHK$ 7.8 6.7 13.9 7.8 2.0 17.6 11.9Foreign currency 5.3 6.9 41.2 19.8 -4.7 58.2 36.9Total 7.2 6.7 20.0 10.9 0.1 28.6 20.2
Trade-weighted -0.9 -1.3 -4.3 -5.3 1.2 -2.4 -4.9Import-weighted -1.1 -1.3 -4.4 -5.9 0.9 -2.9 -5.3Export-weighted -0.7 -1.2 -4.4 -4.5 1.5 -1.8 -4.4
Table 15 : Monetary aggregates
Nominal Effective Exchange Rate Indices(Jan 2010 =100)(b)
Nominal Effective Exchange Rate Indices(Jan 2010 =100)(b)
Definition
of Terms
: The Hong Kong Dollar Money Supply is the Hong Kong dollar component of the respective monetary aggregate.
Total Money Supply: M1: Legal tender notes and coins with the public, plus customers’ demand deposits with licensed banks.
M2: M1 plus customers’ savings and time deposits with licensed banks, plus negotiable certificates of deposit issued by licensed banks and held outside the monetary sector.
M3: M2 plus customers’ deposits with restricted licence banks and deposit-taking companies, plus negotiable certificates of deposit issued by such institutions and held outside the monetary sector.

181
2012 2013 2014 2014Q1 Q2 Q3 Q4
(as at end of period)Hong Kong dollar money supply ($Mn)
M1 920,920 1,000,344 1,116,675 1,014,042 1,081,475 1,100,139 1,116,675M2(a) 4,537,384 4,795,130 5,225,801 4,861,544 5,140,282 5,211,895 5,225,801M3(a) 4,545,590 4,806,012 5,236,215 4,873,038 5,151,120 5,222,564 5,236,215
Total money supply ($Mn)M1 1,377,359 1,510,895 1,707,552 1,522,509 1,628,109 1,677,934 1,707,552M2 8,950,005 10,056,437 11,012,130 10,145,621 10,599,021 10,911,011 11,012,130M3 8,970,396 10,085,243 11,049,702 10,177,899 10,632,038 10,947,313 11,049,702
Deposit ($Mn)HK$ 4,176,200 4,390,953 4,800,358 4,445,310 4,712,873 4,785,302 4,800,358Foreign currency 4,120,234 4,789,109 5,273,535 4,743,682 4,899,221 5,134,316 5,273,535Total 8,296,434 9,180,062 10,073,892 9,188,992 9,612,094 9,919,618 10,073,892
Loans and advances ($Mn)HK$ 3,333,059 3,606,018 4,000,361 3,747,851 3,889,193 3,915,548 4,000,361Foreign currency 2,233,751 2,850,795 3,275,685 3,078,485 3,184,500 3,294,478 3,275,685Total 5,566,810 6,456,813 7,276,046 6,826,336 7,073,693 7,210,026 7,276,046
Trade-weighted 94.9 94.9 96.0 95.1 95.8 95.7 97.4Import-weighted 94.2 94.7 96.0 95.1 95.8 95.6 97.2Export-weighted 95.6 95.1 95.9 95.0 95.9 95.8 97.7
(% change over a year earlier)Hong Kong dollar money supply
M1 15.9 8.6 11.6 7.3 13.1 11.4 11.6M2(a) 12.1 5.7 9.0 7.1 13.1 9.7 9.0M3(a) 12.1 5.7 9.0 7.1 13.1 9.7 9.0
Total money supplyM1 22.2 9.7 13.0 9.5 14.0 13.1 13.0M2 11.1 12.4 9.5 12.1 15.0 12.2 9.5M3 11.0 12.4 9.6 12.2 15.0 12.3 9.6
DepositHK$ 11.7 5.1 9.3 6.7 13.1 9.9 9.3Foreign currency 7.0 16.2 10.1 13.3 13.6 12.8 10.1Total 9.3 10.7 9.7 10.0 13.3 11.4 9.7
Loans and advancesHK$ 5.5 8.2 10.9 11.6 11.4 8.9 10.9Foreign currency 16.3 27.6 14.9 29.5 22.2 17.5 14.9Total 9.6 16.0 12.7 19.0 16.0 12.7 12.7
Trade-weighted 0.3 0.0 1.2 0.4 0.8 0.4 3.0Import-weighted 0.3 0.5 1.4 0.8 1.1 0.4 2.7Export-weighted 0.2 -0.5 0.8 -0.2 0.7 0.4 3.2
Table 15 : Monetary aggregates (Cont'd)
Nominal Effective Exchange Rate Indices(Jan 2010 =100)(b)
Nominal Effective Exchange Rate Indices(Jan 2010 =100)(b)
Notes: (a) Adjusted to include foreign currency swap deposits.
(b) Period average.
182
Table 16 : Rates of change in business receipts indices forservices industries/domains
(%)
2010 2011 2012 2013 2013 2014
Q4 Q1 Q2 Q3
Services Industry
Import and export trade 19.7 8.9 -1.3 -0.3 -1.8 0.9 -0.5 0.8
Wholesale 25.0 12.7 3.2 4.3 5.1 3.1 3.4 -1.7
Retail 18.3 24.9 9.8 11.0 6.8 4.2 -7.0 1.6
Transportation 24.5 4.4 0.9 1.4 4.3 5.9 7.2 7.4within which :Land transport 6.0 7.0 11.9 8.0 11.4 8.5 8.0 7.9Water transport 20.5 0.6 -2.4 -2.9 -2.0 4.9 8.7 7.3Air transport 33.7 6.7 0.3 2.4 6.5 5.5 5.8 7.2
Warehousing and storage 9.5 9.4 25.2 8.2 16.6 10.8 10.0 7.8
Courier 28.3 17.3 16.1 26.1 19.8 24.7 13.8 -15.9
Accommodation services(a) 25.3 19.6 13.8 5.6 2.9 10.0 9.8 9.6
Food services 5.1 6.4 5.0 3.5 2.0 3.6 3.8 4.9
Information and communications 4.9 8.8 9.3 6.0 2.4 -0.1 -0.4 8.1within which :Telecommunications 3.0 8.1 14.7 8.0 3.8 1.0 5.3 12.9Film entertainment -6.4 -5.6 1.9 -4.3 -7.9 -2.5 -17.8 -13.5
Banking 8.8 10.8 9.4 16.8 18.6 5.5 3.8 11.3
Financing (except banking) 16.7 -2.4 1.6 2.6 -5.4 -5.8 0.7 18.6within which :Financial markets and asset management 15.3 -3.2 1.7 1.0 -8.2 -4.7 0.4 23.1
within which : Asset management 28.4 10.6 -5.4 14.9 19.5 4.8 4.9 14.4
Insurance 8.3 9.4 13.6 15.1 18.6 23.1 19.0 17.3
Real estate 11.4 -0.9 11.8 0.1 8.4 2.3 22.1 25.7
Professional, scientific and technical services 13.9 7.3 -0.5 7.2 7.3 6.9 6.2 7.9
Administrative and support services 12.3 10.2 8.2 9.5 8.6 11.6 10.2 5.6
Services Domain
Tourism, convention and exhibition services 30.6 23.8 15.1 17.8 9.7 6.9+ -7.5+ 2.5+
Computer and information technology services 32.5 10.4 15.1 2.1 0.8 -7.8 0.7 0.4
Notes: Upon the implementation of the new HSIC Version 2.0 by the C&SD in October 2008, the new classification has been adopted in compiling the quarterly business receipts indices. Starting from the first quarter of 2009, all business receipts indices are compiled based on the HSIC Version 2.0, and the base period of the indices has been changed to 2008 (i.e. with the quarterly average of the indices in 2008 taken as 100). The series of business receipts indices under the HSIC Version 2.0 has also been backcasted to the first quarter of 2005.
(a) Accommodation services covers hotels, guesthouses, boarding houses and other establishments providing short term accommodation.
(+) Provisional figures.
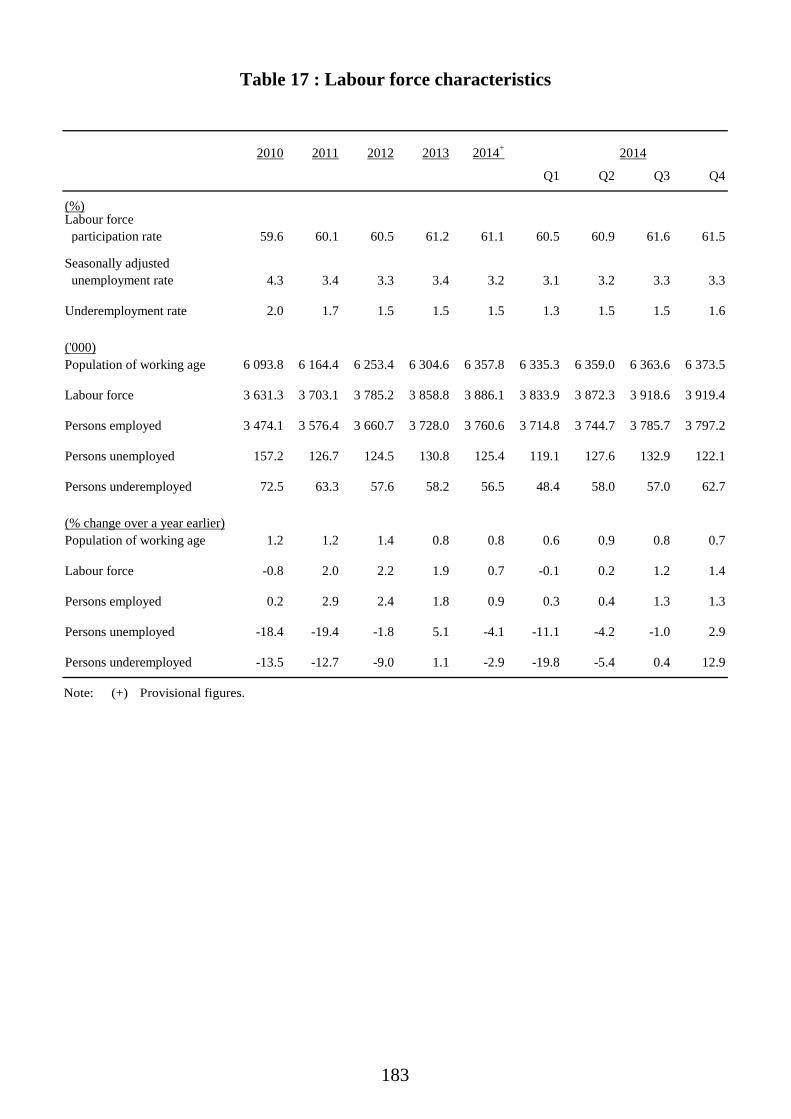
183
2010 2011 2012 2013 2014+ 2014
Q1 Q2 Q3 Q4
(%)Labour force participation rate 59.6 60.1 60.5 61.2 61.1 60.5 60.9 61.6 61.5
Seasonally adjusted unemployment rate 4.3 3.4 3.3 3.4 3.2 3.1 3.2 3.3 3.3
Underemployment rate 2.0 1.7 1.5 1.5 1.5 1.3 1.5 1.5 1.6
('000)Population of working age 6 093.8 6 164.4 6 253.4 6 304.6 6 357.8 6 335.3 6 359.0 6 363.6 6 373.5
Labour force 3 631.3 3 703.1 3 785.2 3 858.8 3 886.1 3 833.9 3 872.3 3 918.6 3 919.4
Persons employed 3 474.1 3 576.4 3 660.7 3 728.0 3 760.6 3 714.8 3 744.7 3 785.7 3 797.2
Persons unemployed 157.2 126.7 124.5 130.8 125.4 119.1 127.6 132.9 122.1
Persons underemployed 72.5 63.3 57.6 58.2 56.5 48.4 58.0 57.0 62.7
(% change over a year earlier)Population of working age 1.2 1.2 1.4 0.8 0.8 0.6 0.9 0.8 0.7
Labour force -0.8 2.0 2.2 1.9 0.7 -0.1 0.2 1.2 1.4
Persons employed 0.2 2.9 2.4 1.8 0.9 0.3 0.4 1.3 1.3
Persons unemployed -18.4 -19.4 -1.8 5.1 -4.1 -11.1 -4.2 -1.0 2.9
Persons underemployed -13.5 -12.7 -9.0 1.1 -2.9 -19.8 -5.4 0.4 12.9
Table 17 : Labour force characteristics
Note: (+) Provisional figures.

184
2009 2010 2011 2012 2013 2013Dec Mar Jun
Selected major industries (No.)
Manufacturing -5.7 -4.5 -5.6 -5.1 -3.0 -1.5 -0.5 -1.1 -1.2 102 642
Construction sites (manual workers only) 2.2 9.6 13.2 13.8 11.2 13.4 1.0 -3.4 12.7 86 534
Import and export trade -4.4 0.9 -0.3 -1.1 -0.2 -0.2 -0.9 * 0.5 491 911
Wholesale -2.0 1.2 * -0.6 -2.0 -1.3 -1.0 -0.3 0.8 62 520
Retail -0.3 3.3 4.0 2.5 2.3 2.9 2.8 2.7 1.9 269 813
Food and beverage services * 3.7 6.6 1.6 0.9 0.5 1.4 2.1 2.7 243 102
Accommodation services(a) -1.0 1.5 5.8 9.2 5.0 6.3 5.9 5.3 1.7 39 848
Transportation, storage, postal and courier services 1.1 1.5 2.0 1.8 2.0 2.6 2.1 3.1 2.6 175 449
Information and communications -1.6 1.3 3.4 5.6 5.1 6.2 4.6 2.4 2.2 104 787
Financing and insurance -0.5 4.8 6.3 1.9 1.0 2.8 2.5 3.2 1.8 214 671
Real estate 0.5 4.1 8.0 4.2 1.6 0.5 * 0.2 0.6 126 777
Professional and business services (excluding cleaning and similar services) 0.9 2.2 4.2 3.4 4.5 5.9 4.4 3.4 1.8 274 023
Cleaning and similar services 6.7 13.7 9.5 3.3 1.6 1.6 0.7 -0.1 * 79 081
Education 5.3 3.4 1.5 2.4 2.8 2.4 3.3 4.1 4.4 184 852
Human health services 3.8 3.0 4.1 4.9 5.2 4.9 4.9 4.2 3.7 111 538
Residential care and social work services 1.5 1.8 1.3 2.0 0.5 -0.5 -0.9 0.1 0.9 58 987
Arts, entertainment, recreation and other services 0.8 5.0 2.8 0.6 1.6 2.5 5.6 6.1 5.4 127 082
Civil service(b) 1.1 0.5 0.7 1.1 1.3 1.7 1.4 1.2 0.9 163 018
Others(c) -1.0 3.1 -0.6 -5.1 3.5 6.6 6.6 3.6 1.6 11 082
2014
Table 18 : Employment in selected major industries
(% change over a year earlier)Sep
(% change)
Notes: Starting from March 2009, the survey coverage has been expanded to include more economic activities in some of the industries due to the change in industrial classification based on the Hong Kong Standard Industrial Classification Version 2.0. The activities newly covered are in the industries of transportation, storage, postal and courier services; professional and business services; and arts, entertainment, recreation and other services. The series of employment statistics under the HSIC Version 2.0 has also been backcasted to March 2000.
(a) Accommodation services cover hotels, guesthouses, boarding houses and other establishments providing short term accommodation.
(b) These figures cover only those employed on civil service terms of appointment. Judges, judicial officers, ICAC officers, locally engaged staff working in the Hong Kong Economic and Trade Offices outside Hong Kong, and other government employees such as non-civil service contract staff are not included.
(c) Include employment in mining and quarrying; and in electricity and gas supply, and waste management.
(*) Change within ±0.05%.

185
2009 2010 2011 2012 2013 2013 2014Dec Mar Jun Sep
(Number)
Building sites
Private sector 28 776 28 620 31 780 37 687 41 308 42 719 43 676 41 792 45 658Public sector(a) 10 277 11 463 12 335 10 578 9 860 8 487 8 785 9 932 11 911
Sub-total 39 053 40 083 44 115 48 265 51 168 51 206 52 461 51 724 57 569
Civil engineering sites
Private sector 1 618 1 544 1 250 1 410 1 322 1 578 1 507 1 593 1 416Public sector(a) 9 831 13 714 17 270 21 621 26 813 27 277 24 602 26 417 27 549
Sub-total 11 449 15 258 18 520 23 030 28 135 28 855 26 109 28 010 28 965
Total 50 501 55 341 62 635 71 295 79 303 80 061 78 570 79 734 86 534
(% change over a year earlier)
Building sites
Private sector -0.4 -0.5 11.0 18.6 9.6 17.2 9.6 -3.3 15.7Public sector(a) 26.3 11.5 7.6 -14.2 -6.8 -19.8 -25.2 -7.2 40.0
Sub-total 5.5 2.6 10.1 9.4 6.0 8.9 1.7 -4.1 20.0
Civil engineering sites
Private sector -4.0 -4.6 -19.0 12.8 -6.2 16.1 42.8 38.6 -5.9Public sector(a) -8.1 39.5 25.9 25.2 24.0 23.0 -2.2 -3.9 0.8
Sub-total -7.6 33.3 21.4 24.4 22.2 22.6 -0.4 -2.1 0.4
Total 2.2 9.6 13.2 13.8 11.2 13.4 1.0 -3.4 12.7
Table 19 : Number of manual workers engaged at building and construction sites
Notes: Individual figures may not add up exactly to the total due to rounding.
(a) Including the Mass Transit Railway Corporation Limited and the Airport Authority Hong Kong.

186
(%)
2009 2010 2011 2012 2013 2013 2014
Selected industry section Q4 Q1 Q2 Q3
(in nominal terms)Manufacturing -3.5 2.3 7.7 8.2 3.3 2.8 4.1 5.7 5.4Import/export and wholesale trade -1.8 2.0 12.8 4.6 3.3 3.1 1.7 4.4 3.4Retail trade -1.4 3.9 12.0 10.1 6.7 6.8 6.8 4.5 2.3Transportation, storage, postal and courier services -0.7 4.0 4.1 1.2 5.4 5.0 4.1 3.6 3.4Accommodation(a) and food service activities -0.9 3.4 9.5 6.2 6.7 6.9 5.9 5.1 5.1Information and communications 0.2 2.5 7.5 8.2 5.4 6.3 6.6 3.9 5.2Financial and insurance activities -3.5 6.5 12.4 4.7 4.6 3.8 8.7 4.8 5.7Real estate activities -2.1 1.8 10.8 7.7 5.9 4.8 4.4 5.7 3.1Professional and business services 0.7 2.2 2.1 4.7 7.1 7.6 7.9 6.4 6.1Social and personal services 1.7 -2.4 3.2 7.6 3.6 3.7 3.3 3.9 -1.3All selected industry sections surveyed 0.7 2.1 7.8 6.5 5.4 5.3 5.1 4.8 3.4
(in real terms)Manufacturing -4.1 0.1 2.1 3.9 -0.8 -1.4 * 1.9 0.6Import/export and wholesale trade -2.5 -0.3 7.2 0.4 -1.0 -1.1 -2.3 0.7 -1.4Retail trade -2.1 1.5 6.3 5.7 2.3 2.4 2.6 0.7 -2.4Transportation, storage, postal and courier services -1.3 1.6 -1.2 -2.7 1.0 0.7 * -0.1 -1.4Accommodation(a) and food service activities -1.6 1.0 4.1 2.0 2.3 2.5 1.7 1.3 0.3Information and communications -0.4 0.1 2.2 4.0 1.0 1.9 2.3 0.2 0.4Financial and insurance activities -4.2 4.1 7.0 0.5 0.4 -0.4 4.4 1.0 0.8Real estate activities -2.6 -0.4 5.2 3.6 1.4 0.5 0.3 1.9 -1.6Professional and business services 0.1 * -3.1 0.7 2.6 3.2 3.6 2.6 1.2Social and personal services 1.2 -4.6 -2.1 3.6 -0.8 -0.5 -0.8 0.2 -5.9All selected industry sections surveyed * -0.2 2.4 2.3 1.1 1.0 1.0 1.0 -1.4
Table 20 : Rates of change in indices of payroll per person engagedby selected industry section
Notes: The rates of change in real terms are compiled from the Real Indices of Payroll per Person Engaged. The Indices are derived by deflating the Nominal Indices of Payroll per Person Engaged by the 2009/10-based Composite CPI.
In addition to wages, which include all regular and guaranteed payments like basic pay and stipulated bonuses and allowances, payroll also covers overtime pay and other non-guaranteed or irregular bonuses and allowances, except severance pay and long service payment. Because of this difference, as well as the difference in industrial and occupational coverage, the movements in payroll per person engaged, do not necessarily match closely with those in wage rates.
(a) Accommodation services cover hotels, guesthouses, boarding houses and other establishments providing short term accommodation.
(*) Change within ±0.05%.

187
(%)
2009 2010 2011 2012 2013 2013 2014
Dec Mar Jun Sep
(in nominal terms)Manufacturing -1.0 -1.0 6.7 4.3 4.7 4.7 4.8 4.5 4.6Import/export, wholesale and retail trades -1.1 2.7 7.7 4.5 2.9 1.9 0.9 4.1 2.1Transportation * 1.1 4.1 3.3 3.9 4.1 4.3 4.9 5.0Accommodation(a) and food service activities
-2.2 2.5 9.4 7.9 5.7 3.7 5.0 4.3 5.3
Financial and insurance activities(b) -0.4 2.9 6.7 4.2 4.4 2.8 2.7 2.8 3.2Real estate leasing and maintenance management -0.3 2.6 8.7 7.6 9.3 9.7 9.7 5.2 3.1Professional and business services 0.8 3.4 12.9 6.5 5.9 8.1 9.1 6.2 5.9Personal services -0.5 3.6 10.0 9.2 6.2 5.4 7.8 7.9 8.3All industries surveyed -0.9 2.5 8.1 5.6 4.7 4.1 4.1 4.5 4.0(in real terms)Manufacturing -1.4 -3.6 0.9 0.6 -0.2 0.4 0.5 0.6 -6.9Import/export, wholesale and retail trades -1.5 -0.2 2.4 0.6 -1.7 -2.3 -3.2 0.3 -9.1Transportation -0.6 -1.6 -1.2 -0.7 -0.6 -0.2 * 1.0 -6.5Accommodation(a) and food service activities -2.6 -0.4 3.9 3.8 1.1 -0.5 0.7 0.5 -6.2Financial and insurance activities(b) -0.9 0.3 1.4 0.1 * -1.4 -1.5 -0.9 -8.1Real estate leasing and maintenance management -0.7 -0.4 3.5 3.4 4.5 5.2 5.2 1.4 -8.2Professional and business services 0.5 0.6 7.0 2.2 1.4 3.6 4.6 2.3 -5.7Personal services -0.8 0.7 4.2 5.3 1.5 1.1 3.4 4.0 -3.5All industries surveyed -1.3 -0.4 2.7 1.6 0.1 -0.2 -0.1 0.7 -7.4
Table 21 : Rates of change in wage indicesby selected industry section
Selected industry section
Notes: The rates of change in real terms are compiled from the Real Wage Indices. The Indices are derived by deflating the Nominal Wage Indices by the 2009/10-based CPI(A).
(a) Accommodation services cover hotels, guesthouses, boarding houses and other establishments providing short term accommodation.
(b) Excluding stock, commodity and bullion brokers, exchanges and services companies; insurance agents and brokers; and real estate agencies.
(*) Change within ±0.05%.

188
(HK$)
25thpercentile
50thpercentile
75thpercentile
25thpercentile
50thpercentile
75thpercentile
Manufacturing(a) 9,500 12,500 18,000 10,800 13,300 20,000Electricity and gas supply; sewerage, waste management and remediation activities 15,000 23,000 36,800 16,200 23,500 37,000Construction 12,100 16,100 21,000 13,800 17,600 22,300Import and export trade 10,400 15,000 22,000 11,200 15,500 24,000Wholesale 9,000 11,600 15,500 10,000 12,200 17,300Retail trade 7,800 10,300 14,100 8,100 10,900 14,900 within which: Supermarkets and convenience stores 5,600 9,100 11,500 5,600 9,500 11,900 Other retail stores 8,000 10,600 14,800 8,400 11,100 15,500Land transport 11,000 14,000 22,000 11,700 15,000 22,500Other transportation, storage, postal and courier services(b) 10,000 13,500 19,400 11,400 14,800 20,700Restaurants 7,500 9,400 12,700 7,800 10,000 13,100 within which: Hong Kong style tea cafes 7,500 9,100 12,200 8,400 9,800 13,000 Chinese restaurants 8,400 10,600 14,800 9,100 11,100 15,100 Restaurants, other than Chinese 8,100 9,800 12,500 8,700 10,400 13,600 Fast food cafes(c) 3,500 7,500 9,800 3,800 7,800 9,900Accommodation(d) and other food service activities 10,000 12,500 16,200 10,400 13,000 16,700Information and communications 12,600 17,000 27,000 13,000 18,200 29,000Financing and insurance 14,900 22,000 39,000 15,000 22,600 39,600Real estate activities(e) 11,700 17,500 25,400 12,000 18,000 27,000Estate management, security and cleaning services 7,300 9,100 10,800 7,700 9,700 11,800 within which: Real estate maintenance management 8,800 10,000 12,000 9,400 10,800 13,700 Security services(f) 8,400 9,500 10,500 8,700 10,000 11,600 Cleaning services 6,000 7,300 7,800 6,200 7,400 8,400 Membership organisations(g) 7,000 9,300 15,000 7,100 10,100 16,100Professional, scientific and technical services 11,500 18,500 28,100 12,000 19,200 29,700Administrative and support services activities 9,200 12,800 19,500 10,200 14,000 22,000Travel agency, reservation service and related activities 9,000 11,400 16,000 10,000 12,000 17,000Education and public administration (excluding the Government) 11,400 23,500 42,000 12,000 24,200 42,300Human health activities; and beauty and body prettifying treatment 10,700 15,500 40,000 11,400 15,800 40,000Miscellaneous activities 7,700 9,200 12,400 8,300 9,800 13,000 within which: Elderly homes 8,700 9,800 11,700 9,400 10,600 13,100 Laundry and dry cleaning services 6,200 8,100 10,400 6,900 8,900 11,300 Hairdressing and other personal services 7,600 8,600 12,500 8,600 9,400 12,600 Local courier services 6,900 7,500 9,700 7,000 8,100 11,000 Food processing and production 7,600 9,300 13,700 7,900 10,200 14,400Other activities not classified above 9,000 12,500 17,700 9,400 12,700 20,000All industry sections above 9,500 13,400 20,900 10,000 14,100 22,000
Table 22 : Monthly wage level and distribution analysedby industry section : all business undertakings
Industry Section
May – Jun 2012 May – Jun 2013
Notes: Monthly wages are rounded to the nearest hundred of Hong Kong dollar. (a) Excluding food processing and production. (b) Excluding local courier services. (c) Including takeaway shops. (d) Accommodation services cover hotels, guesthouses, boarding houses and other establishments providing short
term accommodation. (e) Excluding real estate maintenance management. (f) Including investigation activities and services to buildings and landscape care activities. (g) Including incorporated owners/tenants committees, kaifong welfare associations, etc.

189
(HK$)
25thpercentile
50thpercentile
75thpercentile
25thpercentile
50thpercentile
75thpercentile
Manufacturing(a) 39.0 52.2 76.1 42.7 54.9 84.4Electricity and gas supply; sewerage, waste management and remediation activities 57.4 85.2 129.6 63.5 89.2 130.0Construction 49.9 66.7 87.5 58.1 72.5 92.4Import and export trade 45.0 63.7 92.6 46.4 64.5 101.3Wholesale 37.3 46.6 66.2 41.1 51.2 69.0Retail trade 32.0 38.5 53.8 34.7 40.9 54.4 within which: Supermarkets and convenience stores 30.0 32.3 38.5 32.5 35.4 41.6 Other retail stores 32.6 40.3 56.9 35.0 42.1 58.0Land transport 44.0 62.9 88.4 46.0 65.0 103.1Other transportation, storage, postal and courier services(b) 38.4 51.7 71.9 43.4 56.8 81.7Restaurants 30.5 35.2 45.8 33.1 37.2 48.2 within which: Hong Kong style tea cafes 31.1 35.0 43.3 34.0 37.6 46.9 Chinese restaurants 31.8 38.6 50.9 34.0 40.2 53.0 Restaurants, other than Chinese 32.2 37.3 49.0 35.2 40.0 50.0 Fast food cafes(c) 29.3 31.0 36.1 31.0 33.2 37.8Accommodation(d) and other food service activities 37.0 46.2 61.7 37.9 46.8 62.0Information and communications 49.7 68.5 114.8 51.7 74.1 115.0Financing and insurance 58.8 87.1 157.3 60.5 89.8 166.7Real estate activities(e) 48.8 69.8 110.0 52.3 72.6 116.4Estate management, security and cleaning services 28.9 31.1 40.4 30.5 33.3 44.2 within which: Real estate maintenance management 28.8 31.5 44.4 31.0 33.9 50.2 Security services(f) 28.7 31.3 35.0 30.0 32.9 40.3 Cleaning services 28.9 30.2 34.9 30.0 32.4 38.4 Membership organisations(g) 30.5 40.7 74.5 30.6 41.7 74.7Professional, scientific and technical services 48.4 71.7 116.5 50.3 72.9 122.2Administrative and support services activities 37.0 52.0 75.5 42.0 56.9 88.6Travel agency, reservation service and related activities 37.8 50.4 71.7 39.1 51.9 72.6Education and public administration (excluding the Government) 60.0 108.9 180.6 60.0 114.0 189.4Human health activities; and beauty and body prettifying treatment 46.7 68.9 166.7 50.5 71.6 170.9Miscellaneous activities 31.7 37.5 50.9 34.1 40.0 55.0 within which: Elderly homes 29.2 36.4 49.4 32.0 38.6 53.2 Laundry and dry cleaning services 30.0 34.2 41.3 32.3 37.5 47.0 Hairdressing and other personal services 32.0 38.5 51.9 35.8 40.3 55.3 Local courier services 32.0 36.8 44.4 32.5 40.4 48.2 Food processing and production 32.1 37.5 50.9 34.0 39.3 56.5Other activities not classified above 37.3 50.4 75.0 40.8 53.5 83.5All industry sections above 37.7 54.8 86.9 40.0 57.5 91.9
Table 23 : Hourly wage level and distribution analysedby industry section : all business undertakings
Industry Section
May – Jun 2012 May – Jun 2013
Notes: Hourly wages are rounded to the nearest ten cents of Hong Kong dollar. (a) Excluding food processing and production. (b) Excluding local courier services. (c) Including takeaway shops. (d) Accommodation services cover hotels, guesthouses, boarding houses and other establishments providing short
term accommodation. (e) Excluding real estate maintenance management. (f) Including investigation activities and services to buildings and landscape care activities. (g) Including incorporated owners/tenants committees, kaifong welfare associations, etc.

190
(%)
2005 2006 2007 2008 2009 2010 2011 2012
GDP deflator -0.2 -0.5 3.1 1.3 -0.4 0.3 3.9 3.5
Domestic demand deflator 1.1 1.6 2.4 2.6 -0.8 2.2 4.5 4.2
Consumer Price Indices(a) :Composite CPI 1.0 2.0 2.0 4.3 0.5 2.4 5.3 4.1CPI(A) 1.1 1.7 1.3 3.6 0.4 2.7 5.6 3.6CPI(B) 1.0 2.1 2.2 4.6 0.5 2.3 5.2 4.3CPI(C) 0.8 2.2 2.7 4.7 0.6 2.1 5.1 4.1
Unit Value Indices :Domestic exports 2.2 -2.1 0.8 5.1 -0.2 5.5 6.4 2.5Re-exports 1.2 1.1 2.4 3.8 1.2 4.6 8.0 3.4Total exports of goods 1.3 1.0 2.3 3.8 1.1 4.7 8.0 3.4Imports of goods 2.7 2.1 2.3 4.4 -0.1 6.4 8.1 3.3
Terms of Trade Index -1.4 -1.1 0.1 -0.5 1.3 -1.7 -0.1 0.1
Producer Price Index for all manufacturing industries(b) 0.8 2.2 3.0 5.6 -1.7 6.0 8.3 0.1
Tender Price Indices :
Public sector building projects 1.4 5.0 20.1 41.9 -15.9 12.5 11.6 8.3Public housing projects 7.7 11.2 19.7 30.8 -6.8 6.7 10.1 6.4
Table 24 : Rates of change in prices
Notes: (a) The year-on-year rates of change before October 2010 were derived using the index series in the bases periods at that time (for instance the 2004/05-based index series), compared with the index a year earlier in the same base period.
(b) Starting from the first quarter of 2009, the producer price indices for all manufacturing industries are compiled based on the HSIC Version 2.0, and the base period of the indices has been changed to 2008 (i.e. with the quarterly average of the indices in 2008 taken as 100). The new series has also been backcasted to the first quarter of 2005. The rates of change before 2006 presented here are the old series compiled based on the HSIC Version 1.1. The two series are therefore not strictly comparable.
(#) Figures are subject to revision later on as more data become available.
(*) Change within ±0.05%.
(--) Not applicable.
N.A. Not yet available.
(^) Average annual rate of change for the 10-year period 2003-2013.
(~) Average annual rate of change for the 5-year period 2008-2013.
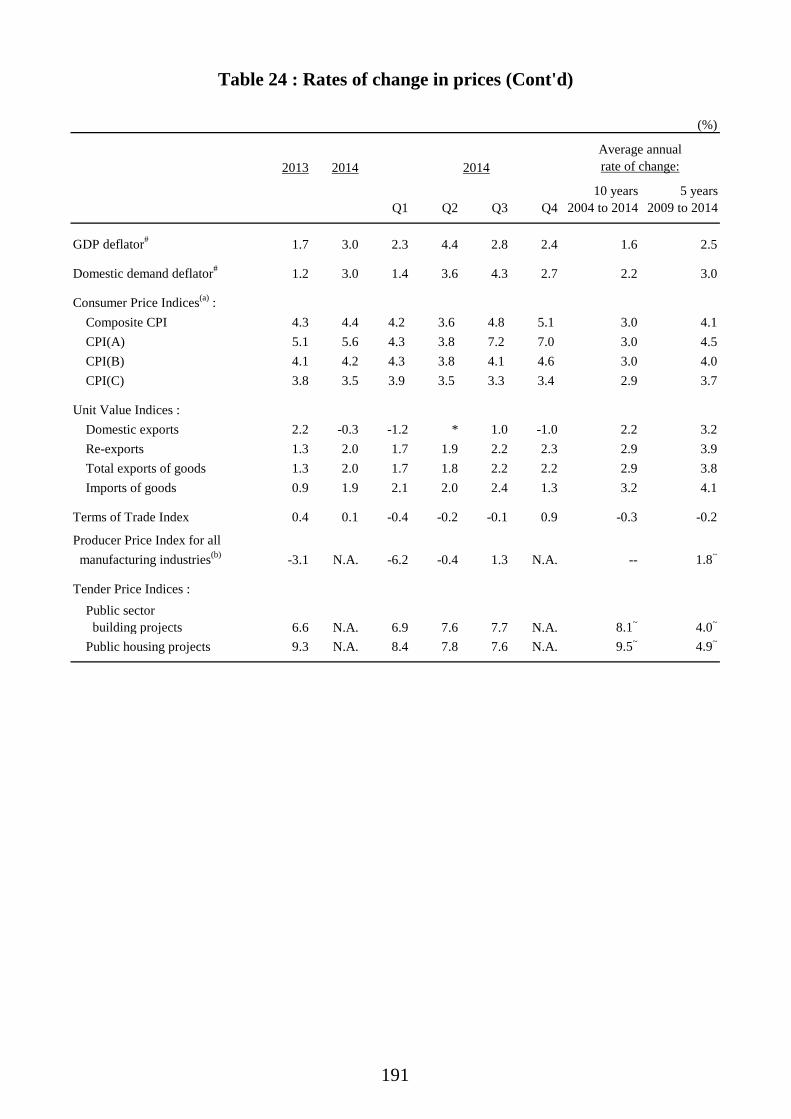
191
(%)
2013 2014 2014
Q1 Q2 Q3 Q410 years
2004 to 20145 years
2009 to 2014
GDP deflator# 1.7 3.0 2.3 4.4 2.8 2.4 1.6 2.5
Domestic demand deflator# 1.2 3.0 1.4 3.6 4.3 2.7 2.2 3.0
Consumer Price Indices(a) :Composite CPI 4.3 4.4 4.2 3.6 4.8 5.1 3.0 4.1CPI(A) 5.1 5.6 4.3 3.8 7.2 7.0 3.0 4.5CPI(B) 4.1 4.2 4.3 3.8 4.1 4.6 3.0 4.0CPI(C) 3.8 3.5 3.9 3.5 3.3 3.4 2.9 3.7
Unit Value Indices :Domestic exports 2.2 -0.3 -1.2 * 1.0 -1.0 2.2 3.2Re-exports 1.3 2.0 1.7 1.9 2.2 2.3 2.9 3.9Total exports of goods 1.3 2.0 1.7 1.8 2.2 2.2 2.9 3.8Imports of goods 0.9 1.9 2.1 2.0 2.4 1.3 3.2 4.1
Terms of Trade Index 0.4 0.1 -0.4 -0.2 -0.1 0.9 -0.3 -0.2
Producer Price Index for all manufacturing industries(b) -3.1 N.A. -6.2 -0.4 1.3 N.A. -- 1.8~
Tender Price Indices :Public sector building projects 6.6 N.A. 6.9 7.6 7.7 N.A. 8.1~ 4.0~
Public housing projects 9.3 N.A. 8.4 7.8 7.6 N.A. 9.5~ 4.9~
Average annualrate of change:
Table 24 : Rates of change in prices (Cont'd)
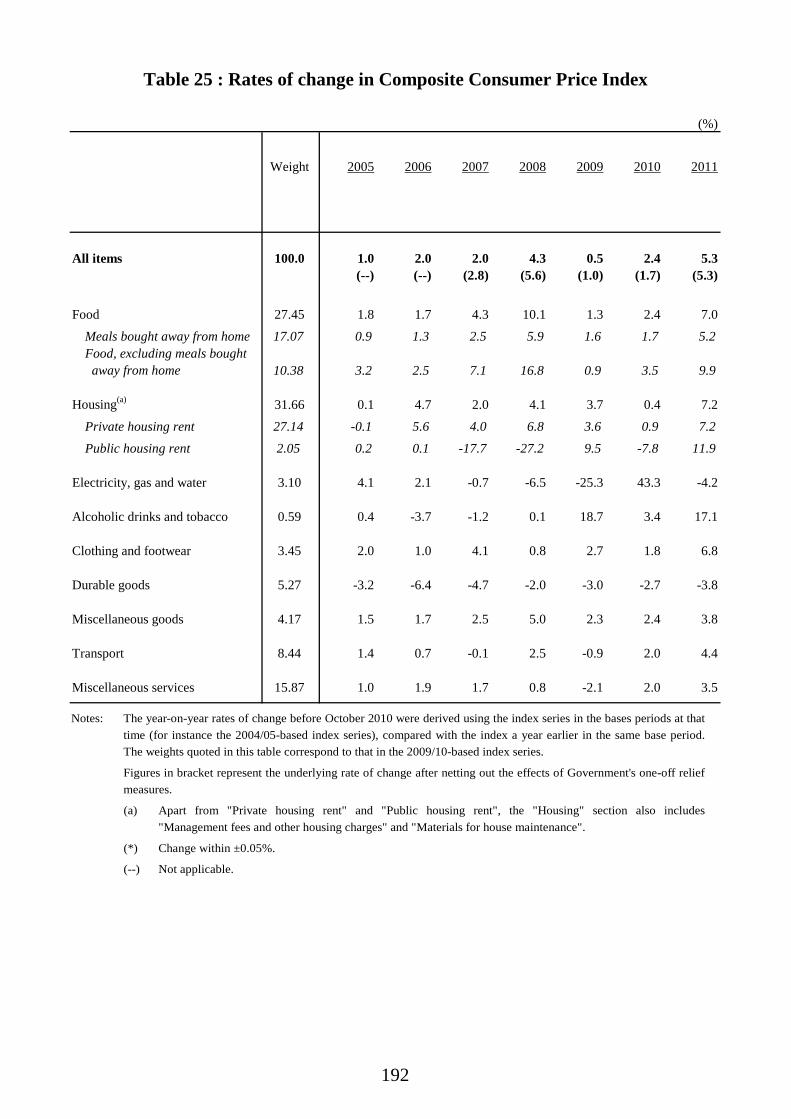
192
(%)
Weight 2005 2006 2007 2008 2009 2010 2011
All items 100.0 1.0 2.0 2.0 4.3 0.5 2.4 5.3(--) (--) (2.8) (5.6) (1.0) (1.7) (5.3)
Food 27.45 1.8 1.7 4.3 10.1 1.3 2.4 7.0
Meals bought away from home 17.07 0.9 1.3 2.5 5.9 1.6 1.7 5.2Food, excluding meals bought away from home 10.38 3.2 2.5 7.1 16.8 0.9 3.5 9.9
Housing(a) 31.66 0.1 4.7 2.0 4.1 3.7 0.4 7.2
Private housing rent 27.14 -0.1 5.6 4.0 6.8 3.6 0.9 7.2Public housing rent 2.05 0.2 0.1 -17.7 -27.2 9.5 -7.8 11.9
Electricity, gas and water 3.10 4.1 2.1 -0.7 -6.5 -25.3 43.3 -4.2
Alcoholic drinks and tobacco 0.59 0.4 -3.7 -1.2 0.1 18.7 3.4 17.1
Clothing and footwear 3.45 2.0 1.0 4.1 0.8 2.7 1.8 6.8
Durable goods 5.27 -3.2 -6.4 -4.7 -2.0 -3.0 -2.7 -3.8
Miscellaneous goods 4.17 1.5 1.7 2.5 5.0 2.3 2.4 3.8
Transport 8.44 1.4 0.7 -0.1 2.5 -0.9 2.0 4.4
Miscellaneous services 15.87 1.0 1.9 1.7 0.8 -2.1 2.0 3.5
Table 25 : Rates of change in Composite Consumer Price Index
Notes: The year-on-year rates of change before October 2010 were derived using the index series in the bases periods at that time (for instance the 2004/05-based index series), compared with the index a year earlier in the same base period. The weights quoted in this table correspond to that in the 2009/10-based index series.
Figures in bracket represent the underlying rate of change after netting out the effects of Government's one-off relief measures.
(a) Apart from "Private housing rent" and "Public housing rent", the "Housing" section also includes "Management fees and other housing charges" and "Materials for house maintenance".
(*) Change within ±0.05%.
(--) Not applicable.
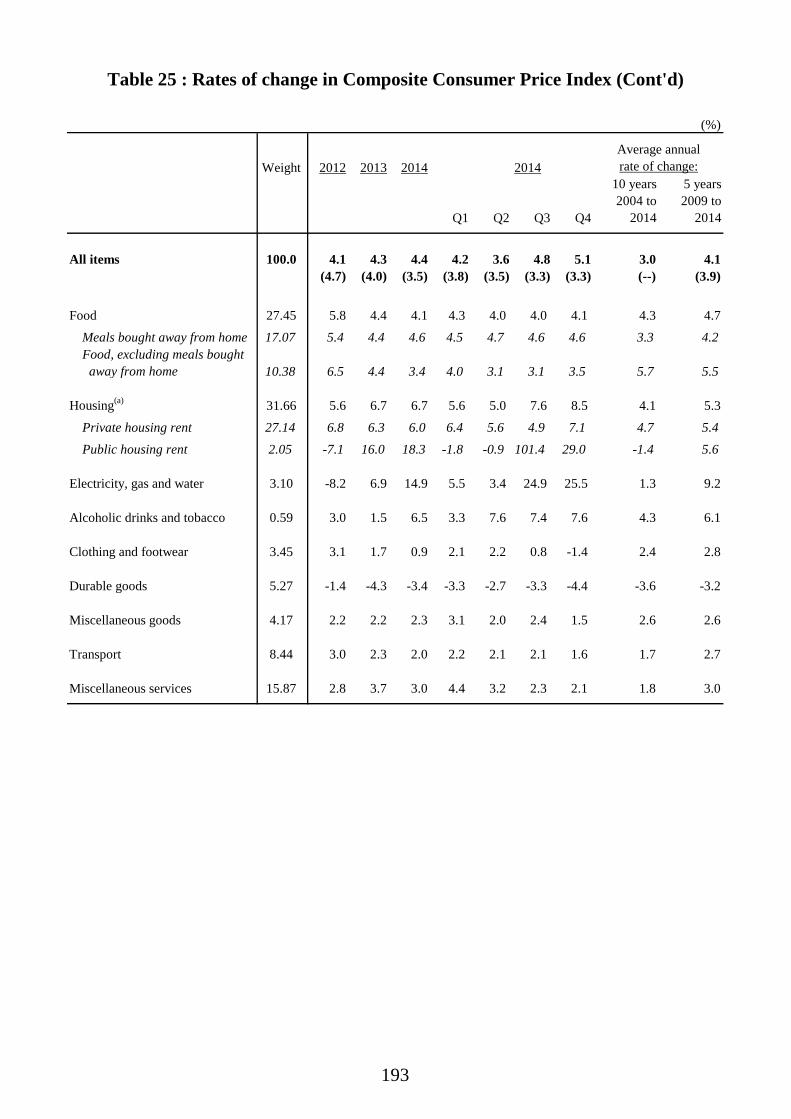
193
(%)
Weight 2012 2013 2014 2014
Q1 Q2 Q3 Q4
10 years2004 to
2014
5 years2009 to
2014
All items 100.0 4.1 4.3 4.4 4.2 3.6 4.8 5.1 3.0 4.1(4.7) (4.0) (3.5) (3.8) (3.5) (3.3) (3.3) (--) (3.9)
Food 27.45 5.8 4.4 4.1 4.3 4.0 4.0 4.1 4.3 4.7
Meals bought away from home 17.07 5.4 4.4 4.6 4.5 4.7 4.6 4.6 3.3 4.2Food, excluding meals bought away from home 10.38 6.5 4.4 3.4 4.0 3.1 3.1 3.5 5.7 5.5
Housing(a) 31.66 5.6 6.7 6.7 5.6 5.0 7.6 8.5 4.1 5.3
Private housing rent 27.14 6.8 6.3 6.0 6.4 5.6 4.9 7.1 4.7 5.4Public housing rent 2.05 -7.1 16.0 18.3 -1.8 -0.9 101.4 29.0 -1.4 5.6
Electricity, gas and water 3.10 -8.2 6.9 14.9 5.5 3.4 24.9 25.5 1.3 9.2
Alcoholic drinks and tobacco 0.59 3.0 1.5 6.5 3.3 7.6 7.4 7.6 4.3 6.1
Clothing and footwear 3.45 3.1 1.7 0.9 2.1 2.2 0.8 -1.4 2.4 2.8
Durable goods 5.27 -1.4 -4.3 -3.4 -3.3 -2.7 -3.3 -4.4 -3.6 -3.2
Miscellaneous goods 4.17 2.2 2.2 2.3 3.1 2.0 2.4 1.5 2.6 2.6
Transport 8.44 3.0 2.3 2.0 2.2 2.1 2.1 1.6 1.7 2.7
Miscellaneous services 15.87 2.8 3.7 3.0 4.4 3.2 2.3 2.1 1.8 3.0
Table 25 : Rates of change in Composite Consumer Price Index (Cont'd)
Average annualrate of change:
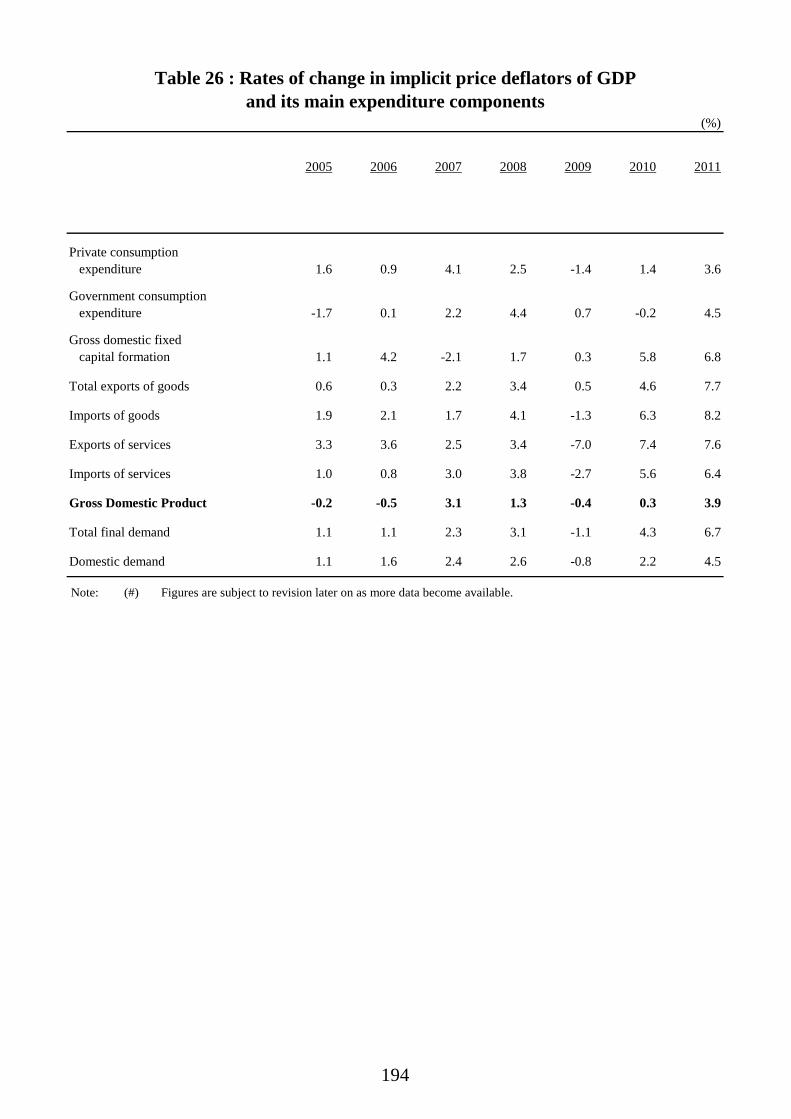
194
(%)
2005 2006 2007 2008 2009 2010 2011
Private consumption expenditure 1.6 0.9 4.1 2.5 -1.4 1.4 3.6
Government consumption expenditure -1.7 0.1 2.2 4.4 0.7 -0.2 4.5
Gross domestic fixed capital formation 1.1 4.2 -2.1 1.7 0.3 5.8 6.8
Total exports of goods 0.6 0.3 2.2 3.4 0.5 4.6 7.7
Imports of goods 1.9 2.1 1.7 4.1 -1.3 6.3 8.2
Exports of services 3.3 3.6 2.5 3.4 -7.0 7.4 7.6
Imports of services 1.0 0.8 3.0 3.8 -2.7 5.6 6.4
Gross Domestic Product -0.2 -0.5 3.1 1.3 -0.4 0.3 3.9
Total final demand 1.1 1.1 2.3 3.1 -1.1 4.3 6.7
Domestic demand 1.1 1.6 2.4 2.6 -0.8 2.2 4.5
Table 26 : Rates of change in implicit price deflators of GDPand its main expenditure components
Note: (#) Figures are subject to revision later on as more data become available.
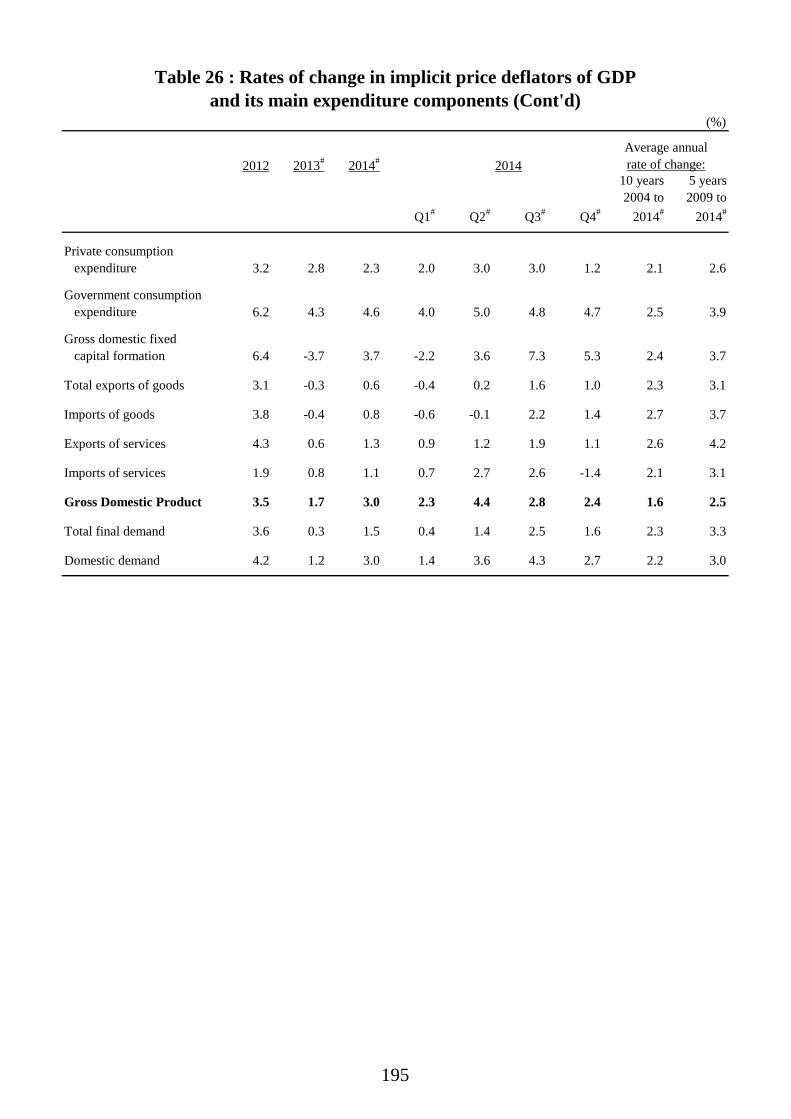
195
(%)
2012 2013# 2014# 2014
Q1# Q2# Q3# Q4#
10 years2004 to
2014#
5 years2009 to
2014#
Private consumption expenditure 3.2 2.8 2.3 2.0 3.0 3.0 1.2 2.1 2.6
Government consumption expenditure 6.2 4.3 4.6 4.0 5.0 4.8 4.7 2.5 3.9
Gross domestic fixed capital formation 6.4 -3.7 3.7 -2.2 3.6 7.3 5.3 2.4 3.7
Total exports of goods 3.1 -0.3 0.6 -0.4 0.2 1.6 1.0 2.3 3.1
Imports of goods 3.8 -0.4 0.8 -0.6 -0.1 2.2 1.4 2.7 3.7
Exports of services 4.3 0.6 1.3 0.9 1.2 1.9 1.1 2.6 4.2
Imports of services 1.9 0.8 1.1 0.7 2.7 2.6 -1.4 2.1 3.1
Gross Domestic Product 3.5 1.7 3.0 2.3 4.4 2.8 2.4 1.6 2.5
Total final demand 3.6 0.3 1.5 0.4 1.4 2.5 1.6 2.3 3.3
Domestic demand 4.2 1.2 3.0 1.4 3.6 4.3 2.7 2.2 3.0
Average annualrate of change:
Table 26 : Rates of change in implicit price deflators of GDPand its main expenditure components (Cont'd)