2014 dqe handouts
TRANSCRIPT

Copyright 2013 by Data Blueprint 1
Unlock Business Value through Data Quality EngineeringOrganizations must realize what it means to utilize data quality management in support of business strategy. This webinar focuses on obtaining business value from data quality initiatives. I will illustrate how organizations with chronic business challenges often can trace the root of the problem to poor data quality. Showing how data quality should be engineered provides a useful framework in which to develop an effective approach. This in turn allows organizations to more quickly identify business problems as well as data problems caused by structural issues versus practice-oriented defects and prevent these from re-occurring.
Date: April 8, 2014Time: 2:00 PM ET/11:00 AM PTPresenter: Peter Aiken, Ph.D.
Time:• timeliness• currency• frequency• time period
Form:• clarity• detail• order• presentation• media
Content:• accuracy• relevance• completeness• conciseness• scope• performance
Time:• timeliness• currency• frequency• time period
Form:• clarity• detail• order• presentation• media
Content:• accuracy• relevance• completeness• conciseness• scope• performance

Copyright 2013 by Data Blueprint
Get Social With Us!
Live Twitter FeedJoin the conversation!
Follow us:
@datablueprint @paiken
Ask questions and submit your comments: #dataed
2
Like Us on Facebookwww.facebook.com/datablueprint
Post questions and comments
Find industry news, insightful content
and event updates.
Join the GroupData Management & Business
IntelligenceAsk questions, gain insights and
collaborate with fellow data management professionals

Copyright 2013 by Data Blueprint 3
Peter Aiken, PhD• 25+ years of experience in data
management• Multiple international awards &
recognition• Founder, Data Blueprint (datablueprint.com)
• Associate Professor of IS, VCU (vcu.edu)
• President, DAMA International (dama.org)
• 8 books and dozens of articles• Experienced w/ 500+ data
management practices in 20 countries• Multi-year immersions with
organizations as diverse as the US DoD, Nokia, Deutsche Bank, Wells Fargo, and the Commonwealth of Virginia
2

Unlock Business Value through Data Quality Engineering
Presented by Peter Aiken, Ph.D.
Copyright 2013 by Data Blueprint
1. Data Management Overview
2. DQE Definitions (w/ example)
3. DQE Cycle & Contextual Complications
4. DQ Causes and Dimensions
5. Quality and the Data Life Cycle
6. DDE Tools
7. Takeaways and Q&A
Outline
5
Tweeting now: #dataed

Copyright 2013 by Data Blueprint
1. Data Management Overview
2. DQE Definitions (w/ example)
3. DQE Cycle & Contextual Complications
4. DQ Causes and Dimensions
5. Quality and the Data Life Cycle
6. DDE Tools
7. Takeaways and Q&A
Outline
6
Tweeting now: #dataed
Data Program Coordination
Feedback
DataDevelopment
Copyright 2013 by Data Blueprint
StandardData
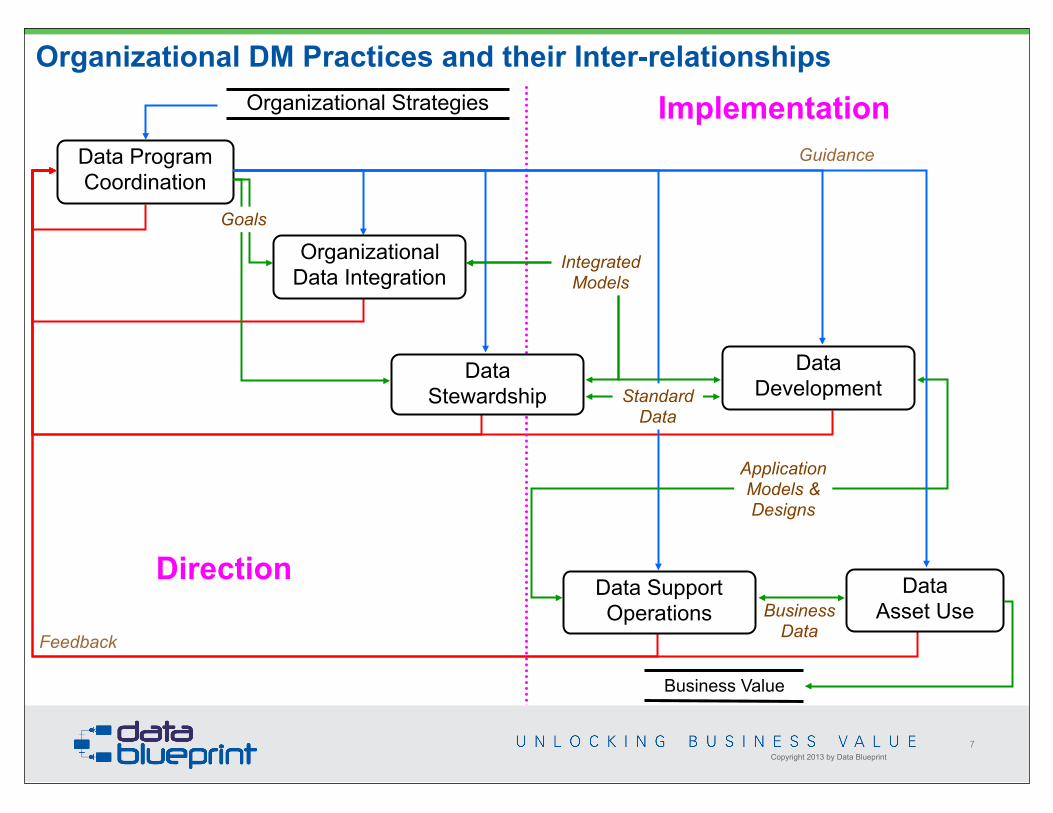
Organizational DM Practices and their Inter-relationshipsOrganizational Strategies
Goals
BusinessData
Business Value
Application Models & Designs
Implementation
Direction
Guidance
7
OrganizationalData Integration
DataStewardship
Data SupportOperations
Data Asset Use
IntegratedModels

Data Program Coordination
Feedback
DataDevelopment
Copyright 2013 by Data Blueprint
StandardData
Organizational DM Practices and their Inter-relationshipsOrganizational Strategies
Goals
BusinessData
Business Value
Application Models & Designs
Implementation
Direction
GuidanceIdentifying, modeling, coordinating, organizing, distributing, and architecting data shared across business areas or organizational boundaries.
Ensuring that specific individuals are assigned the responsibility for the maintenance of specific data as organizational assets, and that those individuals are provided the requisite knowledge, skills, and abilities to accomplish these goals in conjunction with other data stewards in the organization.
Initiation, operation, tuning, maintenance, backup/recovery, archiving and disposal of data assets in support of organizational activities.
8
Specifying and designing appropriately architected data assets that are engineered to be capable of supporting organizational needs.
OrganizationalData Integration
DataStewardship
Data SupportOperations
Data Asset Use
IntegratedModels
Defining, coordinating, resourcing, implementing, and monitoring organizational data program strategies, policies, plans, etc. as coherent set of activities.

Data Program Coordination
Feedback
DataDevelopment
Copyright 2013 by Data Blueprint
StandardData
Five Integrated DM Practice AreasOrganizational Strategies
Goals
BusinessData
Business Value
Application Models & Designs
Implementation
Direction
Guidance
9
OrganizationalData Integration
DataStewardship
Data SupportOperations
Data Asset Use
IntegratedModels
Leverage data in organizational activities
Data management processes andinfrastructure
Combining multipleassets to produceextra value
Organizational-entity subject area data
integration
Provide reliable data access
Achieve sharing of data within a business area

Copyright 2013 by Data Blueprint
Five Integrated DM Practice Areas
10
Manage data coherently.
Share data across boundaries.
Assign responsibilities for data.Engineer data delivery systems.
Maintain data availability.
Data Program Coordination
Organizational Data Integration
Data Stewardship
Data Development
Data Support Operations

Copyright 2013 by Data Blueprint
• 5 Data Management Practices Areas / Data Management Basics
• Are necessary but insufficient prerequisites to organizational data leveraging applications (that is Self Actualizing Data or AdvancedData Practices)
Basic Data Management Practices– Data Program Management– Organizational Data Integration– Data Stewardship– Data Development– Data Support Operations
http://3.bp.blogspot.com/-ptl-9mAieuQ/T-idBt1YFmI/AAAAAAAABgw/Ib-nVkMmMEQ/s1600/
maslows_hierarchy_of_needs.png
Advanced Data Practices• Cloud• MDM• Mining• Analytics• Warehousing• Big
Data Management Practices Hierarchy (after Maslow)

Copyright 2013 by Data Blueprint
Data Management Body of Knowledge
12
Data Management
Functions
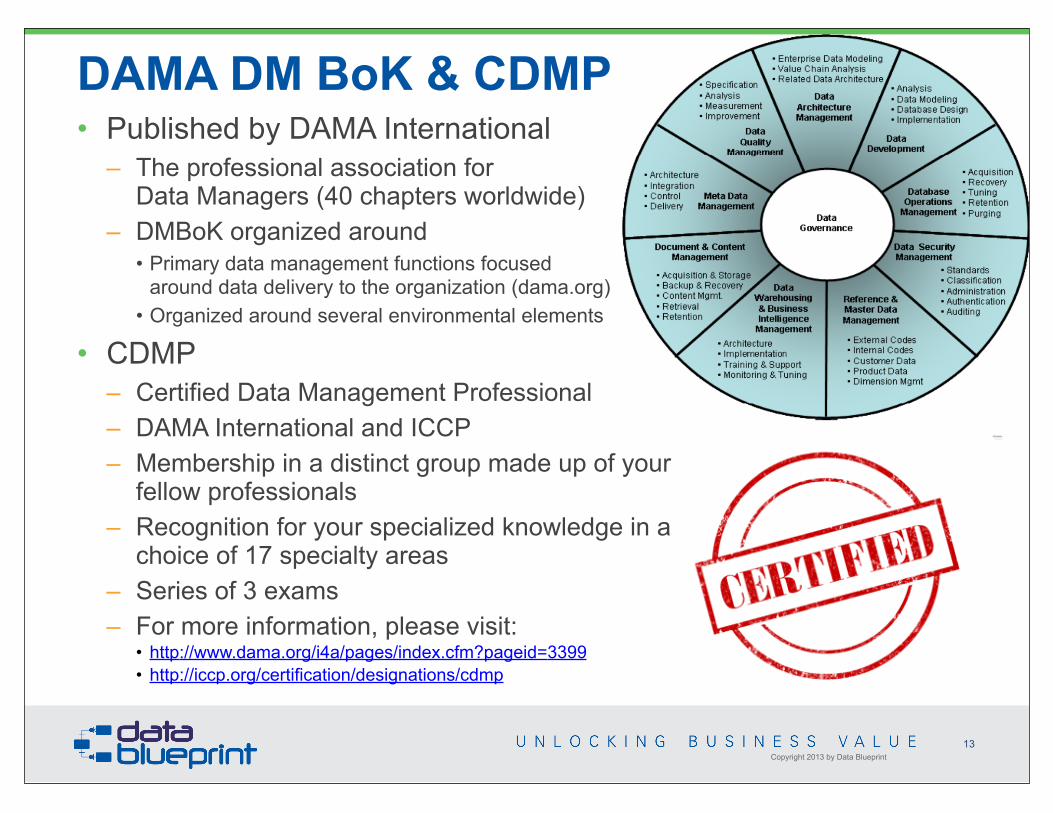
• Published by DAMA International– The professional association for
Data Managers (40 chapters worldwide)– DMBoK organized around
• Primary data management functions focused around data delivery to the organization (dama.org)
• Organized around several environmental elements
• CDMP– Certified Data Management Professional– DAMA International and ICCP– Membership in a distinct group made up of your
fellow professionals– Recognition for your specialized knowledge in a
choice of 17 specialty areas– Series of 3 exams– For more information, please visit:
• http://www.dama.org/i4a/pages/index.cfm?pageid=3399 • http://iccp.org/certification/designations/cdmp
Copyright 2013 by Data Blueprint
DAMA DM BoK & CDMP
13

Copyright 2013 by Data Blueprint
Overview: Data Quality Engineering
14

Copyright 2013 by Data Blueprint
1. Data Management Overview
2. DQE Definitions (w/ example)
3. DQE Cycle & Contextual Complications
4. DQ Causes and Dimensions
5. Quality and the Data Life Cycle
6. DDE Tools
7. Takeaways and Q&A
Outline
15
Tweeting now: #dataed

Copyright 2013 by Data Blueprint
Data Data
Data
Information
Fact Meaning
Request
A Model Specifying Relationships Among Important Terms
[Built on definition by Dan Appleton 1983]
Intelligence
Use
1. Each FACT combines with one or more MEANINGS. 2. Each specific FACT and MEANING combination is referred to as a DATUM. 3. An INFORMATION is one or more DATA that are returned in response to a specific REQUEST 4. INFORMATION REUSE is enabled when one FACT is combined with more than one
MEANING.5. INTELLIGENCE is INFORMATION associated with its USES.
Wisdom & knowledge are often used synonymously
Data
Data
Data Data
16

Copyright 2013 by Data Blueprint
Definitions• Quality Data
– Fit for use meets the requirements of its authors, users, and administrators (adapted from Martin Eppler)
– Synonymous with information quality, since poor data quality results in inaccurate information and poor business performance
• Data Quality Management– Planning, implementation and control activities that apply quality
management techniques to measure, assess, improve, and ensure data quality
– Entails the "establishment and deployment of roles, responsibilities concerning the acquisition, maintenance, dissemination, and disposition of data" http://www2.sas.com/proceedings/sugi29/098-29.pdf
✓ Critical supporting process from change management✓ Continuous process for defining acceptable levels of data quality to meet business
needs and for ensuring that data quality meets these levels• Data Quality Engineering
– Recognition that data quality solutions cannot not managed but must be engineered– Engineering is the application of scientific, economic, social, and practical knowledge in
order to design, build, and maintain solutions to data quality challenges– Engineering concepts are generally not known and understood within IT or business!
17
Spinach/Popeye story from http://it.toolbox.com/blogs/infosphere/spinach-how-a-data-quality-mistake-created-a-myth-and-a-cartoon-character-10166

Copyright 2013 by Data Blueprint
Improving Data Quality during System Migration
18
• Challenge– Millions of NSN/SKUs
maintained in a catalog– Key and other data stored in
clear text/comment fields– Original suggestion was manual
approach to text extraction– Left the data structuring problem unsolved
• Solution– Proprietary, improvable text extraction process– Converted non-tabular data into tabular data– Saved a minimum of $5 million– Literally person centuries of work

Unmatched Items
Ignorable Items
Items Matched
Week # (% Total) (% Total) (% Total)1 31.47% 1.34% N/A2 21.22% 6.97% N/A3 20.66% 7.49% N/A4 32.48% 11.99% 55.53%… … … …14 9.02% 22.62% 68.36%15 9.06% 22.62% 68.33%16 9.53% 22.62% 67.85%17 9.50% 22.62% 67.88%18 7.46% 22.62% 69.92%
Copyright 2013 by Data Blueprint
Determining Diminishing Returns
19

Time needed to review all NSNs once over the life of the project:Time needed to review all NSNs once over the life of the project:NSNs 2,000,000Average time to review & cleanse (in minutes) 5Total Time (in minutes) 10,000,000
Time available per resource over a one year period of time:Time available per resource over a one year period of time:Work weeks in a year 48Work days in a week 5Work hours in a day 7.5Work minutes in a day 450Total Work minutes/year 108,000
Person years required to cleanse each NSN once prior to migration:Person years required to cleanse each NSN once prior to migration:Minutes needed 10,000,000Minutes available person/year 108,000Total Person-Years 92.6
Resource Cost to cleanse NSN's prior to migration:Resource Cost to cleanse NSN's prior to migration:Avg Salary for SME year (not including overhead) $60,000.00Projected Years Required to Cleanse/Total DLA Person Year Saved
93Total Cost to Cleanse/Total DLA Savings to Cleanse NSN's: $5.5 million
Copyright 2013 by Data Blueprint 20
Quantitative Benefits

Copyright 2013 by Data Blueprint
Data Quality Misconceptions
1. You can fix the data
2. Data quality is an IT problem
3. The problem is in the data sources or data entry
4. The data warehouse will provide a single version of the truth
5. The new system will provide a single version of the truth
6. Standardization will eliminate the problem of different "truths" represented in the reports or analysis Source: Business Intelligence solutions, Athena Systems
21

The Blind Men and the Elephant
• It was six men of Indostan, To learning much inclined,Who went to see the Elephant(Though all of them were blind),That each by observationMight satisfy his mind.
• The First approached the Elephant,And happening to fallAgainst his broad and sturdy side,At once began to bawl:"God bless me! but the ElephantIs very like a wall!"
• The Second, feeling of the tuskCried, "Ho! what have we here,So very round and smooth and sharp? To me `tis mighty clearThis wonder of an ElephantIs very like a spear!"
• The Third approached the animal,And happening to takeThe squirming trunk within his hands, Thus boldly up he spake:"I see," quoth he, "the ElephantIs very like a snake!"
• The Fourth reached out an eager hand, And felt about the knee:"What most this wondrous beast is like Is mighty plain," quoth he;"'Tis clear enough the Elephant Is very like a tree!"
• The Fifth, who chanced to touch the ear, Said: "E'en the blindest manCan tell what this resembles most;Deny the fact who can,This marvel of an ElephantIs very like a fan!"
• The Sixth no sooner had begunAbout the beast to grope,Than, seizing on the swinging tailThat fell within his scope."I see," quoth he, "the ElephantIs very like a rope!"
• And so these men of IndostanDisputed loud and long,Each in his own opinionExceeding stiff and strong,Though each was partly in the right,And all were in the wrong!
(Source: John Godfrey Saxe's ( 1816-1887) version of the famous Indian legend ) 22Copyright 2013 by Data Blueprint

Copyright 2013 by Data Blueprint
No universal conception of data quality exists, instead many differing perspective compete.• Problem:
–Most organizations approach data quality problems in the same way that the blind men approached the elephant - people tend to see only the data that is in front of them
–Little cooperation across boundaries, just as the blind men were unable to convey their impressions about the elephant to recognize the entire entity.
–Leads to confusion, disputes and narrow views• Solution:
–Data quality engineering can help achieve a more complete picture and facilitate cross boundary communications
23

Copyright 2013 by Data Blueprint
Structured Data Quality Engineering1. Allow the form of the
Problem to guide the form of the solution
2. Provide a means of decomposing the problem
3. Feature a variety of tools simplifying system understanding
4. Offer a set of strategies for evolving a design solution5. Provide criteria for evaluating the quality of the
various solutions6. Facilitate development of a framework for developing
organizational knowledge.
24

Copyright 2013 by Data Blueprint
1. Data Management Overview
2. DQE Definitions (w/ example)
3. DQE Cycle & Contextual Complications
4. DQ Causes and Dimensions
5. Quality and the Data Life Cycle
6. DDE Tools
7. Takeaways and Q&A
Outline
25
Tweeting now: #dataed

Copyright 2013 by Data Blueprint
Mizuho Securities• Wanted to sell 1 share for
600,000 yen• Sold 600,000 shares for 1
yen• $347 million loss• In-house system did not
have limit checking• Tokyo stock exchange
system did not have limit checking ...
• … and doesn't allow order cancellations
CLUMSY typing cost a Japanese bank at least £128 million and staff their Christmas bonuses yesterday, after a trader mistakenly sold 600,000 more shares than he should have. The trader at Mizuho Securities, who has not been named, fell foul of what is known in financial circles as “fat finger syndrome” where a dealer types incorrect details into his computer. He wanted to sell one share in a new telecoms company called J Com, for 600,000 yen (about £3,000).
Infamous Data Quality Example
26
Copyright 2013 by Data Blueprint
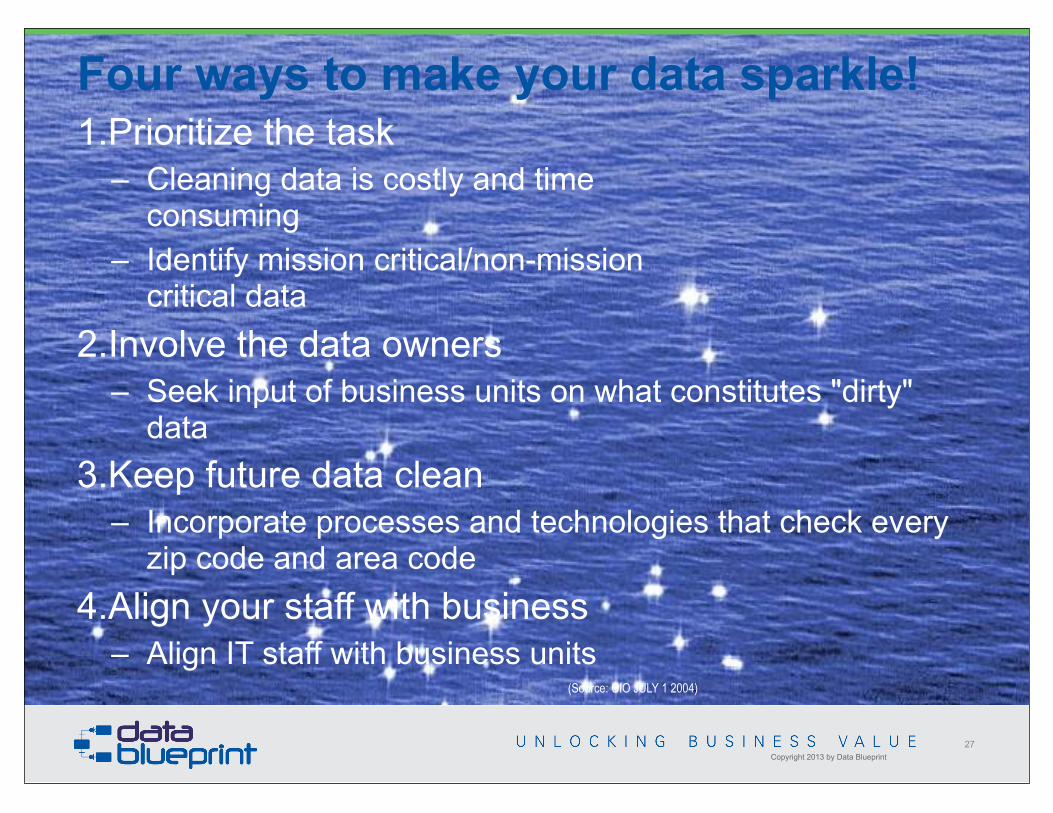
Four ways to make your data sparkle!1.Prioritize the task
– Cleaning data is costly and time consuming
– Identify mission critical/non-mission critical data
2.Involve the data owners – Seek input of business units on what constitutes "dirty"
data3.Keep future data clean
– Incorporate processes and technologies that check every zip code and area code
4.Align your staff with business– Align IT staff with business units
(Source: CIO JULY 1 2004)
27
Copyright 2013 by Data Blueprint
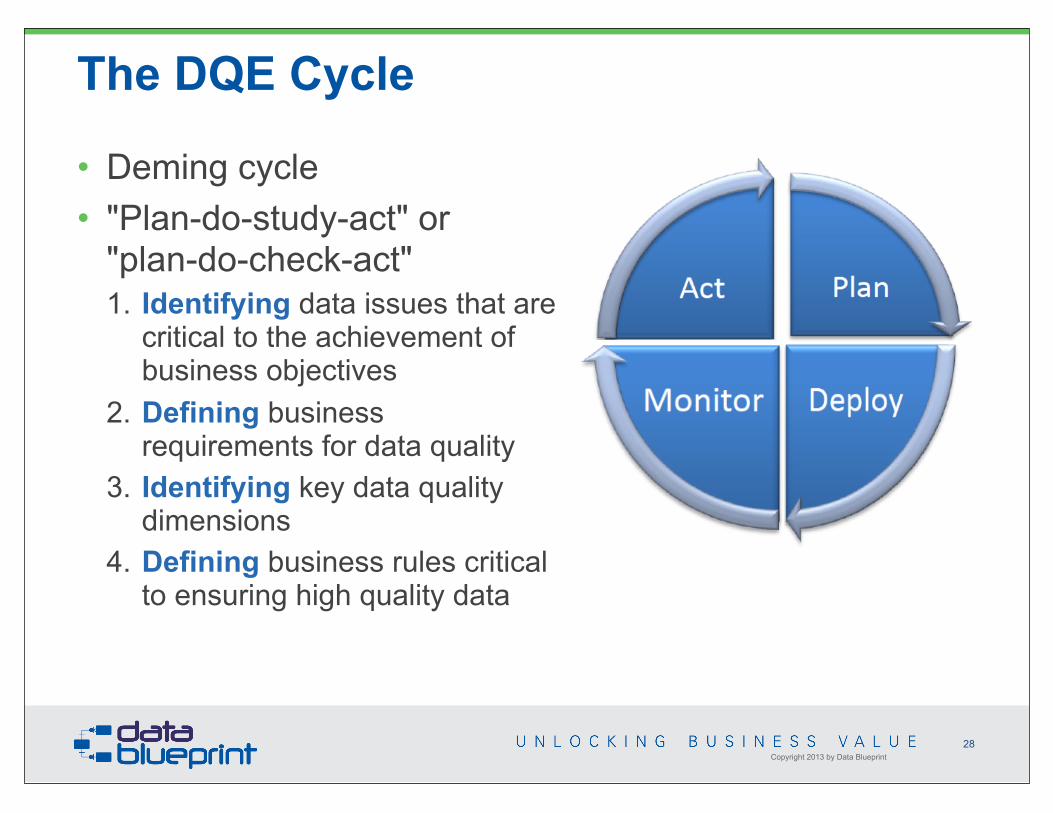
• Deming cycle• "Plan-do-study-act" or
"plan-do-check-act"1. Identifying data issues that are
critical to the achievement of business objectives
2. Defining business requirements for data quality
3. Identifying key data quality dimensions
4. Defining business rules critical to ensuring high quality data
28
The DQE Cycle

Copyright 2013 by Data Blueprint
The DQE Cycle: (1) Plan
• Plan for the assessment of the current state and identification of key metrics for measuring quality
• The data quality engineering team assesses the scope of known issues– Determining cost and impact– Evaluating alternatives for
addressing them
29
Copyright 2013 by Data Blueprint
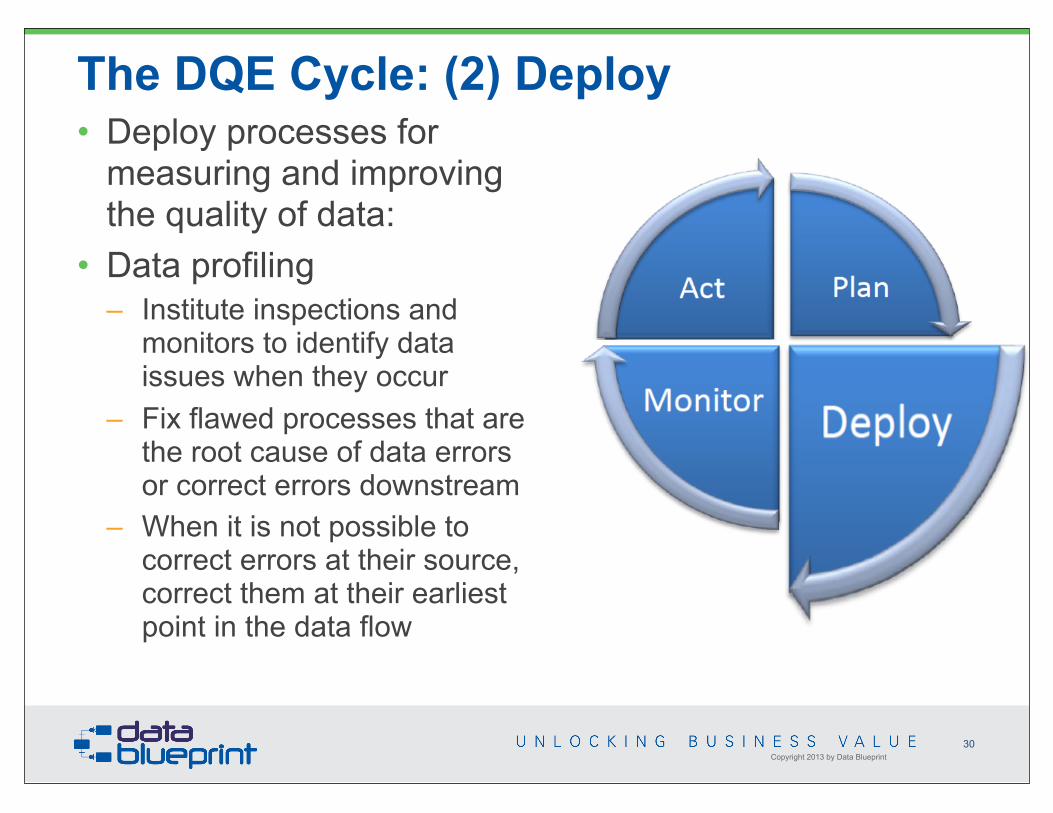
The DQE Cycle: (2) Deploy
30
• Deploy processes for measuring and improving the quality of data:
• Data profiling– Institute inspections and
monitors to identify data issues when they occur
– Fix flawed processes that are the root cause of data errors or correct errors downstream
– When it is not possible to correct errors at their source, correct them at their earliest point in the data flow

Copyright 2013 by Data Blueprint
The DQE Cycle: (3) Monitor• Monitor the quality of data
as measured against the defined business rules
• If data quality meets defined thresholds for acceptability, the processes are in control and the level of data quality meets the business requirements
• If data quality falls below acceptability thresholds, notify data stewards so they can take action during the next stage
31

Copyright 2013 by Data Blueprint
The DQE Cycle: (4) Act• Act to resolve any
identified issues to improve data quality and better meet business expectations
• New cycles begin as new data sets come under investigation or as new data quality requirements are identified for existing data sets
32

Copyright 2013 by Data Blueprint
DQE Context & Engineering Concepts • Can rules be implemented stating that no data can be
corrected unless the source of the error has been discovered and addressed?
• All data must be 100% perfect?
• Pareto – 80/20 rule– Not all data
is of equal Importance
• Scientific, economic, social, and practical knowledge
33

Copyright 2013 by Data Blueprint
Data quality is now acknowledged as a major source of organizational risk by certified risk professionals!
34

Copyright 2013 by Data Blueprint
1. Data Management Overview
2. DQE Definitions (w/ example)
3. DQE Cycle & Contextual Complications
4. DQ Causes and Dimensions
5. Quality and the Data Life Cycle
6. DDE Tools
7. Takeaways and Q&A
Outline
35
Tweeting now: #dataed

Copyright 2013 by Data Blueprint
Two Distinct Activities Support Quality Data
36
• Data quality best practices depend on both– Practice-oriented activities– Structure-oriented activities
Practice-oriented activities focus on the capture and manipulation of data
Structure-oriented activities focus on the data implementation
Quality Data

Copyright 2013 by Data Blueprint
Practice-Oriented Activities
37
• Stem from a failure to rigor when capturing/manipulating data such as:– Edit masking– Range checking of input data– CRC-checking of transmitted data
• Affect the Data Value Quality and Data Representation Quality • Examples of improper practice-oriented activities:
– Allowing imprecise or incorrect data to be collected when requirements specify otherwise
– Presenting data out of sequence
• Typically diagnosed in bottom-up manner: find and fix the resulting problem
• Addressed by imposing more rigorous data-handling governance
Quality of Data Representation
Quality of Data Values
Practice-oriented activities

Copyright 2013 by Data Blueprint
Structure-Oriented Activities
38
• Occur because of data and metadata that has been arranged imperfectly. For example: – When the data is in the system but we just can't access it; – When a correct data value is provided as the wrong response to a query; or – When data is not provided because it is unavailable or inaccessible to the customer
• Developer focus within system boundaries instead of within organization boundaries • Affect the Data Model Quality and Data Architecture Quality• Examples of improper structure-oriented activities:
– Providing a correct response but incomplete data to a query because the user did not comprehend the system data structure
– Costly maintenance of inconsistent data used by redundant systems
• Typically diagnosed in top-down manner: root cause fixes• Addressed through fundamental data structure governance
Quality of Data Architecture
Quality of Data Models
Structure-oriented activities

Copyright 2013 by Data Blueprint
Quality Dimensions
39

Copyright 2013 by Data Blueprint
A congratulations letter from another bankProblems
• Bank did not know it made an error
• Tools alone could not have prevented this error
• Lost confidence in the ability of the bank to manage customer funds
40

Copyright 2013 by Data Blueprint
4 Dimensions of Data Quality
41
An organization’s overall data quality is a function of four distinct components, each with its own attributes:
• Data Value: the quality of data as stored & maintained in the system
• Data Representation – the quality of representation for stored values; perfect data values stored in a system that are inappropriately represented can be harmful
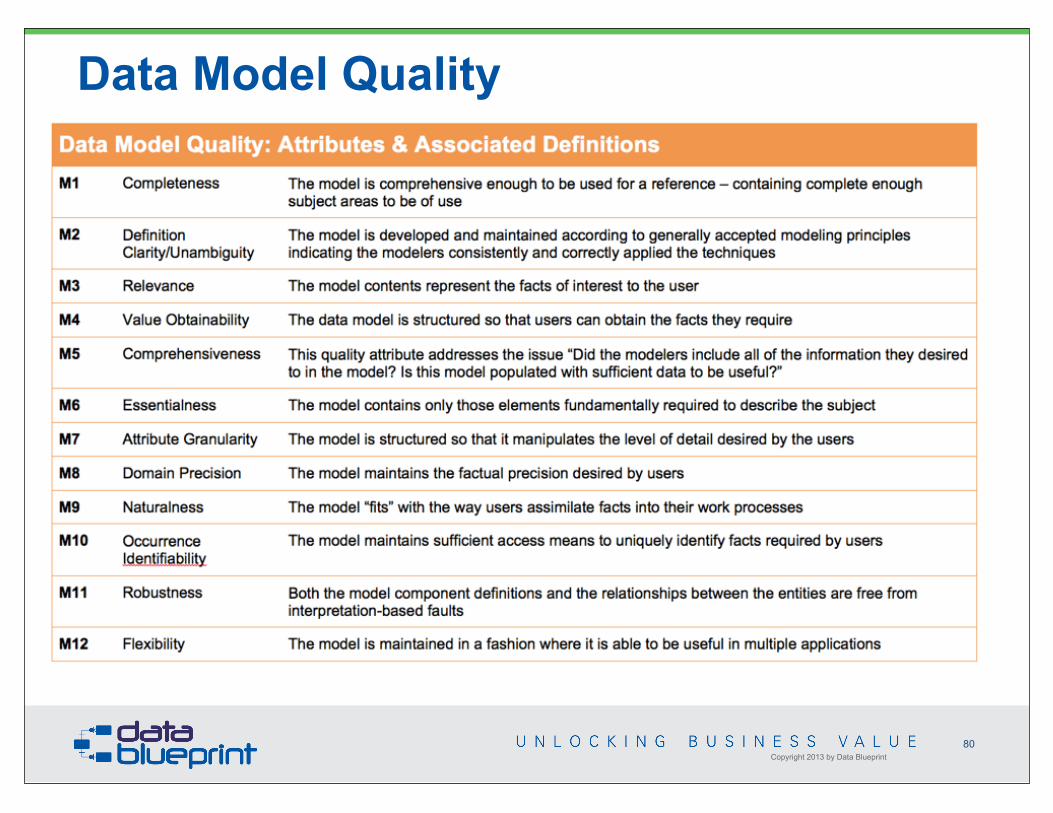
• Data Model – the quality of data logically representing user requirements related to data entities, associated attributes, and their relationships; essential for effective communication among data suppliers and consumers
• Data Architecture – the coordination of data management activities in cross-functional system development and operations
Pra
ctic
e-or
ient
edS
truct
ure-
orie
nted
Copyright 2013 by Data Blueprint
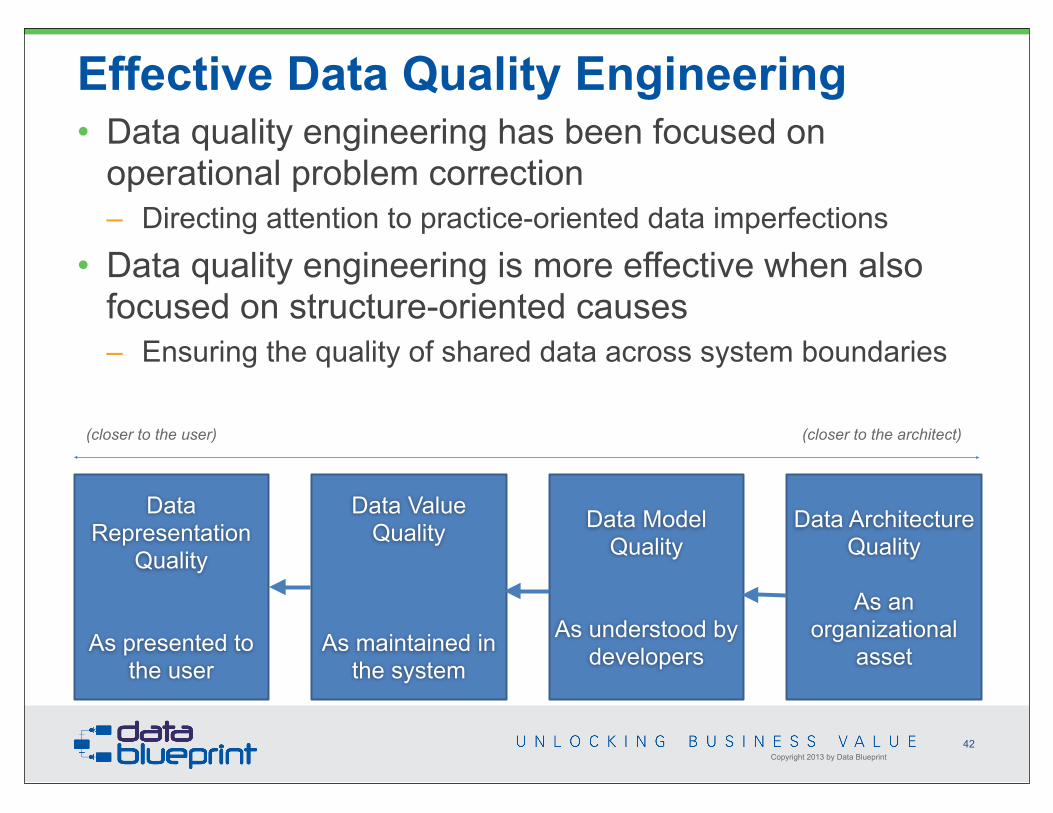
Effective Data Quality Engineering
42
Data Representation
Quality
As presented to the user
Data Value Quality
As maintained in the system
Data Model Quality
As understood by developers
Data Architecture Quality
As an organizational
asset
(closer to the architect)(closer to the user)
• Data quality engineering has been focused on operational problem correction– Directing attention to practice-oriented data imperfections
• Data quality engineering is more effective when also focused on structure-oriented causes– Ensuring the quality of shared data across system boundaries

Copyright 2013 by Data Blueprint
Full Set of Data Quality Attributes
43

Copyright 2013 by Data Blueprint
Difficult to obtain leverage at the bottom of the falls
44

Copyright 2013 by Data Blueprint
Frozen Falls 45

Copyright 2013 by Data Blueprint
New York Turns to Big Data to Solve Big Tree Problem• NYC
– 2,500,000 trees• 11-months from 2009 to 2010
– 4 people were killed or seriously injured by falling tree limbs in Central Park alone
• Belief– Arborists believe that pruning and otherwise maintaining trees
can keep them healthier and make them more likely to withstand a storm, decreasing the likelihood of property damage, injuries and deaths
• Until recently– No research or data to back it up
46
http://www.computerworld.com/s/article/9239793/New_York_Turns_to_Big_Data_to_Solve_Big_Tree_Problem?source=CTWNLE_nlt_datamgmt_2013-06-05

Copyright 2013 by Data Blueprint
NYC's Big Tree Problem• Question
– Does pruning trees in one year reduce the number of hazardous tree conditions in the following year?
• Lots of data but granularity challenges– Pruning data recorded block by block– Cleanup data recorded at the address level– Trees have no unique identifiers
• After downloading, cleaning, merging, analyzing and intensive modeling– Pruning trees for certain types of hazards caused a 22 percent reduction in the
number of times the department had to send a crew for emergency cleanups• The best data analysis
– Generates further questions• NYC cannot prune each block every year
– Building block risk profiles: number of trees, types of trees, whether the block is in a flood zone or storm zone
47
http://www.computerworld.com/s/article/9239793/New_York_Turns_to_Big_Data_to_Solve_Big_Tree_Problem?source=CTWNLE_nlt_datamgmt_2013-06-05

Copyright 2013 by Data Blueprint
1. Data Management Overview
2. DQE Definitions (w/ example)
3. DQE Cycle & Contextual Complications
4. DQ Causes and Dimensions
5. Quality and the Data Life Cycle
6. DDE Tools
7. Takeaways and Q&A
Outline
48
Tweeting now: #dataed

Copyright 2013 by Data Blueprint
Letter from the Bank… so please continue to open your mail from either Chase or Bank One
P.S. Please be on the lookout for any upcoming communications from either Chase or Bank One regarding your Bank One credit card and any other Bank One product you may have.
Problems• I initially discarded the letter!• I became upset after reading it• It proclaimed that Chase has data
quality challenges
49

Copyright 2013 by Data Blueprint
1. Data Management Overview
2. DQE Definitions (w/ example)
3. DQE Cycle & Contextual Complications
4. DQ Causes and Dimensions
5. Quality and the Data Life Cycle
6. DDE Tools
7. Takeaways and Q&A
Outline
50
Tweeting now: #dataed

Copyright 2013 by Data Blueprint
Data acquisition activities Data usage activitiesData storage
Traditional Quality Life Cycle
51

restored data
Metadata Creation
Metadata Refinement
Metadata Structuring
Data Utilization
Copyright 2013 by Data Blueprint
Data Manipulation
Data Creation
Data Storage
Data Assessment
Data Refinement
52
data architecture & models
populated data models and
storage locations
data values
datavalues
datavalues
valuedefects
structuredefects
architecturerefinements
modelrefinements
Data Life Cycle ModelProducts
data

restored data
Metadata Refinement
Metadata Structuring
Data Utilization
Copyright 2013 by Data Blueprint
Data Manipulation
Data Creation
Data Storage
Data Assessment
Data Refinement
53
populated data models and
storage locations
datavalues
Data Life Cycle Model:QualityFocus
data
architecture & model quality
model quality
value quality
value quality
value quality
representation quality
Metadata Creation
architecture quality

Copyright 2013 by Data Blueprint
Startingpointfor newsystemdevelopment
data performance metadata
data architecture
dataarchitecture and
data models
shared data updated data
correcteddata
architecturerefinements
facts &meanings
Metadata &Data Storage
Starting pointfor existingsystems
Metadata Refinement• Correct Structural Defects• Update Implementation
Metadata Creation• Define Data Architecture• Define Data Model Structures
Metadata Structuring• Implement Data Model Views• Populate Data Model Views
Data Refinement• Correct Data Value Defects• Re-store Data Values
Data Manipulation• Manipulate Data• Updata Data
Data Utilization• Inspect Data• Present Data
Data Creation• Create Data• Verify Data Values
Data Assessment• Assess Data Values• Assess Metadata
Extended data life cycle model with metadata sources and uses
54

Copyright 2013 by Data Blueprint
1. Data Management Overview
2. DQE Definitions (w/ example)
3. DQE Cycle & Contextual Complications
4. DQ Causes and Dimensions
5. Quality and the Data Life Cycle
6. DDE Tools
7. Takeaways and Q&A
Outline
55
Tweeting now: #dataed

Copyright 2013 by Data Blueprint
Profile, Analyze and Assess DQ• Data assessment using 2 different approaches:
– Bottom-up– Top-down
• Bottom-up assessment:– Inspection and evaluation of the data sets– Highlight potential issues based on the
results of automated processes• Top-down assessment:
– Engage business users to document their business processes and the corresponding critical data dependencies
– Understand how their processes consume data and which data elements are critical to the success of the business applications
56

Copyright 2013 by Data Blueprint
Define DQ Measures• Measures development occurs as part of the strategy/
design/plan step • Process for defining data quality measures:
1. Select one of the identified critical business impacts
2. Evaluate the dependent data elements, create and update processes associate with that business impact
3. List any associated data requirements
4. Specify the associated dimension of data quality and one or more business rules to use to determine conformance of the data to expectations
5. Describe the process for measuring conformance
6. Specify an acceptability threshold
57

Copyright 2013 by Data Blueprint
Set and Evaluate DQ Service Levels• Data quality inspection and
monitoring are used to measure and monitor compliance with defined data quality rules
• Data quality SLAs specify the organization’s expectations for response and remediation
• Operational data quality control defined in data quality SLAs includes:– Data elements covered by the agreement– Business impacts associated with data flaws– Data quality dimensions associated with each data element– Quality expectations for each data element of the identified dimensions in
each application for system in the value chain– Methods for measuring against those expectations– (…)
58

Measure, Monitor & Manage DQ
Copyright 2013 by Data Blueprint
• DQM procedures depend on available data quality measuring and monitoring services
• 2 contexts for control/measurement of conformance to data quality business rules exist:– In-stream: collect in-stream measurements while creating data– In batch: perform batch activities on collections of data
instances assembled in a data set
• Apply measurements at 3 levels of granularity:– Data element value– Data instance or record– Data set
59

Copyright 2013 by Data Blueprint
Overview: Data Quality Tools4 categories of activities:
1) Analysis2) Cleansing3) Enhancement4) Monitoring
60
Principal tools:1) Data Profiling2) Parsing and Standardization3) Data Transformation4) Identity Resolution and
Matching5) Enhancement6) Reporting

Copyright 2013 by Data Blueprint
DQ Tool #1: Data Profiling• Data profiling is the assessment of
value distribution and clustering of values into domains
• Need to be able to distinguish between good and bad data before making any improvements
• Data profiling is a set of algorithms for 2 purposes:– Statistical analysis and assessment of the data quality values within a
data set– Exploring relationships that exist between value collections within and
across data sets
• At its most advanced, data profiling takes a series of prescribed rules from data quality engines. It then assesses the data, annotates and tracks violations to determine if they comprise new or inferred data quality rules
61

Copyright 2013 by Data Blueprint
DQ Tool #1: Data Profiling, cont’d• Data profiling vs. data quality-business context and
semantic/logical layers– Data quality is concerned with proscriptive rules– Data profiling looks for patterns when rules are adhered to and when
rules are violated; able to provide input into the business context layer
• Incumbent that data profiling services notify all concerned parties of whatever is discovered
• Profiling can be used to…– …notify the help desk that valid
changes in the data are about to case an avalanche of “skeptical user” calls
– …notify business analysts of precisely where they should be working today in terms of shifts in the data
62

Copyright 2013 by Data Blueprint
Courtesy GlobalID.com
63

Copyright 2013 by Data Blueprint
DQ Tool #2: Parsing & Standardization • Data parsing tools enable the definition
of patterns that feed into a rules engine used to distinguish between valid and invalid data values
• Actions are triggered upon matching a specific pattern
• When an invalid pattern is recognized, the application may attempt to transform the invalid value into one that meets expectations
• Data standardization is the process of conforming to a set of business rules and formats that are set up by data stewards and administrators
• Data standardization example:– Brining all the different formats of “street” into a single format, e.g.
“STR”, “ST.”, “STRT”, “STREET”, etc.
64

Copyright 2013 by Data Blueprint
DQ Tool #3: Data Transformation• Upon identification of data errors, trigger data rules to
transform the flawed data• Perform standardization and guide rule-based
transformations by mapping data values in their original formats and patterns into a target representation
• Parsed components of a pattern are subjected to rearrangement, corrections, or any changes as directed by the rules in the knowledge base
65

Copyright 2013 by Data Blueprint
DQ Tool #4: Identify Resolution & Matching• Data matching enables analysts to identify relationships between records for
de-duplication or group-based processing• Matching is central to maintaining data consistency and integrity throughout
the enterprise• The matching process should be used in
the initial data migration of data into a single repository
• 2 basic approaches to matching:• Deterministic
– Relies on defined patterns/rules for assigning weights and scores to determine similarity
– Predictable– Dependent on rules developers anticipations
• Probabilistic – Relies on statistical techniques for assessing the probability that any pair of record
represents the same entity– Not reliant on rules– Probabilities can be refined based on experience -> matchers can improve precision as
more data is analyzed
66

Copyright 2013 by Data Blueprint
DQ Tool #5: Enhancement• Definition:
– A method for adding value to information by accumulating additional information about a base set of entities and then merging all the sets of information to provide a focused view. Improves master data.
• Benefits:– Enables use of third party data sources– Allows you to take advantage of the information and research carried
out by external data vendors to make data more meaningful and useful
• Examples of data enhancements:– Time/date stamps– Auditing information– Contextual information– Geographic information– Demographic information– Psychographic information
67

Copyright 2013 by Data Blueprint
DQ Tool #6: Reporting• Good reporting supports:
– Inspection and monitoring of conformance to data quality expectations– Monitoring performance of data stewards conforming to data quality
SLAs– Workflow processing for data quality incidents– Manual oversight of data cleansing and correction
• Data quality tools provide dynamic reporting and monitoring capabilities
• Enables analyst and data stewards to support and drive the methodology for ongoing DQM and improvement with a single, easy-to-use solution
• Associate report results with:– Data quality measurement– Metrics– Activity
68

Copyright 2013 by Data Blueprint
1. Data Management Overview
2. DQE Definitions (w/ example)
3. DQE Cycle & Contextual Complications
4. DQ Causes and Dimensions
5. Quality and the Data Life Cycle
6. DDE Tools
7. Takeaways and Q&A
Outline
69
Tweeting now: #dataed

• Develop and promote data quality awareness• Define data quality requirements• Profile, analyze and asses data quality• Define data quality metrics• Define data quality business
rules• Test and validate data quality
requirements• Set and evaluate data quality
service levels• Measure and monitor data quality• Manage data quality issues• Clean and correct data quality defects• Design and implement operational DQM procedures• Monitor operational DQM procedures and performance
Copyright 2013 by Data Blueprint
Overview: DQE Concepts and Activities
70

Copyright 2013 by Data Blueprint
Concepts and Activities• Data quality expectations provide the inputs necessary
to define the data quality framework:– Requirements– Inspection policies– Measures, and monitors
that reflect changes in data quality and performance
• The data quality framework requirements reflect 3 aspects of business data expectations1. A manner to record the expectation in business rules2. A way to measure the quality of data within that dimension 3. An acceptability threshold
71
from The DAMA Guide to the Data Management Body of Knowledge © 2009 by DAMA International

Copyright 2013 by Data Blueprint
Summary: Data Quality Engineering
72
1/26/2010 © Copyright this and previous years by Data Blueprint - all rights reserved!

10124 W. Broad Street, Suite CGlen Allen, Virginia 23060804.521.4056

Copyright 2013 by Data Blueprint
Questions?
74
+ =
It’s your turn! Use the chat feature or Twitter (#dataed) to submit
your questions to Peter now.

Developing a Data-centric Strategy & RoadmapEnterprise Data WorldApril 28, 2014 @ 8:30 AM CT
Data Architecture RequirementsMay 13, 2014 @ 2:00 PM ET/11:00 AM PT
Monetizing Data ManagementJune 10, 2014 @ 2:00 PM ET/11:00 AM PT
Sign up here: www.datablueprint.com/webinar-schedule or www.dataversity.net
Copyright 2013 by Data Blueprint
Upcoming Events
75

Copyright 2013 by Data Blueprint
References & Recommended Reading
76
• The DAMA Guide to the Data Management Body of Knowledge © 2009 by DAMA International• http://www2.sas.com/proceedings/sugi29/098-29.pdf

Copyright 2013 by Data Blueprint
Data Quality Dimensions
77
Copyright 2013 by Data Blueprint
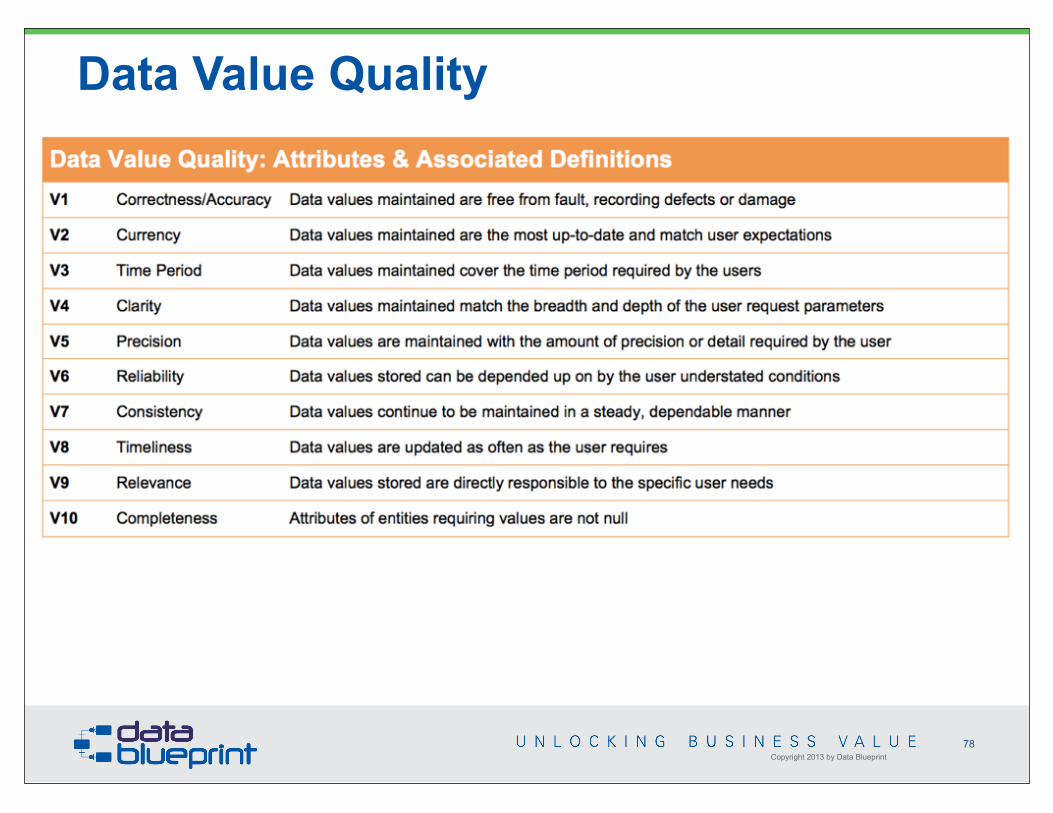
Data Value Quality
78

Copyright 2013 by Data Blueprint
Data Representation Quality
79
Copyright 2013 by Data Blueprint
Data Model Quality
80

Copyright 2013 by Data Blueprint
Data Architecture Quality
81

Copyright 2013 by Data Blueprint
Guiding Principles• Manage data as a core organizational asset. • Identify a gold record for all data elements• All data elements will have a standardized data definition, data type, and
acceptable value domain• Leverage data governance for the control and performance of DQM• Use industry and international data standards whenever possible• Downstream data consumers specify data quality expectations• Define business rules to assert conformance to data quality expectations• Validate data instances and data sets against defined business rules• Business process owners will agree to and abide by data quality SLAs• Apply data corrections at the original source if possible• If it is not possible to correct data at the source, forward data corrections
to the owner of the original source. Influence on data brokers to conform to local requirements may be limited
• Report measured levels of data quality to appropriate data stewards, business process owners, and SLA managers
82

Copyright 2013 by Data Blueprint
Goals and Principles
data quality control into the system development life cycle• To provide defined processes for measuring,
monitoring, and reporting conformance to acceptable levels of data quality
83
1/26/2010 © Copyright this and previous years by Data Blueprint - all rights reserved!
• To measurably improve the quality of data in relation to defined business expectations
• To define requirements and specifications for integrating

Copyright 2013 by Data Blueprint
Primary Deliverables• Improved Quality Data• Data Management Operational
Analysis• Data profiles• Data Quality Certification Reports• Data Quality Service Level
Agreements
84

Copyright 2013 by Data Blueprint
Roles and Responsibilities
85
1/26/2010 © Copyright this and previous years by Data Blueprint - all rights reserved!
Suppliers:• External Sources• Regulatory Bodies• Business Subject Matter Experts• Information Consumers• Data Producers• Data Architects• Data Modelers• Data Stewards
Participants:• Data Quality Analysts• Data Analysts• Database Administrators• Data Stewards• Other Data Professionals• DRM Director• Data Stewardship Council
Consumers:• Data Stewards• Data Professionals• Other IT Professionals• Knowledge Workers• Managers and Executives• Customers