2014 best practices study update · 2014 best practices study update new day, new possibilities ......
TRANSCRIPT

2014BESTPRACTICESSTUDY UPDATENew Day, New Possibilities
Conducted by :
&
Conducted by :
& Independent Insurance Agents & Brokers of America, Inc.
®

2014 BestPractices Study
ii
2014 Best Practices Study
v011315
2014 BestPractices Study
i
2014 Best Practices Study
Copyright©2014 by the Independent Insurance Agents & Brokers of America and Reagan Consulting, Inc. All rights reserved.
Special AcknowledgementWe wish to thank the following companies for their sponsorship which has funded the development of the 2014 Best Practices Study and the Best Practices Gateway website.
For state association and Council for Best Practices use only.

2014 BestPractices Study
ii
2014 Best Practices Study
TABLE OF CONTENTSIntroduction
Analysis of Agencies with Revenues Under $1,250,000
Key Benchmarks. . . . . . . . . . . . . . . . . . . . . . . . . . . . . . . . . . . . . . . . . . . . . . . . . . . . . . . . . . . . . . . . . . . . . . . . . . . . . . . . . . . . . . . . . . . . . . 3Profile. . . . . . . . . . . . . . . . . . . . . . . . . . . . . . . . . . . . . . . . . . . . . . . . . . . . . . . . . . . . . . . . . . . . . . . . . . . . . . . . . . . . . . . . . . . . . . . . . . . . . . . . 4Revenues . . . . . . . . . . . . . . . . . . . . . . . . . . . . . . . . . . . . . . . . . . . . . . . . . . . . . . . . . . . . . . . . . . . . . . . . . . . . . . . . . . . . . . . . . . . . . . . . . . . . 5Expenses . . . . . . . . . . . . . . . . . . . . . . . . . . . . . . . . . . . . . . . . . . . . . . . . . . . . . . . . . . . . . . . . . . . . . . . . . . . . . . . . . . . . . . . . . . . . . . . . . . . . 12Profitability. . . . . . . . . . . . . . . . . . . . . . . . . . . . . . . . . . . . . . . . . . . . . . . . . . . . . . . . . . . . . . . . . . . . . . . . . . . . . . . . . . . . . . . . . . . . . . . . . . 14 Employee Overview . . . . . . . . . . . . . . . . . . . . . . . . . . . . . . . . . . . . . . . . . . . . . . . . . . . . . . . . . . . . . . . . . . . . . . . . . . . . . . . . . . . . . . . . . 17 Producer Information. . . . . . . . . . . . . . . . . . . . . . . . . . . . . . . . . . . . . . . . . . . . . . . . . . . . . . . . . . . . . . . . . . . . . . . . . . . . . . . . . . . . . . . . 18 Service Staff Information . . . . . . . . . . . . . . . . . . . . . . . . . . . . . . . . . . . . . . . . . . . . . . . . . . . . . . . . . . . . . . . . . . . . . . . . . . . . . . . . . . . . 21Technology . . . . . . . . . . . . . . . . . . . . . . . . . . . . . . . . . . . . . . . . . . . . . . . . . . . . . . . . . . . . . . . . . . . . . . . . . . . . . . . . . . . . . . . . . . . . . . . . . 24 Insurance Carriers . . . . . . . . . . . . . . . . . . . . . . . . . . . . . . . . . . . . . . . . . . . . . . . . . . . . . . . . . . . . . . . . . . . . . . . . . . . . . . . . . . . . . . . . . . . 25
Analysis of Agencies with Revenues Between $1,250,000 and $2,500,000
Key Benchmarks. . . . . . . . . . . . . . . . . . . . . . . . . . . . . . . . . . . . . . . . . . . . . . . . . . . . . . . . . . . . . . . . . . . . . . . . . . . . . . . . . . . . . . . . . . . . . 29 Profile. . . . . . . . . . . . . . . . . . . . . . . . . . . . . . . . . . . . . . . . . . . . . . . . . . . . . . . . . . . . . . . . . . . . . . . . . . . . . . . . . . . . . . . . . . . . . . . . . . . . . . . 30 Revenues . . . . . . . . . . . . . . . . . . . . . . . . . . . . . . . . . . . . . . . . . . . . . . . . . . . . . . . . . . . . . . . . . . . . . . . . . . . . . . . . . . . . . . . . . . . . . . . . . . . 31 Expenses . . . . . . . . . . . . . . . . . . . . . . . . . . . . . . . . . . . . . . . . . . . . . . . . . . . . . . . . . . . . . . . . . . . . . . . . . . . . . . . . . . . . . . . . . . . . . . . . . . . . 38Profitability. . . . . . . . . . . . . . . . . . . . . . . . . . . . . . . . . . . . . . . . . . . . . . . . . . . . . . . . . . . . . . . . . . . . . . . . . . . . . . . . . . . . . . . . . . . . . . . . . . 40 Employee Overview . . . . . . . . . . . . . . . . . . . . . . . . . . . . . . . . . . . . . . . . . . . . . . . . . . . . . . . . . . . . . . . . . . . . . . . . . . . . . . . . . . . . . . . . . 43Producer Information. . . . . . . . . . . . . . . . . . . . . . . . . . . . . . . . . . . . . . . . . . . . . . . . . . . . . . . . . . . . . . . . . . . . . . . . . . . . . . . . . . . . . . . . 44Service Staff Information . . . . . . . . . . . . . . . . . . . . . . . . . . . . . . . . . . . . . . . . . . . . . . . . . . . . . . . . . . . . . . . . . . . . . . . . . . . . . . . . . . . . 47Technology . . . . . . . . . . . . . . . . . . . . . . . . . . . . . . . . . . . . . . . . . . . . . . . . . . . . . . . . . . . . . . . . . . . . . . . . . . . . . . . . . . . . . . . . . . . . . . . . . 50 Insurance Carriers . . . . . . . . . . . . . . . . . . . . . . . . . . . . . . . . . . . . . . . . . . . . . . . . . . . . . . . . . . . . . . . . . . . . . . . . . . . . . . . . . . . . . . . . . . . 51
Analysis of Agencies with Revenues Between $2,500,000 and $5,000,000
Key Benchmarks. . . . . . . . . . . . . . . . . . . . . . . . . . . . . . . . . . . . . . . . . . . . . . . . . . . . . . . . . . . . . . . . . . . . . . . . . . . . . . . . . . . . . . . . . . . . . 55 Profile. . . . . . . . . . . . . . . . . . . . . . . . . . . . . . . . . . . . . . . . . . . . . . . . . . . . . . . . . . . . . . . . . . . . . . . . . . . . . . . . . . . . . . . . . . . . . . . . . . . . . . . 56Revenues . . . . . . . . . . . . . . . . . . . . . . . . . . . . . . . . . . . . . . . . . . . . . . . . . . . . . . . . . . . . . . . . . . . . . . . . . . . . . . . . . . . . . . . . . . . . . . . . . . . 57Expenses . . . . . . . . . . . . . . . . . . . . . . . . . . . . . . . . . . . . . . . . . . . . . . . . . . . . . . . . . . . . . . . . . . . . . . . . . . . . . . . . . . . . . . . . . . . . . . . . . . . . 64Profitability. . . . . . . . . . . . . . . . . . . . . . . . . . . . . . . . . . . . . . . . . . . . . . . . . . . . . . . . . . . . . . . . . . . . . . . . . . . . . . . . . . . . . . . . . . . . . . . . . . 66Employee Overview . . . . . . . . . . . . . . . . . . . . . . . . . . . . . . . . . . . . . . . . . . . . . . . . . . . . . . . . . . . . . . . . . . . . . . . . . . . . . . . . . . . . . . . . . 69Producer Information. . . . . . . . . . . . . . . . . . . . . . . . . . . . . . . . . . . . . . . . . . . . . . . . . . . . . . . . . . . . . . . . . . . . . . . . . . . . . . . . . . . . . . . . 70Service Staff Information . . . . . . . . . . . . . . . . . . . . . . . . . . . . . . . . . . . . . . . . . . . . . . . . . . . . . . . . . . . . . . . . . . . . . . . . . . . . . . . . . . . . 73Technology . . . . . . . . . . . . . . . . . . . . . . . . . . . . . . . . . . . . . . . . . . . . . . . . . . . . . . . . . . . . . . . . . . . . . . . . . . . . . . . . . . . . . . . . . . . . . . . . . 76Insurance Carriers . . . . . . . . . . . . . . . . . . . . . . . . . . . . . . . . . . . . . . . . . . . . . . . . . . . . . . . . . . . . . . . . . . . . . . . . . . . . . . . . . . . . . . . . . . . 77
Analysis of Agencies with Revenues Between $5,000,000 and $10,000,000
Key Benchmarks. . . . . . . . . . . . . . . . . . . . . . . . . . . . . . . . . . . . . . . . . . . . . . . . . . . . . . . . . . . . . . . . . . . . . . . . . . . . . . . . . . . . . . . . . . . . . 81Profile. . . . . . . . . . . . . . . . . . . . . . . . . . . . . . . . . . . . . . . . . . . . . . . . . . . . . . . . . . . . . . . . . . . . . . . . . . . . . . . . . . . . . . . . . . . . . . . . . . . . . . . 82Revenues . . . . . . . . . . . . . . . . . . . . . . . . . . . . . . . . . . . . . . . . . . . . . . . . . . . . . . . . . . . . . . . . . . . . . . . . . . . . . . . . . . . . . . . . . . . . . . . . . . . 83Expenses . . . . . . . . . . . . . . . . . . . . . . . . . . . . . . . . . . . . . . . . . . . . . . . . . . . . . . . . . . . . . . . . . . . . . . . . . . . . . . . . . . . . . . . . . . . . . . . . . . . . 90Profitability. . . . . . . . . . . . . . . . . . . . . . . . . . . . . . . . . . . . . . . . . . . . . . . . . . . . . . . . . . . . . . . . . . . . . . . . . . . . . . . . . . . . . . . . . . . . . . . . . . 92Employee Overview . . . . . . . . . . . . . . . . . . . . . . . . . . . . . . . . . . . . . . . . . . . . . . . . . . . . . . . . . . . . . . . . . . . . . . . . . . . . . . . . . . . . . . . . . 95Producer Information. . . . . . . . . . . . . . . . . . . . . . . . . . . . . . . . . . . . . . . . . . . . . . . . . . . . . . . . . . . . . . . . . . . . . . . . . . . . . . . . . . . . . . . . 96Service Staff Information . . . . . . . . . . . . . . . . . . . . . . . . . . . . . . . . . . . . . . . . . . . . . . . . . . . . . . . . . . . . . . . . . . . . . . . . . . . . . . . . . . . . 99Technology . . . . . . . . . . . . . . . . . . . . . . . . . . . . . . . . . . . . . . . . . . . . . . . . . . . . . . . . . . . . . . . . . . . . . . . . . . . . . . . . . . . . . . . . . . . . . . . . 102 Insurance Carriers . . . . . . . . . . . . . . . . . . . . . . . . . . . . . . . . . . . . . . . . . . . . . . . . . . . . . . . . . . . . . . . . . . . . . . . . . . . . . . . . . . . . . . . . . . 103
For state association and Council for Best Practices use only.
2014 BestPractices Study
iii
2014 Best Practices Study
Analysis of Agencies with Revenues Between $10,000,000 and $25,000,000
Key Benchmarks . . . . . . . . . . . . . . . . . . . . . . . . . . . . . . . . . . . . . . . . . . . . . . . . . . . . . . . . . . . . . . . . . . . . . . . . . . . . . . . . . . . . . . . . . . . .107Profile . . . . . . . . . . . . . . . . . . . . . . . . . . . . . . . . . . . . . . . . . . . . . . . . . . . . . . . . . . . . . . . . . . . . . . . . . . . . . . . . . . . . . . . . . . . . . . . . . . . . . .108Revenues . . . . . . . . . . . . . . . . . . . . . . . . . . . . . . . . . . . . . . . . . . . . . . . . . . . . . . . . . . . . . . . . . . . . . . . . . . . . . . . . . . . . . . . . . . . . . . . . . . 109 Expenses . . . . . . . . . . . . . . . . . . . . . . . . . . . . . . . . . . . . . . . . . . . . . . . . . . . . . . . . . . . . . . . . . . . . . . . . . . . . . . . . . . . . . . . . . . . . . . . . . . . 116 Profitability. . . . . . . . . . . . . . . . . . . . . . . . . . . . . . . . . . . . . . . . . . . . . . . . . . . . . . . . . . . . . . . . . . . . . . . . . . . . . . . . . . . . . . . . . . . . . . . . . 118Employee Overview . . . . . . . . . . . . . . . . . . . . . . . . . . . . . . . . . . . . . . . . . . . . . . . . . . . . . . . . . . . . . . . . . . . . . . . . . . . . . . . . . . . . . . . . 121Producer Information . . . . . . . . . . . . . . . . . . . . . . . . . . . . . . . . . . . . . . . . . . . . . . . . . . . . . . . . . . . . . . . . . . . . . . . . . . . . . . . . . . . . . . .122Service Staff Information . . . . . . . . . . . . . . . . . . . . . . . . . . . . . . . . . . . . . . . . . . . . . . . . . . . . . . . . . . . . . . . . . . . . . . . . . . . . . . . . . . . .125 Technology . . . . . . . . . . . . . . . . . . . . . . . . . . . . . . . . . . . . . . . . . . . . . . . . . . . . . . . . . . . . . . . . . . . . . . . . . . . . . . . . . . . . . . . . . . . . . . . . .128 Insurance Carriers . . . . . . . . . . . . . . . . . . . . . . . . . . . . . . . . . . . . . . . . . . . . . . . . . . . . . . . . . . . . . . . . . . . . . . . . . . . . . . . . . . . . . . . . . . .129
Analysis of Agencies with Revenues Over $25,000,000
Key Benchmarks . . . . . . . . . . . . . . . . . . . . . . . . . . . . . . . . . . . . . . . . . . . . . . . . . . . . . . . . . . . . . . . . . . . . . . . . . . . . . . . . . . . . . . . . . . . .133 Profile . . . . . . . . . . . . . . . . . . . . . . . . . . . . . . . . . . . . . . . . . . . . . . . . . . . . . . . . . . . . . . . . . . . . . . . . . . . . . . . . . . . . . . . . . . . . . . . . . . . . . .134 Revenues . . . . . . . . . . . . . . . . . . . . . . . . . . . . . . . . . . . . . . . . . . . . . . . . . . . . . . . . . . . . . . . . . . . . . . . . . . . . . . . . . . . . . . . . . . . . . . . . . . 135 Expenses . . . . . . . . . . . . . . . . . . . . . . . . . . . . . . . . . . . . . . . . . . . . . . . . . . . . . . . . . . . . . . . . . . . . . . . . . . . . . . . . . . . . . . . . . . . . . . . . . . . 142Profitability. . . . . . . . . . . . . . . . . . . . . . . . . . . . . . . . . . . . . . . . . . . . . . . . . . . . . . . . . . . . . . . . . . . . . . . . . . . . . . . . . . . . . . . . . . . . . . . . . 144Employee Overview . . . . . . . . . . . . . . . . . . . . . . . . . . . . . . . . . . . . . . . . . . . . . . . . . . . . . . . . . . . . . . . . . . . . . . . . . . . . . . . . . . . . . . . . .147Producer Information . . . . . . . . . . . . . . . . . . . . . . . . . . . . . . . . . . . . . . . . . . . . . . . . . . . . . . . . . . . . . . . . . . . . . . . . . . . . . . . . . . . . . . .148 Service Staff Information . . . . . . . . . . . . . . . . . . . . . . . . . . . . . . . . . . . . . . . . . . . . . . . . . . . . . . . . . . . . . . . . . . . . . . . . . . . . . . . . . . . .151 Technology . . . . . . . . . . . . . . . . . . . . . . . . . . . . . . . . . . . . . . . . . . . . . . . . . . . . . . . . . . . . . . . . . . . . . . . . . . . . . . . . . . . . . . . . . . . . . . . . .154 Insurance Carriers . . . . . . . . . . . . . . . . . . . . . . . . . . . . . . . . . . . . . . . . . . . . . . . . . . . . . . . . . . . . . . . . . . . . . . . . . . . . . . . . . . . . . . . . . . .155
Appendix
Population Density Analysis . . . . . . . . . . . . . . . . . . . . . . . . . . . . . . . . . . . . . . . . . . . . . . . . . . . . . . . . . . . . . . . . . . . . . . . . . . . . . . . . .159Regional Analysis . . . . . . . . . . . . . . . . . . . . . . . . . . . . . . . . . . . . . . . . . . . . . . . . . . . . . . . . . . . . . . . . . . . . . . . . . . . . . . . . . . . . . . . . . . .161Glossary / Definitions / Formulas . . . . . . . . . . . . . . . . . . . . . . . . . . . . . . . . . . . . . . . . . . . . . . . . . . . . . . . . . . . . . . . . . . . . . . . . . . . .163For state association and Council fo
r Best Practices use only.

2014 BestPractices Study
iv
2014 Best Practices Study
INTRODUCTIONSince 1993 the annual Best Practices Study has served as a tool to help agency owners and managers understand how their business operations perform and measure up to the top performing firms across the country. It is a “must have” for those agencies that want to become the best they can be.
The 2014 Best Practices Study provides critical performance benchmarks in six agency revenue categories ranging from Under $1,250,000 to Over $25,000,000. Agencies can measure, evaluate, and compare results for agency operations including:
• Income & Expense Distribution
• Revenue & Profitability Growth
• Sales & Service Staff Compensation/Productivity
• Technology Expenses
• Property & Casualty and Life & Health Carrier Representation
• And much more
The 2014 study can be purchased from the Independent Insurance Agents & Brokers of America (Big “I”) Education Department. Orders can be placed at http://bp.reaganconsulting.com or at www.independentagent.com. For more information please call 1-800-221-7917.
About The Study
The History
The annual Best Practices Study originated in 1993 as an initiative by the Independent Insurance Agents & Brokers of America (Big “I”) to help its members build and maintain the value of their most important assets, their agencies. By studying the leading agencies and brokers in the country, the association hoped to provide member agents with meaningful performance benchmarks and business strategies that could be adopted or adapted for use in improving agency
performance, thus enhancing agency value.
The Big “I” retained the principals of Reagan Consulting to create and perform the first Best Practices Study. Annual updates conducted by Reagan Consulting continue to provide important financial and operational benchmarks, and the study is recognized as one of the most thoughtful, effective and valuable resources ever made available to the industry.
The Process
Once every three years the Big “I” asks insurance companies, state association affiliates, and other industry organizations to nominate for each of the study revenue categories those agencies they consider to be among the better, more professional agencies in the industry.
The nominated agencies are then invited to participate. They must be willing to share key business practices/philosophies and to complete an in-depth survey detailing their financial and operational year-end results. Those results are then scored and ranked objectively for inclusion on the basis of operational excellence.
In 2013, the beginning of the current three-year study cycle, nearly 1,200 independent agencies throughout the U.S. were nominated to take part in the annual study. Although participation required extensive time and effort, 308 submitted their data; only 217 qualified for the honor and acquired the Best Practices status.
To be chosen, the agency had to be among the top 30-40 top performing agencies in one of six revenue categories. Their year-end results and business practices were then compiled to create the Best Practices benchmarks. The agencies retain their Best Practices status for the three-year study cycle as long as they submit their data each year so that the benchmarks can be updated annually. The 2014 study continues to examine the 2013 agencies.
Taking part in the study has become a prestigious recognition of the superior accomplishments of the top insurance agencies in the country. 2016 will mark
For state association and Council for Best Practices use only.
2014 BestPractices Study
v
2014 Best Practices Study
the beginning of a new study cycle in which the nomination and qualification process will be repeated. Those agencies that believe they have the qualities of a Best Practices Agency and wish to be nominated in 2016 for the next study cycle should contact their state association or insurance carrier and ask that their name be submitted.
About the Best Practices
Gateway WebsiteThe electronic version of this study can be accessed via the websites of the Big “I” (www.independentagent.com) and Reagan Consulting (www.reaganconsulting.com).
From the Best Practices Gateway home page, users can do the following:
• View an HTML version of the current and past Best Practices Study Executive Updates
• Download a Best Practices comparison spreadsheet to compare their year-end results with the study’s results
• Access other Best Practices studies, tools and products
• Order a copy of the study
Other Best Practices Studies and Tools
In addition to the annual Best Practices Study, many other useful studies, resources, and tools are available to help agencies improve their performance and enhance the value of their businesses. Two of the most frequently used tools are The Agency Self-
Diagnostic Tool and the Joint Agency Company
Planner. These Best Practices tools are part of a complete line of Best Practices products and services. Order forms can be downloaded from http://bp.reaganconsulting.com or can be purchased online at www.independentagent.com.
If You Have Questions
If you have questions about the information published in the 2014 Best Practices Study please contact the Big “I” Education Department at 800-221-7917 or Reagan Consulting at 404-233-5545.
For state association and Council for Best Practices use only.

2014 BestPractices Study
1
2014 Best Practices Study
For state association and Council for Best Practices use only.

2014 BestPractices Study
2
2014 Best Practices Study
Agencies with Revenues Under $1,250,000
$1,250,000 $25,000,000$2,500,000 $5,000,000 $10,000,000
For state association and Council for Best Practices use only.

2014 BestPractices Study
AgencieswithRevenuesUnder $1,250,000
3
Analysis of Agencies with Revenues Under $1,250,000
Key Benchmarks
Profile
Revenues
Expenses
Profitability
Employee Overview
Producer Info
Service Staff Info
Technology
Insurance Carriers
Appendix
Key Benchmarks at a Glance Average +25% Profit +25% Growth
Growth
Organic Growth By Line of Business*
Commercial P&C 1.8% -12.7% 9.2%
Personal P&C 4.1% 2.7% 9.0%
Group Medical -6.2% -28.4% -9.8%
All Other Group -9.3% * *
Total Organic Growth 4.6% 1.4% 14.1%
Profit
Pro Forma Pretax Profit 26.1% 48.3% 27.1%
Pro Forma EBITDA 29.0% 48.6% 30.1%
Rule of 20 Score 18.2 24.1 23.5
Financial
Average Top 25%
Current Ratio 1.53:1 2.82:1
Receivable/Payable Ratio 62.4% 12.3%
Accounts Receivables > 60 Days 48.5% *
Accounts Receivables > 90 Days 4.2% 0.0%
Productivity
Average +25% Profit +25% Growth
Revenue per Employee $135,346 $214,865 $135,198
Compensation per Employee $66,272 $78,802 $63,149
Spread per Employee $69,074 $136,063 $72,049
Annual New Commission Generated per Validated Producer
Average Top 25%
Commercial P&C $33,020 $64,733
Personal P&C $25,231 $43,224
Life & Health/Financial * *
Service Staff Total Payroll as % of Line of Business Revenue
Average # of Service Staff
Commercial P&C 25.5% 1.8
Personal P&C 25.8% 2.0
Group Life & Health/Financial 29.7 0.5
*Insufficient Data
*Excludes any acquired revenue
For state association and Council for Best Practices use only.

2014 BestPractices Study
Agencieswith
RevenuesUnder
$1,250,000
4
Analysis of Agencies with Revenues Under $1,250,000
Key Benchmarks
Profile
Revenues
Expenses
Profitability
Employee Overview
Producer Info
Service Staff Info
Technology
Insurance Carriers
Appendix
Average Total Revenues: $810,333
Population Density of Metropolitan Areas Where Home Offi ce is Located
Average +25% Profi t +25% Growth
Less than 50,000 62.1% 42.9% 57.1%
50,000 – 250,000 10.3% 14.3% 14.3%
250,000 – 1,000,000 17.2% 28.6% 14.3%
More than 1,000,000 10.3% 14.3% 14.3%
Corporate Structure
C 17.2% 0.0% 14.3%
S 69.0% 71.4% 71.4%
Partnership 0.0% 0.0% 0.0%
LLC 10.3% 28.6% 14.3%
Sole Proprietorship 3.4% 0.0% 0.0%
Average Number of Agency Locations
(Main Offi ces and Branch Offi ces) 1.3 1.0 1.6
Total Square Footage of Office Space 2,818 2,251 1,793
# of States in which Offices are Located 1.0 1.0 1.0
Agency has an ESOP 0.0% 0.0% 0.0%
% of Stock Owned by ESOP 0.0% 0.0% 0.0%
Shareholders
Number of Shareholders (excluding ESOP) 2.2 1.7 1.0
High 13.0
Low 1.0
Ownership Percentage
% Owned by Largest Shareholder 75.5% 70.0% 91.7%
High 100.0%
Low 33.3%
Shareholder Age
Current Age of Largest Shareholder 53.0 51.2 46.0
Parent Corporation
Average
Other included Independent Agency.
% of Agencies Owned by Another Corporation 3.7%
Description of Parent Corporation
Financial Institution 50.0%
National Broker 0.0%
Other 50.0%
Member of Group
% of Agencies Belonging to a Franchise, Cluster, Alliance/Network or Aggregator Group 41.2%
Other included Continental Insurance Agency Alliance, SIAA, Consolidated Agencies, ISU, Empire Spectrum Group, Combined Agents of America, Marketsource,
TIA, Bainswest, and DCS Risk Management Group.
Profi le (of Agencies in this Study Group)
For state association and Council for Best Practices use only.

2014 BestPractices Study
AgencieswithRevenuesUnder $1,250,000
5
Analysis of Agencies with Revenues Under $1,250,000
Key Benchmarks
Profile
Revenues
Expenses
Profitability
Employee Overview
Producer Info
Service Staff Info
Technology
Insurance Carriers
Appendix
Revenues
Revenue by Source (% of Gross Revenues)
(% by Source) Average +25% Profit +25% Growth
Property & Casualty
Commercial Commissions & Fees 41.2% 27.0% 29.6%
Bonds 0.4% 0.1% 0.2%
Personal Commissions 45.2% 60.9% 57.6%
Value Added Services 0.4% 0.0% 1.0%
Contingent/Bonus 6.2% 6.8% 8.1%
Total P&C 93.5% 94.8% 96.5%
Life & Health/Financial
Group Medical Commissions & Fees 3.0% 1.0% 1.4%
All Other Group Commissions & Fees 0.4% 0.1% 0.0%
Individual L&H Commissions & Fees 2.6% 4.1% 1.6%
Bonus/Overrides 0.0% 0.0% 0.2%
Total L&H/Financial 6.1% 5.1% 3.3%
Investments 0.1% 0.0% 0.0%
Miscellaneous 0.3% 0.0% 0.2%
Gross Revenues 100.0% 100.0% 100.0%
Brokerage Commission Expense 0.3% 0.2% 0.0%
Net Revenues 99.7% 99.8% 100.0%
% T
otal
Rev
enue
10.0%
20.0%
30.0%
40.0%
50.0%
60.0%
0.0%P&C
Contingent/Bonus
P&CVASFees
P&CPersonalComm& Fees
P&CBondsComm& Fees
P&CCommercial
Comm& Fees
L&HGroup
MedicalComm& Fees
L&HAll OtherGroupComm& Fees
L&HIndividualComm& Fees
L&HBonus/
Overrides
Investments Miscellaneous
Average +25% Profit +25% Growth
For state association and Council for Best Practices use only.

2014 BestPractices Study
Agencieswith
RevenuesUnder
$1,250,000
6
Analysis of Agencies with Revenues Under $1,250,000
Key Benchmarks
Profile
Revenues
Expenses
Profitability
Employee Overview
Producer Info
Service Staff Info
Technology
Insurance Carriers
Appendix
Average +25% Profit +25% Growth
5%
10%
15%
20%
25%
21.4%
0%
What the Typical Transactions Looked Like
Revenues Acquired per Transaction Multiples of Revenue Paid
Average * Average *
High * High *
Low * Low *
Acquired Revenues
% of Agencies
Acquiring
Average
Commissions
Acquired
% of
Net Revenues
Acquisitions Made in Last 12 Months 6.9% $65,806 15.8%
Revenue by Acquisition
*Insufficient Data
Revenue by Specialty/NicheAverage +25% Profit +25% Growth
% of Agencies having an Industry and/or
Product Specialty/Niche37.9% * *
Total Commissions & Fees Generated from All Specialties/Niches $160,853 * *
Total Specialty/Niche Revenue as % of Net Revenues 21.4% * *
*Insufficient Data
Specialty/Niche Revenue as % of Net RevenueFor state association and Council fo
r Best Practices use only.
2014 BestPractices Study
AgencieswithRevenuesUnder $1,250,000
7
Analysis of Agencies with Revenues Under $1,250,000
Key Benchmarks
Profile
Revenues
Expenses
Profitability
Employee Overview
Producer Info
Service Staff Info
Technology
Insurance Carriers
Appendix
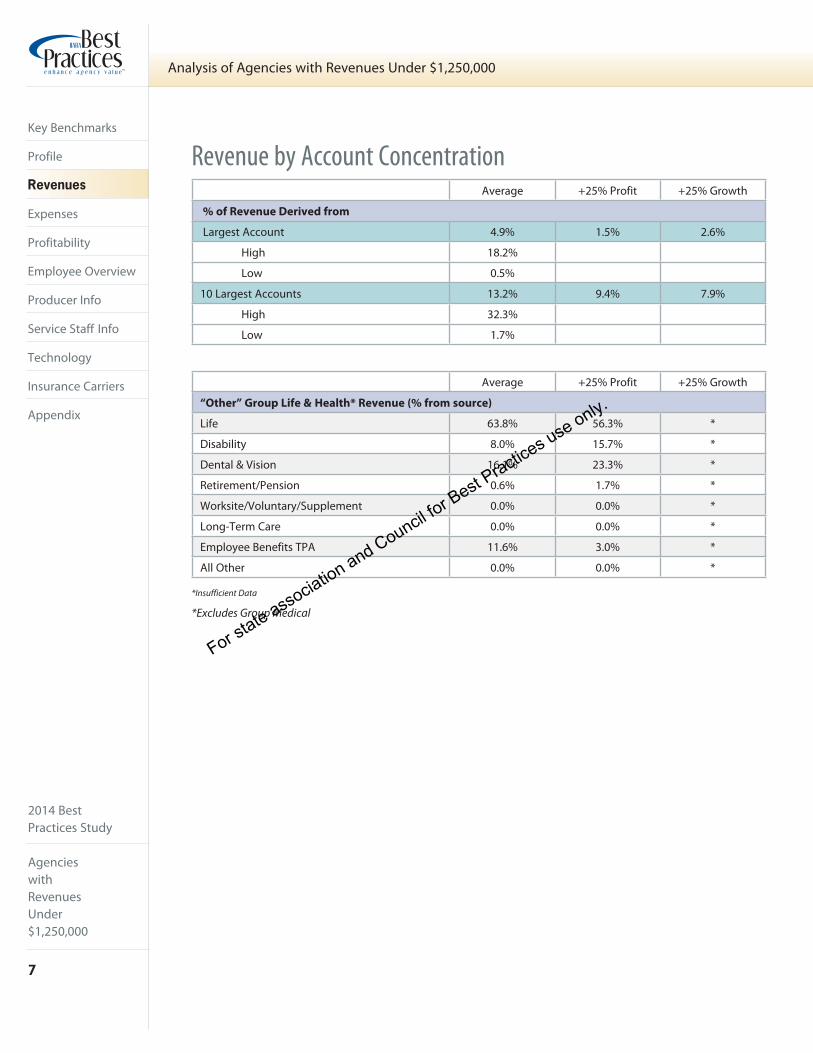
Revenue by Account ConcentrationAverage +25% Profit +25% Growth
% of Revenue Derived from
Largest Account 4.9% 1.5% 2.6%
High 18.2%
Low 0.5%
10 Largest Accounts 13.2% 9.4% 7.9%
High 32.3%
Low 1.7%
Average +25% Profit +25% Growth
“Other” Group Life & Health* Revenue (% from source)
Life 63.8% 56.3% *
Disability 8.0% 15.7% *
Dental & Vision 16.1% 23.3% *
Retirement/Pension 0.6% 1.7% *
Worksite/Voluntary/Supplement 0.0% 0.0% *
Long-Term Care 0.0% 0.0% *
Employee Benefits TPA 11.6% 3.0% *
All Other 0.0% 0.0% *
*Insufficient Data
*Excludes Group Medical
For state association and Council for Best Practices use only.

2014 BestPractices Study
Agencieswith
RevenuesUnder
$1,250,000
8
Analysis of Agencies with Revenues Under $1,250,000
Key Benchmarks
Profile
Revenues
Expenses
Profitability
Employee Overview
Producer Info
Service Staff Info
Technology
Insurance Carriers
Appendix
Revenue by Account Size(as measured by Comm. & Fees – not premium) Average +25% Profit +25% Growth
Commercial P&C
Greater than $25,000
% of Book 17.9% 0.0% 6.6%
# of Accounts 2.5 * *
Total Revenue $161,874 * *
Revenue per Account $65,949 * *
Between $10,000 and $25,000
% of Book 13.1% 17.7% 5.7%
# of Accounts 4.4 4.7 *
Total Revenue $72,556 $84,027 *
Revenue per Account $16,325 $18,006 *
Between $5,000 and $10,000
% of Book 12.2% 21.9% 7.8%
# of Accounts 9.0 17.0 5.0
Total Revenue $54,897 $103,948 $27,759
Revenue per Account $6,069 $6,115 $5,552
Less than $5,000
% of Book 56.8% 60.4% 80.0%
# of Accounts 518.2 346.5 377.8
Total Revenue $225,683 $215,090 $190,070
Revenue per Account $435 $621 $503
(as measured by number of lives) Average +25% Profit +25% Growth
Group L&H/Financial
Over 100 Lives
% of Book 20.4% 0.0% 0.0%
# of Accounts 1.3 * *
Total Revenue $34,186 * *
Revenue per Account $27,349 * *
50 - 100 Lives
% of Book 1.6% 0.0% 0.0%
# of Accounts * * *
Total Revenue * * *
Revenue per Account * * *
25 - 50 Lives
% of Book 23.9% 21.5% 19.4%
# of Accounts 2.9 1.3 *
Total Revenue $22,878 $9,544 *
Revenue per Account $8,007 $7,158 *
Under 25 Lives
% of Book 54.1% 78.5% 80.6%
# of Accounts 32.7 42.3 28.3
Total Revenue $24,151 $34,764 $15,807
Revenue per Account $738 $821 $558
*Insufficient Data
For state association and Council for Best Practices use only.
2014 BestPractices Study
AgencieswithRevenuesUnder $1,250,000
9
Analysis of Agencies with Revenues Under $1,250,000
Key Benchmarks
Profile
Revenues
Expenses
Profitability
Employee Overview
Producer Info
Service Staff Info
Technology
Insurance Carriers
Appendix
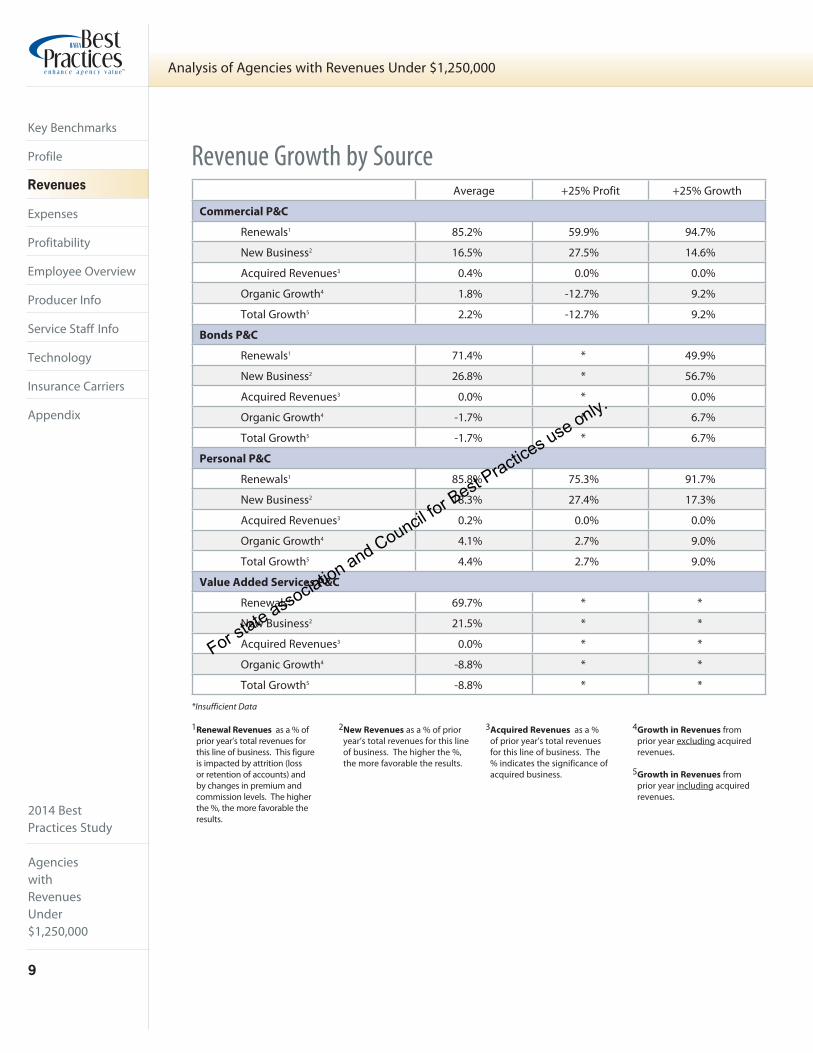
Revenue Growth by Source
*Insufficient Data
Average +25% Profit +25% Growth
Commercial P&C
Renewals1 85.2% 59.9% 94.7%
New Business2 16.5% 27.5% 14.6%
Acquired Revenues3 0.4% 0.0% 0.0%
Organic Growth4 1.8% -12.7% 9.2%
Total Growth5 2.2% -12.7% 9.2%
Bonds P&C
Renewals1 71.4% * 49.9%
New Business2 26.8% * 56.7%
Acquired Revenues3 0.0% * 0.0%
Organic Growth4 -1.7% * 6.7%
Total Growth5 -1.7% * 6.7%
Personal P&C
Renewals1 85.8% 75.3% 91.7%
New Business2 18.3% 27.4% 17.3%
Acquired Revenues3 0.2% 0.0% 0.0%
Organic Growth4 4.1% 2.7% 9.0%
Total Growth5 4.4% 2.7% 9.0%
Value Added Services P&C
Renewals1 69.7% * *
New Business2 21.5% * *
Acquired Revenues3 0.0% * *
Organic Growth4 -8.8% * *
Total Growth5 -8.8% * *
1Renewal Revenues as a % of prior year’s total revenues for this line of business. This figure is impacted by attrition (loss or retention of accounts) and by changes in premium and commission levels. The higher the %, the more favorable the results.
2New Revenues as a % of prior year’s total revenues for this line of business. The higher the %, the more favorable the results.
3Acquired Revenues as a % of prior year’s total revenues for this line of business. The % indicates the significance of acquired business.
4Growth in Revenues from prior year excluding acquired revenues.
5Growth in Revenues from prior year including acquired revenues.
*Insufficient Data
For state association and Council for Best Practices use only.
2014 BestPractices Study
Agencieswith
RevenuesUnder
$1,250,000
10
Analysis of Agencies with Revenues Under $1,250,000
Key Benchmarks
Profile
Revenues
Expenses
Profitability
Employee Overview
Producer Info
Service Staff Info
Technology
Insurance Carriers
Appendix
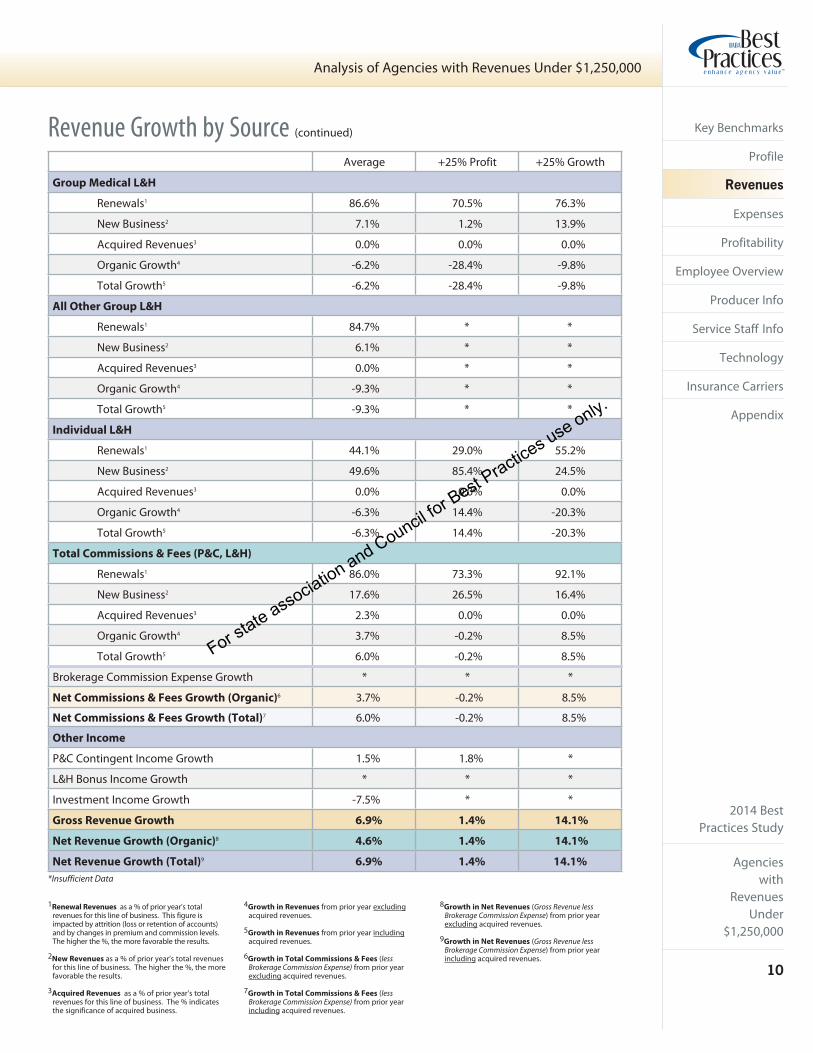
Revenue Growth by Source (continued)
*Insufficient Data
Average +25% Profit +25% Growth
Group Medical L&H
Renewals1 86.6% 70.5% 76.3%
New Business2 7.1% 1.2% 13.9%
Acquired Revenues3 0.0% 0.0% 0.0%
Organic Growth4 -6.2% -28.4% -9.8%
Total Growth5 -6.2% -28.4% -9.8%
All Other Group L&H
Renewals1 84.7% * *
New Business2 6.1% * *
Acquired Revenues3 0.0% * *
Organic Growth4 -9.3% * *
Total Growth5 -9.3% * *
Individual L&H
Renewals1 44.1% 29.0% 55.2%
New Business2 49.6% 85.4% 24.5%
Acquired Revenues3 0.0% 0.0% 0.0%
Organic Growth4 -6.3% 14.4% -20.3%
Total Growth5 -6.3% 14.4% -20.3%
Total Commissions & Fees (P&C, L&H)
Renewals1 86.0% 73.3% 92.1%
New Business2 17.6% 26.5% 16.4%
Acquired Revenues3 2.3% 0.0% 0.0%
Organic Growth4 3.7% -0.2% 8.5%
Total Growth5 6.0% -0.2% 8.5%
Brokerage Commission Expense Growth * * *
Net Commissions & Fees Growth (Organic)6 3.7% -0.2% 8.5%
Net Commissions & Fees Growth (Total)7 6.0% -0.2% 8.5%
Other Income
P&C Contingent Income Growth 1.5% 1.8% *
L&H Bonus Income Growth * * *
Investment Income Growth -7.5% * *
Gross Revenue Growth 6.9% 1.4% 14.1%
Net Revenue Growth (Organic)8 4.6% 1.4% 14.1%
Net Revenue Growth (Total)9 6.9% 1.4% 14.1%
1Renewal Revenues as a % of prior year’s total revenues for this line of business. This figure is impacted by attrition (loss or retention of accounts) and by changes in premium and commission levels. The higher the %, the more favorable the results.
2New Revenues as a % of prior year’s total revenues for this line of business. The higher the %, the more favorable the results.
3Acquired Revenues as a % of prior year’s total revenues for this line of business. The % indicates the significance of acquired business.
4Growth in Revenues from prior year excluding acquired revenues.
5Growth in Revenues from prior year including acquired revenues.
6Growth in Total Commissions & Fees (less Brokerage Commission Expense) from prior year excluding acquired revenues.
7Growth in Total Commissions & Fees (less Brokerage Commission Expense) from prior year including acquired revenues.
8Growth in Net Revenues (Gross Revenue less Brokerage Commission Expense) from prior year excluding acquired revenues.
9Growth in Net Revenues (Gross Revenue less Brokerage Commission Expense) from prior year including acquired revenues.
For state association and Council for Best Practices use only.
2014 BestPractices Study
AgencieswithRevenuesUnder $1,250,000
11
Analysis of Agencies with Revenues Under $1,250,000
Key Benchmarks
Profile
Revenues
Expenses
Profitability
Employee Overview
Producer Info
Service Staff Info
Technology
Insurance Carriers
Appendix
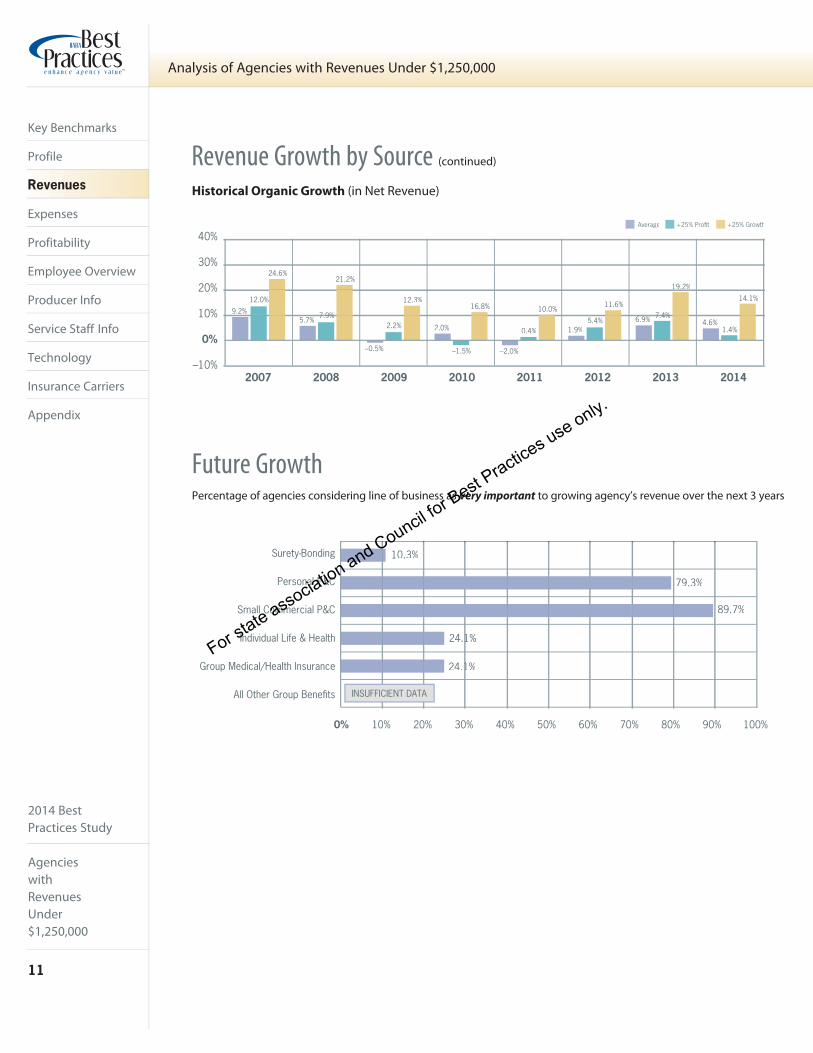
Revenue Growth by Source (continued)
Historical Organic Growth (in Net Revenue)
Future GrowthPercentage of agencies considering line of business as very important to growing agency’s revenue over the next 3 years
Surety-Bonding 10.3%
Personal P&C 79.3%
89.7%Small Commercial P&C
Individual Life & Health 24.1%1
Group Medical/Health Insurance 24.1%1
All Other Group Benefits
0% 10% 20% 30% 40% 50% 60% 70% 80% 90% 100%
2007 2008 2009 2010 2011 2012 2013 2014
10%
–10%
20%
30%
40%
9.2%
12.0%
24.6%
5.7%7.9%7 9%
21.2%
–0.5%
2.2%
12.3%
2.0%
–1.5%
16.8%
–2.0%
0.4%
10.0%
1.9%5.4%
11.6%
6.9% 7.4%7 4%
19.2%
4.6%1.4%
14.1%
0%
Average +25% Profit +25% Growth
For state association and Council for Best Practices use only.

2014 BestPractices Study
Agencieswith
RevenuesUnder
$1,250,000
12
Analysis of Agencies with Revenues Under $1,250,000
Key Benchmarks
Profile
Revenues
Expenses
Profitability
Employee Overview
Producer Info
Service Staff Info
Technology
Insurance Carriers
Appendix
Expenses (as % of Net Revenues)
Average +25% Profit +25% Growth
Compensation Expenses
Payroll: Employee 39.7% 31.9% 40.5%
Payroll: “Non-Employee” - 1099 Producers/Temp Help 4.3% 0.8% 3.8%
Total Payroll 44.0% 32.7% 44.3%
Benefits: Payroll Taxes 3.9% 2.7% 3.0%
Benefits: Retirement 1.4% 1.3% 1.5%
Benefits: Insurance 3.0% 0.7% 3.2%
Benefits: Other 0.3% 0.9% 0.2%
Total Benefits 8.6% 5.6% 7.9%
Total Compensation 52.5% 38.3% 52.2%
Selling Expenses
T&E/Conventions 1.2% 0.6% 1.0%
Auto Expenditures 1.5% 0.9% 1.5%
Auto Depreciation 0.4% 0.0% 0.5%
Total Auto 2.0% 0.9% 2.0%
Advertising/Promotions 2.0% 2.1% 2.5%
Total Selling 5.1% 3.5% 5.5%
Operating Expenses
Occupancy Expenditures 4.7% 4.1% 4.1%
Occupancy Depreciation/Amortization 0.4% 0.1% 0.1%
Total Occupancy 5.0% 4.2% 4.3%
Office Equipment Expenditures 0.3% 0.2% 0.0%
Office Equipment Depreciation 0.1% 0.0% 0.1%
Total Office Equipment 0.4% 0.2% 0.1%
IT (Information Technology) 2.6% 1.8% 2.2%
IT Depreciation/Amortization 0.1% 0.0% 0.1%
Total IT 2.7% 1.8% 2.4%
Telephone 1.3% 1.0% 1.2%
Postage 0.5% 0.3% 0.5%
Supplies/Printing 1.4% 1.2% 1.6%
Dues/Subscriptions/Contributions 1.2% 0.9% 0.9%
Taxes/Licenses 0.8% 0.5% 1.7%
Insurance 2.1% 1.4% 1.7%
Professional Fees 0.6% 0.5% 0.8%
Bad Debts 0.0% 0.0% 0.1%
Outside Services 0.6% 0.0% 0.9%
Education/Training 0.3% 0.2% 0.2%
Miscellaneous 0.5% 0.1% 0.2%
Total Operating 17.3% 12.4% 16.5%
continued on next page
For state association and Council for Best Practices use only.

2014 BestPractices Study
AgencieswithRevenuesUnder $1,250,000
13
Analysis of Agencies with Revenues Under $1,250,000
Key Benchmarks
Profile
Revenues
Expenses
Profitability
Employee Overview
Producer Info
Service Staff Info
Technology
Insurance Carriers
Appendix
Compensation Selling Operating Administrative0%
10%
20%
30%
40%
50%
60%Average +25% Profit +25% Growth
5.1% 3.5%3.5%5.5%
17.3%17 3%12.4%12 4%
16.5%16 5%
2.3%2.3%0.3%0 3%
2.3%2.3%
52.2%52 2% 52.2%52 2%
38.3%38.3%
Average +25% Profit +25% Growth
Administrative Expenses
Amortization of Intangibles 0.9% 0.2% 1.0%
Officer Life 0.2% 0.1% 0.3%
Interest 1.0% 0.0% 0.9%
Other 0.2% 0.0% 0.0%
Total Administrative 2.3% 0.3% 2.3%
Total Expenses 77.3% 54.5% 76.5%
Pre-Tax Profit (Loss) 22.7% 45.5% 23.5%
EBITDA 25.6% 45.8% 26.4%
Average +25% Profit +25% Growth
Expense Growth Over Prior Year
Compensation Expense 5.6% -6.1% 7.7%
Selling Expense -4.8% -7.4% -14.2%
Operating Expense 7.1% 5.9% 10.7%
Administrative Expense 4.0% * *
Expenses (as % of Net Revenues) — continued
Expenses (as % of Net Revenues)
*Insufficient Data
For state association and Council for Best Practices use only.

2014 BestPractices Study
Agencieswith
RevenuesUnder
$1,250,000
14
Analysis of Agencies with Revenues Under $1,250,000
Key Benchmarks
Profile
Revenues
Expenses
Profitability
Employee Overview
Producer Info
Service Staff Info
Technology
Insurance Carriers
Appendix
Average +25% Profit +25% Growth
Revenues (as % of Gross Revenue)
Commercial Lines 41.2% 27.0% 29.6%
Bonds 0.4% 0.1% 0.2%
Personal Lines 45.2% 60.9% 57.6%
VAS - P&C 0.4% 0.0% 1.0%
Contingent/Bonus 6.2% 6.8% 8.1%
Group Medical 3.0% 1.0% 1.4%
All Other Group 0.4% 0.1% 0.0%
Individual Life & Health 2.6% 4.1% 1.6%
Bonus/Overrides 0.0% 0.0% 0.2%
Investments 0.1% 0.0% 0.0%
Miscellaneous 0.3% 0.0% 0.2%
Total Revenues 100.0% 100.0% 100.0%
Brokerage Commission Expense 0.3% 0.2% 0.0%
Net Revenues 99.7% 99.8% 100.0%
Expenses (as % of Net Revenues)
Compensation 52.5% 38.3% 52.2%
Selling 5.1% 3.5% 5.5%
Operating 17.3% 12.4% 16.5%
Administrative 2.3% 0.3% 2.3%
Total Expenses 77.3% 54.5% 76.5%
Average +25% Profit +25% Growth
Pre-Tax Profit 22.7% 45.5% 23.5%
Pro Forma Pre-Tax Profit1 26.1% 48.3% 27.1%
Operating Pre-Tax Profit2 17.3% 41.6% 16.3%
EBITDA3 25.6% 45.8% 26.4%
Pro Forma EBITDA4 29.0% 48.6% 30.1%
1Pre-tax Profits if discretionary expenses are eliminated and all owners compensated as employees
2Pre-tax Profits excluding contingents, bonus and investment income
3EBITDA—Earnings Before Interest Taxes Depreciation and Amortization
4EBITDA if discretionary expenses are eliminated and all owners compensated as employees
Profit/Loss Summary
Profit/Loss (as % of Net Revenues)
For state association and Council for Best Practices use only.
2014 BestPractices Study
AgencieswithRevenuesUnder $1,250,000
15
Analysis of Agencies with Revenues Under $1,250,000
Key Benchmarks
Profile
Revenues
Expenses
Profitability
Employee Overview
Producer Info
Service Staff Info
Technology
Insurance Carriers
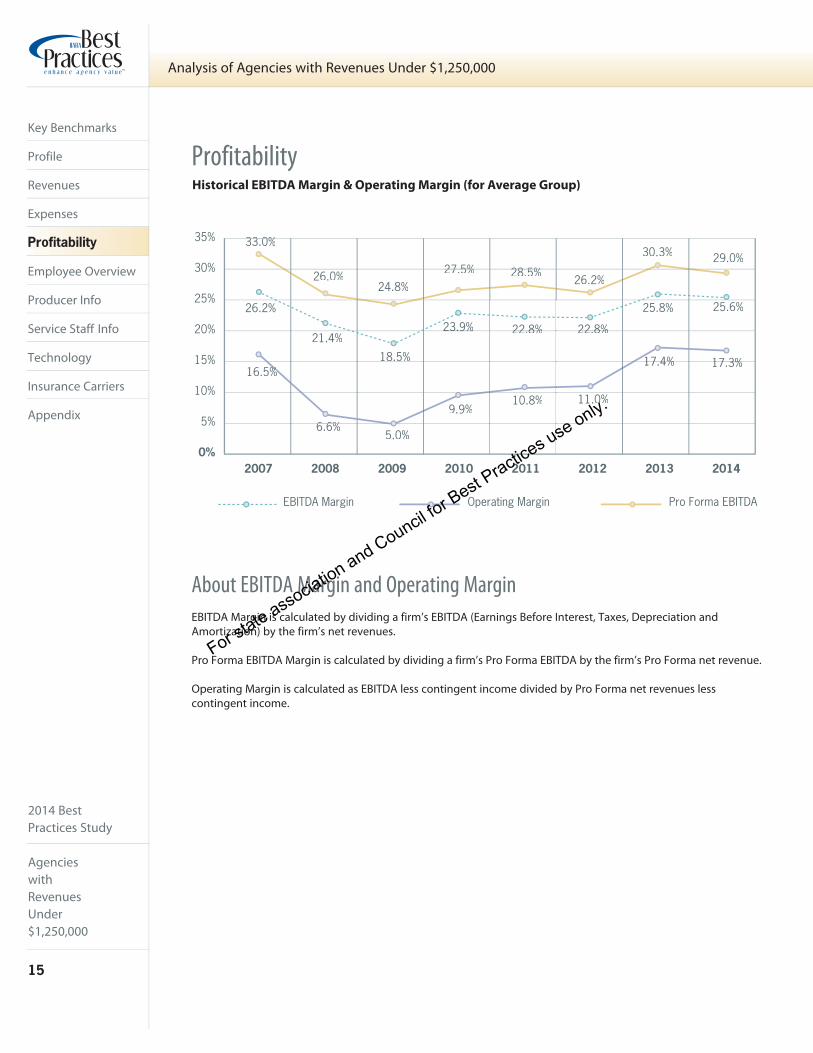
Appendix 5%
10%
15%
20%
25%
30%
35%
0%2008
EBITDA Margin Operating Margin
26.2%
33.0%33 0%
26.0%24.8%
16.5%
21.4%
6.6%6 6%
18.5%
5.0%
23.9%23.9%
9.9%
22.8%22 8%
10.8% 11.0%
25.8% 25.6%
29.0%
17.4%17 4% 17.3%17 3%
20102007 2009 2011 2012 2013 2014
%
Pro Forma EBITDA
22.8%22 8%
27.5%27 5% 28.5%28 5%26.2%
30.3%
Profitability
About EBITDA Margin and Operating Margin
EBITDA Margin is calculated by dividing a firm’s EBITDA (Earnings Before Interest, Taxes, Depreciation and Amortization) by the firm’s net revenues.
Pro Forma EBITDA Margin is calculated by dividing a firm’s Pro Forma EBITDA by the firm’s Pro Forma net revenue.
Operating Margin is calculated as EBITDA less contingent income divided by Pro Forma net revenues less contingent income.
Historical EBITDA Margin & Operating Margin (for Average Group)
For state association and Council for Best Practices use only.

2014 BestPractices Study
Agencieswith
RevenuesUnder
$1,250,000
16
Analysis of Agencies with Revenues Under $1,250,000
Key Benchmarks
Profile
Revenues
Expenses
Profitability
Employee Overview
Producer Info
Service Staff Info
Technology
Insurance Carriers
Appendix
Average Top 25%
Balance Sheet
Current Ratio 1.53:1 2.82:1
Tangible Net Worth (% of Net Revenue) 2.3% 14.7%
Receivables/Payable Ratio 62.4% 12.3%
Aged Receivables
% Receivables Aged Past 60 Days 48.5% *
% Receivables Aged Past 90 Days 4.2% 0.0%
Average +25% Profit +25% Growth
Agency Billed vs. Direct Billed by Carrier
% of P&C Revenues that are Agency Billed 15.5% 3.6% 4.9%
% of P&C Revenues that are Direct Billed 81.0% 82.1% 95.1%
Financial Stability
Accounts Receivable
The Rule of 20 is a simple growth and profitability balancing equation that provides a quick way to determine whether or not an agency is creating value for its shareholders. It states that an agency will drive industry-standard shareholder returns if the sum of (a) its organic growth rate and (b) 1/2 of its EBITDA margin equals or exceeds 20.
Generally speaking, an outcome of 20 or more, regardless of the different combinations of growth and profitability, indicates that the agency’s shareholders can expect to earn 15% -17% per year through stock price appreciation and/or shareholder distributions.
• Provides a tool to benchmark agency performance
• Helps frame the trade-off between growth and profitability
What is the Rule of 20?
Average +25% Profit Average +25% Growth Average
Rule of 20 18.2 24.1 23.5
Public BrokersOrganicGrowth
EBITDA Margin
Rule of 20 Outcome
Willis Group 4.9% 24.0% 16.9
Aon 3.0% 20.9% 13.5
Brown & Brown 6.8% 33.5% 23.6
Arthur J. Gallagher 6.5% 19.9% 16.5
Marsh & McLennan 3.0% 20.7% 13.4
Rule of 20 Outcome
Organic
Revenue
Growth
1/2 of
EBITDA
Margin
Rule of 20 Score +=
*Insufficient Data
For state association and Council for Best Practices use only.
2014 BestPractices Study
AgencieswithRevenuesUnder $1,250,000
17
Analysis of Agencies with Revenues Under $1,250,000
Key Benchmarks
Profile
Revenues
Expenses
Profitability
Employee Overview
Producer Info
Service Staff Info
Technology
Insurance Carriers
Appendix
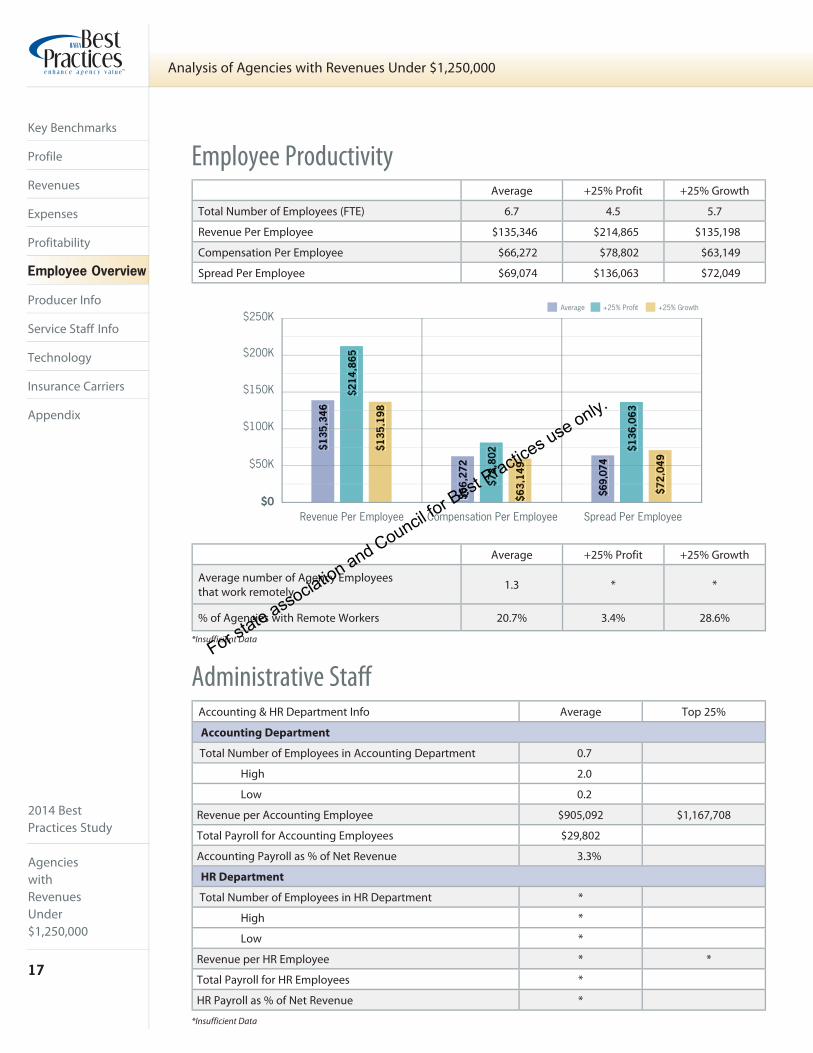
Average +25% Profit +25% Growth
Total Number of Employees (FTE) 6.7 4.5 5.7
Revenue Per Employee $135,346 $214,865 $135,198
Compensation Per Employee $66,272 $78,802 $63,149
Spread Per Employee $69,074 $136,063 $72,049
Average +25% Profit +25% Growth
Average number of Agency Employees that work remotely 1.3 * *
% of Agencies with Remote Workers 20.7% 3.4% 28.6%
Employee Productivity
Administrative Staff
Revenue Per Employee Compensation Per Employee Spread Per Employee$0
$50K
$100K
$150K
$200K
$250K$1
35,3
465
$
$214
,8655
$4
$135
,198
58
$
$66,
2722
6 $78,
802
,2
$
$63,
1499
3
$69,
0747
9
$136
,063
63
$
$72,
0494
7
Average +25% Profit +25% Growth
Accounting & HR Department Info Average Top 25%
Accounting Department
Total Number of Employees in Accounting Department 0.7
High 2.0
Low 0.2
Revenue per Accounting Employee $905,092 $1,167,708
Total Payroll for Accounting Employees $29,802
Accounting Payroll as % of Net Revenue 3.3%
HR Department
Total Number of Employees in HR Department *
High *
Low *
Revenue per HR Employee * *
Total Payroll for HR Employees *
HR Payroll as % of Net Revenue *
*Insufficient Data
*Insufficient DataFor state association and Council fo
r Best Practices use only.
2014 BestPractices Study
Agencieswith
RevenuesUnder
$1,250,000
18
Analysis of Agencies with Revenues Under $1,250,000
Key Benchmarks
Profile
Revenues
Expenses
Profitability
Employee Overview
Producer Info
Service Staff Info
Technology
Insurance Carriers
Appendix
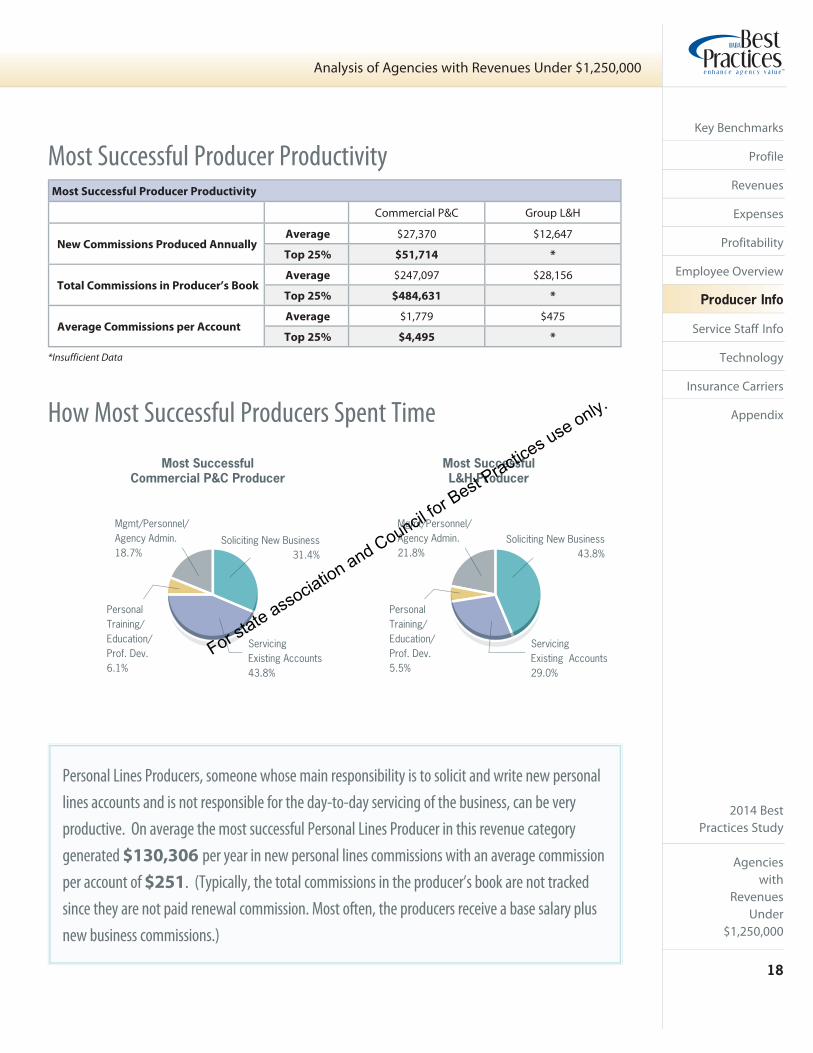
Most Successful Producer Productivity
Commercial P&C Group L&H
New Commissions Produced Annually Average $27,370 $12,647
Top 25% $51,714 *
Total Commissions in Producer’s Book Average $247,097 $28,156
Top 25% $484,631 *
Average Commissions per Account Average $1,779 $475
Top 25% $4,495 *
Most Successful Producer Productivity
How Most Successful Producers Spent Time
Most SuccessfulCommercial P&C Producer
Most SuccessfulL&H Producer
PersonalTraining/Education/Prof. Dev.6.1%
Soliciting New Business31.4%
Mgmt/Personnel/Agency Admin.18.7%
ServicingExisting Accounts43.8%
PersonalTraining/Education/Prof. Dev.5.5%
Soliciting New Business43.8%
Mgmt/Personnel/Agency Admin.21.8%
ServicingExisting Accounts29.0%
Personal Lines Producers, someone whose main responsibility is to solicit and write new personal
lines accounts and is not responsible for the day-to-day servicing of the business, can be very
productive. On average the most successful Personal Lines Producer in this revenue category
generated $130,306 per year in new personal lines commissions with an average commission
per account of $251. (Typically, the total commissions in the producer’s book are not tracked
since they are not paid renewal commission. Most often, the producers receive a base salary plus
new business commissions.)
*Insufficient Data
For state association and Council for Best Practices use only.

2014 BestPractices Study
AgencieswithRevenuesUnder $1,250,000
19
Analysis of Agencies with Revenues Under $1,250,000
Key Benchmarks
Profile
Revenues
Expenses
Profitability
Employee Overview
Producer Info
Service Staff Info
Technology
Insurance Carriers
Appendix
Average Top 25%
Commercial P&C Producers
Average Validated Producers
# Validated 1.6
High 3.2
Low 1.0
Average New Commissions Produced Annually $33,020 $64,733
Average Book Serviced (Commissions) $174,263 $293,933
Average Pay ($) $61,306
Average Pay (% of Book Serviced) 32.5%
Group Life & Health Producers
Average Validated Producers
# Validated 0.8
High 1.5
Low 0.3
Average New Commissions Produced Annually * *
Average Book Serviced (Commissions) $68,587 *
Average Pay ($) $44,297
Average Pay (% of Book Serviced) 64.6%
Personal P&C Producers
Average Validated Producers
# Validated 1.1
High 2.0
Low 0.8
Average New Commissions Produced Annually $25,231 $43,224
Average Book Serviced (Commissions) $142,769 $224,600
Average Pay ($) $44,317
Average Pay (% of Book Serviced) 31.0%
Multi-Line Producers
Average Validated Producers
# Validated 2.1
High 5.0
Low 1.0
Average New Commissions Produced Annually $35,252 $69,995
Average Book Serviced (Commissions) $262,499 $471,416
Average Pay ($) $94,917
Average Pay (% of Book Serviced) 36.2%
Validated Producer Productivity
Average +25% Profit +25% Growth
% of Agencies That Reimburse All/Part T&E Expense 51.7% * 42.9%
*Insufficient Data
For state association and Council for Best Practices use only.

2014 BestPractices Study
Agencieswith
RevenuesUnder
$1,250,000
20
Analysis of Agencies with Revenues Under $1,250,000
Key Benchmarks
Profile
Revenues
Expenses
Profitability
Employee Overview
Producer Info
Service Staff Info
Technology
Insurance Carriers
Appendix
Where New Producers Were Found
UNDER age 30 from WITHINthe insurance industry
OVER age 30 from WITHINthe insurance industry
UNDER age 30 from OUTSIDEthe insurance industry
OVER age 30 from OUTSIDEthe insurance industry
+25% ProfitAverage +25% Growth
14.3%57.1%28.6%
0.0%
33.3%66.7%
0.0%0.0%
****
*Insufficient Data
Average +25% Profit +25% Growth
New Producer Hiring
% of Agencies that Hired New Producers Last Year 20.7% * 42.9%
# of New Producers Hired Last Year 1.2 * 1.0
Average Annualized Wages per Producer Hired $44,075 * $33,150
% of Producers Hired Over Last 5 Years That Met Their Production Goals 73.9% 61.0% 90.0%
New Producers
*Insufficient Data
Average +25% Profit +25% Growth
The NUPP
Expressed as a percentage of Net Revenue, the NUPP is the difference between what an agency pays its unvalidated producer(s) and what the producer(s) would earn under the agency’s normal commission schedule. A NUPP of 1.5% is considered a healthy level of investment.
3.9% * *
High 5.3%
Low 2.0%
By measuring pure payroll costs, the NUPP benchmark allows an “apples-to-apples” comparison with other agencies regarding the amount of direct investment an agency is making in new producers.
While the NUPP provides a general investment guideline, an agency should also consider the success rate of its new producers, i.e. the percentage of new producers hired during the past 5 year period that have achieved the sales goals set before them. By multiplying the NUPP by the producer success rate, an agency can further determine the effectiveness of its NUPP. High performing agencies typically achieve an Effective NUPP between 1.0% - 1.5%.
1An unvalidated producer is one whose production does not yet cover his/her wages
Net-investment in Unvalidated1 Producer Pay
Understanding the NUPP
*Insufficient Data
For state association and Council for Best Practices use only.
2014 BestPractices Study
AgencieswithRevenuesUnder $1,250,000
21
Analysis of Agencies with Revenues Under $1,250,000
Key Benchmarks
Profile
Revenues
Expenses
Profitability
Employee Overview
Producer Info
Service Staff Info
Technology
Insurance Carriers
Appendix
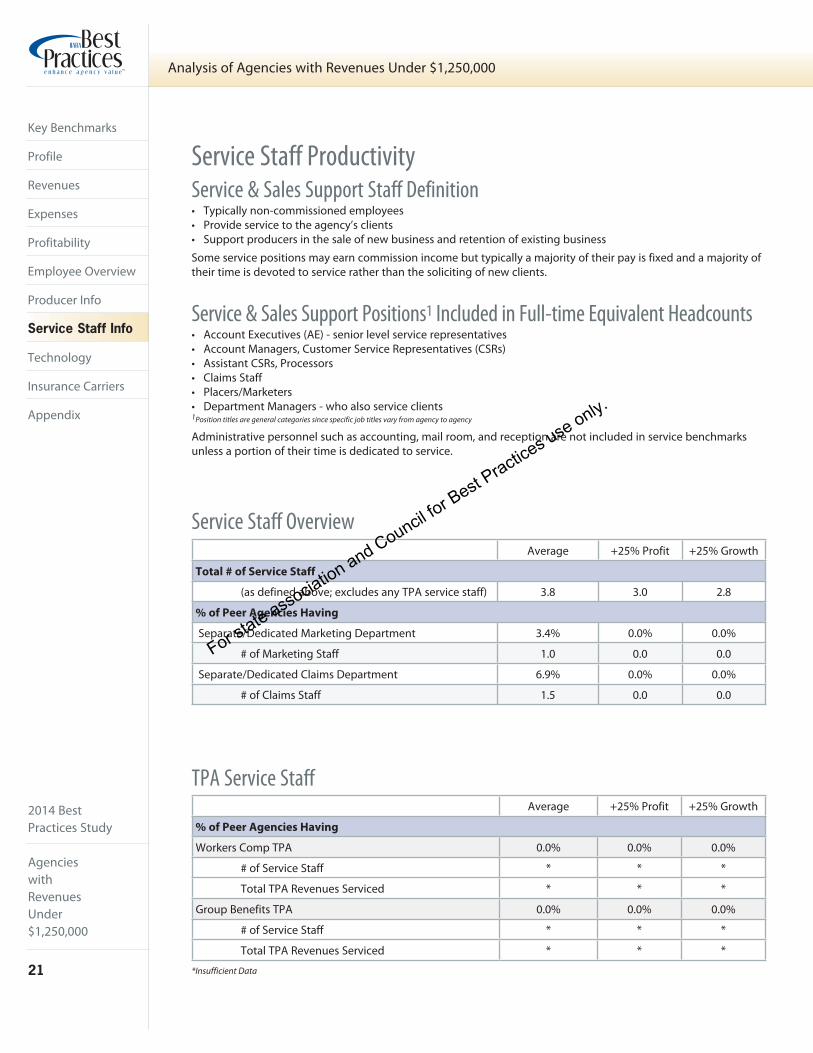
Average +25% Profit +25% Growth
Total # of Service Staff
(as defined above; excludes any TPA service staff) 3.8 3.0 2.8
% of Peer Agencies Having
Separate/Dedicated Marketing Department 3.4% 0.0% 0.0%
# of Marketing Staff 1.0 0.0 0.0
Separate/Dedicated Claims Department 6.9% 0.0% 0.0%
# of Claims Staff 1.5 0.0 0.0
Average +25% Profit +25% Growth
% of Peer Agencies Having
Workers Comp TPA 0.0% 0.0% 0.0%
# of Service Staff * * *
Total TPA Revenues Serviced * * *
Group Benefits TPA 0.0% 0.0% 0.0%
# of Service Staff * * *
Total TPA Revenues Serviced * * *
TPA Service Staff
Service & Sales Support Staff Definition• Typically non-commissioned employees• Provide service to the agency’s clients• Support producers in the sale of new business and retention of existing business
Some service positions may earn commission income but typically a majority of their pay is fixed and a majority of their time is devoted to service rather than the soliciting of new clients.
Service & Sales Support Positions1 Included in Full-time Equivalent Headcounts• Account Executives (AE) - senior level service representatives• Account Managers, Customer Service Representatives (CSRs)• Assistant CSRs, Processors• Claims Staff• Placers/Marketers• Department Managers - who also service clients1Position titles are general categories since specific job titles vary from agency to agency
Administrative personnel such as accounting, mail room, and reception are not included in service benchmarks unless a portion of their time is dedicated to service.
*Insufficient Data
Service Staff Overview
Service Staff Productivity
For state association and Council for Best Practices use only.

2014 BestPractices Study
Agencieswith
RevenuesUnder
$1,250,000
22
Analysis of Agencies with Revenues Under $1,250,000
Key Benchmarks
Profile
Revenues
Expenses
Profitability
Employee Overview
Producer Info
Service Staff Info
Technology
Insurance Carriers
Appendix
Service/Sales Support StaffAverage Top 25%
Commercial P&C Service/Sales Support
Number 1.8
High 4.0
Low 0.5
Average Revenue per Staff $255,274 $404,940
Total Commercial Service Payroll ($) $87,098
Payroll (as % of Total Commercial Revenue) 25.5%
Bonds P&C Service/Sales Support Staff
Number *
High *
Low *
Average Revenue per Staff * *
Total Bond Service Payroll ($) *
Payroll (as % of Total Bond Revenue) *
Personal P&C Service/Sales Support Staff
Number 2.0
High 3.8
Low 0.5
Average Revenue per Staff $183,715 $310,729
Total Personal Service Payroll ($) $77,807
Payroll (as % of Total Personal Revenue) 25.8%
Group L&H Service/Sales Support Staff
Number 0.5
High 1.0
Low 0.3
Average Revenue per Staff $89,547 *
Total Group L&H Service Payroll ($) $15,557
Payroll (as % of Total Group L&H Revenue) 29.7%
Individual L&H Service/Sales Support Staff
Number 0.2
High 0.3
Low 0.1
Average Revenue per Staff $65,153 *
Total Individual L&H Service Payroll ($) $9,799
Payroll (as % of Total Individual L&H Revenue) 22.3%
Multi-Line Service/Sales Support Staff
Number 3.6
High 6.5
Low 0.5
Average Revenue per Staff $397,783 *
Total Multi-Line Service Payroll ($) $157,409
Payroll (as % of Total Multi-Line Revenue) 22.3%*Insufficient Data
For state association and Council for Best Practices use only.
2014 BestPractices Study
AgencieswithRevenuesUnder $1,250,000
23
Analysis of Agencies with Revenues Under $1,250,000
Key Benchmarks
Profile
Revenues
Expenses
Profitability
Employee Overview
Producer Info
Service Staff Info
Technology
Insurance Carriers
Appendix
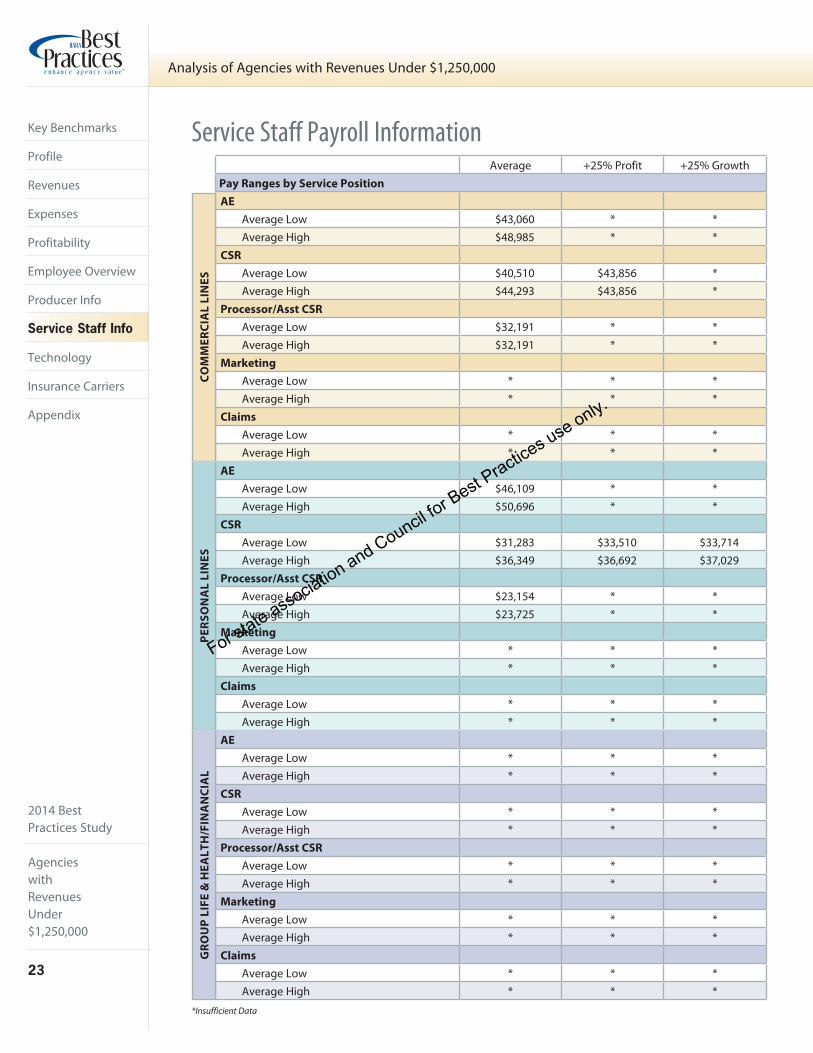
Service Staff Payroll InformationAverage +25% Profit +25% Growth
Pay Ranges by Service Position
AE
Average Low $43,060 * *Average High $48,985 * *
CSR
Average Low $40,510 $43,856 *Average High $44,293 $43,856 *
Processor/Asst CSR
Average Low $32,191 * *Average High $32,191 * *
Marketing
Average Low * * *Average High * * *
Claims
Average Low * * *Average High * * *
AE
Average Low $46,109 * *Average High $50,696 * *
CSR
Average Low $31,283 $33,510 $33,714Average High $36,349 $36,692 $37,029
Processor/Asst CSR
Average Low $23,154 * *Average High $23,725 * *
Marketing
Average Low * * *Average High * * *
Claims
Average Low * * *Average High * * *
AE
Average Low * * *Average High * * *
CSR
Average Low * * *Average High * * *
Processor/Asst CSR
Average Low * * *Average High * * *
Marketing
Average Low * * *Average High * * *
Claims
Average Low * * *Average High * * *
CO
MM
ER
CIA
L L
INE
SP
ER
SO
NA
L L
INE
SG
RO
UP
LIF
E &
HE
AL
TH
/FIN
AN
CIA
L
*Insufficient Data
For state association and Council for Best Practices use only.
2014 BestPractices Study
Agencieswith
RevenuesUnder
$1,250,000
24
Analysis of Agencies with Revenues Under $1,250,000
Key Benchmarks
Profile
Revenues
Expenses
Profitability
Employee Overview
Producer Info
Service Staff Info
Technology
Insurance Carriers
Appendix
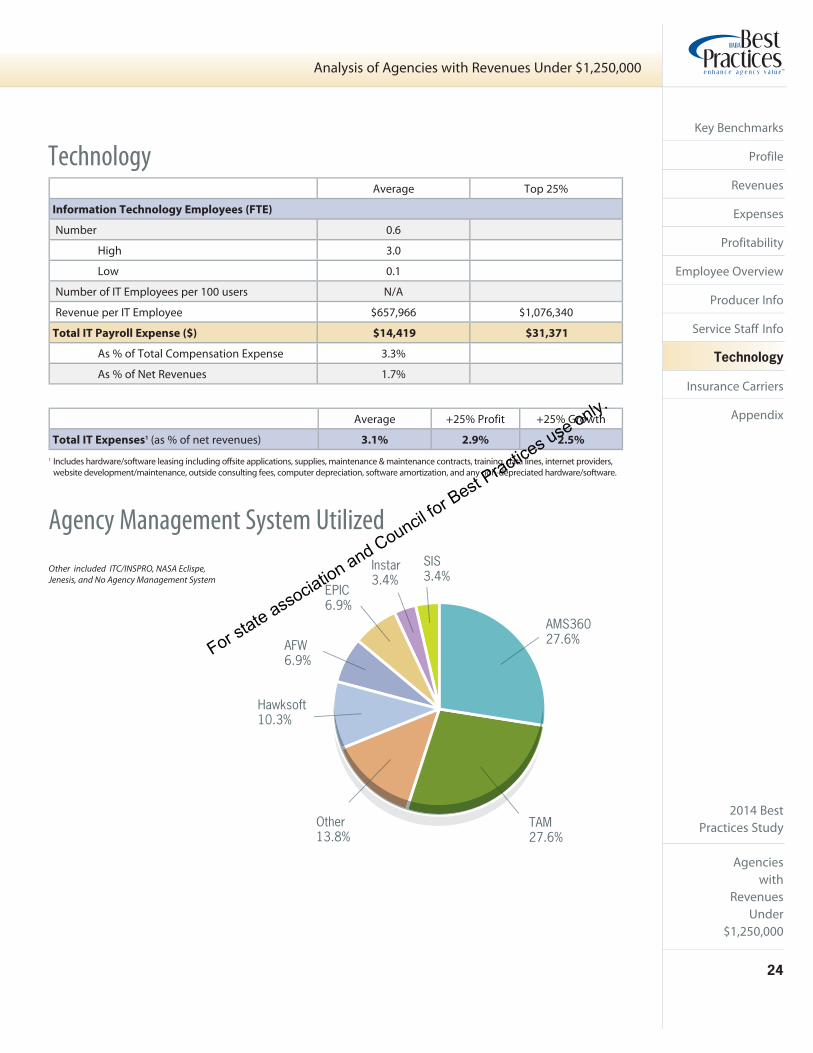
Average Top 25%
Information Technology Employees (FTE)
Number 0.6
High 3.0
Low 0.1
Number of IT Employees per 100 users N/A
Revenue per IT Employee $657,966 $1,076,340
Total IT Payroll Expense ($) $14,419 $31,371
As % of Total Compensation Expense 3.3%
As % of Net Revenues 1.7%
1 Includes hardware/software leasing including offsite applications, supplies, maintenance & maintenance contracts, training, data lines, internet providers, website development/maintenance, outside consulting fees, computer depreciation, software amortization, and any non-depreciated hardware/software.
Other included ITC/INSPRO, NASA Eclispe, Jenesis, and No Agency Management System
Technology
Agency Management System Utilized
Average +25% Profit +25% Growth
Total IT Expenses1 (as % of net revenues) 3.1% 2.9% 2.5%
AMS36027.6%
TAM27.6%
AFW6.9%
EPIC6.9%
Instar3.4%
SIS3.4%
Other13.8%
Hawksoft10.3%
For state association and Council for Best Practices use only.
2014 BestPractices Study
AgencieswithRevenuesUnder $1,250,000
25
Analysis of Agencies with Revenues Under $1,250,000
Key Benchmarks
Profile
Revenues
Expenses
Profitability
Employee Overview
Producer Info
Service Staff Info
Technology
Insurance Carriers
Appendix
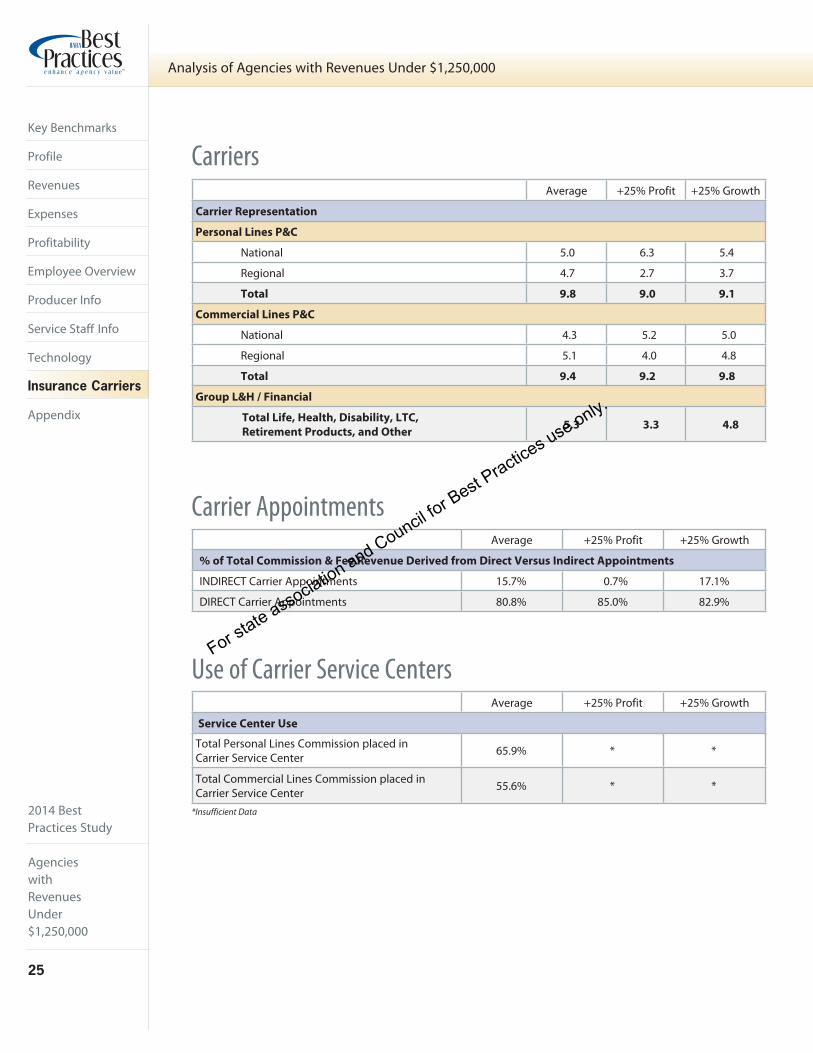
Average +25% Profit +25% Growth
Service Center Use
Total Personal Lines Commission placed in Carrier Service Center 65.9% * *
Total Commercial Lines Commission placed in Carrier Service Center 55.6% * *
Use of Carrier Service Centers
Average +25% Profit +25% Growth
Carrier Representation
Personal Lines P&C
National 5.0 6.3 5.4
Regional 4.7 2.7 3.7
Total 9.8 9.0 9.1
Commercial Lines P&C
National 4.3 5.2 5.0
Regional 5.1 4.0 4.8
Total 9.4 9.2 9.8
Group L&H / Financial
Total Life, Health, Disability, LTC,
Retirement Products, and Other5.3 3.3 4.8
Carriers
Average +25% Profit +25% Growth
% of Total Commission & Fee Revenue Derived from Direct Versus Indirect Appointments
INDIRECT Carrier Appointments 15.7% 0.7% 17.1%
DIRECT Carrier Appointments 80.8% 85.0% 82.9%
Carrier Appointments
*Insufficient Data
For state association and Council for Best Practices use only.
2014 BestPractices Study
Agencieswith
RevenuesUnder
$1,250,000
26
Analysis of Agencies with Revenues Under $1,250,000
Key Benchmarks
Profile
Revenues
Expenses
Profitability
Employee Overview
Producer Info
Service Staff Info
Technology
Insurance Carriers
Appendix
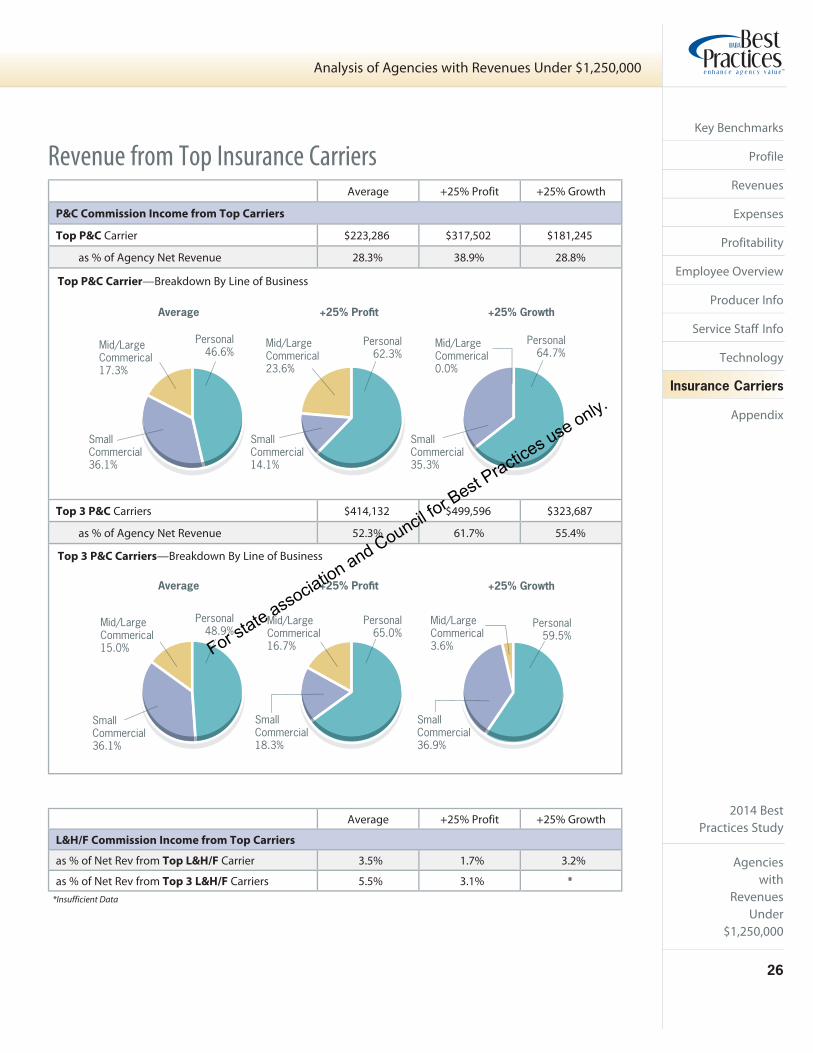
Average +25% Profit +25% Growth
P&C Commission Income from Top Carriers
Top P&C Carrier $223,286 $317,502 $181,245
as % of Agency Net Revenue 28.3% 38.9% 28.8%
Top 3 P&C Carriers $414,132 $499,596 $323,687
as % of Agency Net Revenue 52.3% 61.7% 55.4%
Revenue from Top Insurance Carriers
Average +25% Profit +25% Growth
L&H/F Commission Income from Top Carriers
as % of Net Rev from Top L&H/F Carrier 3.5% 1.7% 3.2%
as % of Net Rev from Top 3 L&H/F Carriers 5.5% 3.1% *
Top P&C Carrier—Breakdown By Line of Business
Top 3 P&C Carriers—Breakdown By Line of Business
*Insufficient Data
+25% ProfitAverage
Mid/LargeCommerical23.6%
Personal62.3%
Mid/LargeCommerical17.3%
Personal46.6%
SmallCommercial36.1%
SmallCommercial14.1%
SmallCommercial35.3%
Mid/LargeCommerical0.0%
Personal64.7%
+25% Growth
Mid/LargeCommerical15.0%
+25% Growth+25% ProfitAverage
Mid/LargeCommerical16.7%
Personal65.0%
SmallCommercial18.3%
Personal48.9%
SmallCommercial36.1%
Mid/LargeCommerical3.6%
Personal59.5%
SmallCommercial36.9%
For state association and Council for Best Practices use only.

2014 BestPractices Study
27
2014 Best Practices Study
For state association and Council for Best Practices use only.
2014 BestPractices Study
28
2014 Best Practices Study
Agencies with Revenues Between $1,250,000 and $2,500,000
$1,250,000 $25,000,000$2,500,000 $5,000,000 $10,000,000
For state association and Council for Best Practices use only.

2014 BestPractices Study
Agencieswith RevenuesBetween $1,250,000 and $2,500,000
29
Analysis of Agencies with Revenues Between $1,250,000 and $2,500,000
Key Benchmarks
Profile
Revenues
Expenses
Profitability
Employee Overview
Producer Info
Service Staff Info
Technology
Insurance Carriers
Appendix
Key Benchmarks at a Glance Average +25% Profit +25% Growth
Growth
Organic Growth By Line of Business*
Commercial P&C 8.3% 9.6% 14.0%
Personal P&C 7.5% 8.5% 16.4%
Group Medical 1.2% 4.1% 17.8%
All Other Group 2.8% * *
Total Organic Growth 10.5% 11.8% 18.9%
Profit
Pro Forma Pretax Profit 23.0% 37.0% 27.5%
Pro Forma EBITDA 30.6% 42.6% 37.7%
Rule of 20 Score 23.7 30.3 35.3
Financial
Average Top 25%
Current Ratio 1.74:1 3.24:1
Receivable/Payable Ratio 62.4% -14.8%
Accounts Receivables > 60 Days 24.6% 1.4%
Accounts Receivables > 90 Days 8.0% 0.0%
Productivity
Average +25% Profit +25% Growth
Revenue per Employee $148,845 $200,208 $179,633
Compensation per Employee $80,893 $82,280 $84,092
Spread per Employee $67,951 $117,927 $95,541
Annual New Commission Generated per Validated Producer
Average Top 25%
Commercial P&C $57,126 $100,696
Personal P&C $22,124 $32,506
Life & Health/Financial $51,649 $80,523
Service Staff Total Payroll as % of Line of Business Revenue
Average # of Service Staff
Commercial P&C 20.5% 3.8
Personal P&C 23.2% 2.9
Group Life & Health/Financial 68.5% 0.9
*Insufficient Data
*Excludes any acquired revenue
For state association and Council for Best Practices use only.

2014 BestPractices Study
Agencieswith Revenues
Between $1,250,000 and
$2,500,000
30
Analysis of Agencies with Revenues Between $1,250,000 and $2,500,000
Key Benchmarks
Profile
Revenues
Expenses
Profitability
Employee Overview
Producer Info
Service Staff Info
Technology
Insurance Carriers
Appendix
Average Total Revenues: $1,879,106
Population Density of Metropolitan Areas Where Home Offi ce is Located
Average +25% Profi t +25% Growth
Less than 50,000 35.7% 16.7% 50.0%
50,000 – 250,000 28.6% 50.0% 16.7%
250,000 – 1,000,000 10.7% 16.7% 0.0%
More than 1,000,000 25.0% 16.7% 33.3%
Corporate Structure
C 32.1% 33.3% 16.7%
S 42.9% 33.3% 16.7%
Partnership 0.0% 0.0% 0.0%
LLC 25.0% 33.3% 66.7%
Sole Proprietorship 0.0% 0.0% 0.0%
Average Number of Agency Locations
(Main Offi ces and Branch Offi ces) 1.8 2.0 2.2
Total Square Footage of Office Space 5,154 4,433 6,040
# of States in which Offices are Located 1.0 1.0 1.0
Agency has an ESOP 0.0% 0.0% 0.0%
% of Stock Owned by ESOP 0.0% 0.0% 0.0%
Shareholders
Number of Shareholders (excluding ESOP) 2.1 1.6 1.8
High 6.0
Low 1.0
Ownership Percentage
% Owned by Largest Shareholder 77.4% 77.7% 83.7%
High 100.0%
Low 47.0%
Shareholder Age
Current Age of Largest Shareholder 51.9 53.5 44.8
Parent Corporation
Average
% of Agencies Owned by Another Corporation 3.7%
Description of Parent Corporation
Financial Institution 100.0%
National Broker 0.0%
Other 0.0%
Member of Group
% of Agencies Belonging to a Franchise, Cluster, Alliance/Network or Aggregator Group 53.6%
Other included The Iroquois Group, Georgia Agency Partners, Inc., North American Insurance Brokers,
Select Prism, Combined Agents of America, Memphis Insurance Group, and Secure Risk/Shared Agency
Services.
Profi le (of Agencies in this Study Group)
For state association and Council for Best Practices use only.
2014 BestPractices Study
Agencieswith RevenuesBetween $1,250,000 and $2,500,000
31
Analysis of Agencies with Revenues Between $1,250,000 and $2,500,000
Key Benchmarks
Profile
Revenues
Expenses
Profitability
Employee Overview
Producer Info
Service Staff Info
Technology
Insurance Carriers
Appendix
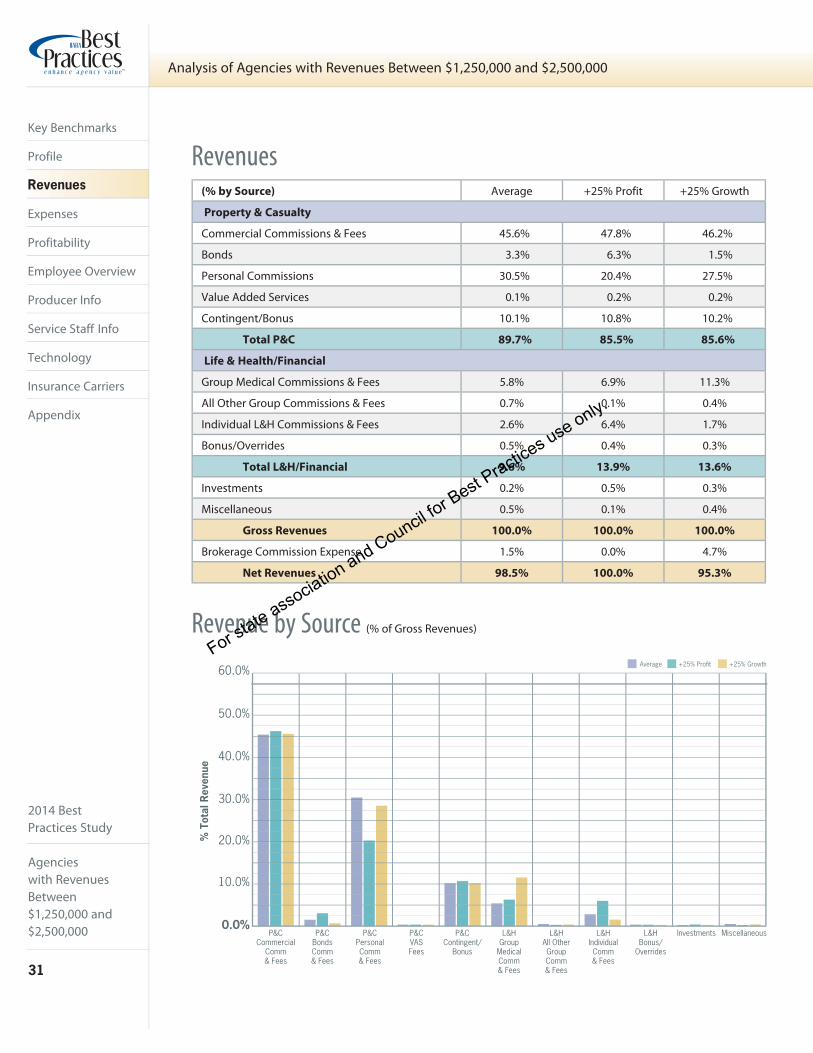
Revenues
Revenue by Source (% of Gross Revenues)
(% by Source) Average +25% Profit +25% Growth
Property & Casualty
Commercial Commissions & Fees 45.6% 47.8% 46.2%
Bonds 3.3% 6.3% 1.5%
Personal Commissions 30.5% 20.4% 27.5%
Value Added Services 0.1% 0.2% 0.2%
Contingent/Bonus 10.1% 10.8% 10.2%
Total P&C 89.7% 85.5% 85.6%
Life & Health/Financial
Group Medical Commissions & Fees 5.8% 6.9% 11.3%
All Other Group Commissions & Fees 0.7% 0.1% 0.4%
Individual L&H Commissions & Fees 2.6% 6.4% 1.7%
Bonus/Overrides 0.5% 0.4% 0.3%
Total L&H/Financial 9.6% 13.9% 13.6%
Investments 0.2% 0.5% 0.3%
Miscellaneous 0.5% 0.1% 0.4%
Gross Revenues 100.0% 100.0% 100.0%
Brokerage Commission Expense 1.5% 0.0% 4.7%
Net Revenues 98.5% 100.0% 95.3%
% T
otal
Rev
enue
10.0%
20.0%
30.0%
40.0%
50.0%
60.0%
0.0%P&C
Contingent/Bonus
P&CVASFees
P&CPersonalComm& Fees
P&CBondsComm& Fees
P&CCommercial
Comm& Fees
L&HGroup
MedicalComm& Fees
L&HAll OtherGroupComm& Fees
L&HIndividualComm& Fees
L&HBonus/
Overrides
Investments Miscellaneous
Average +25% Profit +25% Growth
For state association and Council for Best Practices use only.
2014 BestPractices Study
Agencieswith Revenues
Between $1,250,000 and
$2,500,000
32
Analysis of Agencies with Revenues Between $1,250,000 and $2,500,000
Key Benchmarks
Profile
Revenues
Expenses
Profitability
Employee Overview
Producer Info
Service Staff Info
Technology
Insurance Carriers
Appendix
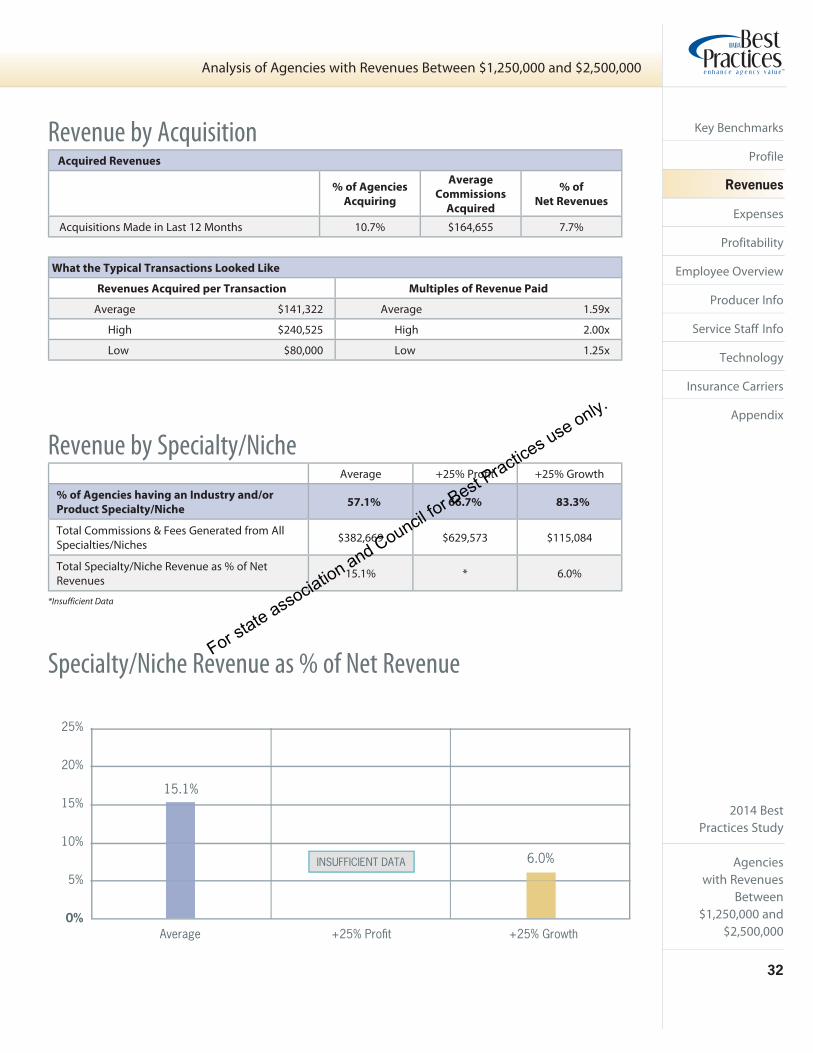
What the Typical Transactions Looked Like
Revenues Acquired per Transaction Multiples of Revenue Paid
Average $141,322 Average 1.59x
High $240,525 High 2.00x
Low $80,000 Low 1.25x
Acquired Revenues
% of Agencies
Acquiring
Average
Commissions
Acquired
% of
Net Revenues
Acquisitions Made in Last 12 Months 10.7% $164,655 7.7%
Revenue by Acquisition
Revenue by Specialty/NicheAverage +25% Profit +25% Growth
% of Agencies having an Industry and/or
Product Specialty/Niche57.1% 66.7% 83.3%
Total Commissions & Fees Generated from All Specialties/Niches $382,669 $629,573 $115,084
Total Specialty/Niche Revenue as % of Net Revenues 15.1% * 6.0%
*Insufficient Data
Specialty/Niche Revenue as % of Net Revenue
Average +25% Profit +25% Growth
5%
10%
15%
20%
25%
15.1%
6.0%
0%
For state association and Council for Best Practices use only.

2014 BestPractices Study
Agencieswith RevenuesBetween $1,250,000 and $2,500,000
33
Analysis of Agencies with Revenues Between $1,250,000 and $2,500,000
Key Benchmarks
Profile
Revenues
Expenses
Profitability
Employee Overview
Producer Info
Service Staff Info
Technology
Insurance Carriers
Appendix
Revenue by Account ConcentrationAverage +25% Profit +25% Growth
% of Revenue Derived from
Largest Account 4.1% 4.2% 6.4%
High 11.8%
Low 1.2%
10 Largest Accounts 14.8% 14.9% 21.2%
High 33.1%
Low 2.9%
Average +25% Profit +25% Growth
“Other” Group Life & Health* Revenue (% from source)
Life 26.4% * 24.3%
Disability 14.7% * 16.0%
Dental & Vision 25.5% * 28.7%
Retirement/Pension 7.8% * 0.0%
Worksite/Voluntary/Supplement 14.7% * 0.0%
Long-Term Care 2.0% * 1.3%
Employee Benefits TPA 9.0% * 29.7%
All Other 0.0% * 0.0%
*Insufficient Data
*Excludes Group Medical
For state association and Council for Best Practices use only.
2014 BestPractices Study
Agencieswith Revenues
Between $1,250,000 and
$2,500,000
34
Analysis of Agencies with Revenues Between $1,250,000 and $2,500,000
Key Benchmarks
Profile
Revenues
Expenses
Profitability
Employee Overview
Producer Info
Service Staff Info
Technology
Insurance Carriers
Appendix
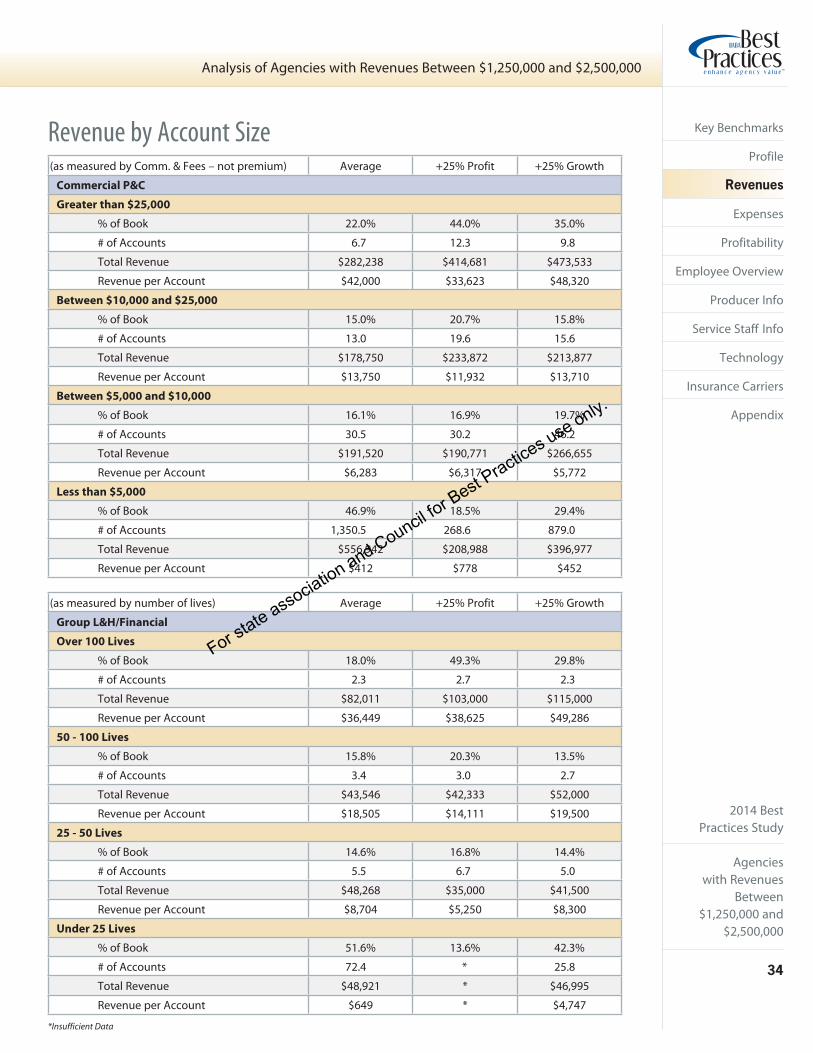
Revenue by Account Size(as measured by Comm. & Fees – not premium) Average +25% Profit +25% Growth
Commercial P&C
Greater than $25,000
% of Book 22.0% 44.0% 35.0%
# of Accounts 6.7 12.3 9.8
Total Revenue $282,238 $414,681 $473,533
Revenue per Account $42,000 $33,623 $48,320
Between $10,000 and $25,000
% of Book 15.0% 20.7% 15.8%
# of Accounts 13.0 19.6 15.6
Total Revenue $178,750 $233,872 $213,877
Revenue per Account $13,750 $11,932 $13,710
Between $5,000 and $10,000
% of Book 16.1% 16.9% 19.7%
# of Accounts 30.5 30.2 46.2
Total Revenue $191,520 $190,771 $266,655
Revenue per Account $6,283 $6,317 $5,772
Less than $5,000
% of Book 46.9% 18.5% 29.4%
# of Accounts 1,350.5 268.6 879.0
Total Revenue $556,942 $208,988 $396,977
Revenue per Account $412 $778 $452
(as measured by number of lives) Average +25% Profit +25% Growth
Group L&H/Financial
Over 100 Lives
% of Book 18.0% 49.3% 29.8%
# of Accounts 2.3 2.7 2.3
Total Revenue $82,011 $103,000 $115,000
Revenue per Account $36,449 $38,625 $49,286
50 - 100 Lives
% of Book 15.8% 20.3% 13.5%
# of Accounts 3.4 3.0 2.7
Total Revenue $43,546 $42,333 $52,000
Revenue per Account $18,505 $14,111 $19,500
25 - 50 Lives
% of Book 14.6% 16.8% 14.4%
# of Accounts 5.5 6.7 5.0
Total Revenue $48,268 $35,000 $41,500
Revenue per Account $8,704 $5,250 $8,300
Under 25 Lives
% of Book 51.6% 13.6% 42.3%
# of Accounts 72.4 * 25.8
Total Revenue $48,921 * $46,995
Revenue per Account $649 * $4,747
*Insufficient Data
For state association and Council for Best Practices use only.

2014 BestPractices Study
Agencieswith RevenuesBetween $1,250,000 and $2,500,000
35
Analysis of Agencies with Revenues Between $1,250,000 and $2,500,000
Key Benchmarks
Profile
Revenues
Expenses
Profitability
Employee Overview
Producer Info
Service Staff Info
Technology
Insurance Carriers
Appendix
Revenue Growth by Source
*Insufficient Data
Average +25% Profit +25% Growth
Commercial P&C
Renewals1 95.2% 95.7% 97.2%
New Business2 13.1% 13.9% 16.8%
Acquired Revenues3 0.6% 0.0% 0.4%
Organic Growth4 8.3% 9.6% 14.0%
Total Growth5 8.9% 9.6% 14.4%
Bonds P&C
Renewals1 68.8% 62.5% 93.3%
New Business2 38.9% 47.2% 34.7%
Acquired Revenues3 0.5% 0.0% 0.0%
Organic Growth4 7.7% 9.7% 28.0%
Total Growth5 8.2% 9.7% 28.0%
Personal P&C
Renewals1 97.6% 97.8% 105.3%
New Business2 9.9% 10.7% 11.1%
Acquired Revenues3 1.8% 0.0% 4.1%
Organic Growth4 7.5% 8.5% 16.4%
Total Growth5 9.3% 8.5% 20.5%
Value Added Services P&C
Renewals1 77.3% * *
New Business2 47.2% * *
Acquired Revenues3 0.0% * *
Organic Growth4 24.5% * *
Total Growth5 24.5% * *
1Renewal Revenues as a % of prior year’s total revenues for this line of business. This figure is impacted by attrition (loss or retention of accounts) and by changes in premium and commission levels. The higher the %, the more favorable the results.
2New Revenues as a % of prior year’s total revenues for this line of business. The higher the %, the more favorable the results.
3Acquired Revenues as a % of prior year’s total revenues for this line of business. The % indicates the significance of acquired business.
4Growth in Revenues from prior year excluding acquired revenues.
5Growth in Revenues from prior year including acquired revenues.
*Insufficient Data
For state association and Council for Best Practices use only.
2014 BestPractices Study
Agencieswith Revenues
Between $1,250,000 and
$2,500,000
36
Analysis of Agencies with Revenues Between $1,250,000 and $2,500,000
Key Benchmarks
Profile
Revenues
Expenses
Profitability
Employee Overview
Producer Info
Service Staff Info
Technology
Insurance Carriers
Appendix
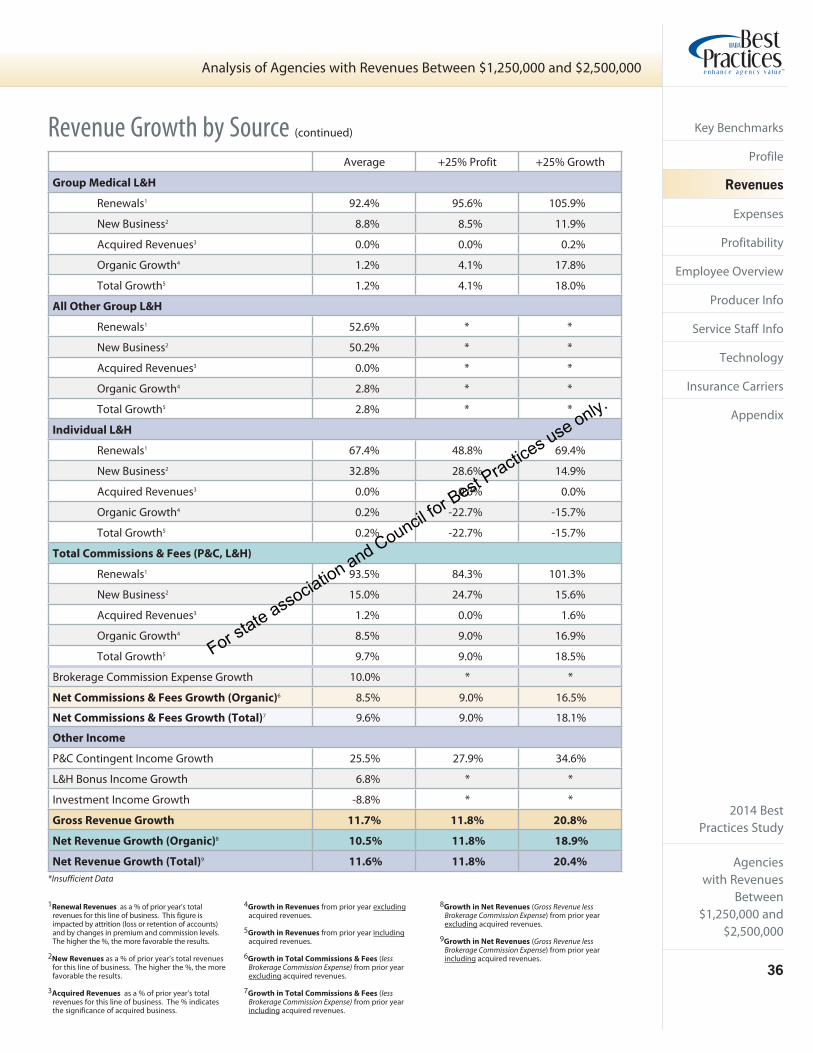
Revenue Growth by Source (continued)
*Insufficient Data
Average +25% Profit +25% Growth
Group Medical L&H
Renewals1 92.4% 95.6% 105.9%
New Business2 8.8% 8.5% 11.9%
Acquired Revenues3 0.0% 0.0% 0.2%
Organic Growth4 1.2% 4.1% 17.8%
Total Growth5 1.2% 4.1% 18.0%
All Other Group L&H
Renewals1 52.6% * *
New Business2 50.2% * *
Acquired Revenues3 0.0% * *
Organic Growth4 2.8% * *
Total Growth5 2.8% * *
Individual L&H
Renewals1 67.4% 48.8% 69.4%
New Business2 32.8% 28.6% 14.9%
Acquired Revenues3 0.0% 0.0% 0.0%
Organic Growth4 0.2% -22.7% -15.7%
Total Growth5 0.2% -22.7% -15.7%
Total Commissions & Fees (P&C, L&H)
Renewals1 93.5% 84.3% 101.3%
New Business2 15.0% 24.7% 15.6%
Acquired Revenues3 1.2% 0.0% 1.6%
Organic Growth4 8.5% 9.0% 16.9%
Total Growth5 9.7% 9.0% 18.5%
Brokerage Commission Expense Growth 10.0% * *
Net Commissions & Fees Growth (Organic)6 8.5% 9.0% 16.5%
Net Commissions & Fees Growth (Total)7 9.6% 9.0% 18.1%
Other Income
P&C Contingent Income Growth 25.5% 27.9% 34.6%
L&H Bonus Income Growth 6.8% * *
Investment Income Growth -8.8% * *
Gross Revenue Growth 11.7% 11.8% 20.8%
Net Revenue Growth (Organic)8 10.5% 11.8% 18.9%
Net Revenue Growth (Total)9 11.6% 11.8% 20.4%
1Renewal Revenues as a % of prior year’s total revenues for this line of business. This figure is impacted by attrition (loss or retention of accounts) and by changes in premium and commission levels. The higher the %, the more favorable the results.
2New Revenues as a % of prior year’s total revenues for this line of business. The higher the %, the more favorable the results.
3Acquired Revenues as a % of prior year’s total revenues for this line of business. The % indicates the significance of acquired business.
4Growth in Revenues from prior year excluding acquired revenues.
5Growth in Revenues from prior year including acquired revenues.
6Growth in Total Commissions & Fees (less Brokerage Commission Expense) from prior year excluding acquired revenues.
7Growth in Total Commissions & Fees (less Brokerage Commission Expense) from prior year including acquired revenues.
8Growth in Net Revenues (Gross Revenue less Brokerage Commission Expense) from prior year excluding acquired revenues.
9Growth in Net Revenues (Gross Revenue less Brokerage Commission Expense) from prior year including acquired revenues.
For state association and Council for Best Practices use only.
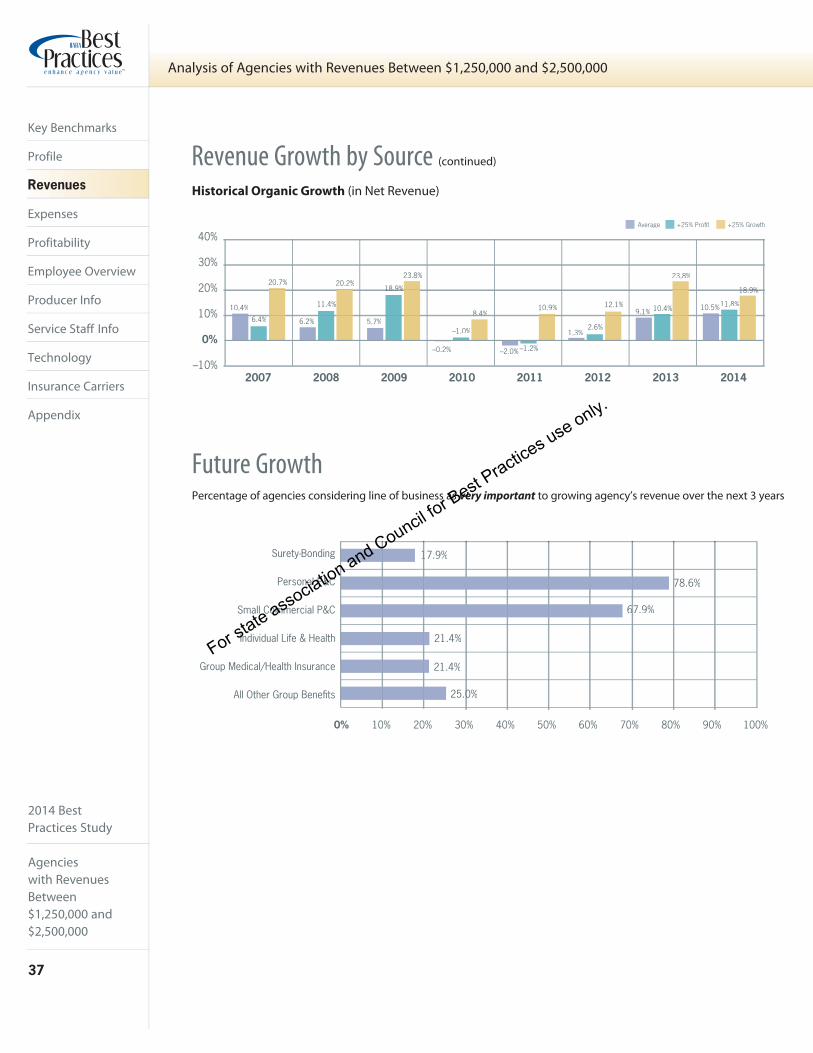
2014 BestPractices Study
Agencieswith RevenuesBetween $1,250,000 and $2,500,000
37
Analysis of Agencies with Revenues Between $1,250,000 and $2,500,000
Key Benchmarks
Profile
Revenues
Expenses
Profitability
Employee Overview
Producer Info
Service Staff Info
Technology
Insurance Carriers
Appendix
Revenue Growth by Source (continued)
Historical Organic Growth (in Net Revenue)
Future GrowthPercentage of agencies considering line of business as very important to growing agency’s revenue over the next 3 years
Surety-Bonding 17.9%1
Personal P&C 78.6%
67.9%6Small Commercial P&C
Individual Life & Health 21.4%
Group Medical/Health Insurance 21.4%
25.0%0All Other Group Benefits
0% 10% 20% 30% 40% 50% 60% 70% 80% 90% 100%
2007 2008 2009 2010 2011 2012 2013 2014
10%
–10%
20%
30%
40%
10.4%
6.4%
20.7%
6.2%
11.4%
20.2%
5.7%
18.9%18 9%
23.8%
–0.2%
–1.0%
8.4%8.4%
–2.0% –1.2%
10.9%
1.3%2.6%
12.1%9.1% 10.4%
23.8%
10.5%11.8%
18.9%18 9%
0%
Average +25% Profit +25% Growth
For state association and Council for Best Practices use only.

2014 BestPractices Study
Agencieswith Revenues
Between $1,250,000 and
$2,500,000
38
Analysis of Agencies with Revenues Between $1,250,000 and $2,500,000
Key Benchmarks
Profile
Revenues
Expenses
Profitability
Employee Overview
Producer Info
Service Staff Info
Technology
Insurance Carriers
Appendix
Expenses (as % of Net Revenues)
Average +25% Profit +25% Growth
Compensation Expenses
Payroll: Employee 43.9% 32.5% 34.0%
Payroll: “Non-Employee” - 1099 Producers/Temp Help 2.9% 3.0% 5.4%
Total Payroll 46.8% 35.5% 39.4%
Benefits: Payroll Taxes 3.5% 3.2% 4.0%
Benefits: Retirement 1.5% 0.5% 0.3%
Benefits: Insurance 3.1% 2.5% 3.6%
Benefits: Other 0.4% 0.2% 0.4%
Total Benefits 8.5% 6.3% 8.4%
Total Compensation 55.3% 41.7% 47.8%
Selling Expenses
T&E/Conventions 1.4% 2.1% 1.2%
Auto Expenditures 1.0% 1.3% 0.6%
Auto Depreciation 0.2% 0.2% 0.1%
Total Auto 1.2% 1.5% 0.7%
Advertising/Promotions 1.6% 1.2% 1.7%
Total Selling 4.2% 4.7% 3.7%
Operating Expenses
Occupancy Expenditures 5.3% 6.0% 6.0%
Occupancy Depreciation/Amortization 0.1% 0.0% 0.0%
Total Occupancy 5.4% 6.0% 6.1%
Office Equipment Expenditures 0.4% 0.9% 0.4%
Office Equipment Depreciation 0.5% 0.2% 1.2%
Total Office Equipment 0.9% 1.1% 1.6%
IT (Information Technology) 2.3% 1.5% 1.7%
IT Depreciation/Amortization 0.2% 0.0% 0.1%
Total IT 2.4% 1.5% 1.8%
Telephone 0.9% 0.6% 0.7%
Postage 0.4% 0.4% 0.3%
Supplies/Printing 1.1% 1.7% 1.6%
Dues/Subscriptions/Contributions 0.8% 0.6% 0.6%
Taxes/Licenses 0.4% 0.4% 0.4%
Insurance 1.4% 1.1% 1.0%
Professional Fees 0.9% 1.7% 1.8%
Bad Debts 0.1% 0.4% 0.5%
Outside Services 0.5% 0.1% 0.6%
Education/Training 0.5% 0.4% 0.4%
Miscellaneous 0.4% 0.1% 0.5%
Total Operating 16.1% 16.1% 17.8%
continued on next page
For state association and Council for Best Practices use only.

2014 BestPractices Study
Agencieswith RevenuesBetween $1,250,000 and $2,500,000
39
Analysis of Agencies with Revenues Between $1,250,000 and $2,500,000
Key Benchmarks
Profile
Revenues
Expenses
Profitability
Employee Overview
Producer Info
Service Staff Info
Technology
Insurance Carriers
Appendix
Average +25% Profit +25% Growth
Administrative Expenses
Amortization of Intangibles 0.8% 0.1% 2.7%
Officer Life 0.2% 0.1% 0.0%
Interest 0.4% 0.2% 0.5%
Other 0.0% 0.1% 0.0%
Total Administrative 1.4% 0.5% 3.2%
Total Expenses 77.0% 63.0% 72.5%
Pre-Tax Profit (Loss) 23.0% 37.0% 27.5%
EBITDA 25.1% 37.7% 32.1%
Average +25% Profit +25% Growth
Expense Growth Over Prior Year
Compensation Expense 8.4% 4.7% 10.0%
Selling Expense 9.3% 13.9% 8.8%
Operating Expense 10.3% 30.0% 30.0%
Administrative Expense -12.2% * -7.8%
Expenses (as % of Net Revenues) — continued
Expenses (as % of Net Revenues)
*Insufficient Data
Compensation Selling Operating Administrative0%
10%
20%
30%
40%
50%
60%Average +25% Profit +25% Growth
4.2%4.2% 4.7% 3.7%3 7%
16.1%16 1% 16.1%16 1% 17.8%17.8%
1.4%1 4% 0.5%0 %3.2%
55.3%55 3%
47.8%47 8%
41.7%41 7%
For state association and Council for Best Practices use only.

2014 BestPractices Study
Agencieswith Revenues
Between $1,250,000 and
$2,500,000
40
Analysis of Agencies with Revenues Between $1,250,000 and $2,500,000
Key Benchmarks
Profile
Revenues
Expenses
Profitability
Employee Overview
Producer Info
Service Staff Info
Technology
Insurance Carriers
Appendix
Average +25% Profit +25% Growth
Revenues (as % of Gross Revenue)
Commercial Lines 45.6% 47.8% 46.2%
Bonds 3.3% 6.3% 1.5%
Personal Lines 30.5% 20.4% 27.5%
VAS - P&C 0.1% 0.2% 0.2%
Contingent/Bonus 10.1% 10.8% 10.2%
Group Medical 5.8% 6.9% 11.3%
All Other Group 0.7% 0.1% 0.4%
Individual Life & Health 2.6% 6.4% 1.7%
Bonus/Overrides 0.5% 0.4% 0.3%
Investments 0.2% 0.5% 0.3%
Miscellaneous 0.5% 0.1% 0.4%
Total Revenues 100.0% 100.0% 100.0%
Brokerage Commission Expense 1.5% 0.0% 4.7%
Net Revenues 98.5% 100.0% 95.3%
Expenses (as % of Net Revenues)
Compensation 55.3% 41.7% 47.8%
Selling 4.2% 4.7% 3.7%
Operating 16.1% 16.1% 17.8%
Administrative 1.4% 0.5% 3.2%
Total Expenses 77.0% 63.0% 72.5%
Average +25% Profit +25% Growth
Pre-Tax Profit 23.0% 37.0% 27.5%
Pro Forma Pre-Tax Profit1 28.5% 41.9% 33.1%
Operating Pre-Tax Profit2 13.3% 28.4% 18.0%
EBITDA3 25.1% 37.7% 32.1%
Pro Forma EBITDA4 30.6% 42.6% 37.7%
1Pre-tax Profits if discretionary expenses are eliminated and all owners compensated as employees
2Pre-tax Profits excluding contingents, bonus and investment income
3EBITDA—Earnings Before Interest Taxes Depreciation and Amortization
4EBITDA if discretionary expenses are eliminated and all owners compensated as employees
Profit/Loss Summary
Profit/Loss (as % of Net Revenues)
For state association and Council for Best Practices use only.

2014 BestPractices Study
Agencieswith RevenuesBetween $1,250,000 and $2,500,000
41
Analysis of Agencies with Revenues Between $1,250,000 and $2,500,000
Key Benchmarks
Profile
Revenues
Expenses
Profitability
Employee Overview
Producer Info
Service Staff Info
Technology
Insurance Carriers
Appendix
Profitability
About EBITDA Margin and Operating Margin
EBITDA Margin is calculated by dividing a firm’s EBITDA (Earnings Before Interest, Taxes, Depreciation and Amortization) by the firm’s net revenues.
Pro Forma EBITDA Margin is calculated by dividing a firm’s Pro Forma EBITDA by the firm’s Pro Forma net revenue.
Operating Margin is calculated as EBITDA less contingent income divided by Pro Forma net revenues less contingent income.
Historical EBITDA Margin & Operating Margin (for Average Group)
5%
10%
15%
20%
25%
30%
35%
0%2008
EBITDA Margin Operating Margin
23.2%23 2%
30.1%
26.7%%
34.0%
7.8%
23.5%23.5%
6.4%6 4%
27.7%27.7%
7.4%
23.4%
8.0%
23.0%23.0%
9.2%12.2%12 2%
24.6%25.1%
30.6%
12.8%12 8% 13.3%13.3%
20102007 2009 2011 2012 2013 2014
Pro Forma EBITDA
23.3%
29.3%27.0%27.0% 27.4%27.4%
31.1%
For state association and Council for Best Practices use only.
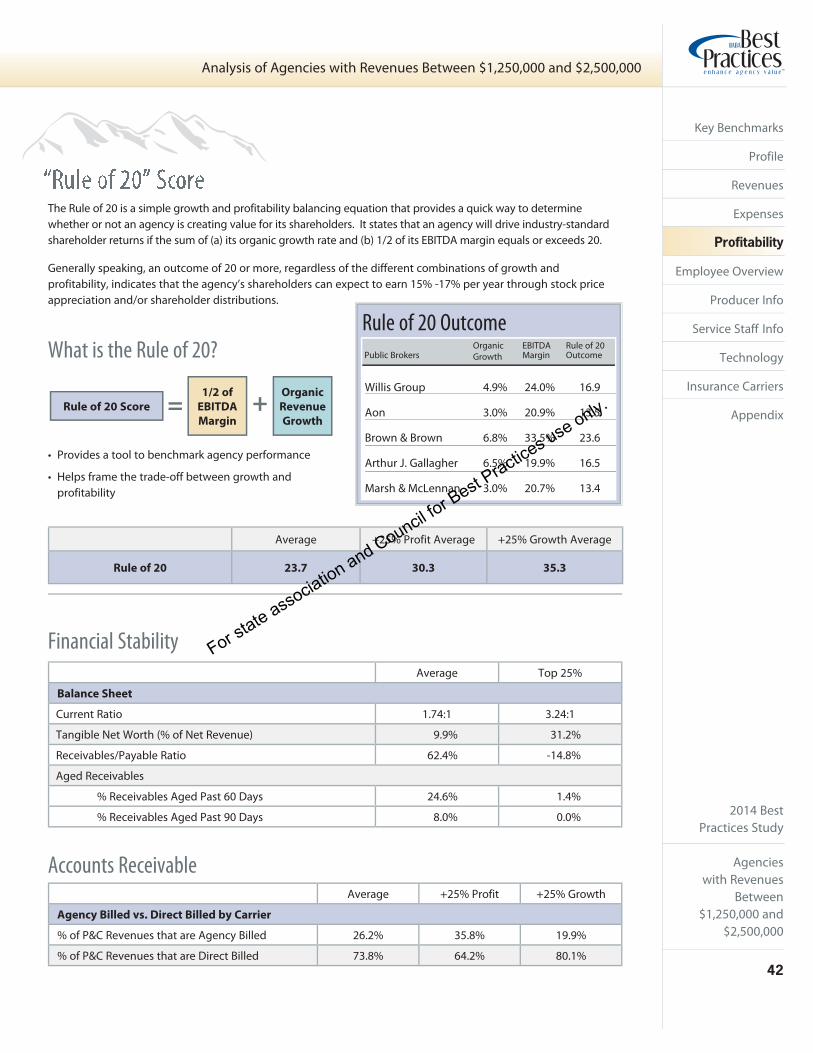
2014 BestPractices Study
Agencieswith Revenues
Between $1,250,000 and
$2,500,000
42
Analysis of Agencies with Revenues Between $1,250,000 and $2,500,000
Key Benchmarks
Profile
Revenues
Expenses
Profitability
Employee Overview
Producer Info
Service Staff Info
Technology
Insurance Carriers
Appendix
Average Top 25%
Balance Sheet
Current Ratio 1.74:1 3.24:1
Tangible Net Worth (% of Net Revenue) 9.9% 31.2%
Receivables/Payable Ratio 62.4% -14.8%
Aged Receivables
% Receivables Aged Past 60 Days 24.6% 1.4%
% Receivables Aged Past 90 Days 8.0% 0.0%
Average +25% Profit +25% Growth
Agency Billed vs. Direct Billed by Carrier
% of P&C Revenues that are Agency Billed 26.2% 35.8% 19.9%
% of P&C Revenues that are Direct Billed 73.8% 64.2% 80.1%
Financial Stability
Accounts Receivable
The Rule of 20 is a simple growth and profitability balancing equation that provides a quick way to determine whether or not an agency is creating value for its shareholders. It states that an agency will drive industry-standard shareholder returns if the sum of (a) its organic growth rate and (b) 1/2 of its EBITDA margin equals or exceeds 20.
Generally speaking, an outcome of 20 or more, regardless of the different combinations of growth and profitability, indicates that the agency’s shareholders can expect to earn 15% -17% per year through stock price appreciation and/or shareholder distributions.
• Provides a tool to benchmark agency performance
• Helps frame the trade-off between growth and profitability
What is the Rule of 20?
Average +25% Profit Average +25% Growth Average
Rule of 20 23.7 30.3 35.3
Public BrokersOrganicGrowth
EBITDA Margin
Rule of 20 Outcome
Willis Group 4.9% 24.0% 16.9
Aon 3.0% 20.9% 13.5
Brown & Brown 6.8% 33.5% 23.6
Arthur J. Gallagher 6.5% 19.9% 16.5
Marsh & McLennan 3.0% 20.7% 13.4
Rule of 20 Outcome
Organic
Revenue
Growth
1/2 of
EBITDA
Margin
Rule of 20 Score +=
For state association and Council for Best Practices use only.
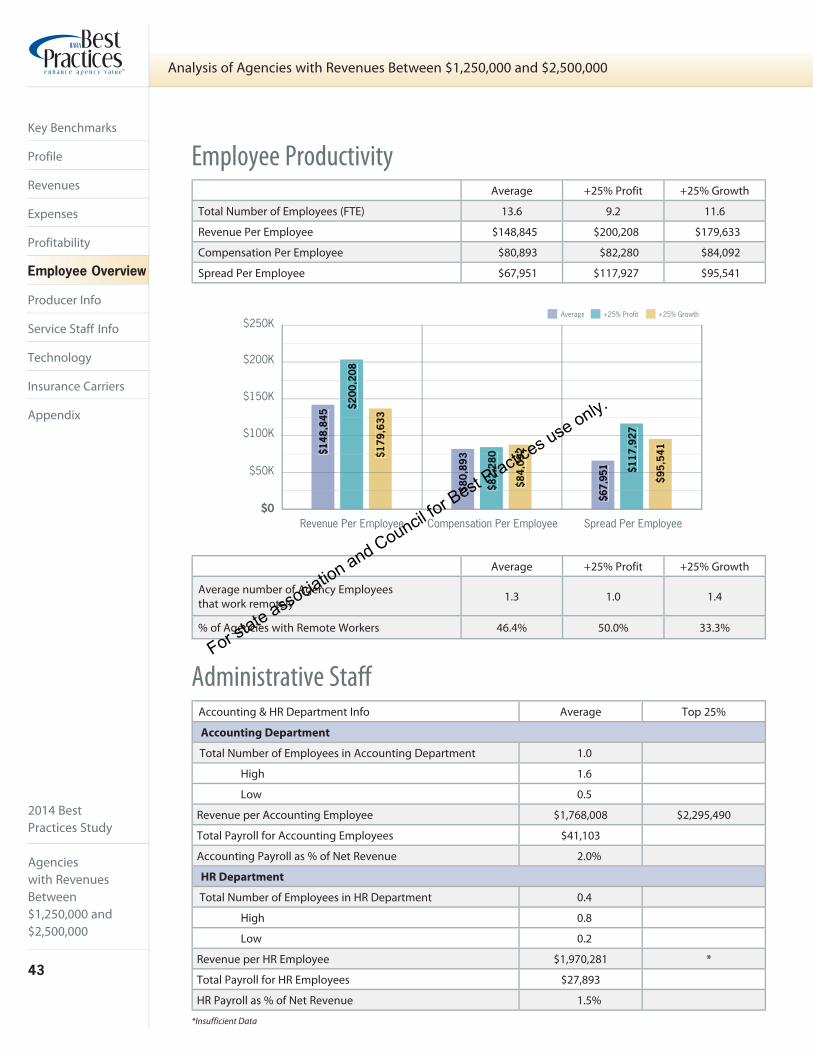
2014 BestPractices Study
Agencieswith RevenuesBetween $1,250,000 and $2,500,000
43
Analysis of Agencies with Revenues Between $1,250,000 and $2,500,000
Key Benchmarks
Profile
Revenues
Expenses
Profitability
Employee Overview
Producer Info
Service Staff Info
Technology
Insurance Carriers
Appendix
Average +25% Profit +25% Growth
Total Number of Employees (FTE) 13.6 9.2 11.6
Revenue Per Employee $148,845 $200,208 $179,633
Compensation Per Employee $80,893 $82,280 $84,092
Spread Per Employee $67,951 $117,927 $95,541
Average +25% Profit +25% Growth
Average number of Agency Employees that work remotely 1.3 1.0 1.4
% of Agencies with Remote Workers 46.4% 50.0% 33.3%
Employee Productivity
Administrative Staff Accounting & HR Department Info Average Top 25%
Accounting Department
Total Number of Employees in Accounting Department 1.0
High 1.6
Low 0.5
Revenue per Accounting Employee $1,768,008 $2,295,490
Total Payroll for Accounting Employees $41,103
Accounting Payroll as % of Net Revenue 2.0%
HR Department
Total Number of Employees in HR Department 0.4
High 0.8
Low 0.2
Revenue per HR Employee $1,970,281 *
Total Payroll for HR Employees $27,893
HR Payroll as % of Net Revenue 1.5%
*Insufficient Data
Revenue Per Employee Compensation Per Employee Spread Per Employee$0
$50K
$100K
$150K
$200K
$250K$1
48,8
458
4$
$200
,208
22
$179
,633
93
$
$80,
893
,3
$ $82,
2800
$84,
092
49
$67,
9515
6
$117
,9272
$
$95,
541
94
Average +25% Profit +25% Growth
For state association and Council for Best Practices use only.
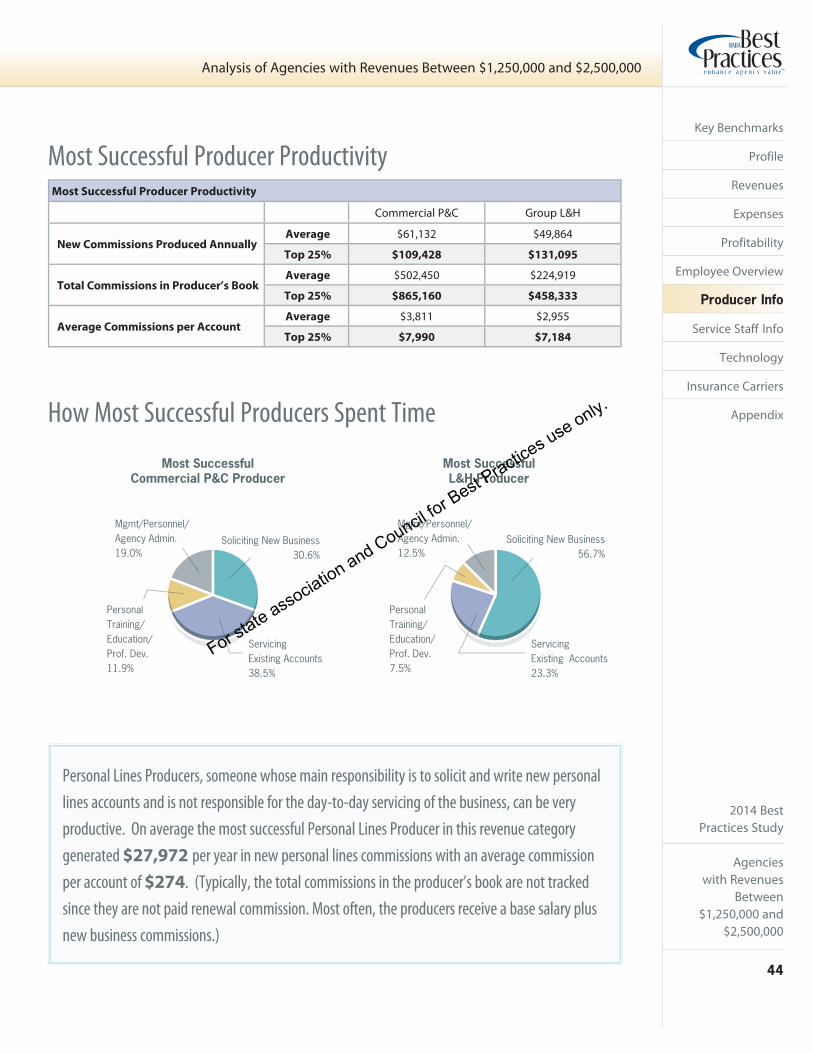
2014 BestPractices Study
Agencieswith Revenues
Between $1,250,000 and
$2,500,000
44
Analysis of Agencies with Revenues Between $1,250,000 and $2,500,000
Key Benchmarks
Profile
Revenues
Expenses
Profitability
Employee Overview
Producer Info
Service Staff Info
Technology
Insurance Carriers
Appendix
Most Successful Producer Productivity
Commercial P&C Group L&H
New Commissions Produced Annually Average $61,132 $49,864
Top 25% $109,428 $131,095
Total Commissions in Producer’s Book Average $502,450 $224,919
Top 25% $865,160 $458,333
Average Commissions per Account Average $3,811 $2,955
Top 25% $7,990 $7,184
Most Successful Producer Productivity
How Most Successful Producers Spent Time
Personal Lines Producers, someone whose main responsibility is to solicit and write new personal lines accounts and is not responsible for the day-to-day servicing of the business, can be very productive. On average the most successful Personal Lines Producer in this revenue category generated $27,972 per year in new personal lines commissions with an average commission per account of $274. (Typically, the total commissions in the producer’s book are not tracked since they are not paid renewal commission. Most often, the producers receive a base salary plus new business commissions.)
Most SuccessfulCommercial P&C Producer
Most SuccessfulL&H Producer
PersonalTraining/Education/Prof. Dev.11.9%
Soliciting New Business30.6%
Mgmt/Personnel/Agency Admin.19.0%
ServicingExisting Accounts38.5%
PersonalTraining/Education/Prof. Dev.7.5%
Soliciting New Business56.7%
Mgmt/Personnel/Agency Admin.12.5%
ServicingExisting Accounts23.3%
For state association and Council for Best Practices use only.
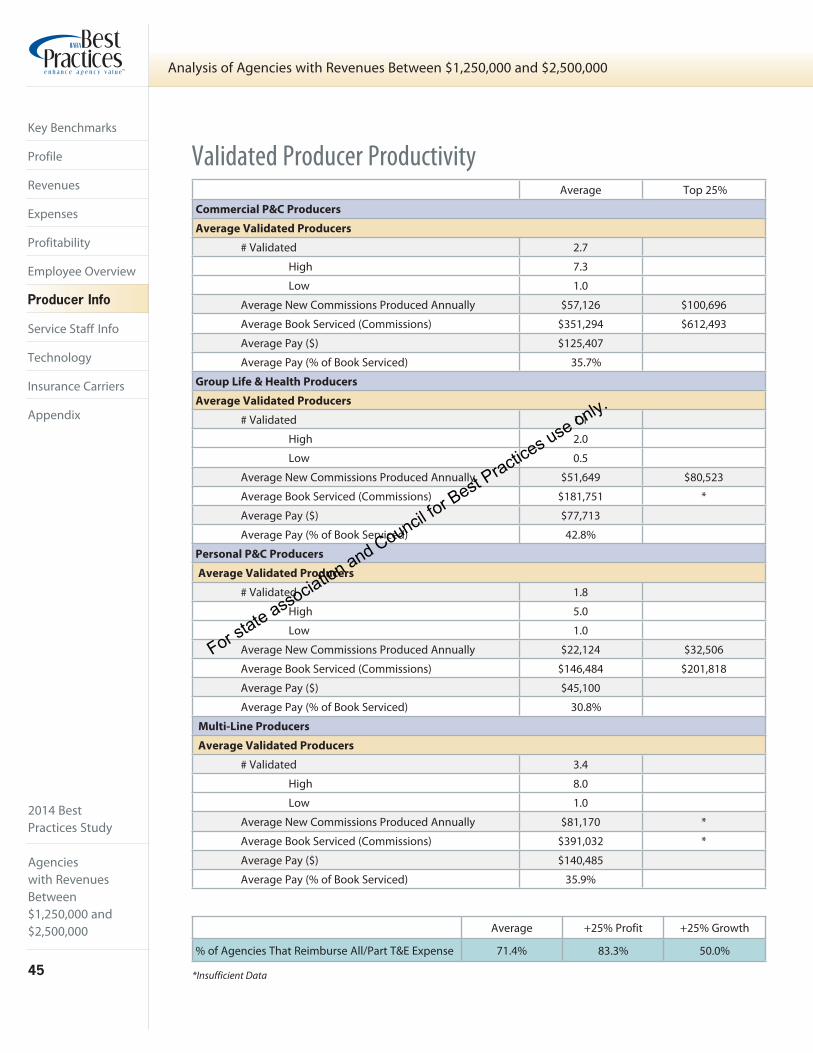
2014 BestPractices Study
Agencieswith RevenuesBetween $1,250,000 and $2,500,000
45
Analysis of Agencies with Revenues Between $1,250,000 and $2,500,000
Key Benchmarks
Profile
Revenues
Expenses
Profitability
Employee Overview
Producer Info
Service Staff Info
Technology
Insurance Carriers
Appendix
Average Top 25%
Commercial P&C Producers
Average Validated Producers
# Validated 2.7
High 7.3
Low 1.0
Average New Commissions Produced Annually $57,126 $100,696
Average Book Serviced (Commissions) $351,294 $612,493
Average Pay ($) $125,407
Average Pay (% of Book Serviced) 35.7%
Group Life & Health Producers
Average Validated Producers
# Validated 1.1
High 2.0
Low 0.5
Average New Commissions Produced Annually $51,649 $80,523
Average Book Serviced (Commissions) $181,751 *
Average Pay ($) $77,713
Average Pay (% of Book Serviced) 42.8%
Personal P&C Producers
Average Validated Producers
# Validated 1.8
High 5.0
Low 1.0
Average New Commissions Produced Annually $22,124 $32,506
Average Book Serviced (Commissions) $146,484 $201,818
Average Pay ($) $45,100
Average Pay (% of Book Serviced) 30.8%
Multi-Line Producers
Average Validated Producers
# Validated 3.4
High 8.0
Low 1.0
Average New Commissions Produced Annually $81,170 *
Average Book Serviced (Commissions) $391,032 *
Average Pay ($) $140,485
Average Pay (% of Book Serviced) 35.9%
Validated Producer Productivity
Average +25% Profit +25% Growth
% of Agencies That Reimburse All/Part T&E Expense 71.4% 83.3% 50.0%
*Insufficient Data
For state association and Council for Best Practices use only.
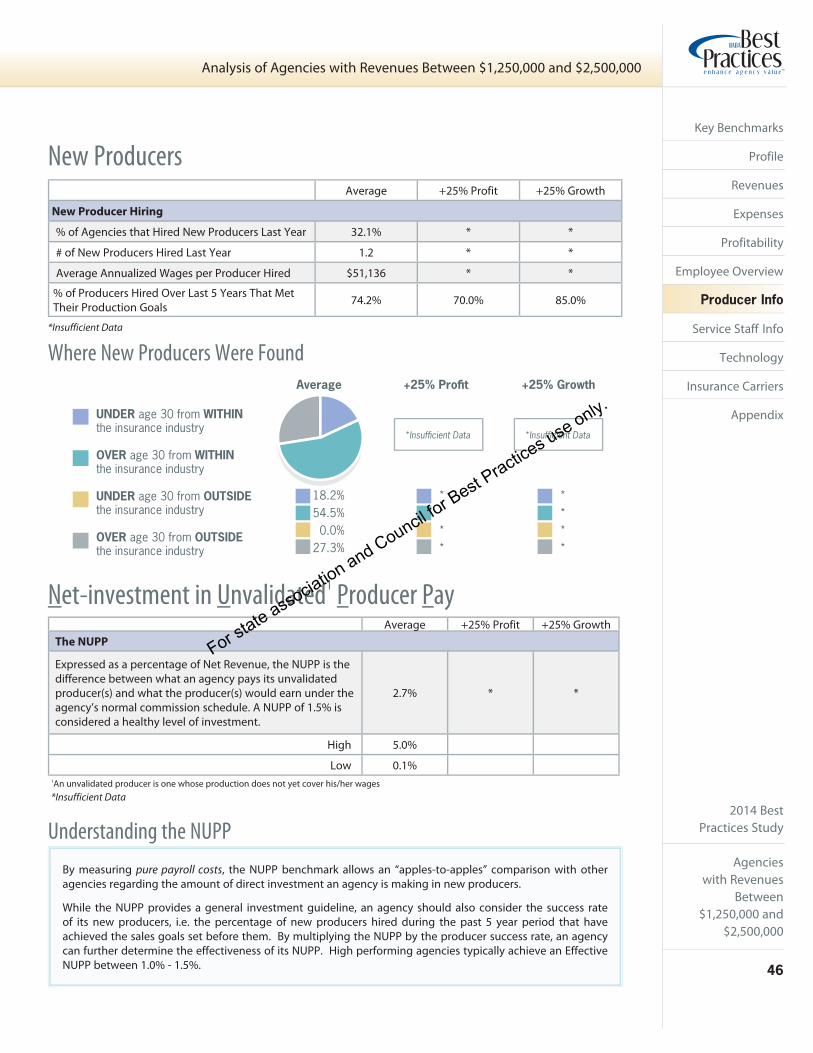
2014 BestPractices Study
Agencieswith Revenues
Between $1,250,000 and
$2,500,000
46
Analysis of Agencies with Revenues Between $1,250,000 and $2,500,000
Key Benchmarks
Profile
Revenues
Expenses
Profitability
Employee Overview
Producer Info
Service Staff Info
Technology
Insurance Carriers
Appendix
Where New Producers Were Found
Average +25% Profit +25% Growth
New Producer Hiring
% of Agencies that Hired New Producers Last Year 32.1% * *
# of New Producers Hired Last Year 1.2 * *
Average Annualized Wages per Producer Hired $51,136 * *
% of Producers Hired Over Last 5 Years That Met Their Production Goals 74.2% 70.0% 85.0%
New Producers
*Insufficient Data
Average +25% Profit +25% GrowthThe NUPP
Expressed as a percentage of Net Revenue, the NUPP is the difference between what an agency pays its unvalidated producer(s) and what the producer(s) would earn under the agency’s normal commission schedule. A NUPP of 1.5% is considered a healthy level of investment.
2.7% * *
High 5.0%
Low 0.1%
By measuring pure payroll costs, the NUPP benchmark allows an “apples-to-apples” comparison with other agencies regarding the amount of direct investment an agency is making in new producers.
While the NUPP provides a general investment guideline, an agency should also consider the success rate of its new producers, i.e. the percentage of new producers hired during the past 5 year period that have achieved the sales goals set before them. By multiplying the NUPP by the producer success rate, an agency can further determine the effectiveness of its NUPP. High performing agencies typically achieve an Effective NUPP between 1.0% - 1.5%.
1An unvalidated producer is one whose production does not yet cover his/her wages
Net-investment in Unvalidated1 Producer Pay
Understanding the NUPP
*Insufficient Data
UNDER age 30 from WITHINthe insurance industry
OVER age 30 from WITHINthe insurance industry
UNDER age 30 from OUTSIDEthe insurance industry
OVER age 30 from OUTSIDEthe insurance industry
+25% ProfitAverage +25% Growth
18.2%54.5%0.0%
27.3%
****
****
*Insufficient Data *Insufficient Data
For state association and Council for Best Practices use only.

2014 BestPractices Study
Agencieswith RevenuesBetween $1,250,000 and $2,500,000
47
Analysis of Agencies with Revenues Between $1,250,000 and $2,500,000
Key Benchmarks
Profile
Revenues
Expenses
Profitability
Employee Overview
Producer Info
Service Staff Info
Technology
Insurance Carriers
Appendix
Average +25% Profit +25% Growth
Total # of Service Staff
(as defined above; excludes any TPA service staff) 7.0 5.1 6.0
% of Peer Agencies Having
Separate/Dedicated Marketing Department 28.6% 0.0% 33.3%
# of Marketing Staff 0.9 0.0 1.0
Separate/Dedicated Claims Department 10.7% 0.0% 0.0%
# of Claims Staff 1.0 0.0 0.0
Average +25% Profit +25% Growth
% of Peer Agencies Having
Workers Comp TPA 0.0% 0.0% 0.0%
# of Service Staff * * *
Total TPA Revenues Serviced * * *
Group Benefits TPA 0.0% 0.0% 0.0%
# of Service Staff * * *
Total TPA Revenues Serviced * * *
TPA Service Staff
Service & Sales Support Staff Definition• Typically non-commissioned employees• Provide service to the agency’s clients• Support producers in the sale of new business and retention of existing business
Some service positions may earn commission income but typically a majority of their pay is fixed and a majority of their time is devoted to service rather than the soliciting of new clients.
Service & Sales Support Positions1 Included in Full-time Equivalent Headcounts• Account Executives (AE) - senior level service representatives• Account Managers, Customer Service Representatives (CSRs)• Assistant CSRs, Processors• Claims Staff• Placers/Marketers• Department Managers - who also service clients1Position titles are general categories since specific job titles vary from agency to agency
Administrative personnel such as accounting, mail room, and reception are not included in service benchmarks unless a portion of their time is dedicated to service.
*Insufficient Data
Service Staff Overview
Service Staff Productivity
For state association and Council for Best Practices use only.
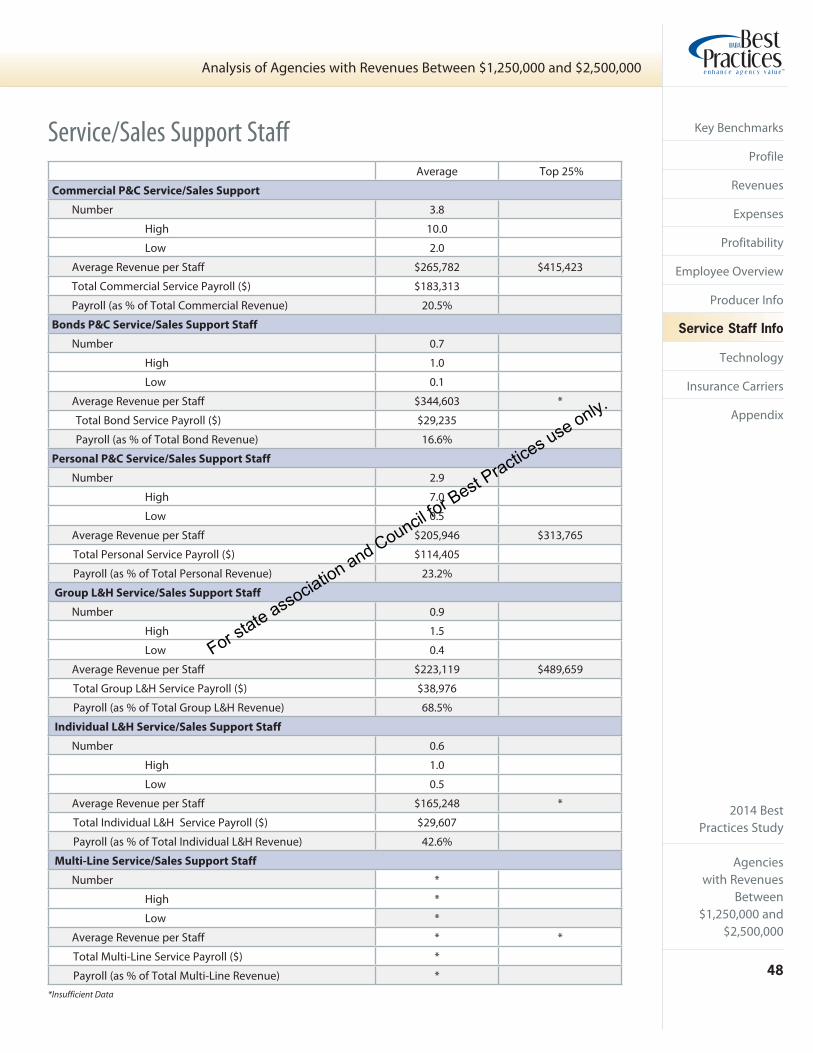
2014 BestPractices Study
Agencieswith Revenues
Between $1,250,000 and
$2,500,000
48
Analysis of Agencies with Revenues Between $1,250,000 and $2,500,000
Key Benchmarks
Profile
Revenues
Expenses
Profitability
Employee Overview
Producer Info
Service Staff Info
Technology
Insurance Carriers
Appendix
Service/Sales Support Staff
Average Top 25%
Commercial P&C Service/Sales Support
Number 3.8
High 10.0
Low 2.0
Average Revenue per Staff $265,782 $415,423
Total Commercial Service Payroll ($) $183,313
Payroll (as % of Total Commercial Revenue) 20.5%
Bonds P&C Service/Sales Support Staff
Number 0.7
High 1.0
Low 0.1
Average Revenue per Staff $344,603 *
Total Bond Service Payroll ($) $29,235
Payroll (as % of Total Bond Revenue) 16.6%
Personal P&C Service/Sales Support Staff
Number 2.9
High 7.0
Low 0.5
Average Revenue per Staff $205,946 $313,765
Total Personal Service Payroll ($) $114,405
Payroll (as % of Total Personal Revenue) 23.2%
Group L&H Service/Sales Support Staff
Number 0.9
High 1.5
Low 0.4
Average Revenue per Staff $223,119 $489,659
Total Group L&H Service Payroll ($) $38,976
Payroll (as % of Total Group L&H Revenue) 68.5%
Individual L&H Service/Sales Support Staff
Number 0.6
High 1.0
Low 0.5
Average Revenue per Staff $165,248 *
Total Individual L&H Service Payroll ($) $29,607
Payroll (as % of Total Individual L&H Revenue) 42.6%
Multi-Line Service/Sales Support Staff
Number *
High *
Low *
Average Revenue per Staff * *
Total Multi-Line Service Payroll ($) *
Payroll (as % of Total Multi-Line Revenue) **Insufficient Data
For state association and Council for Best Practices use only.

2014 BestPractices Study
Agencieswith RevenuesBetween $1,250,000 and $2,500,000
49
Analysis of Agencies with Revenues Between $1,250,000 and $2,500,000
Key Benchmarks
Profile
Revenues
Expenses
Profitability
Employee Overview
Producer Info
Service Staff Info
Technology
Insurance Carriers
Appendix
Service Staff Payroll InformationAverage +25% Profit +25% Growth
Pay Ranges by Service Position
AE
Average Low $40,864 $37,641 $45,000Average High $66,488 $66,500 $71,000
CSR
Average Low $40,721 $41,500 $38,255Average High $54,239 $46,500 $53,691
Processor/Asst CSR
Average Low $26,673 * *Average High $28,062 * *
Marketing
Average Low $39,390 * *Average High $39,390 * *
Claims
Average Low * * *Average High * * *
AE
Average Low $32,506 * *Average High $42,007 * *
CSR
Average Low $37,836 $35,875 $41,543Average High $45,607 $37,750 $46,987
Processor/Asst CSR
Average Low $24,411 * *Average High $27,660 * *
Marketing
Average Low * * *Average High * * *
Claims
Average Low * * *Average High * * *
AE
Average Low $59,285 * *Average High $59,285 * *
CSR
Average Low $32,896 * *Average High $33,030 * *
Processor/Asst CSR
Average Low * * *Average High * * *
Marketing
Average Low * * *Average High * * *
Claims
Average Low * * *Average High * * *
CO
MM
ER
CIA
L L
INE
SP
ER
SO
NA
L L
INE
SG
RO
UP
LIF
E &
HE
AL
TH
/FIN
AN
CIA
L
*Insufficient Data
For state association and Council for Best Practices use only.

2014 BestPractices Study
Agencieswith Revenues
Between $1,250,000 and
$2,500,000
50
Analysis of Agencies with Revenues Between $1,250,000 and $2,500,000
Key Benchmarks
Profile
Revenues
Expenses
Profitability
Employee Overview
Producer Info
Service Staff Info
Technology
Insurance Carriers
Appendix
Average Top 25%
Information Technology Employees (FTE)
Number 0.7
High 1.5
Low 0.1
Number of IT Employees per 100 users N/A
Revenue per IT Employee $1,775,631 $2,370,011
Total IT Payroll Expense ($) $31,541 $54,714
As % of Total Compensation Expense 3.3%
As % of Net Revenues 1.8%
1 Includes hardware/software leasing including offsite applications, supplies, maintenance & maintenance contracts, training, data lines, internet providers, website development/maintenance, outside consulting fees, computer depreciation, software amortization, and any non-depreciated hardware/software.
Technology
Agency Management System Utilized
Average +25% Profit +25% Growth
Total IT Expenses1 (as % of net revenues) 2.9% 2.5% 2.5%
TAM57.1%
AMS36032.1%
EPIC10.7%
For state association and Council for Best Practices use only.
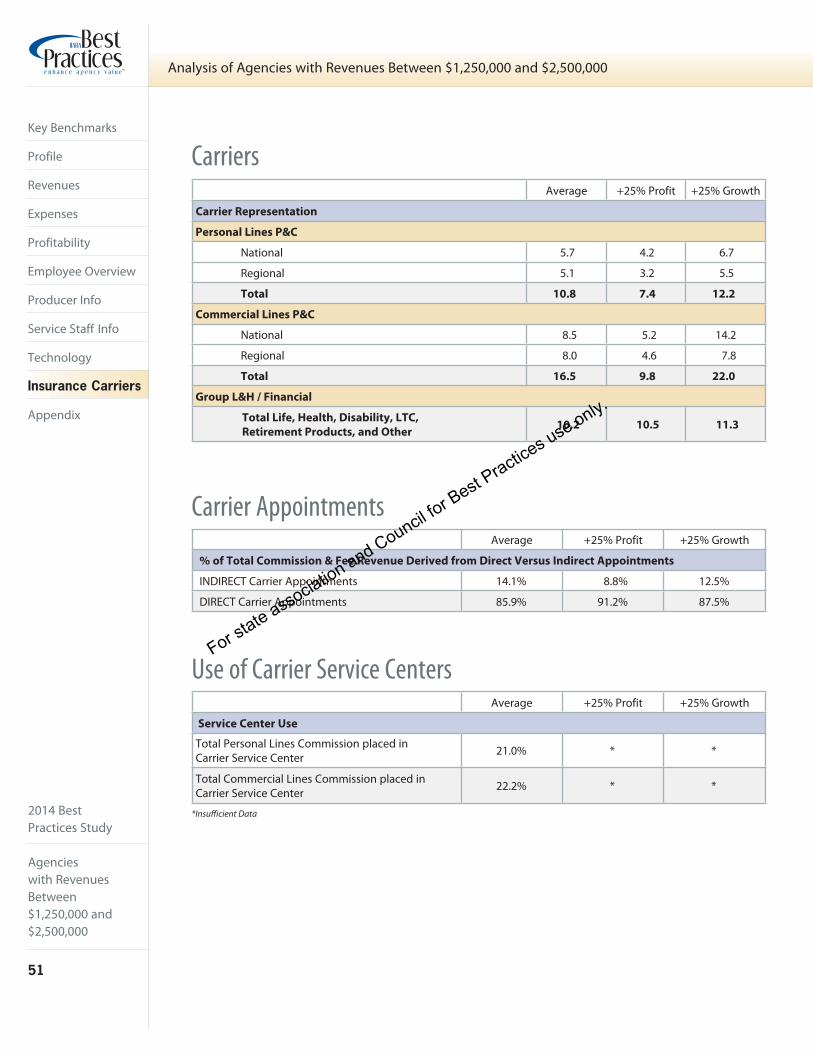
2014 BestPractices Study
Agencieswith RevenuesBetween $1,250,000 and $2,500,000
51
Analysis of Agencies with Revenues Between $1,250,000 and $2,500,000
Key Benchmarks
Profile
Revenues
Expenses
Profitability
Employee Overview
Producer Info
Service Staff Info
Technology
Insurance Carriers
Appendix
Average +25% Profit +25% Growth
Service Center Use
Total Personal Lines Commission placed in Carrier Service Center 21.0% * *
Total Commercial Lines Commission placed in Carrier Service Center 22.2% * *
Use of Carrier Service Centers
Average +25% Profit +25% Growth
Carrier Representation
Personal Lines P&C
National 5.7 4.2 6.7
Regional 5.1 3.2 5.5
Total 10.8 7.4 12.2
Commercial Lines P&C
National 8.5 5.2 14.2
Regional 8.0 4.6 7.8
Total 16.5 9.8 22.0
Group L&H / Financial
Total Life, Health, Disability, LTC,
Retirement Products, and Other10.2 10.5 11.3
Carriers
Average +25% Profit +25% Growth
% of Total Commission & Fee Revenue Derived from Direct Versus Indirect Appointments
INDIRECT Carrier Appointments 14.1% 8.8% 12.5%
DIRECT Carrier Appointments 85.9% 91.2% 87.5%
Carrier Appointments
*Insufficient Data
For state association and Council for Best Practices use only.

2014 BestPractices Study
Agencieswith Revenues
Between $1,250,000 and
$2,500,000
52
Analysis of Agencies with Revenues Between $1,250,000 and $2,500,000
Key Benchmarks
Profile
Revenues
Expenses
Profitability
Employee Overview
Producer Info
Service Staff Info
Technology
Insurance Carriers
Appendix
Average +25% Profit +25% Growth
P&C Commission Income from Top Carriers
Top P&C Carrier $462,570 $489,014 $449,639
as % of Agency Net Revenue 25.2% 27.6% 24.1%
Top 3 P&C Carriers $783,827 $733,637 $760,310
as % of Agency Net Revenue 42.3% 41.2% 40.1%
Top P&C Carrier—Breakdown By Line of Business
Top 3 P&C Carriers—Breakdown By Line of Business
Revenue from Top Insurance Carriers
Average +25% Profit +25% Growth
L&H/F Commission Income from Top Carriers
as % of Net Rev from Top L&H/F Carrier 5.7% 7.5% 7.4%
as % of Net Rev from Top 3 L&H/F Carriers 8.3% 11.0% 12.7%
+25% ProfitAverage
Mid/LargeCommerical45.6%
Personal17.4%
Mid/LargeCommerical24.0%
Personal39.0%
SmallCommercial37.0%
SmallCommercial37.0%
SmallCommercial32.7%
Mid/LargeCommerical22.4%
Personal45.0%
+25% Growth
Mid/LargeCommerical23.8%
+25% Growth+25% ProfitAverage
Mid/LargeCommerical41.7%
Personal23.0%
SmallCommercial35.3%
Personal39.7%
SmallCommercial36.6%
Mid/LargeCommerical32.0%
Personal37.2%
SmallCommercial30.8%
For state association and Council for Best Practices use only.

2014 BestPractices Study
53
2014 Best Practices Study
For state association and Council for Best Practices use only.

2014 BestPractices Study
54
2014 Best Practices Study
Agencies with Revenues Between $2,500,000 and $5,000,000
$1,250,000 $25,000,000$2,500,000 $5,000,000 $10,000,000
For state association and Council for Best Practices use only.
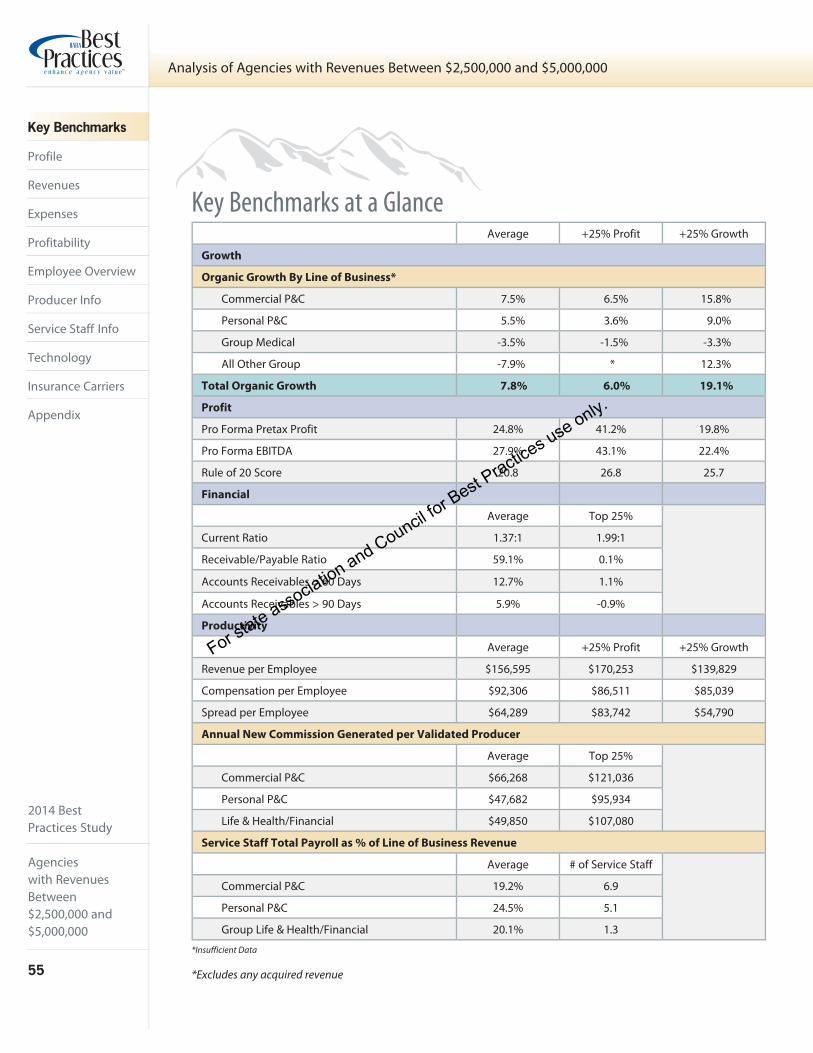
2014 BestPractices Study
Agencieswith RevenuesBetween $2,500,000 and $5,000,000
55
Analysis of Agencies with Revenues Between $2,500,000 and $5,000,000
Key Benchmarks
Profile
Revenues
Expenses
Profitability
Employee Overview
Producer Info
Service Staff Info
Technology
Insurance Carriers
Appendix
Key Benchmarks at a Glance Average +25% Profit +25% Growth
Growth
Organic Growth By Line of Business*
Commercial P&C 7.5% 6.5% 15.8%
Personal P&C 5.5% 3.6% 9.0%
Group Medical -3.5% -1.5% -3.3%
All Other Group -7.9% * 12.3%
Total Organic Growth 7.8% 6.0% 19.1%
Profit
Pro Forma Pretax Profit 24.8% 41.2% 19.8%
Pro Forma EBITDA 27.9% 43.1% 22.4%
Rule of 20 Score 20.8 26.8 25.7
Financial
Average Top 25%
Current Ratio 1.37:1 1.99:1
Receivable/Payable Ratio 59.1% 0.1%
Accounts Receivables > 60 Days 12.7% 1.1%
Accounts Receivables > 90 Days 5.9% -0.9%
Productivity
Average +25% Profit +25% Growth
Revenue per Employee $156,595 $170,253 $139,829
Compensation per Employee $92,306 $86,511 $85,039
Spread per Employee $64,289 $83,742 $54,790
Annual New Commission Generated per Validated Producer
Average Top 25%
Commercial P&C $66,268 $121,036
Personal P&C $47,682 $95,934
Life & Health/Financial $49,850 $107,080
Service Staff Total Payroll as % of Line of Business Revenue
Average # of Service Staff
Commercial P&C 19.2% 6.9
Personal P&C 24.5% 5.1
Group Life & Health/Financial 20.1% 1.3
*Insufficient Data
*Excludes any acquired revenue
For state association and Council for Best Practices use only.

2014 BestPractices Study
Agencieswith Revenues
Between $2,500,000 and
$5,000,000
56
Analysis of Agencies with Revenues Between $2,500,000 and $5,000,000
Key Benchmarks
Profile
Revenues
Expenses
Profitability
Employee Overview
Producer Info
Service Staff Info
Technology
Insurance Carriers
Appendix
Average Total Revenues: $3,472,462
Population Density of Metropolitan Areas Where Home Offi ce is Located
Average +25% Profi t +25% Growth
Less than 50,000 29.2% 54.5% 36.4%
50,000 – 250,000 35.4% 18.2% 27.3%
250,000 – 1,000,000 10.4% 0.0% 18.2%
More than 1,000,000 25.0% 27.3% 18.2%
Corporate Structure
C 14.6% 27.3% 0.0%
S 62.5% 27.3% 63.6%
Partnership 4.2% 9.1% 18.2%
LLC 18.8% 36.4% 18.2%
Sole Proprietorship 0.0% 0.0% 0.0%
Average Number of Agency Locations
(Main Offi ces and Branch Offi ces) 1.6 1.6 1.6
Total Square Footage of Office Space 7,364 6,765 6,963
# of States in which Offices are Located 1.1 1.4 1.1
Agency has an ESOP 2.1% 0.0% 0.0%
% of Stock Owned by ESOP 100.0% 0.0% 0.0%
Shareholders
Number of Shareholders (excluding ESOP) 3.3 3.0 3.5
High 7.0
Low 1.0
Ownership Percentage
% Owned by Largest Shareholder 64.7% 74.7% 65.5%
High 100.0%
Low 25.0%
Shareholder Age
Current Age of Largest Shareholder 56.2 60.1 54.5
Parent Corporation
Average
Other included commercial P&C agency and holding company.
% of Agencies Owned by Another Corporation 6.5%
Description of Parent Corporation
Financial Institution 25.0%
National Broker 25.0%
Other 50.0%
Member of Group
% of Agencies Belonging to a Franchise, Cluster, Alliance/Network or Aggregator Group 31.3%
Other included Combined Agents of America, Trusted Insurance Alliance, CAA, Secure Risk/Shared Agency Services, Keystone Insurance Group, ARM of Illinois, Consolidated Insurance Agents, Assuralliance, and
Northlake Insurance Group.
Profi le (of Agencies in this Study Group)
For state association and Council for Best Practices use only.
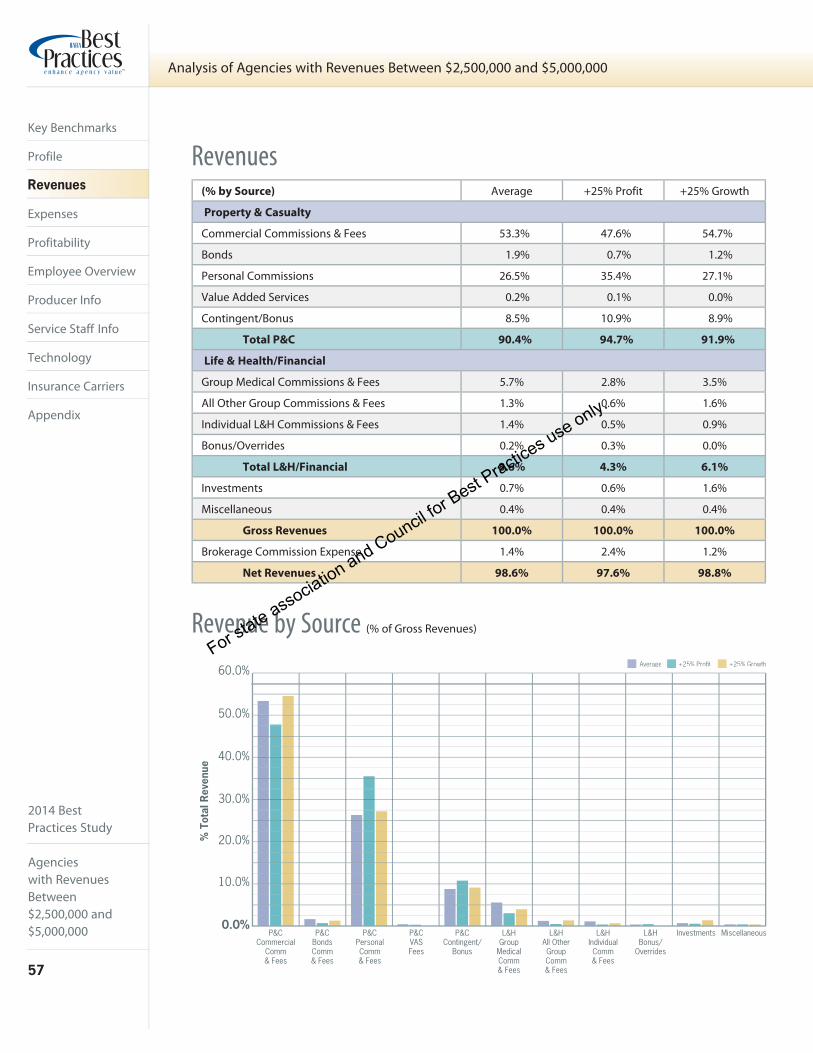
2014 BestPractices Study
Agencieswith RevenuesBetween $2,500,000 and $5,000,000
57
Analysis of Agencies with Revenues Between $2,500,000 and $5,000,000
Key Benchmarks
Profile
Revenues
Expenses
Profitability
Employee Overview
Producer Info
Service Staff Info
Technology
Insurance Carriers
Appendix
Revenues
Revenue by Source (% of Gross Revenues)
(% by Source) Average +25% Profit +25% Growth
Property & Casualty
Commercial Commissions & Fees 53.3% 47.6% 54.7%
Bonds 1.9% 0.7% 1.2%
Personal Commissions 26.5% 35.4% 27.1%
Value Added Services 0.2% 0.1% 0.0%
Contingent/Bonus 8.5% 10.9% 8.9%
Total P&C 90.4% 94.7% 91.9%
Life & Health/Financial
Group Medical Commissions & Fees 5.7% 2.8% 3.5%
All Other Group Commissions & Fees 1.3% 0.6% 1.6%
Individual L&H Commissions & Fees 1.4% 0.5% 0.9%
Bonus/Overrides 0.2% 0.3% 0.0%
Total L&H/Financial 8.6% 4.3% 6.1%
Investments 0.7% 0.6% 1.6%
Miscellaneous 0.4% 0.4% 0.4%
Gross Revenues 100.0% 100.0% 100.0%
Brokerage Commission Expense 1.4% 2.4% 1.2%
Net Revenues 98.6% 97.6% 98.8%
% T
otal
Rev
enue
10.0%
20.0%
30.0%
40.0%
50.0%
60.0%
0.0%P&C
Contingent/Bonus
P&CVASFees
P&CPersonalComm& Fees
P&CBondsComm& Fees
P&CCommercial
Comm& Fees
L&HGroup
MedicalComm& Fees
L&HAll OtherGroupComm& Fees
L&HIndividualComm& Fees
L&HBonus/
Overrides
Investments Miscellaneous
Average +25% Profit +25% Growth
For state association and Council for Best Practices use only.

2014 BestPractices Study
Agencieswith Revenues
Between $2,500,000 and
$5,000,000
58
Analysis of Agencies with Revenues Between $2,500,000 and $5,000,000
Key Benchmarks
Profile
Revenues
Expenses
Profitability
Employee Overview
Producer Info
Service Staff Info
Technology
Insurance Carriers
Appendix
What the Typical Transactions Looked Like
Revenues Acquired per Transaction Multiples of Revenue Paid
Average $198,174 Average 1.49x
High $750,000 High 1.85x
Low $90,100 Low 1.0x
Acquired Revenues
% of Agencies
Acquiring
Average
Commissions
Acquired
% of
Net Revenues
Acquisitions Made in Last 12 Months 14.6% $204,195 5.4%
Revenue by Acquisition
Revenue by Specialty/NicheAverage +25% Profit +25% Growth
% of Agencies having an Industry and/or
Product Specialty/Niche58.3% 36.4% 63.6%
Total Commissions & Fees Generated from All Specialties/Niches $1,094,029 $1,647,837 $882,661
Total Specialty/Niche Revenue as % of Net Revenues 29.1% 46.6% 15.6%
Specialty/Niche Revenue as % of Net Revenue
Average +25% Profit +25% Growth
10%
20%
30%
40%
50%
29.1%
15.6%
0%
46.6%
For state association and Council for Best Practices use only.

2014 BestPractices Study
Agencieswith RevenuesBetween $2,500,000 and $5,000,000
59
Analysis of Agencies with Revenues Between $2,500,000 and $5,000,000
Key Benchmarks
Profile
Revenues
Expenses
Profitability
Employee Overview
Producer Info
Service Staff Info
Technology
Insurance Carriers
Appendix
Revenue by Account ConcentrationAverage +25% Profit +25% Growth
% of Revenue Derived from
Largest Account 3.8% 3.0% 3.4%
High 24.5%
Low 0.7%
10 Largest Accounts 15.1% 12.5% 13.4%
High 43.1%
Low 2.5%
Average +25% Profit +25% Growth
“Other” Group Life & Health* Revenue (% from source)
Life 27.8% 58.0% 40.0%
Disability 16.7% 0.3% 18.2%
Dental & Vision 25.9% 8.3% 16.9%
Retirement/Pension 6.4% 0.0% 17.6%
Worksite/Voluntary/Supplement 6.8% 0.0% 3.3%
Long-Term Care 2.5% 8.3% 3.7%
Employee Benefits TPA 4.4% 0.0% 0.0%
All Other 9.6% 25.0% 0.3%
*Excludes Group Medical
For state association and Council for Best Practices use only.

2014 BestPractices Study
Agencieswith Revenues
Between $2,500,000 and
$5,000,000
60
Analysis of Agencies with Revenues Between $2,500,000 and $5,000,000
Key Benchmarks
Profile
Revenues
Expenses
Profitability
Employee Overview
Producer Info
Service Staff Info
Technology
Insurance Carriers
Appendix
Revenue by Account Size(as measured by Comm. & Fees – not premium) Average +25% Profit +25% Growth
Commercial P&C
Greater than $25,000
% of Book 29.9% 21.5% 25.5%
# of Accounts 12.3 9.4 11.5
Total Revenue $698,258 $535,548 $601,222
Revenue per Account $56,718 $56,705 $52,488
Between $10,000 and $25,000
% of Book 17.0% 12.7% 16.7%
# of Accounts 24.6 18.7 25.3
Total Revenue $379,540 $284,293 $392,951
Revenue per Account $15,431 $15,203 $15,548
Between $5,000 and $10,000
% of Book 13.1% 12.0% 12.5%
# of Accounts 41.2 38.5 39.6
Total Revenue $291,869 $269,778 $294,178
Revenue per Account $7,082 $7,007 $7,422
Less than $5,000
% of Book 40.0% 53.8% 45.4%
# of Accounts 1,660.9 2,872.5 2,042.8
Total Revenue $893,749 $1,208,670 $1,069,882
Revenue per Account $538 $421 $524
(as measured by number of lives) Average +25% Profit +25% Growth
Group L&H/Financial
Over 100 Lives
% of Book 32.0% 14.9% 38.2%
# of Accounts 5.8 1.3 4.3
Total Revenue $198,980 $48,792 $178,232
Revenue per Account $34,369 $36,594 $41,937
50 - 100 Lives
% of Book 21.5% 19.0% 25.2%
# of Accounts 9.3 10.2 13.2
Total Revenue $106,004 $37,404 $94,050
Revenue per Account $11,358 $3,667 $7,125
25 - 50 Lives
% of Book 14.2% 8.9% 20.5%
# of Accounts 13.0 4.8 18.0
Total Revenue $64,730 $17,586 $76,496
Revenue per Account $4,994 $3,664 $4,250
Under 25 Lives
% of Book 32.3% 57.2% 16.0%
# of Accounts 120.6 72.0 47.6
Total Revenue $112,154 $62,503 $42,608
Revenue per Account $930 $868 $896
For state association and Council for Best Practices use only.
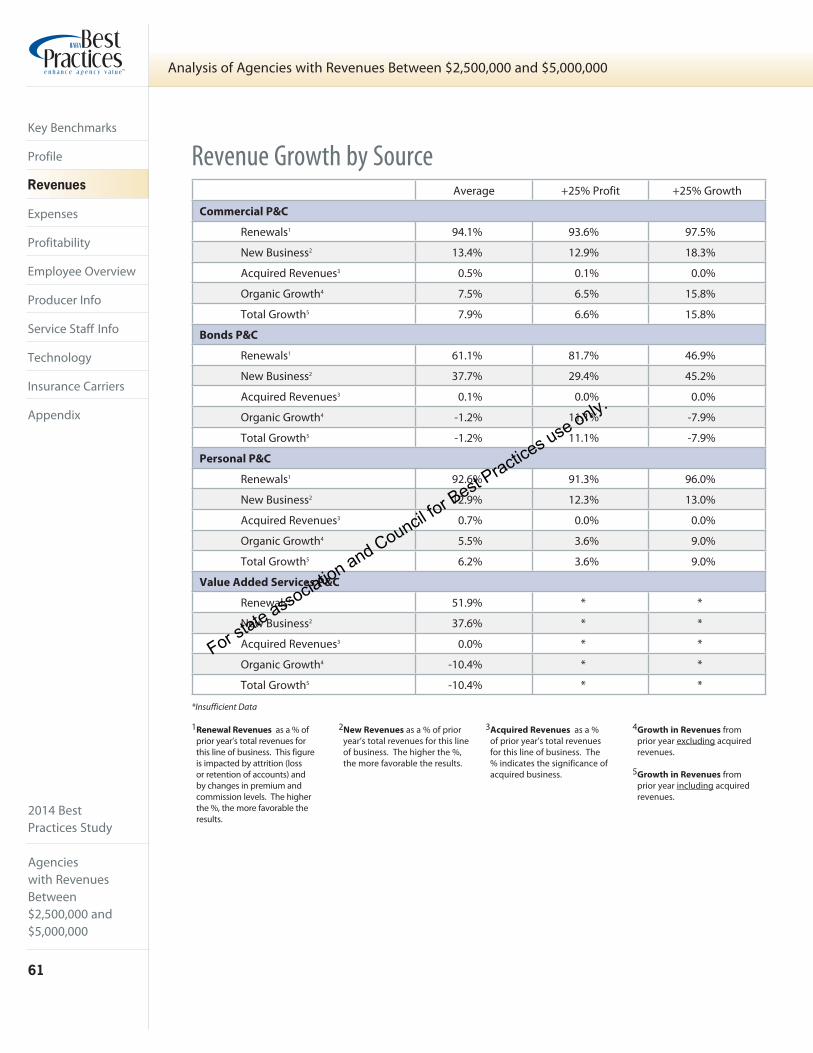
2014 BestPractices Study
Agencieswith RevenuesBetween $2,500,000 and $5,000,000
61
Analysis of Agencies with Revenues Between $2,500,000 and $5,000,000
Key Benchmarks
Profile
Revenues
Expenses
Profitability
Employee Overview
Producer Info
Service Staff Info
Technology
Insurance Carriers
Appendix
Revenue Growth by Source
*Insufficient Data
Average +25% Profit +25% Growth
Commercial P&C
Renewals1 94.1% 93.6% 97.5%
New Business2 13.4% 12.9% 18.3%
Acquired Revenues3 0.5% 0.1% 0.0%
Organic Growth4 7.5% 6.5% 15.8%
Total Growth5 7.9% 6.6% 15.8%
Bonds P&C
Renewals1 61.1% 81.7% 46.9%
New Business2 37.7% 29.4% 45.2%
Acquired Revenues3 0.1% 0.0% 0.0%
Organic Growth4 -1.2% 11.1% -7.9%
Total Growth5 -1.2% 11.1% -7.9%
Personal P&C
Renewals1 92.6% 91.3% 96.0%
New Business2 12.9% 12.3% 13.0%
Acquired Revenues3 0.7% 0.0% 0.0%
Organic Growth4 5.5% 3.6% 9.0%
Total Growth5 6.2% 3.6% 9.0%
Value Added Services P&C
Renewals1 51.9% * *
New Business2 37.6% * *
Acquired Revenues3 0.0% * *
Organic Growth4 -10.4% * *
Total Growth5 -10.4% * *
1Renewal Revenues as a % of prior year’s total revenues for this line of business. This figure is impacted by attrition (loss or retention of accounts) and by changes in premium and commission levels. The higher the %, the more favorable the results.
2New Revenues as a % of prior year’s total revenues for this line of business. The higher the %, the more favorable the results.
3Acquired Revenues as a % of prior year’s total revenues for this line of business. The % indicates the significance of acquired business.
4Growth in Revenues from prior year excluding acquired revenues.
5Growth in Revenues from prior year including acquired revenues.
*Insufficient Data
For state association and Council for Best Practices use only.

2014 BestPractices Study
Agencieswith Revenues
Between $2,500,000 and
$5,000,000
62
Analysis of Agencies with Revenues Between $2,500,000 and $5,000,000
Key Benchmarks
Profile
Revenues
Expenses
Profitability
Employee Overview
Producer Info
Service Staff Info
Technology
Insurance Carriers
Appendix
Revenue Growth by Source (continued)
*Insufficient Data
Average +25% Profit +25% Growth
Group Medical L&H
Renewals1 87.2% 91.1% 87.7%
New Business2 9.3% 7.4% 9.0%
Acquired Revenues3 0.0% 0.0% 0.0%
Organic Growth4 -3.5% -1.5% -3.3%
Total Growth5 -3.5% -1.5% -3.3%
All Other Group L&H
Renewals1 77.8% * 97.4%
New Business2 14.2% * 14.8%
Acquired Revenues3 0.0% * 0.0%
Organic Growth4 -7.9% * 12.3%
Total Growth5 -7.9% * 12.3%
Individual L&H
Renewals1 65.6% 77.5% 74.5%
New Business2 31.5% 16.3% 45.4%
Acquired Revenues3 0.6% 0.0% 0.0%
Organic Growth4 -2.9% -6.2% 19.8%
Total Growth5 -2.3% -6.2% 19.8%
Total Commissions & Fees (P&C, L&H)
Renewals1 92.9% 92.7% 95.6%
New Business2 13.5% 12.5% 16.9%
Acquired Revenues3 0.9% 0.1% 0.0%
Organic Growth4 6.6% 5.2% 13.9%
Total Growth5 7.5% 5.2% 13.9%
Brokerage Commission Expense Growth -3.8% 13.7% *
Net Commissions & Fees Growth (Organic)6 6.8% 5.2% 14.5%
Net Commissions & Fees Growth (Total)7 7.7% 5.3% 14.5%
Other Income
P&C Contingent Income Growth 9.1% 3.3% 31.5%
L&H Bonus Income Growth 13.4% -27.7% *
Investment Income Growth -6.5% * -4.3%
Gross Revenue Growth 8.4% 5.9% 18.6%
Net Revenue Growth (Organic)8 7.8% 6.0% 19.1%
Net Revenue Growth (Total)9 8.6% 6.1% 19.1%
1Renewal Revenues as a % of prior year’s total revenues for this line of business. This figure is impacted by attrition (loss or retention of accounts) and by changes in premium and commission levels. The higher the %, the more favorable the results.
2New Revenues as a % of prior year’s total revenues for this line of business. The higher the %, the more favorable the results.
3Acquired Revenues as a % of prior year’s total revenues for this line of business. The % indicates the significance of acquired business.
4Growth in Revenues from prior year excluding acquired revenues.
5Growth in Revenues from prior year including acquired revenues.
6Growth in Total Commissions & Fees (less Brokerage Commission Expense) from prior year excluding acquired revenues.
7Growth in Total Commissions & Fees (less Brokerage Commission Expense) from prior year including acquired revenues.
8Growth in Net Revenues (Gross Revenue less Brokerage Commission Expense) from prior year excluding acquired revenues.
9Growth in Net Revenues (Gross Revenue less Brokerage Commission Expense) from prior year including acquired revenues.
For state association and Council for Best Practices use only.
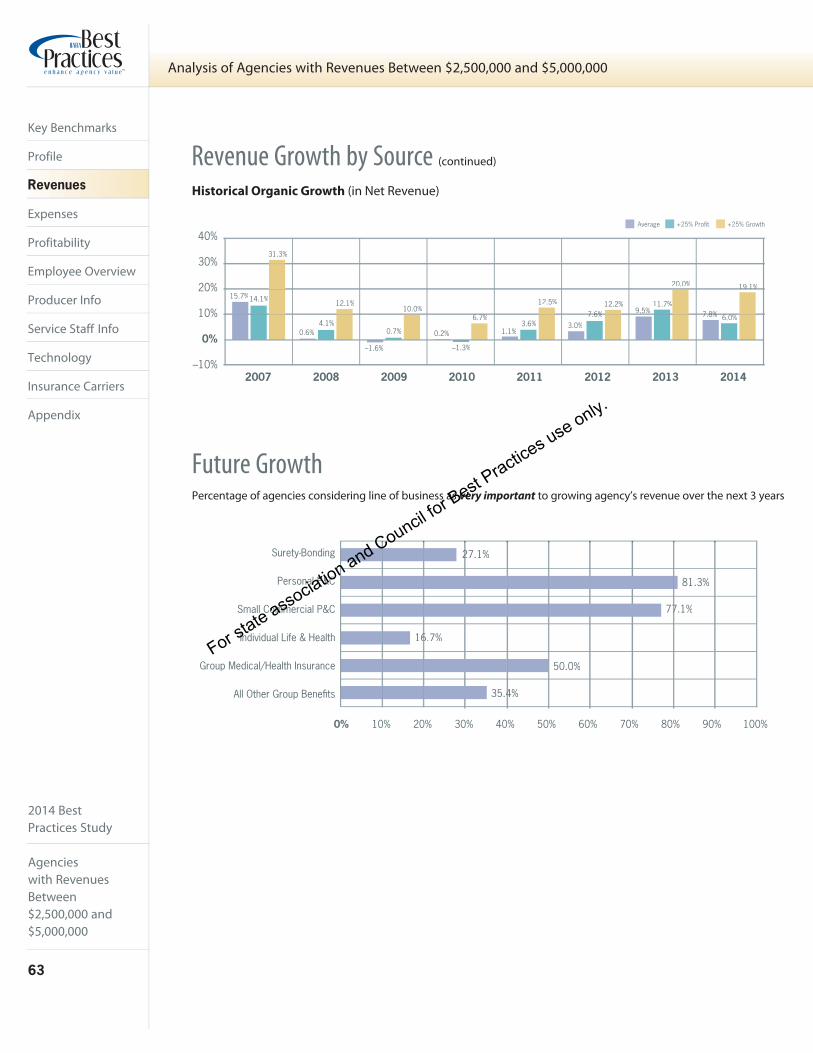
2014 BestPractices Study
Agencieswith RevenuesBetween $2,500,000 and $5,000,000
63
Analysis of Agencies with Revenues Between $2,500,000 and $5,000,000
Key Benchmarks
Profile
Revenues
Expenses
Profitability
Employee Overview
Producer Info
Service Staff Info
Technology
Insurance Carriers
Appendix
Revenue Growth by Source (continued)
Historical Organic Growth (in Net Revenue)
Future GrowthPercentage of agencies considering line of business as very important to growing agency’s revenue over the next 3 years
Surety-Bonding 27.1%2
Personal P&C 81.3%
77.1%7Small Commercial P&C
Individual Life & Health 16.7%6
Group Medical/Health Insurance 50.0%
35.4%4All Other Group Benefits
0% 10% 20% 30% 40% 50% 60% 70% 80% 90% 100%
2007 2008 2009 2010 2011 2012 2013 2014
10%
–10%
20%
30%
40%
15.7%14.1%
31.3%
0.6%4.1%
12.1%
–1.6%
0.7%
10.0%
0.2%
–1.3%
6.7%6 7%
1.1%3.6%
12.5%
3.0%
7.6%7 6%12.2%
9.5%11.7%
20.0%
7.8%7 8% 6.0%6 0%
19.1%19.1%
0%
Average +25% Profit +25% Growth
For state association and Council for Best Practices use only.

2014 BestPractices Study
Agencieswith Revenues
Between $2,500,000 and
$5,000,000
64
Analysis of Agencies with Revenues Between $2,500,000 and $5,000,000
Key Benchmarks
Profile
Revenues
Expenses
Profitability
Employee Overview
Producer Info
Service Staff Info
Technology
Insurance Carriers
Appendix
Expenses (as % of Net Revenues)
Average +25% Profit +25% Growth
Compensation Expenses
Payroll: Employee 47.6% 40.4% 50.0%
Payroll: “Non-Employee” - 1099 Producers/Temp Help 2.7% 1.0% 2.4%
Total Payroll 50.3% 41.4% 52.4%
Benefits: Payroll Taxes 3.4% 3.0% 3.5%
Benefits: Retirement 1.5% 1.5% 1.3%
Benefits: Insurance 3.4% 2.9% 3.9%
Benefits: Other 0.2% 0.5% 0.1%
Total Benefits 8.6% 8.0% 8.9%
Total Compensation 58.8% 49.4% 61.3%
Selling Expenses
T&E/Conventions 1.3% 0.8% 1.4%
Auto Expenditures 0.9% 0.3% 1.1%
Auto Depreciation 0.2% 0.1% 0.2%
Total Auto 1.1% 0.4% 1.3%
Advertising/Promotions 1.5% 0.9% 1.3%
Total Selling 3.9% 2.1% 4.0%
Operating Expenses
Occupancy Expenditures 4.1% 3.3% 5.1%
Occupancy Depreciation/Amortization 0.2% 0.1% 0.0%
Total Occupancy 4.4% 3.4% 5.1%
Office Equipment Expenditures 0.3% 0.2% 0.3%
Office Equipment Depreciation 0.3% 0.1% 0.3%
Total Office Equipment 0.6% 0.3% 0.5%
IT (Information Technology) 1.9% 1.6% 2.4%
IT Depreciation/Amortization 0.1% 0.0% 0.2%
Total IT 2.1% 1.6% 2.5%
Telephone 0.7% 0.6% 0.7%
Postage 0.4% 0.5% 0.5%
Supplies/Printing 0.9% 0.8% 1.0%
Dues/Subscriptions/Contributions 0.8% 0.6% 1.0%
Taxes/Licenses 0.3% 0.4% 0.3%
Insurance 1.5% 1.4% 1.3%
Professional Fees 0.7% 0.6% 0.5%
Bad Debts 0.1% 0.3% 0.1%
Outside Services 0.7% 0.3% 0.5%
Education/Training 0.4% 0.3% 0.4%
Miscellaneous 0.4% 0.4% 0.4%
Total Operating 14.1% 11.6% 14.8%
continued on next page
For state association and Council for Best Practices use only.
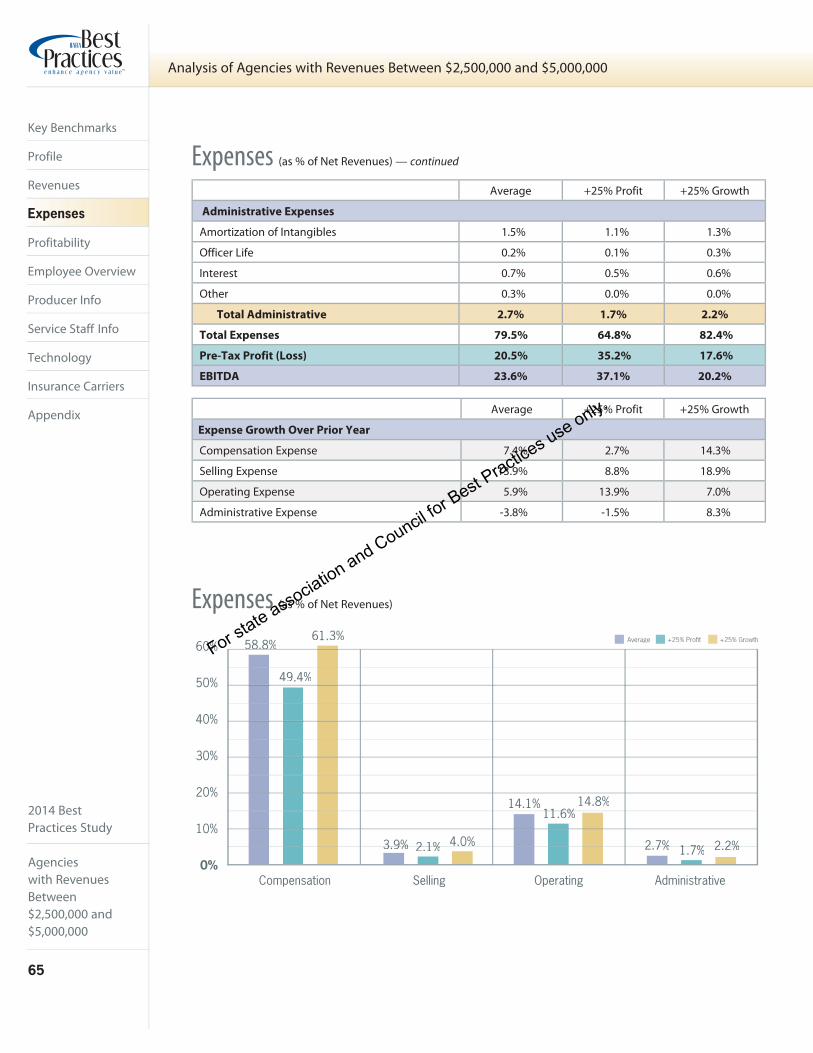
2014 BestPractices Study
Agencieswith RevenuesBetween $2,500,000 and $5,000,000
65
Analysis of Agencies with Revenues Between $2,500,000 and $5,000,000
Key Benchmarks
Profile
Revenues
Expenses
Profitability
Employee Overview
Producer Info
Service Staff Info
Technology
Insurance Carriers
Appendix
Average +25% Profit +25% Growth
Administrative Expenses
Amortization of Intangibles 1.5% 1.1% 1.3%
Officer Life 0.2% 0.1% 0.3%
Interest 0.7% 0.5% 0.6%
Other 0.3% 0.0% 0.0%
Total Administrative 2.7% 1.7% 2.2%
Total Expenses 79.5% 64.8% 82.4%
Pre-Tax Profit (Loss) 20.5% 35.2% 17.6%
EBITDA 23.6% 37.1% 20.2%
Average +25% Profit +25% Growth
Expense Growth Over Prior Year
Compensation Expense 7.4% 2.7% 14.3%
Selling Expense 13.9% 8.8% 18.9%
Operating Expense 5.9% 13.9% 7.0%
Administrative Expense -3.8% -1.5% 8.3%
Expenses (as % of Net Revenues) — continued
Expenses (as % of Net Revenues)
Compensation Selling Operating Administrative0%
10%
20%
30%
40%
50%
60%Average +25% Profit +25% Growth
3.9%3 9% 2.1%2 1% 4.0%
14.1%11.6%11 6%
14.8%
2.7%2 7% 1.7%1 7% 2.2%2 2%
58.8%58.8%61.3%
49.4%
For state association and Council for Best Practices use only.

2014 BestPractices Study
Agencieswith Revenues
Between $2,500,000 and
$5,000,000
66
Analysis of Agencies with Revenues Between $2,500,000 and $5,000,000
Key Benchmarks
Profile
Revenues
Expenses
Profitability
Employee Overview
Producer Info
Service Staff Info
Technology
Insurance Carriers
Appendix
Average +25% Profit +25% Growth
Revenues (as % of Gross Revenue)
Commercial Lines 53.3% 47.6% 54.7%
Bonds 1.9% 0.7% 1.2%
Personal Lines 26.5% 35.4% 27.1%
VAS - P&C 0.2% 0.1% 0.0%
Contingent/Bonus 8.5% 10.9% 8.9%
Group Medical 5.7% 2.8% 3.5%
All Other Group 1.3% 0.6% 1.6%
Individual Life & Health 1.4% 0.5% 0.9%
Bonus/Overrides 0.2% 0.3% 0.0%
Investments 0.7% 0.6% 1.6%
Miscellaneous 0.4% 0.4% 0.4%
Total Revenues 100.0% 100.0% 100.0%
Brokerage Commission Expense 1.4% 2.4% 1.2%
Net Revenues 98.6% 97.6% 98.8%
Expenses (as % of Net Revenues)
Compensation 58.8% 49.4% 61.3%
Selling 3.9% 2.1% 4.0%
Operating 14.1% 11.6% 14.8%
Administrative 2.7% 1.7% 2.2%
Total Expenses 79.5% 64.8% 82.4%
Average +25% Profit +25% Growth
Pre-Tax Profit 20.5% 35.2% 17.6%
Pro Forma Pre-Tax Profit1 24.8% 41.2% 19.8%
Operating Pre-Tax Profit2 12.8% 26.3% 9.3%
EBITDA3 23.6% 37.1% 20.2%
Pro Forma EBITDA4 27.9% 43.1% 22.4%
1Pre-tax Profits if discretionary expenses are eliminated and all owners compensated as employees
2Pre-tax Profits excluding contingents, bonus and investment income
3EBITDA—Earnings Before Interest Taxes Depreciation and Amortization
4EBITDA if discretionary expenses are eliminated and all owners compensated as employees
Profit/Loss Summary
Profit/Loss (as % of Net Revenues)
For state association and Council for Best Practices use only.

2014 BestPractices Study
Agencieswith RevenuesBetween $2,500,000 and $5,000,000
67
Analysis of Agencies with Revenues Between $2,500,000 and $5,000,000
Key Benchmarks
Profile
Revenues
Expenses
Profitability
Employee Overview
Producer Info
Service Staff Info
Technology
Insurance Carriers
Appendix
Profitability
About EBITDA Margin and Operating Margin
EBITDA Margin is calculated by dividing a firm’s EBITDA (Earnings Before Interest, Taxes, Depreciation and Amortization) by the firm’s net revenues.
Pro Forma EBITDA Margin is calculated by dividing a firm’s Pro Forma EBITDA by the firm’s Pro Forma net revenue.
Operating Margin is calculated as EBITDA less contingent income divided by Pro Forma net revenues less contingent income.
Historical EBITDA Margin & Operating Margin (for Average Group)
5%
10%
15%
20%
25%
30%
35%
0%2008
EBITDA Margin Operating Margin
23.2%23 2%
33.5%33 5%
28.4%25.3%
8.9%
21.1%
5.8%
18.3% 18.9%
6.2%
18.6%
6.0%
9.0%
22.4%22 4%23.6%
27.9%
10.4%12.8%12.8%
20102007 2009 2011 2012 2013 2014
Pro Forma EBITDA
20.3%
23.2%23.0%23 0%
24.4%
27.1%27.1%
2.2%2 2%
For state association and Council for Best Practices use only.

2014 BestPractices Study
Agencieswith Revenues
Between $2,500,000 and
$5,000,000
68
Analysis of Agencies with Revenues Between $2,500,000 and $5,000,000
Key Benchmarks
Profile
Revenues
Expenses
Profitability
Employee Overview
Producer Info
Service Staff Info
Technology
Insurance Carriers
Appendix
Average Top 25%
Balance Sheet
Current Ratio 1.37:1 1.99:1
Tangible Net Worth (% of Net Revenue) 6.7% 27.5%
Receivables/Payable Ratio 59.1% 0.1%
Aged Receivables
% Receivables Aged Past 60 Days 12.7% 1.1%
% Receivables Aged Past 90 Days 5.9% -0.9%
Average +25% Profit +25% Growth
Agency Billed vs. Direct Billed by Carrier
% of P&C Revenues that are Agency Billed 28.4% 22.4% 22.6%
% of P&C Revenues that are Direct Billed 71.6% 77.6% 77.4%
Financial Stability
Accounts Receivable
The Rule of 20 is a simple growth and profitability balancing equation that provides a quick way to determine whether or not an agency is creating value for its shareholders. It states that an agency will drive industry-standard shareholder returns if the sum of (a) its organic growth rate and (b) 1/2 of its EBITDA margin equals or exceeds 20.
Generally speaking, an outcome of 20 or more, regardless of the different combinations of growth and profitability, indicates that the agency’s shareholders can expect to earn 15% -17% per year through stock price appreciation and/or shareholder distributions.
• Provides a tool to benchmark agency performance
• Helps frame the trade-off between growth and profitability
What is the Rule of 20?
Average +25% Profit Average +25% Growth Average
Rule of 20 20.8 26.8 25.7
Public BrokersOrganicGrowth
EBITDA Margin
Rule of 20 Outcome
Willis Group 4.9% 24.0% 16.9
Aon 3.0% 20.9% 13.5
Brown & Brown 6.8% 33.5% 23.6
Arthur J. Gallagher 6.5% 19.9% 16.5
Marsh & McLennan 3.0% 20.7% 13.4
Rule of 20 Outcome
Organic
Revenue
Growth
1/2 of
EBITDA
Margin
Rule of 20 Score +=
For state association and Council for Best Practices use only.
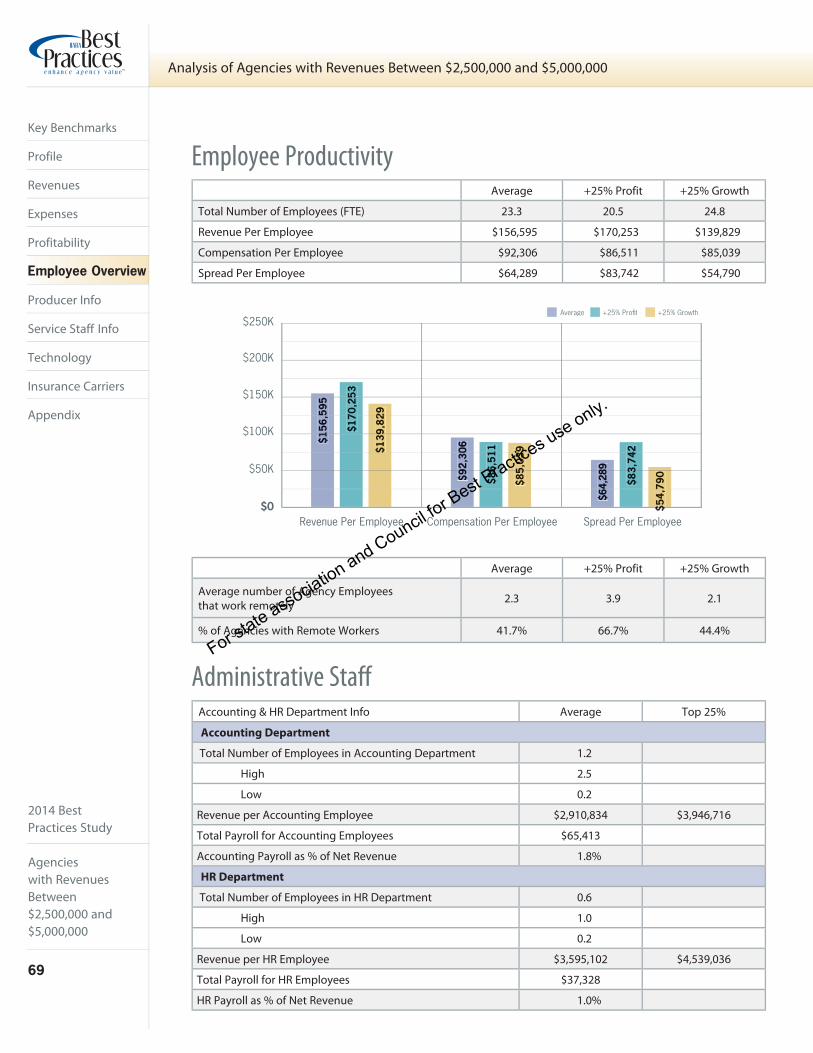
2014 BestPractices Study
Agencieswith RevenuesBetween $2,500,000 and $5,000,000
69
Analysis of Agencies with Revenues Between $2,500,000 and $5,000,000
Key Benchmarks
Profile
Revenues
Expenses
Profitability
Employee Overview
Producer Info
Service Staff Info
Technology
Insurance Carriers
Appendix
Average +25% Profit +25% Growth
Total Number of Employees (FTE) 23.3 20.5 24.8
Revenue Per Employee $156,595 $170,253 $139,829
Compensation Per Employee $92,306 $86,511 $85,039
Spread Per Employee $64,289 $83,742 $54,790
Average +25% Profit +25% Growth
Average number of Agency Employees that work remotely 2.3 3.9 2.1
% of Agencies with Remote Workers 41.7% 66.7% 44.4%
Employee Productivity
Administrative Staff Accounting & HR Department Info Average Top 25%
Accounting Department
Total Number of Employees in Accounting Department 1.2
High 2.5
Low 0.2
Revenue per Accounting Employee $2,910,834 $3,946,716
Total Payroll for Accounting Employees $65,413
Accounting Payroll as % of Net Revenue 1.8%
HR Department
Total Number of Employees in HR Department 0.6
High 1.0
Low 0.2
Revenue per HR Employee $3,595,102 $4,539,036
Total Payroll for HR Employees $37,328
HR Payroll as % of Net Revenue 1.0%
Revenue Per Employee Compensation Per Employee Spread Per Employee$0
$50K
$100K
$150K
$200K
$250K$1
56,5
951
5
$170
,2535
7
$139
,829
92
$
$92,
306
90
$86,
511
61
$85,
039
5
$64,
2898
4 $83,
742
34
Average +25% Profit +25% Growth
$$54,
790
7$
For state association and Council for Best Practices use only.
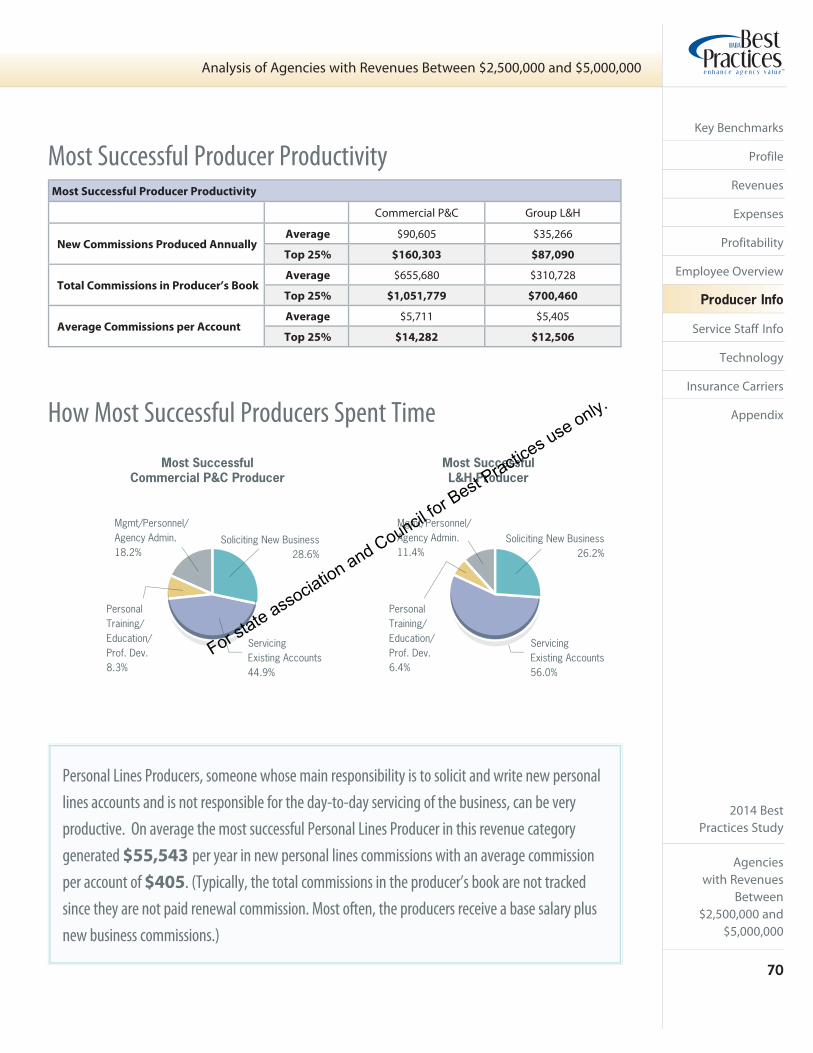
2014 BestPractices Study
Agencieswith Revenues
Between $2,500,000 and
$5,000,000
70
Analysis of Agencies with Revenues Between $2,500,000 and $5,000,000
Key Benchmarks
Profile
Revenues
Expenses
Profitability
Employee Overview
Producer Info
Service Staff Info
Technology
Insurance Carriers
Appendix
Most Successful Producer Productivity
Commercial P&C Group L&H
New Commissions Produced Annually Average $90,605 $35,266
Top 25% $160,303 $87,090
Total Commissions in Producer’s Book Average $655,680 $310,728
Top 25% $1,051,779 $700,460
Average Commissions per Account Average $5,711 $5,405
Top 25% $14,282 $12,506
Most Successful Producer Productivity
How Most Successful Producers Spent Time
Personal Lines Producers, someone whose main responsibility is to solicit and write new personal
lines accounts and is not responsible for the day-to-day servicing of the business, can be very
productive. On average the most successful Personal Lines Producer in this revenue category
generated $55,543 per year in new personal lines commissions with an average commission
per account of $405. (Typically, the total commissions in the producer’s book are not tracked
since they are not paid renewal commission. Most often, the producers receive a base salary plus
new business commissions.)
Most SuccessfulCommercial P&C Producer
Most SuccessfulL&H Producer
PersonalTraining/Education/Prof. Dev.8.3%
Soliciting New Business28.6%
Mgmt/Personnel/Agency Admin.18.2%
ServicingExisting Accounts44.9%
PersonalTraining/Education/Prof. Dev.6.4%
Soliciting New Business26.2%
Mgmt/Personnel/Agency Admin.11.4%
ServicingExisting Accounts56.0%
For state association and Council for Best Practices use only.

2014 BestPractices Study
Agencieswith RevenuesBetween $2,500,000 and $5,000,000
71
Analysis of Agencies with Revenues Between $2,500,000 and $5,000,000
Key Benchmarks
Profile
Revenues
Expenses
Profitability
Employee Overview
Producer Info
Service Staff Info
Technology
Insurance Carriers
Appendix
Average Top 25%
Commercial P&C Producers
Average Validated Producers
# Validated 4.0
High 8.0
Low 1.0
Average New Commissions Produced Annually $66,268 $121,036
Average Book Serviced (Commissions) $415,602 $680,057
Average Pay ($) $138,503
Average Pay (% of Book Serviced) 33.3%
Group Life & Health Producers
Average Validated Producers
# Validated 1.4
High 4.0
Low 0.3
Average New Commissions Produced Annually $49,850 $107,080
Average Book Serviced (Commissions) $293,601 $432,400
Average Pay ($) $94,470
Average Pay (% of Book Serviced) 32.2%
Personal P&C Producers
Average Validated Producers
# Validated 3.1
High 11.0
Low 1.0
Average New Commissions Produced Annually $47,682 $95,934
Average Book Serviced (Commissions) $212,548 $486,820
Average Pay ($) $61,829
Average Pay (% of Book Serviced) 29.1%
Multi-Line Producers
Average Validated Producers
# Validated 3.0
High 10.0
Low 1.0
Average New Commissions Produced Annually $49,403 $89,166
Average Book Serviced (Commissions) $433,272 $629,267
Average Pay ($) $125,708
Average Pay (% of Book Serviced) 29.0%
Validated Producer Productivity
Average +25% Profit +25% Growth
% of Agencies That Reimburse All/Part T&E Expense 72.9% 63.6% 90.9%
For state association and Council for Best Practices use only.
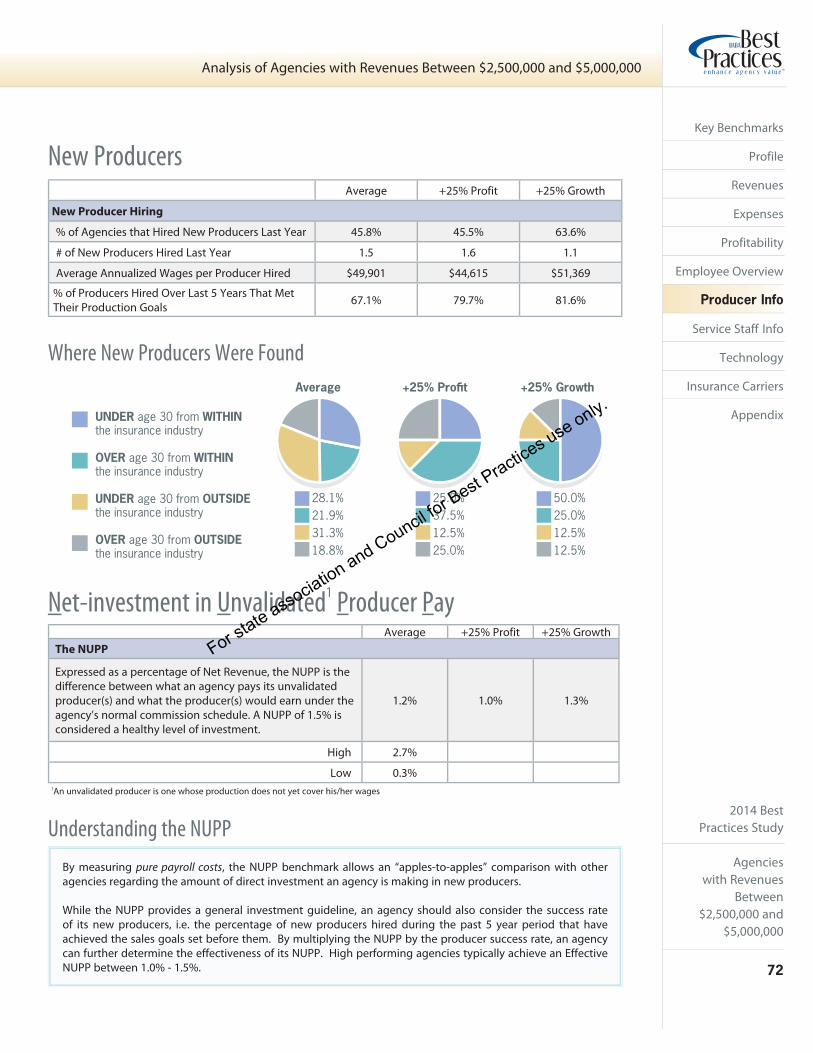
2014 BestPractices Study
Agencieswith Revenues
Between $2,500,000 and
$5,000,000
72
Analysis of Agencies with Revenues Between $2,500,000 and $5,000,000
Key Benchmarks
Profile
Revenues
Expenses
Profitability
Employee Overview
Producer Info
Service Staff Info
Technology
Insurance Carriers
Appendix
Where New Producers Were Found
Average +25% Profit +25% Growth
New Producer Hiring
% of Agencies that Hired New Producers Last Year 45.8% 45.5% 63.6%
# of New Producers Hired Last Year 1.5 1.6 1.1
Average Annualized Wages per Producer Hired $49,901 $44,615 $51,369
% of Producers Hired Over Last 5 Years That Met Their Production Goals 67.1% 79.7% 81.6%
New Producers
Average +25% Profit +25% GrowthThe NUPP
Expressed as a percentage of Net Revenue, the NUPP is the difference between what an agency pays its unvalidated producer(s) and what the producer(s) would earn under the agency’s normal commission schedule. A NUPP of 1.5% is considered a healthy level of investment.
1.2% 1.0% 1.3%
High 2.7%
Low 0.3%
By measuring pure payroll costs, the NUPP benchmark allows an “apples-to-apples” comparison with other agencies regarding the amount of direct investment an agency is making in new producers.
While the NUPP provides a general investment guideline, an agency should also consider the success rate of its new producers, i.e. the percentage of new producers hired during the past 5 year period that have achieved the sales goals set before them. By multiplying the NUPP by the producer success rate, an agency can further determine the effectiveness of its NUPP. High performing agencies typically achieve an Effective NUPP between 1.0% - 1.5%.
1An unvalidated producer is one whose production does not yet cover his/her wages
Net-investment in Unvalidated1 Producer Pay
Understanding the NUPP
UNDER age 30 from WITHINthe insurance industry
OVER age 30 from WITHINthe insurance industry
UNDER age 30 from OUTSIDEthe insurance industry
OVER age 30 from OUTSIDEthe insurance industry
+25% ProfitAverage +25% Growth
28.1%21.9%31.3%18.8%
25.0%37.5%12.5%25.0%
50.0%25.0%12.5%12.5%
For state association and Council for Best Practices use only.

2014 BestPractices Study
Agencieswith RevenuesBetween $2,500,000 and $5,000,000
73
Analysis of Agencies with Revenues Between $2,500,000 and $5,000,000
Key Benchmarks
Profile
Revenues
Expenses
Profitability
Employee Overview
Producer Info
Service Staff Info
Technology
Insurance Carriers
Appendix
Average +25% Profit +25% Growth
Total # of Service Staff
(as defined above; excludes any TPA service staff) 12.8 11.8 13.4
% of Peer Agencies Having
Separate/Dedicated Marketing Department 35.4% 27.3% 27.3%
# of Marketing Staff 1.1 1.3 1.3
Separate/Dedicated Claims Department 50.0% 45.5% 54.5%
# of Claims Staff 1.0 1.1 1.1
Average +25% Profit +25% Growth
% of Peer Agencies Having
Workers Comp TPA 0.0% 0.0% 0.0%
# of Service Staff * * *
Total TPA Revenues Serviced * * *
Group Benefits TPA 0.0% 0.0% 0.0%
# of Service Staff * * *
Total TPA Revenues Serviced * * *
TPA Service Staff
Service & Sales Support Staff Definition• Typically non-commissioned employees• Provide service to the agency’s clients• Support producers in the sale of new business and retention of existing business
Some service positions may earn commission income but typically a majority of their pay is fixed and a majority of their time is devoted to service rather than the soliciting of new clients.
Service & Sales Support Positions1 Included in Full-time Equivalent Headcounts• Account Executives (AE) - senior level service representatives• Account Managers, Customer Service Representatives (CSRs)• Assistant CSRs, Processors• Claims Staff• Placers/Marketers• Department Managers - who also service clients1Position titles are general categories since specific job titles vary from agency to agency
Administrative personnel such as accounting, mail room, and reception are not included in service benchmarks unless a portion of their time is dedicated to service.
*Insufficient Data
Service Staff Overview
Service Staff Productivity
For state association and Council for Best Practices use only.
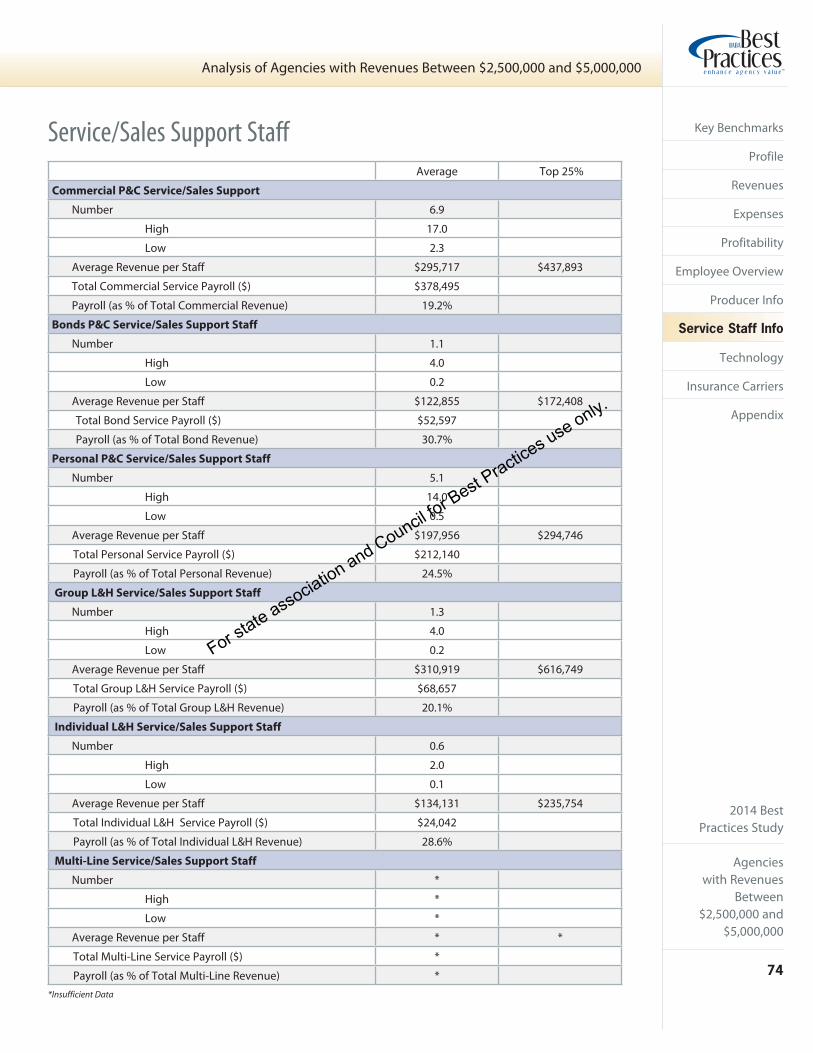
2014 BestPractices Study
Agencieswith Revenues
Between $2,500,000 and
$5,000,000
74
Analysis of Agencies with Revenues Between $2,500,000 and $5,000,000
Key Benchmarks
Profile
Revenues
Expenses
Profitability
Employee Overview
Producer Info
Service Staff Info
Technology
Insurance Carriers
Appendix
Service/Sales Support Staff
Average Top 25%
Commercial P&C Service/Sales Support
Number 6.9
High 17.0
Low 2.3
Average Revenue per Staff $295,717 $437,893
Total Commercial Service Payroll ($) $378,495
Payroll (as % of Total Commercial Revenue) 19.2%
Bonds P&C Service/Sales Support Staff
Number 1.1
High 4.0
Low 0.2
Average Revenue per Staff $122,855 $172,408
Total Bond Service Payroll ($) $52,597
Payroll (as % of Total Bond Revenue) 30.7%
Personal P&C Service/Sales Support Staff
Number 5.1
High 14.0
Low 0.5
Average Revenue per Staff $197,956 $294,746
Total Personal Service Payroll ($) $212,140
Payroll (as % of Total Personal Revenue) 24.5%
Group L&H Service/Sales Support Staff
Number 1.3
High 4.0
Low 0.2
Average Revenue per Staff $310,919 $616,749
Total Group L&H Service Payroll ($) $68,657
Payroll (as % of Total Group L&H Revenue) 20.1%
Individual L&H Service/Sales Support Staff
Number 0.6
High 2.0
Low 0.1
Average Revenue per Staff $134,131 $235,754
Total Individual L&H Service Payroll ($) $24,042
Payroll (as % of Total Individual L&H Revenue) 28.6%
Multi-Line Service/Sales Support Staff
Number *
High *
Low *
Average Revenue per Staff * *
Total Multi-Line Service Payroll ($) *
Payroll (as % of Total Multi-Line Revenue) **Insufficient Data
For state association and Council for Best Practices use only.
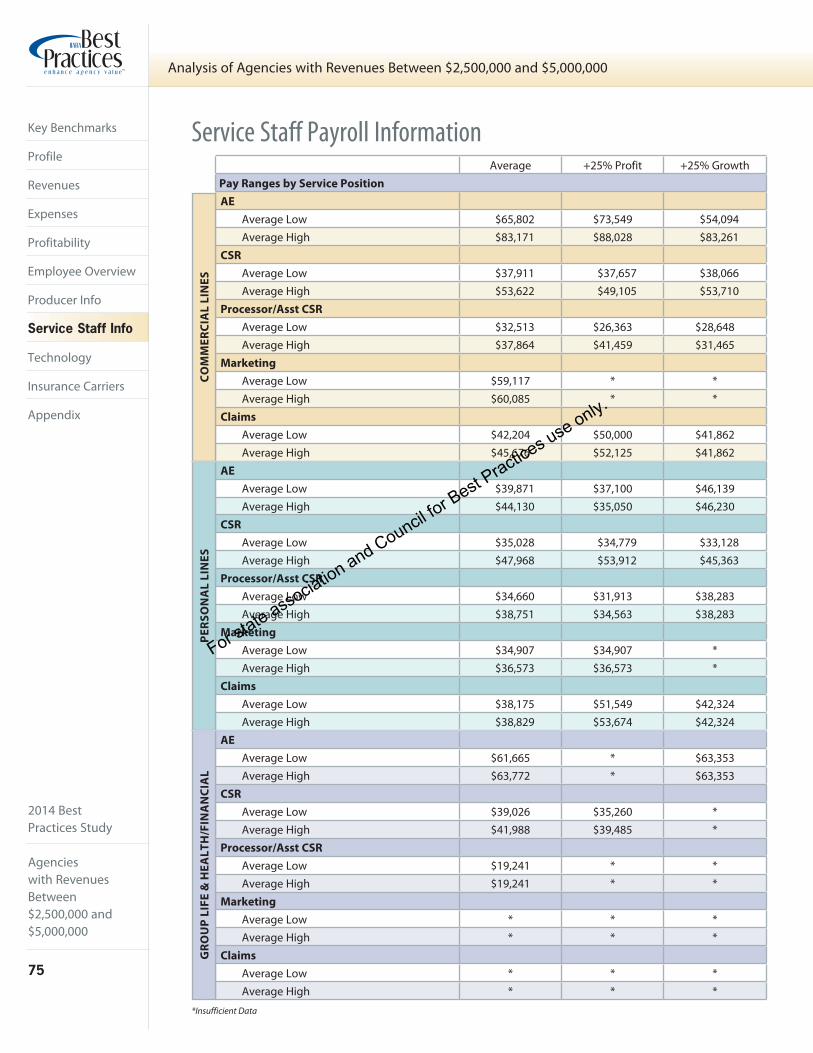
2014 BestPractices Study
Agencieswith RevenuesBetween $2,500,000 and $5,000,000
75
Analysis of Agencies with Revenues Between $2,500,000 and $5,000,000
Key Benchmarks
Profile
Revenues
Expenses
Profitability
Employee Overview
Producer Info
Service Staff Info
Technology
Insurance Carriers
Appendix
Service Staff Payroll InformationAverage +25% Profit +25% Growth
Pay Ranges by Service Position
AE
Average Low $65,802 $73,549 $54,094Average High $83,171 $88,028 $83,261
CSR
Average Low $37,911 $37,657 $38,066Average High $53,622 $49,105 $53,710
Processor/Asst CSR
Average Low $32,513 $26,363 $28,648Average High $37,864 $41,459 $31,465
Marketing
Average Low $59,117 * *Average High $60,085 * *
Claims
Average Low $42,204 $50,000 $41,862Average High $45,676 $52,125 $41,862
AE
Average Low $39,871 $37,100 $46,139Average High $44,130 $35,050 $46,230
CSR
Average Low $35,028 $34,779 $33,128Average High $47,968 $53,912 $45,363
Processor/Asst CSR
Average Low $34,660 $31,913 $38,283Average High $38,751 $34,563 $38,283
Marketing
Average Low $34,907 $34,907 *Average High $36,573 $36,573 *
Claims
Average Low $38,175 $51,549 $42,324Average High $38,829 $53,674 $42,324
AE
Average Low $61,665 * $63,353Average High $63,772 * $63,353
CSR
Average Low $39,026 $35,260 *Average High $41,988 $39,485 *
Processor/Asst CSR
Average Low $19,241 * *Average High $19,241 * *
Marketing
Average Low * * *Average High * * *
Claims
Average Low * * *Average High * * *
CO
MM
ER
CIA
L L
INE
SP
ER
SO
NA
L L
INE
SG
RO
UP
LIF
E &
HE
AL
TH
/FIN
AN
CIA
L
*Insufficient Data
For state association and Council for Best Practices use only.
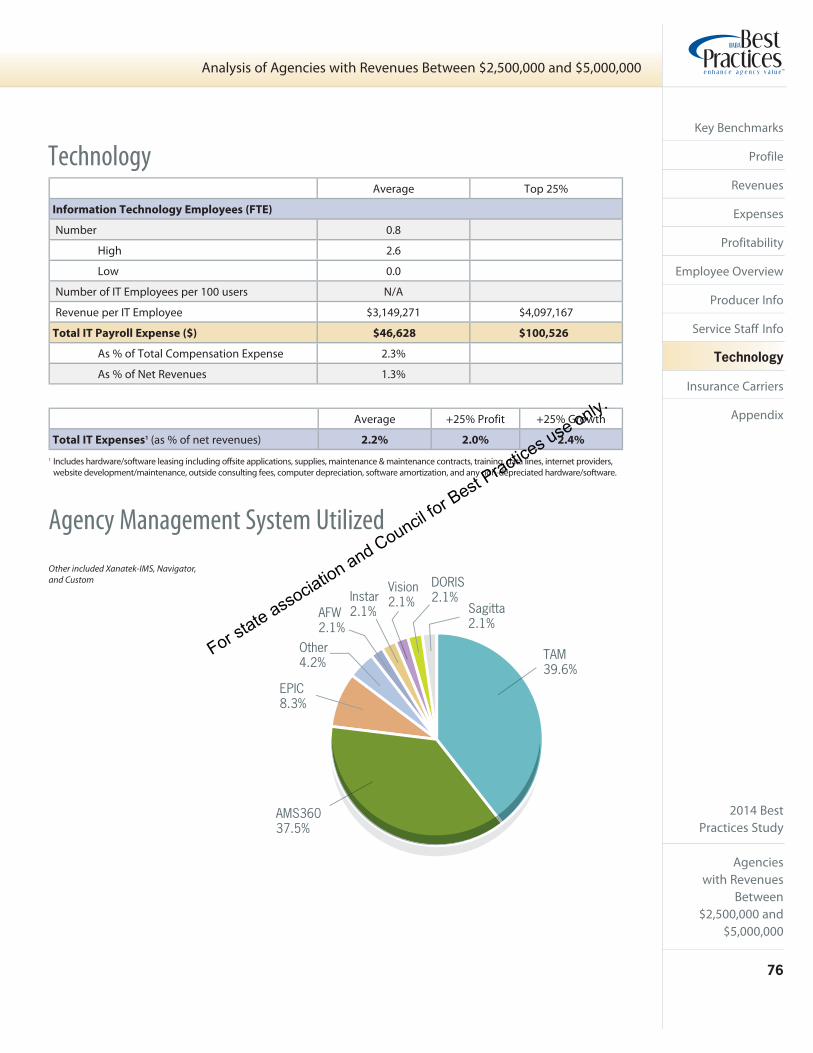
2014 BestPractices Study
Agencieswith Revenues
Between $2,500,000 and
$5,000,000
76
Analysis of Agencies with Revenues Between $2,500,000 and $5,000,000
Key Benchmarks
Profile
Revenues
Expenses
Profitability
Employee Overview
Producer Info
Service Staff Info
Technology
Insurance Carriers
Appendix
Average Top 25%
Information Technology Employees (FTE)
Number 0.8
High 2.6
Low 0.0
Number of IT Employees per 100 users N/A
Revenue per IT Employee $3,149,271 $4,097,167
Total IT Payroll Expense ($) $46,628 $100,526
As % of Total Compensation Expense 2.3%
As % of Net Revenues 1.3%
1 Includes hardware/software leasing including offsite applications, supplies, maintenance & maintenance contracts, training, data lines, internet providers, website development/maintenance, outside consulting fees, computer depreciation, software amortization, and any non-depreciated hardware/software.
Technology
Agency Management System Utilized
Average +25% Profit +25% Growth
Total IT Expenses1 (as % of net revenues) 2.2% 2.0% 2.4%
Other included Xanatek-IMS, Navigator, and Custom
TAM39.6%
AMS36037.5%
EPIC8.3%
Other4.2%
AFW2.1%
Instar2.1%
Vision2.1%
DORIS2.1%
Sagitta2.1%
For state association and Council for Best Practices use only.

2014 BestPractices Study
Agencieswith RevenuesBetween $2,500,000 and $5,000,000
77
Analysis of Agencies with Revenues Between $2,500,000 and $5,000,000
Key Benchmarks
Profile
Revenues
Expenses
Profitability
Employee Overview
Producer Info
Service Staff Info
Technology
Insurance Carriers
Appendix
Average +25% Profit +25% Growth
Service Center Use
Total Personal Lines Commission placed in Carrier Service Center 23.9% * *
Total Commercial Lines Commission placed in Carrier Service Center 6.6% * *
Use of Carrier Service Centers
Average +25% Profit +25% Growth
Carrier Representation
Personal Lines P&C
National 6.5 6.9 10.4
Regional 8.0 7.6 14.3
Total 14.4 14.5 24.7
Commercial Lines P&C
National 12.0 13.1 14.3
Regional 12.6 9.8 15.7
Total 24.6 22.9 30.0
Group L&H / Financial
Total Life, Health, Disability, LTC,
Retirement Products, and Other14.3 7.6 17.6
Carriers
Average +25% Profit +25% Growth
% of Total Commission & Fee Revenue Derived from Direct Versus Indirect Appointments
INDIRECT Carrier Appointments 15.1% 12.6% 9.5%
DIRECT Carrier Appointments 82.9% 87.5% 81.6%
Carrier Appointments
*Insufficient Data
For state association and Council for Best Practices use only.
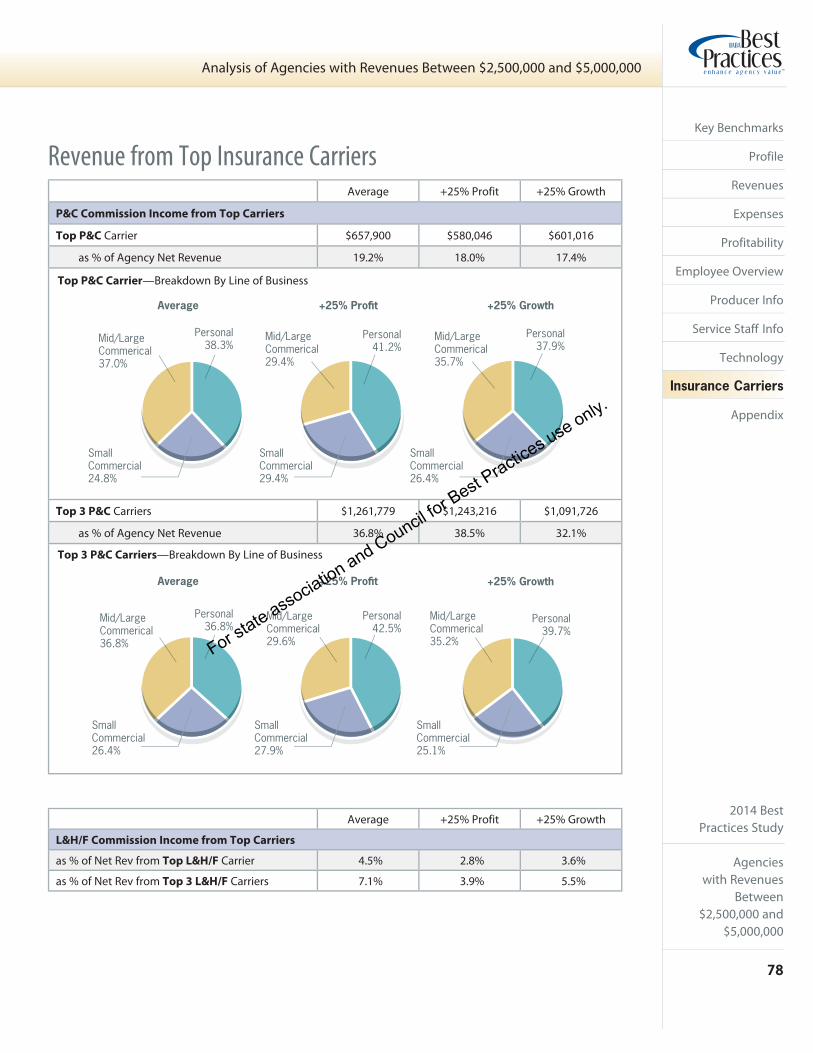
2014 BestPractices Study
Agencieswith Revenues
Between $2,500,000 and
$5,000,000
78
Analysis of Agencies with Revenues Between $2,500,000 and $5,000,000
Key Benchmarks
Profile
Revenues
Expenses
Profitability
Employee Overview
Producer Info
Service Staff Info
Technology
Insurance Carriers
Appendix
Average +25% Profit +25% Growth
P&C Commission Income from Top Carriers
Top P&C Carrier $657,900 $580,046 $601,016
as % of Agency Net Revenue 19.2% 18.0% 17.4%
Top 3 P&C Carriers $1,261,779 $1,243,216 $1,091,726
as % of Agency Net Revenue 36.8% 38.5% 32.1%
Top P&C Carrier—Breakdown By Line of Business
Top 3 P&C Carriers—Breakdown By Line of Business
Revenue from Top Insurance Carriers
Average +25% Profit +25% Growth
L&H/F Commission Income from Top Carriers
as % of Net Rev from Top L&H/F Carrier 4.5% 2.8% 3.6%
as % of Net Rev from Top 3 L&H/F Carriers 7.1% 3.9% 5.5%
+25% ProfitAverage
Mid/LargeCommerical29.4%
Personal41.2%
Mid/LargeCommerical37.0%
Personal38.3%
SmallCommercial24.8%
SmallCommercial29.4%
SmallCommercial26.4%
Mid/LargeCommerical35.7%
Personal37.9%
+25% Growth
Mid/LargeCommerical36.8%
+25% Growth+25% ProfitAverage
Mid/LargeCommerical29.6%
Personal42.5%
SmallCommercial27.9%
Personal36.8%
SmallCommercial26.4%
Mid/LargeCommerical35.2%
Personal39.7%
SmallCommercial25.1%
For state association and Council for Best Practices use only.

2014 BestPractices Study
79
2014 Best Practices Study
For state association and Council for Best Practices use only.

2014 BestPractices Study
80
2014 Best Practices Study
Agencies with Revenues Between $5,000,000 and $10,000,000
$1,250,000 $25,000,000$2,500,000 $5,000,000 $10,000,000
For state association and Council for Best Practices use only.
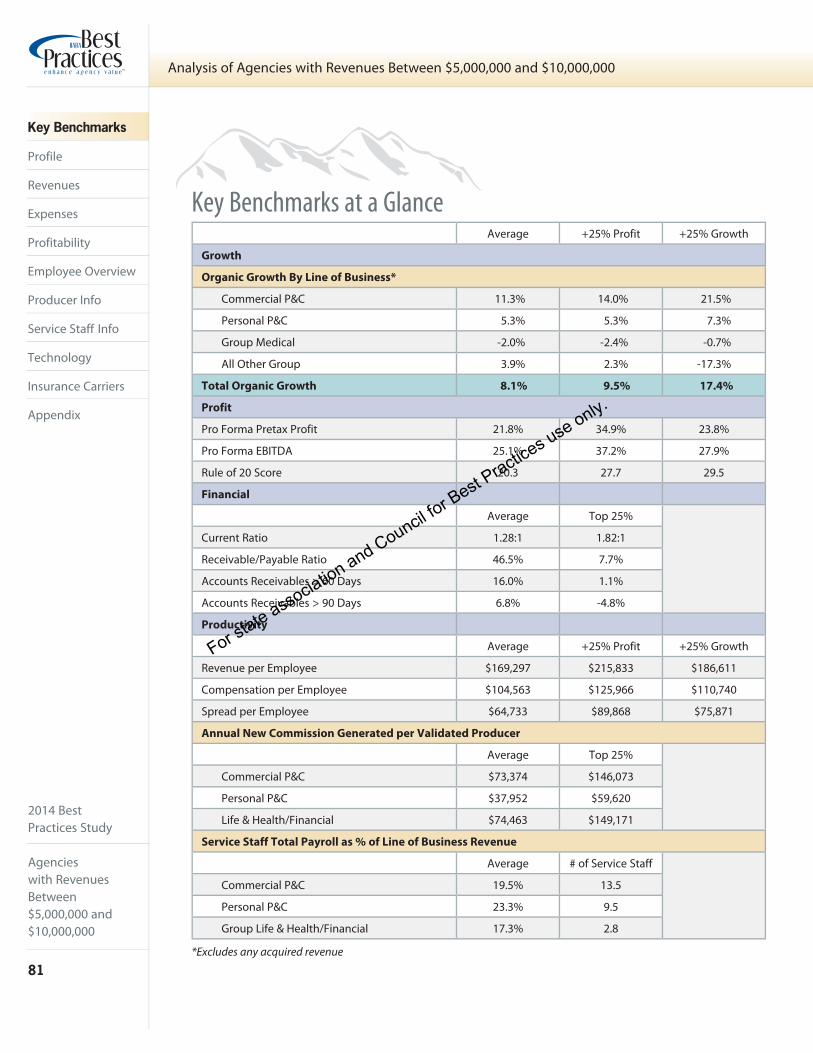
2014 BestPractices Study
Agencieswith RevenuesBetween $5,000,000 and $10,000,000
81
Analysis of Agencies with Revenues Between $5,000,000 and $10,000,000
Key Benchmarks
Profile
Revenues
Expenses
Profitability
Employee Overview
Producer Info
Service Staff Info
Technology
Insurance Carriers
Appendix
Key Benchmarks at a Glance Average +25% Profit +25% Growth
Growth
Organic Growth By Line of Business*
Commercial P&C 11.3% 14.0% 21.5%
Personal P&C 5.3% 5.3% 7.3%
Group Medical -2.0% -2.4% -0.7%
All Other Group 3.9% 2.3% -17.3%
Total Organic Growth 8.1% 9.5% 17.4%
Profit
Pro Forma Pretax Profit 21.8% 34.9% 23.8%
Pro Forma EBITDA 25.1% 37.2% 27.9%
Rule of 20 Score 20.3 27.7 29.5
Financial
Average Top 25%
Current Ratio 1.28:1 1.82:1
Receivable/Payable Ratio 46.5% 7.7%
Accounts Receivables > 60 Days 16.0% 1.1%
Accounts Receivables > 90 Days 6.8% -4.8%
Productivity
Average +25% Profit +25% Growth
Revenue per Employee $169,297 $215,833 $186,611
Compensation per Employee $104,563 $125,966 $110,740
Spread per Employee $64,733 $89,868 $75,871
Annual New Commission Generated per Validated Producer
Average Top 25%
Commercial P&C $73,374 $146,073
Personal P&C $37,952 $59,620
Life & Health/Financial $74,463 $149,171
Service Staff Total Payroll as % of Line of Business Revenue
Average # of Service Staff
Commercial P&C 19.5% 13.5
Personal P&C 23.3% 9.5
Group Life & Health/Financial 17.3% 2.8
*Excludes any acquired revenue
For state association and Council for Best Practices use only.

2014 BestPractices Study
Agencieswith Revenues
Between $5,000,000 and
$10,000,000
82
Analysis of Agencies with Revenues Between $5,000,000 and $10,000,000
Key Benchmarks
Profile
Revenues
Expenses
Profitability
Employee Overview
Producer Info
Service Staff Info
Technology
Insurance Carriers
Appendix
Average Total Revenues: $7,087,464
Population Density of Metropolitan Areas Where Home Offi ce is Located
Average +25% Profi t +25% Growth
Less than 50,000 29.7% 22.2% 22.2%
50,000 – 250,000 21.6% 33.3% 22.2%
250,000 – 1,000,000 13.5% 22.2% 11.1%
More than 1,000,000 35.1% 22.2% 44.4%
Corporate Structure
C 19.4% 22.2% 22.2%
S 63.9% 55.6% 66.7%
Partnership 5.6% 11.1% 11.1%
LLC 11.1% 11.1% 0.0%
Sole Proprietorship 0.0% 0.0% 0.0%
Average Number of Agency Locations
(Main Offi ces and Branch Offi ces) 3.3 3.0 3.4
Total Square Footage of Office Space 13,729 10,479 14,122
# of States in which Offices are Located 1.2 1.1 1.3
Agency has an ESOP 5.4% 22.2% 11.1%
% of Stock Owned by ESOP 60.0% 60.0% 100.0%
Shareholders
Number of Shareholders (excluding ESOP) 4.2 3.4 2.6
High 9.0
Low 1.0
Ownership Percentage
% Owned by Largest Shareholder 57.8% 65.6% 71.4%
High 100.0%
Low 12.5%
Shareholder Age
Current Age of Largest Shareholder 59.3 63.4 59.8
Parent Corporation
Average
% of Agencies Owned by Another Corporation 3.0%
Description of Parent Corporation
Financial Institution 100.0%
National Broker 0.0%
Other 0.0%
Member of Group
% of Agencies Belonging to a Franchise, Cluster, Alliance/Network or Aggregator Group 18.9%
Other included Insurance & Risk Managers, Northern United Agents Alliance, ISU, Insurors Group, Combined Agents of America, Assurex Global, Keystone Insurers
Group, Benefi ts Advisors Network, and Intersure.
Profi le (of Agencies in this Study Group)
For state association and Council for Best Practices use only.
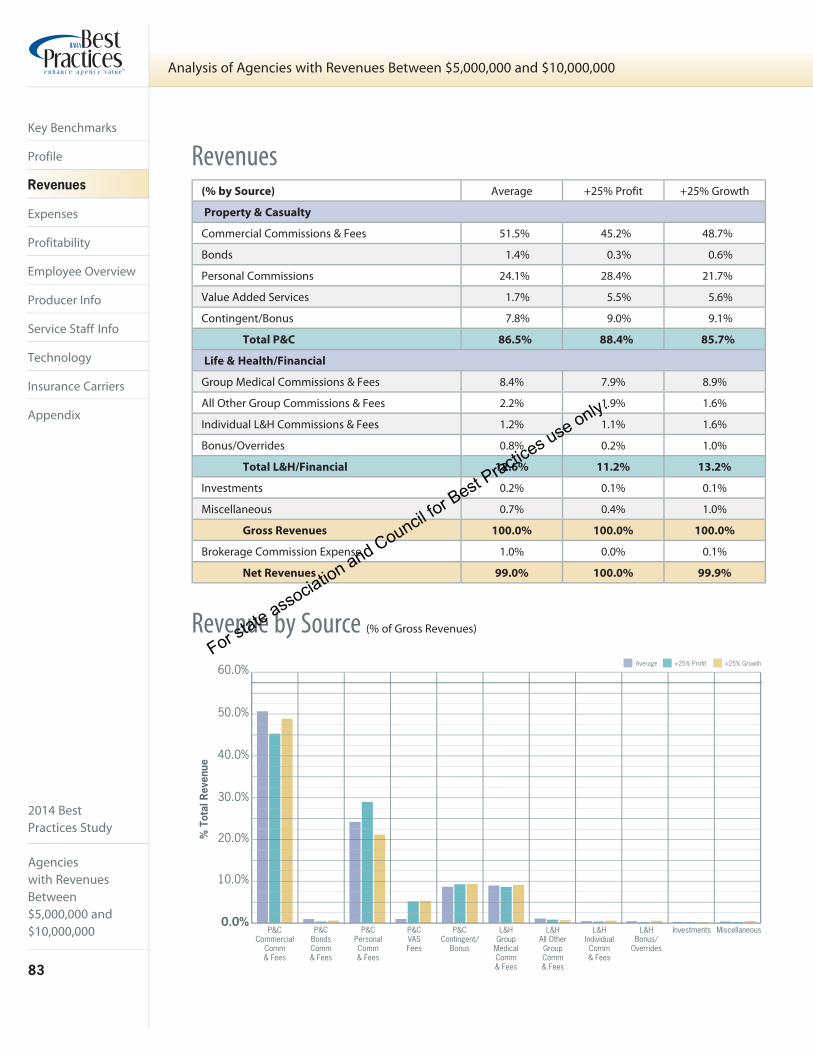
2014 BestPractices Study
Agencieswith RevenuesBetween $5,000,000 and $10,000,000
83
Analysis of Agencies with Revenues Between $5,000,000 and $10,000,000
Key Benchmarks
Profile
Revenues
Expenses
Profitability
Employee Overview
Producer Info
Service Staff Info
Technology
Insurance Carriers
Appendix
Revenues
Revenue by Source (% of Gross Revenues)
(% by Source) Average +25% Profit +25% Growth
Property & Casualty
Commercial Commissions & Fees 51.5% 45.2% 48.7%
Bonds 1.4% 0.3% 0.6%
Personal Commissions 24.1% 28.4% 21.7%
Value Added Services 1.7% 5.5% 5.6%
Contingent/Bonus 7.8% 9.0% 9.1%
Total P&C 86.5% 88.4% 85.7%
Life & Health/Financial
Group Medical Commissions & Fees 8.4% 7.9% 8.9%
All Other Group Commissions & Fees 2.2% 1.9% 1.6%
Individual L&H Commissions & Fees 1.2% 1.1% 1.6%
Bonus/Overrides 0.8% 0.2% 1.0%
Total L&H/Financial 12.6% 11.2% 13.2%
Investments 0.2% 0.1% 0.1%
Miscellaneous 0.7% 0.4% 1.0%
Gross Revenues 100.0% 100.0% 100.0%
Brokerage Commission Expense 1.0% 0.0% 0.1%
Net Revenues 99.0% 100.0% 99.9%
% T
otal
Rev
enue
10.0%
20.0%
30.0%
40.0%
50.0%
60.0%
0.0%P&C
Contingent/Bonus
P&CVASFees
P&CPersonalComm& Fees
P&CBondsComm& Fees
P&CCommercial
Comm& Fees
L&HGroup
MedicalComm& Fees
L&HAll OtherGroupComm& Fees
L&HIndividualComm& Fees
L&HBonus/
Overrides
Investments Miscellaneous
Average +25% Profit +25% Growth
For state association and Council for Best Practices use only.
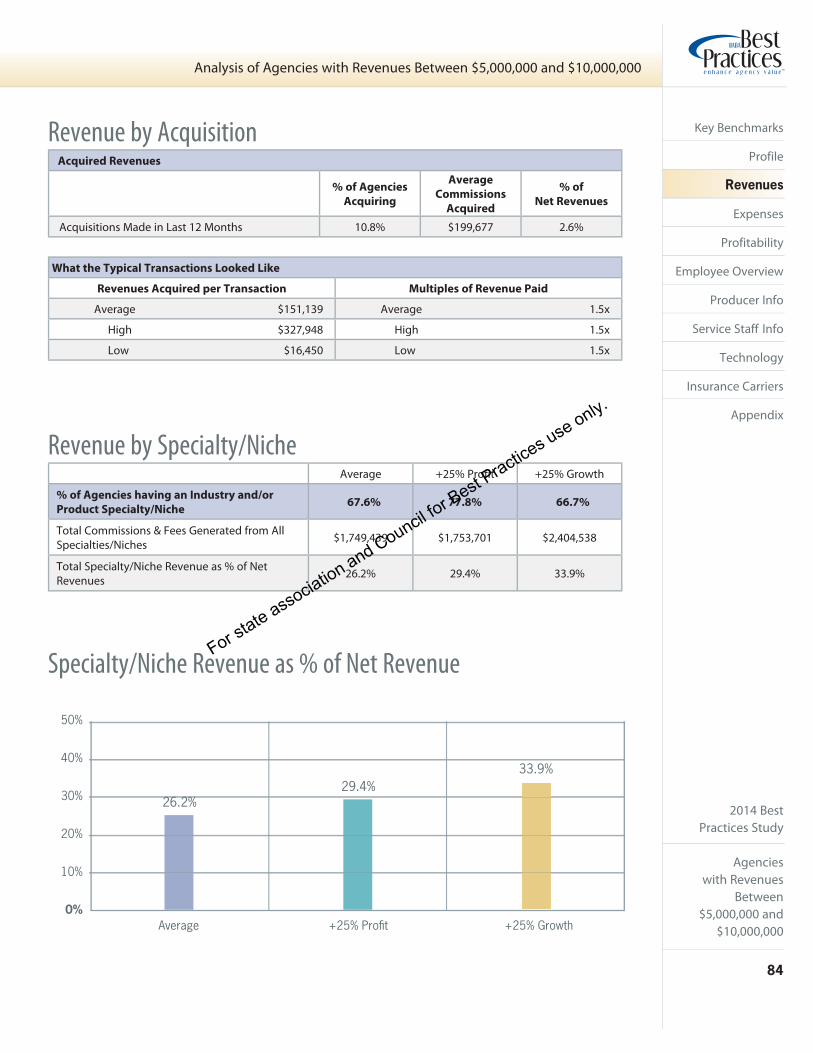
2014 BestPractices Study
Agencieswith Revenues
Between $5,000,000 and
$10,000,000
84
Analysis of Agencies with Revenues Between $5,000,000 and $10,000,000
Key Benchmarks
Profile
Revenues
Expenses
Profitability
Employee Overview
Producer Info
Service Staff Info
Technology
Insurance Carriers
Appendix
What the Typical Transactions Looked Like
Revenues Acquired per Transaction Multiples of Revenue Paid
Average $151,139 Average 1.5x
High $327,948 High 1.5x
Low $16,450 Low 1.5x
Acquired Revenues
% of Agencies
Acquiring
Average
Commissions
Acquired
% of
Net Revenues
Acquisitions Made in Last 12 Months 10.8% $199,677 2.6%
Revenue by Acquisition
Revenue by Specialty/NicheAverage +25% Profit +25% Growth
% of Agencies having an Industry and/or
Product Specialty/Niche67.6% 77.8% 66.7%
Total Commissions & Fees Generated from All Specialties/Niches $1,749,439 $1,753,701 $2,404,538
Total Specialty/Niche Revenue as % of Net Revenues 26.2% 29.4% 33.9%
Specialty/Niche Revenue as % of Net Revenue
Average +25% Profit +25% Growth
10%
20%
30%
40%
50%
26.2%
33.9%
0%
29.4%
For state association and Council for Best Practices use only.
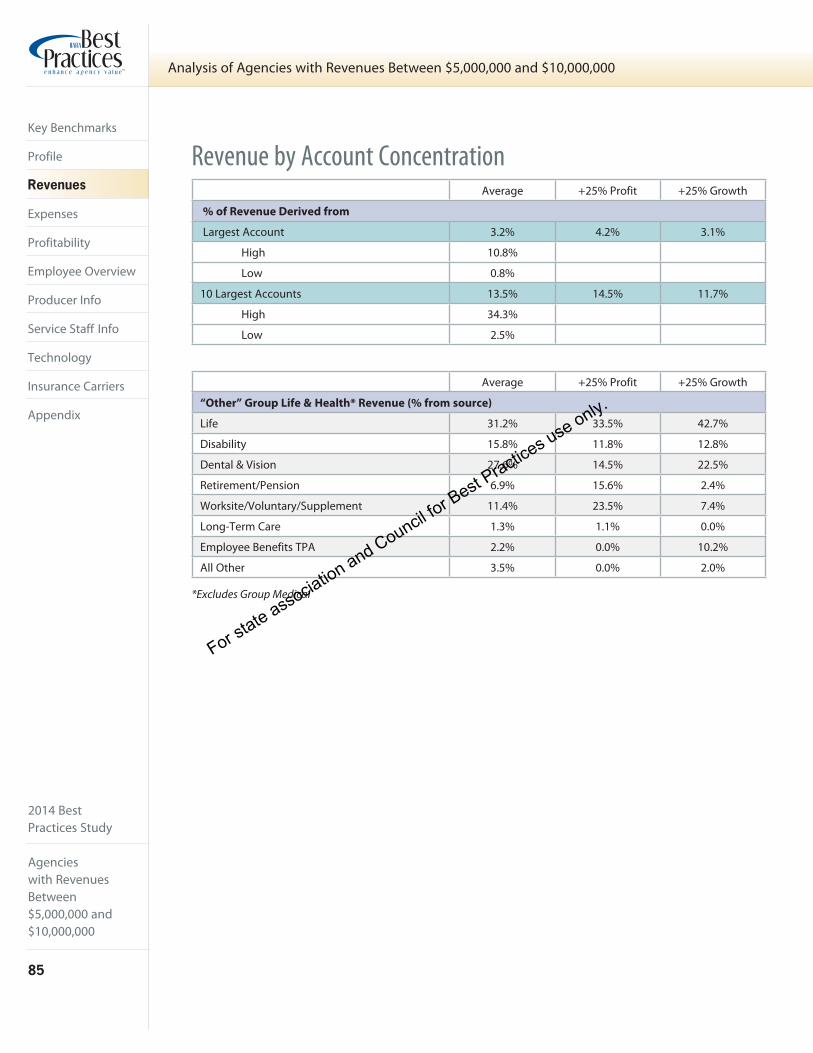
2014 BestPractices Study
Agencieswith RevenuesBetween $5,000,000 and $10,000,000
85
Analysis of Agencies with Revenues Between $5,000,000 and $10,000,000
Key Benchmarks
Profile
Revenues
Expenses
Profitability
Employee Overview
Producer Info
Service Staff Info
Technology
Insurance Carriers
Appendix
Revenue by Account ConcentrationAverage +25% Profit +25% Growth
% of Revenue Derived from
Largest Account 3.2% 4.2% 3.1%
High 10.8%
Low 0.8%
10 Largest Accounts 13.5% 14.5% 11.7%
High 34.3%
Low 2.5%
Average +25% Profit +25% Growth
“Other” Group Life & Health* Revenue (% from source)
Life 31.2% 33.5% 42.7%
Disability 15.8% 11.8% 12.8%
Dental & Vision 27.6% 14.5% 22.5%
Retirement/Pension 6.9% 15.6% 2.4%
Worksite/Voluntary/Supplement 11.4% 23.5% 7.4%
Long-Term Care 1.3% 1.1% 0.0%
Employee Benefits TPA 2.2% 0.0% 10.2%
All Other 3.5% 0.0% 2.0%
*Excludes Group Medical
For state association and Council for Best Practices use only.

2014 BestPractices Study
Agencieswith Revenues
Between $5,000,000 and
$10,000,000
86
Analysis of Agencies with Revenues Between $5,000,000 and $10,000,000
Key Benchmarks
Profile
Revenues
Expenses
Profitability
Employee Overview
Producer Info
Service Staff Info
Technology
Insurance Carriers
Appendix
Revenue by Account Size(as measured by Comm. & Fees – not premium) Average +25% Profit +25% Growth
Commercial P&C
Greater than $25,000
% of Book 33.8% 32.4% 38.4%
# of Accounts 25.8 19.6 27.7
Total Revenue $1,464,122 $1,178,350 $1,576,056
Revenue per Account $56,785 $60,257 $56,966
Between $10,000 and $25,000
% of Book 17.0% 14.9% 17.2%
# of Accounts 47.8 36.0 46.6
Total Revenue $738,105 $543,221 $705,875
Revenue per Account $15,438 $15,089 $15,162
Between $5,000 and $10,000
% of Book 12.0% 12.0% 12.7%
# of Accounts 74.4 64.4 73.2
Total Revenue $521,145 $437,363 $521,224
Revenue per Account $7,004 $6,787 $7,118
Less than $5,000
% of Book 37.2% 40.7% 31.8%
# of Accounts 3,051.3 3,239.8 2,103.0
Total Revenue $1,613,382 $1,482,380 $1,305,340
Revenue per Account $529 $458 $621
(as measured by number of lives) Average +25% Profit +25% Growth
Group L&H/Financial
Over 100 Lives
% of Book 33.8% 37.7% 33.8%
# of Accounts 10.8 10.0 11.2
Total Revenue $465,918 $598,145 $472,804
Revenue per Account $43,341 $59,815 $42,341
50 - 100 Lives
% of Book 17.4% 13.9% 21.9%
# of Accounts 11.8 10.0 14.0
Total Revenue $200,081 $176,817 $261,983
Revenue per Account $17,028 $17,682 $18,713
25 - 50 Lives
% of Book 17.1% 12.1% 16.4%
# of Accounts 21.5 19.6 22.6
Total Revenue $188,941 $152,963 $196,568
Revenue per Account $8,796 $7,804 $8,709
Under 25 Lives
% of Book 31.7% 36.3% 27.9%
# of Accounts 228.2 145.7 182.9
Total Revenue $324,330 $383,441 $334,944
Revenue per Account $1,421 $2,632 $1,832
For state association and Council for Best Practices use only.

2014 BestPractices Study
Agencieswith RevenuesBetween $5,000,000 and $10,000,000
87
Analysis of Agencies with Revenues Between $5,000,000 and $10,000,000
Key Benchmarks
Profile
Revenues
Expenses
Profitability
Employee Overview
Producer Info
Service Staff Info
Technology
Insurance Carriers
Appendix
Revenue Growth by Source
*Insufficient Data
Average +25% Profit +25% Growth
Commercial P&C
Renewals1 97.7% 103.7% 102.8%
New Business2 13.4% 10.3% 18.7%
Acquired Revenues3 0.4% 0.0% 0.2%
Organic Growth4 11.3% 14.0% 21.5%
Total Growth5 11.7% 14.0% 21.8%
Bonds P&C
Renewals1 60.1% 82.5% 45.2%
New Business2 32.1% 13.9% 40.7%
Acquired Revenues3 0.6% 0.0% 0.0%
Organic Growth4 -7..8% -3.6% -14.1%
Total Growth5 -7.2% -3.6% -14.1%
Personal P&C
Renewals1 94.5% 95.1% 94.5%
New Business2 10.7% 10.2% 12.8%
Acquired Revenues3 0.8% 0.1% 1.4%
Organic Growth4 5.3% 5.3% 7.3%
Total Growth5 6.1% 5.4% 8.7%
Value Added Services P&C
Renewals1 83.8% 94.0% 95.2%
New Business2 17.2% 13.9% 16.6%
Acquired Revenues3 0.0% 0.0% 0.0%
Organic Growth4 0.9% 7.9% 11.8%
Total Growth5 0.9% 7.9% 11.8%
1Renewal Revenues as a % of prior year’s total revenues for this line of business. This figure is impacted by attrition (loss or retention of accounts) and by changes in premium and commission levels. The higher the %, the more favorable the results.
2New Revenues as a % of prior year’s total revenues for this line of business. The higher the %, the more favorable the results.
3Acquired Revenues as a % of prior year’s total revenues for this line of business. The % indicates the significance of acquired business.
4Growth in Revenues from prior year excluding acquired revenues.
5Growth in Revenues from prior year including acquired revenues.
For state association and Council for Best Practices use only.
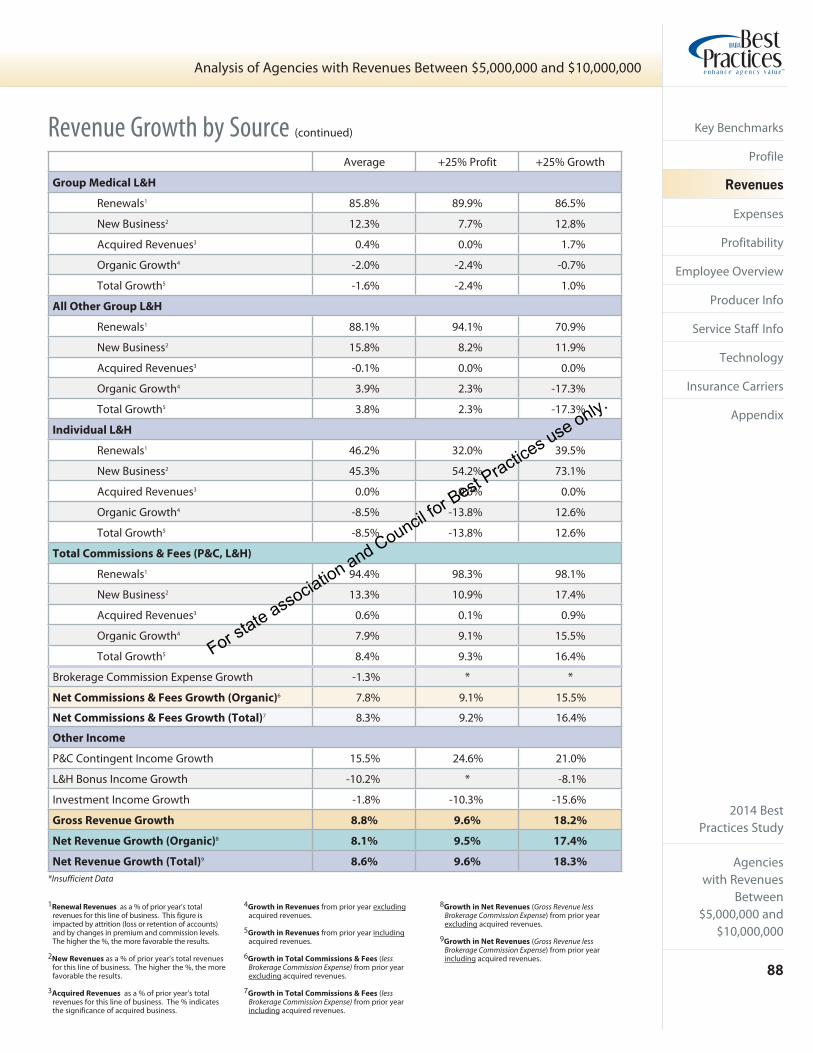
2014 BestPractices Study
Agencieswith Revenues
Between $5,000,000 and
$10,000,000
88
Analysis of Agencies with Revenues Between $5,000,000 and $10,000,000
Key Benchmarks
Profile
Revenues
Expenses
Profitability
Employee Overview
Producer Info
Service Staff Info
Technology
Insurance Carriers
Appendix
Revenue Growth by Source (continued)
*Insufficient Data
Average +25% Profit +25% Growth
Group Medical L&H
Renewals1 85.8% 89.9% 86.5%
New Business2 12.3% 7.7% 12.8%
Acquired Revenues3 0.4% 0.0% 1.7%
Organic Growth4 -2.0% -2.4% -0.7%
Total Growth5 -1.6% -2.4% 1.0%
All Other Group L&H
Renewals1 88.1% 94.1% 70.9%
New Business2 15.8% 8.2% 11.9%
Acquired Revenues3 -0.1% 0.0% 0.0%
Organic Growth4 3.9% 2.3% -17.3%
Total Growth5 3.8% 2.3% -17.3%
Individual L&H
Renewals1 46.2% 32.0% 39.5%
New Business2 45.3% 54.2% 73.1%
Acquired Revenues3 0.0% 0.0% 0.0%
Organic Growth4 -8.5% -13.8% 12.6%
Total Growth5 -8.5% -13.8% 12.6%
Total Commissions & Fees (P&C, L&H)
Renewals1 94.4% 98.3% 98.1%
New Business2 13.3% 10.9% 17.4%
Acquired Revenues3 0.6% 0.1% 0.9%
Organic Growth4 7.9% 9.1% 15.5%
Total Growth5 8.4% 9.3% 16.4%
Brokerage Commission Expense Growth -1.3% * *
Net Commissions & Fees Growth (Organic)6 7.8% 9.1% 15.5%
Net Commissions & Fees Growth (Total)7 8.3% 9.2% 16.4%
Other Income
P&C Contingent Income Growth 15.5% 24.6% 21.0%
L&H Bonus Income Growth -10.2% * -8.1%
Investment Income Growth -1.8% -10.3% -15.6%
Gross Revenue Growth 8.8% 9.6% 18.2%
Net Revenue Growth (Organic)8 8.1% 9.5% 17.4%
Net Revenue Growth (Total)9 8.6% 9.6% 18.3%
1Renewal Revenues as a % of prior year’s total revenues for this line of business. This figure is impacted by attrition (loss or retention of accounts) and by changes in premium and commission levels. The higher the %, the more favorable the results.
2New Revenues as a % of prior year’s total revenues for this line of business. The higher the %, the more favorable the results.
3Acquired Revenues as a % of prior year’s total revenues for this line of business. The % indicates the significance of acquired business.
4Growth in Revenues from prior year excluding acquired revenues.
5Growth in Revenues from prior year including acquired revenues.
6Growth in Total Commissions & Fees (less Brokerage Commission Expense) from prior year excluding acquired revenues.
7Growth in Total Commissions & Fees (less Brokerage Commission Expense) from prior year including acquired revenues.
8Growth in Net Revenues (Gross Revenue less Brokerage Commission Expense) from prior year excluding acquired revenues.
9Growth in Net Revenues (Gross Revenue less Brokerage Commission Expense) from prior year including acquired revenues.
For state association and Council for Best Practices use only.

2014 BestPractices Study
Agencieswith RevenuesBetween $5,000,000 and $10,000,000
89
Analysis of Agencies with Revenues Between $5,000,000 and $10,000,000
Key Benchmarks
Profile
Revenues
Expenses
Profitability
Employee Overview
Producer Info
Service Staff Info
Technology
Insurance Carriers
Appendix
Revenue Growth by Source (continued)
Historical Organic Growth (in Net Revenue)
Future GrowthPercentage of agencies considering line of business as very important to growing agency’s revenue over the next 3 years
Surety-Bonding 27.0%2
Personal P&C 78.4%7
64.9%9Small Commercial P&C
Individual Life & Health 18.9%1
Group Medical/Health Insurance 64.9%9
45.9%9All Other Group Benefits
0% 10% 20% 30% 40% 50% 60% 70% 80% 90% 100%
2007 2008 2009 2010 2011 2012 2013 2014
10%
–10%
20%
30%
40%
12.0%14.4%
21.0%
4.3% 5.9%
12.4%
0.2% 1.0%
7.7%7 7%
0.3% 0.9%
11.0%
–6.0%
0.7%
7.5%7 5%3.2% 4.3%
9.6% 8.9%8 9% 9.2%
18.8%18 8%
8.1%8 1% 9.5%
17.4%17 4%
0%
Average +25% Profit +25% Growth
For state association and Council for Best Practices use only.

2014 BestPractices Study
Agencieswith Revenues
Between $5,000,000 and
$10,000,000
90
Analysis of Agencies with Revenues Between $5,000,000 and $10,000,000
Key Benchmarks
Profile
Revenues
Expenses
Profitability
Employee Overview
Producer Info
Service Staff Info
Technology
Insurance Carriers
Appendix
Expenses (as % of Net Revenues)
Average +25% Profit +25% Growth
Compensation Expenses
Payroll: Employee 50.2% 43.5% 48.3%
Payroll: “Non-Employee” - 1099 Producers/Temp Help 3.0% 6.6% 2.7%
Total Payroll 53.2% 50.1% 51.0%
Benefits: Payroll Taxes 3.3% 2.7% 2.9%
Benefits: Retirement 1.5% 1.4% 1.2%
Benefits: Insurance 3.4% 2.6% 3.2%
Benefits: Other 0.3% 0.0% 0.1%
Total Benefits 8.5% 6.8% 7.4%
Total Compensation 61.7% 56.9% 58.4%
Selling Expenses
T&E/Conventions 1.0% 0.5% 0.8%
Auto Expenditures 0.8% 0.7% 0.8%
Auto Depreciation 0.1% 0.3% 0.3%
Total Auto 0.9% 1.0% 1.1%
Advertising/Promotions 1.3% 1.3% 1.1%
Total Selling 3.2% 2.7% 3.0%
Operating Expenses
Occupancy Expenditures 4.2% 4.4% 4.1%
Occupancy Depreciation/Amortization 0.1% 0.1% 0.1%
Total Occupancy 4.3% 4.5% 4.2%
Office Equipment Expenditures 0.5% 0.3% 0.3%
Office Equipment Depreciation 0.5% 0.1% 0.3%
Total Office Equipment 0.9% 0.3% 0.6%
IT (Information Technology) 1.9% 1.7% 1.9%
IT Depreciation/Amortization 0.2% 0.2% 0.1%
Total IT 2.1% 1.9% 2.0%
Telephone 0.7% 0.6% 0.5%
Postage 0.4% 0.4% 0.4%
Supplies/Printing 0.7% 0.6% 0.7%
Dues/Subscriptions/Contributions 0.8% 0.5% 0.4%
Taxes/Licenses 0.5% 0.4% 0.4%
Insurance 1.5% 1.5% 1.1%
Professional Fees 0.8% 0.7% 0.7%
Bad Debts 0.1% 0.0% 0.1%
Outside Services 0.6% 0.3% 0.6%
Education/Training 0.4% 0.3% 0.3%
Miscellaneous 0.6% 0.5% 0.5%
Total Operating 14.5% 12.5% 12.3%
continued on next page
For state association and Council for Best Practices use only.
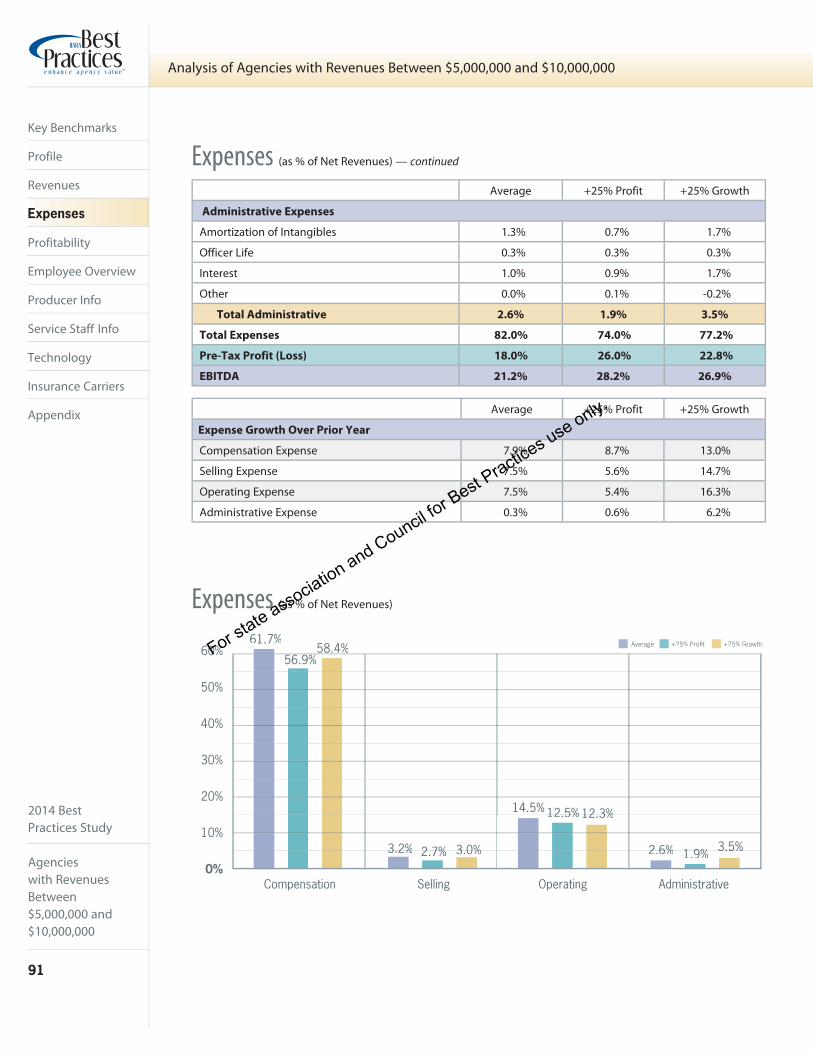
2014 BestPractices Study
Agencieswith RevenuesBetween $5,000,000 and $10,000,000
91
Analysis of Agencies with Revenues Between $5,000,000 and $10,000,000
Key Benchmarks
Profile
Revenues
Expenses
Profitability
Employee Overview
Producer Info
Service Staff Info
Technology
Insurance Carriers
Appendix
Average +25% Profit +25% Growth
Administrative Expenses
Amortization of Intangibles 1.3% 0.7% 1.7%
Officer Life 0.3% 0.3% 0.3%
Interest 1.0% 0.9% 1.7%
Other 0.0% 0.1% -0.2%
Total Administrative 2.6% 1.9% 3.5%
Total Expenses 82.0% 74.0% 77.2%
Pre-Tax Profit (Loss) 18.0% 26.0% 22.8%
EBITDA 21.2% 28.2% 26.9%
Average +25% Profit +25% Growth
Expense Growth Over Prior Year
Compensation Expense 7.9% 8.7% 13.0%
Selling Expense 7.5% 5.6% 14.7%
Operating Expense 7.5% 5.4% 16.3%
Administrative Expense 0.3% 0.6% 6.2%
Expenses (as % of Net Revenues) — continued
Expenses (as % of Net Revenues)
Compensation Selling Operating Administrative0%
10%
20%
30%
40%
50%
60%Average +25% Profit +25% Growth
3.2%3 2% 2.7%2 7% 3.0%3 0%
14.5% 12.5%12 5% 12.3%12 3%
2.6%2 6% 1.9%1 9%3.5%3.5%
61.7%58.4%
56.9%For state association and Council fo
r Best Practices use only.

2014 BestPractices Study
Agencieswith Revenues
Between $5,000,000 and
$10,000,000
92
Analysis of Agencies with Revenues Between $5,000,000 and $10,000,000
Key Benchmarks
Profile
Revenues
Expenses
Profitability
Employee Overview
Producer Info
Service Staff Info
Technology
Insurance Carriers
Appendix
Average +25% Profit +25% Growth
Revenues (as % of Gross Revenue)
Commercial Lines 51.5% 45.2% 48.7%
Bonds 1.4% 0.3% 0.6%
Personal Lines 24.1% 28.4% 21.7%
VAS - P&C 1.7% 5.5% 5.6%
Contingent/Bonus 7.8% 9.0% 9.1%
Group Medical 8.4% 7.9% 8.9%
All Other Group 2.2% 1.9% 1.6%
Individual Life & Health 1.2% 1.1% 1.6%
Bonus/Overrides 0.8% 0.2% 1.0%
Investments 0.2% 0.1% 0.1%
Miscellaneous 0.7% 0.4% 1.0%
Total Revenues 100.0% 100.0% 100.0%
Brokerage Commission Expense 1.0% 0.0% 0.1%
Net Revenues 99.0% 100.0% 99.9%
Expenses (as % of Net Revenues)
Compensation 61.7% 56.9% 58.4%
Selling 3.2% 2.7% 3.0%
Operating 14.5% 12.5% 12.3%
Administrative 2.6% 1.9% 3.5%
Total Expenses 82.0% 74.0% 77.2%
Average +25% Profit +25% Growth
Pre-Tax Profit 18.0% 26.0% 22.8%
Pro Forma Pre-Tax Profit1 21.8% 34.9% 23.8%
Operating Pre-Tax Profit2 10.1% 18.3% 14.0%
EBITDA3 21.2% 28.2% 26.9%
Pro Forma EBITDA4 25.1% 37.2% 27.9%
1Pre-tax Profits if discretionary expenses are eliminated and all owners compensated as employees
2Pre-tax Profits excluding contingents, bonus and investment income
3EBITDA—Earnings Before Interest Taxes Depreciation and Amortization
4EBITDA if discretionary expenses are eliminated and all owners compensated as employees
Profit/Loss Summary
Profit/Loss (as % of Net Revenues)
For state association and Council for Best Practices use only.

2014 BestPractices Study
Agencieswith RevenuesBetween $5,000,000 and $10,000,000
93
Analysis of Agencies with Revenues Between $5,000,000 and $10,000,000
Key Benchmarks
Profile
Revenues
Expenses
Profitability
Employee Overview
Producer Info
Service Staff Info
Technology
Insurance Carriers
Appendix
Profitability
About EBITDA Margin and Operating Margin
EBITDA Margin is calculated by dividing a firm’s EBITDA (Earnings Before Interest, Taxes, Depreciation and Amortization) by the firm’s net revenues.
Pro Forma EBITDA Margin is calculated by dividing a firm’s Pro Forma EBITDA by the firm’s Pro Forma net revenue.
Operating Margin is calculated as EBITDA less contingent income divided by Pro Forma net revenues less contingent income.
Historical EBITDA Margin & Operating Margin (for Average Group)
5%
10%
15%
20%
25%
30%
35%
0%2008
EBITDA Margin Operating Margin
18.4%
29.5%
24.7%22.9%22 9% 22.9%22 9%
4.5%
20.7%
6.5%
17.6% 16.8%6 8%
3.4%
16.3%6 3%
3.7%5.5%
21.0% 21.2%21 2%
25.1%
9.6%10.1%
20102007 2009 2011 2012 2013 2014
Pro Forma EBITDA
16.6%6 6%
21.0% 21.9%
25.2%
For state association and Council for Best Practices use only.

2014 BestPractices Study
Agencieswith Revenues
Between $5,000,000 and
$10,000,000
94
Analysis of Agencies with Revenues Between $5,000,000 and $10,000,000
Key Benchmarks
Profile
Revenues
Expenses
Profitability
Employee Overview
Producer Info
Service Staff Info
Technology
Insurance Carriers
Appendix
Average Top 25%
Balance Sheet
Current Ratio 1.28:1 1.82:1
Tangible Net Worth (% of Net Revenue) 10.2% 27.3%
Receivables/Payable Ratio 46.5% 7.7%
Aged Receivables
% Receivables Aged Past 60 Days 16.0% 1.1%
% Receivables Aged Past 90 Days 6.8% -4.8%
Average +25% Profit +25% Growth
Agency Billed vs. Direct Billed by Carrier
% of P&C Revenues that are Agency Billed 28.3% 20.5% 20.4%
% of P&C Revenues that are Direct Billed 71.7% 79.5% 79.6%
Financial Stability
Accounts Receivable
The Rule of 20 is a simple growth and profitability balancing equation that provides a quick way to determine whether or not an agency is creating value for its shareholders. It states that an agency will drive industry-standard shareholder returns if the sum of (a) its organic growth rate and (b) 1/2 of its EBITDA margin equals or exceeds 20.
Generally speaking, an outcome of 20 or more, regardless of the different combinations of growth and profitability, indicates that the agency’s shareholders can expect to earn 15% -17% per year through stock price appreciation and/or shareholder distributions.
• Provides a tool to benchmark agency performance
• Helps frame the trade-off between growth and profitability
What is the Rule of 20?
Average +25% Profit Average +25% Growth Average
Rule of 20 20.3 27.7 29.5
Public BrokersOrganicGrowth
EBITDA Margin
Rule of 20 Outcome
Willis Group 4.9% 24.0% 16.9
Aon 3.0% 20.9% 13.5
Brown & Brown 6.8% 33.5% 23.6
Arthur J. Gallagher 6.5% 19.9% 16.5
Marsh & McLennan 3.0% 20.7% 13.4
Rule of 20 Outcome
Organic
Revenue
Growth
1/2 of
EBITDA
Margin
Rule of 20 Score +=
For state association and Council for Best Practices use only.
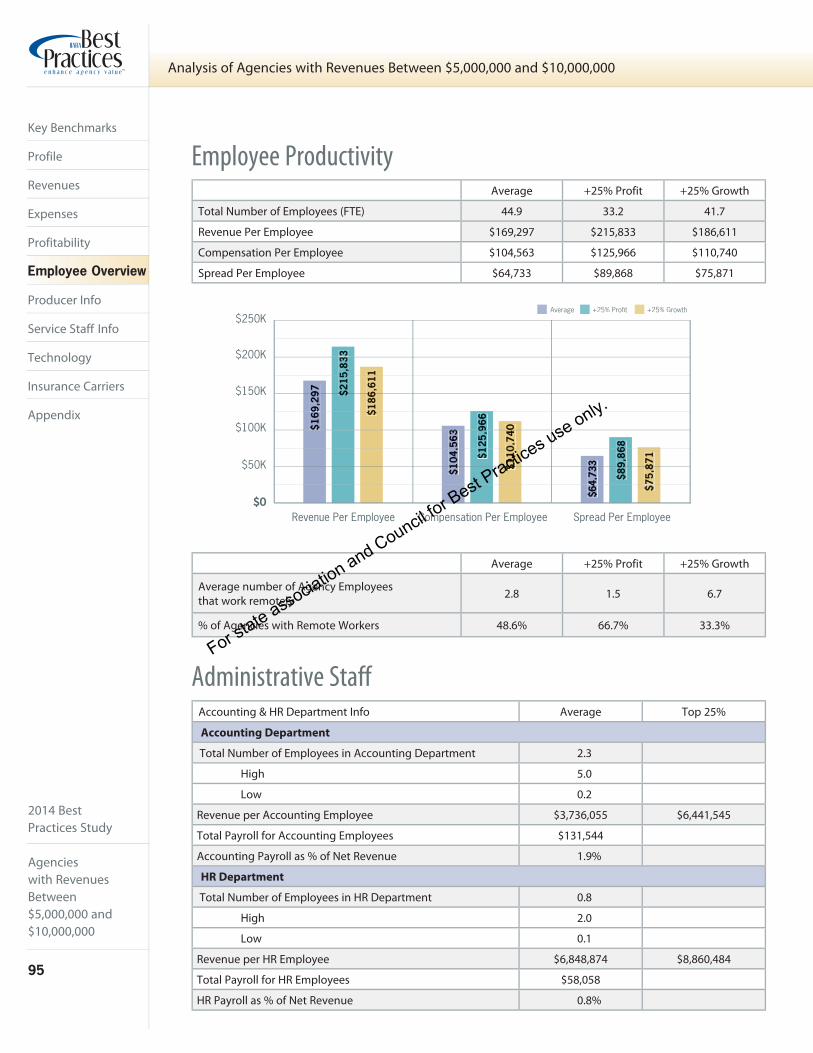
2014 BestPractices Study
Agencieswith RevenuesBetween $5,000,000 and $10,000,000
95
Analysis of Agencies with Revenues Between $5,000,000 and $10,000,000
Key Benchmarks
Profile
Revenues
Expenses
Profitability
Employee Overview
Producer Info
Service Staff Info
Technology
Insurance Carriers
Appendix
Average +25% Profit +25% Growth
Total Number of Employees (FTE) 44.9 33.2 41.7
Revenue Per Employee $169,297 $215,833 $186,611
Compensation Per Employee $104,563 $125,966 $110,740
Spread Per Employee $64,733 $89,868 $75,871
Average +25% Profit +25% Growth
Average number of Agency Employees that work remotely 2.8 1.5 6.7
% of Agencies with Remote Workers 48.6% 66.7% 33.3%
Employee Productivity
Administrative Staff Accounting & HR Department Info Average Top 25%
Accounting Department
Total Number of Employees in Accounting Department 2.3
High 5.0
Low 0.2
Revenue per Accounting Employee $3,736,055 $6,441,545
Total Payroll for Accounting Employees $131,544
Accounting Payroll as % of Net Revenue 1.9%
HR Department
Total Number of Employees in HR Department 0.8
High 2.0
Low 0.1
Revenue per HR Employee $6,848,874 $8,860,484
Total Payroll for HR Employees $58,058
HR Payroll as % of Net Revenue 0.8%
Revenue Per Employee Compensation Per Employee Spread Per Employee$0
$50K
$100K
$150K
$200K
$250K$1
69,2
979$
9
$215
,8333
$5
$186
,611
6$
$104
,5633
1,
$125
,9669
1
$110
,7400
$0
$64,
7333
4 $89,
868
96
Average +25% Profit +25% Growth
$75,
871
8For state association and Council fo
r Best Practices use only.
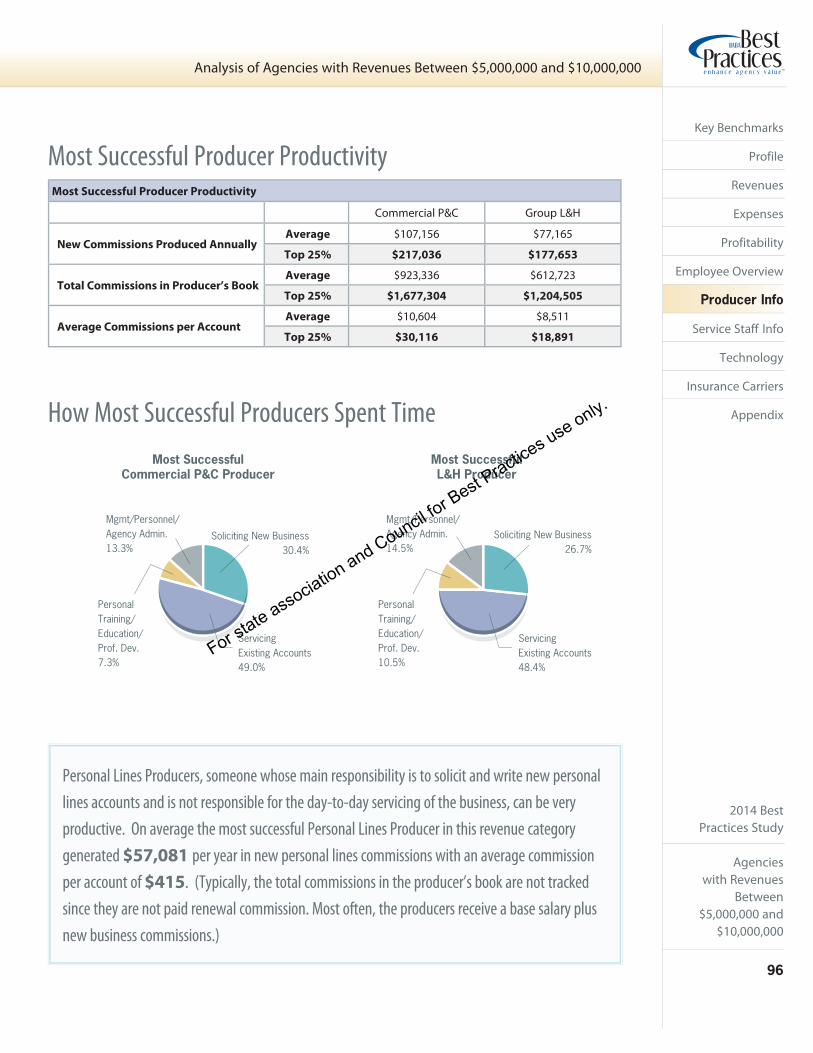
2014 BestPractices Study
Agencieswith Revenues
Between $5,000,000 and
$10,000,000
96
Analysis of Agencies with Revenues Between $5,000,000 and $10,000,000
Key Benchmarks
Profile
Revenues
Expenses
Profitability
Employee Overview
Producer Info
Service Staff Info
Technology
Insurance Carriers
Appendix
Most Successful Producer Productivity
Commercial P&C Group L&H
New Commissions Produced Annually Average $107,156 $77,165
Top 25% $217,036 $177,653
Total Commissions in Producer’s Book Average $923,336 $612,723
Top 25% $1,677,304 $1,204,505
Average Commissions per Account Average $10,604 $8,511
Top 25% $30,116 $18,891
Most Successful Producer Productivity
How Most Successful Producers Spent Time
Personal Lines Producers, someone whose main responsibility is to solicit and write new personal
lines accounts and is not responsible for the day-to-day servicing of the business, can be very
productive. On average the most successful Personal Lines Producer in this revenue category
generated $57,081 per year in new personal lines commissions with an average commission
per account of $415. (Typically, the total commissions in the producer’s book are not tracked
since they are not paid renewal commission. Most often, the producers receive a base salary plus
new business commissions.)
Most SuccessfulCommercial P&C Producer
Most SuccessfulL&H Producer
PersonalTraining/Education/Prof. Dev.7.3%
Soliciting New Business30.4%
Mgmt/Personnel/Agency Admin.13.3%
ServicingExisting Accounts49.0%
PersonalTraining/Education/Prof. Dev.10.5%
Soliciting New Business26.7%
Mgmt/Personnel/Agency Admin.14.5%
ServicingExisting Accounts48.4%
For state association and Council for Best Practices use only.
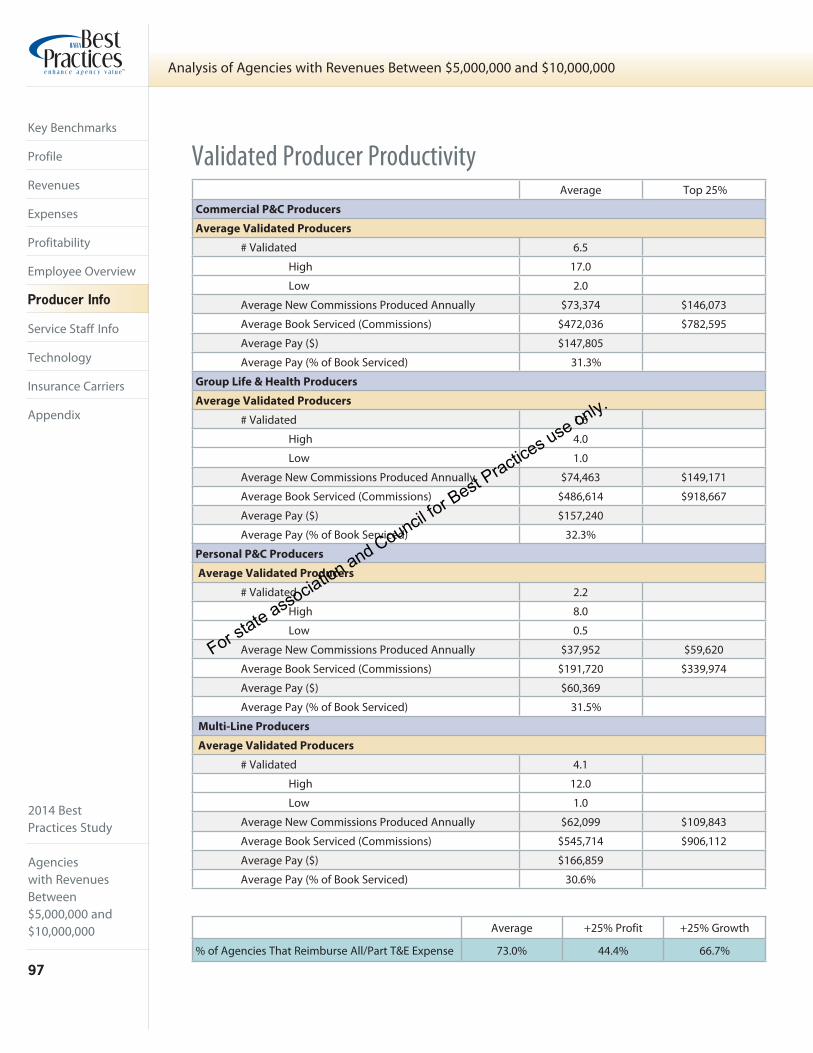
2014 BestPractices Study
Agencieswith RevenuesBetween $5,000,000 and $10,000,000
97
Analysis of Agencies with Revenues Between $5,000,000 and $10,000,000
Key Benchmarks
Profile
Revenues
Expenses
Profitability
Employee Overview
Producer Info
Service Staff Info
Technology
Insurance Carriers
Appendix
Average Top 25%
Commercial P&C Producers
Average Validated Producers
# Validated 6.5
High 17.0
Low 2.0
Average New Commissions Produced Annually $73,374 $146,073
Average Book Serviced (Commissions) $472,036 $782,595
Average Pay ($) $147,805
Average Pay (% of Book Serviced) 31.3%
Group Life & Health Producers
Average Validated Producers
# Validated 1.6
High 4.0
Low 1.0
Average New Commissions Produced Annually $74,463 $149,171
Average Book Serviced (Commissions) $486,614 $918,667
Average Pay ($) $157,240
Average Pay (% of Book Serviced) 32.3%
Personal P&C Producers
Average Validated Producers
# Validated 2.2
High 8.0
Low 0.5
Average New Commissions Produced Annually $37,952 $59,620
Average Book Serviced (Commissions) $191,720 $339,974
Average Pay ($) $60,369
Average Pay (% of Book Serviced) 31.5%
Multi-Line Producers
Average Validated Producers
# Validated 4.1
High 12.0
Low 1.0
Average New Commissions Produced Annually $62,099 $109,843
Average Book Serviced (Commissions) $545,714 $906,112
Average Pay ($) $166,859
Average Pay (% of Book Serviced) 30.6%
Validated Producer Productivity
Average +25% Profit +25% Growth
% of Agencies That Reimburse All/Part T&E Expense 73.0% 44.4% 66.7%
For state association and Council for Best Practices use only.
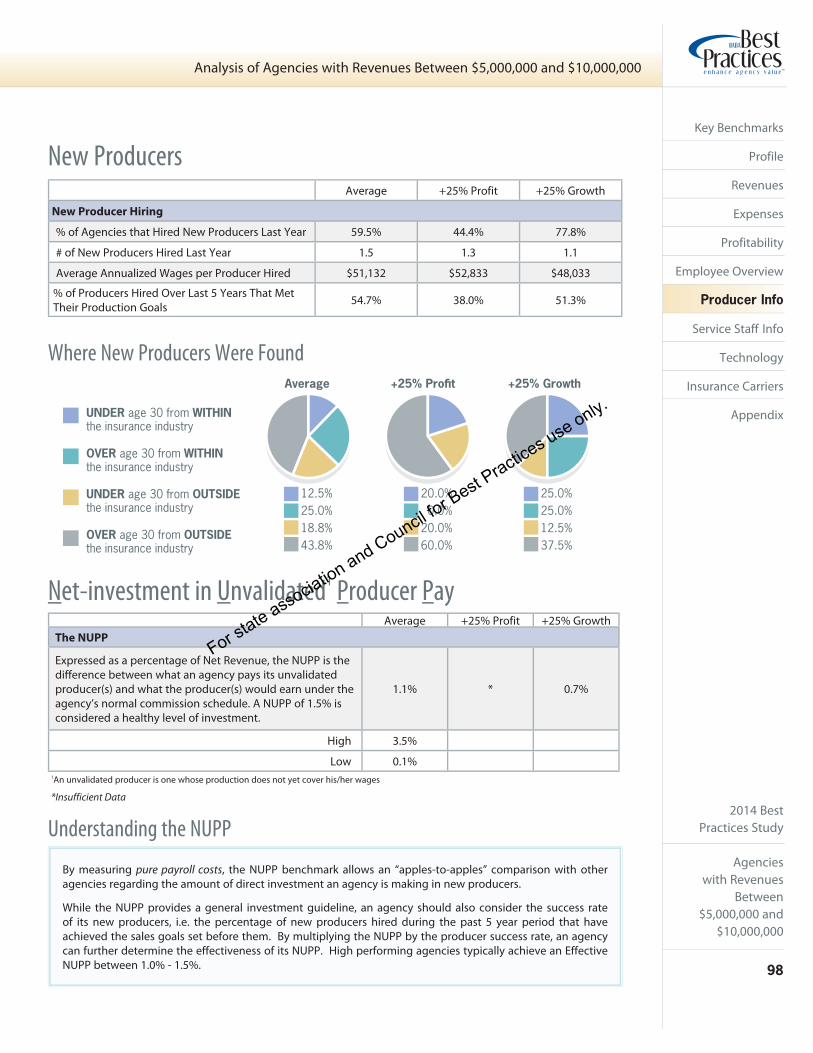
2014 BestPractices Study
Agencieswith Revenues
Between $5,000,000 and
$10,000,000
98
Analysis of Agencies with Revenues Between $5,000,000 and $10,000,000
Key Benchmarks
Profile
Revenues
Expenses
Profitability
Employee Overview
Producer Info
Service Staff Info
Technology
Insurance Carriers
Appendix
Where New Producers Were Found
Average +25% Profit +25% Growth
New Producer Hiring
% of Agencies that Hired New Producers Last Year 59.5% 44.4% 77.8%
# of New Producers Hired Last Year 1.5 1.3 1.1
Average Annualized Wages per Producer Hired $51,132 $52,833 $48,033
% of Producers Hired Over Last 5 Years That Met Their Production Goals 54.7% 38.0% 51.3%
New Producers
Average +25% Profit +25% GrowthThe NUPP
Expressed as a percentage of Net Revenue, the NUPP is the difference between what an agency pays its unvalidated producer(s) and what the producer(s) would earn under the agency’s normal commission schedule. A NUPP of 1.5% is considered a healthy level of investment.
1.1% * 0.7%
High 3.5%
Low 0.1%
By measuring pure payroll costs, the NUPP benchmark allows an “apples-to-apples” comparison with other agencies regarding the amount of direct investment an agency is making in new producers.
While the NUPP provides a general investment guideline, an agency should also consider the success rate of its new producers, i.e. the percentage of new producers hired during the past 5 year period that have achieved the sales goals set before them. By multiplying the NUPP by the producer success rate, an agency can further determine the effectiveness of its NUPP. High performing agencies typically achieve an Effective NUPP between 1.0% - 1.5%.
1An unvalidated producer is one whose production does not yet cover his/her wages
Net-investment in Unvalidated1 Producer Pay
Understanding the NUPP
*Insufficient Data
UNDER age 30 from WITHINthe insurance industry
OVER age 30 from WITHINthe insurance industry
UNDER age 30 from OUTSIDEthe insurance industry
OVER age 30 from OUTSIDEthe insurance industry
+25% ProfitAverage +25% Growth
12.5%25.0%18.8%43.8%
20.0%0.0%
20.0%60.0%
25.0%25.0%12.5%37.5%
For state association and Council for Best Practices use only.

2014 BestPractices Study
Agencieswith RevenuesBetween $5,000,000 and $10,000,000
99
Analysis of Agencies with Revenues Between $5,000,000 and $10,000,000
Key Benchmarks
Profile
Revenues
Expenses
Profitability
Employee Overview
Producer Info
Service Staff Info
Technology
Insurance Carriers
Appendix
Average +25% Profit +25% Growth
Total # of Service Staff
(as defined above; excludes any TPA service staff) 26.0 20.2 23.6
% of Peer Agencies Having
Separate/Dedicated Marketing Department 56.8% 44.4% 44.4%
# of Marketing Staff 1.7 1.0 1.8
Separate/Dedicated Claims Department 62.2% 55.6% 44.4%
# of Claims Staff 1.8 1.4 1.8
Average +25% Profit +25% Growth
% of Peer Agencies Having
Workers Comp TPA 2.7% 0.0% 0.0%
# of Service Staff * * *
Total TPA Revenues Serviced * * *
Group Benefits TPA 8.1% 0.0% 0.0%
# of Service Staff 2.2 * *
Total TPA Revenues Serviced $109,718 * *
TPA Service Staff
Service & Sales Support Staff Definition• Typically non-commissioned employees• Provide service to the agency’s clients• Support producers in the sale of new business and retention of existing business
Some service positions may earn commission income but typically a majority of their pay is fixed and a majority of their time is devoted to service rather than the soliciting of new clients.
Service & Sales Support Positions1 Included in Full-time Equivalent Headcounts• Account Executives (AE) - senior level service representatives• Account Managers, Customer Service Representatives (CSRs)• Assistant CSRs, Processors• Claims Staff• Placers/Marketers• Department Managers - who also service clients1Position titles are general categories since specific job titles vary from agency to agency
Administrative personnel such as accounting, mail room, and reception are not included in service benchmarks unless a portion of their time is dedicated to service.
*Insufficient Data
Service Staff Overview
Service Staff Productivity
For state association and Council for Best Practices use only.

2014 BestPractices Study
Agencieswith Revenues
Between $5,000,000 and
$10,000,000
100
Analysis of Agencies with Revenues Between $5,000,000 and $10,000,000
Key Benchmarks
Profile
Revenues
Expenses
Profitability
Employee Overview
Producer Info
Service Staff Info
Technology
Insurance Carriers
Appendix
Service/Sales Support Staff
Average Top 25%
Commercial P&C Service/Sales Support
Number 13.5
High 27.0
Low 3.5
Average Revenue per Staff $307,824 $489,678
Total Commercial Service Payroll ($) $696,605
Payroll (as % of Total Commercial Revenue) 19.5%
Bonds P&C Service/Sales Support Staff
Number 1.4
High 4.0
Low 0.1
Average Revenue per Staff $186,446 $314,128
Total Bond Service Payroll ($) $79,338
Payroll (as % of Total Bond Revenue) 31.7%
Personal P&C Service/Sales Support Staff
Number 9.5
High 31.6
Low 1.0
Average Revenue per Staff $200,849 $283,475
Total Personal Service Payroll ($) $389,453
Payroll (as % of Total Personal Revenue) 23.3%
Group L&H Service/Sales Support Staff
Number 2.8
High 6.5
Low 0.4
Average Revenue per Staff $372,264 $587,381
Total Group L&H Service Payroll ($) $144,549
Payroll (as % of Total Group L&H Revenue) 17.3%
Individual L&H Service/Sales Support Staff
Number 0.9
High 2.0
Low 0.1
Average Revenue per Staff $95,113 $265,281
Total Individual L&H Service Payroll ($) $32,626
Payroll (as % of Total Individual L&H Revenue) 35.5%
Multi-Line Service/Sales Support Staff
Number *
High *
Low *
Average Revenue per Staff * *
Total Multi-Line Service Payroll ($) *
Payroll (as % of Total Multi-Line Revenue) **Insufficient Data
For state association and Council for Best Practices use only.
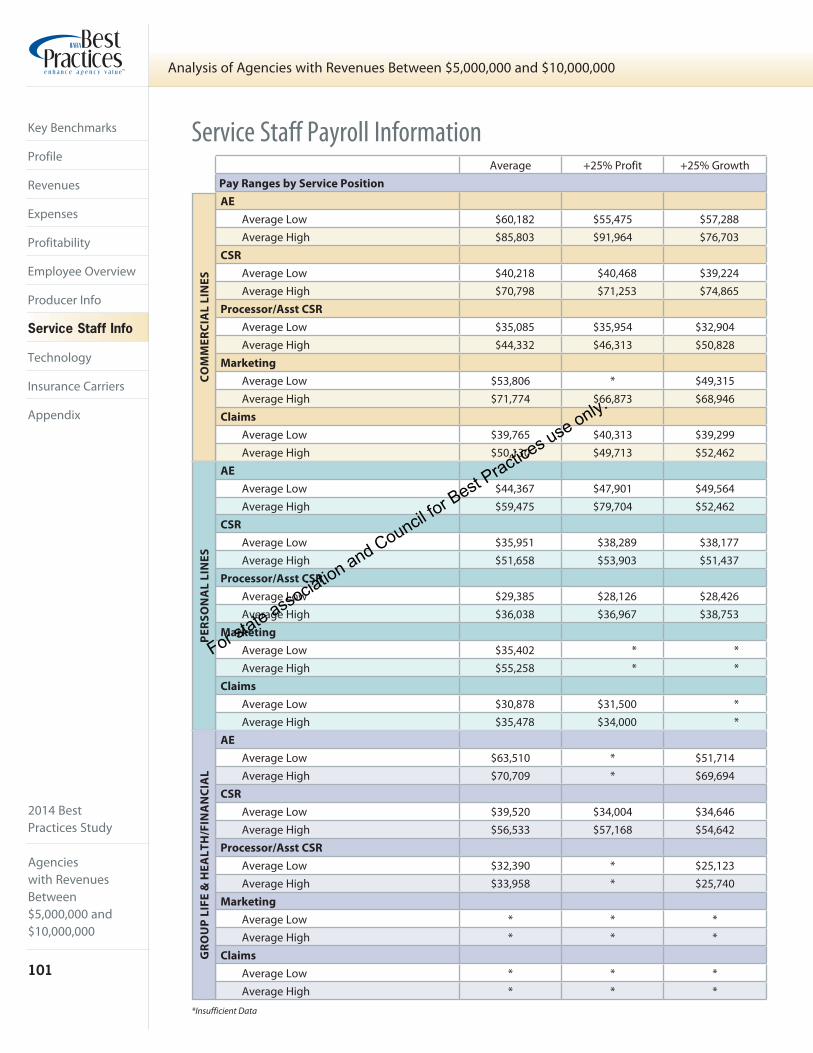
2014 BestPractices Study
Agencieswith RevenuesBetween $5,000,000 and $10,000,000
101
Analysis of Agencies with Revenues Between $5,000,000 and $10,000,000
Key Benchmarks
Profile
Revenues
Expenses
Profitability
Employee Overview
Producer Info
Service Staff Info
Technology
Insurance Carriers
Appendix
Service Staff Payroll InformationAverage +25% Profit +25% Growth
Pay Ranges by Service Position
AE
Average Low $60,182 $55,475 $57,288Average High $85,803 $91,964 $76,703
CSR
Average Low $40,218 $40,468 $39,224Average High $70,798 $71,253 $74,865
Processor/Asst CSR
Average Low $35,085 $35,954 $32,904Average High $44,332 $46,313 $50,828
Marketing
Average Low $53,806 * $49,315Average High $71,774 $66,873 $68,946
Claims
Average Low $39,765 $40,313 $39,299Average High $50,130 $49,713 $52,462
AE
Average Low $44,367 $47,901 $49,564Average High $59,475 $79,704 $52,462
CSR
Average Low $35,951 $38,289 $38,177Average High $51,658 $53,903 $51,437
Processor/Asst CSR
Average Low $29,385 $28,126 $28,426Average High $36,038 $36,967 $38,753
Marketing
Average Low $35,402 * *Average High $55,258 * *
Claims
Average Low $30,878 $31,500 *Average High $35,478 $34,000 *
AE
Average Low $63,510 * $51,714Average High $70,709 * $69,694
CSR
Average Low $39,520 $34,004 $34,646Average High $56,533 $57,168 $54,642
Processor/Asst CSR
Average Low $32,390 * $25,123Average High $33,958 * $25,740
Marketing
Average Low * * *Average High * * *
Claims
Average Low * * *Average High * * *
CO
MM
ER
CIA
L L
INE
SP
ER
SO
NA
L L
INE
SG
RO
UP
LIF
E &
HE
AL
TH
/FIN
AN
CIA
L
*Insufficient Data
For state association and Council for Best Practices use only.
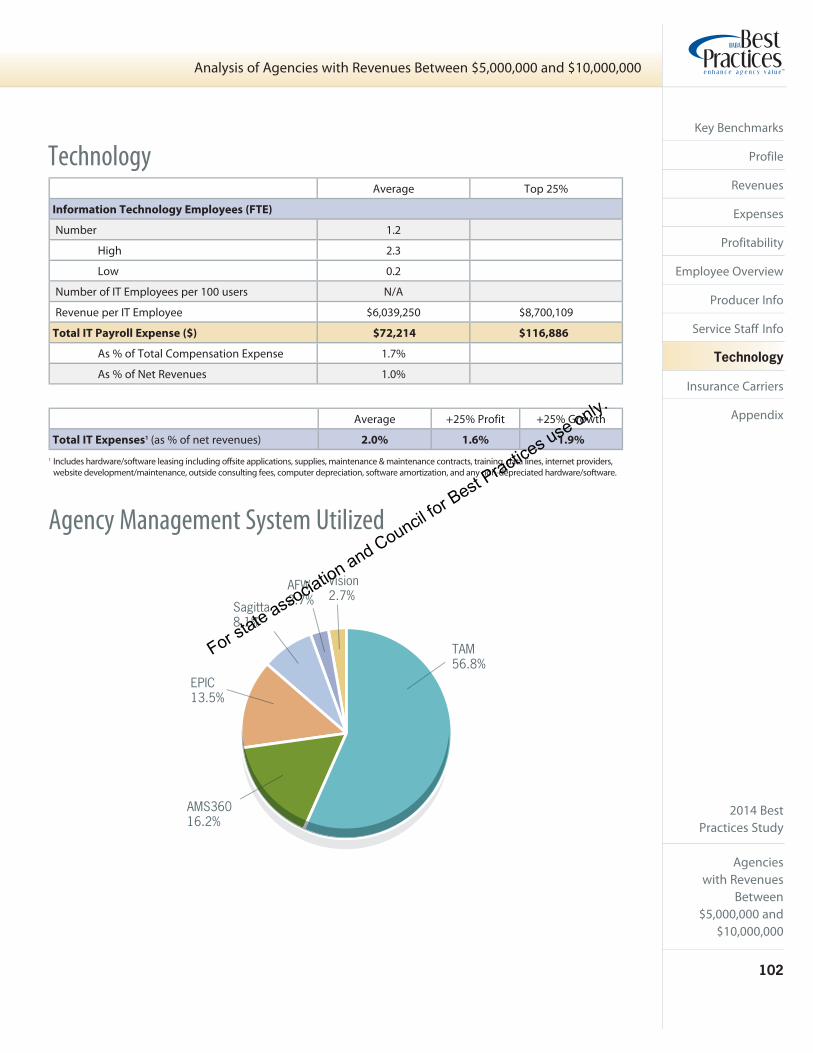
2014 BestPractices Study
Agencieswith Revenues
Between $5,000,000 and
$10,000,000
102
Analysis of Agencies with Revenues Between $5,000,000 and $10,000,000
Key Benchmarks
Profile
Revenues
Expenses
Profitability
Employee Overview
Producer Info
Service Staff Info
Technology
Insurance Carriers
Appendix
Average Top 25%
Information Technology Employees (FTE)
Number 1.2
High 2.3
Low 0.2
Number of IT Employees per 100 users N/A
Revenue per IT Employee $6,039,250 $8,700,109
Total IT Payroll Expense ($) $72,214 $116,886
As % of Total Compensation Expense 1.7%
As % of Net Revenues 1.0%
1 Includes hardware/software leasing including offsite applications, supplies, maintenance & maintenance contracts, training, data lines, internet providers, website development/maintenance, outside consulting fees, computer depreciation, software amortization, and any non-depreciated hardware/software.
Technology
Agency Management System Utilized
Average +25% Profit +25% Growth
Total IT Expenses1 (as % of net revenues) 2.0% 1.6% 1.9%
TAM56.8%
AMS36016.2%
EPIC13.5%
Sagitta8.1%
AFW2.7%
Vision2.7%
For state association and Council for Best Practices use only.

2014 BestPractices Study
Agencieswith RevenuesBetween $5,000,000 and $10,000,000
103
Analysis of Agencies with Revenues Between $5,000,000 and $10,000,000
Key Benchmarks
Profile
Revenues
Expenses
Profitability
Employee Overview
Producer Info
Service Staff Info
Technology
Insurance Carriers
Appendix
Average +25% Profit +25% Growth
Service Center Use
Total Personal Lines Commission placed in Carrier Service Center 28.0% 29.5% 32.8%
Total Commercial Lines Commission placed in Carrier Service Center 5.6% 6.0% 3.7%
Use of Carrier Service Centers
Average +25% Profit +25% Growth
Carrier Representation
Personal Lines P&C
National 11.7 10.8 14.0
Regional 8.3 9.6 8.3
Total 19.9 20.3 22.3
Commercial Lines P&C
National 14.4 13.6 11.0
Regional 12.5 13.0 9.6
Total 26.8 26.6 20.6
Group L&H / Financial
Total Life, Health, Disability, LTC,
Retirement Products, and Other28.5 16.6 22.5
Carriers
Average +25% Profit +25% Growth
% of Total Commission & Fee Revenue Derived from Direct Versus Indirect Appointments
INDIRECT Carrier Appointments 17.2% 9.1% 12.7%
DIRECT Carrier Appointments 80.1% 79.8% 76.2%
Carrier Appointments
For state association and Council for Best Practices use only.
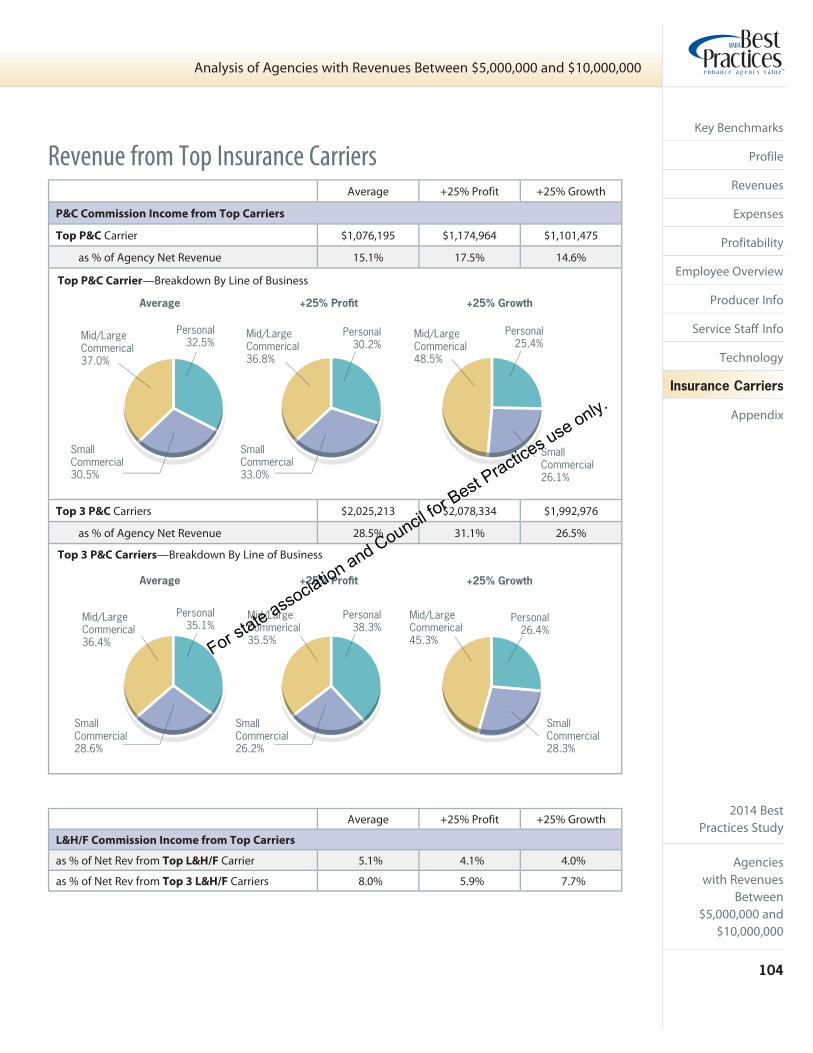
2014 BestPractices Study
Agencieswith Revenues
Between $5,000,000 and
$10,000,000
104
Analysis of Agencies with Revenues Between $5,000,000 and $10,000,000
Key Benchmarks
Profile
Revenues
Expenses
Profitability
Employee Overview
Producer Info
Service Staff Info
Technology
Insurance Carriers
Appendix
Average +25% Profit +25% Growth
P&C Commission Income from Top Carriers
Top P&C Carrier $1,076,195 $1,174,964 $1,101,475
as % of Agency Net Revenue 15.1% 17.5% 14.6%
Top 3 P&C Carriers $2,025,213 $2,078,334 $1,992,976
as % of Agency Net Revenue 28.5% 31.1% 26.5%
Top P&C Carrier—Breakdown By Line of Business
Top 3 P&C Carriers—Breakdown By Line of Business
Revenue from Top Insurance Carriers
Average +25% Profit +25% Growth
L&H/F Commission Income from Top Carriers
as % of Net Rev from Top L&H/F Carrier 5.1% 4.1% 4.0%
as % of Net Rev from Top 3 L&H/F Carriers 8.0% 5.9% 7.7%
+25% ProfitAverage
Mid/LargeCommerical36.8%
Personal30.2%
Mid/LargeCommerical37.0%
Personal32.5%
SmallCommercial30.5%
SmallCommercial33.0%
SmallCommercial26.1%
Mid/LargeCommerical48.5%
Personal25.4%
+25% Growth
Mid/LargeCommerical36.4%
+25% Growth+25% ProfitAverage
Mid/LargeCommerical35.5%
Personal38.3%
SmallCommercial26.2%
Personal35.1%
SmallCommercial28.6%
Mid/LargeCommerical45.3%
Personal26.4%
SmallCommercial28.3%
For state association and Council for Best Practices use only.

2014 BestPractices Study
105
2014 Best Practices Study
For state association and Council for Best Practices use only.

2014 BestPractices Study
106
2014 Best Practices Study
Agencies with Revenues Between $10,000,000 and $25,000,000
$1,250,000 $25,000,000$2,500,000 $5,000,000 $10,000,000
For state association and Council for Best Practices use only.

2014 BestPractices Study
Agencieswith RevenuesBetween $10,000,000 and $25,000,000
107
Analysis of Agencies with Revenues Between $10,000,000 and $25,000,000
Key Benchmarks
Profile
Revenues
Expenses
Profitability
Employee Overview
Producer Info
Service Staff Info
Technology
Insurance Carriers
Appendix
Key Benchmarks at a Glance Average +25% Profit +25% Growth
Growth
Organic Growth By Line of Business*
Commercial P&C 10.7% 8.9% 17.4%
Personal P&C 7.4% 10.6% 6.9%
Group Medical 7.5% 7.8% 29.3%
All Other Group 1.0% 11.0% -1.1%
Total Organic Growth 9.6% 9.3% 19.0%
Profit
Pro Forma Pretax Profit 19.2% 27.1% 17.5%
Pro Forma EBITDA 21.7% 28.5% 20.7%
Rule of 20 Score 20.3 23.6 28.8
Financial
Average Top 25%
Current Ratio 1.26:1 2.02:1
Receivable/Payable Ratio 51.3% 10.5%
Accounts Receivables > 60 Days 10.2% 1.1%
Accounts Receivables > 90 Days 7.3% -5.2%
Productivity
Average +25% Profit +25% Growth
Revenue per Employee $179,711 $205,213 $178,529
Compensation per Employee $116,404 $120,665 $114,420
Spread per Employee $63,308 $84,548 $64,109
Annual New Commission Generated per Validated Producer
Average Top 25%
Commercial P&C $91,816 $183,692
Personal P&C $54,898 $94,922
Life & Health/Financial $96,802 $167,392
Service Staff Total Payroll as % of Line of Business Revenue
Average # of Service Staff
Commercial P&C 20.3% 28.2
Personal P&C 26.0% 12.4
Group Life & Health/Financial 16.0% 10.5
*Excludes any acquired revenue
For state association and Council for Best Practices use only.
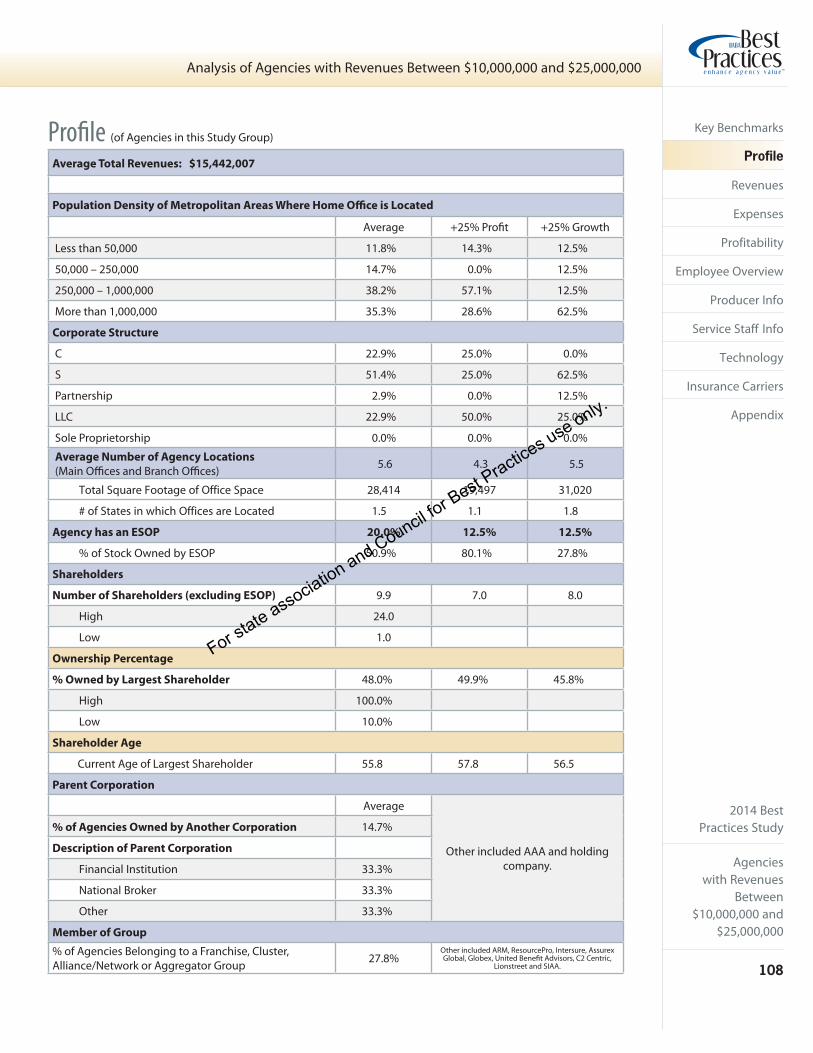
2014 BestPractices Study
Agencieswith Revenues
Between $10,000,000 and
$25,000,000
108
Analysis of Agencies with Revenues Between $10,000,000 and $25,000,000
Key Benchmarks
Profile
Revenues
Expenses
Profitability
Employee Overview
Producer Info
Service Staff Info
Technology
Insurance Carriers
Appendix
Average Total Revenues: $15,442,007
Population Density of Metropolitan Areas Where Home Offi ce is Located
Average +25% Profi t +25% Growth
Less than 50,000 11.8% 14.3% 12.5%
50,000 – 250,000 14.7% 0.0% 12.5%
250,000 – 1,000,000 38.2% 57.1% 12.5%
More than 1,000,000 35.3% 28.6% 62.5%
Corporate Structure
C 22.9% 25.0% 0.0%
S 51.4% 25.0% 62.5%
Partnership 2.9% 0.0% 12.5%
LLC 22.9% 50.0% 25.0%
Sole Proprietorship 0.0% 0.0% 0.0%
Average Number of Agency Locations
(Main Offi ces and Branch Offi ces) 5.6 4.3 5.5
Total Square Footage of Office Space 28,414 19,497 31,020
# of States in which Offices are Located 1.5 1.1 1.8
Agency has an ESOP 20.0% 12.5% 12.5%
% of Stock Owned by ESOP 50.9% 80.1% 27.8%
Shareholders
Number of Shareholders (excluding ESOP) 9.9 7.0 8.0
High 24.0
Low 1.0
Ownership Percentage
% Owned by Largest Shareholder 48.0% 49.9% 45.8%
High 100.0%
Low 10.0%
Shareholder Age
Current Age of Largest Shareholder 55.8 57.8 56.5
Parent Corporation
Average
Other included AAA and holding company.
% of Agencies Owned by Another Corporation 14.7%
Description of Parent Corporation
Financial Institution 33.3%
National Broker 33.3%
Other 33.3%
Member of Group
% of Agencies Belonging to a Franchise, Cluster, Alliance/Network or Aggregator Group 27.8%
Other included ARM, ResourcePro, Intersure, Assurex Global, Globex, United Benefi t Advisors, C2 Centric,
Lionstreet and SIAA.
Profi le (of Agencies in this Study Group)
For state association and Council for Best Practices use only.

2014 BestPractices Study
Agencieswith RevenuesBetween $10,000,000 and $25,000,000
109
Analysis of Agencies with Revenues Between $10,000,000 and $25,000,000
Key Benchmarks
Profile
Revenues
Expenses
Profitability
Employee Overview
Producer Info
Service Staff Info
Technology
Insurance Carriers
Appendix
Revenues
Revenue by Source (% of Gross Revenues)
(% by Source) Average +25% Profit +25% Growth
Property & Casualty
Commercial Commissions & Fees 50.3% 47.6% 38.4%
Bonds 1.8% 0.3% 3.7%
Personal Commissions 15.2% 14.2% 15.6%
Value Added Services 0.8% 0.1% 1.2%
Contingent/Bonus 6.8% 5.9% 6.2%
Total P&C 74.8% 68.0% 65.2%
Life & Health/Financial
Group Medical Commissions & Fees 15.1% 19.1% 20.2%
All Other Group Commissions & Fees 5.0% 5.8% 5.9%
Individual L&H Commissions & Fees 2.9% 4.6% 6.3%
Bonus/Overrides 1.3% 1.9% 1.5%
Total L&H/Financial 24.3% 31.4% 33.9%
Investments 0.4% 0.4% 0.4%
Miscellaneous 0.4% 0.2% 0.5%
Gross Revenues 100.0% 100.0% 100.0%
Brokerage Commission Expense 1.7% 0.6% 0.5%
Net Revenues 98.3% 99.4% 99.5%
% T
otal
Rev
enue
10.0%
20.0%
30.0%
40.0%
50.0%
60.0%
0.0%P&C
Contingent/Bonus
P&CVASFees
P&CPersonalComm& Fees
P&CBondsComm& Fees
P&CCommercial
Comm& Fees
L&HGroup
MedicalComm& Fees
L&HAll OtherGroupComm& Fees
L&HIndividualComm& Fees
L&HBonus/
Overrides
Investments Miscellaneous
Average +25% Profit +25% Growth
For state association and Council for Best Practices use only.
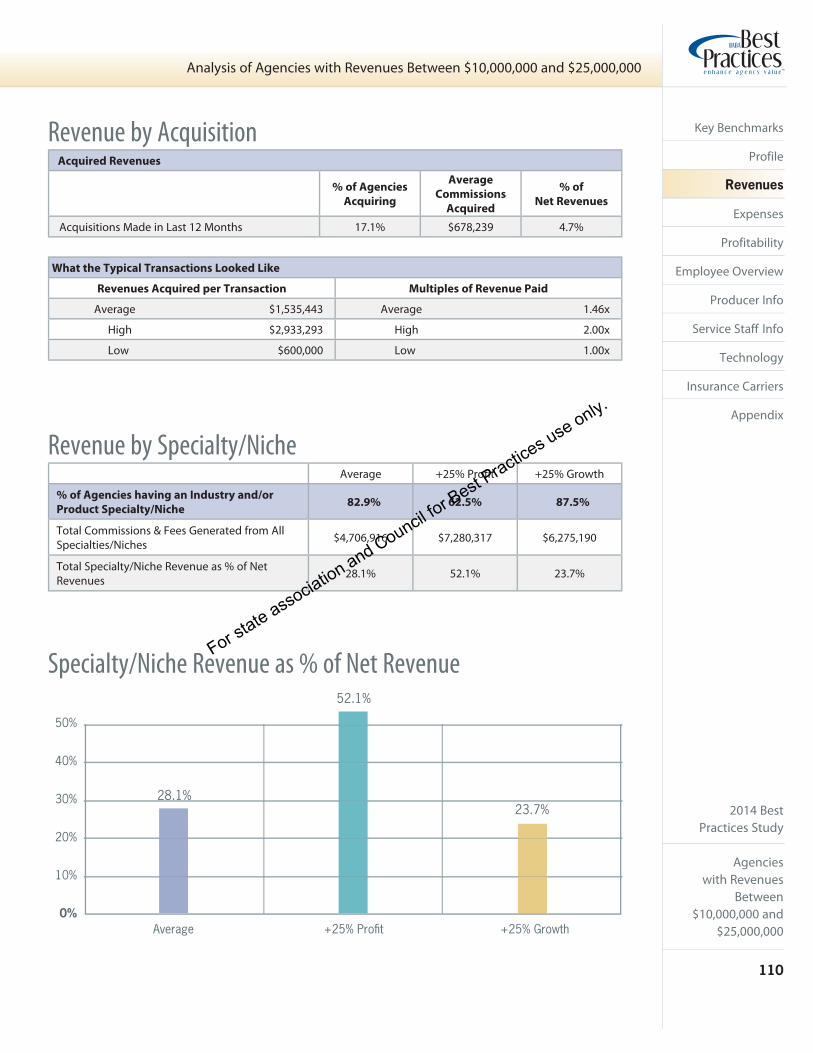
2014 BestPractices Study
Agencieswith Revenues
Between $10,000,000 and
$25,000,000
110
Analysis of Agencies with Revenues Between $10,000,000 and $25,000,000
Key Benchmarks
Profile
Revenues
Expenses
Profitability
Employee Overview
Producer Info
Service Staff Info
Technology
Insurance Carriers
Appendix
What the Typical Transactions Looked Like
Revenues Acquired per Transaction Multiples of Revenue Paid
Average $1,535,443 Average 1.46x
High $2,933,293 High 2.00x
Low $600,000 Low 1.00x
Acquired Revenues
% of Agencies
Acquiring
Average
Commissions
Acquired
% of
Net Revenues
Acquisitions Made in Last 12 Months 17.1% $678,239 4.7%
Revenue by Acquisition
Revenue by Specialty/NicheAverage +25% Profit +25% Growth
% of Agencies having an Industry and/or
Product Specialty/Niche82.9% 62.5% 87.5%
Total Commissions & Fees Generated from All Specialties/Niches $4,706,916 $7,280,317 $6,275,190
Total Specialty/Niche Revenue as % of Net Revenues 28.1% 52.1% 23.7%
Specialty/Niche Revenue as % of Net Revenue
Average +25% Profit +25% Growth
10%
20%
30%
40%
50%
28.1%23.7%
0%
52.1%
For state association and Council for Best Practices use only.
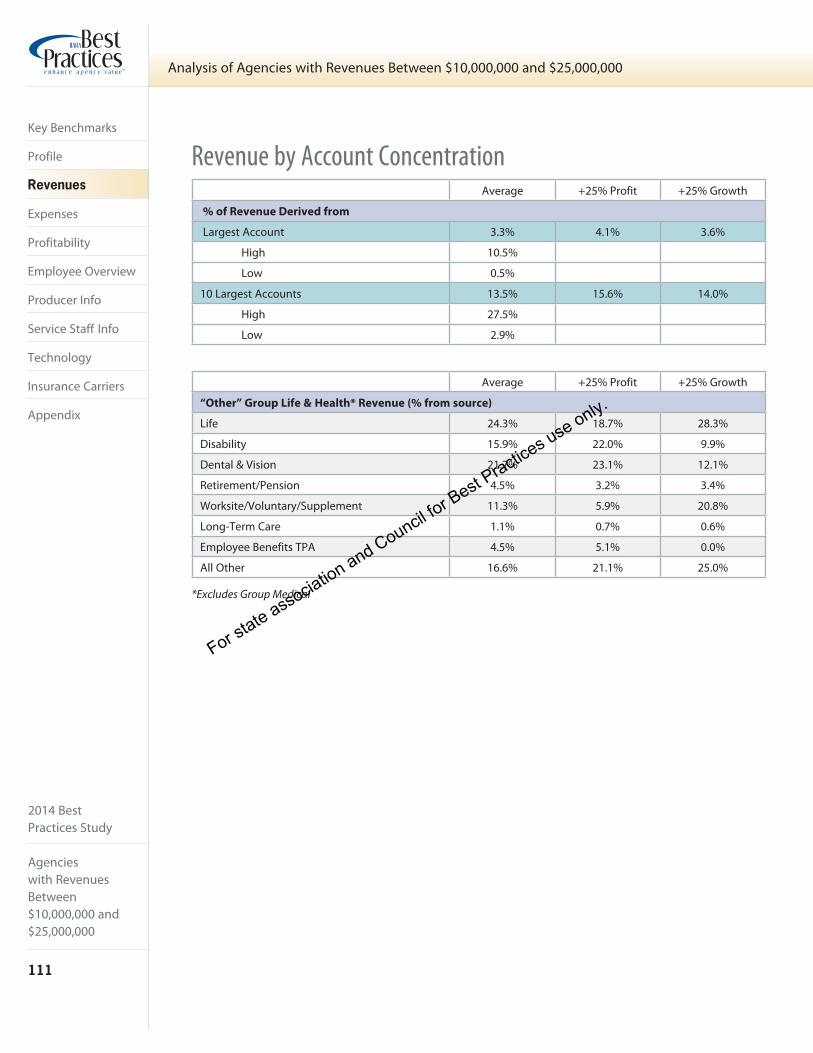
2014 BestPractices Study
Agencieswith RevenuesBetween $10,000,000 and $25,000,000
111
Analysis of Agencies with Revenues Between $10,000,000 and $25,000,000
Key Benchmarks
Profile
Revenues
Expenses
Profitability
Employee Overview
Producer Info
Service Staff Info
Technology
Insurance Carriers
Appendix
Revenue by Account ConcentrationAverage +25% Profit +25% Growth
% of Revenue Derived from
Largest Account 3.3% 4.1% 3.6%
High 10.5%
Low 0.5%
10 Largest Accounts 13.5% 15.6% 14.0%
High 27.5%
Low 2.9%
Average +25% Profit +25% Growth
“Other” Group Life & Health* Revenue (% from source)
Life 24.3% 18.7% 28.3%
Disability 15.9% 22.0% 9.9%
Dental & Vision 21.7% 23.1% 12.1%
Retirement/Pension 4.5% 3.2% 3.4%
Worksite/Voluntary/Supplement 11.3% 5.9% 20.8%
Long-Term Care 1.1% 0.7% 0.6%
Employee Benefits TPA 4.5% 5.1% 0.0%
All Other 16.6% 21.1% 25.0%
*Excludes Group Medical
For state association and Council for Best Practices use only.

2014 BestPractices Study
Agencieswith Revenues
Between $10,000,000 and
$25,000,000
112
Analysis of Agencies with Revenues Between $10,000,000 and $25,000,000
Key Benchmarks
Profile
Revenues
Expenses
Profitability
Employee Overview
Producer Info
Service Staff Info
Technology
Insurance Carriers
Appendix
Revenue by Account Size(as measured by Comm. & Fees – not premium) Average +25% Profit +25% Growth
Commercial P&C
Greater than $25,000
% of Book 45.6% 51.1% 53.2%
# of Accounts 64.8 61.3 64.4
Total Revenue $4,039,967 $4,195,592 $4,261,388
Revenue per Account $62,351 $68,499 $66,196
Between $10,000 and $25,000
% of Book 18.2% 16.6% 16.8%
# of Accounts 105.2 86.1 85.8
Total Revenue $1,611,042 $1,363,341 $1,348,298
Revenue per Account $15,313 $15,830 $15,724
Between $5,000 and $10,000
% of Book 12.1% 9.1% 8.5%
# of Accounts 152.8 105.9 97.6
Total Revenue $1,067,218 $750,354 $681,501
Revenue per Account $6,983 $7,087 $6,981
Less than $5,000
% of Book 24.1% 23.2% 21.4%
# of Accounts 2,112.5 1,658.9 1,434.4
Total Revenue $2,075,680 $1,902,053 $1,713,273
Revenue per Account $611 $470 $445
(as measured by number of lives) Average +25% Profit +25% Growth
Group L&H/Financial
Over 100 Lives
% of Book 54.3% 55.1% 66.6%
# of Accounts 28.5 28.2 46.7
Total Revenue $1,657,013 $1,884,765 $2,609,431
Revenue per Account $58,141 $66,633 $55,859
50 - 100 Lives
% of Book 17.5% 22.2% 13.5%
# of Accounts 29.7 34.8 33.6
Total Revenue $532,665 $758,870 $528,936
Revenue per Account $17,905 $21,771 $15,756
25 - 50 Lives
% of Book 10.9% 11.0% 7.2%
# of Accounts 49.4 73.4 63.0
Total Revenue $346,339 $375,008 $281,951
Revenue per Account $7,015 $5,107 $4,475
Under 25 Lives
% of Book 17.3% 11.7% 12.7%
# of Accounts 461.3 280.8 241.3
Total Revenue $509,192 $399,997 $496,194
Revenue per Account $1,104 $1,424 $2,056
For state association and Council for Best Practices use only.
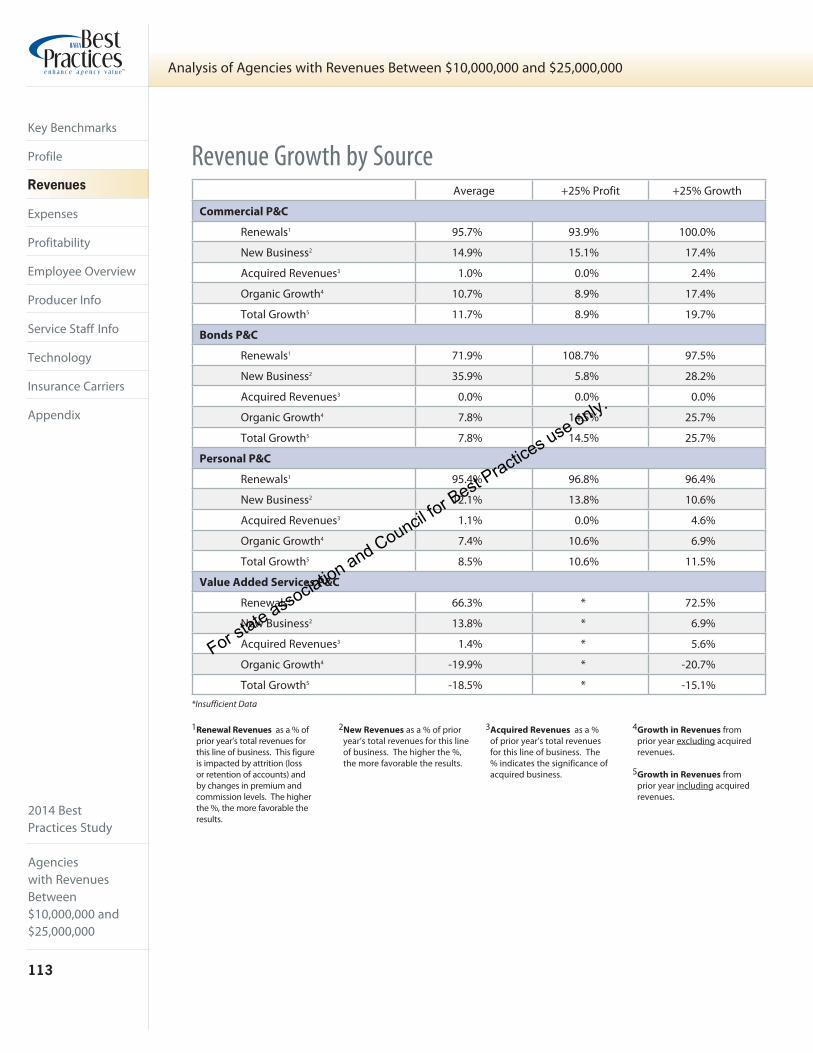
2014 BestPractices Study
Agencieswith RevenuesBetween $10,000,000 and $25,000,000
113
Analysis of Agencies with Revenues Between $10,000,000 and $25,000,000
Key Benchmarks
Profile
Revenues
Expenses
Profitability
Employee Overview
Producer Info
Service Staff Info
Technology
Insurance Carriers
Appendix
Revenue Growth by Source
*Insufficient Data
Average +25% Profit +25% Growth
Commercial P&C
Renewals1 95.7% 93.9% 100.0%
New Business2 14.9% 15.1% 17.4%
Acquired Revenues3 1.0% 0.0% 2.4%
Organic Growth4 10.7% 8.9% 17.4%
Total Growth5 11.7% 8.9% 19.7%
Bonds P&C
Renewals1 71.9% 108.7% 97.5%
New Business2 35.9% 5.8% 28.2%
Acquired Revenues3 0.0% 0.0% 0.0%
Organic Growth4 7.8% 14.5% 25.7%
Total Growth5 7.8% 14.5% 25.7%
Personal P&C
Renewals1 95.4% 96.8% 96.4%
New Business2 12.1% 13.8% 10.6%
Acquired Revenues3 1.1% 0.0% 4.6%
Organic Growth4 7.4% 10.6% 6.9%
Total Growth5 8.5% 10.6% 11.5%
Value Added Services P&C
Renewals1 66.3% * 72.5%
New Business2 13.8% * 6.9%
Acquired Revenues3 1.4% * 5.6%
Organic Growth4 -19.9% * -20.7%
Total Growth5 -18.5% * -15.1%
1Renewal Revenues as a % of prior year’s total revenues for this line of business. This figure is impacted by attrition (loss or retention of accounts) and by changes in premium and commission levels. The higher the %, the more favorable the results.
2New Revenues as a % of prior year’s total revenues for this line of business. The higher the %, the more favorable the results.
3Acquired Revenues as a % of prior year’s total revenues for this line of business. The % indicates the significance of acquired business.
4Growth in Revenues from prior year excluding acquired revenues.
5Growth in Revenues from prior year including acquired revenues.
*Insufficient Data
For state association and Council for Best Practices use only.
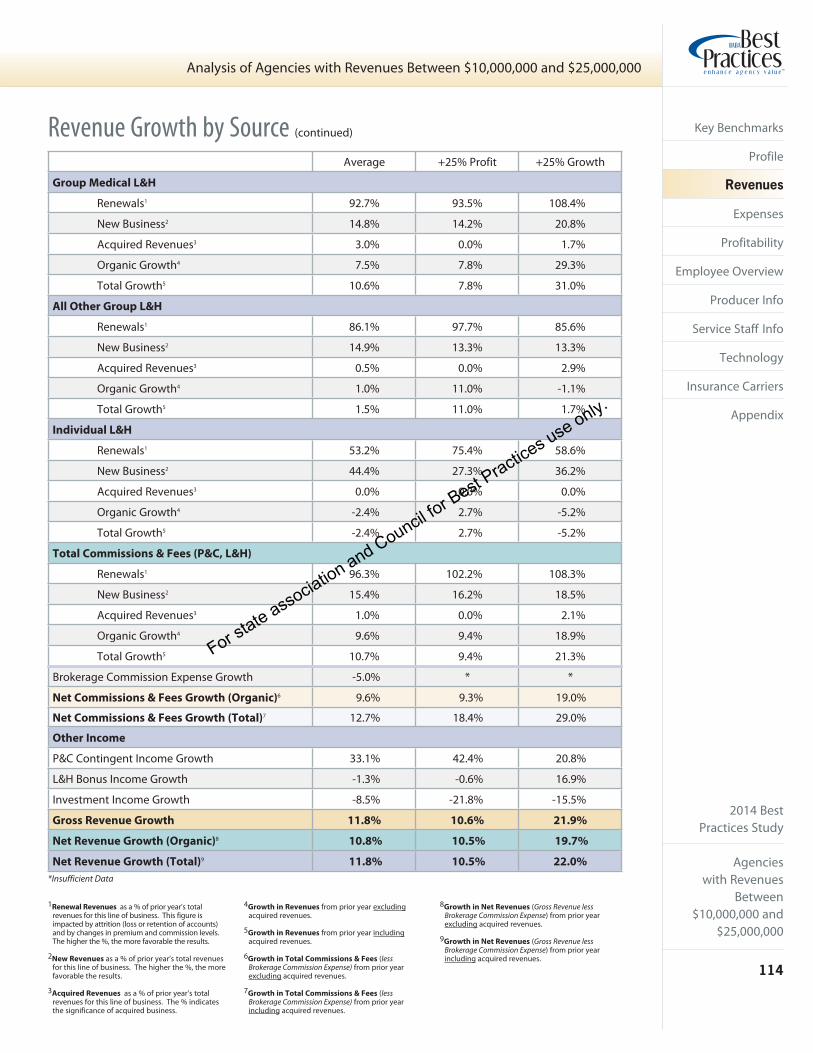
2014 BestPractices Study
Agencieswith Revenues
Between $10,000,000 and
$25,000,000
114
Analysis of Agencies with Revenues Between $10,000,000 and $25,000,000
Key Benchmarks
Profile
Revenues
Expenses
Profitability
Employee Overview
Producer Info
Service Staff Info
Technology
Insurance Carriers
Appendix
Revenue Growth by Source (continued)
*Insufficient Data
Average +25% Profit +25% Growth
Group Medical L&H
Renewals1 92.7% 93.5% 108.4%
New Business2 14.8% 14.2% 20.8%
Acquired Revenues3 3.0% 0.0% 1.7%
Organic Growth4 7.5% 7.8% 29.3%
Total Growth5 10.6% 7.8% 31.0%
All Other Group L&H
Renewals1 86.1% 97.7% 85.6%
New Business2 14.9% 13.3% 13.3%
Acquired Revenues3 0.5% 0.0% 2.9%
Organic Growth4 1.0% 11.0% -1.1%
Total Growth5 1.5% 11.0% 1.7%
Individual L&H
Renewals1 53.2% 75.4% 58.6%
New Business2 44.4% 27.3% 36.2%
Acquired Revenues3 0.0% 0.0% 0.0%
Organic Growth4 -2.4% 2.7% -5.2%
Total Growth5 -2.4% 2.7% -5.2%
Total Commissions & Fees (P&C, L&H)
Renewals1 96.3% 102.2% 108.3%
New Business2 15.4% 16.2% 18.5%
Acquired Revenues3 1.0% 0.0% 2.1%
Organic Growth4 9.6% 9.4% 18.9%
Total Growth5 10.7% 9.4% 21.3%
Brokerage Commission Expense Growth -5.0% * *
Net Commissions & Fees Growth (Organic)6 9.6% 9.3% 19.0%
Net Commissions & Fees Growth (Total)7 12.7% 18.4% 29.0%
Other Income
P&C Contingent Income Growth 33.1% 42.4% 20.8%
L&H Bonus Income Growth -1.3% -0.6% 16.9%
Investment Income Growth -8.5% -21.8% -15.5%
Gross Revenue Growth 11.8% 10.6% 21.9%
Net Revenue Growth (Organic)8 10.8% 10.5% 19.7%
Net Revenue Growth (Total)9 11.8% 10.5% 22.0%
1Renewal Revenues as a % of prior year’s total revenues for this line of business. This figure is impacted by attrition (loss or retention of accounts) and by changes in premium and commission levels. The higher the %, the more favorable the results.
2New Revenues as a % of prior year’s total revenues for this line of business. The higher the %, the more favorable the results.
3Acquired Revenues as a % of prior year’s total revenues for this line of business. The % indicates the significance of acquired business.
4Growth in Revenues from prior year excluding acquired revenues.
5Growth in Revenues from prior year including acquired revenues.
6Growth in Total Commissions & Fees (less Brokerage Commission Expense) from prior year excluding acquired revenues.
7Growth in Total Commissions & Fees (less Brokerage Commission Expense) from prior year including acquired revenues.
8Growth in Net Revenues (Gross Revenue less Brokerage Commission Expense) from prior year excluding acquired revenues.
9Growth in Net Revenues (Gross Revenue less Brokerage Commission Expense) from prior year including acquired revenues.
For state association and Council for Best Practices use only.

2014 BestPractices Study
Agencieswith RevenuesBetween $10,000,000 and $25,000,000
115
Analysis of Agencies with Revenues Between $10,000,000 and $25,000,000
Key Benchmarks
Profile
Revenues
Expenses
Profitability
Employee Overview
Producer Info
Service Staff Info
Technology
Insurance Carriers
Appendix
Revenue Growth by Source (continued)
Historical Organic Growth (in Net Revenue)
Future GrowthPercentage of agencies considering line of business as very important to growing agency’s revenue over the next 3 years
Surety-Bonding 34.3%3
Personal P&C 57.1%
31.4%Small Commercial P&C
Individual Life & Health 28.6%2
Group Medical/Health Insurance 82.9%%
65.7%.All Other Group Benefits
0% 10% 20% 30% 40% 50% 60% 70% 80% 90% 100%
2007 2008 2009 2010 2011 2012 2013 2014
10%
20%
30%
40%
17.0%
20.4%
33.4%
5.1%1.6%
15.0%
1.0%5.0%
11.3%
0.7% 1.1%
8.7%8 7%
2.4% 3.5%
10.1%
4.7% 4.1%
12.4% 10.4%7.3%7 3%
20.0%
10.8%10.5%
19.7%
0%
Average +25% Profit +25% Growth
For state association and Council for Best Practices use only.

2014 BestPractices Study
Agencieswith Revenues
Between $10,000,000 and
$25,000,000
116
Analysis of Agencies with Revenues Between $10,000,000 and $25,000,000
Key Benchmarks
Profile
Revenues
Expenses
Profitability
Employee Overview
Producer Info
Service Staff Info
Technology
Insurance Carriers
Appendix
Expenses (as % of Net Revenues)
Average +25% Profit +25% Growth
Compensation Expenses
Payroll: Employee 54.9% 50.6% 51.5%
Payroll: “Non-Employee” - 1099 Producers/Temp Help 1.3% 0.5% 3.8%
Total Payroll 56.2% 51.1% 55.3%
Benefits: Payroll Taxes 3.3% 2.6% 3.1%
Benefits: Retirement 1.6% 1.3% 2.0%
Benefits: Insurance 3.4% 3.2% 3.3%
Benefits: Other 0.2% 0.2% 0.1%
Total Benefits 8.5% 7.4% 8.5%
Total Compensation 64.7% 58.5% 63.8%
Selling Expenses
T&E/Conventions 1.4% 1.3% 1.6%
Auto Expenditures 0.6% 0.4% 0.6%
Auto Depreciation 0.1% 0.0% 0.1%
Total Auto 0.6% 0.4% 0.7%
Advertising/Promotions 1.2% 1.0% 1.2%
Total Selling 3.2% 2.7% 3.5%
Operating Expenses
Occupancy Expenditures 3.7% 3.4% 4.0%
Occupancy Depreciation/Amortization 0.2% 0.1% 0.1%
Total Occupancy 3.9% 3.5% 4.1%
Office Equipment Expenditures 0.4% 0.2% 0.5%
Office Equipment Depreciation 0.4% 0.6% 0.6%
Total Office Equipment 0.8% 0.7% 1.1%
IT (Information Technology) 2.1% 2.1% 2.1%
IT Depreciation/Amortization 0.3% 0.3% 0.2%
Total IT 2.3% 2.4% 2.3%
Telephone 0.6% 0.4% 0.6%
Postage 0.3% 0.3% 0.4%
Supplies/Printing 0.7% 0.6% 0.8%
Dues/Subscriptions/Contributions 0.7% 0.7% 0.7%
Taxes/Licenses 0.4% 0.4% 0.4%
Insurance 1.2% 1.0% 1.2%
Professional Fees 1.3% 1.9% 2.6%
Bad Debts 0.2% 0.1% 0.0%
Outside Services 0.9% 1.0% 0.9%
Education/Training 0.3% 0.2% 0.4%
Miscellaneous 0.6% 1.4% 0.5%
Total Operating 14.2% 14.5% 16.0%
continued on next page
For state association and Council for Best Practices use only.
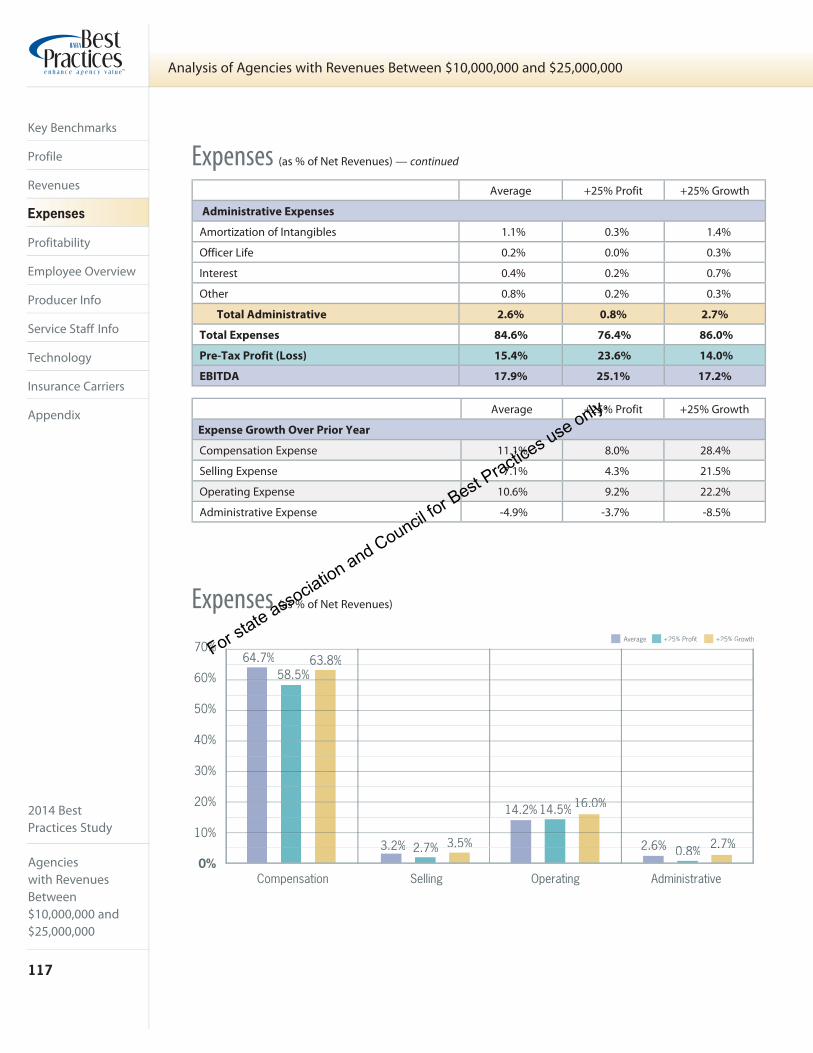
2014 BestPractices Study
Agencieswith RevenuesBetween $10,000,000 and $25,000,000
117
Analysis of Agencies with Revenues Between $10,000,000 and $25,000,000
Key Benchmarks
Profile
Revenues
Expenses
Profitability
Employee Overview
Producer Info
Service Staff Info
Technology
Insurance Carriers
Appendix
Average +25% Profit +25% Growth
Administrative Expenses
Amortization of Intangibles 1.1% 0.3% 1.4%
Officer Life 0.2% 0.0% 0.3%
Interest 0.4% 0.2% 0.7%
Other 0.8% 0.2% 0.3%
Total Administrative 2.6% 0.8% 2.7%
Total Expenses 84.6% 76.4% 86.0%
Pre-Tax Profit (Loss) 15.4% 23.6% 14.0%
EBITDA 17.9% 25.1% 17.2%
Average +25% Profit +25% Growth
Expense Growth Over Prior Year
Compensation Expense 11.1% 8.0% 28.4%
Selling Expense 7.1% 4.3% 21.5%
Operating Expense 10.6% 9.2% 22.2%
Administrative Expense -4.9% -3.7% -8.5%
Expenses (as % of Net Revenues) — continued
Expenses (as % of Net Revenues)
Compensation Selling Operating Administrative0%
10%
20%
30%
40%
50%
60%
70%Average +25% Profit +25% Growth
3.2%3 2% 2.7%2 7% 3.5%
14.2% 14.5% 16.0%16 0%
2.6%2 6% 0.8%0 8% 2.7%2.7%
64.7% 63.8%63.8%58.5%
For state association and Council for Best Practices use only.
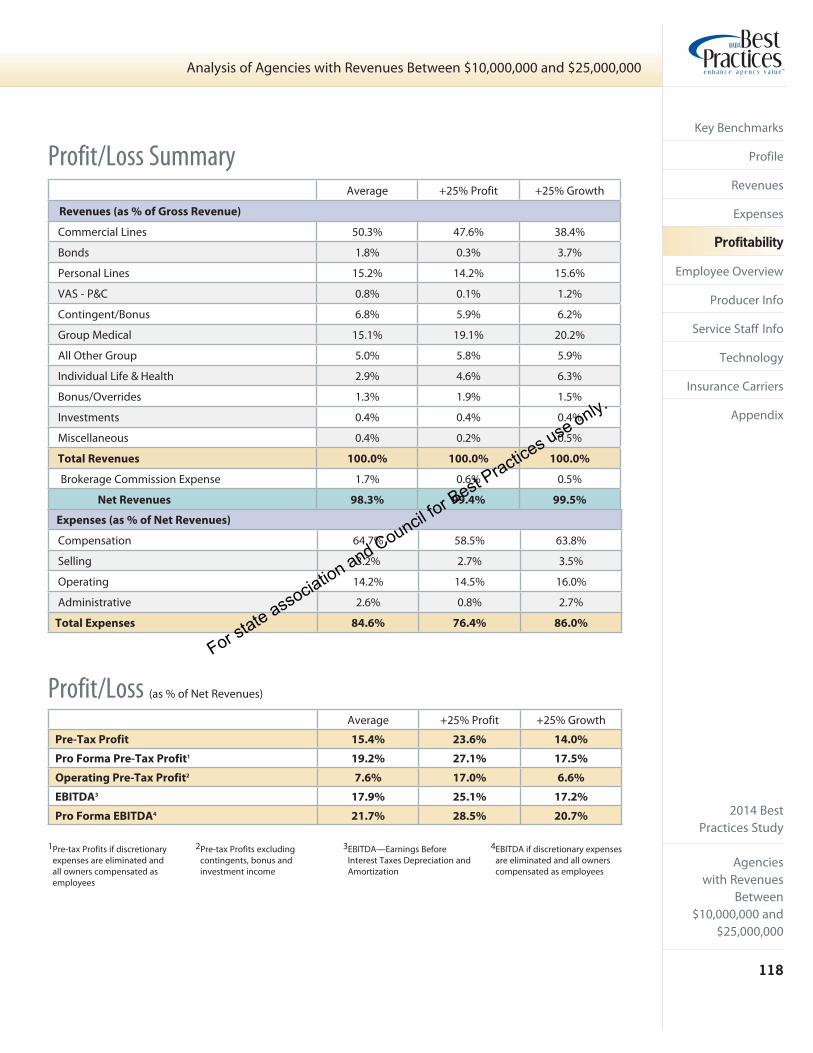
2014 BestPractices Study
Agencieswith Revenues
Between $10,000,000 and
$25,000,000
118
Analysis of Agencies with Revenues Between $10,000,000 and $25,000,000
Key Benchmarks
Profile
Revenues
Expenses
Profitability
Employee Overview
Producer Info
Service Staff Info
Technology
Insurance Carriers
Appendix
Average +25% Profit +25% Growth
Revenues (as % of Gross Revenue)
Commercial Lines 50.3% 47.6% 38.4%
Bonds 1.8% 0.3% 3.7%
Personal Lines 15.2% 14.2% 15.6%
VAS - P&C 0.8% 0.1% 1.2%
Contingent/Bonus 6.8% 5.9% 6.2%
Group Medical 15.1% 19.1% 20.2%
All Other Group 5.0% 5.8% 5.9%
Individual Life & Health 2.9% 4.6% 6.3%
Bonus/Overrides 1.3% 1.9% 1.5%
Investments 0.4% 0.4% 0.4%
Miscellaneous 0.4% 0.2% 0.5%
Total Revenues 100.0% 100.0% 100.0%
Brokerage Commission Expense 1.7% 0.6% 0.5%
Net Revenues 98.3% 99.4% 99.5%
Expenses (as % of Net Revenues)
Compensation 64.7% 58.5% 63.8%
Selling 3.2% 2.7% 3.5%
Operating 14.2% 14.5% 16.0%
Administrative 2.6% 0.8% 2.7%
Total Expenses 84.6% 76.4% 86.0%
Average +25% Profit +25% Growth
Pre-Tax Profit 15.4% 23.6% 14.0%
Pro Forma Pre-Tax Profit1 19.2% 27.1% 17.5%
Operating Pre-Tax Profit2 7.6% 17.0% 6.6%
EBITDA3 17.9% 25.1% 17.2%
Pro Forma EBITDA4 21.7% 28.5% 20.7%
1Pre-tax Profits if discretionary expenses are eliminated and all owners compensated as employees
2Pre-tax Profits excluding contingents, bonus and investment income
3EBITDA—Earnings Before Interest Taxes Depreciation and Amortization
4EBITDA if discretionary expenses are eliminated and all owners compensated as employees
Profit/Loss Summary
Profit/Loss (as % of Net Revenues)
For state association and Council for Best Practices use only.

2014 BestPractices Study
Agencieswith RevenuesBetween $10,000,000 and $25,000,000
119
Analysis of Agencies with Revenues Between $10,000,000 and $25,000,000
Key Benchmarks
Profile
Revenues
Expenses
Profitability
Employee Overview
Producer Info
Service Staff Info
Technology
Insurance Carriers
Appendix
Profitability
About EBITDA Margin and Operating Margin
EBITDA Margin is calculated by dividing a firm’s EBITDA (Earnings Before Interest, Taxes, Depreciation and Amortization) by the firm’s net revenues.
Pro Forma EBITDA Margin is calculated by dividing a firm’s Pro Forma EBITDA by the firm’s Pro Forma net revenue.
Operating Margin is calculated as EBITDA less contingent income divided by Pro Forma net revenues less contingent income.
Historical EBITDA Margin & Operating Margin (for Average Group)
5%
10%
15%
20%
25%
30%
35%
0%2008
EBITDA Margin Operating Margin
21.6%
27.1%27 1%25.0%
20.4%
6.6%
19.2%
3.2%
18.2%18.2%16.3%
0.2%
16.7%16 7%
1.8%3.4%
15.8%17.9%
21.7%
5.9%7.6%7.6%
20102007 2009 2011 2012 2013 2014
Pro Forma EBITDA
15.1%
19.6% 19.7%17.7%17 7%
20.1%
2.3%2 3%
For state association and Council for Best Practices use only.

2014 BestPractices Study
Agencieswith Revenues
Between $10,000,000 and
$25,000,000
120
Analysis of Agencies with Revenues Between $10,000,000 and $25,000,000
Key Benchmarks
Profile
Revenues
Expenses
Profitability
Employee Overview
Producer Info
Service Staff Info
Technology
Insurance Carriers
Appendix
Average Top 25%
Balance Sheet
Current Ratio 1.26:1 2.02:1
Tangible Net Worth (% of Net Revenue) 4.5% 22.6%
Receivables/Payable Ratio 51.3% 10.5%
Aged Receivables
% Receivables Aged Past 60 Days 10.2% 1.1%
% Receivables Aged Past 90 Days 7.3% -5.2%
Average +25% Profit +25% Growth
Agency Billed vs. Direct Billed by Carrier
% of P&C Revenues that are Agency Billed 40.1% 44.7% 48.6%
% of P&C Revenues that are Direct Billed 59.9% 55.3% 51.4%
Financial Stability
Accounts Receivable
The Rule of 20 is a simple growth and profitability balancing equation that provides a quick way to determine whether or not an agency is creating value for its shareholders. It states that an agency will drive industry-standard shareholder returns if the sum of (a) its organic growth rate and (b) 1/2 of its EBITDA margin equals or exceeds 20.
Generally speaking, an outcome of 20 or more, regardless of the different combinations of growth and profitability, indicates that the agency’s shareholders can expect to earn 15% -17% per year through stock price appreciation and/or shareholder distributions.
• Provides a tool to benchmark agency performance
• Helps frame the trade-off between growth and profitability
What is the Rule of 20?
Average +25% Profit Average +25% Growth Average
Rule of 20 20.3 23.6 28.8
Public BrokersOrganicGrowth
EBITDA Margin
Rule of 20 Outcome
Willis Group 4.9% 24.0% 16.9
Aon 3.0% 20.9% 13.5
Brown & Brown 6.8% 33.5% 23.6
Arthur J. Gallagher 6.5% 19.9% 16.5
Marsh & McLennan 3.0% 20.7% 13.4
Rule of 20 Outcome
Organic
Revenue
Growth
1/2 of
EBITDA
Margin
Rule of 20 Score +=
For state association and Council for Best Practices use only.
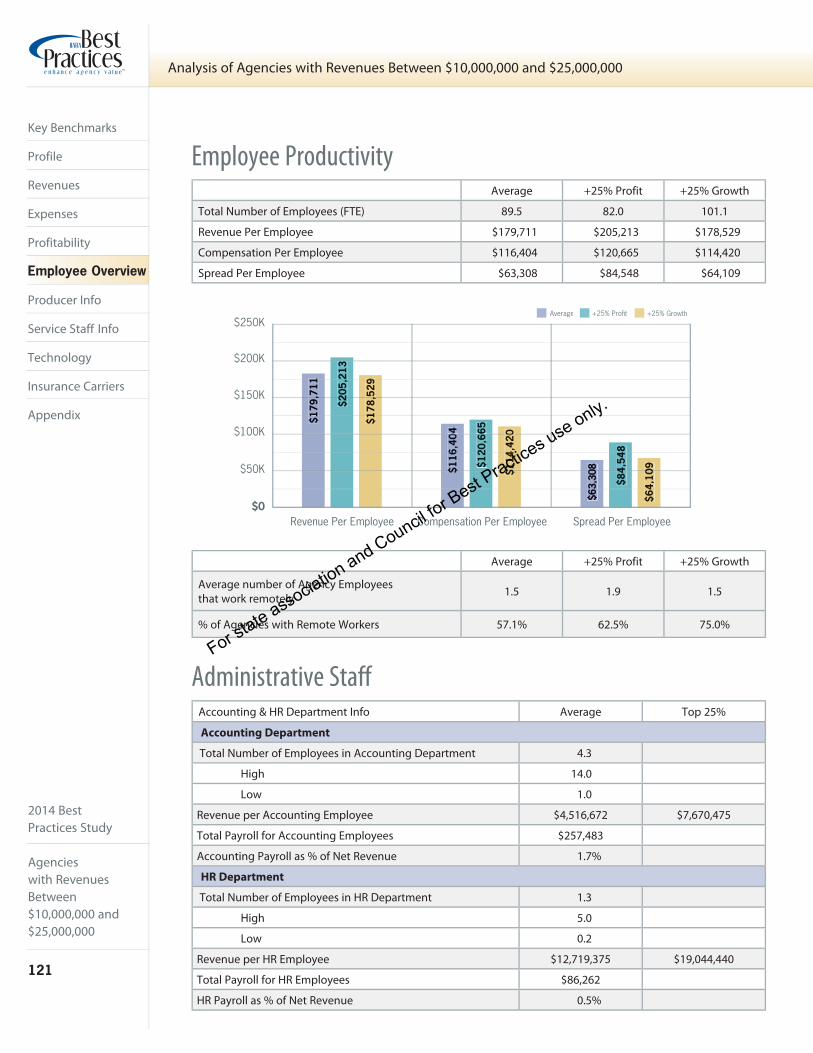
2014 BestPractices Study
Agencieswith RevenuesBetween $10,000,000 and $25,000,000
121
Analysis of Agencies with Revenues Between $10,000,000 and $25,000,000
Key Benchmarks
Profile
Revenues
Expenses
Profitability
Employee Overview
Producer Info
Service Staff Info
Technology
Insurance Carriers
Appendix
Average +25% Profit +25% Growth
Total Number of Employees (FTE) 89.5 82.0 101.1
Revenue Per Employee $179,711 $205,213 $178,529
Compensation Per Employee $116,404 $120,665 $114,420
Spread Per Employee $63,308 $84,548 $64,109
Average +25% Profit +25% Growth
Average number of Agency Employees that work remotely 1.5 1.9 1.5
% of Agencies with Remote Workers 57.1% 62.5% 75.0%
Employee Productivity
Administrative Staff Accounting & HR Department Info Average Top 25%
Accounting Department
Total Number of Employees in Accounting Department 4.3
High 14.0
Low 1.0
Revenue per Accounting Employee $4,516,672 $7,670,475
Total Payroll for Accounting Employees $257,483
Accounting Payroll as % of Net Revenue 1.7%
HR Department
Total Number of Employees in HR Department 1.3
High 5.0
Low 0.2
Revenue per HR Employee $12,719,375 $19,044,440
Total Payroll for HR Employees $86,262
HR Payroll as % of Net Revenue 0.5%
Revenue Per Employee Compensation Per Employee Spread Per Employee$0
$50K
$100K
$150K
$200K
$250K$1
79,7
11,
11
$205
,213
2
$178
,529
,9
1
$116
,4040
$6
$120
,66566
2
$114
,4200
$4
$63,
3080
$84,
548
44
Average +25% Profit +25% Growth
$64,
1090
4For state association and Council fo
r Best Practices use only.

2014 BestPractices Study
Agencieswith Revenues
Between $10,000,000 and
$25,000,000
122
Analysis of Agencies with Revenues Between $10,000,000 and $25,000,000
Key Benchmarks
Profile
Revenues
Expenses
Profitability
Employee Overview
Producer Info
Service Staff Info
Technology
Insurance Carriers
Appendix
Most Successful Producer Productivity
Commercial P&C Group L&H
New Commissions Produced Annually Average $161,413 $159,788
Top 25% $271,376 $316,076
Total Commissions in Producer’s Book Average $1,571,993 $924,043
Top 25% $2,492,641 $1,825,342
Average Commissions per Account Average $15,333 $17,419
Top 25% $35,791 $40,116
Most Successful Producer Productivity
How Most Successful Producers Spent Time
Personal Lines Producers, someone whose main responsibility is to solicit and write new personal
lines accounts and is not responsible for the day-to-day servicing of the business, can be very
productive. On average the most successful Personal Lines Producer in this revenue category
generated $62,505 per year in new personal lines commissions with an average commission
per account of $1,084. (Typically, the total commissions in the producer’s book are not tracked
since they are not paid renewal commission. Most often, the producers receive a base salary plus
new business commissions.)
Most SuccessfulCommercial P&C Producer
Most SuccessfulL&H Producer
PersonalTraining/Education/Prof. Dev.7.8%
Soliciting New Business32.5%
Mgmt/Personnel/Agency Admin.14.1%
ServicingExisting Accounts45.7%
PersonalTraining/Education/Prof. Dev.9.5%
Soliciting New Business36.6%
Mgmt/Personnel/Agency Admin.13.8%
ServicingExisting Accounts40.2%
For state association and Council for Best Practices use only.

2014 BestPractices Study
Agencieswith RevenuesBetween $10,000,000 and $25,000,000
123
Analysis of Agencies with Revenues Between $10,000,000 and $25,000,000
Key Benchmarks
Profile
Revenues
Expenses
Profitability
Employee Overview
Producer Info
Service Staff Info
Technology
Insurance Carriers
Appendix
Average Top 25%
Commercial P&C Producers
Average Validated Producers
# Validated 11.1
High 36.0
Low 1.0
Average New Commissions Produced Annually $91,816 $183,692
Average Book Serviced (Commissions) $714,091 $1,147,191
Average Pay ($) $208,471
Average Pay (% of Book Serviced) 29.2%
Group Life & Health Producers
Average Validated Producers
# Validated 3.1
High 7.0
Low 1.0
Average New Commissions Produced Annually $96,802 $167,392
Average Book Serviced (Commissions) $569, 795 $961,989
Average Pay ($) $185,708
Average Pay (% of Book Serviced) 32.6%
Personal P&C Producers
Average Validated Producers
# Validated 2.4
High 8.0
Low 1.0
Average New Commissions Produced Annually $54,898 $94,922
Average Book Serviced (Commissions) $290,530 $529,550
Average Pay ($) $91,964
Average Pay (% of Book Serviced) 31.7%
Multi-Line Producers
Average Validated Producers
# Validated 7.6
High 23.0
Low 1.0
Average New Commissions Produced Annually $111,153 $202,151
Average Book Serviced (Commissions) $728,311 $1,694,770
Average Pay ($) $224,904
Average Pay (% of Book Serviced) 30.9%
Validated Producer Productivity
Average +25% Profit +25% Growth
% of Agencies That Reimburse All/Part T&E Expense 74.3% 75.0% 62.5%
For state association and Council for Best Practices use only.

2014 BestPractices Study
Agencieswith Revenues
Between $10,000,000 and
$25,000,000
124
Analysis of Agencies with Revenues Between $10,000,000 and $25,000,000
Key Benchmarks
Profile
Revenues
Expenses
Profitability
Employee Overview
Producer Info
Service Staff Info
Technology
Insurance Carriers
Appendix
Where New Producers Were Found
Average +25% Profit +25% Growth
New Producer Hiring
% of Agencies that Hired New Producers Last Year 85.7% 100.0% 100.0%
# of New Producers Hired Last Year 2.3 3.1 3.1
Average Annualized Wages per Producer Hired $72,730 $88,386 $86,077
% of Producers Hired Over Last 5 Years That Met Their Production Goals 52.2% 56.2% 53.3%
New Producers
Average +25% Profit +25% GrowthThe NUPP
Expressed as a percentage of Net Revenue, the NUPP is the difference between what an agency pays its unvalidated producer(s) and what the producer(s) would earn under the agency’s normal commission schedule. A NUPP of 1.5% is considered a healthy level of investment.
1.4% 1.1% 1.7%
High 4.1%
Low 0.1%
By measuring pure payroll costs, the NUPP benchmark allows an “apples-to-apples” comparison with other agencies regarding the amount of direct investment an agency is making in new producers.
While the NUPP provides a general investment guideline, an agency should also consider the success rate of its new producers, i.e. the percentage of new producers hired during the past 5 year period that have achieved the sales goals set before them. By multiplying the NUPP by the producer success rate, an agency can further determine the effectiveness of its NUPP. High performing agencies typically achieve an Effective NUPP between 1.0% - 1.5%.
1An unvalidated producer is one whose production does not yet cover his/her wages
Net-investment in Unvalidated1 Producer Pay
Understanding the NUPP
UNDER age 30 from WITHINthe insurance industry
OVER age 30 from WITHINthe insurance industry
UNDER age 30 from OUTSIDEthe insurance industry
OVER age 30 from OUTSIDEthe insurance industry
+25% ProfitAverage +25% Growth
13.3%51.1%12.2%18.9%
4.0%52.0%12.0%24.0%
12.0%48.0%12.0%28.0%
For state association and Council for Best Practices use only.
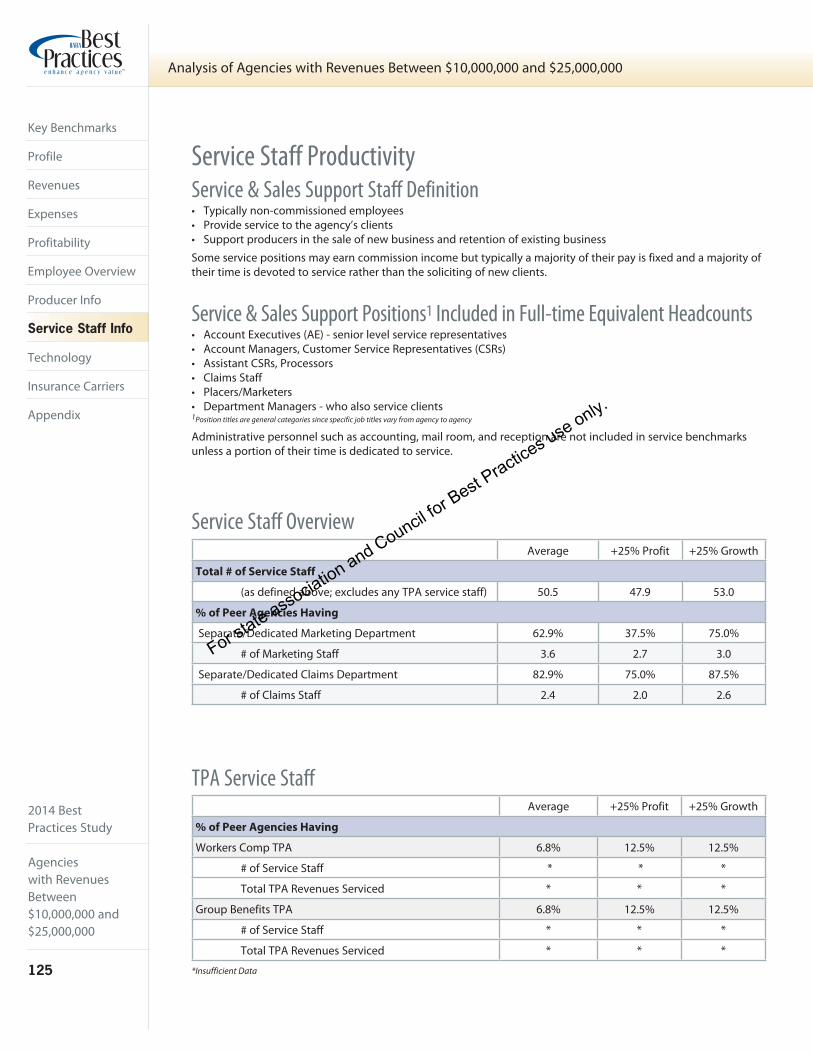
2014 BestPractices Study
Agencieswith RevenuesBetween $10,000,000 and $25,000,000
125
Analysis of Agencies with Revenues Between $10,000,000 and $25,000,000
Key Benchmarks
Profile
Revenues
Expenses
Profitability
Employee Overview
Producer Info
Service Staff Info
Technology
Insurance Carriers
Appendix
Average +25% Profit +25% Growth
Total # of Service Staff
(as defined above; excludes any TPA service staff) 50.5 47.9 53.0
% of Peer Agencies Having
Separate/Dedicated Marketing Department 62.9% 37.5% 75.0%
# of Marketing Staff 3.6 2.7 3.0
Separate/Dedicated Claims Department 82.9% 75.0% 87.5%
# of Claims Staff 2.4 2.0 2.6
Average +25% Profit +25% Growth
% of Peer Agencies Having
Workers Comp TPA 6.8% 12.5% 12.5%
# of Service Staff * * *
Total TPA Revenues Serviced * * *
Group Benefits TPA 6.8% 12.5% 12.5%
# of Service Staff * * *
Total TPA Revenues Serviced * * *
TPA Service Staff
Service & Sales Support Staff Definition• Typically non-commissioned employees• Provide service to the agency’s clients• Support producers in the sale of new business and retention of existing business
Some service positions may earn commission income but typically a majority of their pay is fixed and a majority of their time is devoted to service rather than the soliciting of new clients.
Service & Sales Support Positions1 Included in Full-time Equivalent Headcounts• Account Executives (AE) - senior level service representatives• Account Managers, Customer Service Representatives (CSRs)• Assistant CSRs, Processors• Claims Staff• Placers/Marketers• Department Managers - who also service clients1Position titles are general categories since specific job titles vary from agency to agency
Administrative personnel such as accounting, mail room, and reception are not included in service benchmarks unless a portion of their time is dedicated to service.
*Insufficient Data
Service Staff Overview
Service Staff Productivity
For state association and Council for Best Practices use only.

2014 BestPractices Study
Agencieswith Revenues
Between $10,000,000 and
$25,000,000
126
Analysis of Agencies with Revenues Between $10,000,000 and $25,000,000
Key Benchmarks
Profile
Revenues
Expenses
Profitability
Employee Overview
Producer Info
Service Staff Info
Technology
Insurance Carriers
Appendix
Service/Sales Support StaffAverage Top 25%
Commercial P&C Service/Sales Support
Number 28.2
High 53.4
Low 10.5
Average Revenue per Staff $296,697 $392,998
Total Commercial Service Payroll ($) $1,603,497
Payroll (as % of Total Commercial Revenue) 20.3%
Bonds P&C Service/Sales Support Staff
Number 1.5
High 2.0
Low 1.0
Average Revenue per Staff $298,617 $532,900
Total Bond Service Payroll ($) $89,781
Payroll (as % of Total Bond Revenue) 30.5%
Personal P&C Service/Sales Support Staff
Number 12.4
High 44.0
Low 1.0
Average Revenue per Staff $202,048 $322,245
Total Personal Service Payroll ($) $525,751
Payroll (as % of Total Personal Revenue) 26.0%
Group L&H Service/Sales Support Staff
Number 10.5
High 34.6
Low 1.0
Average Revenue per Staff $389,453 $552,339
Total Group L&H Service Payroll ($) $594,031
Payroll (as % of Total Group L&H Revenue) 16.0%
Individual L&H Service/Sales Support Staff
Number 1.4
High 6.0
Low 0.1
Average Revenue per Staff $367,171 $833,916
Total Individual L&H Service Payroll ($) $61,647
Payroll (as % of Total Individual L&H Revenue) 17.7%
Multi-Line Service/Sales Support Staff
Number *
High *
Low *
Average Revenue per Staff * *
Total Multi-Line Service Payroll ($) *
Payroll (as % of Total Multi-Line Revenue) **Insufficient Data
For state association and Council for Best Practices use only.
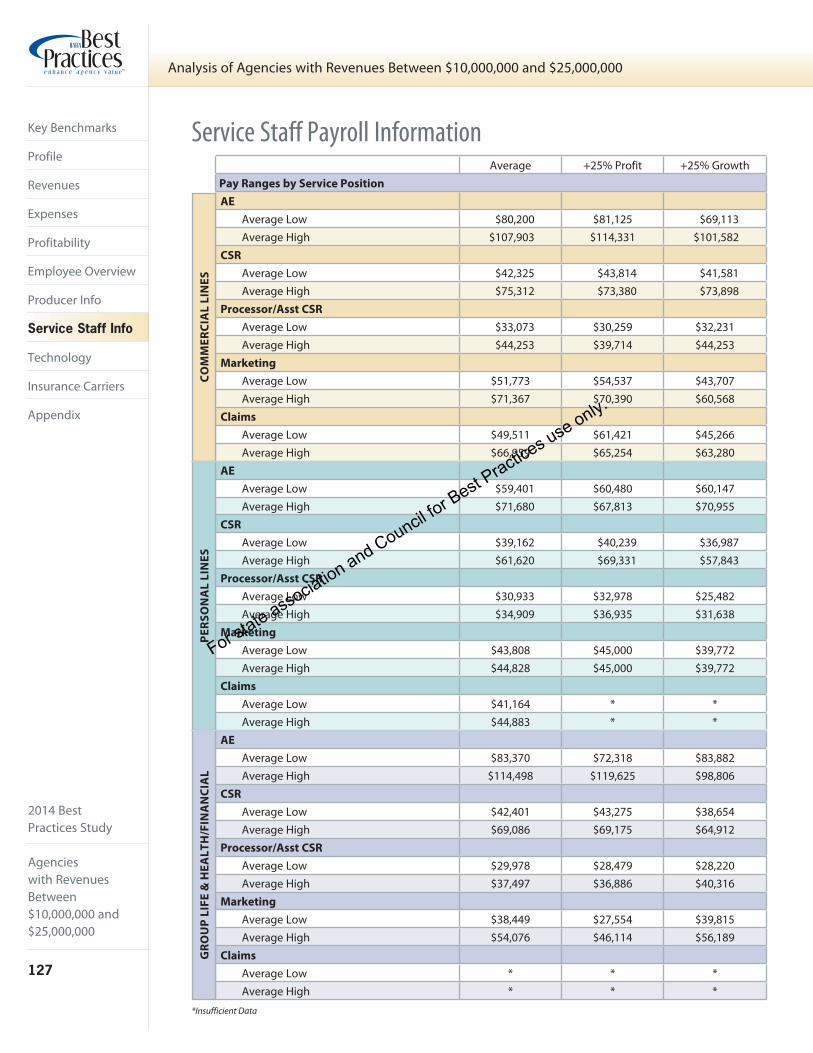
2014 BestPractices Study
Agencieswith RevenuesBetween $10,000,000 and $25,000,000
127
Analysis of Agencies with Revenues Between $10,000,000 and $25,000,000
Key Benchmarks
Profile
Revenues
Expenses
Profitability
Employee Overview
Producer Info
Service Staff Info
Technology
Insurance Carriers
Appendix
Service Staff Payroll InformationAverage +25% Profit +25% Growth
Pay Ranges by Service Position
AE
Average Low $80,200 $81,125 $69,113Average High $107,903 $114,331 $101,582
CSR
Average Low $42,325 $43,814 $41,581Average High $75,312 $73,380 $73,898
Processor/Asst CSR
Average Low $33,073 $30,259 $32,231Average High $44,253 $39,714 $44,253
Marketing
Average Low $51,773 $54,537 $43,707Average High $71,367 $70,390 $60,568
Claims
Average Low $49,511 $61,421 $45,266Average High $66,959 $65,254 $63,280
AE
Average Low $59,401 $60,480 $60,147Average High $71,680 $67,813 $70,955
CSR
Average Low $39,162 $40,239 $36,987Average High $61,620 $69,331 $57,843
Processor/Asst CSR
Average Low $30,933 $32,978 $25,482Average High $34,909 $36,935 $31,638
Marketing
Average Low $43,808 $45,000 $39,772Average High $44,828 $45,000 $39,772
Claims
Average Low $41,164 * *Average High $44,883 * *
AE
Average Low $83,370 $72,318 $83,882Average High $114,498 $119,625 $98,806
CSR
Average Low $42,401 $43,275 $38,654Average High $69,086 $69,175 $64,912
Processor/Asst CSR
Average Low $29,978 $28,479 $28,220Average High $37,497 $36,886 $40,316
Marketing
Average Low $38,449 $27,554 $39,815Average High $54,076 $46,114 $56,189
Claims
Average Low * * *Average High * * *
CO
MM
ER
CIA
L L
INE
SP
ER
SO
NA
L L
INE
SG
RO
UP
LIF
E &
HE
AL
TH
/FIN
AN
CIA
L
*Insufficient Data
For state association and Council for Best Practices use only.

2014 BestPractices Study
Agencieswith Revenues
Between $10,000,000 and
$25,000,000
128
Analysis of Agencies with Revenues Between $10,000,000 and $25,000,000
Key Benchmarks
Profile
Revenues
Expenses
Profitability
Employee Overview
Producer Info
Service Staff Info
Technology
Insurance Carriers
Appendix
Average Top 25%
Information Technology Employees (FTE)
Number 2.0
High 4.0
Low 1.0
Number of IT Employees per 100 users 2.3
Revenue per IT Employee $8,285,567 $12,307,230
Total IT Payroll Expense ($) $142,096 $227,520
As % of Total Compensation Expense 1.4%
As % of Net Revenues 0.9%
1 Includes hardware/software leasing including offsite applications, supplies, maintenance & maintenance contracts, training, data lines, internet providers, website development/maintenance, outside consulting fees, computer depreciation, software amortization, and any non-depreciated hardware/software.
Other included XDTI/Nexsure.
Technology
Agency Management System Utilized
Average +25% Profit +25% Growth
Total IT Expenses1 (as % of net revenues) 2.5% 2.6% 2.8%
TAM25.7%
AMS36031.4%
EPIC14.3%
Other2.9%Vision
5.7%
Sagitta20.0%
For state association and Council for Best Practices use only.

2014 BestPractices Study
Agencieswith RevenuesBetween $10,000,000 and $25,000,000
129
Analysis of Agencies with Revenues Between $10,000,000 and $25,000,000
Key Benchmarks
Profile
Revenues
Expenses
Profitability
Employee Overview
Producer Info
Service Staff Info
Technology
Insurance Carriers
Appendix
Average +25% Profit +25% Growth
Service Center Use
Total Personal Lines Commission placed in Carrier Service Center 12.4% 13.6% *
Total Commercial Lines Commission placed in Carrier Service Center 3.2% 10.6% 2.3%
Use of Carrier Service Centers
Average +25% Profit +25% Growth
Carrier Representation
Personal Lines P&C
National 13.0 17.7 14.0
Regional 8.9 14.3 10.9
Total 21.8 32.0 24.9
Commercial Lines P&C
National 29.9 28.0 37.0
Regional 17.8 24.1 22.0
Total 47.8 52.1 59.0
Group L&H / Financial
Total Life, Health, Disability, LTC,
Retirement Products, and Other42.3 44.0 38.3
Carriers
Average +25% Profit +25% Growth
% of Total Commission & Fee Revenue Derived from Direct Versus Indirect Appointments
INDIRECT Carrier Appointments 17.1% 13.7% 15.5%
DIRECT Carrier Appointments 82.9% 86.3% 84.5%
Carrier Appointments
*Insufficient Data
For state association and Council for Best Practices use only.

2014 BestPractices Study
Agencieswith Revenues
Between $10,000,000 and
$25,000,000
130
Analysis of Agencies with Revenues Between $10,000,000 and $25,000,000
Key Benchmarks
Profile
Revenues
Expenses
Profitability
Employee Overview
Producer Info
Service Staff Info
Technology
Insurance Carriers
Appendix
Average +25% Profit +25% Growth
P&C Commission Income from Top Carriers
Top P&C Carrier $1,751,905 $1,311,780 $2,016,752
as % of Agency Net Revenue 11.5% 9.1% 10.9%
Top 3 P&C Carriers $3,575,172 $3,247,017 $3,881,360
as % of Agency Net Revenue 23.6% 22.0% 21.5%
Revenue from Top Insurance Carriers
Average +25% Profit +25% Growth
L&H/F Commission Income from Top Carriers
as % of Net Rev from Top L&H/F Carrier 6.4% 8.2% 6.2%
as % of Net Rev from Top 3 L&H/F Carriers 10.7% 13.4% 11.5%
Top P&C Carrier—Breakdown By Line of Business
Top 3 P&C Carriers—Breakdown By Line of Business
+25% ProfitAverage
Mid/LargeCommerical56.4%
Personal29.8%
Mid/LargeCommerical50.8%
Personal34.0%
SmallCommercial15.2%
SmallCommercial13.8%
SmallCommercial6.8%
Mid/LargeCommerical58.0%
Personal35.2%
+25% Growth
Mid/LargeCommerical48.4%
+25% Growth+25% ProfitAverage
Mid/LargeCommerical48.1%
Personal30.9%
SmallCommercial21.1%
Personal28.7%
SmallCommercial22.9%
Mid/LargeCommerical51.7%
Personal32.7%
SmallCommercial15.6%
For state association and Council for Best Practices use only.

2014 BestPractices Study
131
2014 Best Practices Study
For state association and Council for Best Practices use only.

2014 BestPractices Study
132
2014 Best Practices Study
Agencies with Revenues Over $25,000,000
$1,250,000 $25,000,000$2,500,000 $5,000,000 $10,000,000
For state association and Council for Best Practices use only.
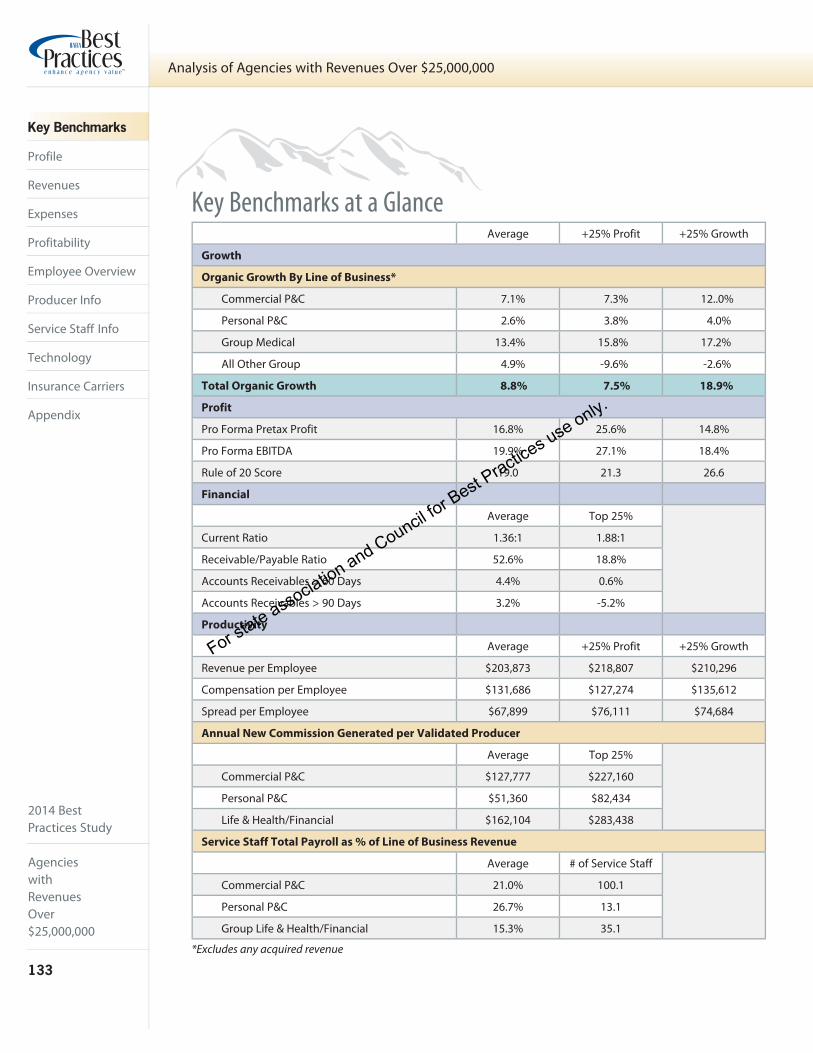
2014 BestPractices Study
Agencieswith RevenuesOver $25,000,000
133
Analysis of Agencies with Revenues Over $25,000,000
Key Benchmarks
Profile
Revenues
Expenses
Profitability
Employee Overview
Producer Info
Service Staff Info
Technology
Insurance Carriers
Appendix
Key Benchmarks at a Glance Average +25% Profit +25% Growth
Growth
Organic Growth By Line of Business*
Commercial P&C 7.1% 7.3% 12..0%
Personal P&C 2.6% 3.8% 4.0%
Group Medical 13.4% 15.8% 17.2%
All Other Group 4.9% -9.6% -2.6%
Total Organic Growth 8.8% 7.5% 18.9%
Profit
Pro Forma Pretax Profit 16.8% 25.6% 14.8%
Pro Forma EBITDA 19.9% 27.1% 18.4%
Rule of 20 Score 19.0 21.3 26.6
Financial
Average Top 25%
Current Ratio 1.36:1 1.88:1
Receivable/Payable Ratio 52.6% 18.8%
Accounts Receivables > 60 Days 4.4% 0.6%
Accounts Receivables > 90 Days 3.2% -5.2%
Productivity
Average +25% Profit +25% Growth
Revenue per Employee $203,873 $218,807 $210,296
Compensation per Employee $131,686 $127,274 $135,612
Spread per Employee $67,899 $76,111 $74,684
Annual New Commission Generated per Validated Producer
Average Top 25%
Commercial P&C $127,777 $227,160
Personal P&C $51,360 $82,434
Life & Health/Financial $162,104 $283,438
Service Staff Total Payroll as % of Line of Business Revenue
Average # of Service Staff
Commercial P&C 21.0% 100.1
Personal P&C 26.7% 13.1
Group Life & Health/Financial 15.3% 35.1
*Excludes any acquired revenue
For state association and Council for Best Practices use only.

2014 BestPractices Study
Agencieswith
RevenuesOver
$25,000,000
134
Analysis of Agencies with Revenues Over $25,000,000
Key Benchmarks
Profile
Revenues
Expenses
Profitability
Employee Overview
Producer Info
Service Staff Info
Technology
Insurance Carriers
Appendix
Average Total Revenues: $62,381,287
Population Density of Metropolitan Areas Where Home Offi ce is Located
Average +25% Profi t +25% Growth
Less than 50,000 0.0% 0.0% 0.0%
50,000 – 250,000 20.7% 28.6% 42.9%
250,000 – 1,000,000 44.8% 42.9% 28.6%
More than 1,000,000 34.5% 28.6% 28.6%
Corporate Structure
C 37.9% 42.9% 42.9%
S 51.7% 42.9% 42.9%
Partnership 3.4% 14.3% 0.0%
LLC 6.9% 0.0% 14.3%
Sole Proprietorship 0.0% 0.0% 0.0%
Average Number of Agency Locations
(Main Offi ces and Branch Offi ces) 8.8 5.7 9.9
Total Square Footage of Office Space 88,622 73,918 55,806
# of States in which Offices are Located 3.1 2.2 2.1
Agency has an ESOP 31.0% 14.3% 42.9%
% of Stock Owned by ESOP 46.7% 26.3% 46.2%
Shareholders
Number of Shareholders (excluding ESOP) 33.5 44.0 37.2
High 122.0
Low 2.0
Ownership Percentage
% Owned by Largest Shareholder 27.3% 22.9% 24.9%
High 99.0%
Low 1.5%
Shareholder Age
Current Age of Largest Shareholder 59.3 61.4 59.5
Parent Corporation
Average
% of Agencies Owned by Another Corporation 17.9%
Description of Parent Corporation
Financial Institution 83.3%
National Broker 16.7%
Other 0.0%
Member of Group
% of Agencies Belonging to a Franchise, Cluster, Alliance/Network or Aggregator Group 44.8% Other included Assurex Global, and Worldwide Broker
Network.
Profi le (of Agencies in this Study Group)
For state association and Council for Best Practices use only.

2014 BestPractices Study
Agencieswith RevenuesOver $25,000,000
135
Analysis of Agencies with Revenues Over $25,000,000
Key Benchmarks
Profile
Revenues
Expenses
Profitability
Employee Overview
Producer Info
Service Staff Info
Technology
Insurance Carriers
Appendix
Revenues
Revenue by Source (% of Gross Revenues)
(% by Source) Average +25% Profit +25% Growth
Property & Casualty
Commercial Commissions & Fees 52.8% 59.1% 40.5%
Bonds 3.5% 4.2% 2.7%
Personal Commissions 6.7% 4.0% 11.1%
Value Added Services 1.9% 1.2% 2.3%
Contingent/Bonus 5.6% 6.0% 6.4%
Total P&C 70.4% 74.6% 63.0%
Life & Health/Financial
Group Medical Commissions & Fees 19.4% 17.7% 21.7%
All Other Group Commissions & Fees 5.9% 4.0% 8.6%
Individual L&H Commissions & Fees 1.2% 1.4% 1.9%
Bonus/Overrides 1.7% 1.6% 2.7%
Total L&H/Financial 28.2% 24.7% 35.0%
Investments 0.5% 0.1% 0.8%
Miscellaneous 0.8% 0.6% 1.3%
Gross Revenues 100.0% 100.0% 100.0%
Brokerage Commission Expense 2.4% 2.0% 3.1%
Net Revenues 97.6% 98.0% 96.9%
% T
otal
Rev
enue
10.0%
20.0%
30.0%
40.0%
50.0%
60.0%
0.0%P&C
Contingent/Bonus
P&CVASFees
P&CPersonalComm& Fees
P&CBondsComm& Fees
P&CCommercial
Comm& Fees
L&HGroup
MedicalComm& Fees
L&HAll OtherGroupComm& Fees
L&HIndividualComm& Fees
L&HBonus/
Overrides
Investments Miscellaneous
Average +25% Profit +25% Growth
For state association and Council for Best Practices use only.

2014 BestPractices Study
Agencieswith
RevenuesOver
$25,000,000
136
Analysis of Agencies with Revenues Over $25,000,000
Key Benchmarks
Profile
Revenues
Expenses
Profitability
Employee Overview
Producer Info
Service Staff Info
Technology
Insurance Carriers
Appendix
What the Typical Transactions Looked Like
Revenues Acquired per Transaction Multiples of Revenue Paid
Average $967,284 Average 1.25x
High $2,998,725 High 1.90x
Low $160,000 Low 1.00x
Acquired Revenues
% of Agencies
Acquiring
Average
Commissions
Acquired
% of
Net Revenues
Acquisitions Made in Last 12 Months 34.5% $5,608,047 7.5%
Revenue by Acquisition
Revenue by Specialty/NicheAverage +25% Profit +25% Growth
% of Agencies having an Industry and/or
Product Specialty/Niche69.0% 57.1% 42.9%
Total Commissions & Fees Generated from All Specialties/Niches $17,663,360 $10,141,281 $8,778,421
Total Specialty/Niche Revenue as % of Net Revenues 34.1% 29.2% 17.1%
Specialty/Niche Revenue as % of Net Revenue
Average +25% Profit +25% Growth
10%
20%
30%
40%
50%
34.1%
17%
0%
29.2%
For state association and Council for Best Practices use only.
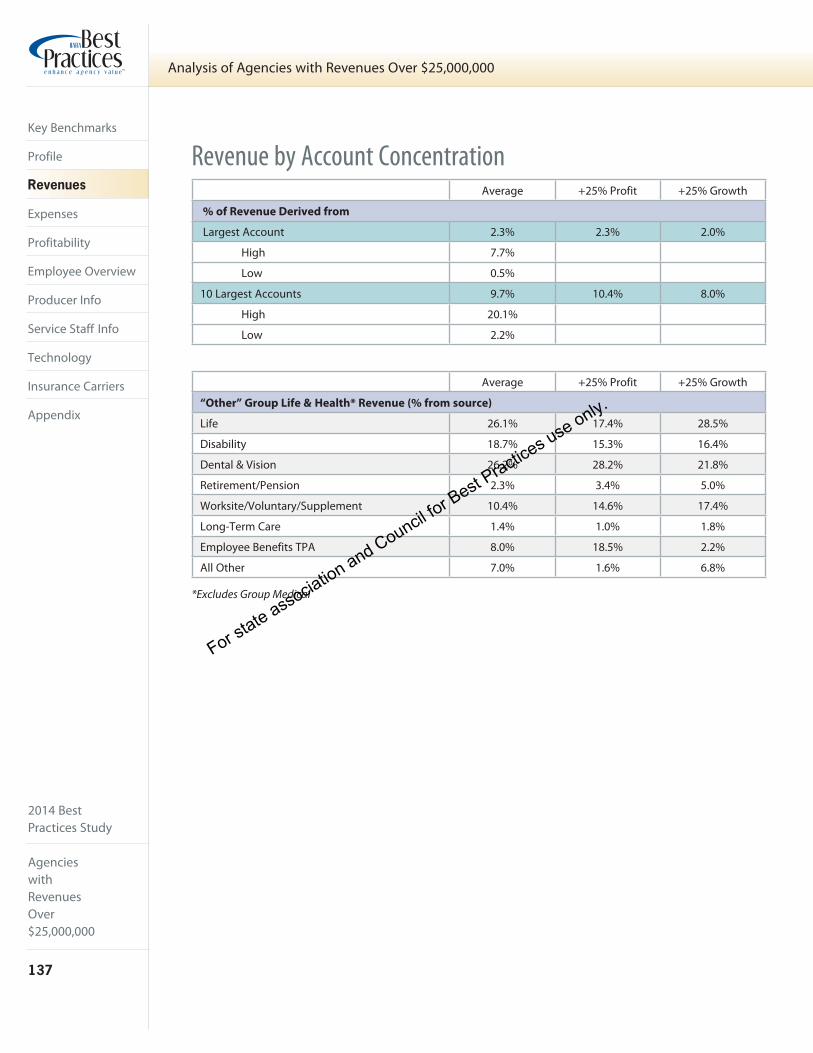
2014 BestPractices Study
Agencieswith RevenuesOver $25,000,000
137
Analysis of Agencies with Revenues Over $25,000,000
Key Benchmarks
Profile
Revenues
Expenses
Profitability
Employee Overview
Producer Info
Service Staff Info
Technology
Insurance Carriers
Appendix
Revenue by Account ConcentrationAverage +25% Profit +25% Growth
% of Revenue Derived from
Largest Account 2.3% 2.3% 2.0%
High 7.7%
Low 0.5%
10 Largest Accounts 9.7% 10.4% 8.0%
High 20.1%
Low 2.2%
Average +25% Profit +25% Growth
“Other” Group Life & Health* Revenue (% from source)
Life 26.1% 17.4% 28.5%
Disability 18.7% 15.3% 16.4%
Dental & Vision 26.2% 28.2% 21.8%
Retirement/Pension 2.3% 3.4% 5.0%
Worksite/Voluntary/Supplement 10.4% 14.6% 17.4%
Long-Term Care 1.4% 1.0% 1.8%
Employee Benefits TPA 8.0% 18.5% 2.2%
All Other 7.0% 1.6% 6.8%
*Excludes Group Medical
For state association and Council for Best Practices use only.
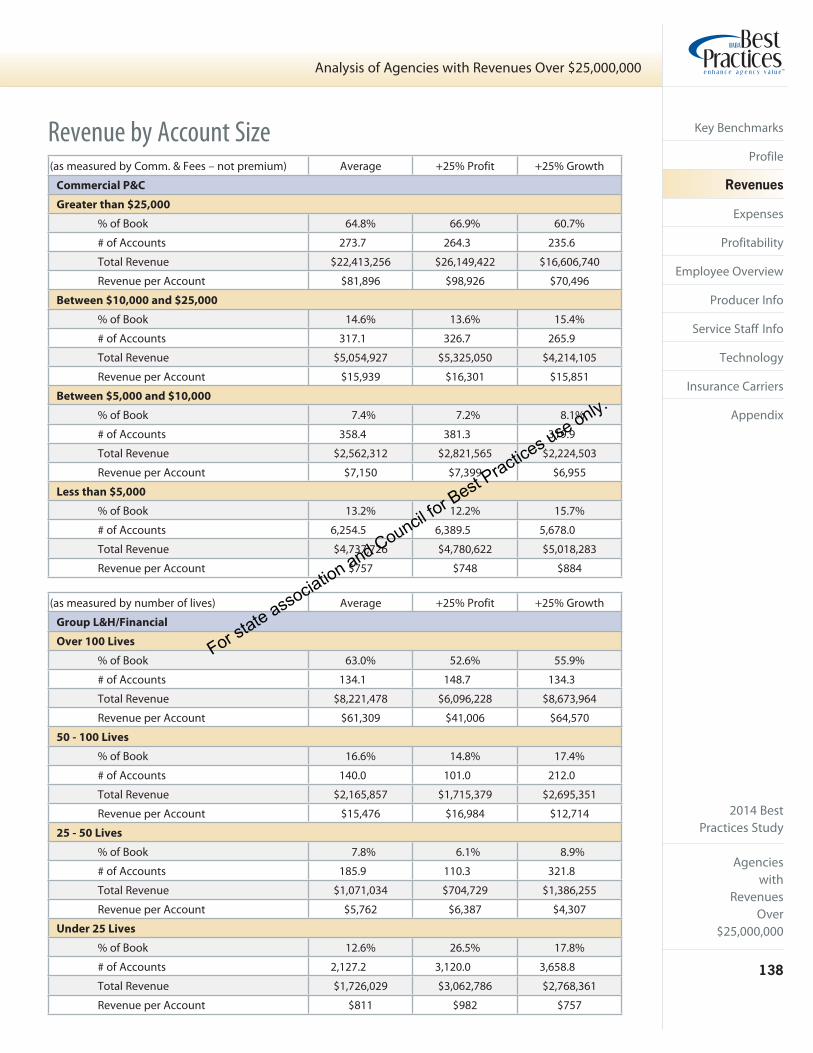
2014 BestPractices Study
Agencieswith
RevenuesOver
$25,000,000
138
Analysis of Agencies with Revenues Over $25,000,000
Key Benchmarks
Profile
Revenues
Expenses
Profitability
Employee Overview
Producer Info
Service Staff Info
Technology
Insurance Carriers
Appendix
Revenue by Account Size(as measured by Comm. & Fees – not premium) Average +25% Profit +25% Growth
Commercial P&C
Greater than $25,000
% of Book 64.8% 66.9% 60.7%
# of Accounts 273.7 264.3 235.6
Total Revenue $22,413,256 $26,149,422 $16,606,740
Revenue per Account $81,896 $98,926 $70,496
Between $10,000 and $25,000
% of Book 14.6% 13.6% 15.4%
# of Accounts 317.1 326.7 265.9
Total Revenue $5,054,927 $5,325,050 $4,214,105
Revenue per Account $15,939 $16,301 $15,851
Between $5,000 and $10,000
% of Book 7.4% 7.2% 8.1%
# of Accounts 358.4 381.3 319.9
Total Revenue $2,562,312 $2,821,565 $2,224,503
Revenue per Account $7,150 $7,399 $6,955
Less than $5,000
% of Book 13.2% 12.2% 15.7%
# of Accounts 6,254.5 6,389.5 5,678.0
Total Revenue $4,737,726 $4,780,622 $5,018,283
Revenue per Account $757 $748 $884
(as measured by number of lives) Average +25% Profit +25% Growth
Group L&H/Financial
Over 100 Lives
% of Book 63.0% 52.6% 55.9%
# of Accounts 134.1 148.7 134.3
Total Revenue $8,221,478 $6,096,228 $8,673,964
Revenue per Account $61,309 $41,006 $64,570
50 - 100 Lives
% of Book 16.6% 14.8% 17.4%
# of Accounts 140.0 101.0 212.0
Total Revenue $2,165,857 $1,715,379 $2,695,351
Revenue per Account $15,476 $16,984 $12,714
25 - 50 Lives
% of Book 7.8% 6.1% 8.9%
# of Accounts 185.9 110.3 321.8
Total Revenue $1,071,034 $704,729 $1,386,255
Revenue per Account $5,762 $6,387 $4,307
Under 25 Lives
% of Book 12.6% 26.5% 17.8%
# of Accounts 2,127.2 3,120.0 3,658.8
Total Revenue $1,726,029 $3,062,786 $2,768,361
Revenue per Account $811 $982 $757
For state association and Council for Best Practices use only.

2014 BestPractices Study
Agencieswith RevenuesOver $25,000,000
139
Analysis of Agencies with Revenues Over $25,000,000
Key Benchmarks
Profile
Revenues
Expenses
Profitability
Employee Overview
Producer Info
Service Staff Info
Technology
Insurance Carriers
Appendix
Revenue Growth by Source
*Insufficient Data
Average +25% Profit +25% Growth
Commercial P&C
Renewals1 94.8% 95.0% 99.3%
New Business2 12.3% 12.3% 12.6%
Acquired Revenues3 1.1% 0.5% 3.0%
Organic Growth4 7.1% 7.3% 12.0%
Total Growth5 8.1% 7.8% 15.0%
Bonds P&C
Renewals1 81.7% 90.8% 86.3%
New Business2 23.9% 13.7% 23.9%
Acquired Revenues3 0.8% 0.0% 3.5%
Organic Growth4 5.6% 4.5% 10.1%
Total Growth5 6.4% 4.5% 13.6%
Personal P&C
Renewals1 90.4% 95.3% 87.0%
New Business2 12.2% 8.6% 17.0%
Acquired Revenues3 1.2% 0.9% 3.5%
Organic Growth4 2.6% 3.8% 4.0%
Total Growth5 3.7% 4.7% 7.5%
Value Added Services P&C
Renewals1 79.6% 65.0% 90.9%
New Business2 30.2% 42.9% 19.6%
Acquired Revenues3 0.0% 0.0% 0.0%
Organic Growth4 9.8% 7.9% 10.4%
Total Growth5 9.8% 7.9% 10.4%
1Renewal Revenues as a % of prior year’s total revenues for this line of business. This figure is impacted by attrition (loss or retention of accounts) and by changes in premium and commission levels. The higher the %, the more favorable the results.
2New Revenues as a % of prior year’s total revenues for this line of business. The higher the %, the more favorable the results.
3Acquired Revenues as a % of prior year’s total revenues for this line of business. The % indicates the significance of acquired business.
4Growth in Revenues from prior year excluding acquired revenues.
5Growth in Revenues from prior year including acquired revenues.
For state association and Council for Best Practices use only.
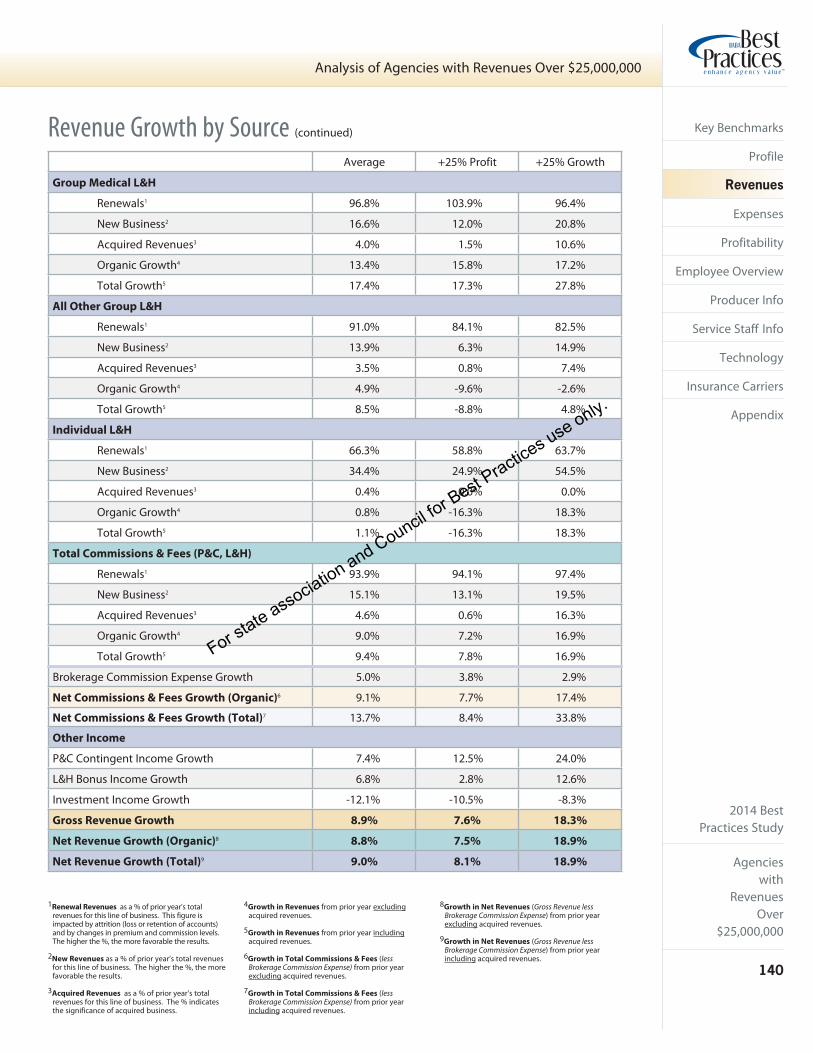
2014 BestPractices Study
Agencieswith
RevenuesOver
$25,000,000
140
Analysis of Agencies with Revenues Over $25,000,000
Key Benchmarks
Profile
Revenues
Expenses
Profitability
Employee Overview
Producer Info
Service Staff Info
Technology
Insurance Carriers
Appendix
Revenue Growth by Source (continued)
Average +25% Profit +25% Growth
Group Medical L&H
Renewals1 96.8% 103.9% 96.4%
New Business2 16.6% 12.0% 20.8%
Acquired Revenues3 4.0% 1.5% 10.6%
Organic Growth4 13.4% 15.8% 17.2%
Total Growth5 17.4% 17.3% 27.8%
All Other Group L&H
Renewals1 91.0% 84.1% 82.5%
New Business2 13.9% 6.3% 14.9%
Acquired Revenues3 3.5% 0.8% 7.4%
Organic Growth4 4.9% -9.6% -2.6%
Total Growth5 8.5% -8.8% 4.8%
Individual L&H
Renewals1 66.3% 58.8% 63.7%
New Business2 34.4% 24.9% 54.5%
Acquired Revenues3 0.4% 0.0% 0.0%
Organic Growth4 0.8% -16.3% 18.3%
Total Growth5 1.1% -16.3% 18.3%
Total Commissions & Fees (P&C, L&H)
Renewals1 93.9% 94.1% 97.4%
New Business2 15.1% 13.1% 19.5%
Acquired Revenues3 4.6% 0.6% 16.3%
Organic Growth4 9.0% 7.2% 16.9%
Total Growth5 9.4% 7.8% 16.9%
Brokerage Commission Expense Growth 5.0% 3.8% 2.9%
Net Commissions & Fees Growth (Organic)6 9.1% 7.7% 17.4%
Net Commissions & Fees Growth (Total)7 13.7% 8.4% 33.8%
Other Income
P&C Contingent Income Growth 7.4% 12.5% 24.0%
L&H Bonus Income Growth 6.8% 2.8% 12.6%
Investment Income Growth -12.1% -10.5% -8.3%
Gross Revenue Growth 8.9% 7.6% 18.3%
Net Revenue Growth (Organic)8 8.8% 7.5% 18.9%
Net Revenue Growth (Total)9 9.0% 8.1% 18.9%
1Renewal Revenues as a % of prior year’s total revenues for this line of business. This figure is impacted by attrition (loss or retention of accounts) and by changes in premium and commission levels. The higher the %, the more favorable the results.
2New Revenues as a % of prior year’s total revenues for this line of business. The higher the %, the more favorable the results.
3Acquired Revenues as a % of prior year’s total revenues for this line of business. The % indicates the significance of acquired business.
4Growth in Revenues from prior year excluding acquired revenues.
5Growth in Revenues from prior year including acquired revenues.
6Growth in Total Commissions & Fees (less Brokerage Commission Expense) from prior year excluding acquired revenues.
7Growth in Total Commissions & Fees (less Brokerage Commission Expense) from prior year including acquired revenues.
8Growth in Net Revenues (Gross Revenue less Brokerage Commission Expense) from prior year excluding acquired revenues.
9Growth in Net Revenues (Gross Revenue less Brokerage Commission Expense) from prior year including acquired revenues.
For state association and Council for Best Practices use only.
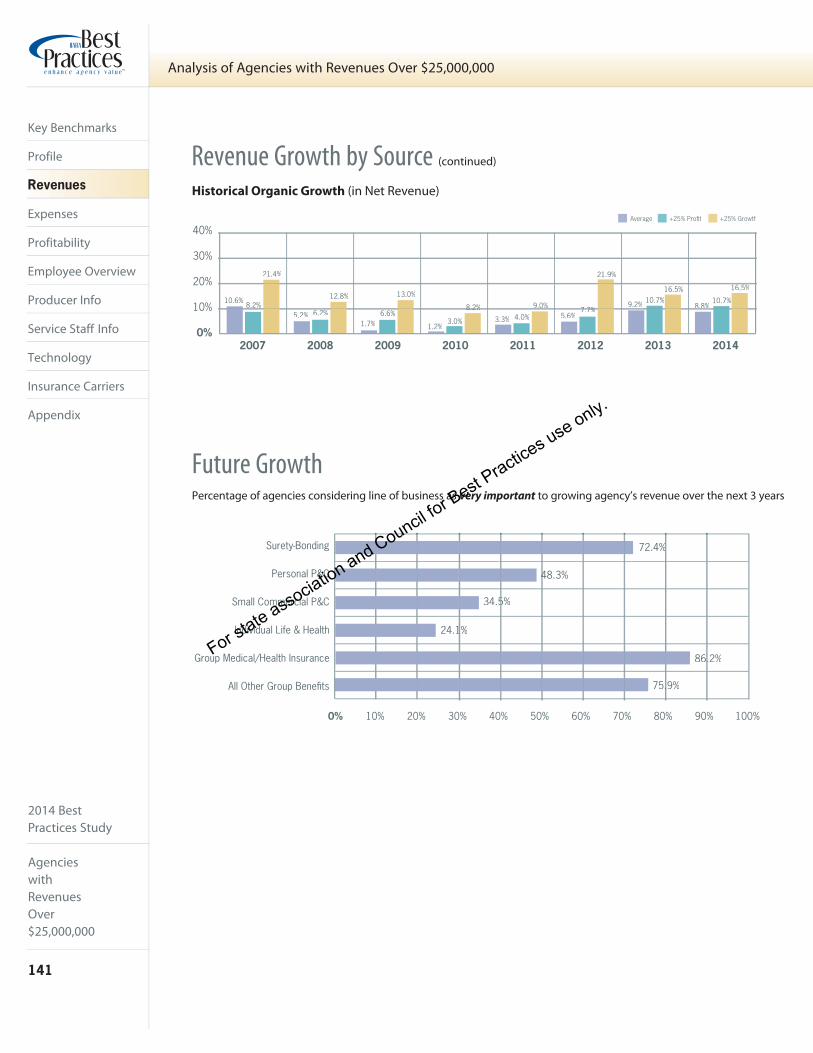
2014 BestPractices Study
Agencieswith RevenuesOver $25,000,000
141
Analysis of Agencies with Revenues Over $25,000,000
Key Benchmarks
Profile
Revenues
Expenses
Profitability
Employee Overview
Producer Info
Service Staff Info
Technology
Insurance Carriers
Appendix
Revenue Growth by Source (continued)
Historical Organic Growth (in Net Revenue)
Future GrowthPercentage of agencies considering line of business as very important to growing agency’s revenue over the next 3 years
Surety-Bonding 72.4%
Personal P&C 48.3%4
34.5%5Small Commercial P&C
Individual Life & Health 24.1%1
Group Medical/Health Insurance 86.2%.
75.9%.All Other Group Benefits
0% 10% 20% 30% 40% 50% 60% 70% 80% 90% 100%
2007 2008 2009 2010 2011 2012 2013 2014
10%
20%
30%
40%
10.6%8.2%
21.4%
5.2% 6.2%
12.8%
1.7%6.6%
13.0%
1.2%3.0%
8.2%8 2%
3.3% 4.0%
9.0%5.6%
7.7%7 7%
21.9%
9.2% 10.7%16.5%
8.8%8.8%10.7%
16.5%
0%
Average +25% Profit +25% Growth
For state association and Council for Best Practices use only.
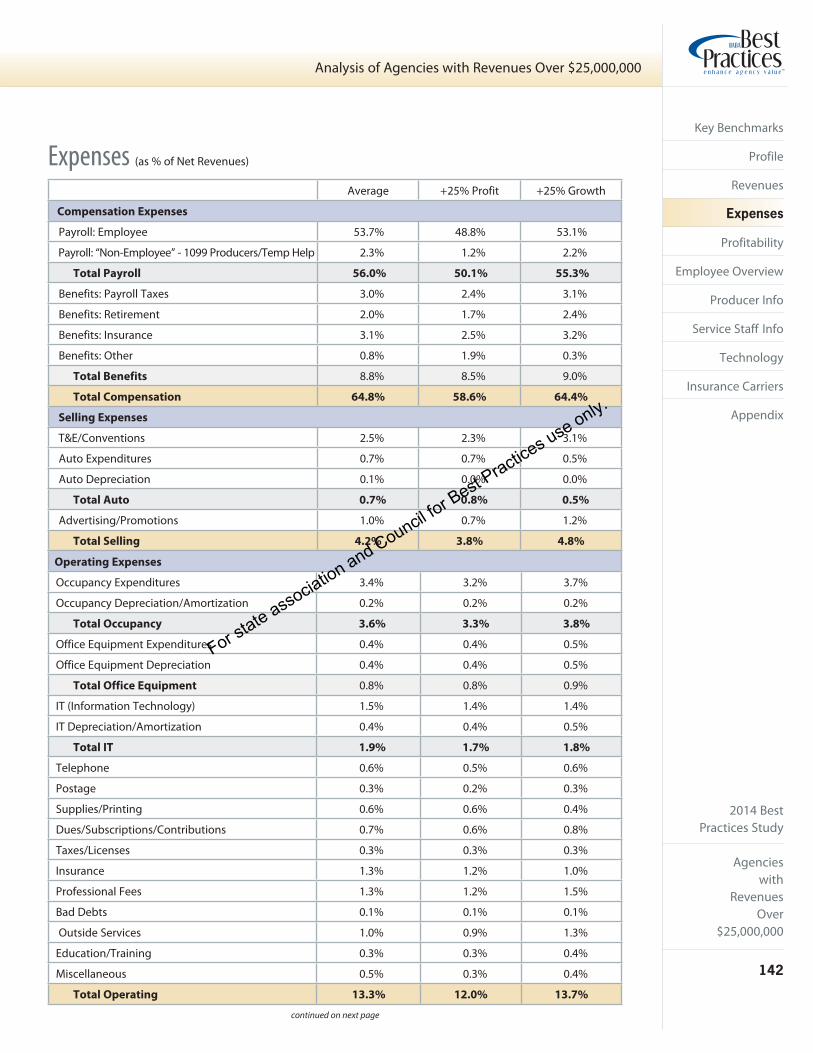
2014 BestPractices Study
Agencieswith
RevenuesOver
$25,000,000
142
Analysis of Agencies with Revenues Over $25,000,000
Key Benchmarks
Profile
Revenues
Expenses
Profitability
Employee Overview
Producer Info
Service Staff Info
Technology
Insurance Carriers
Appendix
Expenses (as % of Net Revenues)
Average +25% Profit +25% Growth
Compensation Expenses
Payroll: Employee 53.7% 48.8% 53.1%
Payroll: “Non-Employee” - 1099 Producers/Temp Help 2.3% 1.2% 2.2%
Total Payroll 56.0% 50.1% 55.3%
Benefits: Payroll Taxes 3.0% 2.4% 3.1%
Benefits: Retirement 2.0% 1.7% 2.4%
Benefits: Insurance 3.1% 2.5% 3.2%
Benefits: Other 0.8% 1.9% 0.3%
Total Benefits 8.8% 8.5% 9.0%
Total Compensation 64.8% 58.6% 64.4%
Selling Expenses
T&E/Conventions 2.5% 2.3% 3.1%
Auto Expenditures 0.7% 0.7% 0.5%
Auto Depreciation 0.1% 0.0% 0.0%
Total Auto 0.7% 0.8% 0.5%
Advertising/Promotions 1.0% 0.7% 1.2%
Total Selling 4.2% 3.8% 4.8%
Operating Expenses
Occupancy Expenditures 3.4% 3.2% 3.7%
Occupancy Depreciation/Amortization 0.2% 0.2% 0.2%
Total Occupancy 3.6% 3.3% 3.8%
Office Equipment Expenditures 0.4% 0.4% 0.5%
Office Equipment Depreciation 0.4% 0.4% 0.5%
Total Office Equipment 0.8% 0.8% 0.9%
IT (Information Technology) 1.5% 1.4% 1.4%
IT Depreciation/Amortization 0.4% 0.4% 0.5%
Total IT 1.9% 1.7% 1.8%
Telephone 0.6% 0.5% 0.6%
Postage 0.3% 0.2% 0.3%
Supplies/Printing 0.6% 0.6% 0.4%
Dues/Subscriptions/Contributions 0.7% 0.6% 0.8%
Taxes/Licenses 0.3% 0.3% 0.3%
Insurance 1.3% 1.2% 1.0%
Professional Fees 1.3% 1.2% 1.5%
Bad Debts 0.1% 0.1% 0.1%
Outside Services 1.0% 0.9% 1.3%
Education/Training 0.3% 0.3% 0.4%
Miscellaneous 0.5% 0.3% 0.4%
Total Operating 13.3% 12.0% 13.7%
continued on next page
For state association and Council for Best Practices use only.

2014 BestPractices Study
Agencieswith RevenuesOver $25,000,000
143
Analysis of Agencies with Revenues Over $25,000,000
Key Benchmarks
Profile
Revenues
Expenses
Profitability
Employee Overview
Producer Info
Service Staff Info
Technology
Insurance Carriers
Appendix
Average +25% Profit +25% Growth
Administrative Expenses
Amortization of Intangibles 1.6% 0.4% 2.0%
Officer Life 0.1% 0.0% 0.2%
Interest 0.4% 0.1% 0.5%
Other 0.8% 0.0% 0.4%
Total Administrative 2.9% 0.6% 3.0%
Total Expenses 85.2% 75.0% 85.9%
Pre-Tax Profit (Loss) 14.8% 25.0% 14.1%
EBITDA 17.8% 26.5% 17.7%
Average +25% Profit +25% Growth
Expense Growth Over Prior Year
Compensation Expense 9.0% 7.3% 13.8%
Selling Expense 11.9% 8.9% 16.7%
Operating Expense 8.8% 8.2% 13.9%
Administrative Expense 7.3% 0.2% 24.6%
Expenses (as % of Net Revenues) — continued
Expenses (as % of Net Revenues)
Compensation Selling Operating Administrative0%
10%
20%
30%
40%
50%
60%
70%Average +25% Profit +25% Growth
4.2% 3.8%3.8% 4.8%
13.3% 12.0%12 0% 13.7%
2.9%2.9% 0.6%0 6%3.0%
64.8% 64.4%64.4%58.6%
For state association and Council for Best Practices use only.
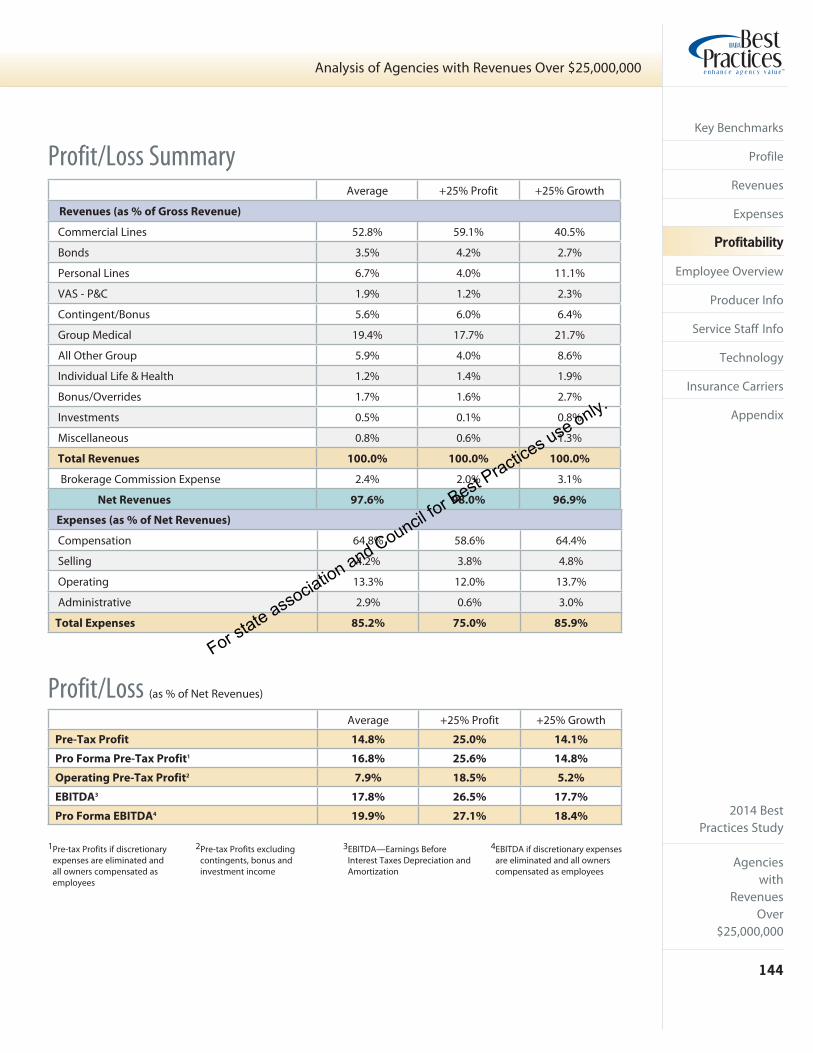
2014 BestPractices Study
Agencieswith
RevenuesOver
$25,000,000
144
Analysis of Agencies with Revenues Over $25,000,000
Key Benchmarks
Profile
Revenues
Expenses
Profitability
Employee Overview
Producer Info
Service Staff Info
Technology
Insurance Carriers
Appendix
Average +25% Profit +25% Growth
Revenues (as % of Gross Revenue)
Commercial Lines 52.8% 59.1% 40.5%
Bonds 3.5% 4.2% 2.7%
Personal Lines 6.7% 4.0% 11.1%
VAS - P&C 1.9% 1.2% 2.3%
Contingent/Bonus 5.6% 6.0% 6.4%
Group Medical 19.4% 17.7% 21.7%
All Other Group 5.9% 4.0% 8.6%
Individual Life & Health 1.2% 1.4% 1.9%
Bonus/Overrides 1.7% 1.6% 2.7%
Investments 0.5% 0.1% 0.8%
Miscellaneous 0.8% 0.6% 1.3%
Total Revenues 100.0% 100.0% 100.0%
Brokerage Commission Expense 2.4% 2.0% 3.1%
Net Revenues 97.6% 98.0% 96.9%
Expenses (as % of Net Revenues)
Compensation 64.8% 58.6% 64.4%
Selling 4.2% 3.8% 4.8%
Operating 13.3% 12.0% 13.7%
Administrative 2.9% 0.6% 3.0%
Total Expenses 85.2% 75.0% 85.9%
Average +25% Profit +25% Growth
Pre-Tax Profit 14.8% 25.0% 14.1%
Pro Forma Pre-Tax Profit1 16.8% 25.6% 14.8%
Operating Pre-Tax Profit2 7.9% 18.5% 5.2%
EBITDA3 17.8% 26.5% 17.7%
Pro Forma EBITDA4 19.9% 27.1% 18.4%
1Pre-tax Profits if discretionary expenses are eliminated and all owners compensated as employees
2Pre-tax Profits excluding contingents, bonus and investment income
3EBITDA—Earnings Before Interest Taxes Depreciation and Amortization
4EBITDA if discretionary expenses are eliminated and all owners compensated as employees
Profit/Loss Summary
Profit/Loss (as % of Net Revenues)
For state association and Council for Best Practices use only.
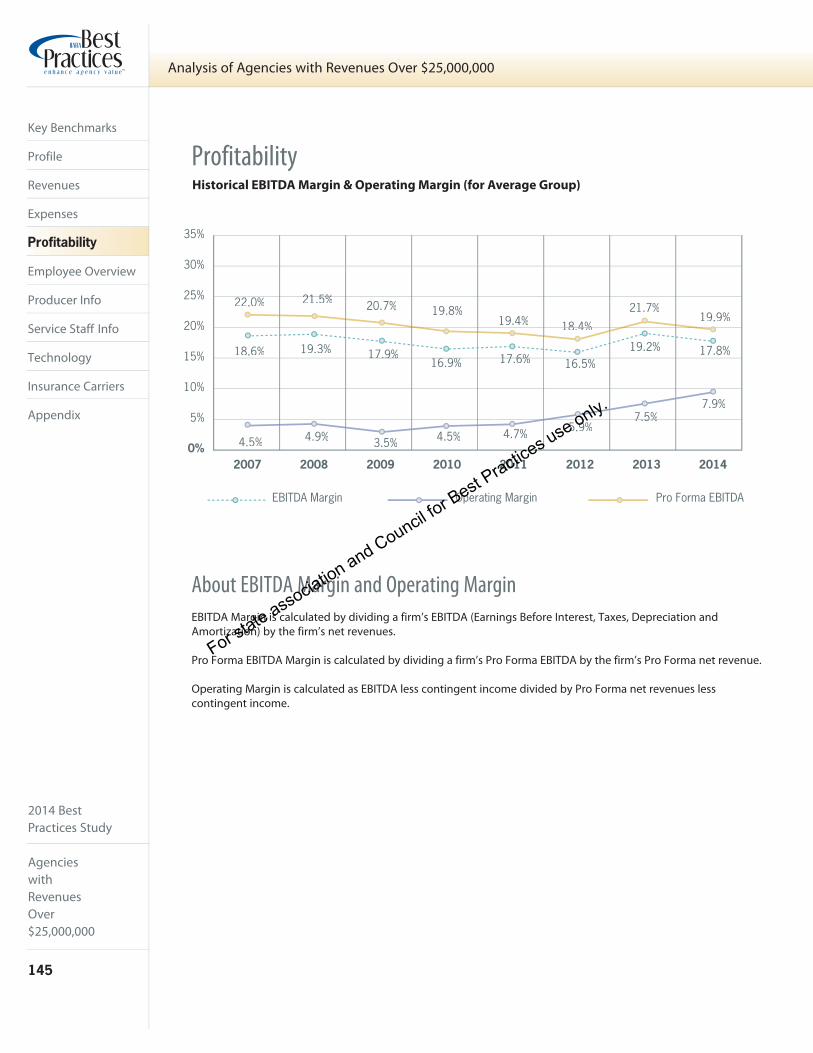
2014 BestPractices Study
Agencieswith RevenuesOver $25,000,000
145
Analysis of Agencies with Revenues Over $25,000,000
Key Benchmarks
Profile
Revenues
Expenses
Profitability
Employee Overview
Producer Info
Service Staff Info
Technology
Insurance Carriers
Appendix
Profitability
About EBITDA Margin and Operating Margin
EBITDA Margin is calculated by dividing a firm’s EBITDA (Earnings Before Interest, Taxes, Depreciation and Amortization) by the firm’s net revenues.
Pro Forma EBITDA Margin is calculated by dividing a firm’s Pro Forma EBITDA by the firm’s Pro Forma net revenue.
Operating Margin is calculated as EBITDA less contingent income divided by Pro Forma net revenues less contingent income.
Historical EBITDA Margin & Operating Margin (for Average Group)
5%
10%
15%
20%
25%
30%
35%
0%2008
EBITDA Margin Operating Margin
18.6%
22.0% 21.5%21 5% 20.7%
4.5%
19.3%
4.9%
17.9%17.9%16.9%16 9%
4.5%
17.6%17 6%
4.7% 5.9%
19.2% 17.8%
19.9%
7.5%7.5%7.9%
20102007 2009 2011 2012 2013 2014
Pro Forma EBITDA
16.5%
19.8%19.4% 18.4%18 4%
21.7%
3.5%
For state association and Council for Best Practices use only.
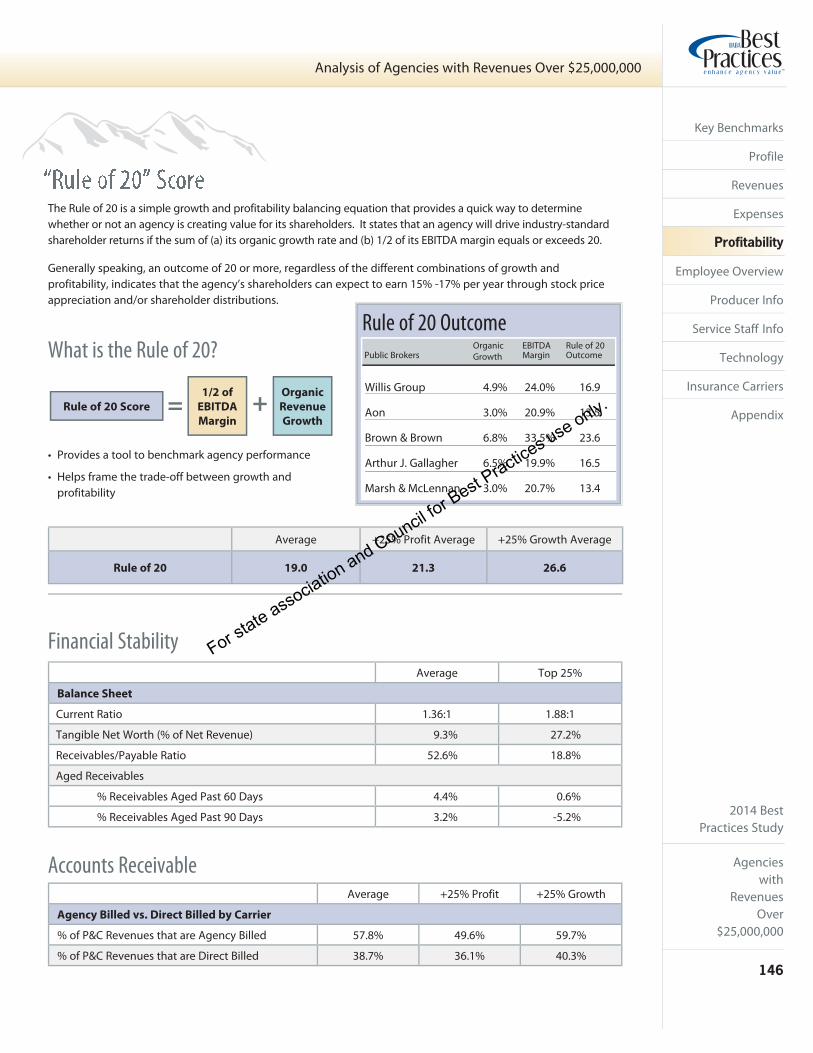
2014 BestPractices Study
Agencieswith
RevenuesOver
$25,000,000
146
Analysis of Agencies with Revenues Over $25,000,000
Key Benchmarks
Profile
Revenues
Expenses
Profitability
Employee Overview
Producer Info
Service Staff Info
Technology
Insurance Carriers
Appendix
Average Top 25%
Balance Sheet
Current Ratio 1.36:1 1.88:1
Tangible Net Worth (% of Net Revenue) 9.3% 27.2%
Receivables/Payable Ratio 52.6% 18.8%
Aged Receivables
% Receivables Aged Past 60 Days 4.4% 0.6%
% Receivables Aged Past 90 Days 3.2% -5.2%
Average +25% Profit +25% Growth
Agency Billed vs. Direct Billed by Carrier
% of P&C Revenues that are Agency Billed 57.8% 49.6% 59.7%
% of P&C Revenues that are Direct Billed 38.7% 36.1% 40.3%
Financial Stability
Accounts Receivable
The Rule of 20 is a simple growth and profitability balancing equation that provides a quick way to determine whether or not an agency is creating value for its shareholders. It states that an agency will drive industry-standard shareholder returns if the sum of (a) its organic growth rate and (b) 1/2 of its EBITDA margin equals or exceeds 20.
Generally speaking, an outcome of 20 or more, regardless of the different combinations of growth and profitability, indicates that the agency’s shareholders can expect to earn 15% -17% per year through stock price appreciation and/or shareholder distributions.
• Provides a tool to benchmark agency performance
• Helps frame the trade-off between growth and profitability
What is the Rule of 20?
Average +25% Profit Average +25% Growth Average
Rule of 20 19.0 21.3 26.6
Public BrokersOrganicGrowth
EBITDA Margin
Rule of 20 Outcome
Willis Group 4.9% 24.0% 16.9
Aon 3.0% 20.9% 13.5
Brown & Brown 6.8% 33.5% 23.6
Arthur J. Gallagher 6.5% 19.9% 16.5
Marsh & McLennan 3.0% 20.7% 13.4
Rule of 20 Outcome
Organic
Revenue
Growth
1/2 of
EBITDA
Margin
Rule of 20 Score +=
For state association and Council for Best Practices use only.
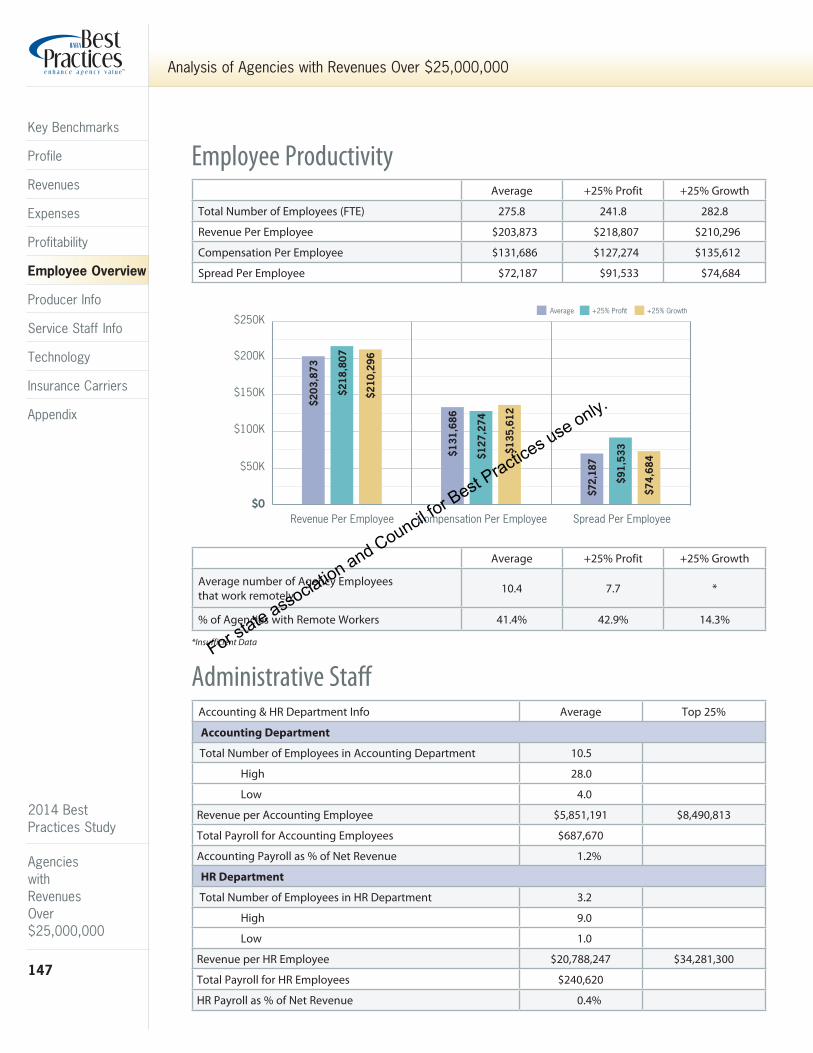
2014 BestPractices Study
Agencieswith RevenuesOver $25,000,000
147
Analysis of Agencies with Revenues Over $25,000,000
Key Benchmarks
Profile
Revenues
Expenses
Profitability
Employee Overview
Producer Info
Service Staff Info
Technology
Insurance Carriers
Appendix
Average +25% Profit +25% Growth
Total Number of Employees (FTE) 275.8 241.8 282.8
Revenue Per Employee $203,873 $218,807 $210,296
Compensation Per Employee $131,686 $127,274 $135,612
Spread Per Employee $72,187 $91,533 $74,684
Average +25% Profit +25% Growth
Average number of Agency Employees that work remotely 10.4 7.7 *
% of Agencies with Remote Workers 41.4% 42.9% 14.3%
Employee Productivity
Administrative Staff Accounting & HR Department Info Average Top 25%
Accounting Department
Total Number of Employees in Accounting Department 10.5
High 28.0
Low 4.0
Revenue per Accounting Employee $5,851,191 $8,490,813
Total Payroll for Accounting Employees $687,670
Accounting Payroll as % of Net Revenue 1.2%
HR Department
Total Number of Employees in HR Department 3.2
High 9.0
Low 1.0
Revenue per HR Employee $20,788,247 $34,281,300
Total Payroll for HR Employees $240,620
HR Payroll as % of Net Revenue 0.4%
*Insufficient Data
5%
10%
15%
20%
25%
30%
35%
0%
1-Revenue-By-Source
% T
otal
Rev
enue
10.0%
20.0%
30.0%
40.0%
50.0%
60.0%
0.0%P&C
Contingent/Bonus
P&CVASFees
P&CPersonalComm& Fees
P&CBondsComm& Fees
P&CCommercial
Comm& Fees
L&HGroup
MedicalComm& Fees
L&HAll OtherGroupComm& Fees
L&HIndividualComm& Fees
L&HBonus/
Overrides
Investments Miscellaneous Compensation Selling Operating Administrative0%
10%
20%
30%
40%
50%
60%
70%
5-Expenses-as-Percent-of-NR
2008
EBITDA Margin Operating Margin
18.6%
22.0% 21.5% 20.7%
4.5%
19.3%
4.9%
17.9%16.9%
4.5%
17.6%
4.7% 5.9%
19.2% 17.8%
19.9%
7.5%7.9%
20102007 2009 2011 2012 2013 2014
3-Historical-Organic-Growth
2007 2008 2009 2010 2011 2012 2013 2014
10%
20%
30%
40%
10.6%8.2%
21.4%
5.2% 6.2%
12.8%
1.7%6.6%
13.0%
1.2%3.0%
8.2%
3.3% 4.0%
9.0%5.6%
7.7%
21.9%
9.2% 10.7%16.5%
8.8%10.7%
16.5%
0%
4-Future-Growth
Surety-Bonding 72.4%
Personal P&C 48.3%
34.5%Small Commercial P&C
Individual Life & Health 24.1%
Group Medical/Health Insurance 86.2%
75.9%All Other Group Benefits
7-Productivity
6-Historical-EBITDA-and-Operating
Revenue Per Employee Compensation Per Employee Spread Per Employee$0
$50K
$100K
$150K
$200K
$250K$2
03,8
73
$218
,807
$210
,296
$131
,686
$127
,274
$135
,612
$72,
187
$91,
533
9-New-Prod-Hiring-Practices
10-Agency-Mgmt-System-Utilized
11-Top-PC-Carrier-LOB
+25% ProfitAverage
Mid/LargeCommerical78.0%
Personal3.1%
Mid/LargeCommerical72.4%
Personal12.7%
SmallCommercial14.8%
SmallCommercial18.9%
SmallCommercial22.9%
Mid/LargeCommerical54.4%
Mid/LargeCommerical73.2%
Personal22.8%
+25% Growth
+25% Growth
12-Top-3-PC-Carrier-LOB
+25% ProfitAverage
Mid/LargeCommerical74.9%
Personal9.7%
SmallCommercial15.4%
Personal12.5%
SmallCommercial14.2%
Mid/LargeCommerical57.3%
Personal22.6%
SmallCommercial20.0%
8-How-Successful-Prod-Spent-Time
Most SuccessfulCommercial P&C Producer
Most SuccessfulL&H Producer
UNDER age 30 from WITHINthe insurance industry
OVER age 30 from WITHINthe insurance industry
UNDER age 30 from OUTSIDEthe insurance industry
OVER age 30 from OUTSIDEthe insurance industry
EPIC31.0%
Sagitta27.6%
AMS3606.9%
Other3.4%Vision
6.9%
TAM24.1%
Average +25% Profit +25% Growth
Average +25% Profit +25% Growth
Average +25% Profit +25% Growth
Average +25% Profit +25% Growth
4.2% 3.8% 4.8%
13.3% 12.0% 13.7%
2.9% 0.6%3.0%
64.8% 64.4%58.6%
Pro Forma EBITDA
16.5%
0% 10% 20% 30% 40% 50% 60% 70% 80% 90% 100%
2-Specialty/Niche Revenue as % of Net Revenue
Average +25% Profit +25% Growth
10%
20%
30%
40%
50%
34.1%
17%
0%
PersonalTraining/Education/Prof. Dev.5.9%
Soliciting New Business30.4%
Mgmt/Personnel/Agency Admin.11.4%
ServicingExisting Accounts52.4%
19.8%19.4% 18.4%
21.7%
PersonalTraining/Education/Prof. Dev.8.2%
Soliciting New Business34.7%
Mgmt/Personnel/Agency Admin.11.1%
ServicingExisting Accounts46.1%
+25% ProfitAverage +25% Growth
16.2%64.0%9.0%
10.8%
35.0%50.0%5.0%
10.0%
16.7%61.1%11.1%11.1%
29.2%3.5%
$74,
684
For state association and Council for Best Practices use only.
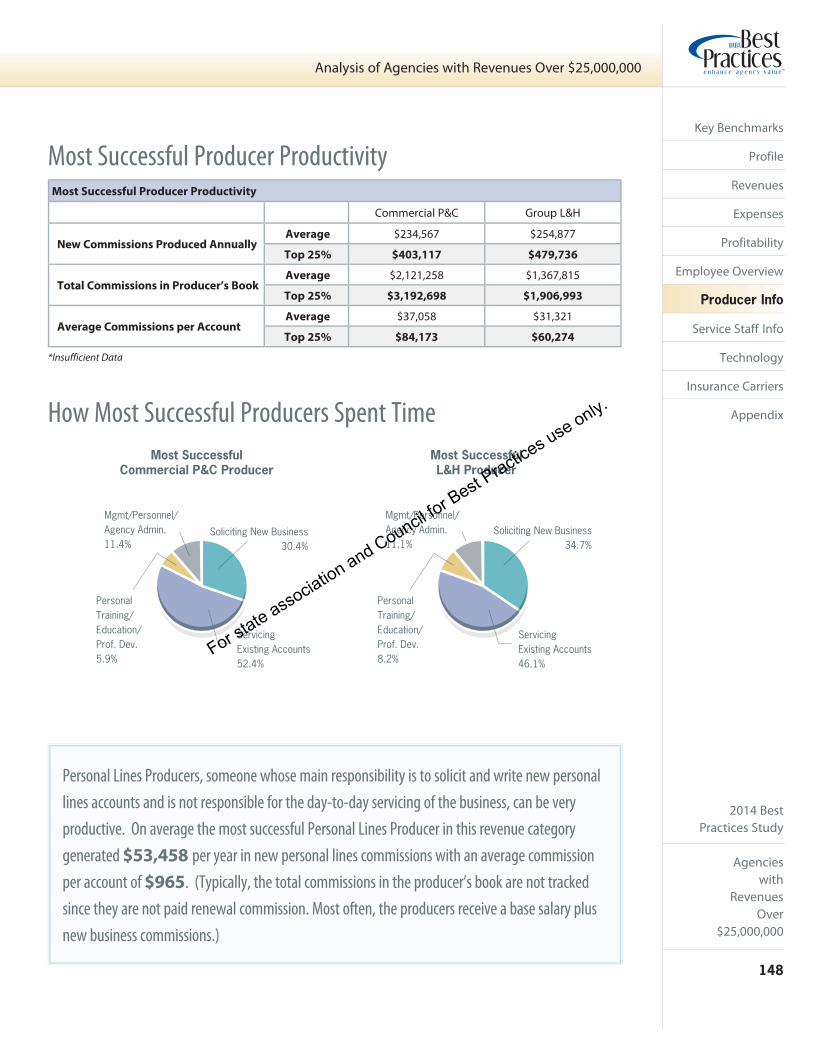
2014 BestPractices Study
Agencieswith
RevenuesOver
$25,000,000
148
Analysis of Agencies with Revenues Over $25,000,000
Key Benchmarks
Profile
Revenues
Expenses
Profitability
Employee Overview
Producer Info
Service Staff Info
Technology
Insurance Carriers
Appendix
Most Successful Producer Productivity
Commercial P&C Group L&H
New Commissions Produced Annually Average $234,567 $254,877
Top 25% $403,117 $479,736
Total Commissions in Producer’s Book Average $2,121,258 $1,367,815
Top 25% $3,192,698 $1,906,993
Average Commissions per Account Average $37,058 $31,321
Top 25% $84,173 $60,274
Most Successful Producer Productivity
How Most Successful Producers Spent Time
Personal Lines Producers, someone whose main responsibility is to solicit and write new personal
lines accounts and is not responsible for the day-to-day servicing of the business, can be very
productive. On average the most successful Personal Lines Producer in this revenue category
generated $53,458 per year in new personal lines commissions with an average commission
per account of $965. (Typically, the total commissions in the producer’s book are not tracked
since they are not paid renewal commission. Most often, the producers receive a base salary plus
new business commissions.)
*Insufficient Data
Most SuccessfulCommercial P&C Producer
Most SuccessfulL&H Producer
PersonalTraining/Education/Prof. Dev.5.9%
Soliciting New Business30.4%
Mgmt/Personnel/Agency Admin.11.4%
ServicingExisting Accounts52.4%
PersonalTraining/Education/Prof. Dev.8.2%
Soliciting New Business34.7%
Mgmt/Personnel/Agency Admin.11.1%
ServicingExisting Accounts46.1%
For state association and Council for Best Practices use only.

2014 BestPractices Study
Agencieswith RevenuesOver $25,000,000
149
Analysis of Agencies with Revenues Over $25,000,000
Key Benchmarks
Profile
Revenues
Expenses
Profitability
Employee Overview
Producer Info
Service Staff Info
Technology
Insurance Carriers
Appendix
Average Top 25%
Commercial P&C Producers
Average Validated Producers
# Validated 35.4
High 92.0
Low 9.0
Average New Commissions Produced Annually $127,777 $227,160
Average Book Serviced (Commissions) $833,839 $1,135,284
Average Pay ($) $238,748
Average Pay (% of Book Serviced) 28.6%
Group Life & Health Producers
Average Validated Producers
# Validated 12.9
High 32.0
Low 2.0
Average New Commissions Produced Annually $162,104 $283,438
Average Book Serviced (Commissions) $909,077 $1,253,629
Average Pay ($) $263,868
Average Pay (% of Book Serviced) 29.0%
Personal P&C Producers
Average Validated Producers
# Validated 2.2
High 5.0
Low 1.0
Average New Commissions Produced Annually $51,360 $82,434
Average Book Serviced (Commissions) $334,477 $615,817
Average Pay ($) $97,313
Average Pay (% of Book Serviced) 29.1%
Multi-Line Producers
Average Validated Producers
# Validated 6.2
High 19.0
Low 1.0
Average New Commissions Produced Annually $194,175 *
Average Book Serviced (Commissions) $1,153,534 *
Average Pay ($) $371,510
Average Pay (% of Book Serviced) 32.2%
Validated Producer Productivity
Average +25% Profit +25% Growth
% of Agencies That Reimburse All/Part T&E Expense 72.4% 85.7% 71.4%
*Insufficient Data
For state association and Council for Best Practices use only.
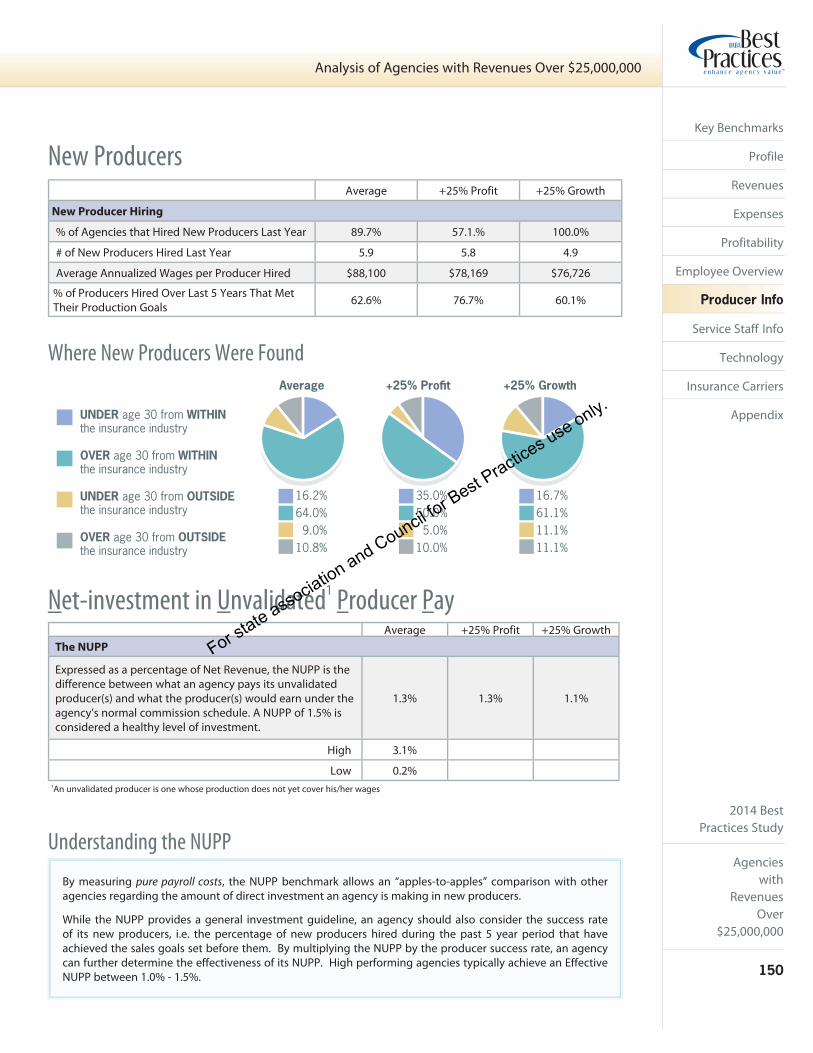
2014 BestPractices Study
Agencieswith
RevenuesOver
$25,000,000
150
Analysis of Agencies with Revenues Over $25,000,000
Key Benchmarks
Profile
Revenues
Expenses
Profitability
Employee Overview
Producer Info
Service Staff Info
Technology
Insurance Carriers
Appendix
Where New Producers Were Found
Average +25% Profit +25% Growth
New Producer Hiring
% of Agencies that Hired New Producers Last Year 89.7% 57.1.% 100.0%
# of New Producers Hired Last Year 5.9 5.8 4.9
Average Annualized Wages per Producer Hired $88,100 $78,169 $76,726
% of Producers Hired Over Last 5 Years That Met Their Production Goals 62.6% 76.7% 60.1%
New Producers
Average +25% Profit +25% GrowthThe NUPP
Expressed as a percentage of Net Revenue, the NUPP is the difference between what an agency pays its unvalidated producer(s) and what the producer(s) would earn under the agency’s normal commission schedule. A NUPP of 1.5% is considered a healthy level of investment.
1.3% 1.3% 1.1%
High 3.1%
Low 0.2%
By measuring pure payroll costs, the NUPP benchmark allows an “apples-to-apples” comparison with other agencies regarding the amount of direct investment an agency is making in new producers.
While the NUPP provides a general investment guideline, an agency should also consider the success rate of its new producers, i.e. the percentage of new producers hired during the past 5 year period that have achieved the sales goals set before them. By multiplying the NUPP by the producer success rate, an agency can further determine the effectiveness of its NUPP. High performing agencies typically achieve an Effective NUPP between 1.0% - 1.5%.
1An unvalidated producer is one whose production does not yet cover his/her wages
Net-investment in Unvalidated1 Producer Pay
Understanding the NUPP
UNDER age 30 from WITHINthe insurance industry
OVER age 30 from WITHINthe insurance industry
UNDER age 30 from OUTSIDEthe insurance industry
OVER age 30 from OUTSIDEthe insurance industry
+25% ProfitAverage +25% Growth
16.2%64.0%
9.0%10.8%
35.0%50.0%
5.0%10.0%
16.7%61.1%11.1%11.1%
For state association and Council for Best Practices use only.

2014 BestPractices Study
Agencieswith RevenuesOver $25,000,000
151
Analysis of Agencies with Revenues Over $25,000,000
Key Benchmarks
Profile
Revenues
Expenses
Profitability
Employee Overview
Producer Info
Service Staff Info
Technology
Insurance Carriers
Appendix
Average +25% Profit +25% Growth
Total # of Service Staff
(as defined above; excludes any TPA service staff) 164.5 139.3 154.4
% of Peer Agencies Having
Separate/Dedicated Marketing Department 58.6% 42.9% 42.9%
# of Marketing Staff 8.9 6.9 2.7
Separate/Dedicated Claims Department 86.2% 71.4% 85.7%
# of Claims Staff 11.3 9.1 13.8
Average +25% Profit +25% Growth
% of Peer Agencies Having
Workers Comp TPA 20.7% 0.0% 14.3%
# of Service Staff 11.7 * *
Total TPA Revenues Serviced $1,562,860 * *
Group Benefits TPA 6.9% 14.3% 0.0%
# of Service Staff * * *
Total TPA Revenues Serviced * * *
TPA Service Staff
Service & Sales Support Staff Definition• Typically non-commissioned employees• Provide service to the agency’s clients• Support producers in the sale of new business and retention of existing business
Some service positions may earn commission income but typically a majority of their pay is fixed and a majority of their time is devoted to service rather than the soliciting of new clients.
Service & Sales Support Positions1 Included in Full-time Equivalent Headcounts• Account Executives (AE) - senior level service representatives• Account Managers, Customer Service Representatives (CSRs)• Assistant CSRs, Processors• Claims Staff• Placers/Marketers• Department Managers - who also service clients1Position titles are general categories since specific job titles vary from agency to agency
Administrative personnel such as accounting, mail room, and reception are not included in service benchmarks unless a portion of their time is dedicated to service.
*Insufficient Data
Service Staff Overview
Service Staff Productivity
For state association and Council for Best Practices use only.
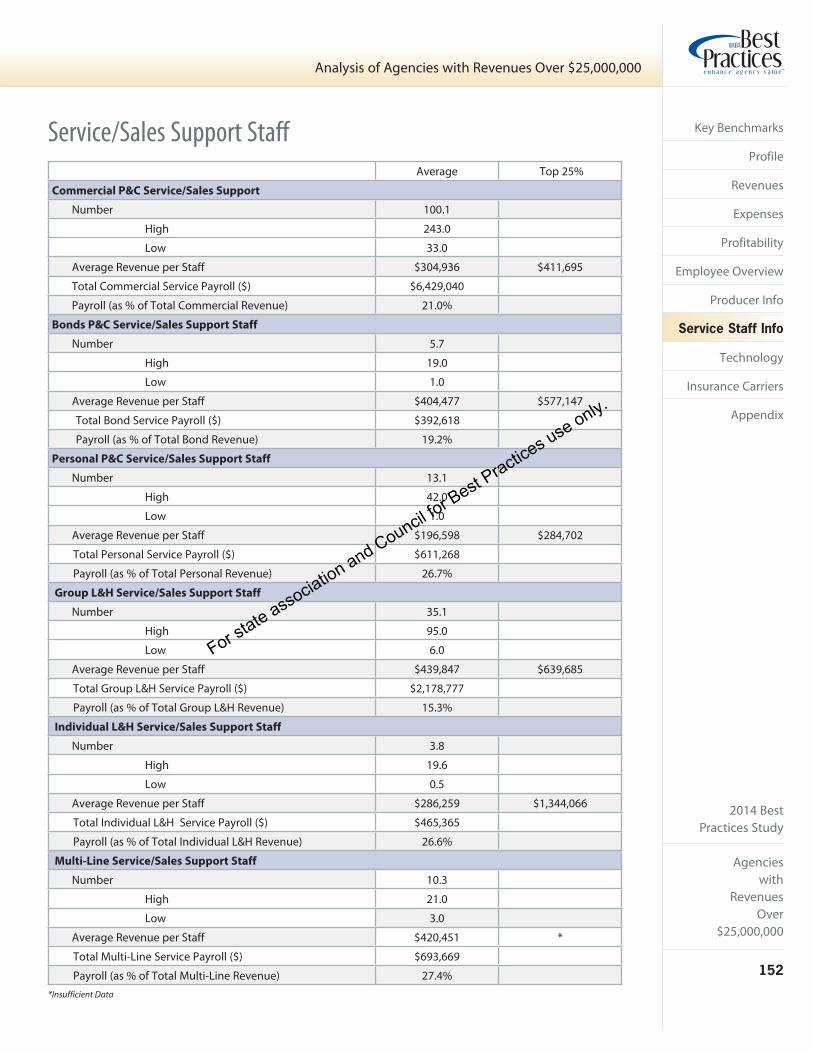
2014 BestPractices Study
Agencieswith
RevenuesOver
$25,000,000
152
Analysis of Agencies with Revenues Over $25,000,000
Key Benchmarks
Profile
Revenues
Expenses
Profitability
Employee Overview
Producer Info
Service Staff Info
Technology
Insurance Carriers
Appendix
Service/Sales Support Staff
Average Top 25%
Commercial P&C Service/Sales Support
Number 100.1
High 243.0
Low 33.0
Average Revenue per Staff $304,936 $411,695
Total Commercial Service Payroll ($) $6,429,040
Payroll (as % of Total Commercial Revenue) 21.0%
Bonds P&C Service/Sales Support Staff
Number 5.7
High 19.0
Low 1.0
Average Revenue per Staff $404,477 $577,147
Total Bond Service Payroll ($) $392,618
Payroll (as % of Total Bond Revenue) 19.2%
Personal P&C Service/Sales Support Staff
Number 13.1
High 42.0
Low 1.0
Average Revenue per Staff $196,598 $284,702
Total Personal Service Payroll ($) $611,268
Payroll (as % of Total Personal Revenue) 26.7%
Group L&H Service/Sales Support Staff
Number 35.1
High 95.0
Low 6.0
Average Revenue per Staff $439,847 $639,685
Total Group L&H Service Payroll ($) $2,178,777
Payroll (as % of Total Group L&H Revenue) 15.3%
Individual L&H Service/Sales Support Staff
Number 3.8
High 19.6
Low 0.5
Average Revenue per Staff $286,259 $1,344,066
Total Individual L&H Service Payroll ($) $465,365
Payroll (as % of Total Individual L&H Revenue) 26.6%
Multi-Line Service/Sales Support Staff
Number 10.3
High 21.0
Low 3.0
Average Revenue per Staff $420,451 *
Total Multi-Line Service Payroll ($) $693,669
Payroll (as % of Total Multi-Line Revenue) 27.4%*Insufficient Data
For state association and Council for Best Practices use only.

2014 BestPractices Study
Agencieswith RevenuesOver $25,000,000
153
Analysis of Agencies with Revenues Over $25,000,000
Key Benchmarks
Profile
Revenues
Expenses
Profitability
Employee Overview
Producer Info
Service Staff Info
Technology
Insurance Carriers
Appendix
Service Staff Payroll InformationAverage +25% Profit +25% Growth
Pay Ranges by Service Position
AE
Average Low $75,185 $81,231 $76,707Average High $147,229 $120,809 $132,419
CSR
Average Low $40,473 $36,488 $33,462Average High $84,585 $83,963 $72,825
Processor/Asst CSR
Average Low $31,645 $30,958 $36,491Average High $49,811 $40,150 $48,481
Marketing
Average Low $58,077 * *Average High $115,722 * *
Claims
Average Low $45,266 $45,375 $46,604Average High $107,379 $96,275 $88,786
AE
Average Low $62,337 * $51,455Average High $92,170 * $98,799
CSR
Average Low $39,206 $39,150 $34,701Average High $60,264 $57,169 $60,366
Processor/Asst CSR
Average Low $32,971 * $29,185Average High $46,317 * $52,095
Marketing
Average Low * * *Average High * * *
Claims
Average Low $38,300 * *Average High $61,678 * *
AE
Average Low $84,811 $88,000 $88,910Average High $142,653 $137,988 $111,884
CSR
Average Low $43,565 $40,570 $40,296Average High $76,792 $64,088 $63,949
Processor/Asst CSR
Average Low $31,490 * $31,901Average High $48,704 $48,775 $48,268
Marketing
Average Low $44,888 * *Average High $116,733 * *
Claims
Average Low $72,148 * $52,863Average High $93,050 * $80,733
CO
MM
ER
CIA
L L
INE
SP
ER
SO
NA
L L
INE
SG
RO
UP
LIF
E &
HE
AL
TH
/FIN
AN
CIA
L
*Insufficient Data
For state association and Council for Best Practices use only.

2014 BestPractices Study
Agencieswith
RevenuesOver
$25,000,000
154
Analysis of Agencies with Revenues Over $25,000,000
Key Benchmarks
Profile
Revenues
Expenses
Profitability
Employee Overview
Producer Info
Service Staff Info
Technology
Insurance Carriers
Appendix
Average Top 25%
Information Technology Employees (FTE)
Number 7.3
High 26.4
Low 1.4
Number of IT Employees per 100 users 2.5
Revenue per IT Employee $9,343,352 $15,156,330
Total IT Payroll Expense ($) $572,776 $1,170,644
As % of Total Compensation Expense 1.5%
As % of Net Revenues 1.0%
1 Includes hardware/software leasing including offsite applications, supplies, maintenance & maintenance contracts, training, data lines, internet providers, website development/maintenance, outside consulting fees, computer depreciation, software amortization, and any non-depreciated hardware/software.
Other included multiple systems used.
Technology
Agency Management System Utilized
Average +25% Profit +25% Growth
Total IT Expenses1 (as % of net revenues) 2.4% 2.1% 2.2%
EPIC31.0%
Sagitta27.6%
AMS3606.9%
Other3.4%Vision
6.9%
TAM24.1%
For state association and Council for Best Practices use only.

2014 BestPractices Study
Agencieswith RevenuesOver $25,000,000
155
Analysis of Agencies with Revenues Over $25,000,000
Key Benchmarks
Profile
Revenues
Expenses
Profitability
Employee Overview
Producer Info
Service Staff Info
Technology
Insurance Carriers
Appendix
Average +25% Profit +25% Growth
Service Center Use
Total Personal Lines Commission placed in Carrier Service Center 30.9% * *
Total Commercial Lines Commission placed in Carrier Service Center 2.0% 3.2% 2.7%
Use of Carrier Service Centers
Average +25% Profit +25% Growth
Carrier Representation
Personal Lines P&C
National 14.5 8.0 10.9
Regional 9.8 9.3 9.7
Total 24.3 17.3 20.5
Commercial Lines P&C
National 38.1 27.6 22.9
Regional 35.4 25.5 26.8
Total 73.5 53.1 49.7
Group L&H / Financial
Total Life, Health, Disability, LTC,
Retirement Products, and Other80.8 53.6 70.4
Carriers
Average +25% Profit +25% Growth
% of Total Commission & Fee Revenue Derived from Direct Versus Indirect Appointments
INDIRECT Carrier Appointments 19.3% 13.6% 22.1%
DIRECT Carrier Appointments 70.4% 72.1% 77.9%
Carrier Appointments
*Insufficient Data
For state association and Council for Best Practices use only.
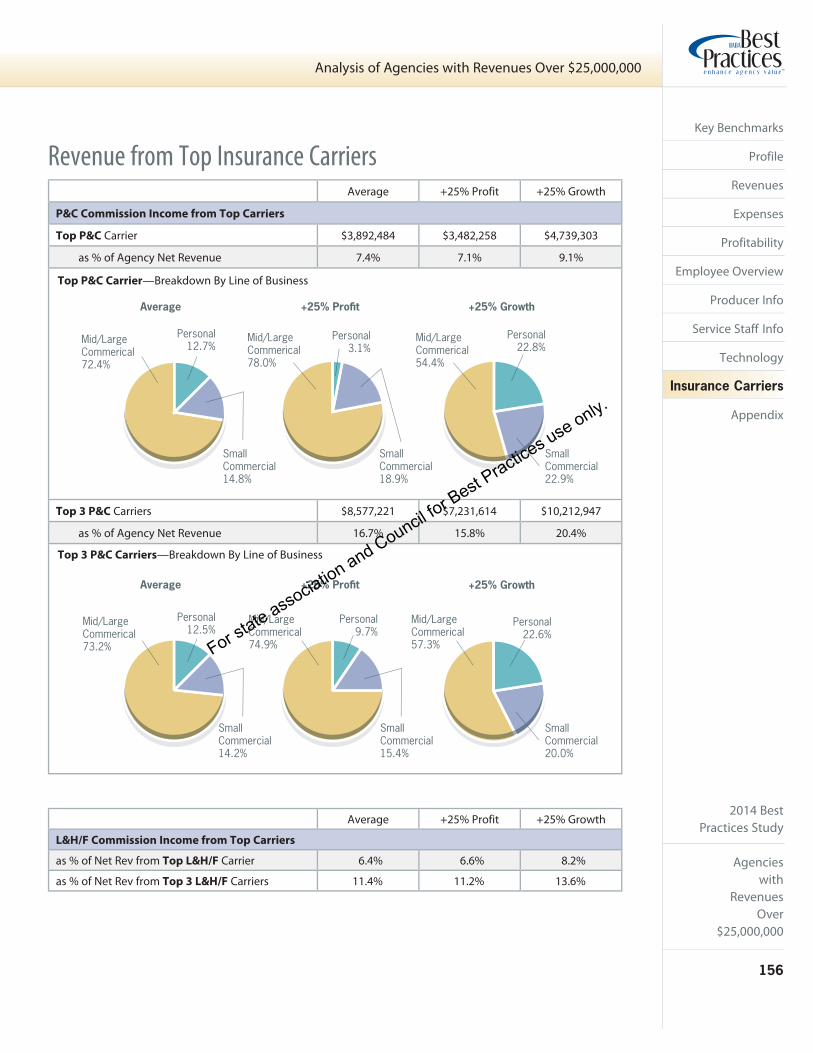
2014 BestPractices Study
Agencieswith
RevenuesOver
$25,000,000
156
Analysis of Agencies with Revenues Over $25,000,000
Key Benchmarks
Profile
Revenues
Expenses
Profitability
Employee Overview
Producer Info
Service Staff Info
Technology
Insurance Carriers
Appendix
Revenue from Top Insurance CarriersAverage +25% Profit +25% Growth
P&C Commission Income from Top Carriers
Top P&C Carrier $3,892,484 $3,482,258 $4,739,303
as % of Agency Net Revenue 7.4% 7.1% 9.1%
Top 3 P&C Carriers $8,577,221 $7,231,614 $10,212,947
as % of Agency Net Revenue 16.7% 15.8% 20.4%
Top P&C Carrier—Breakdown By Line of Business
Top 3 P&C Carriers—Breakdown By Line of Business
+25% ProfitAverage
Mid/LargeCommerical78.0%
Personal3.1%
Mid/LargeCommerical72.4%
Personal12.7%
SmallCommercial14.8%
SmallCommercial18.9%
SmallCommercial22.9%
Mid/LargeCommerical54.4%
Personal22.8%
+25% Growth
Mid/LargeCommerical73.2%
+25% Growth+25% ProfitAverage
Mid/LargeCommerical74.9%
Personal9.7%
SmallCommercial15.4%
Personal12.5%
SmallCommercial14.2%
Mid/LargeCommerical57.3%
Personal22.6%
SmallCommercial20.0%
Average +25% Profit +25% Growth
L&H/F Commission Income from Top Carriers
as % of Net Rev from Top L&H/F Carrier 6.4% 6.6% 8.2%
as % of Net Rev from Top 3 L&H/F Carriers 11.4% 11.2% 13.6%
For state association and Council for Best Practices use only.

2014 BestPractices Study
157
2014 Best Practices Study
For state association and Council for Best Practices use only.
2014 BestPractices Study
158
2014 Best Practices Study
Key Benchmarks
Profile
Revenues
Expenses
Profitability
Employee Overview
Producer Info
Service Staff Info
Technology
Insurance Carriers
Appendix
Appendix
$1,250,000 $25,000,000$2,500,000 $5,000,000 $10,000,000
For state association and Council for Best Practices use only.

2014 BestPractices Study
159
2014 Best Practices Study
Key Benchmarks
Profile
Revenues
Expenses
Profitability
Employee Overview
Producer Info
Service Staff Info
Technology
Insurance Carriers
Appendix
Population DensityAgencies with Revenues UNDER $5,000,000
Population Where Home Office is Located:Less than
50,000
50,000 to
250,000
250,000 to
1,000,000
Over
1,000,000
% of Agencies Located in Each Population 20.4% 13.6% 6.4% 10.7%
Net Revenue Growth (Organic) 7.3% 7.1% 7.4% 9.3%
Profitability as % of Net Revenues
Pre-tax Profit 22.0% 23.2% 21.9% 19.4%
Pro Forma Pre-tax Profit 27.2% 27.4% 23.8% 24.1%
Operating Pre-tax Profit 14.3% 15.3% 14.7% 12.1%
EBITDA 25.2% 25.9% 24.6% 21.4%
Pro Forma EBITDA 30.3% 30.1% 26.5% 26.1%
Value Creation “Rule of 20” Score 21.3 20.8 19.3 21.0
Productivity
Revenue per Employee $139,349 $157,872 $161,489 $148,180
Compensation per Employee $74,872 $83,587 $88,089 $90,925
Spread per Employee $64,476 $74,285 $73,400 $57,255
Pay Levels for Producers
Commercial P&C $101,761 $137,256 $106,136 $160,844
Personal P&C $43,516 $74,348 $63,333 $60,023
Life & Health / Financial $64,598 $74,645 * $107,141
Multi-Line $99,545 $138,829 $140,436 $148,890
Total Number of Service / Sales Support Staff per Line of Business
Commercial P&C 3.6 5.6 5.3 6.5
Personal P&C 4.1 4.0 2.4 3.3
Group Life & Health 1.3 1.1 * 0.9
Multi-Line 2.3 * * *
Total Service / Sales Support Staff Payroll as % of LOB Revenue
Commercial P&C 18.5% 20.6% 21.7% 24.7%
Personal Lines 22.6% 23.1% 21.7% 30.9%
Group Life & Health 59.1% 26.3% * 27.6%
Multi-Line 20.2% * * *
Number of Carriers
Personal Lines 11.2 11.3 15.6 12.2
Commercial Lines 11.9 22.8 20.2 23.9
Life & Health 7.5 13.2 7.2 15.2
Service Center Use
Total PL Comms Placed (as % of PL Revenues) * 44.8% 25.6% *
Total CL Comms Placed (as % of CL Revenues) 12.9% 8.6% 26.0% 13.6%
% of Agencies Making an Acquisition in the last 12 Months 16.7% 3.6% 0.0% 18.2%
*Insufficient Data
For state association and Council for Best Practices use only.

2014 BestPractices Study
160
2014 Best Practices Study
Key Benchmarks
Profile
Revenues
Expenses
Profitability
Employee Overview
Producer Info
Service Staff Info
Technology
Insurance Carriers
Appendix
Population DensityAgencies with Revenues OVER $5,000,000
Population Where Home Office is Located:Less than
50,000
50,000 to
250,000
250,000 to
1,000,000
Over
1,000,000
% of Agencies Located in Each Population 7.3% 9.6% 15.1% 17.0%
Net Revenue Growth (Organic) 6.5% 10.3% 8.8% 10.1%
Profitability as % of Net Revenues
Pre-tax Profit 14.5% 17.9% 16.6% 15.5%
Pro Forma Pre-tax Profit 16.7% 20.4% 20.5% 19.3%
Operating Pre-tax Profit 5.8% 11.3% 8.8% 8.0%
EBITDA 18.9% 21.2% 18.7% 18.3%
Pro Forma EBITDA 21.1% 23.7% 22.6% 22.1%
Value Creation “Rule of 20” Score 17.1 22.2 19.0 20.7
Productivity
Revenue per Employee $154,264 $181,040 $184,384 $194,521
Compensation per Employee $95,138 $111,475 $118,418 $126,501
Spread per Employee $58,946 $69,566 $65,966 $68,020
Pay Levels for Producers
Commercial P&C $131,722 $168,755 $209,249 $220,329
Personal P&C $51,650 $66,885 $101,846 $81,690
Life & Health / Financial $140,940 $200,951 $214,375 $226,808
Multi-Line $180,497 $233,506 $210,006 $178,581
Total Number of Service / Sales Support Staff per Line of Business
Commercial P&C 20.4 28.4 45.3 29.1
Personal P&C 14.5 9.0 12.8 9.8
Group Life & Health 6.3 13.6 19.3 17.7
Multi-Line * * * *
Total Service / Sales Support Staff Payroll as % of LOB Revenue
Commercial P&C 20.5% 19.9% 19.3% 20.6%
Personal Lines 26.4% 23.4% 25.1% 24.9%
Group Life & Health 16.3% 16.5% 14.4% 17.8%
Multi-Line * * * *
Number of Carriers
Personal Lines 23.9 16.9 23.5 22.1
Commercial Lines 46.8 37.2 67.3 44.3
Life & Health 38.3 38.8 60.0 46.4
Service Center Use
Total PL Comms Placed (as % of PL Revenues) 29.3% 27.6% 18.3% 23.6%
Total CL Comms Placed (as % of CL Revenues) * 3.1% 5.1% 2.7%
% of Agencies Making an Acquisition in the last 12 Months 6.7% 20.0% 22.6% 22.9%
*Insufficient Data
For state association and Council for Best Practices use only.

2014 BestPractices Study
161
2014 Best Practices Study
Key Benchmarks
Profile
Revenues
Expenses
Profitability
Employee Overview
Producer Info
Service Staff Info
Technology
Insurance Carriers
Appendix
Regional AnalysisAgencies with Revenues UNDER $5,000,000
Geographic Region: Northeast Southeast Midwest Southwest West
% of Agencies Located in Each Region 8.3% 13.6% 14.6% 9.3% 5.4%
Net Revenue Growth (Organic) 9.1% 10.0% 4.7% 6.4% 9.8%
Profitability as % of Net Revenues
Pre-tax Profit 19.7% 16.2% 25.2% 25.1% 24.0%
Pro Forma Pre-tax Profit 26.0% 21.2% 27.9% 30.0% 27.7%
Operating Pre-tax Profit 10.5% 9.4% 18.1% 15.3% 19.2%
EBITDA 23.3% 18.9% 28.0% 27.6% 25.8%
Pro Forma EBITDA 29.6% 23.9% 30.7% 32.5% 29.4%
Value Creation “Rule of 20” Score 22.3 19.5 19.2 21.8 25.1
Productivity
Revenue per Employee $136,203 $140,259 $150,707 $177,117 $136,658
Compensation per Employee $75,647 $86,354 $77,884 $92,731 $75,294
Spread per Employee $60,556 $53,905 $72,823 $84,386 $61,364
Pay Levels for Producers
Commercial P&C $109,593 $160,399 $104,398 $125,083 $113,055
Personal P&C $54,824 $48,183 $54,190 $57,500 $48,750
Life & Health / Financial * $108,878 $65,316 * $106,000
Multi-Line $100,390 $137,802 $105,279 $146,264 *
Total Number of Service / Sales Support Staff per Line of Business
Commercial P&C 3.8 5.5 4.4 6.5 4.5
Personal P&C 5.3 2.9 4.3 3.6 1.9
Group Life & Health 0.8 1.4 1.3 0.9 0.9
Multi-Line * * 3.0 * *
Total Service / Sales Support Staff Payroll as % of LOB Revenue
Commercial P&C 28.5% 22.8% 16.7% 18.3% 19.2%
Personal Lines 23.4% 24.6% 21.9% 27.1% 27.9%
Group Life & Health 47.1% 26.0% 12.6% 27.4% 12.1%
Multi-Line * * 20.6% * *
Number of Carriers
Personal Lines 10.6 14.8 10.6 12.9 9.9
Commercial Lines 10.3 23.2 15.1 24.3 16.5
Life & Health 7.8 11.4 9.9 11.0 14.9
Service Center Use
Total PL Comms Placed(as % of PL Revenues) * 29.1% * * *
Total CL Comms Placed(as % of CL Revenues) 12.9% 3.6% * * 37.4%
% of Agencies Making an Acquisition in the last 12 Months 17.6% 7.1% 6.7% 15.8% 18.2%
*Insufficient Data
For state association and Council for Best Practices use only.

2014 BestPractices Study
162
2014 Best Practices Study
Key Benchmarks
Profile
Revenues
Expenses
Profitability
Employee Overview
Producer Info
Service Staff Info
Technology
Insurance Carriers
Appendix
Regional AnalysisAgencies with Revenues OVER $5,000,000
Geographic Region: Northeast Southeast Midwest Southwest West
% of Agencies Located in Each Region 10.7% 12.7% 9.3% 8.8% 7.8%
Net Revenue Growth (Organic) 8.3% 8.5% 11.1% 8.5% 10.2%
Profitability as % of Net Revenues
Pre-tax Profit 16.0% 16.6% 15.9% 18.5% 13.3%
Pro Forma Pre-tax Profit 18.8% 20.0% 18.5% 20.8% 19.3%
Operating Pre-tax Profit 8.7% 9.5% 6.0% 11.2% 7.2%
EBITDA 20.4% 18.7% 18.7% 20.6% 16.5%
Pro Forma EBITDA 23.3% 22.1% 21.3% 23.0% 22.4%
Value Creation “Rule of 20” Score 20.5 18.6 20.0 19.7 21.4
Productivity
Revenue per Employee $175,779 $174,870 $185,636 $183,611 $200,817
Compensation per Employee $107,305 $112,812 $119,522 $116,259 $131,272
Spread per Employee $68,474 $62,058 $66,114 $67,352 $69,545
Pay Levels for Producers
Commercial P&C $146,672 $205,766 $213,707 $170,852 $226,633
Personal P&C $55,833 $88,579 $76,014 $89,734 $84,181
Life & Health / Financial $146,320 $232,882 $219,707 $193,891 $217,331
Multi-Line $101,307 $196,712 $282,598 $185,452 $273,921
Total Number of Service / Sales Support Staff per Line of Business
Commercial P&C 25.3 31.8 43.1 25.5 40.6
Personal P&C 16.0 11.0 9.7 11.4 6.9
Group Life & Health 8.2 15.0 28.6 8.7 20.0
Multi-Line 11.0 * * * *
Total Service / Sales Support Staff Payroll as % of LOB Revenue
Commercial P&C 22.4% 20.5% 19.9% 16.8% 19.5%
Personal Lines 24.8% 22.4% 28.1% 26.1% 23.6%
Group Life & Health 21.1% 15.4% 15.9% 14.4% 14.1%
Multi-Line 9.3% * * * *
Number of Carriers
Personal Lines 22.6 26.1 19.6 20.6 16.3
Commercial Lines 36.6 59.3 52.7 56.8 48.5
Life & Health 34.6 47.2 57.2 39.4 65.7
Service Center Use
Total PL Comms Placed(as % of PL Revenues) 18.5% 28.0% 33.9% 21.4% 25.4%
Total CL Comms Placed(as % of CL Revenues) 11.1% 2.1% 0.8% 1.9% 3.0%
% of Agencies Making an Acquisition in the last 12 Months 18.2% 19.2% 31.6% 16.7% 12.5%
*Insufficient Data
For state association and Council for Best Practices use only.
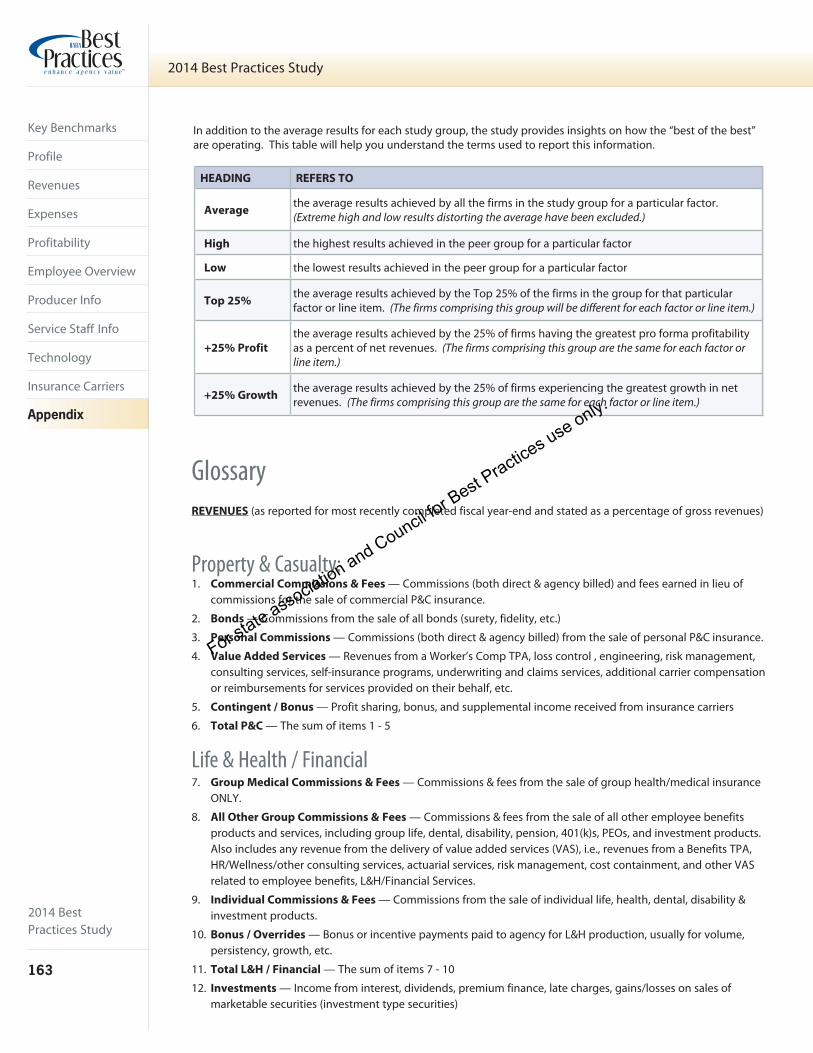
2014 BestPractices Study
163
2014 Best Practices Study
Key Benchmarks
Profile
Revenues
Expenses
Profitability
Employee Overview
Producer Info
Service Staff Info
Technology
Insurance Carriers
Appendix
In addition to the average results for each study group, the study provides insights on how the “best of the best” are operating. This table will help you understand the terms used to report this information.
HEADING REFERS TO
Averagethe average results achieved by all the firms in the study group for a particular factor. (Extreme high and low results distorting the average have been excluded.)
High the highest results achieved in the peer group for a particular factor
Low the lowest results achieved in the peer group for a particular factor
Top 25%the average results achieved by the Top 25% of the firms in the group for that particular factor or line item. (The firms comprising this group will be different for each factor or line item.)
+25% Profit
the average results achieved by the 25% of firms having the greatest pro forma profitability as a percent of net revenues. (The firms comprising this group are the same for each factor or line item.)
+25% Growththe average results achieved by the 25% of firms experiencing the greatest growth in net revenues. (The firms comprising this group are the same for each factor or line item.)
GlossaryREVENUES (as reported for most recently completed fiscal year-end and stated as a percentage of gross revenues)
Property & Casualty:1. Commercial Commissions & Fees — Commissions (both direct & agency billed) and fees earned in lieu of
commissions for the sale of commercial P&C insurance.
2. Bonds — Commissions from the sale of all bonds (surety, fidelity, etc.)
3. Personal Commissions — Commissions (both direct & agency billed) from the sale of personal P&C insurance.
4. Value Added Services — Revenues from a Worker’s Comp TPA, loss control , engineering, risk management, consulting services, self-insurance programs, underwriting and claims services, additional carrier compensation or reimbursements for services provided on their behalf, etc.
5. Contingent / Bonus — Profit sharing, bonus, and supplemental income received from insurance carriers
6. Total P&C — The sum of items 1 - 5
Life & Health / Financial7. Group Medical Commissions & Fees — Commissions & fees from the sale of group health/medical insurance
ONLY.
8. All Other Group Commissions & Fees — Commissions & fees from the sale of all other employee benefits products and services, including group life, dental, disability, pension, 401(k)s, PEOs, and investment products. Also includes any revenue from the delivery of value added services (VAS), i.e., revenues from a Benefits TPA, HR/Wellness/other consulting services, actuarial services, risk management, cost containment, and other VAS related to employee benefits, L&H/Financial Services.
9. Individual Commissions & Fees — Commissions from the sale of individual life, health, dental, disability & investment products.
10. Bonus / Overrides — Bonus or incentive payments paid to agency for L&H production, usually for volume, persistency, growth, etc.
11. Total L&H / Financial — The sum of items 7 - 10
12. Investments — Income from interest, dividends, premium finance, late charges, gains/losses on sales of marketable securities (investment type securities)
For state association and Council for Best Practices use only.

2014 BestPractices Study
164
2014 Best Practices Study
Key Benchmarks
Profile
Revenues
Expenses
Profitability
Employee Overview
Producer Info
Service Staff Info
Technology
Insurance Carriers
Appendix
13. Miscellaneous — Income from countersignatures fees, gains/losses on fixed or intangible assets, life insurance proceeds
14. Gross Revenues — The sum of items 6, 11, 12 & 13
15. Brokerage Commission Expense — Commissions paid to other agencies or outside brokers. Does NOT include in-house producers that are paid on a 1099.
16. Net Revenues — Gross Revenues less Brokerage Commission Expense
EXPENSES (as reported for most recently completed fiscal year-end and stated as a percentage of net revenues)
Compensation Payroll: The following payroll breakdown is for the entire agency including agency owners:
17. Employees — Salaries, commissions, bonuses, management fees, and discretionary owner compensation
18. “Non-Employees” 1099 Producers /Temporary Help — Commissions, bonuses for agency’s producers compensated on 1099. (Does not include producers/agencies to which you pay outside broker commissions.) Also includes expenses for outside temporary staffing, temp-to-perm staffing expenses, etc.
19. Total Payroll — The sum of items 17 - 18
Benefits:
20. Payroll Taxes — All payroll taxes (SS, FICA, FUTA, etc.)
21. Retirement — Expenses related to a 401(k), ESOP/ESOT, miscellaneous retirement benefits
22. Insurance — Health ins, medical reimbursements, life ins (except “key man” life), disability insurance
23. Other – Wellness programs, health club memberships, gifts, etc.
24. Total Benefits — The sum of items 20-23
25. Total Compensation — The sum of items 19 & 24
Selling26. Travel & Entertainment/Conventions — Airfare, meals, hotels, social/country club dues, convention related
expenses (Excludes professional dues/memberships)
27. Auto Expenditures — Lease, gas, maintenance/repair, employee parking, mileage allowances, etc.
28. Auto Depreciation — Depreciated expense for current year that is associated with auto only.
29. Total Auto — The sum of items 27 & 28
30. Advertising / Promotion — Promotional / advertising materials, target marketing services, fees paid to advertising or public relations agencies, media buys, contest rewards, customer relations functions, gifts, telemarketing, etc.
31. Total Selling — The sum of items 26, 29 & 30
Operating32. Occupancy Expenditures — Total rent, utilities, building/grounds maintenance, property taxes, janitorial
services, storage & other building related expense. (net rental/sublet income against Occupancy Expense)
33. Occupancy Depreciation/Amortization — Building depreciation, leasehold amortization
34. Total Occupancy — The sum of items 32 & 33
35. Office Equipment Expenditures — Leases and expensed equipment purchases including copier leasing/maintenance, telephone & fax leasing/maintenance, postage meters lease/maintenance, office furniture & fixtures leasing/maintenance (Excludes IT equipment)
For state association and Council for Best Practices use only.

2014 BestPractices Study
165
2014 Best Practices Study
Key Benchmarks
Profile
Revenues
Expenses
Profitability
Employee Overview
Producer Info
Service Staff Info
Technology
Insurance Carriers
Appendix
36. Office Equipment Depreciation/Amortization — Current year depreciation expense for equipment, furniture, fixtures. Include Section 179 purchases.
37. Total Office Equipment — The sum of items 35 & 36
38. IT Expenditures — Expensed/leased computers, servers, software, wiring, maintenance and maintenance contracts, website development/maintenance, website hosting, internet connections, & training.
39. IT Depreciation / Amortization — Current year depreciation expense for computers, servers, etc, software amortization. Include Section 179 items.
40. Total IT — The sum of items 38 & 39
41. Telephone — Local & long distance, cellular telephone, and fax expenses. (Excludes leased telephone equipment; included under Office Equipment)
42. Postage — Postage, Express mail, FedEx, UPS, courier services (Excludes postage meter lease/maintenance; included under Office Equipment)
43. Supplies / Printing — Office supplies, paper, copying/printing, coffee/soft drinks/break room expenses
44. Dues / Subscriptions/ Contributions — Professional dues/membership fees, periodical & information services subscriptions, contributions
45. Taxes / Licenses — Miscellaneous local & franchise taxes, sales tax, other property taxes, license fees. (Excludes property taxes entered under Occupancy, payroll taxes, & state/federal income taxes)
46. Insurance — All property & casualty insurance including employee auto insurance, and any payments for E&O claims /settlements
47. Professional Fees — Expenses for CPAs, lawyers, consultants and other outside advisors (Excludes directors’ fee included in Administrative-Other)
48. Bad Debts — Any bad debts written off, claims paid (Excludes E&O claims/settlements)
49. Outside Services — MVRs, bank fees, employment fees, moving expenses and all other outside service expense including those used to deliver value added services to the agency’s clients (e.g. Zywave, actuarial services, COBRA administration, etc.)
50. Education / Training — Registration fees, materials, in-house training programs, etc. (Excludes training on how to use your agency management system or other agency technology)
51. Miscellaneous — Other non-specific miscellaneous operating expenses not included elsewhere
52. Total Operating — The sum of items 34, 37, 40-51
Administrative53. Amortization of Intangibles — Acquired expirations, covenants, non-competes, etc.
54. Officer Life — Premium paid by agency, agency is beneficiary
55. Interest — All interest expense incurred
56. Other — Director’s fees, non-specific overhead allocations to parent companies, deferred compensation, and any other miscellaneous administrative expenses
57. Total Administrative — The sum of items 53-56
58. Total Expenses — The sum of 25, 31, 52, & 57
PROFITABILITY
59. Pretax Profit / Loss — Net revenues minus total expenses.
60. EBITDA — (Earnings Before Interest, Taxes, Depreciation, and Amortization) The agency’s profit before interest, taxes, depreciation and amortization expenses are included.
61. Pro Forma Pretax Profit — The agency’s profit if all “discretionary” expenditures made for the benefit of the owners, based solely on ownership, were removed and all extraordinary / non-reoccurring expenses or revenues were normalized.
For state association and Council for Best Practices use only.
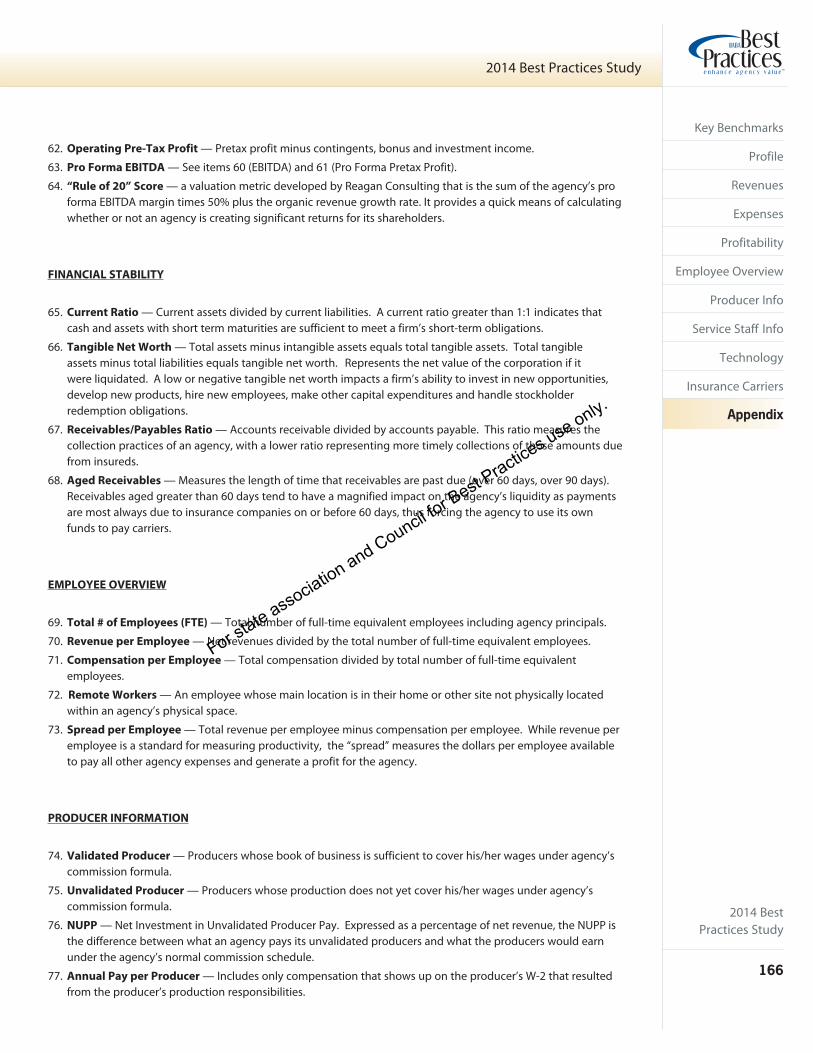
2014 BestPractices Study
166
2014 Best Practices Study
Key Benchmarks
Profile
Revenues
Expenses
Profitability
Employee Overview
Producer Info
Service Staff Info
Technology
Insurance Carriers
Appendix
62. Operating Pre-Tax Profit — Pretax profit minus contingents, bonus and investment income.
63. Pro Forma EBITDA — See items 60 (EBITDA) and 61 (Pro Forma Pretax Profit).
64. “Rule of 20” Score — a valuation metric developed by Reagan Consulting that is the sum of the agency’s pro forma EBITDA margin times 50% plus the organic revenue growth rate. It provides a quick means of calculating whether or not an agency is creating significant returns for its shareholders.
FINANCIAL STABILITY
65. Current Ratio — Current assets divided by current liabilities. A current ratio greater than 1:1 indicates that cash and assets with short term maturities are sufficient to meet a firm’s short-term obligations.
66. Tangible Net Worth — Total assets minus intangible assets equals total tangible assets. Total tangible assets minus total liabilities equals tangible net worth. Represents the net value of the corporation if it were liquidated. A low or negative tangible net worth impacts a firm’s ability to invest in new opportunities, develop new products, hire new employees, make other capital expenditures and handle stockholder redemption obligations.
67. Receivables/Payables Ratio — Accounts receivable divided by accounts payable. This ratio measures the collection practices of an agency, with a lower ratio representing more timely collections of those amounts due from insureds.
68. Aged Receivables — Measures the length of time that receivables are past due (over 60 days, over 90 days). Receivables aged greater than 60 days tend to have a magnified impact on the agency’s liquidity as payments are most always due to insurance companies on or before 60 days, thus forcing the agency to use its own funds to pay carriers.
EMPLOYEE OVERVIEW
69. Total # of Employees (FTE) — Total number of full-time equivalent employees including agency principals.
70. Revenue per Employee — Net revenues divided by the total number of full-time equivalent employees.
71. Compensation per Employee — Total compensation divided by total number of full-time equivalent employees.
72. Remote Workers — An employee whose main location is in their home or other site not physically located within an agency’s physical space.
73. Spread per Employee — Total revenue per employee minus compensation per employee. While revenue per employee is a standard for measuring productivity, the “spread” measures the dollars per employee available to pay all other agency expenses and generate a profit for the agency.
PRODUCER INFORMATION
74. Validated Producer — Producers whose book of business is sufficient to cover his/her wages under agency’s commission formula.
75. Unvalidated Producer — Producers whose production does not yet cover his/her wages under agency’s commission formula.
76. NUPP — Net Investment in Unvalidated Producer Pay. Expressed as a percentage of net revenue, the NUPP is the difference between what an agency pays its unvalidated producers and what the producers would earn under the agency’s normal commission schedule.
77. Annual Pay per Producer — Includes only compensation that shows up on the producer’s W-2 that resulted from the producer’s production responsibilities.
For state association and Council for Best Practices use only.

2014 BestPractices Study
167
2014 Best Practices Study
Key Benchmarks
Profile
Revenues
Expenses
Profitability
Employee Overview
Producer Info
Service Staff Info
Technology
Insurance Carriers
Appendix
SERVICE STAFF INFORMATION
78. Service Staff — Typically non-commissioned personnel who are responsible for providing service to the agency’s clients and/or supporting producers in the sale of new business and the retention of existing business.
79. Service /Sales Support Staff Definitions:
• Account Executives (AE) — Senior level service position, often assigned to a Commercial P&C or Group L&H producer in order to support & enable the producer to focus on new business production. Primary responsibility is to manage the overall service plan/activities for an existing book of business and to maintain ongoing client relationships including renewals & account development. In some agencies the AE position may have specific responsibility to solicit new clients or write new business that is referred/comes to agency, but a majority of time is spent on service and client retention.
• Customer Service Reps (CSR)s / Account Managers — Senior level service position in agencies where the AE position does not exist to support the producer. Position will serve as the main service contact for the client. Customer service duties are similar to AE duties including renewals, account upgrading, cross-selling, etc., but may include some processing responsibilities (e.g. coordinate new client set-up, prepare proposals, order & check policies, issue certificates, binders, billings, etc.).
• Assistant CSRs/Processors — Lower level service position whose main function is to support AEs or other senior level service staff. Position may or may not have direct client contact. Duties vary but are usually processing oriented (e.g. coordinate new client set-ups, prepare proposals, order & check policies, issue certificates, binders, billings, etc.).
• Marketing — Has responsibility to negotiate with carriers to obtain coverage for clients (solicit quotes/rates, negotiate coverage/pricing; place new & renewal business with carriers; may prepare proposals/binders). Keeps track of market trends, pricing and underwriting policies. If you do not have a person dedicated to these activities, leave blank.
• Claims — Coordinates P&C claims reporting, tracking, processing, and analysis for agency and its clients; delivers VAS claims services. If you do not have a person dedicated to these activities, leave blank.
80. Service Staff Pay Ranges— Pay includes Salary, Commissions, and Bonuses but does NOT include benefits or payroll taxes.
INSURANCE CARRIERS
81. Top Carrier Commissions: Small Commercial Accounts — Accounts generating less than $7,500 in commission income.
82. Carrier Service Center Use — Carriers with whom agency has the option of placing policies in their service centers (i.e., the carrier will assume the role of providing customer service to the policyholder).
For state association and Council for Best Practices use only.

Reagan Consulting, Inc.
1 Piedmont Center, Suite 500Atlanta, GA 30305(404) 233-5545(404) 237-5996 - faxwww.reaganconsulting.com
Independent Insurance Agents and Brokers of America
127 S. Peyton StreetAlexandria, VA 22314(800) 221-7917(703) 683-7556 - faxwww.independentagent.com
Independent Insurance Agent
For state association and Council for Best Practices use only.