2014 annual report key performance indicators
TRANSCRIPT

1\1LH 2013 Amended General Rate ApplicationInformation - 'kt )p iled:p ''Gelb- Board Secretary:
Quarterly Regulatory Report
December 31, 2014
Appendix E
Annual Report on Key Performance Indicators
A REPORT TO
THE BOARD OF COMMISSIONERS OF PUBLIC UTILITIES
2014 ANNUAL REPORTON
KEY PERFORMANCE INDICATORSPursuant to Order No. P.U. 14(2004)
NEWFOUNDLAND AND LABRADOR HYDRO
a Rakcar energy company
Page El

Quarterly Regulatory Report December 31, 2014 Appendix E
Annual Report on Key Performance Indicators
Page E2
TABLE OF CONTENTS
1 Introduction ............................................................................................................... 3 2 Overview of Key Performance Indicator Results ....................................................... 4
2.1 Overview .................................................................................................................... 4 2.2 Performance in 2014 versus 2014 Target .................................................................. 5
3 Performance Indices .................................................................................................. 6 3.1 Reliability Performance Indicators ............................................................................. 6
3.1.1 Reliability KPI: Generation ............................................................................ 6 3.1.2 Reliability KPI: Transmission ....................................................................... 10 3.1.3 Reliability KPI: Distribution ......................................................................... 17 3.1.4 Reliability KPI: Other ................................................................................... 23
3.2 Operating Performance Indicators .......................................................................... 26 3.2.1 Operating KPI: Generation ......................................................................... 26
3.3 Financial Performance Indicators ............................................................................ 29 3.4 Customer‐Related Performance Indicators ............................................................. 29
Appendix A: Rationale for Hydro’s 2014 KPI Targets Appendix B: Computation of Weighted Capability Factor and Factors Impacting Performance Appendix C1: Significant Transmission Events – 2014 Appendix C2: Significant Distribution Events – 2014 (Excluding Fourth Quarter) Appendix C3: Underfrequency Load Shedding Events (Excluding Fourth Quarter) Appendix D: List of U.S.‐Based Peers for Financial KPI Benchmarking

Quarterly Regulatory Report December 31, 2014 Appendix E
Annual Report on Key Performance Indicators
Page E3
1 Introduction In Order No. P.U. 14(2004), the Board required Newfoundland and Labrador Hydro (Hydro) to file appropriate historic, current and forecast comparisons of reliability, operating, financial and other Key Performance Indicators (KPIs). These were ordered to be filed with Hydro’s annual financial report, commencing in 2004. In compliance with the above Order, Hydro has 16 individual KPIs within the following four general categories: Reliability; Operating; Financial; and Customer‐Related.
Within each of these categories, KPI data is reported on a historic basis for Hydro. Where appropriate, KPIs are subcategorized based on whether they relate to generation, transmission, distribution or overall corporate activity. For most of the Reliability KPIs, data from the Canadian Electricity Association (CEA) is provided in this report, as has been the case in prior years. At the time of this report, CEA data has been published only to 2013. CEA data is unavailable for underfrequency load shedding, a reliability KPI, as this measure is unique to Hydro’s Island Interconnected System. In the Operating category, the KPIs used to measure performance relate to two specific facilities within Hydro’s system: Bay d’Espoir and Holyrood. For these two generation plants, performance is measured and compared on a year‐over‐year basis. Section 2 of this report provides an overview of Hydro’s KPI performance in 2014 compared with the prior year as well as a comparison of actual KPI results compared with targets. Section 3 of this report provides a detailed analysis of each individual KPI within the four categories named above in Section 3. In addition, it provides fourth quarter data for transmission and distribution reliability which is routinely included in Hydro’s quarterly regulatory reports. Section 3.3 Financial Performance Indicators are not yet available but will follow after the audited financial statements are available. In addition, it provides fourth quarter data for transmission and distribution reliability which is routinely reported in quarterly regulatory reports. The 2014 financial data and 2015 targets in Section 4 Data Table of Key Performance Indicators are not available at this time. This section will be re‐filed after the financial data is available and the 2015 target levels have been established.

Quarterly Regulatory Report December 31, 2014 Appendix E
Annual Report on Key Performance Indicators
Page E4
2 Overview of Key Performance Indicator Results
2.1 Overview
A number of key indices measured by Hydro showed improvement when compared to 2013 or the targets for 2014. All indices are discussed in the following sections of this Appendix. Some highlights are below.
Residential Customer Satisfaction was 84% in 2014 compared to a target of 80%.
There was an improvement in generation availability in 2014 when compared to 2013. Hydro’s Weighted Capability factor, which measures generating unit availability, was 79.7% in 2014 compared to 75.5% in 2.13. The availability of the Holyrood thermal plant improved to 63% in 2014, compared to 46% in 2013. The availability of gas turbines improved to 80%, compared to 62% in 2013. The availability of Hydro’s hydraulic plants was 88% in 2014, compared to 92% in 2013. With the exception of Unit 6 at the Bay d’Espoir generating station, Hydro’s hydraulic units’ availability was consistent with historic performance. Impacting on the overall hydraulic unit availability was a failure of a rectifying transformer Unit 6 and the subsequent failure of the spare during the winter months. These transformer issues resulted in an extended outage to Unit 6 that impacted hydraulic availability.
Derating‐Adjusted Forced Outage Rate (DAFOR ‐ measures the percentage of the time that a unit or group of units is unable to generate at its Maximum Continuous Rating (MCR) due to forced outages)
Hydro’s DAFOR performance was 8.2% in 2014, compared to 13.7% in 2013.
The frequency of transmission delivery point outages improved in 2014, compared to 2013. The forced outage component of transmission delivery point outages also improved in 2014, compared to 2013.
The hydraulic conversion factor at Bay d’Espoir improved in 2014 from 2013. In 2014, the water levels experienced in the reservoirs were generally lower. This allowed greater output flexibility resulting in improved water utilization at the Bay d’Espoir plant. The target was met in 2014 for this measure.
Other indices did not exhibit the same improvement in comparison to the 2013 performance or target.
There were 14 underfrequency load shedding events in 2014. This is compared to a 2014 target of six events and a 2013 performance of seven events.
Transmission and Distribution reliability were impacted by the significant disturbances on January 4 and 5 which were precipitated by a transformer failure at Sunnyside Terminal Station and subsequent breaker failures. Additionally, there were a number of severe weather related outages, primarily occurring in the Central region in February and April.
The 2014 operating KPI for energy conversion at Holyrood was primarily impacted by the low heating content in the fuel consumed at the plant, in addition to a lower average unit loading. A review of all indices are contained in the following sections.
Quarterly Regulatory Report December 31, 2014 Appendix E
Annual Report on Key Performance Indicators
Page E5
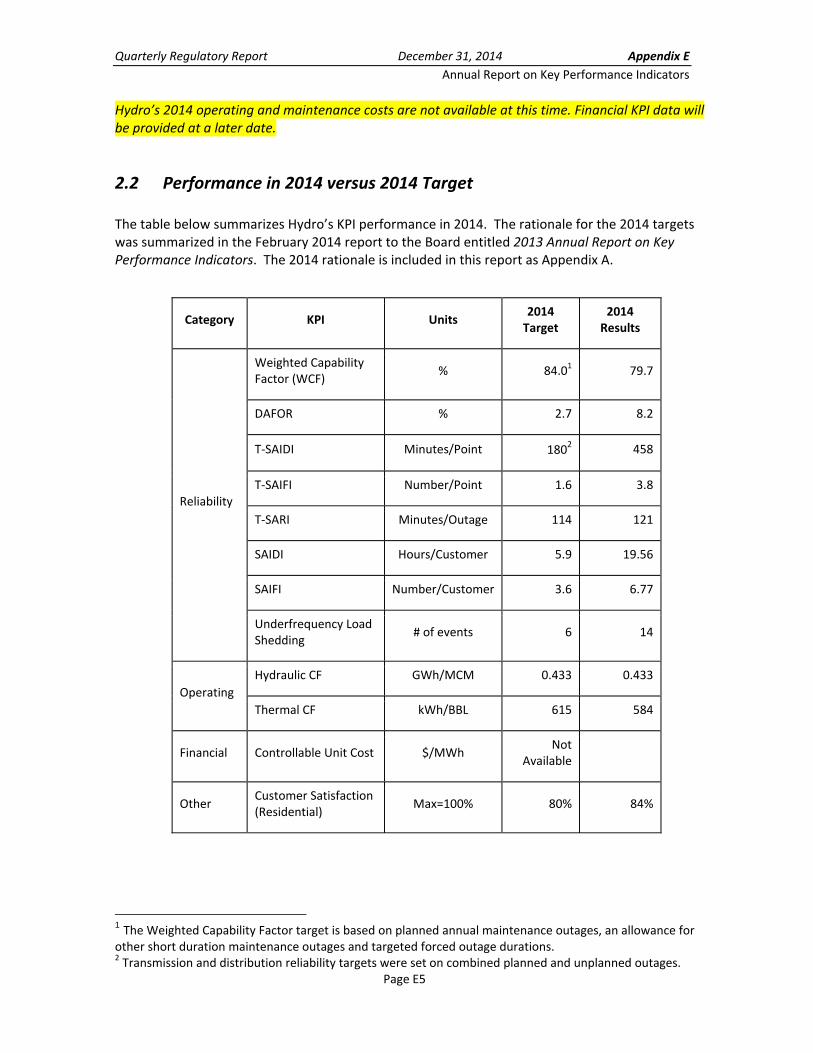
Hydro’s 2014 operating and maintenance costs are not available at this time. Financial KPI data will be provided at a later date.
2.2 Performance in 2014 versus 2014 Target
The table below summarizes Hydro’s KPI performance in 2014. The rationale for the 2014 targets was summarized in the February 2014 report to the Board entitled 2013 Annual Report on Key Performance Indicators. The 2014 rationale is included in this report as Appendix A.
Category KPI Units 2014 Target
2014 Results
Reliability
Weighted Capability Factor (WCF)
% 84.01 79.7
DAFOR % 2.7 8.2
T‐SAIDI Minutes/Point 1802 458
T‐SAIFI Number/Point 1.6 3.8
T‐SARI Minutes/Outage 114 121
SAIDI Hours/Customer 5.9 19.56
SAIFI Number/Customer 3.6 6.77
Underfrequency Load Shedding
# of events 6 14
Operating
Hydraulic CF GWh/MCM 0.433 0.433
Thermal CF kWh/BBL 615 584
Financial Controllable Unit Cost $/MWh Not
Available
Other Customer Satisfaction (Residential)
Max=100% 80% 84%
1 The Weighted Capability Factor target is based on planned annual maintenance outages, an allowance for other short duration maintenance outages and targeted forced outage durations. 2 Transmission and distribution reliability targets were set on combined planned and unplanned outages.

Quarte
3 The focatego
3.1 Hydro divided
3.1.1
3.1.1 aHydro’Intercois avaireflectmeasu
In 201Hydro out forwork p
erly Regulatory
Perform
llowing definories: Reliabili
Reliabilit
monitors reld into the fol
Reliability K
a) Weighted C’s thermal, gaonnected Systilable to suppt the differencure.
4, Hydro’s Wfive‐year aver maintenancplanned for th
y Report
mance Ind
es and descriity, Operating
ty Perform
iability perforlowing subca
KPI: Generati
Capability Facas turbine andtems. The Wly power at mce in generati
CF was 79.7%erage is 81.6%ce. Thereforehat year.
dices
ibes detailed g, Financial, a
mance Indic
rmance with tegories: Gen
ion
ctor (WCF) –d hydroelectrCF measures maximum coning unit sizes,
%, compared t%. The annuale, the capabili
December 3
An
Page E6
Key Performnd Customer
cators
eight separatneration, Tran
a reliability Kric generationthe percentantinuous gene meaning larg
to 75.5% in 2l target for avity in any yea
31, 2014
nual Report on
ance Indicator‐Related.
te metrics. Thnsmission, Dis
KPI for generan assets on thage of the timerating capacrger units hav
013 and a tarvailability inclr is affected b
n Key Performa
or data within
hese metrics stribution, an
ation assets the Island and Le that a unit city. The factove a greater im
rget of 84%. udes the timby the mainte
Appendix E
ance Indicator
n four genera
have been nd Other.
hat includes Labrador or a group ofor is weightedmpact on this
The 2009 to e that units aenance and c
E
rs
l
f units d to s
2013 are apital

Quarterly Regulatory Report December 31, 2014 Appendix E
Annual Report on Key Performance Indicators
Page E7
Thermal unit WCF was 63% in 2014 compared to 46% in 2013. The overall 2014 Thermal WCF target was 67%. Holyrood Unit 3 had a capability factor of 69%, Unit 2 had a capability factor of 61%, and Unit 1 had a capability factor of 60%. Holyrood unit maintenance and planned outages were completed within the intended timeframes. A Holyrood unit was operated throughout the summer months in 2014 in order to support the transmission into the Avalon Peninsula. Overall, the hydraulic unit WCF performance was 88%, compared to 92% in 2013 and a target of 92%. The primary driver for the 88% WCF is the failure of two rectifying transformers on Bay d’Espoir Unit 6. The in‐service rectifying transformer failed on January 30 and the unit was returned to service on February 1, using the spare transformer. This spare transformer failed on February 17 and, with no other spares available, a new transformer was required to be built. The unit was returned to service on August 5 with a new rectifying transformer. Removing the impact of the rectifying transformer failure from the hydraulic WCF, results in an annual hydraulic WCF outcome which is approximately equal to the target of 92%. Gas turbine availability improved to 80% in 2014 from 62% in 2013. The 2014 gas turbine WCF target was 86%. Calculation details for weighted capability as well as a list of factors that can impact KPI performance are included in Appendix B of this report.
3.1.1 b) Weighted Derating‐Adjusted Forced Outage Rate (DAFOR) ‐ a reliability KPI for generation assets that includes Hydro’s thermal and hydroelectric generation assets on the interconnected systems3. DAFOR measures the percentage of the time that a unit or group of units is unable to generate at its Maximum Continuous Rating (MCR) due to forced outages. The KPI is weighted to reflect differences in generating unit sizes. In 2014, Hydro’s weighted DAFOR was 8.2%, compared to 12.2% in 2013 and a target of 2.7%. The thermal DAFOR for 2014 was 13.7%, compared to 36.6% in 2013 and a target of 8.0%. The variance from target for the thermal units was not attributed to any major failures on any one unit, but rather a series of minor failures of one to three days in duration. The hydraulic DAFOR was 5.9% compared to 0.55% in 2013 and a target of 0.6%. The hydraulic DAFOR was impacted by the failures of the rectifying transformers on Bay d’Espoir Unit 6, as described in the previous section. These failures contributed approximately 83% of the overall 2014 hydraulic DAFOR.
Hydro’s overall weighted DAFOR for the period 2009 to 2013 is 5.0%, 2.0% better than the equivalently weighted national average of 7.0% for the same period.
3 DAFOR is not applicable to the gas turbines because of the gas turbines’ low operating hours.

Quarte
3.1.1 c The tafor 201compa
In
F(Fo
InF(P
DO(P
UFP
erly Regulatory
c) Generatio
ble below hig13 and for thearison.
ndex
ailure Rate Forced Outageoperating hour
ncapability actor Percent of Tim
Derating AdjusOutage Rate Percent of Tim
Utilization orced OutageProbability (Pe
y Report
on Equipme
ghlights the ve latest CEA n
es per 8,760 rs)
me)
sted Forced
me)
e ercent of Time
nt Performa
arious perfornational avera
Generatio
NLH 201
NLH 201
CEA ‘09‐
NLH 201
NLH 201
CEA ‘09‐
NLH 201
NLH 201
CEA ‘09‐
e)
NLH 201
NLH 201
CEA ‘09‐
December 3
An
Page E8
ance
rmance indiceage for the pe
n Performanc
Hy
14 2
13 1
‐‘13 2
14 11
13 7
‐‘13 10
14 5
13 0
‐‘13 4
14
13
‐‘13
31, 2014
nual Report on
es for Hydro’seriod 2009‐20
ce Indices
ydro
2.67
1.42
2.01
1.30
7.97
0.27
5.87
0.55
4.17
n Key Performa
s generation f013 are inclu
Thermal
11.72
8.84
7.12
36.41
53.96
26.76
13.74
36.58
12.69
Appendix E
ance Indicator
facilities. Indded for
Gas Turbine
160.36
144.46
22.39
17.36
35.64
13.33
14.34
28.07
13.07
E
rs
dices
e
Quarterly Regulatory Report December 31, 2014 Appendix E
Annual Report on Key Performance Indicators
Page E9
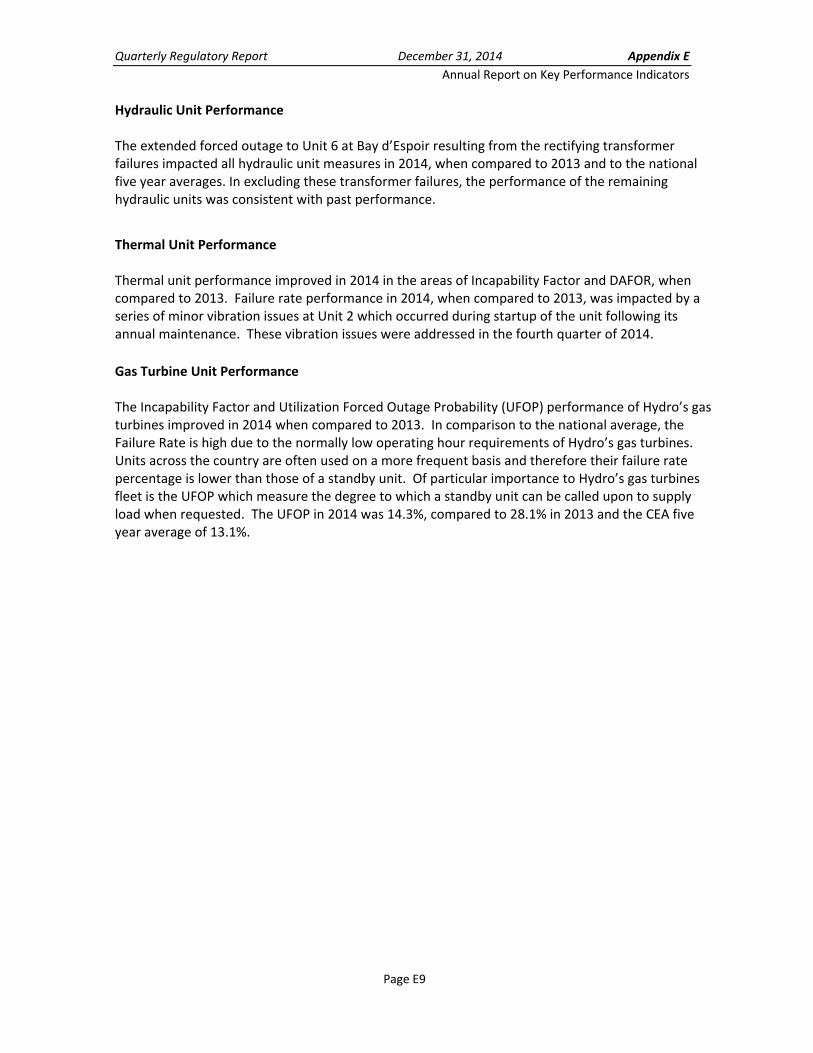
Hydraulic Unit Performance The extended forced outage to Unit 6 at Bay d’Espoir resulting from the rectifying transformer failures impacted all hydraulic unit measures in 2014, when compared to 2013 and to the national five year averages. In excluding these transformer failures, the performance of the remaining hydraulic units was consistent with past performance.
Thermal Unit Performance Thermal unit performance improved in 2014 in the areas of Incapability Factor and DAFOR, when compared to 2013. Failure rate performance in 2014, when compared to 2013, was impacted by a series of minor vibration issues at Unit 2 which occurred during startup of the unit following its annual maintenance. These vibration issues were addressed in the fourth quarter of 2014.
Gas Turbine Unit Performance The Incapability Factor and Utilization Forced Outage Probability (UFOP) performance of Hydro’s gas turbines improved in 2014 when compared to 2013. In comparison to the national average, the Failure Rate is high due to the normally low operating hour requirements of Hydro’s gas turbines. Units across the country are often used on a more frequent basis and therefore their failure rate percentage is lower than those of a standby unit. Of particular importance to Hydro’s gas turbines fleet is the UFOP which measure the degree to which a standby unit can be called upon to supply load when requested. The UFOP in 2014 was 14.3%, compared to 28.1% in 2013 and the CEA five year average of 13.1%.

Quarte
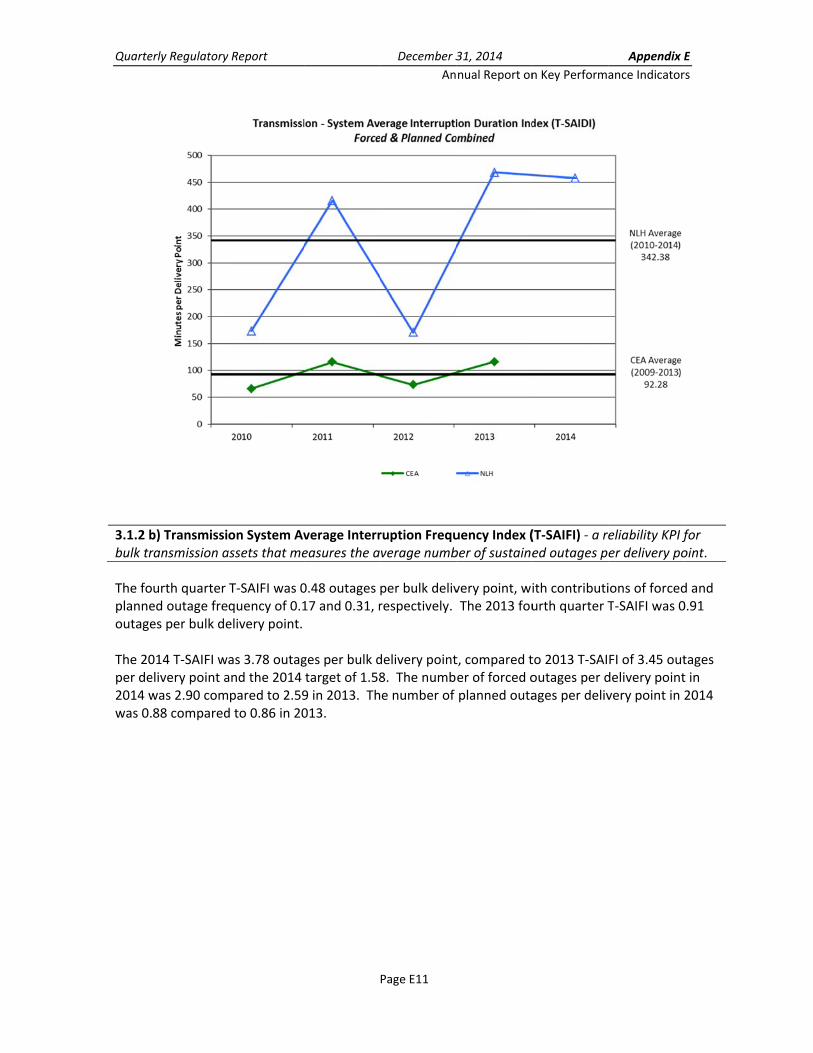
3.1.2
3.1.2 atransm
The focompa The toper dewas 21point. of 128 The sigcontrib56% ofincrea
erly Regulatory
Reliability K
a) Transmissiomission assets
urth quarter ared to 120 m
otal 2014 T‐SAelivery point a14 minutes, cThe planned minutes per
gnificant outabuted 120 mif the total forsed maintena
y Report
KPI: Transmis
on System Avs which measu
T‐SAIDI was 9minutes in 201
AIDI was 458 mand a target oompared to 2outage duratdelivery poin
ages which onutes per derced T‐SAIDI).ance on term
ssion
verage Interrures the aver
96 minutes pe13.
minutes per dof 180 minute277 minutes ition was 244nt.
ccurred on Jalivery point to. The increasinal station e
December 3
An
Page E10
ruption Duratrage duration
er delivery po
delivery pointes per deliveryin 2013 and aminutes, com
anuary 4 and o the forced oe in the T‐SAquipment.
31, 2014
nual Report on
tion Index (T‐ of outages in
oint (forced a
t compared ty point. The fa 2014 target mpared to 192
5, originatingoutage T‐SAIDIDI for planne
n Key Performa
‐SAIDI) ‐ relian minutes per
and planned c
o a 2013 totaforced outageof 53 minute2 minutes in
g on the AvaloDI for 2014 (aed outages w
Appendix E
ance Indicator
ability KPI for r delivery poin
combined)
al of 469 minue duration in es per deliver2013 and a ta
on Peninsula,approximatelywas the result
E
rs
bulk nt.
utes 2014 y arget
, y of
Quarte
3.1.2 bbulk tr The foplanneoutage The 20per de2014 wwas 0.
erly Regulatory
b) Transmissiransmission a
urth quarter ed outage frees per bulk de
014 T‐SAIFI welivery point awas 2.90 com88 compared
y Report
on System Avassets that me
T‐SAIFI was 0quency of 0.1elivery point.
as 3.78 outagand the 2014 pared to 2.59d to 0.86 in 20
verage Interreasures the a
0.48 outages 17 and 0.31, r
ges per bulk dtarget of 1.589 in 2013. Th013.
December 3
An
Page E11
ruption Frequverage numb
per bulk delivrespectively.
delivery point8. The numbe number of
31, 2014
nual Report on
uency Index (ber of sustaine
very point, wi The 2013 fou
t, compared ter of forced oplanned outa
n Key Performa
(T‐SAIFI) ‐ a reed outages p
ith contributiurth quarter T
to 2013 T‐SAIoutages per dages per deliv
Appendix E
ance Indicator
eliability KPI fer delivery po
ions of forcedT‐SAIFI was 0
FI of 3.45 outdelivery pointvery point in
E
rs
for oint.
d and 0.91
tages t in 2014

Quarte
erly Regulatoryy Report December 3
An
Page E12
31, 2014
nual Report onn Key Performa
Appendix E
ance Indicator
E
rs
4.00
3.50
... c 3.00 0 "-~ <II
-~ 2.50 -.; 0 ~
<II Q. .. c 2.00 ~ Q.
" t:: <II
~ 1.50
1.00
0.50
0.00
5.00
4.50
4.00
E ·~ 3.50 "-~
.~ 3.00 Qj 0
X. 2.50 .. 5 ·;::; 2.00 Q.
2 ~ 1.50
1.00
0 .50
0.00
Transmission -System Average Interruption Frequency Index (T-SAIFI) FORCED OUTAGES ONLY
(\ I \ ~
I \. /
I \ / I \/
!!. y
......
....
2010 2011 2012 2013 2014
- cEA __..NLH
Transmission - System Average Interruption Frequency Index (T-SAIFI)
Forced & Planned Comb/ned
1\ I \ _____-A
/ \ ? / '\. /
I \ / !!. \/
~
.....
2010 2011 2012 2013 2014
- NLH
NLH Average
(2010-2014) 2.34
CEAAverage
(2008-2013) 0.78
NLH Average (2010-2014)
3.19
CEAAverage (2009-2013)
0.88

Quarte
3.1.2 ctransmcalcula
Hydro’compacompo2013. minute Hydro’compaof T‐SAcompoSARI isSAIFI. Hydro’CEA fiv
erly Regulatory
c) Transmissiomission assetsated by dividi
’s total transmared to 131 monent of T‐SAThe plannedes in 2013.
’s 2014 total ared to 136 mARI was 74 monent of T‐SAs the ratio of T
’s total T‐SARve year avera
y Report
on System Avs which measung T‐SAIDI by
mission T‐SARminutes per inARI was 42 mi outage comp
transmission minutes in 201inutes per int
ARI was 277 mT‐SAIDI to T‐S
RI performancge.
verage Restoures the avery T‐SAIFI.
RI was 199 minterruption dunutes per inteponent of T‐S
T‐SARI on an13 and a 2014terruption, cominutes per inSAIFI, this inc
ce improved i
December 3
An
Page E13
ration Index rage duration
inutes per inturing the samerruption, coSARI was 286
n annual basis4 target of 11ompared to 1nterruption, crease results
n 2014 comp
31, 2014
nual Report on
(T‐SARI) ‐ rel per transmis
terruption forme quarter in ompared to 9minutes per
s was 121 min14 minutes. T107 minutes iompared to 2from the inc
pared to 2013
n Key Performa
liability KPI fossion interrup
r the fourth q2013. The fo1 minutes peinterruption
nutes per inteThe forced oun 2013. The 223 minutes rease in T‐SA
3 and is bette
Appendix E
ance Indicator
or bulk ption. T‐SARI
quarter of 201rced outage r interruptioncompared to
erruption, utage componplanned outain 2013. SincAIDI relative to
r than the lat
E
rs
is
14,
n in o 192
nent age ce T‐o T‐
test
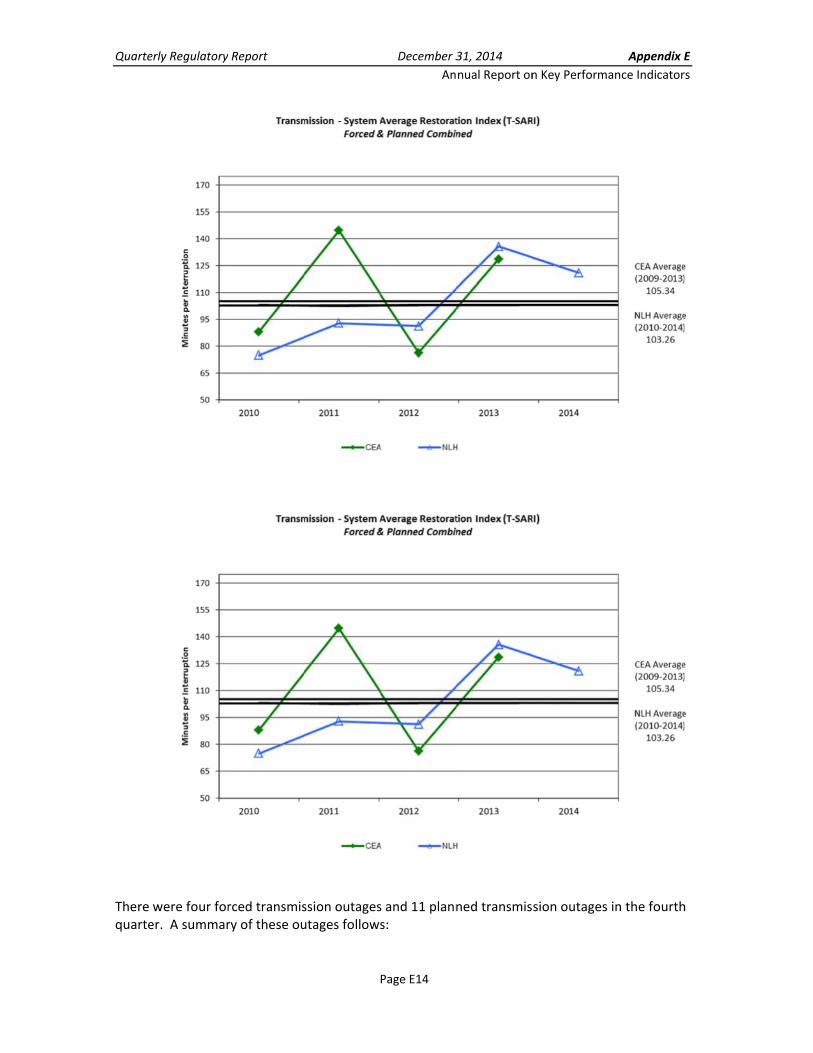
Quarte
There quarte
erly Regulatory
were four forer. A summar
y Report
rced transmisry of these ou
ssion outagesutages follows
December 3
An
Page E14
s and 11 planns:
31, 2014
nual Report on
ned transmis
n Key Performa
sion outages
Appendix E
ance Indicator
in the fourth
E
rs
h
170
155
140 c .,g
125 a. E s -= 110 a; a.
~ 95
" c ~ 80
65
50
170
155
140 c .2 Q. 125
~ -= 110 a; a.
"' 95 s " .5 ~ 80
65
50
Transmission - System Average Restoration Index (T-SARI) Forced & Planned Combined
A
/\ ~ / \ / / ,
" , ,
/ \. / / ~ ~ \~/ /!!"' ..
2010 2011 2012 2013
- cEA
Transmission - System Average Restoration Index (T-SARI) Forced & Planned Combined
A
/\ ~ / \ / / ,
" , ,
/ \. / /
~ ~ \~/ /!!"' ..
2010 2011 2012 2013
- cEA
~
2014
~
2014
CEA Average (2009-2013)
105.34
NLH Average (2010-2014)
103.26
CEA Average (2009-2013)
105.34
NLH Average (2010-20141
103.26

Quarterly Regulatory Report December 31, 2014 Appendix E
Annual Report on Key Performance Indicators
Page E15
Forced On October 4, customers supplied by the Main Brook and Roddickton Terminal Stations experienced an unplanned power outage of ten minutes. The outage occurred at the commencement of a planned outage to perform preventative maintenance on breakers at the St. Anthony Airport Terminal Station. During the switching to prepare for the planned outage, there was a protection trip of TL261 on opening L56T1. Customers in St. Anthony continued to be supplied via the St. Anthony Diesel Plant. On October 29, all customers on the Great Northern Peninsula, north of and including Plum Point, experienced an unplanned power outage of up to one hour and 32 minutes. The outages were caused by the misoperation of the neutral overcurrent protection on Plum Point transformer T1 resulting in a transformer lockout which tripped transmission Lines TL241 and TL244. The protection was activated by issues on feeder L2 in the Plum Point distribution area. Customers north of Plum Point were subjected to an extended outage due to the failure of a micro switch on the high side disconnect switch B1T1 on T1 at Plum Point. The failure of this micro switch required that personnel travel to Plum Point to reset the transformer lockout before TL241 and TL244 could be restored. The St. Anthony Diesel Plant was started to restore St. Anthony customers.
On November 9, customers supplied by the Main Brook and Roddickton Terminal Stations experienced an unplanned power outage of 25 minutes. The outage occurred during switching for a planned outage at the St. Anthony Airport Terminal Station. The customers in Main Brook, Roddickton and St. Anthony distribution systems were planned to be supplied by the St. Anthony diesel plant. The outage occurred when TL261 tripped when disconnect switch L56T1 was opened. The trip is related to an issue with the line distance protection on TL261 operating when the St. Anthony Airport Terminal Station is disconnected from the grid, while the St. Anthony Diesel Plant is on‐line supplying customers in the St Anthony, Roddickton and Main Brook areas. A similar trip occurred on October 4. The problem with the line protection has been addressed to prevent further misoperations. On December 17, customers supplied by the Hawke’s Bay Terminal Station experienced an unplanned power outage of 16 minutes. The outage occurred after a fault occurred during the energization of the Mobile Substation P235 at Hawke’s Bay during planned work. A set of temporary transportation grounds were not removed from P235 prior to its energization.
Planned
On October 4, customers supplied by the Bear Cove Terminal Station experienced a planned power outage of 13 minutes. The outage was required to isolate transmission line TL244 to perform preventative maintenance on breaker B1L44 at Plum Point Terminal Station. On October 7, customers supplied by the Parson’s Pond Terminal Station experienced a planned power outage of five hours and 16 minutes. The outage was required to perform preventative maintenance on equipment in the terminal station.
Quarterly Regulatory Report December 31, 2014 Appendix E
Annual Report on Key Performance Indicators
Page E16
On October 18, customers supplied by the Wiltondale and Glenburnie Terminal Stations experienced a planned power outage of five hours. The outage was required to connect mobile substation P235 in Wiltondale in order to perform terminal station improvements. On November 1, customers supplied by the Jackson’s Arm and Hampden Terminal Stations experienced a planned power outage of six hours and 17 minutes. The outage was required to perform preventive maintenance on equipment in the terminal stations.
On November 2, customers supplied by the Jackson’s Arm and Hampden Terminal Stations experienced a planned power outage of five hours and 36 minutes. The outage was required to complete preventive maintenance on equipment in the terminal stations.
On November 3, customers supplied by the Cow Head Terminal Station experienced a planned power outage of five hours and 36 minutes. The outage was required to remove the high voltage leads on circuit breaker B1L27 in the terminal station. Working is continuing to replace this breaker.
On November 5, customers supplied by the Rocky Harbour Terminal Station experienced a planned power outage of one hour and 11 minutes (71 minutes). The outage was required to obtain a dissolved gas analysis sample from transformer T1 in the station, in addition to the installation of a new pole on feeder L1 in the Rocky Harbour distribution system. On November 13, customers supplied by the Cow Head and Parson’s Pond Terminal Stations experienced a planned power outage of five minutes. The outage was required to safely close bypass switch B1L27‐BP at Cow Head Terminal Station.
On November 16, all customers supplied by the Plum Point and Bear Cove Terminal Stations and customers supplied by feeder L2 in St. Anthony experienced a planned power outage of up to seven hours and 44 minutes. Customers in Main Brook, Roddickton, and St. Anthony feeders L1 and L3 were supplied via the St. Anthony Diesel Plant. The outages were required to perform preventative/corrective maintenance on circuit breaker B1L56, disconnect switch B1L44 and the BC6‐R1 recloser structure at the Bear Cove station; and to perform preventative/corrective maintenance on circuit breaker B1L41, bypass switch B1L41‐BP and disconnect switch B1T1 at the Plum Point station. In addition, the outage facilitated replacement of a pole on structure 405 on transmission line TL241. On November 22, NP customers supplied by the Sunnyside Terminal Station experienced a planned power outage of five hours and 45 minutes. The outage was required to complete corrective and preventive maintenance on disconnect switches on bus B3 at the terminal station.
On December 2, customers supplied by the Wiltondale and Glenburnie Terminal Stations experienced a planned power outage of five hours and 51 minutes. The outage was required to disconnect the mobile substation P235 in Wiltondale and to energize the new Wiltondale Terminal Station.

Quarte
3.1.3
3.1.3 aand it custom In the custom The to One ofin the voltagWabus
3.1.3 bwhich
In the total 2
erly Regulatory
Reliability K
a) System Avemeasures sermer served du
fourth quartemer during th
otal 2014 SAID
f the main cosummer and e conversion sh Substation
b) System Avemeasures the
fourth quarte2014 SAIFI wa
y Report
KPI: Distribut
erage Interrurvice continuiuring the year
er of 2014, SAe same quart
DI was 19.56 h
ntributors to fall of 2014. Tproject, whil
n and for vario
erage Interrue average cum
er of 2014 SAs 6.77, comp
tion
uption Duratioity in terms ofr.
AIDI was 2.56ter of 2013.
hours per cus
SAIDI was a sThe planned e the Wabushous distributi
uption Frequemulative num
AIFI was 1.18,ared to 5.82
December 3
An
Page E17
on Index (SAf the average
hours per cu
stomer, comp
series of planoutages in Lah planned ouon feeders.
ency Index (Smber of sustain
compared toin 2013 and a
31, 2014
nual Report on
IDI) ‐ a reliabe cumulative d
ustomer, com
pared to 19.2
nned outages abrador City wutages were to
SAIFI) ‐ reliabined interrupt
o 1.41 duringa target of 3.6
n Key Performa
bility KPI for dduration of ou
mpared to 5.01
2 hours per c
in Labrador Cwere requiredo complete u
ility KPI for ditions per cust
the same qua65 in 2014.
Appendix E
ance Indicator
distribution seutages per
1 hours per
customer in 2
City and Wabd to completeupgrades at th
istribution sertomer per yea
arter of 2013
E
rs
ervice
013.
bush e the he
rvice ar.
. The
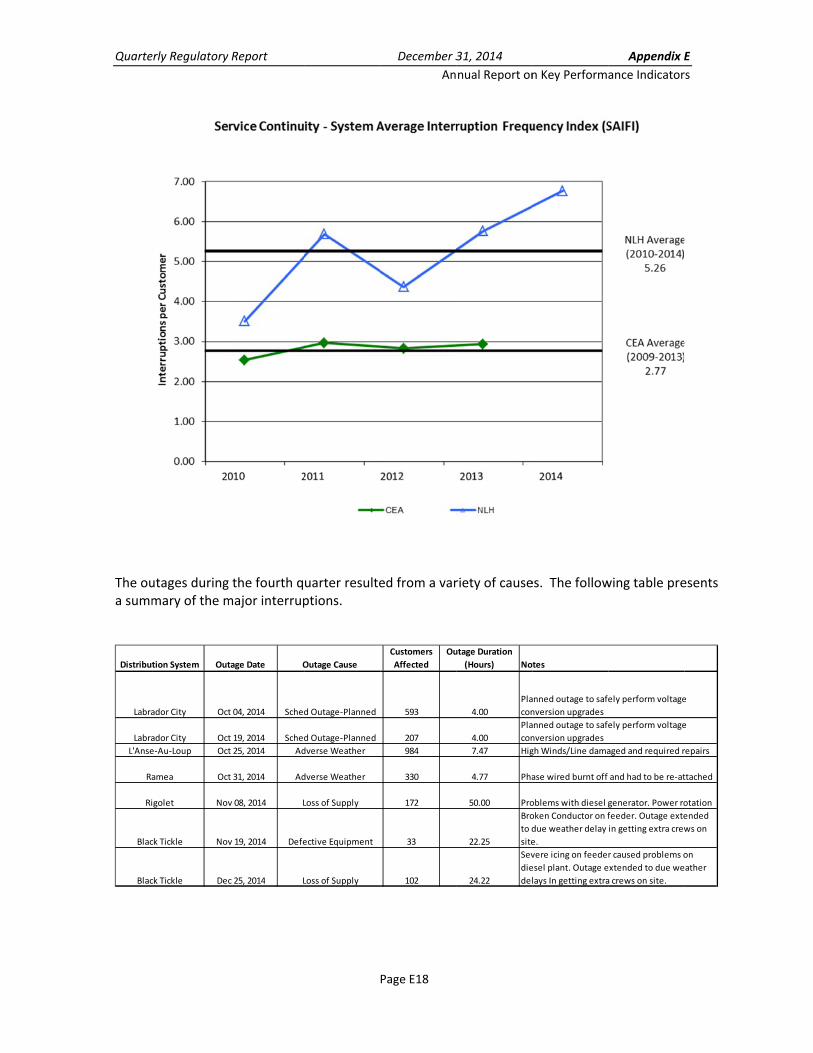
Quarte
The oua summ
Distribut
Labra
Labra
L'Anse
Ra
Ri
Blac
Blac
erly Regulatory
utages duringmary of the m
tion System Out
ador City Oct
ador City Oct
e‐Au‐Loup Oct
amea Oct
igolet Nov
ck Tickle Nov
ck Tickle De
y Report
g the fourth qmajor interrup
tage Date O
t 04, 2014 Sched
t 19, 2014 Sched
t 25, 2014 Ad
t 31, 2014 Ad
v 08, 2014 L
v 19, 2014 Defe
c 25, 2014 L
uarter resulteptions.
Outage Cause
d Outage‐Planned
d Outage‐Planned
dverse Weather
dverse Weather
Loss of Supply
ective Equipment
Loss of Supply
December 3
An
Page E18
ed from a var
Customers
Affected
Ou
593
207
984
330
172
33
102
31, 2014
nual Report on
riety of cause
utage Duration
(Hours) No
4.00
Pla
con
4.00
Pla
con
7.47 Hig
4.77 Pha
50.00 Pro
22.25
Bro
to d
site
24.22
Sev
die
del
n Key Performa
es. The follow
tes
anned outage to safe
nversion upgrades
anned outage to safe
nversion upgrades
gh Winds/Line dama
ase wired burnt off
oblems with diesel g
oken Conductor on f
due weather delay
e.
vere icing on feede
esel plant. Outage e
lays In getting extra
Appendix E
ance Indicator
wing table pre
ely perform voltage
ely perform voltage
aged and required r
and had to be re‐at
generator. Power ro
feeder. Outage exte
in getting extra crew
r caused problems o
xtended to due we
a crews on site.
E
rs
esents
e
e
repairs
ttached
otation
ended
ws on
on
ather

Quarterly Regulatory Report December 31, 2014 Appendix E
Annual Report on Key Performance Indicators
Page E19
A summary of the more significant 2014 interruptions affecting the distribution systems (i.e., outages generally to a complete system with duration of greater than five hours) are contained in Appendix C2.
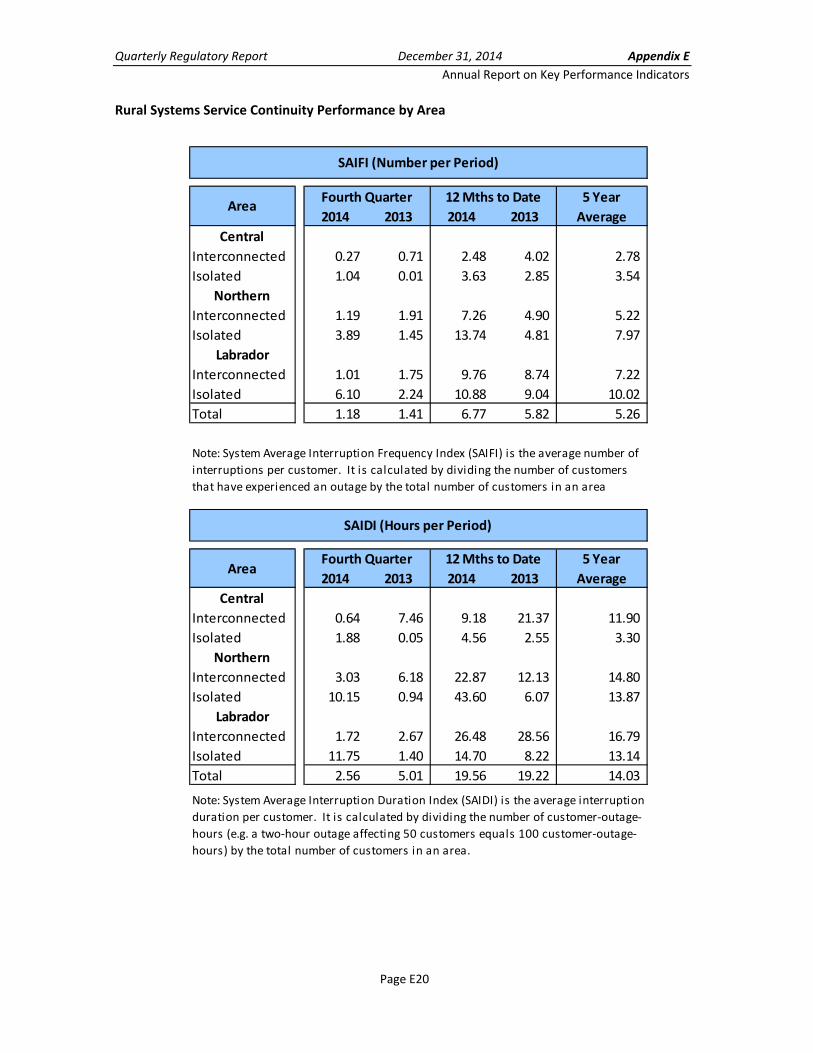
3.1.3 c) Additional Information As per Hydro’s regular quarterly report, this section provides more detailed information on distribution system interruptions with performance broken down by Area, Origin, and Type.
Quarterly Regulatory Report December 31, 2014 Appendix E
Annual Report on Key Performance Indicators
Page E20
Rural Systems Service Continuity Performance by Area
5 Year
2014 2013 2014 2013 Average
Central
Interconnected 0.27 0.71 2.48 4.02 2.78
Isolated 1.04 0.01 3.63 2.85 3.54
Northern
Interconnected 1.19 1.91 7.26 4.90 5.22
Isolated 3.89 1.45 13.74 4.81 7.97
Labrador
Interconnected 1.01 1.75 9.76 8.74 7.22
Isolated 6.10 2.24 10.88 9.04 10.02
Total 1.18 1.41 6.77 5.82 5.26
5 Year
2014 2013 2014 2013 Average
Central
Interconnected 0.64 7.46 9.18 21.37 11.90
Isolated 1.88 0.05 4.56 2.55 3.30
Northern
Interconnected 3.03 6.18 22.87 12.13 14.80
Isolated 10.15 0.94 43.60 6.07 13.87
Labrador
Interconnected 1.72 2.67 26.48 28.56 16.79
Isolated 11.75 1.40 14.70 8.22 13.14
Total 2.56 5.01 19.56 19.22 14.03
Note: System Average Interruption Frequency Index (SAIFI) is the average number of
interruptions per customer. It is calculated by dividing the number of customers
that have experienced an outage by the total number of customers in an area
Note: System Average Interruption Duration Index (SAIDI) is the average interruption
duration per customer. It is calculated by dividing the number of customer‐outage‐
hours (e.g. a two‐hour outage affecting 50 customers equals 100 customer‐outage‐
hours) by the total number of customers in an area.
SAIFI (Number per Period)
Area12 Mths to DateFourth Quarter
SAIDI (Hours per Period)
AreaFourth Quarter 12 Mths to Date
Quarterly Regulatory Report December 31, 2014 Appendix E
Annual Report on Key Performance Indicators
Page E21
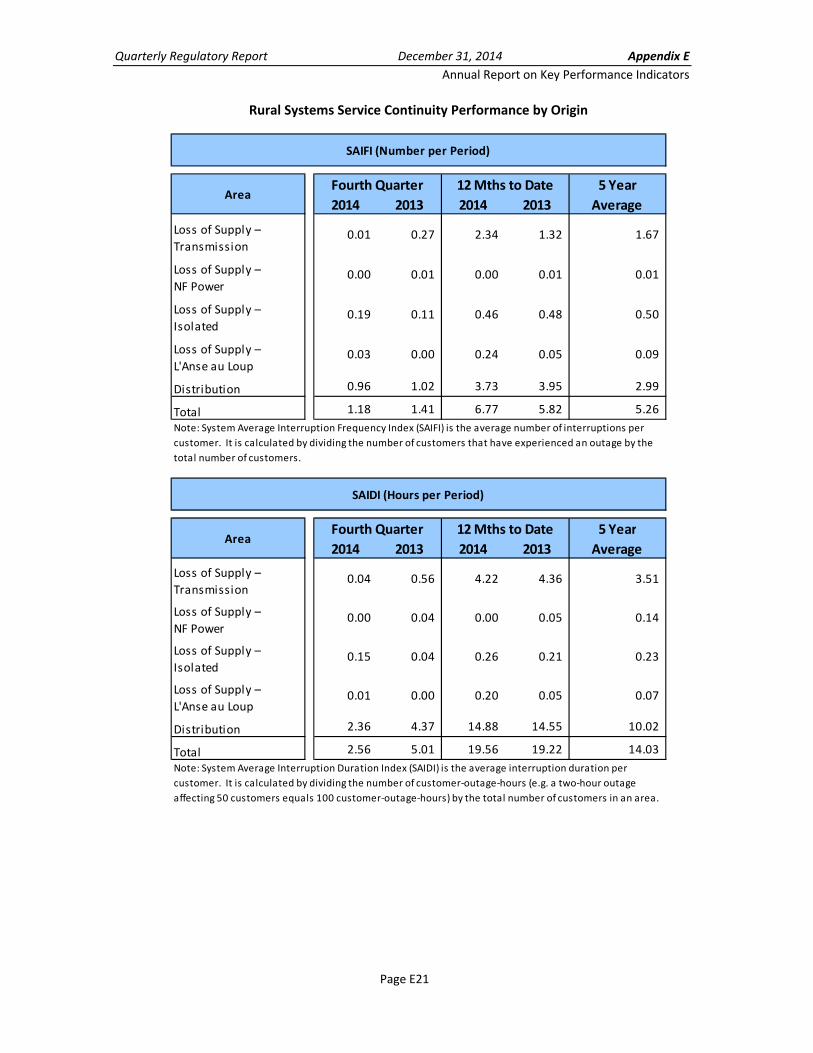
Rural Systems Service Continuity Performance by Origin
5 Year
2014 2013 2014 2013 Average
Loss of Supply –
Transmission0.01 0.27 2.34 1.32 1.67
Loss of Supply –
NF Power0.00 0.01 0.00 0.01 0.01
Loss of Supply –
Isolated0.19 0.11 0.46 0.48 0.50
Loss of Supply –
L'Anse au Loup0.03 0.00 0.24 0.05 0.09
Distribution 0.96 1.02 3.73 3.95 2.99
Total 1.18 1.41 6.77 5.82 5.26
5 Year
2014 2013 2014 2013 Average
Loss of Supply –
Transmission0.04 0.56 4.22 4.36 3.51
Loss of Supply –
NF Power0.00 0.04 0.00 0.05 0.14
Loss of Supply –
Isolated0.15 0.04 0.26 0.21 0.23
Loss of Supply –
L'Anse au Loup0.01 0.00 0.20 0.05 0.07
Distribution 2.36 4.37 14.88 14.55 10.02
Total 2.56 5.01 19.56 19.22 14.03
Note: System Average Interruption Frequency Index (SAIFI) is the average number of interruptions per
customer. It is calculated by dividing the number of customers that have experienced an outage by the
total number of customers.
SAIFI (Number per Period)
AreaFourth Quarter 12 Mths to Date
SAIDI (Hours per Period)
12 Mths to Date
Note: System Average Interruption Duration Index (SAIDI) is the average interruption duration per
customer. It is calculated by dividing the number of customer‐outage‐hours (e.g. a two‐hour outage
affecting 50 customers equals 100 customer‐outage‐hours) by the total number of customers in an area.
Fourth QuarterArea

Quarterly Regulatory Report December 31, 2014 Appendix E
Annual Report on Key Performance Indicators
Page E22
Rural Systems Service Continuity Performance by Type – 2014 Fourth Quarter Only
SAIFI SAIDI SAIFI SAIDI SAIFI SAIDI
Central
Interconnected 0.00 0.00 0.27 0.64 0.27 0.64
Isolated 0.16 0.04 0.88 1.84 1.04 1.88
Northern
Interconnected 0.54 1.38 0.65 1.65 1.19 3.03
Isolated 0.89 6.51 3.00 3.64 3.89 10.15
Labrador
Interconnected 0.61 1.44 0.40 0.29 1.01 1.72
Isolated 2.35 7.10 3.74 4.66 6.10 11.76
Total 0.47 1.41 0.71 1.15 1.18 2.56
Unscheduled
Note:
1. System Average Interruption Frequency Index (SAIFI) is the average number of interruptions per customer.
It is calculated by dividing the number of customers that have experienced an outage by the total number of
customers in an area.
2. System Average Interruption Duration Index (SAIDI) is the average interruption duration per customer. It
is calculated by dividing the number of customer‐outage‐hours (e.g. a two‐hour outage affecting 50
customers equals 100 customer‐outage‐hours) by the total number of customers in an area.
TotalScheduledArea
Quarterly Regulatory Report December 31, 2014 Appendix E
Annual Report on Key Performance Indicators
Page E23
3.1.4 Reliability KPI: Other
3.1.4 a) Under Frequency Load Shedding (UFLS) ‐ reliability KPI that measures the number of events in which shedding of a customer load is required to counteract a generator trip. Customer loads are shed automatically depending upon the generation lost. There were four underfrequency events during the fourth quarter of 2014, summarized as follows:
On October 13, Holyrood Unit 2 tripped. Hydro’s investigation has concluded that the Holyrood Terminal Station (HRD TS) Unit #2 unit breakers (B2L42 & B2B11) tripped forcing Unit 2 offline. Hydro was conducting commissioning testing on the HRD TS Unit #1 unit breakers (B1L17 & B1B11) when the incident occurred. As part of the commissioning testing, a protection relay trip check was being performed on the Unit 1 unit breakers. The incorrect protection relay, the protection relay associated with Unit 2 unit breakers, was triggered. The incident and commissioning procedures have been reviewed to ensure a repeat of similar incidents is prevented.
With the removal of generation (approximately 70 MW) the system frequency dropped to 58.66 Hz resulting in the activation of the under frequency protection at Newfoundland Power. Total system load at the time of the incident was 730 MW. All Newfoundland Power customers were reported to be restored within four minutes after the event occurred. Load Shed: Newfoundland Power: 16 MW. (Unsupplied Energy: 65 MW‐Mins)
On November 15, at 1621 hours, Holyrood Unit 2 tripped. Hydro’s investigation has determined that part of the commissioning activities ongoing on Holyrood Unit 1 included control valve programming and testing. Completing this work required working on the Mark V Distributed Control System (DCS) which is common to both Units 1 and 2. Comparisons between Unit 1 and Unit 2 control valve programming were being checked when a test was initiated to stroke the valve on Unit 1. This test was accidentally initiated on Unit 2 causing the trip. The Unit 1 and Unit 2 distributed control system programming parameters are not distinguishable from each other at the programming level. The technologists mistakenly thought they were testing the Unit #1 parameters. Both the Hydro and the OEM contractor technologists are very familiar with this control system. Hydro has identified a failure to check/identify the task as the root cause. The outcomes of the investigation were reviewed with employees who may work inside the DCS to highlight the system limitations on naming convention.
With the removal of generation (approximately 70 MW) the system frequency dropped to 58.68 Hz resulting in the activation of the under frequency protection at Newfoundland Power. Total system load at the time of the incident was 964 MW. All Newfoundland Power customers were reported to be restored within 2 minutes after the event occurred. Newfoundland Power load loss: 15 MW (Unsupplied Energy: 30 MW‐Mins)
Quarterly Regulatory Report December 31, 2014 Appendix E
Annual Report on Key Performance Indicators
Page E24
On December 19, at 0849 hours, Holyrood Unit 2 tripped. Hydro’s investigation determined the trip was the result of loss of power to all eight of the unit’s 4160V motors. The motors tripped due to the failure of a motor lug resulting in a fault which was detected by the overcurrent protection. This subsequently tripped the unit.
With the removal of generation (approximately 72 MW) the system frequency dropped to 58.77 Hz resulting in the activation of the under frequency protection at Newfoundland Power. Total Island load at the time of the incident was 1125 MW. All Newfoundland Power customers were reported to be restored within 2 minutes after the event occurred. Newfoundland Power load loss: 23 MW (Unsupplied Energy: 46 MW‐Mins)
On December 30, at 2334 hours, Holyrood Unit 3 tripped. Hydro’s investigation determined that the unit tripped because of a loss of atomizing steam going to the burner. Operations found two manual valves in the incorrect position (one 90% closed and one 100% closed). The unit controls operated correctly to adjust for a low aux steam pressure but the position of these valves resulted in the cut off of all atomizing steam. With the removal of generation (approximately 130 MW) the system frequency dropped to 58.36 Hz resulting in the activation of the under frequency protection at Newfoundland Power, Hydro, and Corner Brook Pulp & Paper Limited. Total Island load at the time of the incident was 1370 MW. Hydro advised Newfoundland Power to begin customer restoration within 4 minutes of the incident. Relative to the time of the incident: all (919) Hydro customers were restored within 4 minutes; Corner Brook Pulp & Paper Limited was restored within 5 minutes; the majority (15,683) of Newfoundland Power customers were reported to be restored within 22 minutes; and the remaining (1299) Newfoundland Power customers were reported to be restored within 69 minutes. Load Shed: Newfoundland Power: 95 MW
Hydro: 3 MW Corner Brook Pulp & Paper: 14 MW Total Load Shed: 112 MW (Unsupplied Energy: 1,664 MW‐Mins)
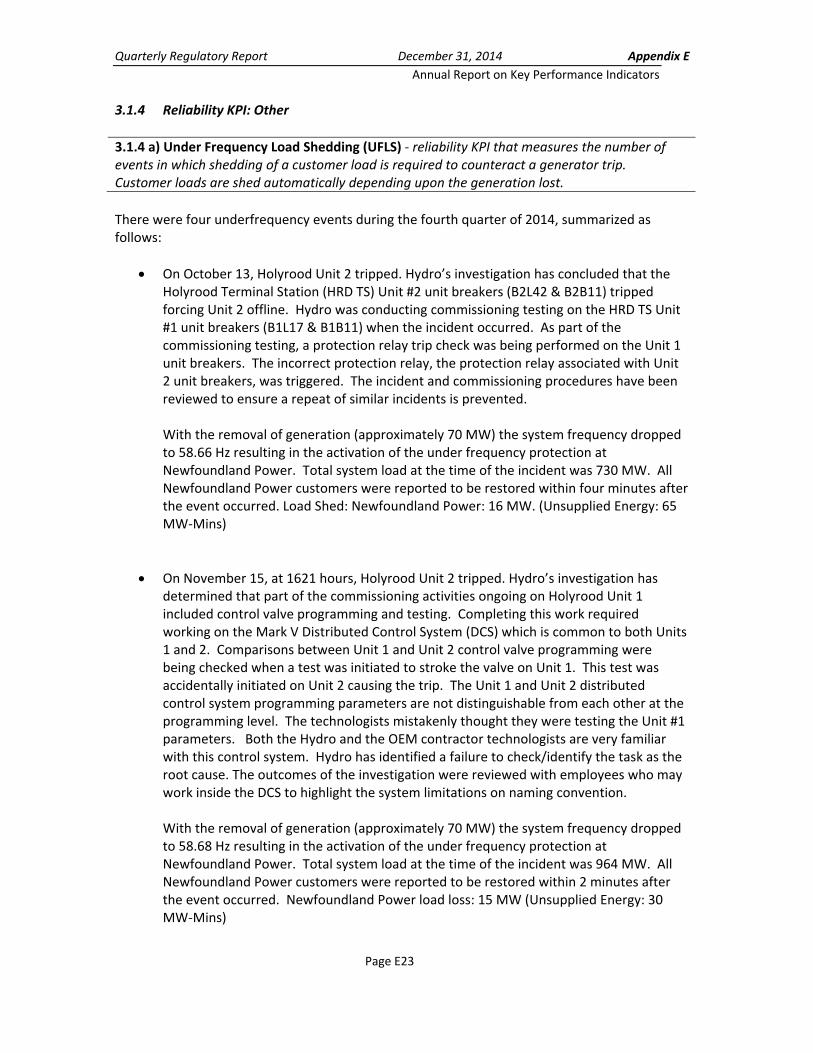
In total, there were 14 UFLS events in 2014, compared to 7 in 2013 and the five‐year average (2009‐2013) of 5.6 events. Refer to the graph below which compares the UFLS events over the past five years to this year’s performance.
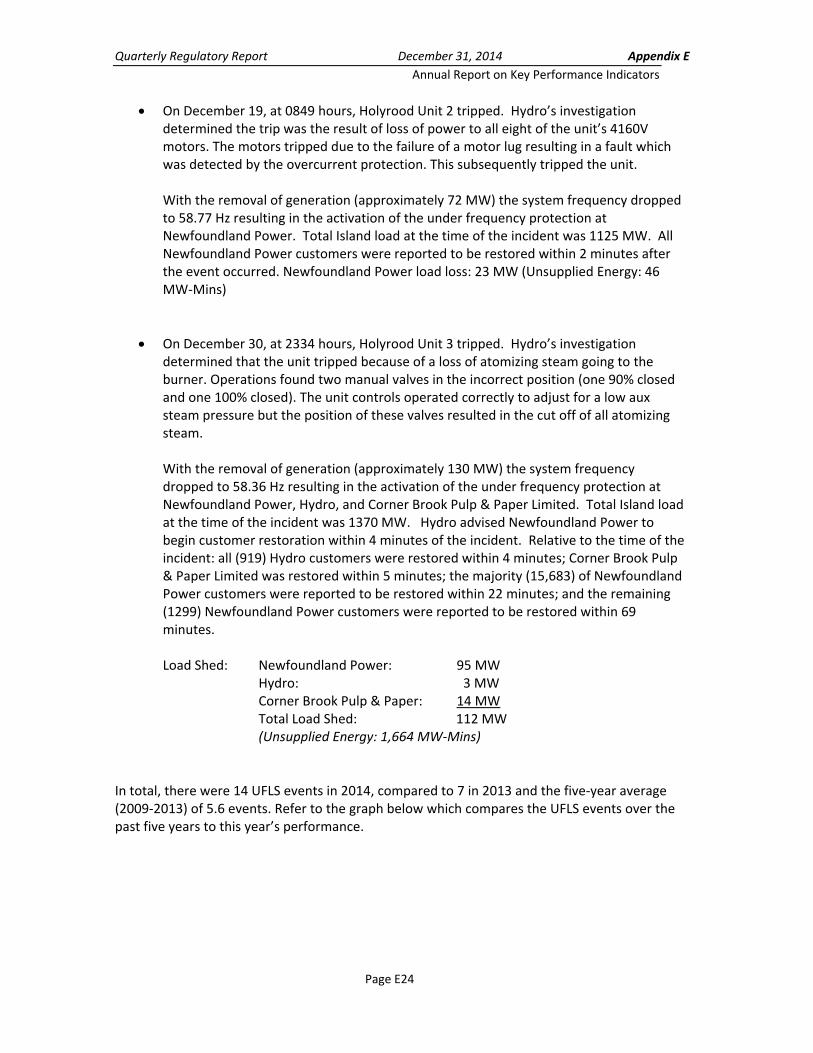
Quarte
The foin 201
The de
erly Regulatory
llowing table3 in addition
etails of the p
NF Power
Industrials
Hydro Rura
Total Event
NF Power
Industrials
Hydro Rura
Total Event* Underfrequen
outages. Outag
section of the re
Custom
Custom
y Report
compares thto annual pe
previous 10 U
s
al*
ts
s
al*
tscy activity affect
ge frequency and
eport for these a
Underfr
mers
Underfreque
mers
Pag
he UFLS eventrformance.
FLS events in
2014
4
1
1
4
2014
1,722
70
12
1,804ting Hydro Rural C
duration are als
reas, namely the
Fourth Qua
requency Load
Fourth Qua
ency Load Shed
December 3
Annual R
ge E25
ts in the fourt
2014 are sum
2013 20
1
0
1
1
2013 20
175
0
0
175Customers may a
o included in tot
e Connaigre Penin
arter
d Shedding Num
arter
dding Unsupplie
31, 2014
Report on Key
th quarter of
mmarized in A
014 2013
14
3
2
14
014 2013
5,798 13,
200
48
6,046 14,also result in a nu
als shown in the
nsula and Bonne
Year to Date
mber of Event
Year to Date
ed Energy (MW
Performance I
2014 to the s
Appendix C3.
5 Year Av
3 (2010–2
7
0
3
7
5 Year Av
3 (2010–2
917
0
324
241umber of delivery
delivery point st
Bay.
s
W‐min)
Appendix E
Indicators
same quarter
verage
2014)
7
1.2
1.6
7
verage
2014)
4,713
92
96
4,901y point
tatistics
E
r

Quarte
3.2 This seare ass
3.2.1
3.2.1 aprincipconvermillion
In 2010.4324
In 201the Baefficie
erly Regulatory
Operatin
ection presensociated with
Operating K
a) Hydraulic Cpal hydroelectrting water ton cubic metres
4, the hydrau4 GWh/MCM
4, the water y d’Espoir plant output lev
y Report
ng Perform
ts informatioh generation.
KPI: Generat
Conversion Fatric generatioo energy and s (MCM) of w
ulic conversiocompared to
levels were loant, as there wels.
Pag
mance Indic
on on two ind
tion
actor (Bay d’Eon assets locait is calculate
water consum
n factor for Bo a 2014 targe
ower in the rewere fewer h
December 3
Annual R
ge E26
cators
icators of ope
Espoir) ‐ a repated at Bay d’ed as the ratioed.
Bay d’Espoir wet of 0.433 GW
eservoirs allowhours where p
31, 2014
Report on Key
erating perfo
presentative p’Espoir. This Ko of Net GWh
was 0.4329 GWWh/MCM.
wing for impplant product
Performance I
ormance, both
performanceKPI tracks theh generated fo
Wh/MCM, co
roved water tion was high
Appendix E
Indicators
h of which
e KPI for the e efficiency inor every one
ompared to
utilization at er at less
E
n
Quarterly Regulatory Report December 31, 2014 Appendix E
Annual Report on Key Performance Indicators
Page E27
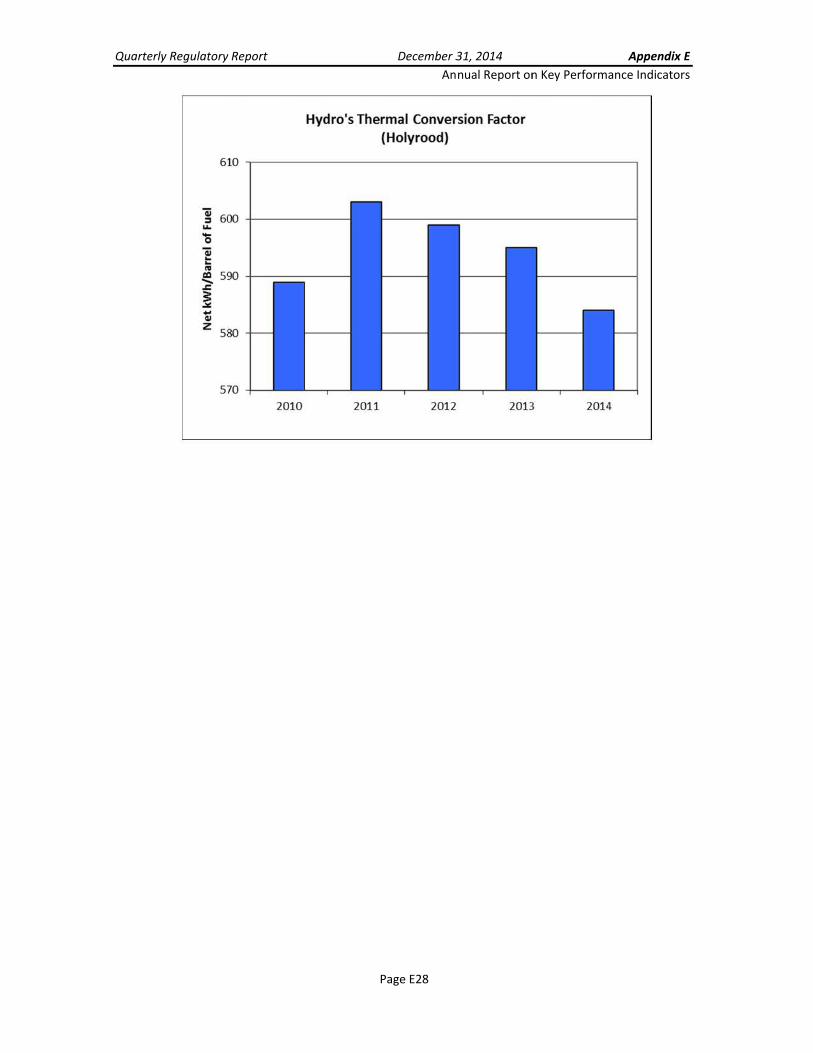
3.2.1 b) Thermal Conversion Factor ‐ a representative performance KPI for the oil‐fired thermal generation assets located at Holyrood. This KPI tracks the efficiency in converting heavy fuel oil into electrical energy and is measured as the ratio of the net kWhs generated to the number of barrels of No. 6 fuel oil consumed. The thermal conversion factor for Holyrood is proportional to the output level of the three units, with higher averages and sustained loadings resulting in higher conversion factors. The output level of the Holyrood Thermal Generating Station will vary depending on hydraulic production on the Island, quantity of power purchases, customer energy requirements and system security requirements. The thermal conversion factor is also impacted by the heating content in the No. 6 fuel consumed at the plant, measured in BTUs/bbl. In 2014, Hydro’s net thermal conversion factor was 584 kWh per barrel compared to a 2014 target of 615 kWh per barrel. The lower energy conversion rate in 2014, relative to the target, is resulting from two primary factors:
operating the units at a lower average output level due to the high volume of water resources on the Island and energy receipts relative to the system load requirements; and
a low heating content in the No. 6 fuel consumed at the Holyrood generating station.
The efficiency at the Holyrood plant has remained relatively consistent with a gross heat rate performance of 10,124 BTU/kWh in 2014 compared to 10,127 BTU/kWh in 2013. In 2014, the units were dispatched as required for Avalon transmission support and system peak load considerations. The average net unit load while operating was 83.2 MW, down from 87.6 MW in 2013 and a forecast of 92.3 MW for 2014. Overall, net production from Holyrood for 2014 was 1,315 GWh, a 37% increase from 2013 production levels and a decrease of 8% from the 2014 forecast. The production increase in 2014 relative to 2013 was related to operating one unit throughout the summer months in 2014 in order to support the transmission into the Avalon Peninsula, in addition to higher customer demand requirements during the winter and early spring period.
Quarteerly Regulatoryy Report December 3
An
Page E28
31, 2014
nual Report onn Key Performa
Appendix E
ance Indicator
E
rs
2010
Hydro's Thermal Conversion Factor {Holyrood)
2011 2012 2013 2014

Quarterly Regulatory Report December 31, 2014 Appendix E
Annual Report on Key Performance Indicators
Page E29
3.3 Financial Performance Indicators 2014 Financial results are not available at this time.
3.4 Customer‐Related Performance Indicators
3.4.1 a) Residential Customer Satisfaction ‐ an indicator of Hydro’s residential customers overall satisfaction level with service, which is tracked by the Percent Satisfied Customers KPI4. The Percent Satisfied Customers measure is also a corporate performance KPI that tracks the satisfaction of rural residential customers with Hydro’s performance. The Percent Satisfied Customers measure is produced via an annual survey of Hydro’s residential customers. The 2014 residential customer satisfaction survey shows that 84% of customers are either very
satisfied or somewhat satisfied with Hydro.
4 As of 2009, the Customer Satisfaction index (CSI) is no longer being calculated as a Customer‐Related Performance Indicator.
74
76
78
80
82
84
86
88
90
92
94
2008 2009 2010 2011 2012 2014
Overall Customer Satisfaction
Redidential Customer Satisfaction

Quarterly Regulatory Report December 31, 2014 Appendix E
Annual Report on Key Performance Indicators
Page E30
Appendices
Quarterly Regulatory Report December 31, 2014 Appendix E
Annual Report on Key Performance Indicators
Page E31
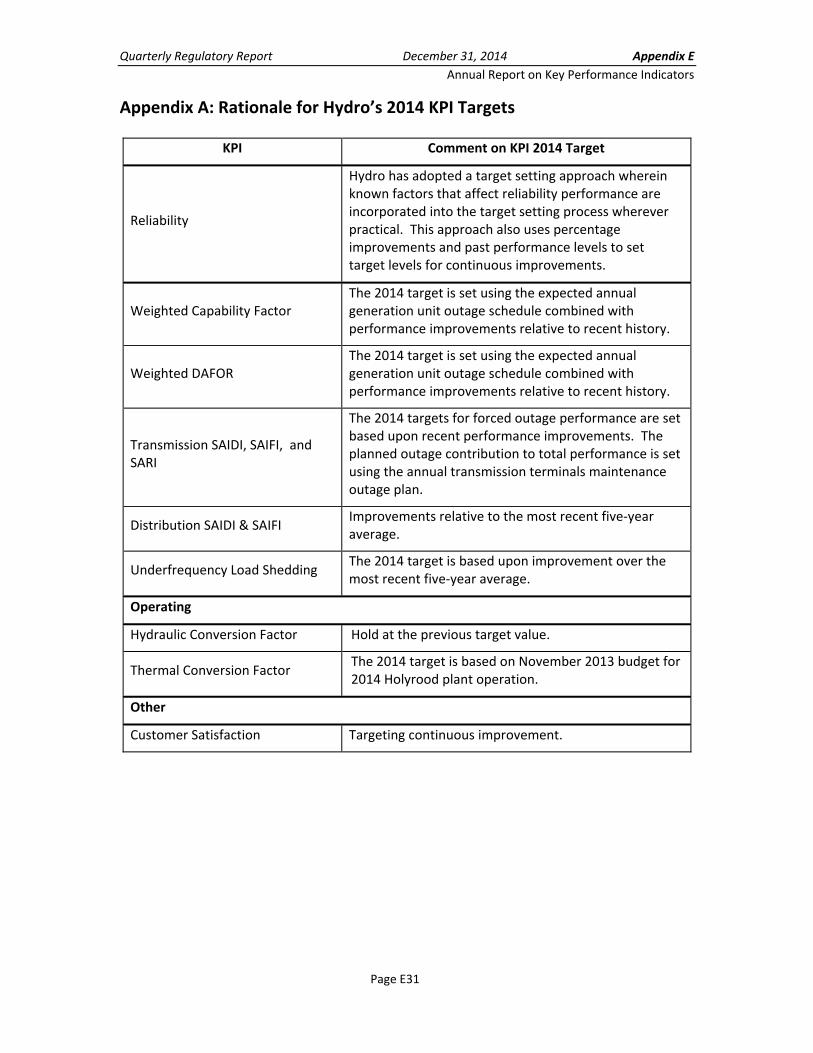
Appendix A: Rationale for Hydro’s 2014 KPI Targets
KPI Comment on KPI 2014 Target
Reliability
Hydro has adopted a target setting approach wherein known factors that affect reliability performance are incorporated into the target setting process wherever practical. This approach also uses percentage improvements and past performance levels to set target levels for continuous improvements.
Weighted Capability Factor The 2014 target is set using the expected annual generation unit outage schedule combined with performance improvements relative to recent history.
Weighted DAFOR The 2014 target is set using the expected annual generation unit outage schedule combined with performance improvements relative to recent history.
Transmission SAIDI, SAIFI, and SARI
The 2014 targets for forced outage performance are set based upon recent performance improvements. The planned outage contribution to total performance is set using the annual transmission terminals maintenance outage plan.
Distribution SAIDI & SAIFI Improvements relative to the most recent five‐year average.
Underfrequency Load Shedding The 2014 target is based upon improvement over the most recent five‐year average.
Operating
Hydraulic Conversion Factor Hold at the previous target value.
Thermal Conversion Factor The 2014 target is based on November 2013 budget for 2014 Holyrood plant operation.
Other
Customer Satisfaction Targeting continuous improvement.

Quarterly Regulatory Report December 31, 2014 Appendix E
Annual Report on Key Performance Indicators
Page E32
Appendix B: Computation of Weighted Capability Factor and Factors Impacting Performance
Weighted Capability Factor is calculated using the following formula:
unitsall
unitsall
MCRunit
hoursunit
MCRunittimeoutageequivalenttotalunit
1
Where,
MCR = Maximum Continuous Rating, the gross maximum electrical output, measured in megawatts, for which a generating unit has been designed and/or has been shown capable of producing continuously. MCR would only change if the generating capability of a unit is permanently altered by virtue of equipment age, regulation, or capital modifications. Such changes to MCR are infrequent and have not actually taken place within Hydro since the 1980’s when two units at Holyrood were uprated due to modifications made to these units.
Unit hours = the sum of hours that a unit is in commercial service. This measure includes time that a unit is operating, shut down, on maintenance, or operating under some form of derating. Unit hours will only be altered in the infrequent event that a unit is removed from commercial service for an extended period of time.
Unit total equivalent outage time = the period of time a unit is wholly or partially unavailable to generate at its MCR. For the purposes of calculating outage time, the degree to which a unit is derated is converted to an outage equivalency. Thus, a unit that is able to generate at 75% load for four days would have an equivalent outage time of one full day out of four. Factors that can affect unit total equivalent outage time are classified by CEA under nine categories, which are outlined in Appendix A to this Report. Hydro tracks the time that each unit spends in each of these nine states and calculates the weighted capability accordingly. Unit total equivalent outage time is the measure that is most likely to impact Weighted Capability Factor on a year‐to‐year basis, since MCR and unit hours are unlikely to change.

Quarterly Regulatory Report December 31, 2014 Appendix E
Annual Report on Key Performance Indicators
Page E33
Appendix B: Computation of Weighted Capability Factor and Factors Impacting Performance (Cont’d) Factors that Affect Unit Total Equivalent Outage Time
1. Sudden Forced Outage. An occurrence wherein a unit trips or becomes immediately unavailable.
2. Immediately Deferrable Forced Outage. An occurrence wherein a unit must be made unavailable within a very short time (10 minutes).
3. Deferrable Forced Outage. An occurrence or condition wherein a unit must be made unavailable within the next week.
4. Starting Failure. A condition wherein a unit is unable to start. 5. Planned Outage. A condition where a unit is unavailable because it is on its annual
inspection and maintenance. 6. Maintenance Outage. A condition where a unit is unavailable due to repair work.
Maintenance outage time covers outages that can be deferred longer than a week, but cannot wait until the next annual planned maintenance period.
7. Forced Derating. A condition that limits the usable capacity of a unit to something less than MCR. The derating is forced in nature, typically because of the breakdown of a subsystem on the unit.
8. Scheduled Derating. A condition that limits the usable capacity of a unit to something less than MCR, but is done by virtue of the decision of the unit operator. Scheduled deratings are less common than forced deratings, but can arise, for example, when a unit at Holyrood is derated to remove a pump from service.
9. Common Mode Outages. Common mode outages are rare, and arise when an event causes multiple units to become unavailable. An example might be the operation of multiple circuit breakers in a switchyard at Holyrood due to a lightning strike, rendering up to three units unavailable.
Note: There are hundreds of CEA equipment codes for generator subsystems that track the cause for the time spent in each of the above categories.

Quarterly Regulatory Report December 31, 2014 Appendix E
Annual Report on Key Performance Indicators
Page E34
Appendix C1: Significant Transmission Events – 2014
There were 12 significant events in 2014. The details follow:
Event 1
On January 4 at 0905 hours, transformer T1 at the Sunnyside Terminal Station faulted resulting in a fire. Circuit breaker B1L03 failed to isolate T1, and resulted in a trip of transmission lines TL203 and TL237, isolating the Avalon Peninsula from the remainder of the power system. This resulted in the interruption of the following generation: Holyrood Plant, Cat Arm Plant, Hinds Lake Plant, Granite Canal Plant, Upper Salmon Plant, Stephenville Gas Turbine, St. Anthony Diesel Plant, and Hawke’s Bay Diesel Plant. (Unsupplied Energy: 158,954 MW‐Mins)
The following table outlines the delivery point customer interruptions.
Events on January 4, 2014 (09:05 hrs)
Delivery Point Affected Start Time Finish Time
Duration of Interruptions
(mins) MW Load MW‐Mins
Hardwoods 1/4/2014 9:05 1/4/2014 9:52 47 268 12,596
Oxen Pond 1/4/2014 9:05 1/4/2014 10:43 98 286 28,067
Holyrood ‐ 39L 1/4/2014 9:05 1/4/2014 14:01 296 29 9,320
Holyrood ‐ 38L 1/4/2014 9:05 1/4/2014 14:07 302 46 13,771
Western Avalon ‐ 64L 1/4/2014 9:05 1/4/2014 14:44 339 94 27,735
Western Avalon ‐ Bus B2 1/4/2014 9:05 1/4/2014 14:01 296 46 16,780
Vale (Long Harbour) 1/4/2014 9:05 1/4/2014 12:22 197 6 1,143
Sunnyside ‐ rural (T5) 1/4/2014 9:05 1/4/2014 20:07 662 9 6,091
Sunnyside ‐ TL219 1/4/2014 9:05 1/4/2014 20:07 662 29 20,445
Linton Lake 1/4/2014 9:05 1/4/2014 20:07 662 17 11,985
Bay L'Argent 1/4/2014 9:05 1/4/2014 20:07 662 17 4,653
Monkstown 1/4/2014 9:05 1/4/2014 20:07 662 17 2,397
Duck Pond Mine 1/4/2014 9:05 1/4/2014 12:46 221 9 1,923
Wiltondale 1/4/2014 9:05 1/4/2014 9:33 28 0.1 4
Glenburine 1/4/2014 9:05 1/4/2014 9:33 28 3 78
Rocky Harbour 1/4/2014 9:05 1/4/2014 9:33 28 4 118
Grandy Brook 1/4/2014 9:05 1/4/2014 9:33 28 5 132
St Alban's 1/4/2014 9:05 1/4/2014 10:19 74 5 548
Conne River 1/4/2014 9:05 1/4/2014 10:37 92 2 187
English Harbour West 1/4/2014 9:05 1/4/2014 10:37 92 4 362
Barachoix 1/4/2014 9:05 1/4/2014 10:37 92 7 619
Come By Chance T2 1/4/2014 9:05 1/4/2014 13:18 N/A (BES: 253 mins) N/A N/A
Totals 158,954

Quarterly Regulatory Report December 31, 2014 Appendix E
Annual Report on Key Performance Indicators
Page E35
Appendix C1: Significant Transmission Events – 2014 (Cont’d)
Event 2
On January 4 at 1533 hours, personnel were in the process of re‐energizing SSD T4. The transformer had tripped after transformer T1 locked out earlier in the day. During the re‐energization there was a breaker failure protection operation associated with the transformer breaker B3T4. Circuit breaker B1L02 at the Sunnyside Terminal Station failed to open due to the breaker failure protection configuration, and resulted in the trip of transmission line TL206 at the Bay d’Espoir Generating Plant. The distance protection was activated on transmission line TL202 but failed to trip this line at the Bay d’Espoir Generating Plant, resulting in a bus lockout on BDE Bus B3 and the loss of the Bay d’Espoir Units 5 and 6. Circuit breaker B5B6 falsely tripped at Bay d’Espoir resulting in the loss of transmission line TL204. Transmission lines TL202, TL203, TL206 and TL207 tripped at the Sunnyside Terminal Station, resulting in the isolation of the Avalon Peninsula from the remainder of the power system. The Come by Chance Oil Refinery was also interrupted. This disturbance resulted in the interruption of the following generation: Cat Arm Plant, Granite Canal Plant, Stephenville Gas Turbine, and Hawke’s Bay Diesel Plant. The Holyrood units had not been restored following the events earlier in the morning. (Unsupplied Energy: 13,836 MW‐Mins) The following table outlines the delivery point customer interruptions.
Events on January 4, 2014 (15:33 hrs)
Delivery Point Affected Start Time Finish Time
Duration of Interruptions
(mins) MW Load MW‐Mins
Hardwoods 1/4/2014 15:33 1/4/2014 15:55 22 164 3,608
Oxen Pond 1/4/2014 15:33 1/4/2014 16:06 33 166 5,478
Holyrood ‐ 38L 1/4/2014 15:33 1/4/2014 16:10 37 24 870
Western Avalon ‐ 64L 1/4/2014 15:33 1/4/2014 16:18 45 61 2,750
Come By Chance T1 1/4/2014 15:33 1/4/2014 15:39 6 15 91
Duck Pond Mine 1/4/2014 15:33 1/4/2014 17:47 134 5 724
Wiltondale 1/4/2014 15:33 1/4/2014 15:43 10 0.1 1
Glenburine 1/4/2014 15:33 1/4/2014 15:43 10 3 29
Rocky Harbour 1/4/2014 15:33 1/4/2014 15:43 10 4 43
Grandy Brook 1/4/2014 15:33 1/4/2014 15:39 6 5 28
St Alban's (1) 1/4/2014 15:33 1/4/2014 15:43 10 8 75
Conne River 1/4/2014 15:33 1/4/2014 15:43 10 2 22
English Harbour West 1/4/2014 15:33 1/4/2014 15:43 10 4 43
Barachoix 1/4/2014 15:33 1/4/2014 15:43 10 7 74
Come By Chance T2 1/4/2014 15:33 1/4/2014 15:39 N/A (BES: 6 mins) N/A N/A
Holyrood ‐ 39L 1/4/2014 15:33 1/4/2014 16:39 N/A (BES: 66 mins) N/A N/A
Totals 13,836

Quarterly Regulatory Report December 31, 2014 Appendix E
Annual Report on Key Performance Indicators
Page E36
Appendix C1: Significant Transmission Events – 2014 (Cont’d)
Event 3
On January 5 at 2127 hours, the Holyrood generating Unit 1 was being prepared to be placed on line. The unit disconnect switch was closed as the first step in this procedure. After this switch was closed the unit connected to the grid, out of synch, single phase through a closed breaker contact. This resulted in a 230 KV disturbance and the tripping of Holyrood units 2 and 3, the Stephenville Gas Turbine, and the Hawke’s Bay Diesel Plant. (Unsupplied Energy: 34,030 MW‐Mins)
The following table outlines the delivery point customer interruptions.
Event 4
On January 26, customers supplied by the Grandy Brook Terminal Station experienced an unplanned power outage of eight hours and 46 minutes. The outage occurred after a crossarm failed at a structure in transmission line TL250 during an extreme wind storm. There were wind gusts of over 130 km/h recorded on this day. (Unsupplied Energy: 1,999 MW‐Mins)
Event 5
On January 28, customers supplied by the Monkstown and Bay L’Argent Terminal Stations experienced an unplanned power outage of three hours and 10 minutes. The outage occurred after a crossarm failed at a structure in transmission line TL212 during an extreme wind storm. There were wind gusts of over 120 km/h recorded on this day. (Unsupplied Energy: 1,121 MW‐Mins)
Events on January 5, 2014 (21:27 hrs)
Delivery Point Affected Start Time Finish Time
Duration of Interruptions
(mins) MW Load MW‐Mins
Holyrood ‐ 38L 1/5/2014 21:27 1/5/2014 21:31 4 37 146
Holyrood ‐ 39L 1/5/2014 21:27 1/6/2014 8:42 675 17 11,610
Western Avalon ‐ 64L 1/5/2014 21:27 1/6/2014 0:22 175 83 14,525
Western Avalon ‐ Bus B2 1/5/2014 21:27 1/6/2014 0:36 189 41 7,749
Totals 34,030

Quarterly Regulatory Report December 31, 2014 Appendix E
Annual Report on Key Performance Indicators
Page E37
Appendix C1: Significant Transmission Events – 2014 (Cont’d)
Event 6
On February 19, Vale at Long Harbour experienced an unplanned power outage of two hours and 52 minutes. The outage was caused by transformer T1 tripping due a protection coordination issue with Vale’s protection. These protection issues have since been resolved. (Unsupplied Energy: 1,032 MW‐Mins)
Event 7/Event 8/Event 9
On February 23, customers supplied by the Bottom Waters Terminal Station experienced three unplanned power outages of 11 hours and 30 minutes in total. The first outage was caused by a bus lockout operation for a trip of transformer T1. The other two outages occurred during the restoration of T1. The transformer trip was caused by a faulty pressure/vacuum switch. The switch required isolation before T1 could be re‐energized. Event 7: (Unsupplied Energy: 1,230 MW‐Mins) Event 8: (Unsupplied Energy: 2,700 MW‐Mins) Event 9: (Unsupplied Energy: 1,238 MW‐Mins)
Event 10
On April 14, customers supplied by the Bottom Waters Terminal Station experienced an unplanned power outage of 2 hours and 32 minutes. The outage was caused by a squirrel that came into contact with a lightning arrestor on the low voltage side (25 kV) of transformer T1 resulting in the operation of the bus lockout. This, in turn, tripped circuit switcher L60T1 on the high side of T1 (138 kV). (Unsupplied Energy: 1,170 MW‐Mins)
Event 11
On August 5, 7,345 customers on the Great North Peninsula experienced an unplanned power outage. The outage occurred due to a failure of an SF6 Breaker, B1L41 at the Peter’s Barren Terminal Station, tripping transmission line TL241 and causing a bus lockout at the terminal station. (Unsupplied Energy: 2,530 MW‐Mins) The following table outlines the delivery point customer interruptions.

Quarterly Regulatory Report December 31, 2014 Appendix E
Annual Report on Key Performance Indicators
Page E38
Appendix C1: Significant Transmission Events – 2014 (Cont’d)
Event 12
On August 10, customers supplied by the Happy Valley and Muskrat Falls Construction Power Terminal Stations experienced an unplanned power outage of two hours and 40 minutes. The outage occurred when a tertiary lead on the 230/138 kV transformer T71 failed at the Churchill Falls Switchyard, resulting in a fault and a trip of the 138 kV transmission line (L1301/L1302) at the Churchill Falls switchyard. (Unsupplied Energy: 2,512 MW‐Mins)
Event ‐TL241 Trip/PBN B1 Lockout
Parson's Pond 15:16 15:28 12 0.31 3.72
Daniel's Harbour 15:16 15:28 12 0.37 4.44
Hawkes's Bay 15:16 15:28 12 3.75 45
Plum Point 15:16 23:26 490 2.1 1029
Bear Cove 15:16 23:26 490 2.54 1244.6
Main Brook 15:16 15:43 27 1.7 45.9
Roddickton 15:16 15:49 33 1.4 46.2
St Anthony 15:16 15:49 33 5.3 111.3
MW‐MinsDelivery Point Affected Start Time Time of
Restoration
Outage
Duration
(mins)
Load Loss
(MW)

Quarterly Regulatory Report December 31, 2014 Appendix E
Annual Report on Key Performance Indicators
Page E39
Appendix C2: Significant Distribution Events – 2014 (Excluding Fourth Quarter)
On January 1, customers in Happy Valley ‐ Goose Bay, Labrador serviced by feeder L16 experienced two unplanned and one emergency planned power outage. The outages occurred due to unbalanced loading on the feeder. See the following for outages details:
Outage 1: 1745‐1817 hours (32 minutes) 3,984 customers Outage 2: 1757 – 1811 hours (14 minutes) 1,019 customers (Emergency planned outage for switching operations) Outage 3: 1815 – 2344 hours (five hours 29 minutes) 1,019 customers
On January 22, at 2000 hours (Labrador time), 391 customers in Labrador City, Labrador supplied by Line 13 experienced an unplanned power outage. The outage occurred when a piece of jumper conductor burned off a pole. All customers were restored at 2200 hours.
On January 26, at 0955 hours, all customers (1369) serviced by the Barachoix Terminal Station, including the communities of Gaultois, Harbour Breton, Hermitage, and Seal Cove experienced an unplanned power outage. The outage occurred due to line damage caused by extreme weather and high winds. Hydro crews safely made the necessary repairs and all customers were restored by 1855 hours. Delays in restoration were due to distance and travel time in extreme weather, the investigation into the cause of the outage, and the repair time.
On January 26, at 0848 hours, all customers (921) serviced by the Grandy Brook Terminal Station, including the communities of Burgeo, Grand Bruit, and La Poile, experienced an unplanned power outage. The outage occurred when the 138 kV Transmission Line TL250 tripped out of service due to a failed cross arm. There were extreme high winds at the time. Hydro crews safely made the necessary repairs and all customers were restored by 1735 hours. Delays in restoration were due to distance and travel time in extreme weather, the investigation into the cause of the outage, and the repair time.
On January 26, at 0933 hours, all customers (813) serviced by the English Harbour West Terminal Station, including the communities of Boxey, Belleoram, Coombs Cove, English Harbour West, Mose Ambrose, Pools Cove, Rencontre East, St. Jacques, and Wreck Cove experienced an unplanned power outage. The exact cause of the outage is unknown, however it was most likely due to the extreme weather and high winds experienced at the time. All customers were restored by 1323 hours.
On April 10, at 1400 hours (Labrador time), 330 customers in Happy Valley ‐ Goose Bay, Labrador serviced by Line 7 experienced a planned power outage. The outage was required to safely replace a utility pole. All customers were restored at 1650 hours.
On April 14, at 0825 hours, 1774 customers serviced by the Bottom Waters Terminal Station experienced an unplanned power outage. The outage occurred when the 138 kV circuit breaker L60T1 tripped open. This circuit breaker is located on the high voltage side (138 kV) of the transformer ‐ T1. Hydro investigated and discovered that a squirrel had come in contact with a lightning arrestor on the low voltage side (25 kV) of the transformer and the

Quarterly Regulatory Report December 31, 2014 Appendix E
Annual Report on Key Performance Indicators
Page E40
protection systems for transformer T1 commanded circuit breaker L60T1 to trip. All customers were restored by 1057 hours.
On April 16, at 1906 hours, all customers (990) serviced by the L’Anse au Loup Substation experienced an unplanned power outage. The outage occurred due to a loss of supply from Hydro Québec. Communities affected include L’Anse Amour, English Point, Buckle’s Point, Forteau, L’Anse au Clair, L’Anse au Loup, West St. Modeste, Capstan Island, L’Anse au Diable, Pinware, Red Bay, and Organ’s Island.
The L’Anse au Loup Diesel Plant was used to restore customers.
Customer Outage details are as follows: Outage 1: 1906 – 1927 hours (21 minutes), 467 customers between L’Anse au Loup to Pinware Outage 2: 1906 – 1935 hours (29 minutes), 262 customers in L’Anse Amour and Forteau Outage 3: 1906 – 1942 hours (36 minutes), 124 customers in L’Anse au Clair Outage 4: 1906 – 1950 hours (44 minutes), 137 customers in Red Bay
Supply was restored from Hydro Québec at 2330 hours, April 17.
On May 07, at 0130 hours (Labrador time), 140 customers in Cartwright, Labrador experienced an unplanned power outage. The outage occurred when one phase in a distribution line faulted. Hydro investigated and made the necessary repairs to the line. All customers were restored at 0400 hours.
On May 22, at 1225 hours, all customers (990) serviced by the L’Anse au Loup Substation experienced an unplanned power outage. The outage occurred due to a loss of supply from Hydro Québec. Hydro Québec reported a pole down. Communities affected include L’Anse Amour, English Point, Buckle’s Point, Forteau, L’Anse au Clair, L’Anse au Loup, West St. Modeste, Capstan Island, L’Anse au Diable, Pinware, Red Bay, and Organ’s Island.
The L’Anse au Loup Diesel Plant was used to restore customers.
Customer Outage details are as follows:
Outage 1: 1225 – 1236 hours (11 minutes), 467 customers between L’Anse au Loup to Pinware Outage 2: 1225 – 1241 hours (16 minutes), 262 customers in L’Anse Amour and Forteau Outage 3: 1225 – 1245 hours (20 minutes), 124 customers in L’Anse au Clair Outage 4: 1225 – 1251 hours (26 minutes), 137 customers in Red Bay
Supply from Hydro Québec was restored at 1312 hours.
On May 23, at 2344 hours, all customers (990) serviced by the L’Anse au Loup Substation experienced an unplanned power outage. The outage occurred due to a loss of supply from Hydro Québec. Hydro Québec reported a problem at their Blanc‐Sablon Station. Communities affected include L’Anse Amour, English Point, Buckle’s Point, Forteau, L’Anse

Quarterly Regulatory Report December 31, 2014 Appendix E
Annual Report on Key Performance Indicators
Page E41
au Clair, L’Anse au Loup, West St. Modeste, Capstan Island, L’Anse au Diable, Pinware, Red Bay, and Organ’s Island. The L’Anse au Loup Diesel Plant was used to restore customers. All customers were restored by 0034 hours May 24. Supply from Hydro Québec was restored at 1038 hours May 24.
On June 08, at 0600 hours (Labrador time), all customers (5813), including Industrial Customers IOCC and Wabush Mines, in Labrador City and Wabush experienced a planned power outage. The outage was required so that CF(L)Co could safely perform maintenance on the Wabush Terminal Station.
See the following for the number of affected customers and restoration times:
Wabush: 2006 hours (1466 customers – 14 hours six minutes) Labrador City: 2020 hours (4347 customers – 14 hour 20 minutes)
On June 25, at 1025 hours (Labrador time), all customers (226) in Port Hope Simpson, Labrador experienced a planned power outage. The outage was required to safely disconnect Mobile Unit 2044. All customers were restored at 1150 hours.
On July 01, 175 customers in Labrador City, Labrador serviced by Lines 18 and 21 experienced a planned power outage. The outage was required to perform voltage conversion upgrades to the distribution system. Outage duration was four hours.
On July 02, at 0645 hours (Labrador time), 5677 customers in Labrador City and Wabush, Labrador experienced an unplanned power outage. The outage occurred when a fault at the IOCC mine site activated relay protection at the Wabush Terminal Station, tripping breakers 46‐32 (Labrador City) and 46‐36 (Wabush). See the following for customer restoration details:
Outage 1: 1467 Wabush customers, 35 minutes Outage 2: 4210 Labrador City customers, one hour
On July 05, 400 customers in Sheshatshui, Labrador serviced by Happy Valley Terminal Station Line 7, experienced a planned power outage. The outage was required to install new equipment on the distribution system. Outage duration was three hours and 40 minutes.
On July 12, 350 customers in Labrador City, Labrador serviced by Lines 6 and 15 experienced a planned power outage. The outage was required to perform voltage conversion upgrades to the distribution system. Outage duration was five hours.
On July 13, 350 customers in Labrador City, Labrador serviced by Lines 6 and 15 experienced a planned power outage. The outage was required to perform voltage conversion upgrades to the distribution system. Outage duration was five hours.

Quarterly Regulatory Report December 31, 2014 Appendix E
Annual Report on Key Performance Indicators
Page E42
On July 16, all customers (170) on Long Island including the communities of Beaumont and Lushes Bight experienced an unplanned power outage of seven hours and 30 minutes. Hydro’s preliminary investigation indicated a subsea cable failure was the cause of the outage. Hydro attempted to energize the primary and all backup cables without success. Hydro involved additional technical and support staff to assist with the restoration efforts. Hydro had also begun to mobilizing a portable diesel generator to site. Power was restored to Long Island via one of the submarine cables. Preliminary investigation indicates three of the four cables have been damaged and remain out of service. Hydro is arranging for inspection of the cables to determine the cause of the outage and why the other cables could not be energized. Preparations are being made to execute repairs, pending the findings from the inspection. In the interim, standby backup generation has been installed on Long Island should the existing energized cable fail.
On August 21, all customers (1,466) in Wabush, Labrador experienced a planned power outage of nearly two and a half hours in duration. The outage was required to tie in transformers T3 and T5 at the Wabush Substation. This work was required to energize T5 for condition assessment and monitoring.
On August 26, 451 customers serviced by Bottom Waters Terminal Station Line 4 are experienced an unplanned power outage of approximately 19 hours in duration. The communities affected included Burlington, Smith's Harbour, and Middle Arm. The outage was caused by a failure of a step‐down transformer located in the Burlington Substation. Hydro expedited a replacement transformer from the Bishop’s Falls warehouse. Hydro crews worked late into the evening of August 26 and resumed work during the morning of August 27, during which time the replacement of the transformer was completed and all customers were restored.
On September 07, 723 customers in Labrador City, Labrador, serviced by Line 8, experienced a planned power outage. The outage was required to connect new feeders into the Quartzite Substation. Outage duration was three hours.
On September 11, all customers (874) in Little Bay and King’s Point, serviced by the Springdale Terminal Station, experienced an unplanned power outage. The outage occurred when Newfoundland Power’s mobile substation, located in the Springdale Terminal Station, failed causing Hydro’s breakers to trip. Newfoundland Power made the necessary repairs to mobile substation, Hydro then proceeded to restore supply to customers. Outage duration was seven hours and 43 minutes.
On September 14, all customers (1466) in Wabush, Labrador experienced a planned power outage. The outage was required to make modifications to the steel structure within the Wabush Substation yard in preparation for the connection of an additional power transformer. Outage duration was five hours and 45 minutes.
On September 21, all customers (1459) in Wabush, Labrador experienced an extended planned power outage. The outage was required for the installation of a new power transformer (T6) at the Wabush Substation. All customers were planned to be restored by 1000 hours, however due to an issue with breaker WA36‐CB1 at the Wabush Substation, the outage was extended beyond this time. Hydro crews resolved the issue with the breaker. Outage duration was eight hours and 15 minutes.

Quarterly Regulatory Report December 31, 2014 Appendix E
Annual Report on Key Performance Indicators
Page E43
On September 22, 1765 customers serviced by the Bottom Waters Terminal Station Lines 1 and 3 experienced an unplanned power outage. The communities affected include Brent’s Cove, Burlington, Harbour Round, La Scie, Middle Arm, Ming’s Bight, Nipper’s Harbour, Pacquet, Round Harbour, Snook’s Arm, Shoe Cove, Smith’s Harbour, Tilt Cove and Woodstock. This outage also affected Rambler Mines. The outage was caused by rain and high winds in the area blowing trees into the distribution lines. Hydro crews responded, patrolled the lines, and safely removed any trees prior to restoring customers. Outage duration was five hours and 10 minutes.
On September 26, 446 customers in Labrador City, Labrador serviced by Quartzite Substation Line 13 and Bartlett Substation Line 4 experienced a planned power outage. The outage was required to perform voltage conversion upgrades to the distribution system. Outage duration was three hours.
On September 27, 311 customers in Labrador City, Labrador serviced by Quartzite Substation Line 13 and Bartlett Substation Line 4 experienced a planned power outage. The outage was required to perform voltage conversion upgrades to the distribution system. Outage duration was two hours and 30 minutes.

Quarterly Regulatory Report December 31, 2014 Appendix E
Annual Report on Key Performance Indicators
Page E44
Appendix C3: Underfrequency Load Shedding Events (Excluding Fourth Quarter)
On January 10, Holyrood Generating Unit No. 2 tripped. The trip of Unit 2 occurred when a compressor failure resulted in an outage to a 600V power center. This power center supplies auxiliary equipment associated with Unit 2 turbine/boiler. Unit 2 was restored to service at 0123 hours January 11. With the removal of generation (approximately 155 MW) the system frequency dropped to 58.25 Hz resulting in the activation of the under frequency protection at Hydro and Newfoundland Power. Total system load at the time of the incident was 1,306 MW. Hydro customers (2,210) were restored within three minutes. Newfoundland Power customers (21,067) were restored in twenty‐two load blocks. The first customers were restored in seven minutes and all customers were reported to be restored within 28 minutes after the event occurred. (Unsupplied Energy: 1,568 MW‐Mins)
On January 12, Holyrood Generating Unit No. 3 tripped. The under frequency trip occurred when a main feed water isolator did not electrically open. As a result Unit 3 tripped on low drum level. Hydro determined that the problem was with a control power signal from the local control system. Repairs were made and the Unit was restored to service at 1830 hours, January 12. With the removal of generation (approximately 66 MW) the system frequency dropped to 58.78 Hz resulting in the activation of the under frequency protection at Newfoundland Power. Total system load at the time of the incident was 1,030 MW. All Newfoundland Power customers (5,750) were restored within 10 minutes after the event occurred. (Unsupplied Energy: 220 MW‐Mins)
On January 15, transmission line TL‐201 (from the Western Avalon to Hardwoods terminal
stations) tripped and remained open. The fault created a system disturbance which activated the rate of change (df/dt) underfrequency load shedding protection at Newfoundland Power. The decline in system frequency achieved a maximum value of 0.56 Hz/Sec. All Newfoundland Power customers (3,307) were restored within 1 minute after the event occurred. Total NLH system load at the time of the incident was 998 MW. Upon investigation through line patrol, it was determined that two phases on structure 157 had fallen to the ground after the insulators had separated. The immediate cause is suspected to be a mechanical insulator failure due to high winds and adverse weather. The insulators were replaced and the line was restored to service at 2229 hours on January 15. (Unsupplied Energy: 15 MW‐Mins)
On January 27, at 1650 hours, Holyrood Generating Unit No. 1 tripped. Hydro’s investigation into the cause of the trip on Unit 1 determined that a circuit breaker supplying the burner management system was inadvertently tripped as corrective maintenance was carried out on another piece of equipment located in the same electrical cabinet. With the removal of generation (approximately 120 MW) the system frequency dropped to 58.56 Hz resulting in the activation of the under frequency protection at Newfoundland Power. Total system load at the time of the incident was 1,248 MW. All Newfoundland Power customers (11,061) were reported to be restored within 18 minutes after the event occurred. (Unsupplied Energy: 904 MW‐Mins)
Quarterly Regulatory Report December 31, 2014 Appendix E
Annual Report on Key Performance Indicators
Page E45
Appendix C3: Underfrequency Load Shedding Events (Excluding Fourth Quarter) (cont’d)
On January 30, at 0509 hours, Bay d’Espoir Generating Unit No. 6 tripped. The unit trip was caused by the failure of the rectifying transformer associated with the unit excitation system. The spare transformer was installed. With the removal of generation (approximately 64 MW) the system frequency dropped to 58.71 Hz resulting in the activation of the under frequency protection at Newfoundland Power and Corner Brook Pulp and Paper. Total system load at the time of the incident was 1,060 MW. All Newfoundland Power customers (6,087) were reported to be restored within four minutes after the event occurred. (Unsupplied Energy: 107 MW‐Mins)
On February 17, at 0422 hours, Bay d’Espoir Generating Unit No. 6 tripped. The unit trip was caused by the failure of the rectifying transformer (this time the spare unit which was installed following the failure on January 30). With the removal of generation (approximately 67 MW) the system frequency dropped to 58.58 Hz resulting in the activation of the under frequency protection at Newfoundland Power. Total system load at the time of the incident was 1,053 MW. 15,108 Newfoundland Power customers were reported to be restored within five minutes after the event occurred. Unit No. 6 remains out of service. (Unsupplied Energy: 240 MW‐Mins)
On March 18, at 2203 hours, while taking Bay d'Espoir Unit 4 offline, the unit breaker mis‐operated, causing a bus lockout of Bus 2 at Bay d'Espoir, and tripping Unit 3 offline. With the removal of generation (approximately 59 MW) the system frequency dropped to 58.72 Hz resulting in the activation of the under frequency protection at Newfoundland Power and Corner Brook Pulp and Paper. Total system load at the time of the incident was 1,184 MW. There were 7,225 Newfoundland Power customers reported to be restored within five minutes after the event occurred. (Unsupplied Energy: 190 MW‐Mins)
On July 14, at 1414 hours, while Holyrood Unit 3 was undergoing a load test, a problem with the forced draft fans caused the unit to trip offline. With the removal of generation (approximately 113 MW) the system frequency dropped to 58.79 Hz resulting in the activation of the under frequency protection at Newfoundland Power. Total system load at the time of the incident was 598 MW. All Newfoundland Power customers were reported to be restored within 16 minutes after the event occurred. Load Shed: Newfoundland Power: 13 MW (Unsupplied Energy: 208 MW‐Mins)
Quarterly Regulatory Report December 31, 2014 Appendix E
Annual Report on Key Performance Indicators
Page E46
Appendix C3: Underfrequency Load Shedding Events (Excluding Fourth Quarter) (cont’d)
On July 28, at 0728 hours, Holyrood Unit 3 tripped offline. Hydro’s investigation into this incident indicated that the root cause stemmed from an issue that occurred during switching, related to an abnormal configuration of the plant’s electrical distribution system which was required for planned maintenance at the Holyrood Thermal Generating Station (HTGS). With the removal of generation (approximately 71 MW) the system frequency dropped to 58.41 Hz resulting in the activation of the under frequency protection at Newfoundland Power. Total system load at the time of the incident was 491 MW. All Newfoundland Power customers were reported to be restored within 18 minutes after the event occurred. Load Shed: Newfoundland Power: 19.5 MW (Unsupplied Energy: 351 MW‐Mins)
On July 29, at 0943 hours, Holyrood Unit 3 tripped offline. Analysis concluded the root cause of the incident was a lack of clear communication during switching for a planned equipment maintenance outage in the Holyrood Terminal Station (HRD TS). The investigation also found that this specific outage type had not been executed by all control room operators in the past, highlighting the need for a better understanding of this outage type. Hydro has and continues to communicate this incident internally via lessons learned and training programs. With the removal of generation (approximately 70 MW) the system frequency dropped to 58.50 Hz resulting in the activation of the under frequency protection at Newfoundland Power. Total system load at the time of the incident was 588 MW. All Newfoundland Power customers were reported to be restored within 11 minutes after the event occurred. Load Shed: Newfoundland Power: 40 MW (Unsupplied Energy: 440 MW‐Mins)

Quarterly Regulatory Report December 31, 2014 Appendix E
Annual Report on Key Performance Indicators
Page E47
Appendix D: List of U.S.‐Based Peers for Financial KPI Benchmarking
Generation and Corporate Peer Group: Transmission Peer Group:
Alcoa Power Generating Inc. AEP Texas North Company Allete, Inc. Allete, Inc. Aquila, Inc. Aquila, Inc. Avista Corporation Avista Corporation Buckeye Power, Inc. Central Illinois Public Service Company Cleco Power LLC Delmarva Power & Light Company Electric Energy, Inc. Entergy Mississippi, Inc. Entergy Mississippi, Inc. Kentucky Utilities Company Hawaiian Electric Company, Inc. MDU Resources Group, Inc. Indiana‐Kentucky Electric Corporation Mississippi Power Company Kentucky Power Company New York State Electric & Gas Corporation Ohio Valley Electric Corporation Northern Indiana Public Service Company Portland General Electric Company Northern States Power Company (Wisconsin) Public Service Company of New Hampshire Oklahoma Gas and Electric Company Puget Sound Energy, Inc. Public Service Company of Colorado Savannah Electric and Power Company Public Service Company of Oklahoma Sierra Pacific Power Company Sierra Pacific Power Company Southern Electric Generating Company Southwestern Electric Power Company Southern Indiana Gas and Electric Company Tucson Electric Power Company The Empire District Electric Company Westar Energy, Inc.