2014 annual chapter report - slowfood usa annual chapter report submitted by brittani le, ... slow...
TRANSCRIPT

1
2014 ANNUAL CHAPTER REPORT
Submitted by Brittani Le, Network Coordinator Jessica Tomaz, Network Engagement Intern
Last Updated April 29, 2015

2
Background Slow Food USA is comprised of 144 active local chapters.1 The Chapter Report offers a general sense of who Slow Food USA local chapters are and what they did in 2014. In December 2014, the Slow Food USA national office sent an email to all Official Chapter Email Accounts and requested leaders to complete and submit the chapter survey. These surveys help the national office tell the story of Slow Food across the country by highlighting what chapters are doing on the ground. By March 2015, there were 96 chapters or 67% active local chapters that had completed the survey. Out of 144 active local chapters, 48 chapters did not complete the survey and were not included in this report. Readers should note that there are inconsistent, incongruous, or inexistent tracking mechanisms for the data aggregated in this report. The role of metrics in capturing Slow Food work varies from chapter to chapter, and the national office has not yet been able to develop and implement a stable lexicon of terminology (e.g. what does “support” or “engage” mean?) or a standardized process for measuring and evaluating chapter performance. What this means in practice is that not all chapters answered every question and some of the responses were not very thorough. Given all this, readers should not take these numbers as indisputable facts and figures. Rather, it might be more helpful for readers to keep in mind that much of the analysis and insights offered in this summary is rooted in and supported by responses to the open-ended questions in the chapter reports – and remain helpful in telling the story of Slow Food across the county. In the future, we will continue to work on developing better reporting and evaluation tools and procedures.
1 The Slow Food USA national office defines an “active” chapter as being up to date on tax filings and compliant with chapter guidelines as outlined in the Chapter Handbook. An “inactive” chapter is one that notifies the national office that they are inactive, but whose EIN is still valid. A “high risk” chapter is one that is delinquent in their filing of taxes and submission of an annual chapter survey OR is unresponsive. In 2014, there were 144 active chapters, of which 96 are in good standing. Completing a yearly chapter report is a requirement of being in good standing as a Slow Food USA local chapter. Another 27 chapters were inactive and 18 chapters were high risk.

3
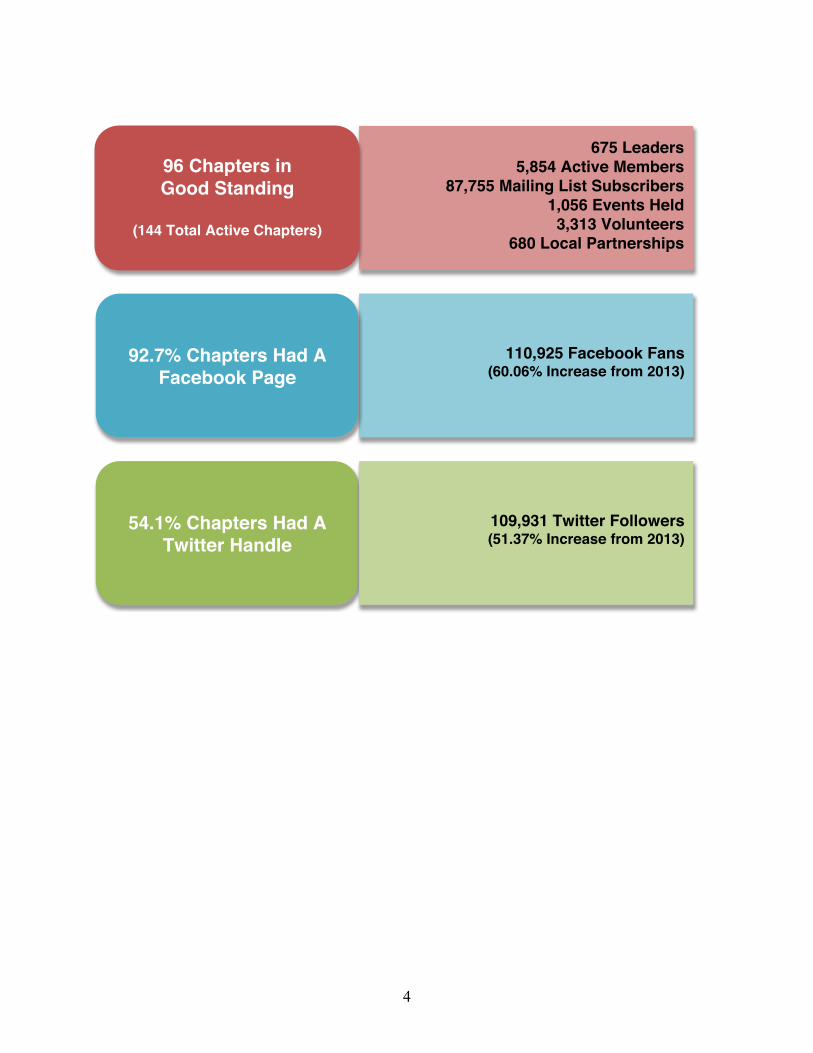
Profile Slow Food USA local chapters are part of a grassroots food movement. Given this and the probability that many more people are untouched by the idea and philosophy of Slow Food than they are by the organization, it is difficult to pinpoint the exact size and reach of a local chapter. For example, unlike tallying the hard numbers that are available for mailing list subscribers, Facebook fans, Twitter followers, websites, Twitter handles, and Facebook pages, counting the number of supporters, participants or audience is an evolving art and science. The numbers reported for leaders and “active” members are also estimates, based on individual chapters’ definition of “active” and “leader.” Lastly, because there are more active chapters than completed chapter reports, the reported numbers may paint a more conservative picture than exists in reality. However limited or approximate, the available numbers do speak to the possible size and reach (online and on-the-ground) of Slow Food USA local chapters – which are a key component of Slow Food USA’s organizational structure. It is important to note that these numbers are higher than in previous years, signifying an increase in Slow Food USA’s reach, especially through social media. (See graphic on the following page for exact numbers.)
4
675 Leaders 5,854 Active Members
87,755 Mailing List Subscribers 1,056 Events Held
3,313 Volunteers 680 Local Partnerships
54.1% Chapters Had A Twitter Handle
110,925 Facebook Fans (60.06% Increase from 2013)
92.7% Chapters Had A Facebook Page
96 Chapters in Good Standing
(144 Total Active Chapters)
109,931 Twitter Followers (51.37% Increase from 2013)

5
Demographics Slow Food USA asked our leaders to determine what percentage of their leadership identified with categories in respect to age, gender, income, race & ethnicity, and residence.2 To provide some context to the percentages calculated, we have provided the numbers from the 2013 annual chapter survey in the graphs below. It is important to note that the 2014 annual chapter survey is the first time that we included the ‘transgender’ category and although the percentage is too small to show on the graph, 2 individuals self-identified as transgender. Also, it might not have been clear to some leaders that the question pertained specifically to their leadership, not their entire chapter, which may slightly skew the data. (All data is shown in percentages.) AGE:
GENDER:
2 The percentages may not add up to 100% because some of the categories are not mutually exclusive and some numbers were rounded.
4
24
29
33
10
6
22
28
30
14
0 20 40 60 80 100
18-25
26-35
36-50
51-65
65+
In 2014
In 2013
29
71
30
70
0
0 20 40 60 80 100
Female
Male
Transgender
In 2014
In 2013
6
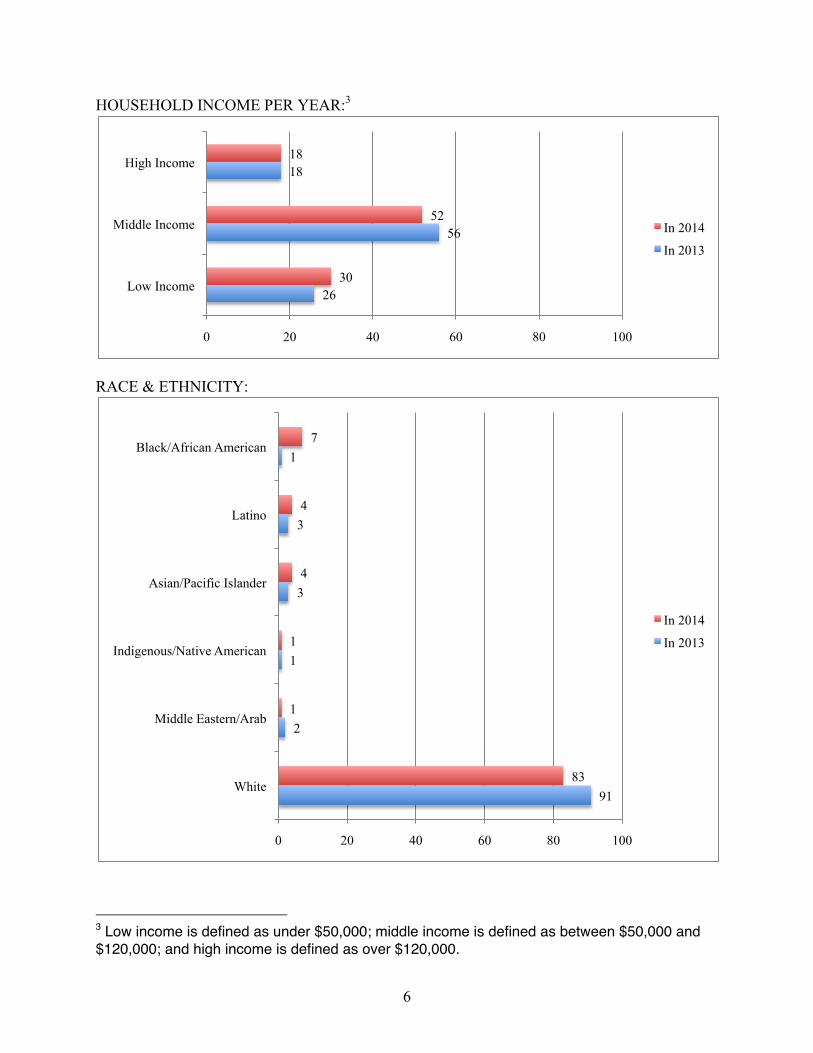
HOUSEHOLD INCOME PER YEAR:3
RACE & ETHNICITY:
3 Low income is defined as under $50,000; middle income is defined as between $50,000 and $120,000; and high income is defined as over $120,000.
26
56
18
30
52
18
0 20 40 60 80 100
Low Income
Middle Income
High Income
In 2014
In 2013
91
2
1
3
3
1
83
1
1
4
4
7
0 20 40 60 80 100
White
Middle Eastern/Arab
Indigenous/Native American
Asian/Pacific Islander
Latino
Black/African American
In 2014
In 2013

7
RESIDENCE:4
For the most part, the numbers stayed more or less the same from 2013 to 2014. The two main notable differences were the increase in the number of Black/African American leaders and the increase in the number of leaders from low-income households. We believe that this is due to the decrease in perception that Slow Food USA is bourgeois and is actually a useful tool in underserved communities. It is important to mention that the percentages between 2012 and 2013 were consistent as well.
4 There was no set definition for urban, suburban, or rural, so the data may be skewed due to the potential subjectivity of the categories.
39
27
35
38
32
30
0 20 40 60 80 100
Urban
Suburban
Rural
In 2014
In 2013

8
Top Priorities in 2014 Local chapters determined their own top priorities for the year. Below are the top five responses with related quotes from individual surveys. • Education/Increase Awareness:
“Educational Outreach via Dinner and a Book” “Promoting Slow Food Concepts – Annual Movie Night” “Partner with more local chefs to increase awareness of local food”
• Board/Leader/Chapter Development: “Building a sustainable board/leadership team” “Hire PT staff to do admin and communications” “Board development and better definition of roles and responsibilities”
• School Gardens: “Raise money for our school and community garden program” “Slow Food in Schools – garden project” “Initiate an edible school gardens support group”
• Membership: “Encourage renewals and new members” “Create more opportunities for members to participate…member-hosted potlucks” “…Taking care of our members (surveys & engagement strategies)”
• Farmers/Local Artisans: “Master Farmer Program” “Access - Cooper Young Farmers Market, Memphis Mobile Market…” “Promoting young farmers”
9
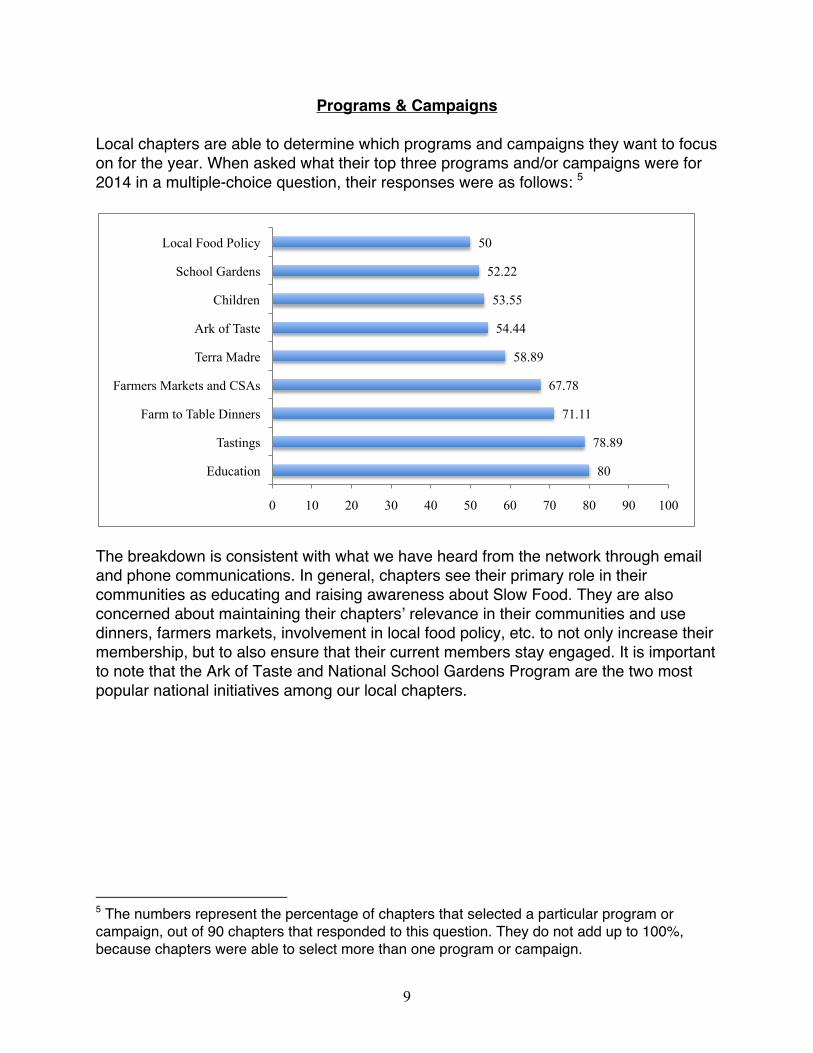
Programs & Campaigns Local chapters are able to determine which programs and campaigns they want to focus on for the year. When asked what their top three programs and/or campaigns were for 2014 in a multiple-choice question, their responses were as follows: 5
The breakdown is consistent with what we have heard from the network through email and phone communications. In general, chapters see their primary role in their communities as educating and raising awareness about Slow Food. They are also concerned about maintaining their chapters’ relevance in their communities and use dinners, farmers markets, involvement in local food policy, etc. to not only increase their membership, but to also ensure that their current members stay engaged. It is important to note that the Ark of Taste and National School Gardens Program are the two most popular national initiatives among our local chapters.
5 The numbers represent the percentage of chapters that selected a particular program or campaign, out of 90 chapters that responded to this question. They do not add up to 100%, because chapters were able to select more than one program or campaign.
80
78.89
71.11
67.78
58.89
54.44
53.55
52.22
50
0 10 20 30 40 50 60 70 80 90 100
Education
Tastings
Farm to Table Dinners
Farmers Markets and CSAs
Terra Madre
Ark of Taste
Children
School Gardens
Local Food Policy

10
Slow Food USA Initiatives In 2014, Slow Food USA decided to focus on three national initiatives: Slow Meat, Biodiversity/Ark of Taste, and National School Gardens Program. Over one-quarter worked on Slow Meat (26%)6, over one-half worked on Biodiversity/Ark of Taste (54%), and over two-thirds of Slow Food USA’s local chapters worked on the National School Garden Program (67%).
The decrease in chapters participating in Biodiversity/Ark of Taste does not reflect less engagement and interest. The national office has reduced the number of resources dedicated to Biodiversity/Ark of Taste, which has led to fewer chapters starting their own related programming. However, many of the chapters that were involved in the past, continue to remain engaged by holding Ark of Taste-related events throughout the year.
6 Slow Meat launched in late 2013, but did not gain traction until after the Slow Meat convening in June of 2014. Since it is still a relatively new program, the low percentage of chapters who worked on it in 2014 does not reflect the overall interest from the network. We expect interest to grow even more after the second Slow Meat convening in June 2015.
Slow Meat 26% of chapters were either involved with the Slow Meat 2014 convening or Slow Meat programming (i.e. Nose-to-Tailgating) or both, in comparison to 0% in 2013
Biodiversity/Ark of Taste
54% of chapters hosted one or more Ark of Taste related events including dinners and talks, in comparison to 60% in 2013
School Gardens 67% of chapters worked on school gardens – starting 98 new gardens and maintaining 345 established gardens, in comparison to 60 new and 253 established gardens in 2013

11
Finances As a whole, local chapters carry out a great deal of economic activity. In 2014, total revenue from all local chapters was about $2.8 million, whereas in 2013 it was about $800,000.7 This sharp increase is skewed though, because Slow Food Charlotte raised about $1.7 million and Slow Food Portland raised about $129,0008, meaning the actual growth is closer to 25%, instead of 250%. It is important to note that another organization, Friendship Gardens, runs its funds through Slow Food Charlotte, which would explain the huge number of funds raised. The expenses from all local chapters in 2014 totaled about $2.4 million, which is over 3 times higher than in 2013. However, this sharp increase is also skewed, because Slow Food Charlotte spent about $1.5 million, meaning the actual percent difference is closer to 28%. The total bank balance of our chapters by December 2014 was about $2.2 million – about twice the amount calculated at the end of December 2013. Again, this is due to the numbers from Slow Food Charlotte and Slow Food Portland. However, skewing data aside, there is an overall increase among our chapters’ finances, which shows increased activity and engagement. There is the reality that there is a huge financial disparity among chapters also skewing the data and may be due to many factors such as: proximity to wealth, community support, demographics of leaders’ social networks, access to capital (human, cultural, social, resources, technology) and so on. We will need to explore this disparity more deeply. (See charts for detailed breakdown of revenue and expenses on the following page.)
7 Chapter revenue and expenses may be even higher because chapters were not explicitly asked to report in-kind donations. 8 CORRECTION: Slow Food Portland raised $12,900; $129,000 was a typo.
12
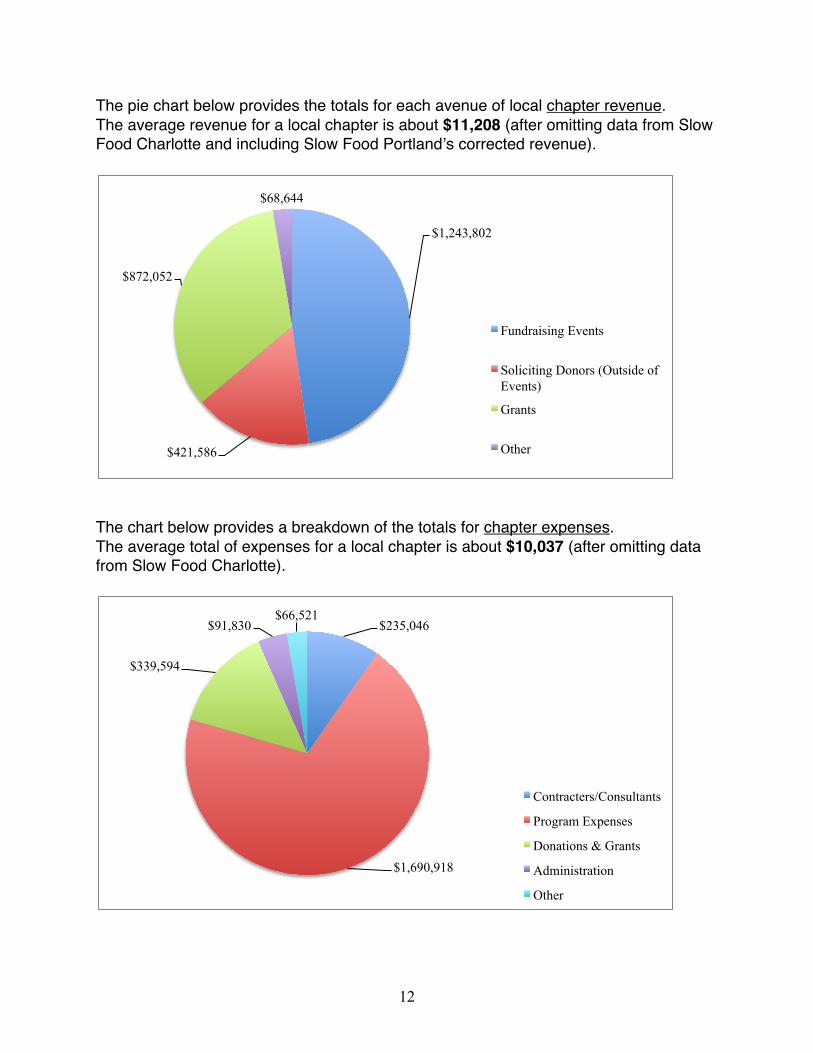
The pie chart below provides the totals for each avenue of local chapter revenue. The average revenue for a local chapter is about $11,208 (after omitting data from Slow Food Charlotte and including Slow Food Portland’s corrected revenue).
The chart below provides a breakdown of the totals for chapter expenses. The average total of expenses for a local chapter is about $10,037 (after omitting data from Slow Food Charlotte).
$1,243,802
$421,586
$872,052
$68,644
Fundraising Events
Soliciting Donors (Outside of Events)
Grants
Other
$235,046
$1,690,918
$339,594
$91,830 $66,521
Contracters/Consultants
Program Expenses
Donations & Grants
Administration
Other
13
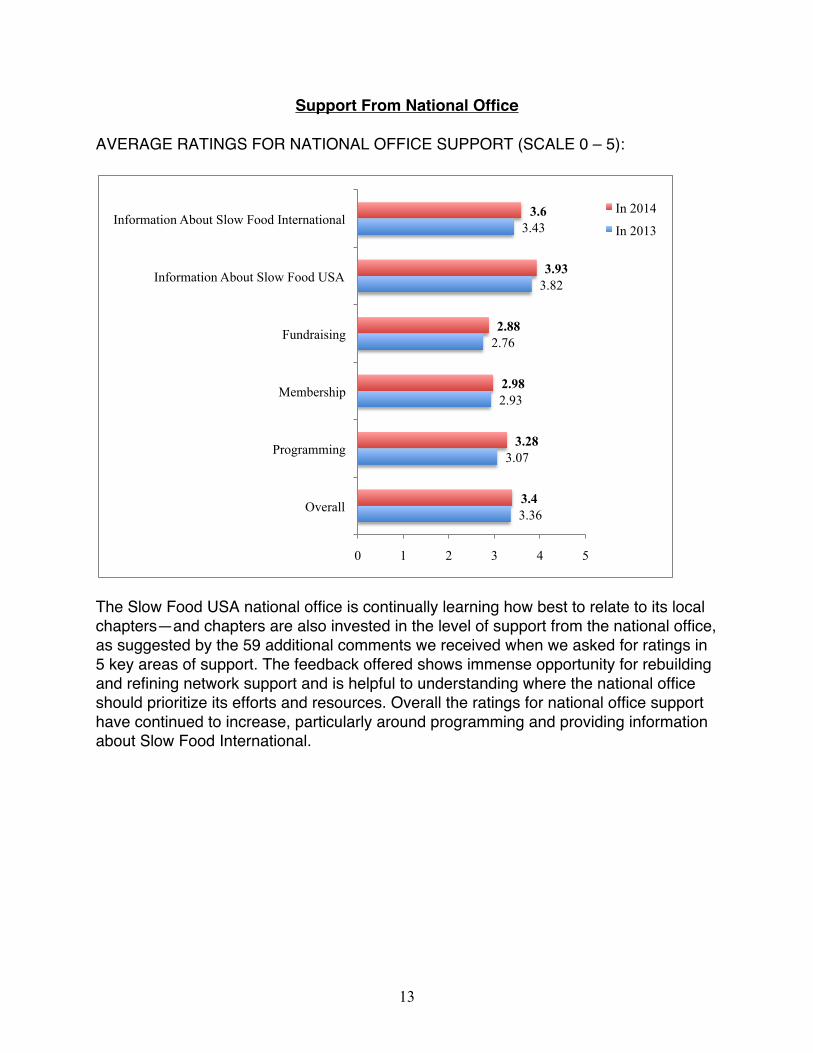
Support From National Office AVERAGE RATINGS FOR NATIONAL OFFICE SUPPORT (SCALE 0 – 5):
The Slow Food USA national office is continually learning how best to relate to its local chapters—and chapters are also invested in the level of support from the national office, as suggested by the 59 additional comments we received when we asked for ratings in 5 key areas of support. The feedback offered shows immense opportunity for rebuilding and refining network support and is helpful to understanding where the national office should prioritize its efforts and resources. Overall the ratings for national office support have continued to increase, particularly around programming and providing information about Slow Food International.
3.36
3.07
2.93
2.76
3.82
3.43
3.4
3.28
2.98
2.88
3.93
3.6
0 1 2 3 4 5
Overall
Programming
Membership
Fundraising
Information About Slow Food USA
Information About Slow Food International In 2014
In 2013

14
Support From Regional Governors
In contrast to the primarily neutral ratings received by the national office, feedback from local chapters about working with regional governors was overwhelmingly positive (see below for examples). Many local chapter leaders felt a stronger connection with their regional governors than with the national office. At the same time, at least 15% of chapters do not know or do not have any relationship with their regional governor. This is less than in 2013, but shows that the national office still needs to better communicate information about regional governors to local chapters. “Ed Yowell is always around when I need him. Not only is he great to talk to about Slow Food issues, but I love talking produce, seeds, and other agriculture-related issues.” “Laurie Carlson is great – always has time and encouragement for me. Vast wealth of knowledge – she’s a blessing to us!” “Charity is fantastic…She has been so inclusive in all communications and very patient with me! I appreciate her willingness to be available to troubleshoot and include us, despite our lacking momentum. Thank you Charity!” “Mara Welton, our regional governor is wonderful…She hosted a regional gathering and we found the information presented to be very helpful and inspiring.” “Pamela Hamilton was awesome. She always had an open ear for me. She responded to emails in a timely manner and kept her appointments with me. She made me and my work feel appreciated.” “We love working with Eve (Lacivita)!” “Dominic Fiume has provided excellent guidance and leadership this year. His guidance was especially appreciated throughout our leadership transition process.” “My regional governor Jan Wesley has been outstanding both with her communication to me around SFUSA issues but also with local and regional interests.” “Cheryl Brock has been a terrific governor communicating well with our chapter and meeting with the leadership and attending our events.” “Marilyn Noble is quite responsive and excellent to work with.” “Jennifer Casey is great! I hope Jennifer becomes our State Governor.”
15
Additional Comments and Feedback Local chapters were also asked what three leadership development areas they most wanted help and support from the national office with. The top three results were: • Member Recruitment • Board Recruitment, Retention, and Engagement • Fundraising The majority of the additional comments and feedback fit into the following categories: • Lack of resources (printed materials, tools, brochures, etc.) • Greater communication from the national office • Membership (membership lists, membership retention, etc.) • Board Member and Leader Trainings • Stability In conclusion, the overwhelming sentiment from chapter leaders is that they are feeling overworked and tired. The national office will take this into consideration, as we continue to work on strengthening the network, taking the suggestions within the surveys and using already existing knowledge within the network to build the resources and tools that will support local chapters spreading the word of Slow Food in their communities.
