2013_stork_calandro_gamage_-_the_future_of_broadband_-_acorn_redecom
TRANSCRIPT

Future of Broadband in AfricaChristoph Stork, Enrico Calandro, Ranmalee Gamage
Monday, 20 May 13
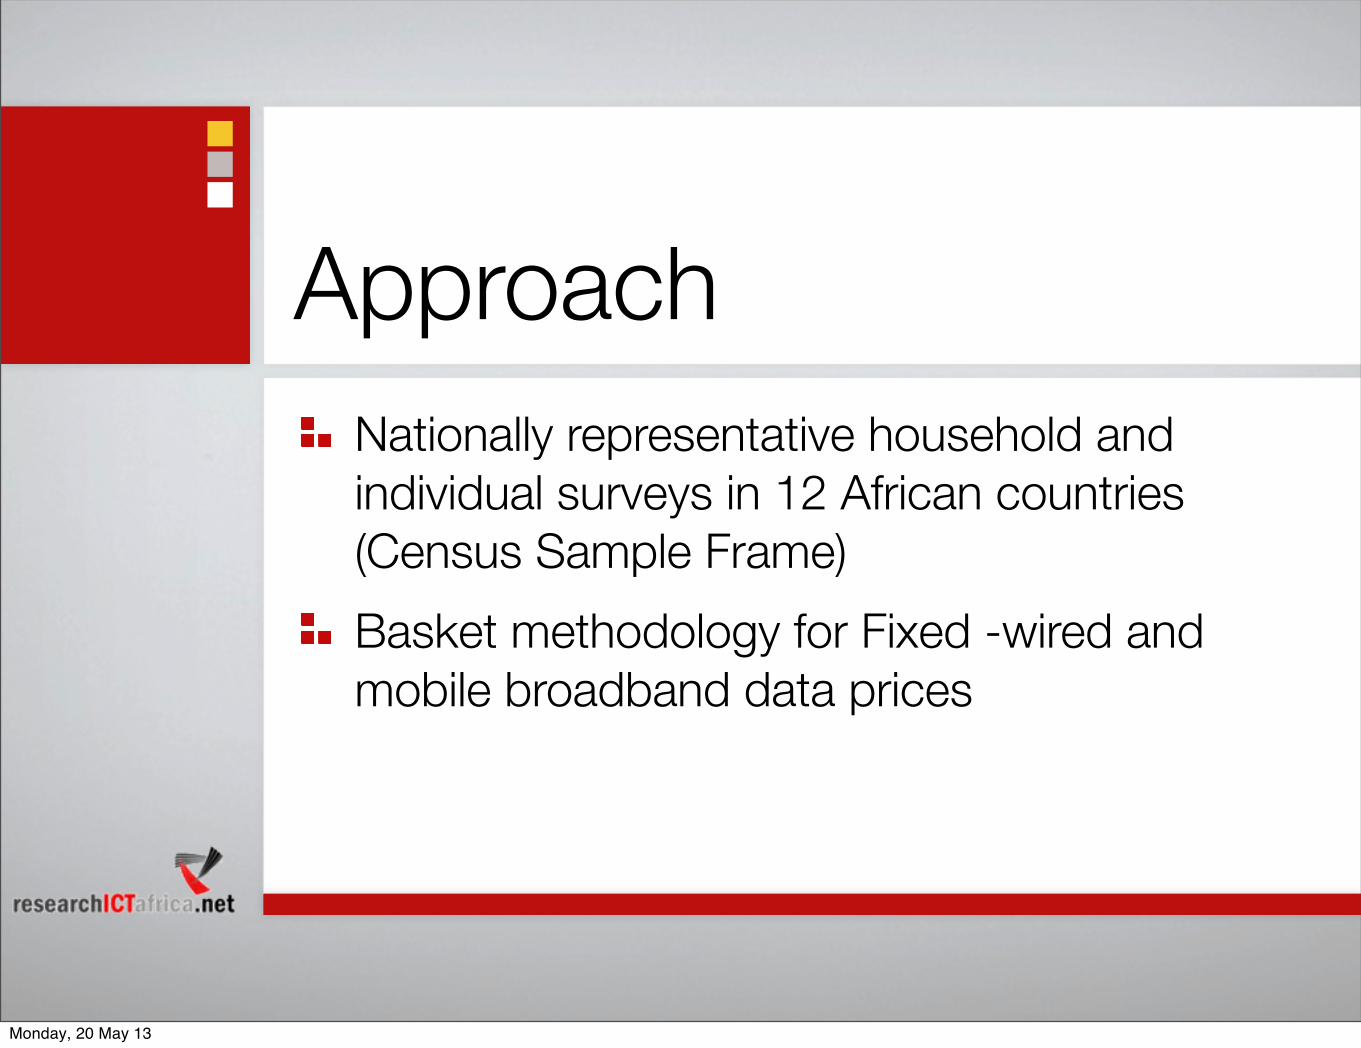
ApproachNationally representative household and individual surveys in 12 African countries (Census Sample Frame)Basket methodology for Fixed -wired and mobile broadband data prices
Monday, 20 May 13

Share of households with fixed-lines
South AfricaNamibiaEthiopia
GhanaKenya
TanzaniaNigeria 0.3%
0.4%
0.6%
1.8%
4.0%
11.5%
18.0%
0.9%
2.3%
2.6%
7.6%
17.4%
18.2%
2007/8 2011/12
Residential fixed-lines on the way out except Botswana, Cameroon, Uganda and Rwanda
BotswanaCameroon
UgandaRwanda 0.2%
1.5%
2.2%
15.0%
0.1%
0.3%
1.8%
11.0%
Monday, 20 May 13
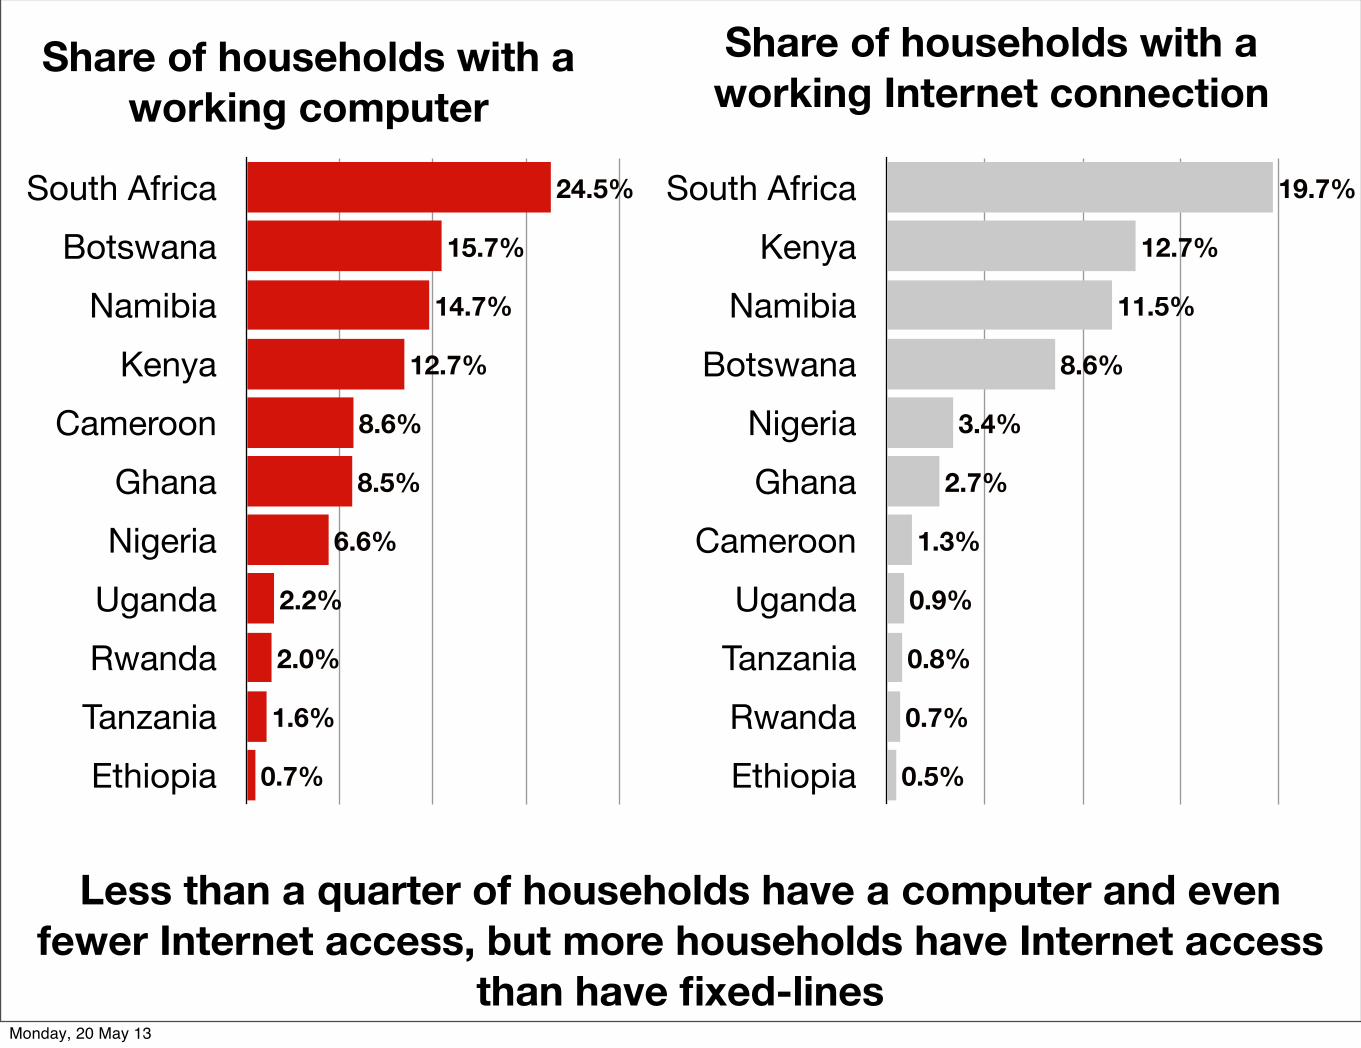
Share of households with a working computer
South AfricaBotswana
NamibiaKenya
CameroonGhanaNigeria
UgandaRwandaTanzaniaEthiopia 0.7%
1.6%
2.0%
2.2%
6.6%
8.5%
8.6%
12.7%
14.7%
15.7%
24.5%
Share of households with a working Internet connection
South AfricaKenya
NamibiaBotswana
NigeriaGhana
CameroonUganda
TanzaniaRwandaEthiopia 0.5%
0.7%
0.8%
0.9%
1.3%
2.7%
3.4%
8.6%
11.5%
12.7%
19.7%
Less than a quarter of households have a computer and even fewer Internet access, but more households have Internet access
than have fixed-linesMonday, 20 May 13
!"!!
!5!!
!10!!
!15!!
!20!!
!25!!
!30!!
1996! 1997! 1998! 1999! 2000! 2001! 2002! 2003! 2004! 2005! 2006! 2007! 2008! 2009! 2010!
Botswana! Cameroon!Ethiopia! Ghana!Kenya! Mozambique!Namibia! Nigeria!Rwanda! South!Africa!Tanzania! Uganda!
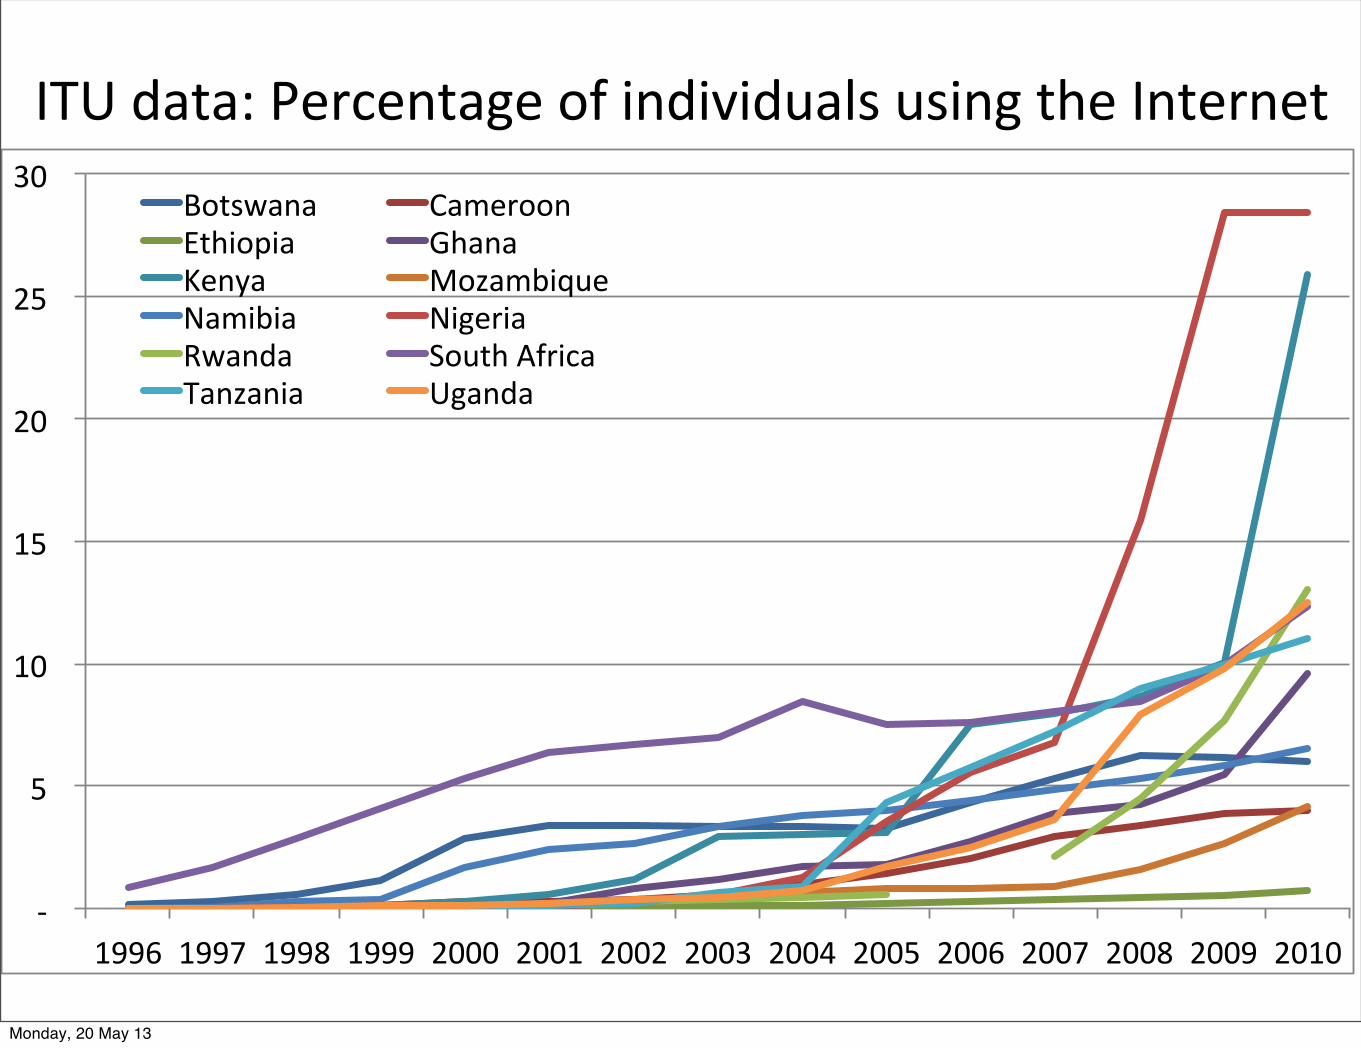
ITU data: Percentage of individuals using the Internet
Monday, 20 May 13

Ethiopia
Tanzania
Rwanda
Uganda
Ghana
Cameroon
Namibia
Nigeria
Kenya
Botswana
South Africa 15%
6%
15%
9%
13%
6%
2%
2%
2%
1% Internet use (15+)
more than doubled within 4
years
34%
29%
26%
18%
16%
14%
13%
8%
6%
4%
3%
2007/8 2011/12
Monday, 20 May 13

Internet Access ModelsOld Internet New
InternetHardware
Billing
Skill requirement
Electricity
Location
Computer / Laptop MobilePostpaid (monthly Internet
subscription) Prepaid
High (Windows + Internet explorer
+ Viruses)Low
electricity mostly required at location of Internet use
not required at home
Work, school, Internet cafe AnywhereMonday, 20 May 13
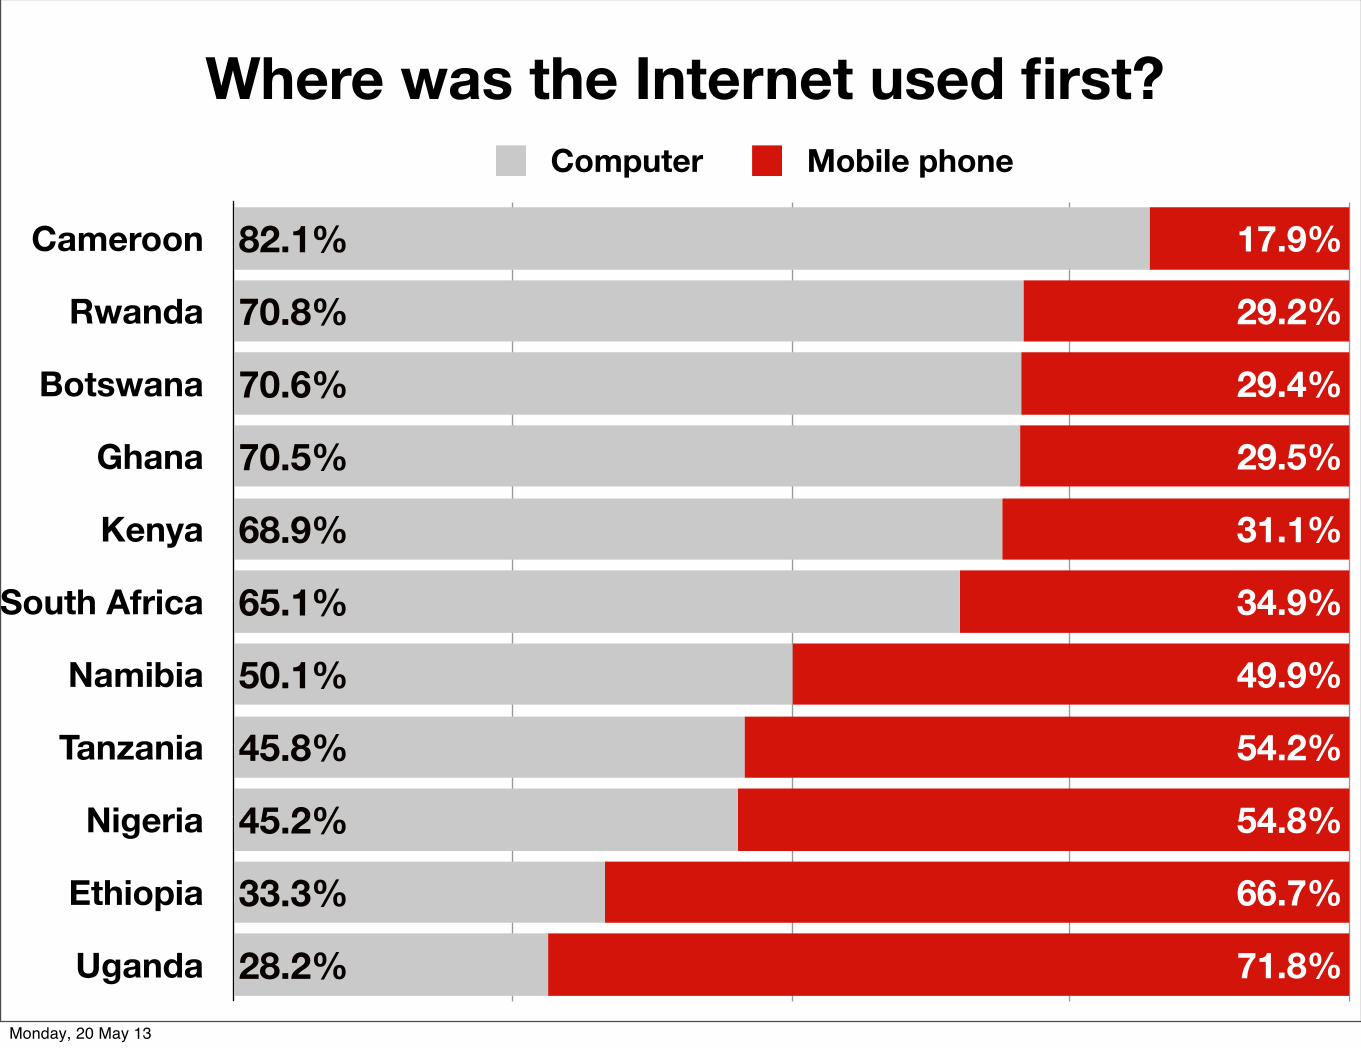
Where was the Internet used first?
Cameroon
Rwanda
Botswana
Ghana
Kenya
South Africa
Namibia
Tanzania
Nigeria
Ethiopia
Uganda 71.8%
66.7%
54.8%
54.2%
49.9%
34.9%
31.1%
29.5%
29.4%
29.2%
17.9%
28.2%
33.3%
45.2%
45.8%
50.1%
65.1%
68.9%
70.5%
70.6%
70.8%
82.1%
Computer Mobile phone
Monday, 20 May 13

Where the Internet was used in past 12 months C
amer
oon
Gha
na
Bots
wan
a
Sout
h Af
rica
Rwan
da
Tanz
ania
Nig
eria
Keny
a
Ethi
opia
Uga
nda
Nam
ibia
23%
74%
42%
72%
45%
63%50%
33%
58%85%
80%
36%51%
21%39%
20%24%31%
21%32%51%
20%
48%55%17%31%29%45%52%36%51%35%
10% 87%81%81%78%75%75%71%71%64%61%30%
Mobile phone Work Place of education Internet cafe
Monday, 20 May 13

Broadband PricingBaskets to analyze:
Monthly cost of 1 GB use per month with at least 256kbps connection for a period of 24 months (ITU basket)Monthly cost of 5 GB use per month with at least 256kbps connection for a period of 24 months.Monthly cost of uncapped use per month with at least 256kbps connection for a period of 24 months.
Monday, 20 May 13

BotswanaMozambique
CameroonSouth Africa
NamibiaGhanaKenya
UgandaEthiopiaTanzania
NigeriaRwanda 11.9
20.1
13.0
14.5
8.7
6.2
38.5
12.6
40.9
25.1
78.8
29.4
20.1
13.0
21.1
18.7
7.3
14.4
51.3
12.1
50.8
30.4
26.7
19.2
22.8
23.8
37.9
40.8
48.7
51.5
59.4
62.1
66.6
Fixed Mobile Postpaid Mobile prepaid
1 GB per month basket
Monday, 20 May 13

BotswanaMozambique
CameroonUganda
South AfricaNamibia
GhanaEthiopia
KenyaTanzania
NigeriaRwanda 25.8
51.8
16.2
34.1
36.1
143.7
21.9
40.8
100.5
57.3
29.4
51.8
16.2
7.3
64.3
36.1
51.3
26.6
37.8
50.8
68.0
133.5
19.2
37.9
39.8
40.8
48.7
51.5
53.7
59.4
62.1
133.3
Fixed Mobile Postpaid Mobile prepaid
5 GB per month basketBotswana prepaid mobile not displayed: 380 USD
Monday, 20 May 13

Ghana
South Africa
Cameroon
Namibia
Kenya
Tanzania
Rwanda
Uganda 37.8
29.4
22.6
7.3
122.9
50.8
32.8
19.2
37.9
48.7
59.4
64.9
103.4
Fixed Mobile Postpaid
uncapped GB per month basket
Monday, 20 May 13

Download Speed (kbps) Upload Speed (kbps) Latency (ms)
262216586
135
2,716
9,227
156863
4,753
FixedMobileFixed-wireless
South Africa:Broadband.co.za 75,000 measurements 2013
Monday, 20 May 13
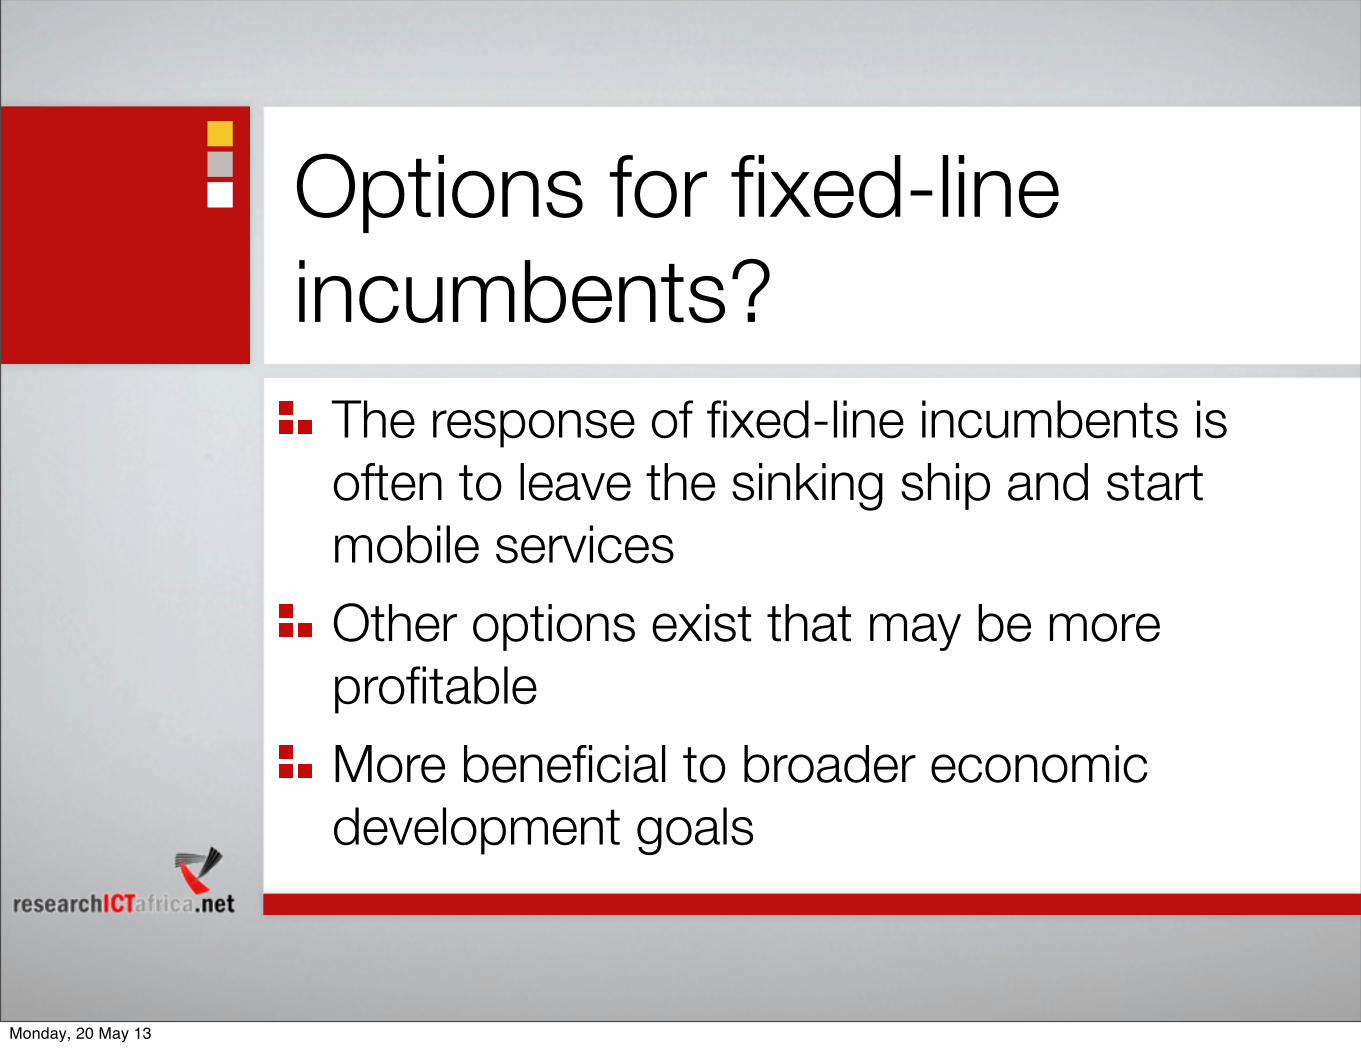
Options for fixed-line incumbents?
The response of fixed-line incumbents is often to leave the sinking ship and start mobile services Other options exist that may be more profitableMore beneficial to broader economic development goals
Monday, 20 May 13
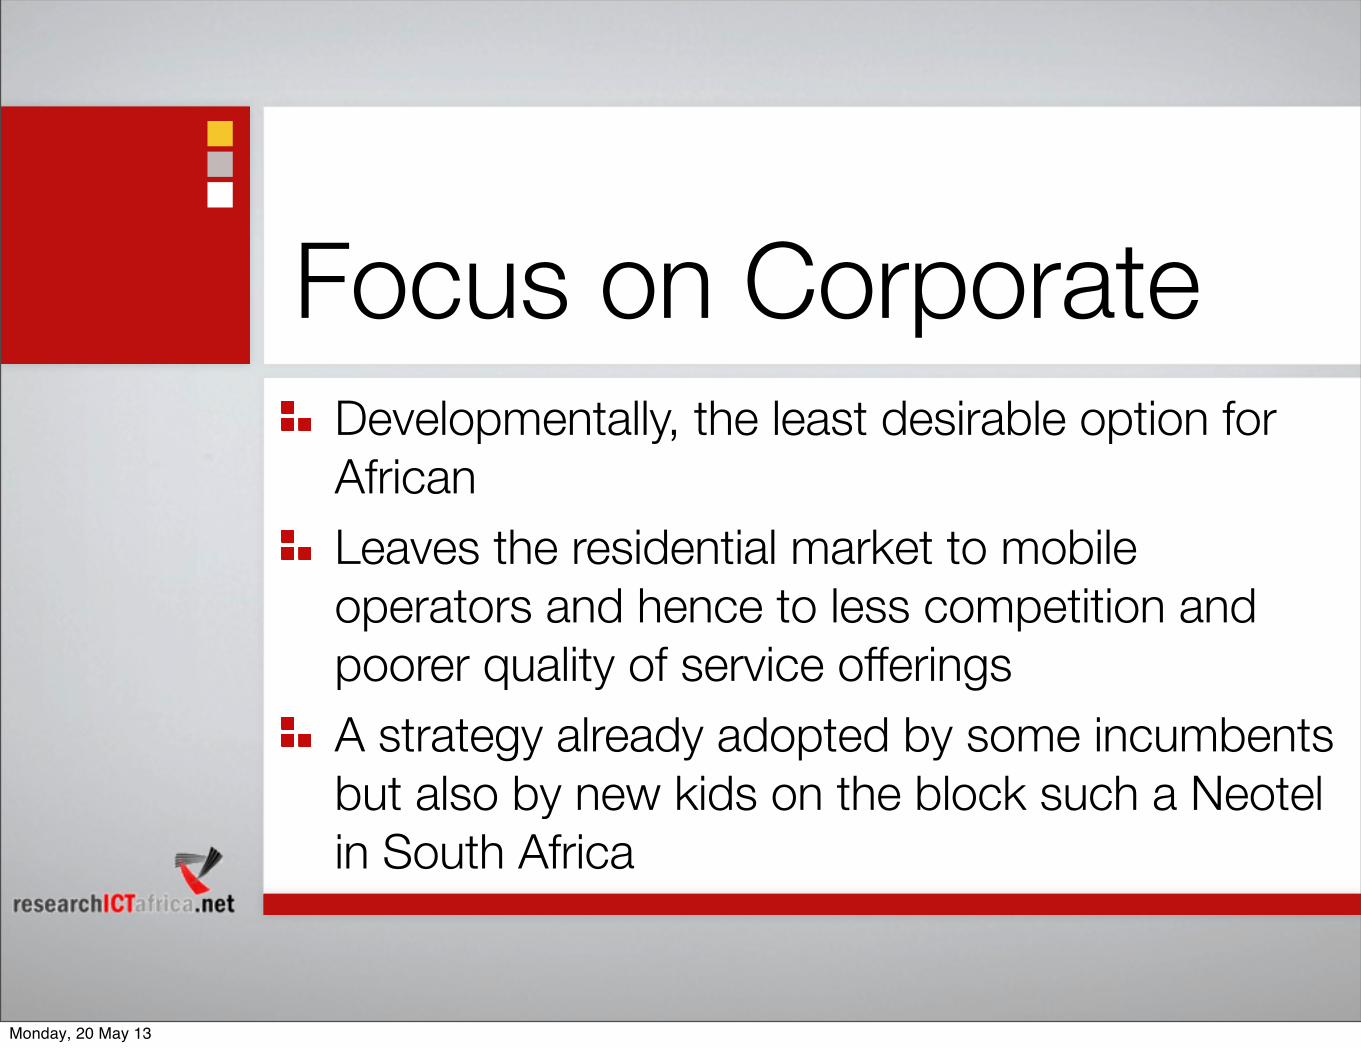
Focus on CorporateDevelopmentally, the least desirable option for African Leaves the residential market to mobile operators and hence to less competition and poorer quality of service offeringsA strategy already adopted by some incumbents but also by new kids on the block such a Neotel in South Africa
Monday, 20 May 13
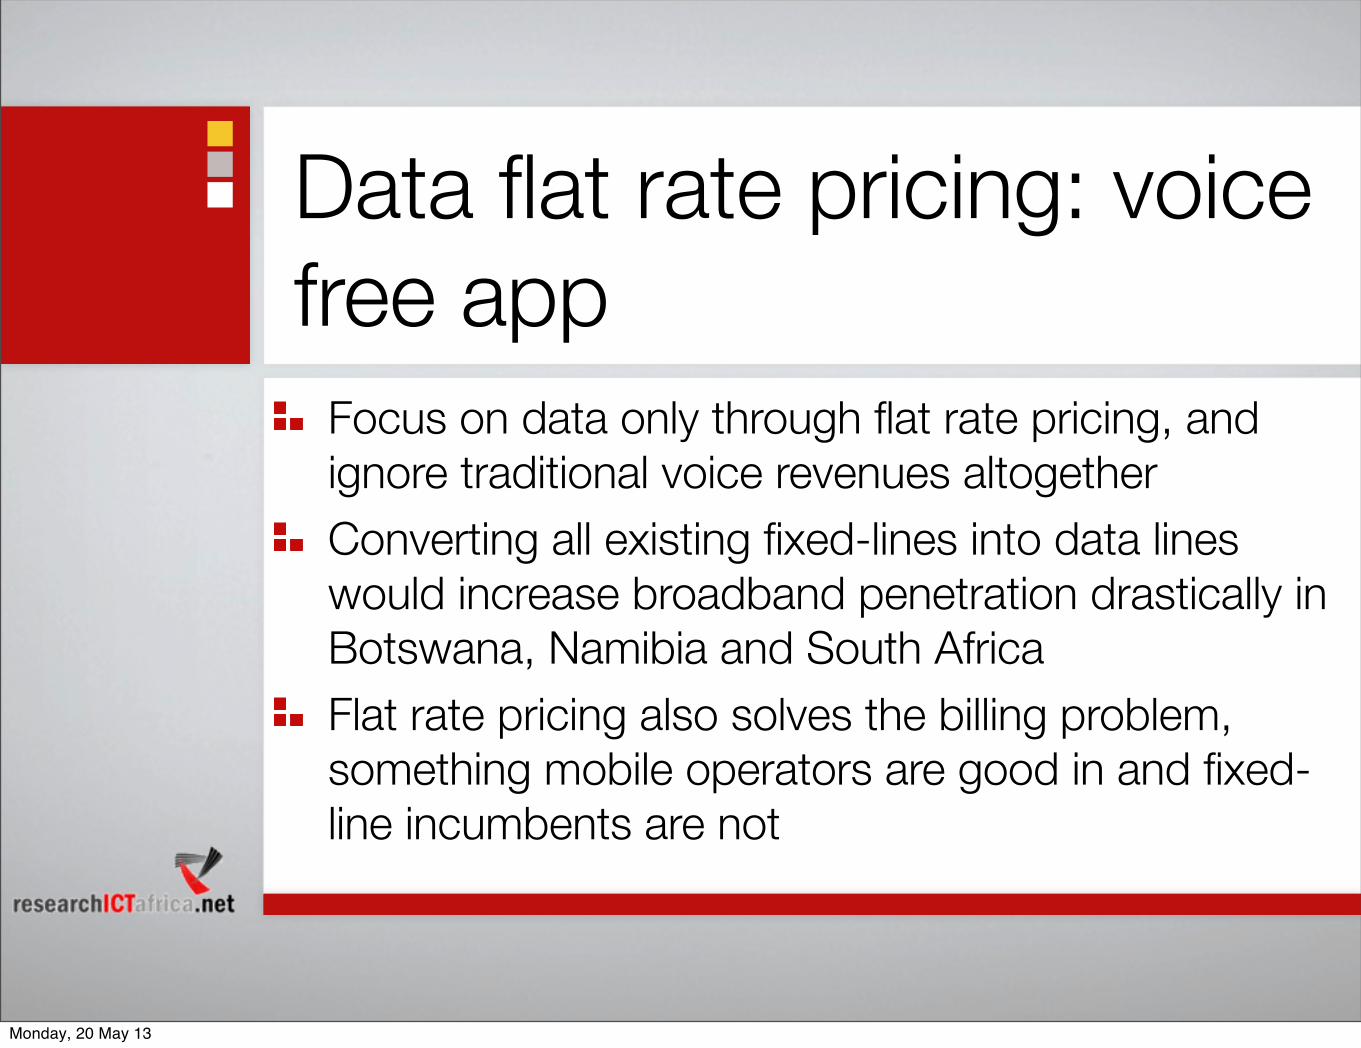
Data flat rate pricing: voice free app
Focus on data only through flat rate pricing, and ignore traditional voice revenues altogetherConverting all existing fixed-lines into data lines would increase broadband penetration drastically in Botswana, Namibia and South AfricaFlat rate pricing also solves the billing problem, something mobile operators are good in and fixed-line incumbents are not
Monday, 20 May 13

Example NamibiaTelecom Namibia’s revenues by segment in million N$
2009 2010 2011
452417297
304029183204240
Post- paid services Pre- paid servicesData and IP services
Monday, 20 May 13
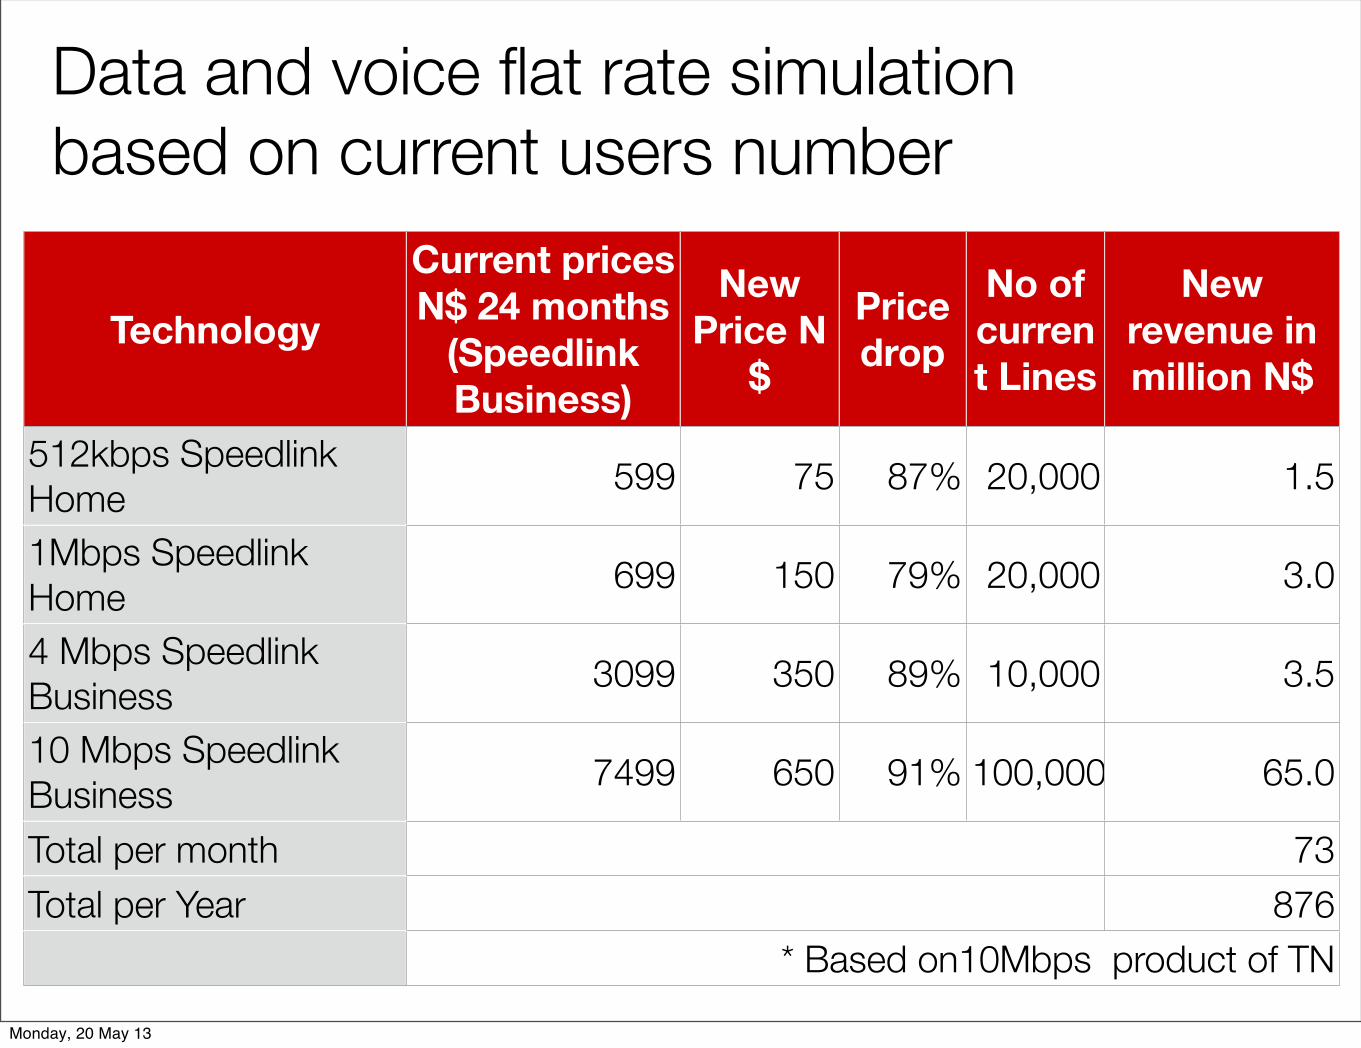
Data and voice flat rate simulation based on current users number
Technology
Current prices N$ 24 months
(Speedlink Business)
New Price N
$
Price drop
No of current Lines
New revenue in million N$
512kbps Speedlink Home1Mbps Speedlink Home4 Mbps Speedlink Business10 Mbps Speedlink BusinessTotal per monthTotal per Year
599 75 87% 20,000 1.5
699 150 79% 20,000 3.0
3099 350 89% 10,000 3.5
7499 650 91% 100,000 65.0
73876
* Based on10Mbps product of TN* Based on10Mbps product of TN* Based on10Mbps product of TN* Based on10Mbps product of TN* Based on10Mbps product of TNMonday, 20 May 13
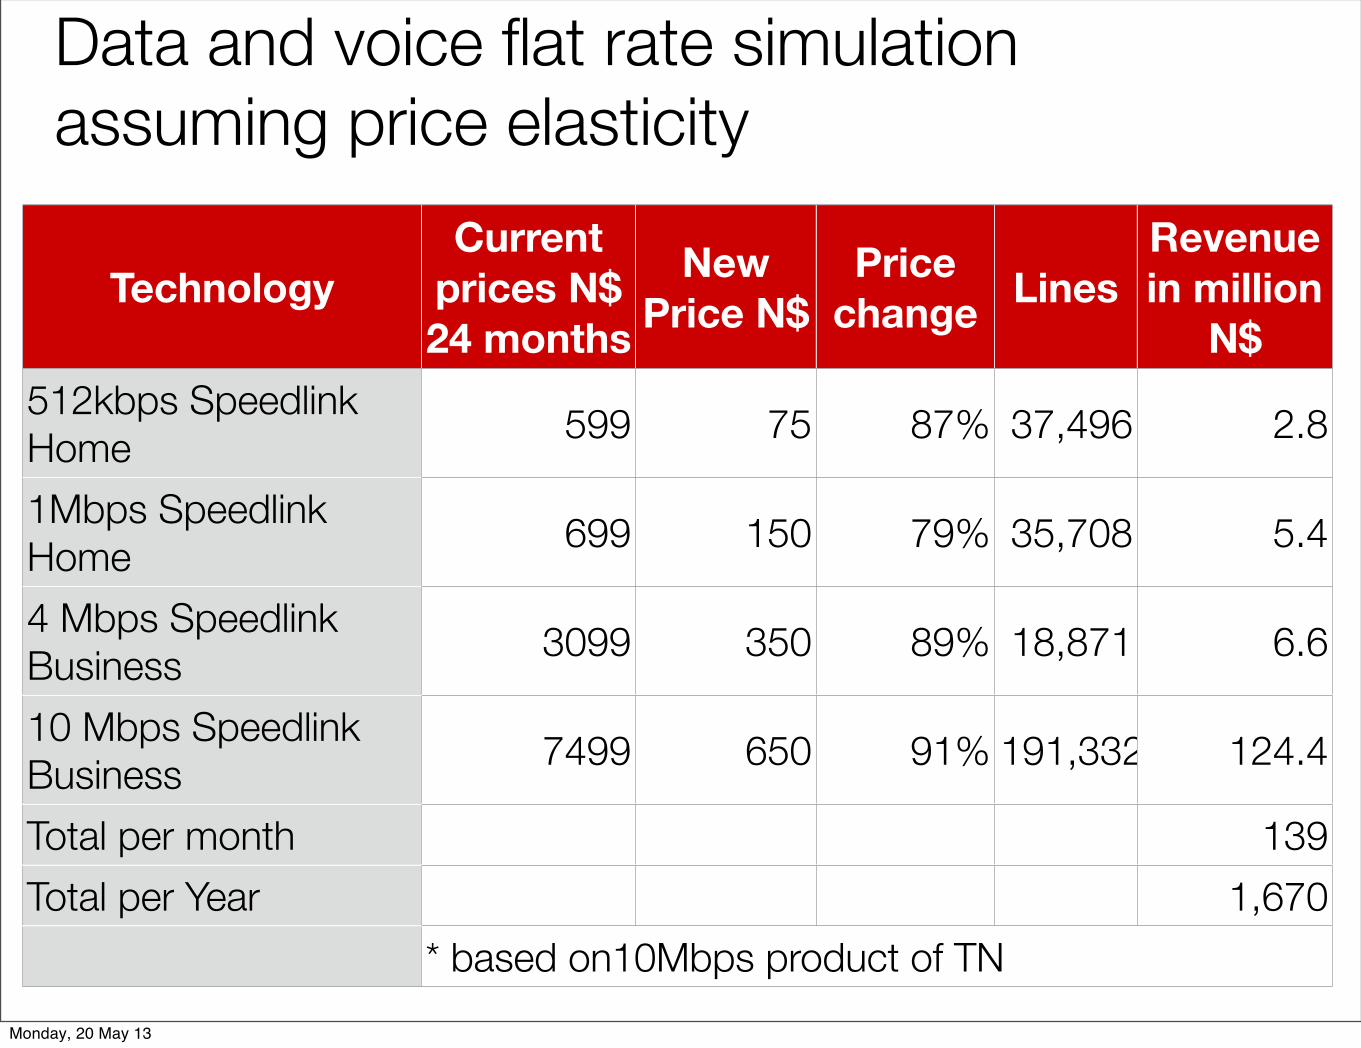
Data and voice flat rate simulation assuming price elasticity
TechnologyCurrent
prices N$ 24 months
New Price N$
Price change Lines
Revenue in million
N$512kbps Speedlink Home1Mbps Speedlink Home4 Mbps Speedlink Business10 Mbps Speedlink BusinessTotal per monthTotal per Year
599 75 87% 37,496 2.8
699 150 79% 35,708 5.4
3099 350 89% 18,871 6.6
7499 650 91% 191,332 124.4
1391,670
* based on10Mbps product of TN* based on10Mbps product of TN* based on10Mbps product of TN* based on10Mbps product of TN* based on10Mbps product of TNMonday, 20 May 13

Triple Play - Premium TV contentAdd premium content TV and replace copper with fibreFibre to the home (FTTH) may be able to compete if it is able to match satellite TV content-wiseThe competition for premium TV content would also reduce prices, bringing them closer to European levels instead of the current USD 80+An average ARPU of USD50 still good enough for premium content and uncapped fast Internet
Botswana
Cameroon
Ethiopia
Ghana
Kenya
Mozambique
Namibia
Nigeria
Rwanda
South Africa
Tanzania
Uganda 88.3
83.5
72.0
78.0
69.8
72.0
63.4
84.6
84.4
78.0
78.0
68.1
DSTV Premium Package in USD per monthMonday, 20 May 13
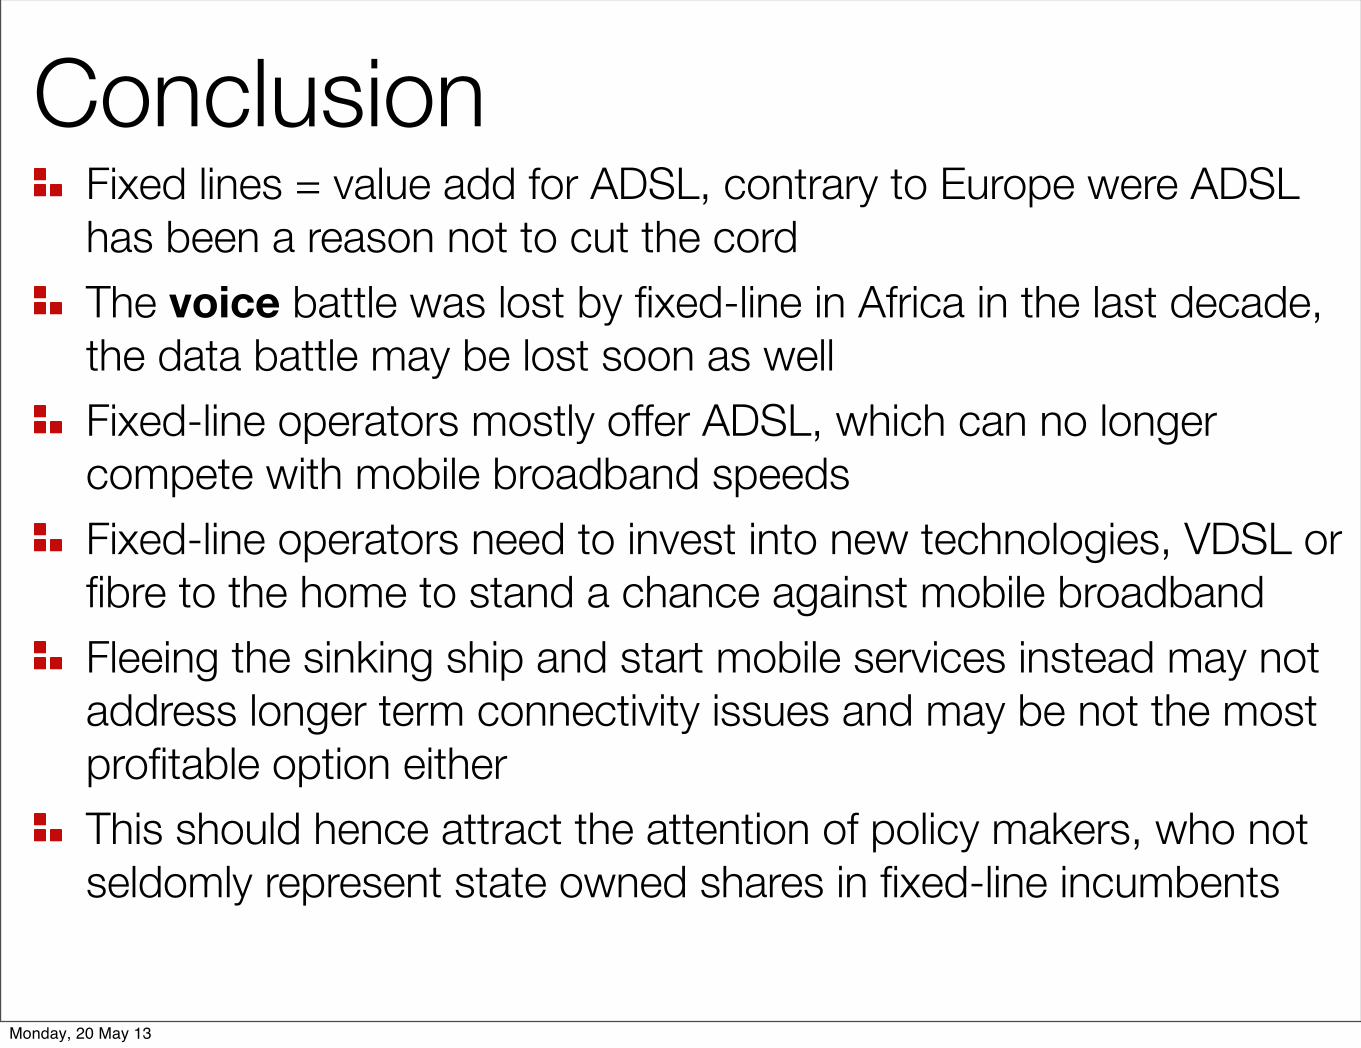
Fixed lines = value add for ADSL, contrary to Europe were ADSL has been a reason not to cut the cordThe voice battle was lost by fixed-line in Africa in the last decade, the data battle may be lost soon as wellFixed-line operators mostly offer ADSL, which can no longer compete with mobile broadband speedsFixed-line operators need to invest into new technologies, VDSL or fibre to the home to stand a chance against mobile broadbandFleeing the sinking ship and start mobile services instead may not address longer term connectivity issues and may be not the most profitable option eitherThis should hence attract the attention of policy makers, who not seldomly represent state owned shares in fixed-line incumbents
Conclusion
Monday, 20 May 13
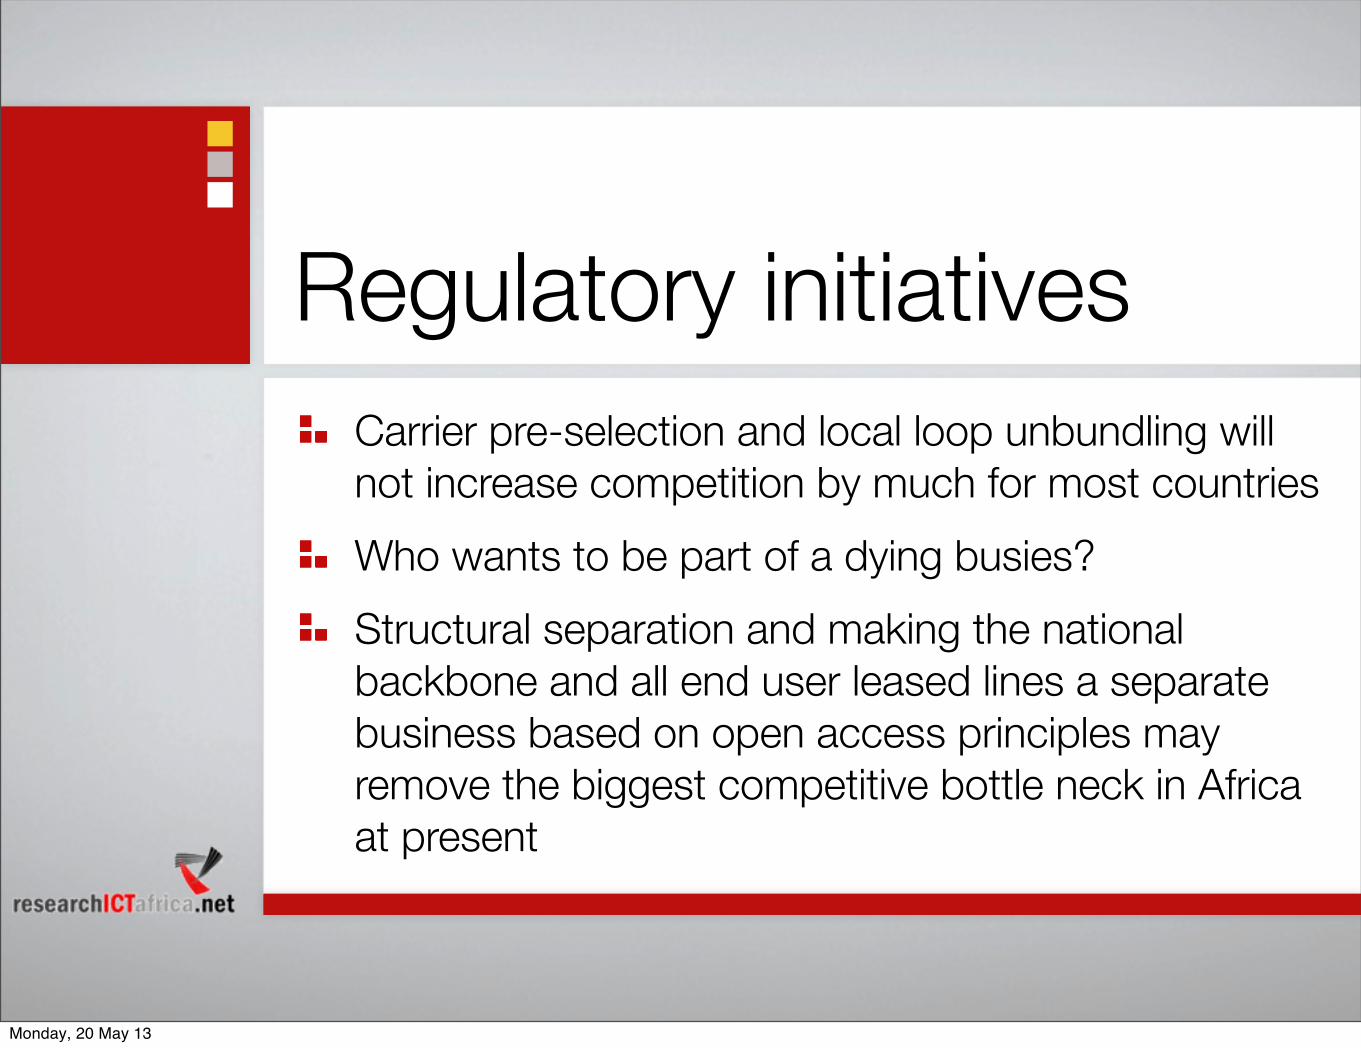
Regulatory initiativesCarrier pre-selection and local loop unbundling will not increase competition by much for most countriesWho wants to be part of a dying busies?Structural separation and making the national backbone and all end user leased lines a separate business based on open access principles may remove the biggest competitive bottle neck in Africa at present
Monday, 20 May 13