2013 wang worsley main meal patterns latent-brit jour of...
TRANSCRIPT

This is the authors’ final peer reviewed (post print) version of the item published as: Wang, Wei C., Worsley, Anthony and Hodgson, Victoria 2013, Classification of main meal patterns - a latent class approach, British journal of nutrition, vol. 109, no. 12, pp. 2285-2296. Available from Deakin Research Online: http://hdl.handle.net/10536/DRO/DU:30053674 Reproduced with the kind permission of the copyright owner Copyright: 2013, Cambridge University

1
Published in British journal of Nutrition 2013, 109 (12): 2285‐2296
Patterns of main meal consumption among Australians
Wei. C. Wang1*and Anthony Worsley1
1 School of Exercise and Nutrition Sciences, Deakin University, 221 Burwood Highway,
Burwood, Vic. 3125, Australia
*Corresponding author.
Wei Chun Wang PhD
Postdoctoral Research Fellow
221 Burwood Highway,
Burwood, Vic. 3125, Australia
Ph: 61 3 9244 6223; Fax: 61 3 9244 6017
Email address: [email protected]
Key words: main meal dishes, demographics, food knowledge, personal values, latent class
analysis, survey, Australia

2
Abstract
Relatively little examination of the meals that are consumed by the population has been
conducted, despite their well defined properties and widespread community interest in their
preparation. The purpose of this study was to identify patterns of consumption of main meals
among Australian adult household meal preparers aged 18-44 years and 45 years and over
and the relationships between these patterns and likely socio demographic and psychological
predictors. An on line cross-sectional survey was conducted by Meat and Livestock Australia
among a representative sample of people aged 18-64 years in Australia in 2011. A total of
1076 usable questionnaires were obtained which included categorical information about the
use of main meal dishes that participants had prepared during the previous six months along
with demographic information, the presence or absence of children at home, confidence in
seasonal food knowledge, and personal values. Latent class analysis was used to identify
different types of consumption patterns of 33 popular dishes among the two age groups. The
meal consumption patterns were associated differentially with the covariates between the age
groups. For example, marital status was related to the class membership among the older
group, and education and BMI were associated with the class membership in the younger
group. The findings suggest that nutrition education could be tailored to the identified classes
and changes of meals rather than individual foods may be easier to adopt by general
population.

3
Introduction
The role of red meats and vegetables in the prevention of diseases such as cancer and heart
disease remains somewhat controversial. For example, the traditional red meat based Western
dietary patterns have been found to be positively associated with colon cancer risk in females
(Kim, Sasaki, Otani, Tsugane, & for the Japan Public Health Center-based Prospective Study,
2005). However in other studies, no significant associations have been found between dietary
patterns and breast or colon cancer (Nkondjock & Ghadirian, 2005).
These contradictory findings may be due in part to the difficulty of measuring dietary patterns
(Ashima K, 2004; Moeller et al., 2007). Most work on dietary pattern analysis to date has
used conventional methods such as factor analysis (e.g., Flood et al., 2008) and cluster
analysis (e.g., Bailey et al., 2006) to discern patterns from collected data, or, has used a priori
approaches such as Healthy Eating indices (Guenther, Reedy, Krebs-Smith, & Reeve, 2008)
to assess the main components of diet. These components include fruit and vegetables, meat,
or occasional foods (energy dense nutrient poor foods) such as cakes and cookies, soft drinks,
fast foods, etc (NHMRC, 2003a).
Recently alternative statistical techniques such as latent class analysis (LCA) have begun to
be used in dietary research (e.g., Padmadas, Dias, & Willekens, 2006). LCA is a form of
nonparametric cluster analysis and it can be used for identifying classes of individuals with
comparable profiles. For example, LCA allows the identification of groups of individuals that
are similar based on their food consumption characteristics. That is, LCA can be used to
determine and enumerate the number of groups with similar meal consumption patterns;
distinguish consumption patterns that characterise groups well (e.g., high variety of dishes);
estimate the prevalence of the groups; and classify individuals into groups. LCA is a person-
centred rather than variable-centred (e.g., factor analysis) technique.
Typically frequency lists of individual food frequencies have been analysed; such studies
suggest that some patterns are associated with poor health outcomes, others (so called prudent
diets (Slattery & Potter, 2002)) with better health outcomes. However, few studies have

4
examined patterns of meal intake despite the fact that most foods are eaten in recognisable,
memorable, combinations at one time (often referred to as meals, courses or dishes).
Examination of meal consumption patterns might allow better understanding of both the
antecedents of consumption and, the possible effects of food intake on health status. In 2009,
Meat and Livestock Australia (the peak body for the Australian meat industry), undertook a
nationwide survey of consumers’ food consumption with special focus on main meal
consumption of variety of dishes (Meat & Livestock Australia, 2009). Subsequently, in
2011, Meat and Livestock Australia commissioned a second national survey - Weekly meal
repertoire (Meat & Livestock Australia, 2011) which assessed the intake of various dishes,
and elicited details of demographics and indices of other variables which were considered
likely to be associated with consumption of these dishes.
The data from the survey provide the opportunity to test the use of LCA to identify discrete
groups of consumers and to examine the association of demographics and psychological
predictors with the consumption of a variety of dishes. We wanted to test several hypotheses
about the likely associations of these variables, as follows.
Demographic influences Whilst there is much evidence about the influence of demographic
factors on intakes of individual foods, we wanted to see if these influences also affect patterns
of meal consumption. These factors include age, gender, income and education, marital
status, life stage and the presence or absence of children.
Age, life stage and children As people age, their material circumstances change from early
adulthood (18 to 44 years) to middle adulthood (45 to 64 years). (Skrabski, Kopp, &
Kawachi, 2003). For many, the period between 18 and 45 is about high financial costs
associated with children and the time scarcity associated with the need to for income to meet
expenses (Higgins, Duxbury, & Lee, 1994). As children grow up and become independent,
financial pressures may ease but the impact of health conditions is likely to increase
(Leveille, Wee, & Iezzoni, 2005). Among various lifestyle determinants, healthy eating plays
an important role in people’s health (Trichopoulou, Costacou, Bamia, & Trichopoulos, 2003).
Therefore, a key aim in the present analyses was to compare the consumption patterns of
main meals and their possible antecedents between two broad age groups 44 years and
younger and 45 years and older.
5
Gender and socio economic influences Gender differences in food preferences and practices
are pronounced (Beardsworth et al., 2002), and income and education have been reported as
significant determinants of food choice in the nutrition literature (Drewnowski & Specter,
2004; Thiele, Mensink, & Beitz, 2004). Differences in food intake have also been
documented among people with different marital status (Schafer, Schafer, Dunbar, & Keith,
1999; Umberson, 1992) that dietary quality has been shown among married people through
family food interaction. Therefore, we hypothesized that people’s background characteristics
(i.e., gender, income, education, marital status) would be related to their meal consumption
patterns. We expected that high levels of education and income would be associated with
high variety intakes of the main meal dishes since several studies have linked these factors to
consumption of a wide variety of individual foods (Turrell, Hewitt, Patterson, Oldenburg, &
Gould, 2002; Worsley, Blasche, Ball, & Crawford, 2003; Worsley, Blasche, Ball, &
Crawford, 2004) and that women would consume a greater variety of meals or less red meat
dishes than men because of their known health consciousness and lesser preference for red
meat (Beardsworth, et al., 2002; Worsley & Scott, 2000).
Influence of children Among very few studies about the impact of children’s presence on
family food choice, Laroche, Hofer, and Davis (2007) showed that the presence of children in
the household was associated with significantly higher total and saturated fat intakes and
these were associated with greater intakes of high-fat foods such as salty snacks, pizza,
cheese, beef, ice cream, cakes/cookies, bacon/sausage/processed meats, and peanuts.
Moreover, Burke, Beilin, Dunbar, and Kevan (2004) found higher caloric consumption
among women with children than women without children. Thus, we hypothesized that the
meal consumption patterns would vary by the presence or absence of children in household –
families with children would consume a greater variety of dishes.
BMI (Body Mass Index) There are clear associations between overweight, obesity and the
consumption of energy dense, nutrient poor foods (Drewnowski, 2004). Thus, food
consumption appears to be closely related to people’s body weight (Booth, Blair, Lewis, &
Baek, 2004). Therefore, we hypothesized that people who were normal weight would be
more likely to consume healthy meals such as meals containing energy-dense but nutrition
rich foods.

6
Cooking confidence and skills Several studies (e.g., Stead, Caraher, & Anderson, 2004;
Wrieden et al., 2007) have shown that confidence and skills in cooking and food preparation
contribute to the improvement of dietary quality, as in general, home prepared meals are
healthier than processed foods or foods prepared and consumed outside the home (Guthrie,
Lin, & Frazao, 2002). For example, confidence in seasonal food knowledge may be
associated with making tasty meals using fresh produce in season. Thus, we hypothesized
that people’s cooking confidence and skill would be positively associated with their healthy
consumption patterns of main meal dishes.
Values orientation Universalist values (Schwartz, 1992) refer to a strong orientation towards
caring for others and the environment. Our previous studies showed there were strong links
between this value orientation and food consumption. For example, Worsley (2006) found
that people who held strong universalist values were most supportive of healthy eating
policies. Furthermore, Lea (2001) and Worsley, Wahlqvist, Dalais, and Savige (2002)
demonstrated strong associations between vegetarian diets and soy products, and universalist
values. Therefore, we hypothesized that people who held strong universalist values would
less prefer meat dishes than those with lesser universalist values
In summary, this study aimed to:
1. Examine the number of distinct types (latent classes) of consumption patterns of main
meal dishes among Australian adults aged 44 years and younger, and 45 years and
older.
2. Examine the influences of several likely predictors on identified class membership.
Method
Procedure
The survey questionnaire – Main Meal Repertoire Questionnaire was administered on line by
Clever Stuff Pty on behalf of Meat and Livestock Australia to a quota sample of Australians
aged between 18 and 64 years across metro and rural areas of six states and territories,
Australia. The data were supplied to the researchers in de-identified format. One thousand
and seventy six people within the age range participated and returned the completed
questionnaires. Table 1 provides an outline of the participants’ demographic characteristics,
BMI, presence of children in the home, food cooking confidence, and universalist value
orientation.

7
-------------------------------------
Table 1 here
-------------------------------------
The questionnaire
Background characteristics
Social demographic information was collected, which included age, gender, income, marital
status, education, self-reported height and weight for the calculation of BMI, cooking
confidence, having children at home, and personal values. Separate analyses were carried out
across age groups (i.e., 44 years and younger, 45 years and older). Being male and having
children at home was a reference category for the binary variables gender and children at
home. Marital status was re-coded into binary variables and the corresponding reference
categories were Single/Divorced/separated/Widowed (versus married/cohabiting). In
addition, income, education, cooking confidence including seasonal food knowledge (i.e.,
make a tasty meal using fresh produce in season), and the personal value of universalism
were ordered categorical variables with higher scores indicating higher levels of income,
education, confidence in seasonal food knowledge, and greater importance in value
orientation. A continuous BMI variable (i.e., BMI = weight (kg) / height (m)2) was
calculated based on the height and weight reported by the participants and used in the
analysis. Self-reported weights and heights are valid for determining associations in
epidemiological studies (Venn et al., 2007).
Main meals
As part of the Main Meal Repertoire survey, a checklist of 81 dishes prepared for main meals
by the participants in their homes during the past six months was administered. The checklist
used dichotomous response scales with “0” representing no consumption and “1” indicating
that the dish was consumed. The question that the respondents were required to answer was
thinking about the last six months which of the following dinners have you prepared in the
home? We are only interested in what you have prepared for the main meal, not any side
dishes or starters. To minimise the complexity of the data analysis, the current paper reports
the top 40%, which was 33 out of 81 main meals that were consumed most frequently by the
respondents.
Analytical procedure
8
Similar to factor analysis for continuous latent variables, latent class analysis (LCA)
accommodates an analogous framework for measuring categorical latent variables (Lanza,
Collins, Lemmon, & Schafer, 2007). LCA allocates a sample population into mutually
exclusive and exhaustive subgroups (Goodman, 1974). In the present study, the response
patterns of the 33 dietary questions were subjected to LCA to identify the number of classes
to which the respondents may belong. LCA was carried out with Mplus version 6.1 (Muthén
& Muthén, 1998-2011) for both age groups (i.e., 44 years and younger and 45 years and
older) separately. The maximum likelihood estimation method was used to adjust the
standard errors of the present analyses.
The performance of two, three and four latent class models was assessed. Of these three
competing latent class models, the selection of the best fitting model was subject to several
statistical fit indices as well as theoretical considerations. The literature has shown that the
Akaike information criterion (AIC, Akaike, 1987) and the Bayesian information criterion
(BIC, Schwarz, 1978) are commonly used for LCA assessment (Lanza, et al., 2007). In
addition, the sample size adjusted BIC (aBIC, Sclove, 1987) has demonstrated notable
success in determining the number of classes from competing LCA models (Yang, 1998).
The information criteria are goodness-of-fit measures that incorporate various penalties for
model complexity (Sclove, 1987). Smaller values indicate better fit. Lo-Mendell-Rubin’s
likelihood ratio test (LMR) (Lo, Mendell, & Rubin, 2001) compares the estimated model with
a model with one fewer class than the estimated model. The p value obtained represents the
probability that the data have been generated by the model with one fewer class. Lower p
values indicate better model fit. Entropy is a standardized summary measure of the
classification accuracy of placing participants into classes on the basis of their posterior
probabilities (Ramaswamy, Desarbo, Reibstein, & Robinson, 1993). It can range from 0 to 1,
with higher values indicating better classification. Moreover, higher values of the
loglikelihood test statistic suggest better model fit. In the present study, six statistical fit
indices were considered to determine the best number of classes: the loglikelihood value, the
Akaike, Bayesian, and adjusted Bayesian information criteria, LMR p value, and an entropy
measure.
Furthermore, the current analysis included the predictors of class membership (Lanza, et al.,
2007) in which the suitable latent classes were regressed on participants’ background
characteristics, including gender, income, marital status, education, BMI, having children at

9
home, confidence in seasonal food knowledge, and universalism value orientation. All of
these factors are considered as possible influences of population heterogeneity on the main
meal dishes consumed by respondents. The multinomial logistic regression coefficients for
each of the classes were then estimated and compared to the reference class.
Results
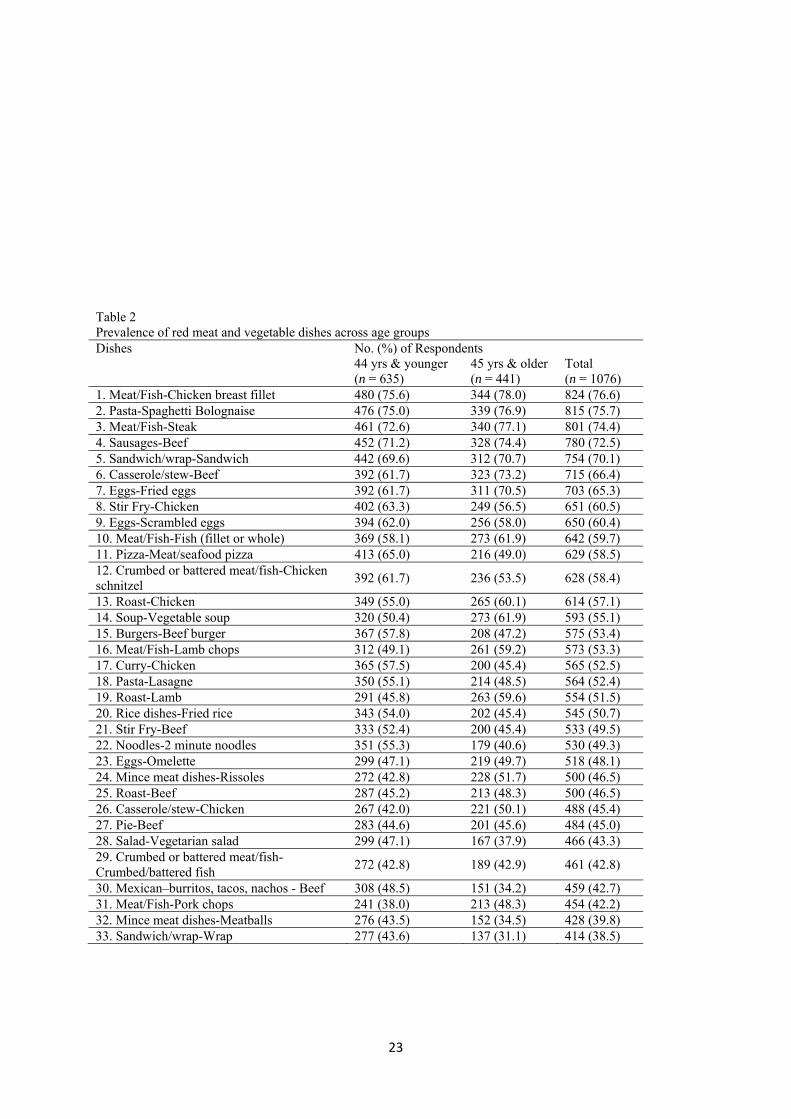
Table 2 presents prevalence estimates for the 33 main meal dishes included in the LCA
analyses. The prevalence of the consumption of these dishes, for the younger group, ranged
from the lowest: 38% (meat/fish-pork chops) to the highest: 75.6% (meat/fish-chicken breast
fillet). However, for the older group, sandwich/wrap was consumed at the lowest rate
(31.1%) and meat/fish-chicken breast fillet was consumed the most (78%), reflecting a wide
range of meals captured within the analyses.
-------------------------------------
Table 2 here
-------------------------------------
Latent class results
To identify the appropriate number of classes, a two-class model was initially fitted to the
data and successively compared to models that specified an increasing number of latent
classes. In selecting the optimal model solution, a set of statistics including the loglikelihood,
AIC, BIC, aBIC, LMR p value, and entropy were examined. Table 3 shows the model fit
statistics derived from LCAs for the two- to four- latent class models for both age groups
when the 33 main meal dishes, and the covariates were included in the model.
An examination of Table 3 suggests a four-class solution for both age groups based on the
higher loglikelihood statistic values and the LMR p value; the smallest AIC and aBIC; and
the highest entropy. However, it can be seen that a three-class model is favoured by the lowest
BIC for the older age group. Nevertheless, based on the fact that the determination of the
number of classes depends on a combination of factors including fit indices, theoretical
justification, and interpretability, a four-class model was deemed the most appropriate solution
for both age groups.
-------------------------------------
Table 3 here
-------------------------------------

10
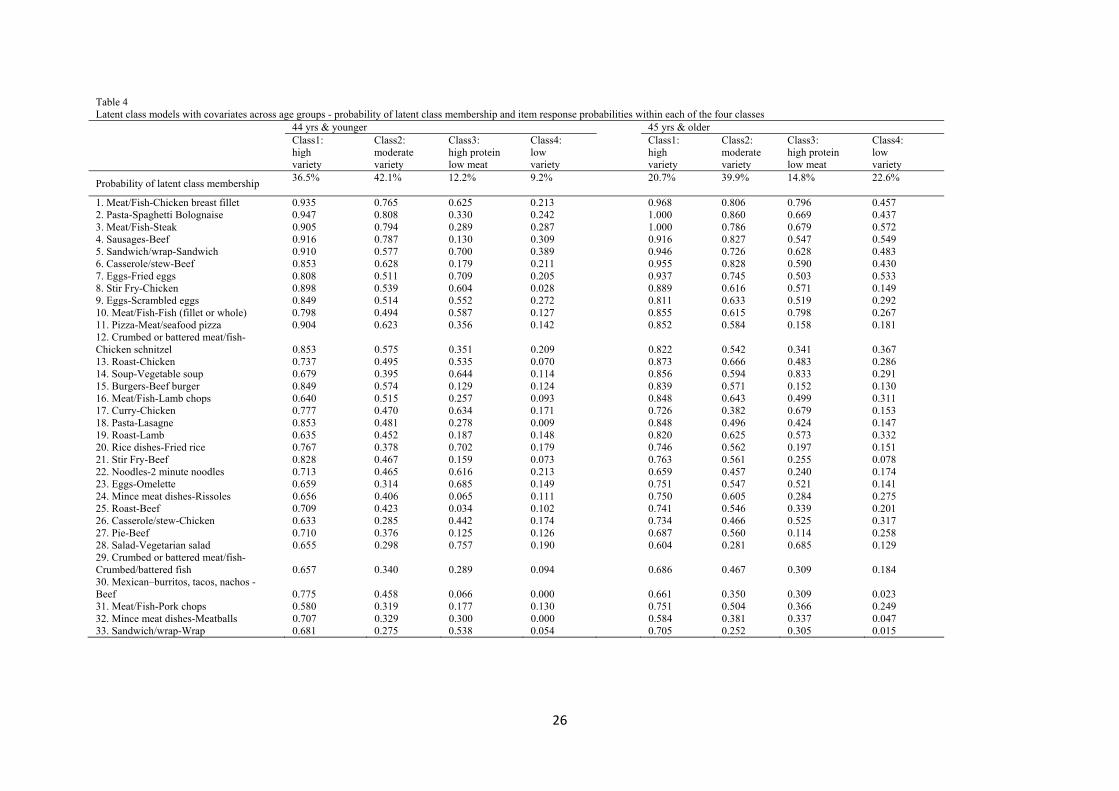
The response probabilities for each of the 33 main meal dishes are presented for each of the
latent classes in Table 4. These probabilities can be used to characterize the four latent
classes. The four distinct latent classes of the main meal dishes for people who were 44 years
and younger, and 45 years and older are as follows:
Class 1 – high variety. This group reported the highest probabilities of endorsing main meals
across all the 33 dishes from 0.58 (meat/fish-pork chops) to 0.95 (pasta-spaghetti bolognaise)
for people aged 44 years and younger (Table 4, second column) and 0.58 (mince meat dishes-
meatballs) to 1.00 (pasta-spaghetti bolognaise, meat/fish-steak) for people aged 45 years and
older (Table 4, fifth column). The class represented 36.5% and 20.7% of the younger and
older age groups, respectively. Generally, this group consumed a wide variety of the main
meal dishes.
Class 2 – moderate variety. This class constituted 42.1% and 39.9% of the younger and older
age groups, respectively and was the largest group for both age groups. For example (Table 4,
columns third and sixth), dishes were reported with the probabilities ranging from 0.28
(sandwich/wrap) to 0.81 (pasta-spaghetti bolognaise) by the younger group and from 0.25
(sandwich/wrap) to 0.86 (pasta-spaghetti bolognaise) by the older group. This group was
similar to class 1 but tended to consume moderate rather than high variety of the dishes.
Class 3 - high protein but low red meat. These respondents had low probabilities on the red
meat dishes but high probabilities on the vegetarian dishes. For example (Table 4, columns
fourth and eighth), the younger age group reported roast-beef consumption of 0.03 and salad-
vegetarian salad meals of 0.76 while the older group had pie-beef of 0.11 and soup-vegetable
soup of 0.83. Nevertheless, more high protein dishes were consumed, for example, 0.71
(eggs-fried eggs) by the younger group and 0.80 (meat/fish-fish (fillet or whole)) by the older
group. This class comprised 12.2% and 14.8% of the younger and older age groups,
respectively.
Class 4 - low variety. This class reported the lowest probabilities of consumption of the 33
dishes, ranging from 0 (Mexican–burritos, tacos, nachos - beef, mince meat dishes-meatballs)
to 0.39 (Sandwich/wrap-Sandwich) for the younger group and from 0.02 (Sandwich/wrap) to
0.57 (Meat/Fish-Steak) for the older group (Table 4, columns fifth and ninth). The class
represented 9.2% and 22.6% of younger and older age groups, respectively. This was the

11
smallest class for the younger group and the second largest group for the older groups, which
suggests that very few younger people but quite a lot of older people consumed low variety
main meal dishes.
-------------------------------------
Table 4 here
-------------------------------------
Overall, the meal consumption patterns were similar between the younger and older age
groups for the four classes identified (see Figure 1). However, there were dissimilarities in
class percentages among the two age groups. The composition of classes for both age groups
were class 1 (high variety): 36.5% vs. 20.7%; class 2 (moderate variety): 42.1% vs. 39.9%;
class 3 (high protein but low red meat): 12.2% vs. 14.8%; and class 4 (low variety): 9.2% vs.
22.6% for people aged 44 years and younger, and 45 years and older, respectively.
-------------------------------------
Figure 1 here
-------------------------------------
Multinomial logistic regression analyses were conducted on the younger and older age group
samples. Class 1 (high variety), 2 (moderate variety), and class 3 (high protein but low red
meat) were compared with class 4 (low variety) in order to interpret the associations between
class membership and the covariates: gender, income, marital status, education, BMI,
children’s presence at home, confidence in seasonal food knowledge, and universalism value
orientation. The estimated log odds coefficients and the corresponding log odds confidence
intervals were then converted into odds ratios and their corresponding 95% confidence
intervals (see Table 5).
-------------------------------------
Table 5 here
-------------------------------------
Associations among people 44 years and younger

12
Gender: Women were two and half times more likely to be in class 1 (high variety) versus
class 4 (low variety) than men were. Moreover, women were nearly three times more likely
than men to be in class 2 (moderate variety) rather than class 4 (low variety).
Education: People who had higher level of education were almost two and half times more
likely to be in class 3 (high protein but low red meat) than class 4 (low variety) when
compared to people who reported lower level of education.
BMI: as people’s BMI increased, the odds of being in class 1 v. class 4 decreased. In other
words, people with a higher BMI were 9% less likely to be in class 3 (high protein but low
red meat) than people with a lower BMI.
Presence of children: For people who had children living at home, the odds of being in class 1
(high variety) and 2 (moderate variety) versus class 4 (low variety) were over ten times and
eight times, respectively higher than for people without children at home.
Confidence in seasonal food knowledge: People with more confidence were nearly three
more likely to be in class 3 (high protein but low red meat) rather than in class 4 (low variety)
than people without confidence in seasonal food knowledge.
No other statistically significant associations with class membership were found.
Associations among people 45 years and older
Marital status: In contrast to the under 45 year old, marital status was significantly associated
with the class membership. For example, the odds of being in class 1 (high variety) and 2
(moderate variety) versus class 4 (low variety) were almost five and half times and four
times, respectively higher for married and de facto people than for single, divorced, or
widowed people.
Education: The odds of being in class 3 (high protein but low red meat) versus class 4 (low
variety) were almost three times higher for people who had higher level of education.

13
Children’s presence: The odds of being in class 1 (high variety) versus class 4 (low variety)
were over three and half times higher for families with children than without children in the
household.
Seasonal food knowledge: The odds of being in class 1 (high variety) and 2 (moderate
variety) versus class 4 (low variety) were nearly three and two times, respectively higher for
people who had higher confidence in seasonal food knowledge than people who had no
confidence.
Universalism: For older people who held strong universalist values, the odds of being in class
1 (high variety) and class 3 (high protein but low red meat) versus class 4 (low variety) were
almost three times and over six times higher than people who did not value universalism.
Interestingly, these associations were not found among the younger population.
Generally, the associations between class membership and the covariates yielded differences
between the age groups. While gender, education, BMI, children’s presence at home, and
confidence in seasonal food knowledge were related to class membership among the younger
age group, marital status, education, seasonal food knowledge, and universalist value were
associated with class membership among the older age group.
In summary, four consumption patterns of main meal dishes were identified for people aged
44 years and younger and 45 years and older. The highest proportion of participants were
classified into the class of moderate variety for both age groups, followed by the high variety
class for the younger group and the low variety class for the older group, high protein but low
red meat class for the younger group and high variety class for the older group. The smallest
proportion of younger respondents belonged to the class of low variety and among the older
respondents, to the high protein, low red meat class. Furthermore, various combinations of
covariates were associated with class membership in the two age groups.
Discussion
Overall, the four consumption patterns (classes) of main meals identified by the LCA were
predictable by gender, marital status, education, BMI, children’s presence in household,
seasonal food knowledge, and universalist values.
14
Class 1 and Class 2 represent high and moderate variety meal classes. The findings suggest
that the consumptions of all the 33 main meal dishes were in moderate frequencies for most
of the younger and older participants, and in high frequencies for more of the younger people
and fewer of the older people. These meal patterns are in line with national dietary
recommendations (NHMRC, 2003a) as by eating a wide variety of meal dishes, a diverse
range of foods with different colours, tastes, textures and smells and nutrient propertries are
consumed. Many of these naturally occurring ingredients are likely to be beneficial to health
(Savige, 2002). Noticeably, the frequencies of consumption of variety of meals decreased
among the older group, which may be associated with age as physiological functions decline
with age (Brownie, 2006).
Gender The findings suggest that younger females were more likely to be in the high (class 1)
and moderate (class 2) variety meal classes versus low variety class (class 4) than their male
counterparts, which corresponds with our hypothesis and previous findings from the food
literature. For example, Beardsworth, et al. (2002) showed that women were more likely to
make dietary changes in line with recommendations and women had higher levels of health
knowledge than men as dietary variety is positively associated with low body weight and
adequate macronutrient (Roberts, Hajduk, Howarth, Russell, & McCrory, 2005). However,
this gender difference was not found within the older population.
Marital status For the older age group, people who were in married or in de facto
relationships were more likely to consume a high and moderate variety of main meal dishes.
This finding supports our hypothesis and is consistent with Schafer, et al. (1999) who
provided clear evidence of the importance of family food interactions for the diet quality of
marital partners and Umberson (1992) who demonstrated that the transition from married to
unmarried status is associated with an increase in negative health behaviour. Furthermore,
Michels and Wolk (2002) showed that a lower variety of foods was associated with non-
marital status.
Education Class 3 exhibits a high protein but low red meat consumption pattern. People who
had higher level of education were more likely to be in this class for both age groups, which
is consistent with Worsley, et al. (2004) that university educated people were less likely to be
regular consumers of several meat products and Gossard and York’s (2003) finding that
education was inversely related to meat consumption. This finding supports our hypothesis.

15
BMI Among the younger group, people who had a lower BMI was more likely to consume
high protein but low red meat dishes for their main meals. The finding confirms that people
with lower body weight eat healthier foods and is consistent with Booth, et al., (2004). It may
also be related to the greater satiety provided by high protein meals (Noakes & Clifton,
2005). However, this relationship was not found among the older age group. With people
over 45 years, body weight may be also confounded by other physiological factors.
Children’s presence For both age groups, children’s presence in the household was strongly
associated with the class membership. Food preparers who had children at home were more
likely to consume high variety of meals for both age groups and moderate variety for the
younger age group. This supports our hypothesis and is supported by Laroche, et al. (2007)
that families with children consumed various types of foods than families without children.
This finding may be partly due to various forms of nutrition promotion over the years
recommended by the Dietary Guidelines for Children and Adolescents in Australia
(NHMRC, 2003b) as well as to the high value and prominence placed on children in
Australian society (Huntley, 2008).
Seasonal food knowledge Seasonal food knowledge was also a determinant of class
membership for both age groups. People who had confidence in seasonal food knowledge
were more likely to consume high variety of main meal dishes for both age groups, and to
consume moderate variety for the older age group. Food knowledge appears to be important
in food preparation and is associated with cooking skills and the ability to make meals from
fresh ingredients (Caraher, Dixon, Lang, & Carr-Hill, 1999; Fordyce-Voorham, 2010). The
finding is supported by the literature (Stead, et al., 2004; Wrieden, et al., 2007).
Seasonal food knowledge was also related to the consumption pattern of high protein but low
red meat among the younger group. Previous studies have shown that lack of confidence in
food preparation is one of the barriers to choosing healthy foods (Hughes, Bennett, &
Hetherington, 2004). The finding supports our hypothesis and is in line with Stead, et al.
(2004) and Wrieden, et al. (2007) that dietary quality would be improved by people’s food
knowledge and skills. It suggests that younger people with sufficient seasonal food
knowledge could make equally nutritious main meal dishes without using red meats.
However, the relationship between seasonal food knowledge and eating high protein but low

16
red meat was not found among the older age group. This may be due to the fact that older
people are generally more confident in using a wider range of knowledge and skills than their
younger counterparts (Caraher, et al., 1999).
Universalism For the older age group, people who held strong universalist values were more
likely to consume high variety of meal dishes. This may be because communitarian values
like universalism are positively related to dietary quality as universalists tend to show
concern for the welfare of members of their own in group including family (Worsley, Wang,
& Hunter, 2010). The finding supports our hypothesis.
As expected, older people who held strong universalist values were more likely to consume
high protein but low red meat dishes. The finding confirmed our hypothesis and is also
supported the studies of Worsley (2006), Lea (2001), and Worsley, Wahlqvist, Dalais, and
Savige (2002). However, the relationship was not shown within the younger population.
The LCA technique is capable of determining the number and composition of groups in
which participants are aggregated on the basis of their consumption of main meal dishes.
LCA would seem an optimal choice of analysis to capture dietary patterns. This study
suggests that LCA could be applied to a greater extent in behavioural nutrition. For example,
once individuals are classified into various classes of food intake patterns, the outcome
variables such as their health conditions may be predicted by their class memberships. In
particular, the high variety group appears likely to be associated with lower prevalence of
various diseases such as type 2 diabetes (Pan et al., 2011). In contrast, the EPIC (European
Prospective Investigation into Cancer and Nutrition) study suggests that consumption of high
protein but low red meat may be associated with better health outcomes (Davey et al., 2002).
LCA would provide one way of examining such effects of eating patterns.
Limitations:
The study showed that large percentages of participants were consumers of moderate variety
of main meal dishes. However, it should be noticed that a relatively large percentage of the
older group was in the low variety class, which raises the question of what other foods they
consumed in the past six months? The data were checked among the class 4 of the older
participants. The consumption of other meals that were not listed on the current analysis was
still low, ranging from 0 (fish pie) to 22% (meat soup). Therefore, these older adults’ diet

17
probably would not meet their nutritional needs. It underscores the requirement for health
education to improve older people’s current food intake behaviours.
Consumption of a high variety of foods is positively related to health (Kellett, Smith, &
Schmerlaib, 1998). However, the healthiness of the consumption patterns identified in the
current study needs to be investigated in a future study especially for class 1 and 2, which
included various meat dishes.
Other variables might be related to meal patterns such as timing, regularity, types of people
present, location, etc. (Holm, 2001). Within the older population, there may be other factors
(e.g., health condition, food accessibility) that affect their dietary patterns (Wilson,
Alexander, & Lumbers, 2004). Therefore, future studies need to examine these predictors that
are possible determinants of meal patterns in particular population.
In the present study, only one of the food knowledge and skill variables (i.e., seasonal food
knowledge) was found to be related to the class memberships for both groups. This may be
due to inadequate measurement of this set of the items. Future research requires the
development of psychometrically sound food knowledge and skill measures.
Implications:
The identification of classes of meal users should enable better communication of messages
to these groups. For example, people in the low variety class may need to be encouraged to
consume healthier dishes more often. Healthy eating messages could be tailored to improve
the meal patterns used by these groups. Future studies should also examine the consumption
patterns of breakfast, lunch, and snacks.
Moreover, the concept of meals may be useful for health communication because people may
find it easier to adopt by changing of meals rather than individual food.
Finally, among various predictors of class memberships, social psychological factors
including confidence in seasonal food knowledge and universalist values are more amenable
to change than people’s socioeconomic characteristics. These psychological determinants can
be communicated and moderated via health communication approaches.

18
Conclusion
LCA identified four major groups of consumers with different consumption patterns of main
meal dishes. These patterns were differentially associated mainly with gender, education,
marital status, children’s presence at home, confidence in seasonal food knowledge, and
univeralist values among younger and older food preparers.
Acknowledgements
The authors thank Ms Veronique Droulez, Nutrition Manage of MLA for her support and
encouragement, Ms Victoria Hodgeson (Clever Stuff Pty Ltd) who conducted the survey the
data were derived from, and MLA Pty Ltd for providing access to the data set.
References: Akaike, H. (1987). Factor analysis and AIC. Psychometrika, 52(3), 317-332. Ashima K, K. (2004). Dietary patterns and health outcomes. [doi:
10.1016/j.jada.2004.01.010]. Journal of the American Dietetic Association, 104(4), 615-635.
Bailey, R. L., Gutschall, M. D., Mitchell, D. C., Miller, C. K., Lawrence, F. R., & Smiciklas-Wright, H. (2006). Comparative strategies for using cluster analysis to assess dietary patterns. [doi: 10.1016/j.jada.2006.05.012]. Journal of the American Dietetic Association, 106(8), 1194-1200.
Beardsworth, A., Bryman, A., Keil, T., Goode, J., Haslam, C., & Lancashire, E. (2002). Women, men and food: The significance of gender for nutritional attitudes and choices British Food Journal, 104(7), 470-491.
Booth, D. A., Blair, A. J., Lewis, V. J., & Baek, S. H. (2004). Patterns of eating and movement that best maintain reduction in overweight. Appetite, 43(3), 277-283.
Brownie, S. (2006). Why are elderly individuals at risk of nutritional deficiency? International Journal of Nursing Practice, 12(2), 110-118. doi: 10.1111/j.1440-172X.2006.00557.x
Burke, V., Beilin, L. J., Dunbar, D., & Kevan, M. (2004). Changes in health-related behaviours and cardiovascular risk factors in young adults: associations with living with a partner. [doi: 10.1016/j.ypmed.2004.02.038]. Preventive Medicine, 39(4), 722-730.
Caraher, M., Dixon, P., Lang, T., & Carr-Hill, R. (1999). The state of cooking in England: the relationship of cooking skills to food choice. British Food Journal, 101(8), 590-609.
Davey, G. K., Spencer, E. A., Appleby, P. N., Allen, N. E., Knox, K. H., & Key, T. J. (2002). EPIC–Oxford:lifestyle characteristics and nutrient intakes in a cohort of 33 883 meat-eaters and 31 546 non meat-eaters in the UK. Public Health Nutrition, 6(3), 259-268.
Drewnowski, A. (2004). Obesity and the food environment: Dietary energy density and diet costs. American Journal of Preventive Medicine, 27(3, Supplement 1), 154-162.
Drewnowski, A., & Specter, S. (2004). Poverty and obesity: The role of energy density and energy costs. American Journal of Clinical Nutrition, 79(1), 6-16.
19
Flood, A., Rastogi, T., Wirfält, E., Mitrou, P. N., Reedy, J., Subar, A. F., . . . Schatzkin, A. (2008). Dietary patterns as identified by factor analysis and colorectal cancer among middle-aged Americans. The American Journal of Clinical Nutrition, 88(1), 176-184.
Fordyce-Voorham, S. (2010). Identification of essential food skills for skill-based healthful eating programs in secondary schools. Journal of Nutrition Education and Behavior, 43(2), 116-122.
Goodman, L. A. (1974). Exploratory latent structure analysis using both identifiable and unidentifiable models. Biometrika, 61(2), 215-231.
Gossard, M. H., & York, R. (2003). Social structural influences on meat consumption. [Article]. Human Ecology Review, 10(1), 1.
Guenther, P. M., Reedy, J., Krebs-Smith, S. M., & Reeve, B. B. (2008). Evaluation of the Healthy Eating Index-2005. [doi: 10.1016/j.jada.2008.08.011]. Journal of the American Dietetic Association, 108(11), 1854-1864.
Guthrie, J. F., Lin, B.-H., & Frazao, E. (2002). Role of Food Prepared Away from Home in the American Diet, 1977-78 versus 1994-96: Changes and Consequences. [Article]. Journal of Nutrition Education & Behavior, 34(3), 140.
Higgins, C., Duxbury, L., & Lee, C. (1994). Impact of life-cycle stage and gender on the ability to balance work and family responsibilities. Family Relations, 43(2), 144-150.
Holm, L. (2001). The social context of eating. In U. Kjaernes (Ed.), Eating patterns: A day in the lives of Nordic peoples (pp. 159-198). Lyasker, Norway: National Institute for Consumer Research.
Hughes, G., Bennett, K. M., & Hetherington, M. M. (2004). Old and alone: Barriers to healthy eating in older men living on their own. [doi: 10.1016/j.appet.2004.06.002]. Appetite, 43(3), 269-276.
Huntley, R. (2008). Eating between the lines: Food and equality in Australia. Melbourne: Black Inc.
Kellett, E., Smith, A., & Schmerlaib, Y. (1998). The Australian guide to healthy eating. Canberra: Commonwealth Department of Health and Family Services.
Kim, M. K., Sasaki, S., Otani, T., Tsugane, S., & for the Japan Public Health Center-based Prospective Study, G. (2005). Dietary patterns and subsequent colorectal cancer risk by subsite: A prospective cohort study. International Journal of Cancer, 115(5), 790-798. doi: 10.1002/ijc.20943
Lanza, S. T., Collins, L. M., Lemmon, D. R., & Schafer, J. L. (2007). PROC LCA: A SAS procedure for latent class analysis. Structural Equation Modeling, 14, 671-694.
Laroche, H. H., Hofer, T. P., & Davis, M. M. (2007). Adult fat intake associated with the presence of children in households: Findings from NHANES III. J Am Board Fam Med, 20(1), 9-15. doi: 10.3122/jabfm.2007.01.060085
Lea, E. (2001). Moving from meat: Vegetarianism, beliefs and information systems. PhD thesis, University of Adelaide, Adelaide.
Leveille, S. G., Wee, C. C., & Iezzoni, L. I. (2005). Trends in obesity and arthritis among baby boomers and their predecessors, 1971–2002. American Journal of Public Health, 95(9), 1607-1613. doi: 10.2105/ajph.2004.060418
Lo, Y., Mendell, N. R., & Rubin, D. B. (2001). Testing the number of components in a normal mixture. Biometrika, 88(3), 767-778. doi: 10.1093/biomet/88.3.767
Meat & Livestock Australia. (2009). Last night's dinner: What Australians prepared for dinner last night. North Sydney: MLA.
Meat & Livestock Australia. (2011). Main meal repertoires: How Australians plan, purchase and choose main meals. North Sydney: MLA.
20
Michels, K. B., & Wolk, A. (2002). A prospective study of variety of healthy foods and mortality in women. International Journal of Epidemiology, 31(4), 847-854. doi: 10.1093/ije/31.4.847
Moeller, S. M., Reedy, J., Millen, A. E., Dixon, L. B., Newby, P. K., Tucker, K. L., . . . Guenther, P. M. (2007). Dietary Patterns: Challenges and Opportunities in Dietary Patterns Research: An Experimental Biology Workshop, April 1, 2006. [doi: 10.1016/j.jada.2007.03.014]. Journal of the American Dietetic Association, 107(7), 1233-1239.
Muthén, L. K., & Muthén, B. O. (1998-2011). Mplus user's guide (Sixth Edition ed.). Los Angeles, CA: Muthén & Muthén. Available as a download at http://www.statmodel.com/ugexcerpts.shtml.
NHMRC. (2003a). Dietary guidelines for Australian adults. Canberra: National Health and Medical Research Council.
NHMRC. (2003b). Dietary guidelines for children and adolescents in Australia. Canberra: National Health and Medical Research Council.
Nkondjock, A., & Ghadirian, P. (2005). Associated nutritional risk of breast and colon cancers: a population-based case-control study in Montreal, Canada. [doi: 10.1016/j.canlet.2004.11.034]. Cancer Letters, 223(1), 85-91.
Noakes, M., & Clifton, P. (2005). The CSIRO Total Wellbeing Diet Set Melbourne: Penguin. Padmadas, S. S., Dias, J. G., & Willekens, F. J. (2006). Disentangling women's responses on
complex dietary intake patterns from an Indian cross-sectional survey: a latent class analysis. Public Health Nutrition, 9(2), 204-204-211. doi: 10.1079/phn2005842
Pan, A., Sun, Q., Bernstein, A. M., Schulze, M. B., Manson, J. E., Willett, W. C., & Hu, F. B. (2011). Red meat consumption and risk of type 2 diabetes: 3 cohorts of US adults and an updated meta-analysis. The American Journal of Clinical Nutrition, 94(4), 1088-1096.
Ramaswamy, V., Desarbo, W. S., Reibstein, D. J., & Robinson, W. T. (1993). An empirical pooling approach for estimating marketing mix elasticities with PIMS data. Marketing Science, 12(1), 103-124. doi: 10.1287/mksc.12.1.103
Roberts, S. B., Hajduk, C. L., Howarth, N. C., Russell, R., & McCrory, M. A. (2005). Dietary variety predicts low Body Mass Index and inadequate macronutrient and micronutrientIntakes in community-dwelling older adults. Journals of Gerontology Series A: Biological Sciences and Medical Sciences, 60(5), 613-621.
Savige, G. S. (2002). Can food variety add years to your life? Asia Pacific Journal Of Clinical Nutrition, 11 Suppl 3, S637-641.
Schafer, R. B., Schafer, E., Dunbar, M., & Keith, P. M. (1999). Marital food interaction and dietary behavior. Social Science & Medicine, 48(6), 787-796.
Schwartz, S. H. (1992). Universals in the content and structure of values: Theoretical advances and empirical tests in 20 countries. In M. P. Zanna (Ed.), Advances in experimental social psychology (Vol. 25, pp. 1-65). San Diego, CA: Academic Press.
Schwarz, G. (1978). Estimating the dimension of a model. The Annals of Statistics, 6(2), 461-464.
Sclove, S. (1987). Application of model-selection criteria to some problems in multivariate analysis. Psychometrika, 52(3), 333-343.
Skrabski, Á., Kopp, M., & Kawachi, I. (2003). Social capital in a changing society: cross sectional associations with middle aged female and male mortality rates. Journal of Epidemiology and Community Health, 57(2), 114-119. doi: 10.1136/jech.57.2.114
Slattery, M., & Potter, J. (2002). Physical activity and colon cancer: Confounding or interaction? Medicine & Science in Sports & Exercise, 34(6), 913-919.
21
Stead, M., Caraher, M., & Anderson, A. (2004). Confident, fearful and hopeless cooks: Findings from the development of a food-skills initiative. British food journal., 106(4), 274-287.
Thiele, S., Mensink, G. B. M., & Beitz, R. (2004). Determinants of diet quality. Public Health Nutrition, 7(01), 29-37. doi: doi:10.1079/PHN2003516
Trichopoulou, A., Costacou, T., Bamia, C., & Trichopoulos, D. (2003). Adherence to a mediterranean diet and survival in a Greek population. The New England Journal of Medicine, 348(26), 2599-2608. Turrell, G., Hewitt, B., Patterson, C., Oldenburg, B., & Gould, T. (2002). Socioeconomic differences in food purchasing behaviour and suggested implications for diet-related health promotion. Journal of Human Nutrition & Dietetics, 15(5), 355-364. Umberson, D. (1992). Gender, marital status and the social control of health behavior. Social Science & Medicine, 34(8), 907-917. Venn, A. J., Thomson, R. J., Schmidt, M. D., Cleland, V. J., Curry, B. A., Gennat, H. C., & Dwyer, T. (2007). Overweight and obesity from childhood to adulthood: A follow-up of participants in the 1985 Australian Schools Health and Fitness Survey. The Medical Journal of Australia, 186(9), 458-460. Wilson, L. C., Alexander, A., & Lumbers, M. (2004). Food access and dietary variety among older people. [Article]. International Journal of Retail & Distribution Management, 32(2), 109-122. Worsley, A. (2006). Lay people's views of school food policy options: Associations with confidence, personal values and demographics. Health Education Research, 21(6), 848-861. doi: 10.1093/her/cyl138 Worsley, A., Blasche, R., Ball, K., & Crawford, D. (2003). Income differences in food consumption in the 1995 Australian National Nutrition Survey. European Journal of Clinical Nutrition, 57, 1198-1211. Worsley, A., Blasche, R., Ball, K., & Crawford, D. (2004). The relationship between education and food consumption in the 1995 Australian National Nutrition Survey. Public Health Nutrition, 7(5), 649-663. Worsley, A., & Scott, V. (2000). Consumers' concerns about food and health in Australia and New Zealand. Asia Pacific Journal of Clinical Nutrition, 9(1), 24-32. Worsley, A., Wahlqvist, M. L., Dalais, F. S., & Savige, G. S. (2002). Characteristics of soy bread users and their beliefs about soy products. Asia Pacific Journal of Clinical Nutrition, 11(1), 51-55. Worsley, A., Wang, W. C., & Hunter, W. (2010). Baby boomers' food shopping habits. Relationships with demographics and personal values. Appetite, 55(3), 466-472. Wrieden, W. L., Anderson, A. S., Longbottom, P. J., Valentine, K., Stead, M., Caraher, M., . . . Dowler, E. (2007). The impact of a community-based food skills intervention on cooking confidence, food preparation methods and dietary choices – an exploratory trial. Public Health Nutrition, 10(02), 203-211. doi: doi:10.1017/S1368980007246658 Yang, C. C. (1998). Finite mixture model selection with psychometrics applications. PhD, University of Califormia, Los Angeles, CA.

22
Table 1 Personal background characteristics across age groups Demographics 44 yrs &
younger (n = 635)
45 yrs & older
(n = 441)
Total
(n = 1076) Gender (%) Female 53.7 57.6 55.3 Income (%) ≤ $50k pa
$50-$100k pa ≥ $100k pa
32.9 35.4 31.7
44.2 27.9 27.9
37.5 32.3 30.1
Marital status (%) Single/divorced/widowed Married/defacto
38.7 60.8
36.7 63.0
37.9 61.7
Education (%) Year 12 & less TAFE Tertiary
27.9 24.4 47.2
45.4 28.6 26.1
35.0 26.1 38.6
BMI (kg/m2)
Mean SD
26.92 7.86
30.82 10.79
28.52 9.37
Children’s presence (%) Yes 52.4 40.4 47.5 Seasonal food knowledge (%)
Confident 84.8 91.4 87.5
Universalism (scale score)
Mean SD
2.85 .72
2.94 .67
2.89 .70
Note: SD = standard deviation
23
Table 2 Prevalence of red meat and vegetable dishes across age groups Dishes No. (%) of Respondents
44 yrs & younger (n = 635)
45 yrs & older (n = 441)
Total (n = 1076)
1. Meat/Fish-Chicken breast fillet 480 (75.6) 344 (78.0) 824 (76.6) 2. Pasta-Spaghetti Bolognaise 476 (75.0) 339 (76.9) 815 (75.7) 3. Meat/Fish-Steak 461 (72.6) 340 (77.1) 801 (74.4) 4. Sausages-Beef 452 (71.2) 328 (74.4) 780 (72.5) 5. Sandwich/wrap-Sandwich 442 (69.6) 312 (70.7) 754 (70.1) 6. Casserole/stew-Beef 392 (61.7) 323 (73.2) 715 (66.4) 7. Eggs-Fried eggs 392 (61.7) 311 (70.5) 703 (65.3) 8. Stir Fry-Chicken 402 (63.3) 249 (56.5) 651 (60.5) 9. Eggs-Scrambled eggs 394 (62.0) 256 (58.0) 650 (60.4) 10. Meat/Fish-Fish (fillet or whole) 369 (58.1) 273 (61.9) 642 (59.7) 11. Pizza-Meat/seafood pizza 413 (65.0) 216 (49.0) 629 (58.5) 12. Crumbed or battered meat/fish-Chicken schnitzel
392 (61.7) 236 (53.5) 628 (58.4)
13. Roast-Chicken 349 (55.0) 265 (60.1) 614 (57.1) 14. Soup-Vegetable soup 320 (50.4) 273 (61.9) 593 (55.1) 15. Burgers-Beef burger 367 (57.8) 208 (47.2) 575 (53.4) 16. Meat/Fish-Lamb chops 312 (49.1) 261 (59.2) 573 (53.3) 17. Curry-Chicken 365 (57.5) 200 (45.4) 565 (52.5) 18. Pasta-Lasagne 350 (55.1) 214 (48.5) 564 (52.4) 19. Roast-Lamb 291 (45.8) 263 (59.6) 554 (51.5) 20. Rice dishes-Fried rice 343 (54.0) 202 (45.4) 545 (50.7) 21. Stir Fry-Beef 333 (52.4) 200 (45.4) 533 (49.5) 22. Noodles-2 minute noodles 351 (55.3) 179 (40.6) 530 (49.3) 23. Eggs-Omelette 299 (47.1) 219 (49.7) 518 (48.1) 24. Mince meat dishes-Rissoles 272 (42.8) 228 (51.7) 500 (46.5) 25. Roast-Beef 287 (45.2) 213 (48.3) 500 (46.5) 26. Casserole/stew-Chicken 267 (42.0) 221 (50.1) 488 (45.4) 27. Pie-Beef 283 (44.6) 201 (45.6) 484 (45.0) 28. Salad-Vegetarian salad 299 (47.1) 167 (37.9) 466 (43.3) 29. Crumbed or battered meat/fish-Crumbed/battered fish
272 (42.8) 189 (42.9) 461 (42.8)
30. Mexican–burritos, tacos, nachos - Beef 308 (48.5) 151 (34.2) 459 (42.7) 31. Meat/Fish-Pork chops 241 (38.0) 213 (48.3) 454 (42.2) 32. Mince meat dishes-Meatballs 276 (43.5) 152 (34.5) 428 (39.8) 33. Sandwich/wrap-Wrap 277 (43.6) 137 (31.1) 414 (38.5)

24

25
Table 3 Criterion to assess model fit for age group specific LCA models with covariates 44 yrs & younger 45 yrs & older Number of classes 2 class 3 class 4 class 2 class 3 class 4 class Loglikelihood -12764.396 -12446.920 -12256.373 -8741.926 -8580.073 -8487.580 # of parameters 75 117 159 75 117 159 AIC 25678.792 25127.841 24830.746 17633.852 17394.146 17293.161 BIC 26012.459 25648.361 25538.120 17940.360 17872.289 17942.958 aBIC 25774.342 25276.898 25033.311 17702.346 17500.997 17438.368 LMR p-value 0.0000 0.0000 0.1322 0.0000 0.0072 0.6583 Entropy 0.872 0.888 0.895 0.877 0.841 0.849 Note: AIC=Akaike information criterion, BIC=Bayesian information criterion, aBIC=sample size adjusted Bayesian information criterion
26
Table 4 Latent class models with covariates across age groups - probability of latent class membership and item response probabilities within each of the four classes 44 yrs & younger 45 yrs & older Class1:
high variety
Class2: moderate variety
Class3: high protein low meat
Class4: low variety
Class1: high variety
Class2: moderate variety
Class3: high protein low meat
Class4: low variety
Probability of latent class membership 36.5% 42.1% 12.2%
9.2%
20.7% 39.9% 14.8% 22.6%
1. Meat/Fish-Chicken breast fillet 0.935 0.765 0.625 0.213 0.968 0.806 0.796 0.457 2. Pasta-Spaghetti Bolognaise 0.947 0.808 0.330 0.242 1.000 0.860 0.669 0.437 3. Meat/Fish-Steak 0.905 0.794 0.289 0.287 1.000 0.786 0.679 0.572 4. Sausages-Beef 0.916 0.787 0.130 0.309 0.916 0.827 0.547 0.549 5. Sandwich/wrap-Sandwich 0.910 0.577 0.700 0.389 0.946 0.726 0.628 0.483 6. Casserole/stew-Beef 0.853 0.628 0.179 0.211 0.955 0.828 0.590 0.430 7. Eggs-Fried eggs 0.808 0.511 0.709 0.205 0.937 0.745 0.503 0.533 8. Stir Fry-Chicken 0.898 0.539 0.604 0.028 0.889 0.616 0.571 0.149 9. Eggs-Scrambled eggs 0.849 0.514 0.552 0.272 0.811 0.633 0.519 0.292 10. Meat/Fish-Fish (fillet or whole) 0.798 0.494 0.587 0.127 0.855 0.615 0.798 0.267 11. Pizza-Meat/seafood pizza 0.904 0.623 0.356 0.142 0.852 0.584 0.158 0.181 12. Crumbed or battered meat/fish-Chicken schnitzel 0.853 0.575 0.351 0.209 0.822 0.542 0.341 0.367 13. Roast-Chicken 0.737 0.495 0.535 0.070 0.873 0.666 0.483 0.286 14. Soup-Vegetable soup 0.679 0.395 0.644 0.114 0.856 0.594 0.833 0.291 15. Burgers-Beef burger 0.849 0.574 0.129 0.124 0.839 0.571 0.152 0.130 16. Meat/Fish-Lamb chops 0.640 0.515 0.257 0.093 0.848 0.643 0.499 0.311 17. Curry-Chicken 0.777 0.470 0.634 0.171 0.726 0.382 0.679 0.153 18. Pasta-Lasagne 0.853 0.481 0.278 0.009 0.848 0.496 0.424 0.147 19. Roast-Lamb 0.635 0.452 0.187 0.148 0.820 0.625 0.573 0.332 20. Rice dishes-Fried rice 0.767 0.378 0.702 0.179 0.746 0.562 0.197 0.151 21. Stir Fry-Beef 0.828 0.467 0.159 0.073 0.763 0.561 0.255 0.078 22. Noodles-2 minute noodles 0.713 0.465 0.616 0.213 0.659 0.457 0.240 0.174 23. Eggs-Omelette 0.659 0.314 0.685 0.149 0.751 0.547 0.521 0.141 24. Mince meat dishes-Rissoles 0.656 0.406 0.065 0.111 0.750 0.605 0.284 0.275 25. Roast-Beef 0.709 0.423 0.034 0.102 0.741 0.546 0.339 0.201 26. Casserole/stew-Chicken 0.633 0.285 0.442 0.174 0.734 0.466 0.525 0.317 27. Pie-Beef 0.710 0.376 0.125 0.126 0.687 0.560 0.114 0.258 28. Salad-Vegetarian salad 0.655 0.298 0.757 0.190 0.604 0.281 0.685 0.129 29. Crumbed or battered meat/fish-Crumbed/battered fish 0.657 0.340 0.289 0.094 0.686 0.467 0.309 0.184 30. Mexican–burritos, tacos, nachos - Beef 0.775 0.458 0.066 0.000 0.661 0.350 0.309 0.023 31. Meat/Fish-Pork chops 0.580 0.319 0.177 0.130 0.751 0.504 0.366 0.249 32. Mince meat dishes-Meatballs 0.707 0.329 0.300 0.000 0.584 0.381 0.337 0.047 33. Sandwich/wrap-Wrap 0.681 0.275 0.538 0.054 0.705 0.252 0.305 0.015

27
Table 5 Estimated odds ratio and 95% confidence interval between dietary classes with covariates for age groups Contrast of latent classes
44 yrs & younger 45 yrs & older class1 vs. class4 class2 vs. class4 Class3 vs. class4 class1 vs. class4 Class2 vs. class4 Class3 vs. class4 OR 95%CI OR 95%CI OR 95%CI OR 95%CI OR 95%CI OR 95%CI
gender 2.469* 1.02, 5.98 2.86** 1.28, 6.37 2.14 0.68, 6.69 1.61 0.68, 3.82 0.75 0.31, 1.85 5.68 0.38, 85.06 income 1.45 0.92, 2.29 1.28 0.80, 2.05 1.06 0.65, 1.74 1.12 0.83, 1.51 0.95 0.74, 1.23 1.26 0.71, 2.22 marital status 1.03 0.20, 5.16 0.69 0.13, 3.75 0.79 0.11, 5.54 5.40** 1.99, 14.68 3.71** 1.72, 8.03 2.90 0.59, 14.23 education 1.24 0.88, 1.74 1.17 0.84, 1.64 2.43** 1.65, 3.59 1.18 0.85, 1.65 1.15 0.78, 1.69 2.80* 1.02, 7.73 BMI 0.99 0.95, 1.04 0.98 0.93, 1.03 0.91* 0.83, 1.00 1.03 0.99, 1.07 1.02 0.98, 1.06 1.03 0.96, 1.10 children’s presence
10.17** 2.21, 46.86 8.29** 1.90, 36.09 4.83 0.70, 33.17 3.27* 1.26, 8.54 1.83 0.78, 4.30 0.73 0.15, 3.42
seasonal food knowledge
2.70* 1.18, 6.17 2.09 0.88, 4.97 2.75** 1.32, 5.75 2.74** 1.41, 5.32 1.88* 1.06, 3.35 1.59 0.37, 6.80
universalism 1.11 0.64, 1.92 0.96 0.55, 1.67 1.17 0.62, 2.23 2.88** 1.30, 6.37 1.92 0.95, 3.90 6.14** 1.87, 20.17 Note: BMI=Body Mass Index; class1=high variety, class2=moderate variety, class3= high protein low meat, class4=low variety. *p < .05; ** p < .01 for the multinomial logistic latent class regression weights.
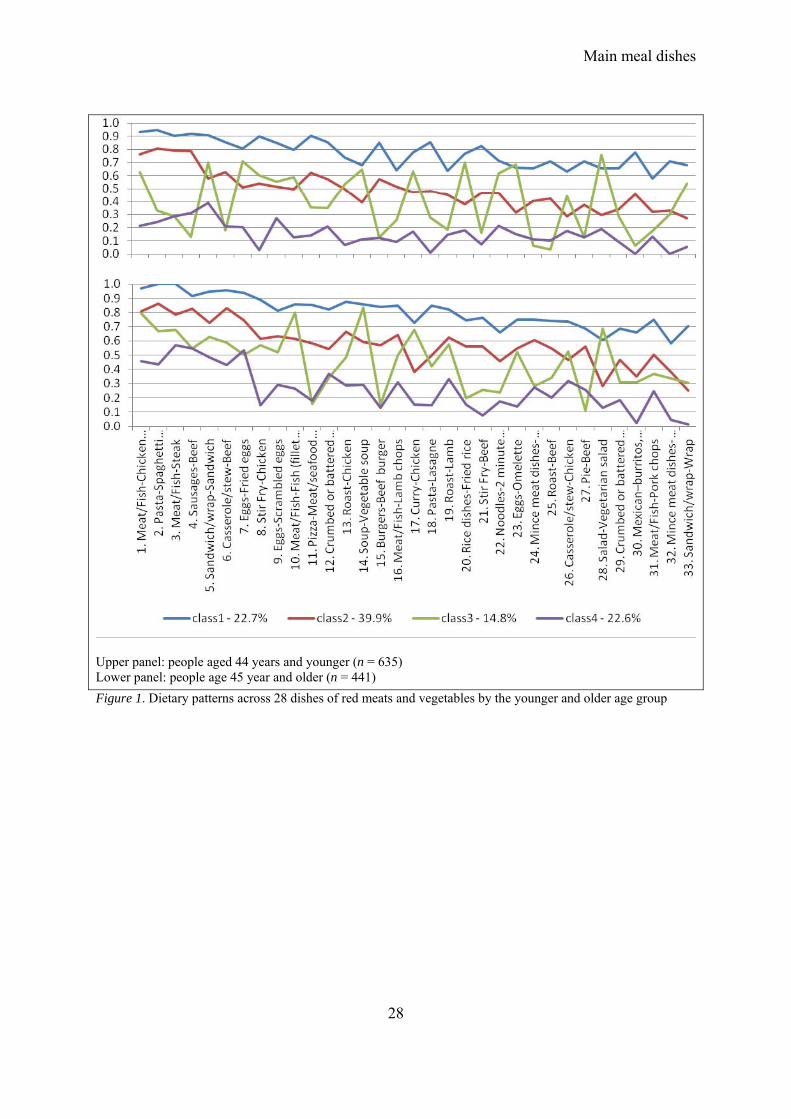
Main meal dishes
28
Upper panel: people aged 44 years and younger (n = 635) Lower panel: people age 45 year and older (n = 441)
Figure 1. Dietary patterns across 28 dishes of red meats and vegetables by the younger and older age group