2013 specialist meeting advancing the spatially enabled...
TRANSCRIPT

2013 Specialist Meeting—Advancing the Spatially Enabled Smart Campus Abernathy—1
Advancing the Spatially Enabled Smart Campus
DAVID ABERNATHY
Chair, Department of Global Studies Director of Educational Technology
Warren Wilson College Email: [email protected]
he trial separation of bits and atoms is over.” So says William J. Mitchell in his book
Me++: The Cyborg Self and the Networked City. What’s more, these bits and atoms are
increasingly interconnected, as everything from cell phones to cars to sensor swarms are
increasingly able to communicate with each other. These twin themes—the blurring of bits and
atoms and the rapid growth of communication networks—are the underlying focus for a
freshman seminar I will begin teaching next week: #Cyborg_Geographies: Hybrid Places, Networked Natures and the Emerging Internet of Things. In the class, students will engage with
literature on sensor networks, the emerging “programmable world,” social media, P2P, and the
fundamental reconfigurations of geography that are shifting under our feet. From smart cities to
big data, from wikileaks to drone warfare, from swarm intelligence to the singularity, and from
Twitter to Tahrir Square, the class will grapple with the ways in which our past conceptions of
space and place are inadequate for fully grasping the new spatiality of our contemporary age.
I have taught courses on geographic information systems at Warren Wilson College since
2003. In May of 2005, I was struck by an article in the New York Times titled “A Web of Sensors:
Taking Earth’s Pulse.” The idea of sensor networks as a sort of “macroscope” that could
measure the previously unmeasureable resonated with me. I immediately set out to discover
ways in which sensor network data might help us map data that previously had not been
mapped. In 2006, I co-wrote a grant application with the Director of an NGO in Panama who was
managing a 1000-acre nature reserve there. We received a grant of $100,000 to build a
comprehensive GIS database for the nature reserve and to conduct research on the feasibility of
setting up a wireless sensor network to collect data on temperature, humidity and
photosynthetically active radiation around the main research station at the reserve. Soon after, in
2007, I came across the Sun SPOT (Small, Programmable Object Technology) from Sun
Microsystems. Sun granted us approximately $3,000 worth of Sun Spot motes and base stations
to experiment with as the Panama project moved forward. At the time, we were the only small
liberal arts school receiving such a grant from Sun.
The project energized a handful of my students at a level I had not previously seen at my
institution. They stayed up late in the lab, learning the necessary java to make the Sun SPOTs
communicate, to run on solar power, to take sensor readings, to record those readings in a
database, and to visualize those readings on web mapping platforms such as Google Earth. One
student earned a paid internship at Sun’s headquarters in Silicon Valley to continue research on
Sun SPOT sensor networks. The same student then traveled to Panama with me to test out the
feasibility of operating the technology in the harsh conditions of a tropical rainforest.
“T

2013 Specialist Meeting—Advancing the Spatially Enabled Smart Campus Abernathy—2
We ran into many challenges in Panama, but we were able to successfully send sensor data
from the reserve via satellite back to Sun. We turned much of our energy and attention to
powering the sensors with solar panels, distributing motes in such a way that data would
successfully hope across the network despite the dense foilage, and (most difficult) keeping
insects and water out of the Sun SPOTs. The complications of keeping the network in deep
sleep, waking synchronously, and collecting data proved to be difficult, particularly when some
of the motes would inevitably be fried by water and/or ants. We turned to using Hobo
dataloggers instead, as they were completely water and bug proof. But overall the project was
useful and successful, as it launched the career of one student and gave us valuable information
on how we might further proceed in research along these lines. Current Interest in Smart Campus Technology at Warren Wilson College The Panama project has ended, but my interest in sensor networks continues. I am currently
working on using Arduino microcontrollers, SD card data loggers, sensors and Xbee radios to
create low-cost sensor network nodes. I am also working with a small quadcopter drone with
attached camera to collect frequent high-resolution aerial imagery of our campus. Two initiatives,
in particular, are driving my current interest in the collection, analysis and visualization of sensor
network data. I. Sensor Network Data for Sustainability
Sustainability is one of the core values embedded in the mission of Warren Wilson College.
Recently ranked fourth in Sierra’s “Top Ten Coolest Schools” for its commitment to sustainability,
Warren Wilson College is home to a working farm, forest and organic garden. Environmental
Studies is our top major, and the College’s EcoDorm has been featured in the New York Times.
As the only liberal arts college in the nation with a national student body and an integrated work
and service program required for all students, Warren Wilson College promotes a unique Triad
education program.
Our current work on Arduino-based sensor networks focuses on the collection of data on our
campus farm. It is hoped that by collecting data on soil moisture, temperature, humidity and
more we can better manage the resources going into running a working farm. In addition to the
potential benefits to our sustainability efforts, this work provides excellent educational
opportunities for students wanting to integrate their academic work in GIS and computer
science with the very physical work of managing our campus farm and forest. II. Smart Structures—Embedding Sensor Networks in a New Academic Building
Our College is currently raising funds to build a state-of-the-art academic building for the Social
Sciences. This building will be the new home for our geospatial technology laboratory and will
serve as a showcase for cutting-edge technology on our campus. As such, I am proposing that
we strive to create as “smart” a building as possible by embedding sensors throughout the
structure and by integrating the building with its surrounding environment (including the campus
farm mentioned above).

2013 Specialist Meeting—Advancing the Spatially Enabled Smart Campus Abernathy—3
Our campus was one of the charter signatories on the Presidential Climate Commitment,
and we have long been dedicated to reducing our carbon footprint. The new academic building
can serve as a model for demonstrating how sensor technologies can assist in this effort. It will
also serve as our campus “dashboard” for other sensors on campus, allowing us to actively
embed sensor data collection, analysis and visualization into our academics. Further, the data
collected by such networks will provide us with new avenues of analysis, as we are forced to find
ways to manage big data with cloud computing and analysis tools like Hadoop.
While some may overlook the small liberal arts college when considering research on sensor
networks and spatially enabled smart campuses, it seems that the interdisciplinarity, creativity
and critical thinking that a liberal arts college provides could contribute to advancing such work.
Warren Wilson’s commitment to sustainability, its integrated work and service programs, and its
living laboratories of farm and forest make it an excellent place for experimenting with the
emerging technologies of sensor networks. I sincerely hope to be able to participate in your
specialist meeting in order to further the research being done on this front in general, and to
further the specific projects on my home campus.

2013 Specialist Meeting—Advancing the Spatially Enabled Smart Campus Ahearn—4
Advancing the Spatially Enabled Smart Campus
SEAN AHEARN
Department of Geography, Hunter College The Doctoral Program in Earth and Environmental Sciences,
City University of New York Director, Center for Advanced Research of Spatial Information
Email: [email protected]
Topic 1: Course articulation and curriculum pathways: a knowledge-based solution. his discussion will examine the potential of using an ontology/domain knowledge base with
a service-oriented architecture to better understand similarities and difference among
courses (Figure 1 & also see www.gistbok.org). It could be used for assessment of single courses
content or as an assessment tool for course articulation. Also discuss is the possibility of a
concept-based approach to selecting a curriculum pathway.
Figure 1: Comparison of an Intro GIS Course (Trending Dark Blue) and an Advanced GIS Course (trending Dark Red). Overlap is greatest for Data Manipulation (Tan). Analysis uses a Topic Model service and a visualization application to “project” each course onto the GIS&T BoK.
Topic 2: Spatially enabling research across the campus.
This discussion is focused on enabling the University research community to engage in
interdisciplinary geo-spatial research. To accomplish this one needs: (1) a common problem domain that necessitates interdisciplinary research and collaboration, (2) an ontology that
enables the community to “forge a common language” in a diverse and data-rich environment
T

2013 Specialist Meeting—Advancing the Spatially Enabled Smart Campus Ahearn—5
and (3) a computational framework that fosters sharing, integration and synthesis of data for
modeling, simulation and visualization of the problem domain.
The idea is to create a geographic and ontological nexus on which to build an
interdisciplinary research community across the campus. The new framework will align the
ontologies that span the different disciplines and use geography as the unifying platform on
which the disciplines will interact. Its common domain will be the multiple spatial and temporal
scales over which human activity occurs in the urban environment. “Organic” spatial units like a
neighborhood, which can act as integrators for social welfare, quality of life, education, health
and economics will be one of the scales of analysis of this approach.
The basis for this approach relates to the increase in the volume, velocity and variety of data
that is now available to the social and behavioral science domains, much of which is geographic.
This new data rich environment can be exploited by new methodologies of analysis and
computing and new tools for structuring knowledge. However, to date, this transformation of
approaches afforded by these new data and tools has yet to occur in the social and behavioral
sciences. What these disciplines share is a common geography for their analysis, what they don't
share is a common language. This has resulted in fragmentation of geographic data sets and
analytic approaches, and a loss of synergism among the discipline.
To resolve these problems two things are needed: (1) an ontological approach to knowledge
organization that bridges the conceptual framework of the different disciplines of social and
behavioral sciences and (2) the utilization of geospatial technologies to create a common
platform around which data sharing, modeling and analysis can occur. Some research questions
that could be addressed include: Data richness/big data: enablers of new approaches to domain research
What is a neighborhood and how does place act as a mediator for social welfare, quality of life, education, health and economics?
Can an “organic” delineation of a neighborhood be uncovered using an n-dimensional space of socio-economic data, education test scores, 311 complaint data …etc. and how do these definitions compare with “named” neighborhoods? Can this analysis also applied to higher level scales such as communities?
Ontology: interoperability between different scientific communities: how can we make sure the experts,
each speaking the language of their respective community, understand each other (and each other's datasets) correctly?
unexpected (re-) use of data: how can we propose new ways of combining and analyzing different datasets from our pool?
Geography and Geospatial system architecture: How do scientists in the social and behavioral domains think about the spatial/temporal
aspects of their problems? What is the optimal design for the geospatial platform for enabling data-intensive collaboration
among scientists in the social and behavioral domains? Can we create a network of research centers that share data and methodology and which
fosters interdisciplinary research?

2013 Specialist Meeting—Advancing the Spatially Enabled Smart Campus Ahearn—6
Could this network also enable cross comparisons of different geographic regions with regard
to the multiple spatial and temporal scales over which human activity occurs in the urban environment?
The goal is to create key elements of a framework for interdisciplinary research in the social
and behavioral sciences through an ontology that bridges the communication between these
domain sciences, a geospatial platform that create a common environment for data analysis,
visualization and modeling, and the examination of these approaches in the context of a
common shared problem domain, the urban environment and the issues of social welfare,
quality of life, education, health and economics.
A pilot study “Spatial Laboratory for long term neighborhood research and community
engagement” in New York, is underway that focuses on East Harlem. It will be used as an
example of how this system might be configured (http://www.carsilab.org/spatial_lab/). The
structure utilizes ArcGIS.com for organization of its spatial data.

2013 Specialist Meeting—Advancing the Spatially Enabled Smart Campus Conner—7
Perspective on Advancing the Spatially Enabled
Smart Campus
STEVE CONNER Senior Planner, Office of Campus Planning and Design
University of California, Santa Barbara Email: [email protected]
niversity campuses are a perfect environment for experimenting with new technologies that
enable people to navigate, manage assets/facilities, and perform cohesive research on a
variety of subjects. The new technologies tend to revolve around smart phones and applications
that provide various uses. In general, university populations contain technologically-savvy users
who are willing to push the boundaries on experimentation with data and smart phone
applications. The self-contained nature of the university provides many common themes that
participants in a smart campus can focus on.
In my workplace, there is typically abundant need for development of smart campus data and
applications, but precious little time and resources to devote to projects that aren’t specifically
related to capital development. As support for sustainable development increases among campus
administrators, information/communication, volunteered geographic information, and sensor
network technologies will become an important part of capital projects. A mechanism for
integrating those components into the design development process must be supported by upper-
level administrators, even if the cost may seem intangible to individual projects.
I would like to participate in this specialist meeting because I think it might help me assemble
the justification for integrating innovative smart campus technologies into our workflow at the
university. In particular, I think the sharing of best practices and existing examples might be helpful
for my understanding of what is possible at my workplace.
I appreciate your time and consideration, and I look forward to learning and sharing at this
meeting.
U

Environmental
Social Financial
Growing a Smart Campus: Spatial Sustainability and the Living Learning Laboratory
John Cook
Advancing n. from Advance v. -- to promote or help the progress, success, or completion of (something)1
When the verb advance crosses the page, the initial thought is a pushing forward in a unilateral direction. Progress or moving out front immediately comes to mind. But when we discuss sustainability in a post 350 ppm era, we might perceive advancing differently; not as an outward unidirectional movement, but as a coming together of what some consider to be disparate movements/disciplines into a state of being rather than a progression. Even the very capable, but somewhat ambiguous definition of sustainable development, put forward by the Brundtalnd
Commission in 1987, recognized that society may not keep advancing if it jeopardizes futures societies’ success. 2 What significantly is lacking from earlier definitions of sustainability is the ecosystem as organizing principle. So Advancing the Spatially Enabled Smart Campus might be read not as pushing forward an agenda or technological progress, but rather, harnessing scattered incidents into actionable moments that help to bring balance to the campus ecosystem.
Sustainability often falters on campuses, as it does in society, because it is implemented in a linear departmentalized sequencing rather than relying on its methodological foundation in systems thinking. What is often perceived as independent administrative and operational actions and procedures on a campus in support of its greater mission, are really interconnected practices that can inform and be informed by the academic endeavors of the institution, when realized as part of the greater system of research, education and community engagement. For example, a green office certification that invites various business units across the campus to evaluate their use of personal and campus resources in providing service to the university expands the dialogue between faculty, staff, student and community as participants begin to better understand their common relationship with the campus. The contact points of engagement are made more apparent through the self-examination and analysis generated from the green office certification. For instance a switch from printed hand-outs to providing QR codes for linking to online versions of documents at orientation for one department fostered greater dialogue between staff and students during orientation. The novelty of the QR codes and the slight increase of activity between the student and staff member took the passive act of picking up a packet of papers to actual discussions. Once the student accessed the online data another space opened up where the dialogue could continue between staff and students. Environmental Sustainability, conserving paper,
1 "advancing, n.". OED Online. September 2013. Oxford University Press. 5 November 2013 <http://www.oed.com/view/Entry/2889?rskey=4Bq8nh&result=1>. 2 The oft cited definition of Sustainability from the UN Report of the World Commission on Environment and Development: Our Common Future from 1987.
Sustainability: “meet[ing] the needs of the present generation without compromising the ability of future generations to meet their own needs.”
Laboratory: Place for Labor or Work – a building set apart for scientific
experiments
Community
Research
Education
Operations
ink and energy by replacing hard copy handouts with a hyperlink led to an enhanced social engagement that further extended the participants recognition of the staff’s role in fulfilling the academic mission of the university. The metrics generated from the “greening” of the department then becomes data for student and faculty research providing another feedback loop that further illuminates the staff’s role in the campuses ecosystem.
With multiple feedback loops, nodes of input and porous disciplinary boundaries systems thinking challenges the silo mentality of traditional academic, operational and social units at the institution. When Thinking in Systems, one thrives on the ebb and flow of data points in a continual process of adaptation and resilience. The Spatially Enabled Smart Campus provides one mechanism through which sustainability can map its organic transformation onto a campus.
One model of a campus being “smart” is the Living Learning Laboratory.
The Living Learning Laboratory is space, place and time sensitive. Academic institutions have begun to recognize the advantages of using their campus as both locus and locale for advancing and sustaining the mission of the university. The campus, through the Living Learning Laboratory, enables research and learning that benefits all participants in an immediate and visible manner. The lab, classroom or lecture hall is exposed to the larger boundaries of the campus through direct engagement. In this space, a greater potential for seepage of knowledge exists, allowing for an immediacy of dissemination. A knowledge that is no longer immune to the community in which it was generated.
An enabled smart campus could accelerate the spread of knowledge generated on and through the campus while facilitating the feedback responses required for all ecosystems to thrive. Case in point was a project facilitated through the Office of Sustainability that brought together undergraduate engineering students and campus Fleet operations to develop a reusable, drain filter made from recycled materials for a senior design project. The filter included a sensor that indicated when the filter needed to be changed thus eliminating the manual checking of the filter and reducing potential of run-off contamination. The project was selected for an award by the EPA and is currently being developed for commercialization.
Further, in conjunction with the Living Learning Laboratory pedagogy, a Spatially Enable Smart Campus could extend the learning/research domain of the institution well beyond the confines of the formal academic structures of class/lab, journal and conference. The spatially enabled smart campus affords more opportunities for bits of knowledge to coalesce into organized data sets, artifacts if you will, that build a narrative for the campus. As these narratives weave together with existing metrics, they form an archeology of activity. As layers are added depth is added to breadth; our knowledge and application grow wider and deeper simultaneously. This can take shape in the form of consumption patterns of water and energy that denote shifts in research patterns. Or through recycling and compost bins that provide feedback on consumption patterns or direct users to information on campus metrics or resources on the value and end use of recycling. Or art exhibits that celebrate beauty while tracing the campuses history and directing its future engagement with the community.

2013 Specialist Meeting—Advancing the Spatially Enabled Smart Campus Cowen—10
What is a Spatial University
DAVID J. COWEN
Distinguished Professor Emeritus Former Chair, Department of Geography
University of South Carolina Email: [email protected]
n the past couple of years considerable interest has emerged about universities that foster a
comprehensive approach to spatial teaching, research, services and infrastructure. For
example, entities such as The Center for Spatial Studies at UC Santa Barbara, U Spatial at the
University of Minnesota and NSF sponsored Spatial Intelligence and Learning Center
headquartered at Temple University have received considerable media attention. This interest
suggests that it is possible and desirable to define and identify a Spatial University. The
objective of this presentation is to serve as a launching pad for a discussion about the
appropriate criteria, methods of measurement, categorization and selection process for Spatial
Universities. It advocates that such a designation would highlight exemplary universities that
have successfully developed comprehensive programs that foster spatial approaches across a
campus. From a public relations standpoint, Spatial Universities would serve as models that
demonstrate the value to society for embracing a spatial perspective. Ideally, this designation
would foster replication, encourage innovation and provide examples of best practices. The first
step toward reaching a definition is the acceptance of criteria and metrics. To this end, the
following dimensions are offered as a starting point for reaching a consensus:
1. Spatial thinking across the curriculum. 2. Geospatial workforce development. 3. Geographically oriented collaborative research. 4. GIS applications for campus administration and logistics
It is argued that elements of each of these dimensions should exist at a Spatial University
with extensive integration occurring among many groups across the campus. Ideally, faculty and
students should be working alongside staff and administrators using the campus and community
as laboratories for novel, as well as, practical spatial applications and procedures. In the current
computing environment this should include smart systems that use smart phones and other
sensors to generate a real time pulse of the campus. Common activities existing at Spatial
Universities could include (possible metrics):
• the maintenance of spatial inventories of a wide range of facilities and landscape features • GIS based planning and logistical support • innovative research projects using students as subjects in experiments • internships that help prepare students for the workplace • data base creation • development of modeling and analytical procedures that enhance programs such as campus
safety and access for disabled students
I

2013 Specialist Meeting—Advancing the Spatially Enabled Smart Campus Cowen—11
• creation of informative on line maps and visualizations that support navigation
Measures of success or the quality of the programs could include:
• operational administrative decision support systems • utilization of online systems that improve way finding, movement, safety • student placement measures • smart systems that enhance the quality of life on campus • creative teaching modules that incorporate spatial reasoning • evidence of collaboration and sharing such as join research proposals • scholarly publications, presentations and even master’s theses
It is also assumed that successful Spatial Universities are enabled by enlightened
administrators and a proactive support staff. Therefore, it is valuable to identify successful
organizational structures, funding mechanisms, computing infrastructures, incentives and
technical support programs that promote synergism at Spatial Universities. As noted in the NRC
report Learning to Think Spatially:
If we are to teach how to think spatially, then we need to provide both low- and high-tech
support systems for practicing and performing spatial thinking significant individual and group
differences in levels of performance
The same report provides a useful list of functions that a support system for thinking would
provides:
1. Database construction and management: provides a capacity for data acquisition, entry, formatting, storage, and management (the functional equivalent of long-term memory)
2. Data analysis: performs operations and functions for data manipulation, analysis, interpretation, representation, and evaluation
3. Memory: provides working memory for tracking the flow of computations and the storage of working and final results (the functional equivalent of short-term memory)
4. Assistance: provides prompts, feedback, hints, and suggestions to guide the choice of data analysis steps and to manage the flow of work
5. Display: provides a flexible display system for the representation of working and final results to oneself and to others—in physical form (e.g., a graph on paper, a three-dimensional model of molecular structure) or in virtual form (e.g., on-screen, for hard-copy printing, for export to other software packages)
If a consensus can be reached that a Spatial Universities can be clearly defined and identified
then it is important to establish a process that will add prestige to those universities that are
selected. Such as discussion should focus on:
• What is the full range of dimensions? • What are the appropriate metrics? • What is a minimum set of criteria? • What group should select? • How should spatial universities be recognized? • How should they be publicized?

2013 Specialist Meeting—Advancing the Spatially Enabled Smart Campus Cowen—12
• What is the proper role of associations such as the AAG, ASPRS, CaGIS and UCGIS? • What is the proper role of commercial organizations? • How can this become a global initiative?

2013 Specialist Meeting—Advancing the Spatially Enabled Smart Campus Crampton et al—13
Critically Assessing Big Data and its Sustainable
Implementation in the Spatially Enabled Smart Campus
JEREMY CRAMPTON Associate Professor
Department of Geography University of Kentucky
Email: [email protected]
with MATTHEW WILSON AND MATTHEW ZOOK
University of Kentucky
Objective The objective of this position paper is to identify critical factors in the conceptualization and
implementation of “big data” in the spatially enabled smart campus. There is a critical need to
understand how big data and its collection (e.g., with volunteered geographic information, VGI),
distribution and sharing (i.e., cyber-infrastructure) can be undertaken in a fashion that improves
human well-being (sustainability) in the spatially enabled smart campus.
The key factors in achieving this objective are to identify how big data can be implemented
in a sustainable fashion, that is, how it can improve human well-being on the smart campus. Big
data is a commonly proposed solution to a range of problems, including data-driven decision-
making and pattern analysis, identifying and tracking diseases, analyzing social media such as
Twitter (a billion tweets every 2.5 days)1 or for enhancing national security.2 At the same time, it
may equally lead to undesirable outcomes such as geosurveillance and privacy invasions. This
set of dual-outcomes lead Richards and King to identify three big data paradoxes:3
The transparency paradox, where big data promises the make the world more
transparent for problem solutions, while threatening the loss of privacy;
The identity paradox, in which big data threatens to replace our right to self-identity
with big-data-fed options (e.g., locationally driven goods and services);
The power paradox, in which big data sensors are predominantly in the hands of state
or corporate entities.
Guided by these paradoxes, we state that the sustainable spatially enabled campus must
ensure that personal privacy is “baked in” to the campus design; that the smart campus should
enroll our right to autonomy, especially concerning geolocationally available choices; and that
those on campus have a stake in how geodata collected or contributed by them is gathered and
shared.
To achieve these ends, we draw on the contributions of sustainability science to examine
these paradoxes of privacy, autonomy, and power. There is now much interest in applying
1 See https://blog.twitter.com/2013/behind-the-numbers-how-to-understand-big-moments-on-twitter 2 Nakashima, E. and Warrick, J. 2013. For NSA Chief, Terrorist Threat Drives Passion to ‘Collect it all,’ Observers Say” Washington Post, July 14. 3 Richards, N.M. and King, J.H. 2013. Three Paradoxes of Big Data. Stanford Law Review Online, 66(41), 41–46.
2013 Specialist Meeting—Advancing the Spatially Enabled Smart Campus Crampton et al—14
insights from sustainability science to the smart campus—for example, the ninth annual
conference on “Smart and Sustainable Campuses” will take place in Baltimore in April 2014. The
Millennium Ecosystem Assessment (www.maweb.org) launched by the United Nations over a
decade ago identified a framework for assessment of human well-being and the role of
ecosystem services in sustaining that well-being. In other words, sustainability is that which is
resilient to changes over the long term. If the smart campus is not sustainably designed (does
not lead to improved human well-being in the long term) it will fail its objectives. Significance and Applicability to the Smart Campus
The significance of this proposal is that it can enhance the application of big geodata to the
smart campus by answering several key questions of the meeting: how do smart campuses
contribute to sustainability; are there best (and worst) practice case studies of smart campuses;
and a range of questions on how best to engage and empower students. What is not currently
possible is to consensually identify proxies (ways to measure) for resilience in our three areas of
big geodata concern (privacy, autonomy and power). We seek input from the workshop to
develop and refine sustainability proxies for big geodata that can be applied to the smart
campus.
In this proposal we use a case study to begin this proxy development process, and then to
use the proxies to assess the recent expenditure of nearly $5 million at the University of Kentucky
to upgrade campus safety and security. This project includes the installation of nearly 2,000
cameras that can detect unexpected movement in order to send automated alerts, and
identification cards that can track students, faculty and administrators entering buildings.4 To
what extent were these systems implemented in ways that enrolled privacy, protected autonomy,
and engaged students in the educational mission of the university? Do the technologies address
identifiable needs of the campus (and surrounding neighborhoods), for example in traffic
management or disability access? Conclusion
In this proposal we draw from sustainability science to develop consensually agreed proxies that
can critically assess the implementation of big geodata on the smart campus. Whereas big data
is a commonly proffered solution to improve quality of life, it suffers from three contradictions
that make it necessary to disambiguate sustainable from non-sustainable uses. Using better
measures that resolve these contradictions, for example to resolve whether privacy has been
enhanced or degraded by the smart campus, will ensure that human well-being is maintained
(sustainable). We propose to apply these measures to case studies of big data usage on campus,
beginning with a significant security investment at the University of Kentucky, but with the
potential to extend from this use-case to other campuses.
4 See http://www.kentucky.com/2013/08/29/2794114/university-of-kentucky-spending.html
2013 Specialist Meeting—Advancing the Spatially Enabled Smart Campus Fu—15
Smart Campus—My Experiences and Perspective
JENNIFER FU
Founding Director, Geographic Information Systems Center Founding/Former Director, Certificate Program of GIS
Courtesy Professor, Department of Earth and Environmental Sciences Florida International University
Email: [email protected]
s a founding director of FIU’s GIS center, I applied the geo-spatial web to provide
solutions to local communities. This is reflected in a number of urban, transportation
planning as well as campus wide projects including the most recent “Mapping FIU’s Faculty
Residence” (see also: http://maps.fiu.edu/fiufacultyresidence/), a library Digital Signage, which
includes an in-door navigation map and directory on touch screens, and a Library Resources
Locator, which guide students to books, journals, and other resources in the library. I am the
Principal Investigator (PI) of “Transportation Outreach Planner” (see also:
http://mpotransportationoutreachplanner.org/), PI of a bicycle trip planning project (BiKE) (see
also: http://maps.fiu.edu/mpobike/ ) and PI of a Walk to School Safe Route Planner (See also:
http://maps.fiu.edu/srts/). We also developed mobile application for the BiKE project
(http://digir.fiu.edu/mpobike/Broward.html). All of these projects were funded by perspective
Metropolitan Planning Organizations (MPOs) of Palm Beach, Broward and Miami Dade Counties.
These projects gave me insights of what some of the most urgent campus and community needs
are and how geo-spatial web technology can provide solutions.
From my perspective, a smart campus is one that is efficient, intelligent, and environmentally
sustainable. If geo-spatial solutions can be integrated with various campus information systems
including student information, course catalog, course materials and syllabi, faculty research and
publications, and library catalogs and research databases (e-books, and journals), it would
greatly enhance its usability. The biggest challenge lies in the history of various existing
information systems, which are not necessarily interoperable with each other. Integrating them in
a single or a series of smart campus databases could be a very difficult task if not impossible.
The solutions might lay in APIs and web services that can be published, or central indexed for
retrieval.
Moving students around with efficiency and guiding them to locate campus resources can
save both energy and students’ time of navigation to campus and on campus. The following are
low hanging fruits where geo-spatial solutions can play key roles and be integrated later to the
Smart Campus solutions.
1) A Multi-Modal Route Planner (to Campus and on Campus): The route planner is most
useful if multiple travel modes are included: Transit+Bike; Tranist+Walk; Bike+Walk; Bike
Only. Google Route planner already includes Transit +Walk. However, on-campus
navigation or route planner, along with integration of cycling are missing;
2) Resource Locator and Navigator (all campus buildings, classrooms, library resources,
and so on): Students needs to find where they can park their bikes, where they can find a
A

2013 Specialist Meeting—Advancing the Spatially Enabled Smart Campus Fu—16
vacant computer station or a study space, and where the classrooms are (typically at
beginning of the semester). Most of the space and resource related information exist in
either CAD files or facilities databases of the campus facilities management department.
However, few campuses automated the facilities maps for public consumption.
3) Volunteered Geographic Information (VGI) and Other Crowd-sourcing tools can be
best applied in areas of reporting infrastructural problems such as a road/path is
flooded, campus security related issues, usability studies, and evaluations of Smart
Campus applications;
4) Car-sharing programs for commuting students: This is relatively easy to implement, as
we only need addresses from students (privacy is a concern, and should be carefully
implemented) and social networking tools. There are several vendor products and state
or local government web services that serve this purpose.
5) Using GIS to map out student and faculty residence clusters: Such mapping efforts
can assist the administrators to make better decisions on where to place shuttle bus
routes and stations.
A large aspect of Smart Campus solutions requires an intelligent academic information
system. The emphasis is on the word “Intelligent.” It shouldn’t be only limited to browse, search,
or discovery functions with query expansions. This system should be able to gorge “who the
client is” and make intelligent recommendations accordingly. For instance, after basic
demographic and academic interest and progress data is collected on a student, (s)he could
enter the student ID, such a system should be able to recommend options of study area,
relevant courses and professors, supporting services, technological and literary trainings and
tutoring, and library research materials, etc., which cover all aspects of a student’s academic life.
This intelligent information system combined with spatial visualization tools, can then pin-point
where some of these services and resources are available and route them there on a mobile
device. Similar to what amazon.com presents to shoppers, this system should provide an
exhaustive searchable listing of academic curriculum, services, technology, supporting structure,
and with “map it” and “router planner” options.

2013 Specialist Meeting—Advancing the Spatially Enabled Smart Campus Goodchild—17
Advancing the Spatially Enabled Smart Campus
MICHAEL GOODCHILD
Director Emeritus, Center for Spatial Studies Professor Emeritus, Department of Geography
University of California, Santa Barbara Email: [email protected]
he term Smart X has been very popular recently, as in Smart City, Smart Bay, and now
Smart Campus. All convey a similar meaning, but there are aspects of Smart Campus that
give it special significance. In what follows I try to separate the generic from the specific. I also
try to emphasize the questions and issues that arise when emphasis is placed on the geospatial:
geospatial data, geospatial databases, and geospatial functionality.
We assume first that X fully exploits information technology. At some point in the future,
when Smart Campus is fully implemented, mobile devices and sensors will be ubiquitous, and all
will be connected through the Internet. Base mapping will be available, sourced perhaps from
remote sensing or crowdsourcing, to resolutions and positional accuracies better than 1m. Base
mapping will also be three-dimensional, such that 3D representations will be available of both
the exterior and interior of all built structures and underground spaces. All individuals and
vehicles will be constantly geolocated, through GPS, RFID, or other technologies, such that
positions will be accurately known at all times, to better than 1m. X will also fully exploit the
potential of the Internet of Things: significant features will exist as URLs, tagged with QR codes,
and their attributes will be available for query. These assumptions are of course well beyond
current reality, but well within our current vision of a spatially enabled society, and well within the
capabilities of current technology.
One of the arguments behind this specialist meeting is that the university campus provides a
unique laboratory with many advantages for exploring and evaluating the potential of Smart X.
Substantial investments have already been made on most campuses in creating accurate
representations of 3D built form, making university campuses among the spaces best equipped
with base mapping. Some campuses have also undertaken extensive mapping of environmental
features, such as trees and wetlands, in support of ecological restoration. Universities are also
home to intelligent and highly motivated students, and GIS programs have long featured
campus-based projects. Some universities have surveillance systems that can be used to gather
spatio-temporal data on individual movements, and most campus faculty, students, and staff
carry smart phones.
I believe it would be both wise and productive to follow a traditional sequence in our
discussions. First, we need to identify the use cases of Smart Campus: what questions will people
want to ask of Smart Campus? We need to bear in mind that our own abilities as a group to
envision such uses are limited: that ultimately it will be the university’s students who are best
able to think outside the box, and that we should be discussing how to encourage and enable
them to do so, rather than prescribing uses on our own. Second, we need to identify the data
types that will be needed to serve these uses. This will require the identification of a Smart
T

2013 Specialist Meeting—Advancing the Spatially Enabled Smart Campus Goodchild—18
Campus ontology, and given our limited ability to imagine a full set of uses it will be important
that the ontology be extensible. Third, we need to identify the functionality that will be needed,
and delivered perhaps as device-independent apps, many of them created as projects by
students.
Within this framework, what do we not yet know how to do, and what other researchable
issues arise? The following bullets provide my tentative thoughts in this direction:
We do not yet know how to represent the interiors of built structures. There are many
options, and they depend on use cases. BIM representations exist for many comparatively
new buildings, but not older buildings. Applications such as evacuation or infrastructure
maintenance have very different ontological requirements. Each ontology has its own
issues with respect to data acquisition and maintenance.
We do not yet know how to capture real-time position within built structures. There are
several competing technologies, each with their own advantages and disadvantages in
specific use cases.
Real-time tracking of positions raises concerns about privacy. We will need to know how
privacy concerns can be balanced against successful applications in each use case. The
campus environment has longstanding traditions of information access, for example to
individual grades, that will need to be taken into account.
Besides practical applications, Smart Campus offers significant potential for social
science, in terms both of discoveries made from observations of student behavior, to
methods and techniques that can be tested on campus and then applied more generally.
The latter include Big Data analytics, since the campus and its rich data can act as a
convenient testbed for new tools.
Many issues of concern to faculty, staff, and students are not confined to the limits of the
campus, but also extend to the surrounding territory. Commuting and longer-distance
travel, off-campus recreation, and off-campus housing are just some of the activities that
may be aided by Smart Campus tools, if the geographic limits of the latter can be
extended sufficiently. Similar requirements exist for Smart City. What are the associated
requirements for data and functionality?
We do not yet know how Smart Campus will scale. Will it be necessary to implement
spatial divide-and-conquer, in order to achieve satisfactory scalability? Will peer-to-peer
applications be feasible, or will all use cases have to be resolved centrally?

2013 Specialist Meeting—Advancing the Spatially Enabled Smart Campus Gould—19
Advancing the Spatially Enabled Smart Campus
MICHAEL GOULD
Global Education Manager, Esri Associate Professor, Information Systems, University Jaume I
Email: [email protected]
work with Esri’s 84 international distributors to assist the 10000-plus universities around the
world who use our software for teaching and research. Recently we started revisiting some of
our key university users, to propose new thinking about how GIS is used on campus. In far too
many institutions GIS software is hidden away in a few teaching laboratories, while at the same
time the university shares many of the concerns as a small city—safety, public transportation,
planning, facilities management, etc.—which could benefit from GIS application. Some 1,200
universities around the world are running an Esri University Site License, a form of Enterprise
License Agreement, which allows unlimited software installations on desktop, server, cloud
(ArcGIS Online), and mobile platforms. A growing collection of innovative universities are
beginning to exercise these licenses to their full potential, creating a form of smart campus. Smart Campus Smart City projects are all the rage these days. Most are based on applying technology to
improve energy efficiency, mobility, ease traffic congestion, and hopefully improve quality-of-life
for citizens. The university can be considered an enterprise in a similar way than is a city. So why
is it the case that many universities do not use their GIS as enterprise software? Why do
individual professors struggle, often times, to secure funding for GIS software for teaching
purposes, when it should be an enterprise-wide investment for administrative, research, and
then teaching purposes? Other IT software and services, such as databases, IP telephony,
hardware maintenance, or WIFI infrastructure, are funded that way. We use figure1, below, to
remind university (and school district) administrators that the enterprise GIS should be theirs to
own, and not only relegated to only a few geo-savvy professors teaching class. Figure 1. Uses beyond the classroom, which include a wide range of administrative applications for GIS across the campus, school district, etc.
I

2013 Specialist Meeting—Advancing the Spatially Enabled Smart Campus Gould—20
GIS has demonstrated its capability to unite disparate data systems and themes, via the
unique identifier that is geography, or the location of each entity being studied or monitored.
Decision-makers need to see where they are wasting energy, where space is underutilized,
where lawns are overwatered, etc. Decision-makers can gain access to this integrated
information via what is called an Operational Dashboard (Figure 2). This vision of GIS is what is
being implemented in countless organizations around the world, so it behooves universities to
both teach and employ this enterprise implementation pattern as well.
Some of the attendees and speakers at this meeting will demonstrate progress being made
in this sort of enterprise GIS or spatially enabled Smart Campus. Others will cover the intriguing
area of knowledge representation, or in this context, “How might we make our campuses
smarter?”. One of the key questions I hope we will answer is “What do we mean by smart
campus, and which are its requirements as derived from students, faculty and administration?”
In addition to helping moderate the conversation I will be listening to suggestions and needs to
bring back to Esri colleagues. Esri welcomes collaboration in improving solutions for smart
campuses.
Figure 2. A sample Operational Dashboard, providing a synthetic view of the overall performance of a spatial jurisdiction: shopping mall, city, port complex or university campus.

2013 Specialist Meeting—Advancing the Spatially Enabled Smart Campus Hegarty—21
Smart Campuses and Smart People
MARY HEGARTY
Director, Center for Spatial Studies Professor, Department of Psychological and Brain Sciences
University of California, Santa Barbara Email: [email protected]
t the heart of the idea of the spatially enabled smart campus is the idea of integrating spatial
technologies with human spatial thinking to make people and campuses “smarter.” But
technologies do not always make people smarter. In considering how to best implement a smart
campus it is important to reflect on both positive and negative influences of technologies on
spatial thinking and cognition more generally, in order to implement smart campuses in a way that
truly makes people smarter.
Some lessons can be learned from research on GPS-based mobile navigation systems. These
systems can have both positive and negative spatial thinking processes. Recent research has
shown that navigation using GPS systems is not always more efficient than navigation using
traditional paper maps (Ishikawa et al., 2008). That is, when using GPS navigation devices, people
are less likely to develop an internal cognitive map of their environment, relying on their smart
phone to provide the relevant spatial information. While one might conceptualize a person and his
or her navigation system as a distributed-cognition smart system, this might cause problems in
emergency situations, in which GPS navigational systems may not always be available. One
challenge, therefore, is to develop spatial technologies that augment rather than replace spatial
intelligence.
A second cognitive concern in the development of smart campuses is the possibility of
information overload, as we use spatial technologies to track human movement, communication
patterns, and resource consumption. While this will provide extremely valuable information, the
challenge will be to provide “just-in-time” information to stakeholders, and not distract people
with information that is irrelevant to their current goals. Attention is limited, and the distracting
effects of even mobile phones are now well established (e.g., Strayer and Johnson, 2011). Critically
this distraction happens with both hands-free and handheld devices, indicating that the
interference is attentional, and not just about tying up one’s hands with different devices. One can
imagine similar distraction effects if too much information is available on a smart campus map. For
example, when navigating to Room 3512 Phelps Hall from across campus for the first time,
someone might appreciate a map of the internal corridors of Phelps Hall, showing the location of
this room. But most of the time, when walking across campus, this information would be
superfluous and distracting. Providing access to the most relevant information at the relevant time
will require both good models of the information needs of stakeholders in a smart campus, and
good user interfaces to the relevant information.
A third cognitive concern is that there are well established individual differences in spatial
intelligence (e.g., Hegarty et al., 2006). People differ enormously in their ability to learn the layout
A

2013 Specialist Meeting—Advancing the Spatially Enabled Smart Campus Hegarty—22
of a new place, plan routes, or imagine spatial transformations. More critically, ability to use spatial
interfaces is also related to spatial abilities, so that spatial technologies can often enhance the
performance of those with good spatial ability while just adding to the challenges of those with
poor spatial ability. The development of smart technologies also needs to take these individual
differences into account.
References: Gardony, A.L., T.T. Brunye, C.R. Mahoney, H.A. Taylor (2013). How navigational aids impair spatial
memory: Evidence for divided attention. Spatial Cognition and Computation 13: 319–350. Hegarty, M., D.R. Montello, A.E. Richardson, T. Ishikawa, and K. Lovelace (2006) Spatial abilities at
different scales: Individual differences in aptitude-test performance and spatial-layout learning. Intelligence 34: 151–176.
Ishikawa, T., H. Fujiwara, O. Imai, and A. Okabe (2008). Wayfinding with a GPS-based movile navigation system: A comparison with maps and direct experience. Journal of Environmental Psychology 28: 74–82.
Strayer, D.L. (2001). Driven to distraction. Dual-task studies for simulated driving and conversing on a cellular telephone. Psychological Science 12: 462–466.

2013 Specialist Meeting—Advancing the Spatially Enabled Smart Campus Huerta—23
smartUJI:
Integrating Information, Services, and Participation
JOAQUÍN HUERTA Associate Professor, Department of Information Systems
University Jaume I of Castellón Email: [email protected]
he University Jaume I (UJI) of Castellón (Spain) has recently adopted GIS technology in
order to improve the monitoring and management of campus resources. The reasons for
this adoption are: (1) budget cuts make it essential to efficiently manage the remainders what
remains; (2) The managers of UJI are now computer scientist. The project, smartUJI, is based on
the integration of university corporate data, digital maps and derivative applications (apps). This
information system and its tools enable multiple views of the campus primarily for management
purposes, but also offering services for other user profiles such as teachers, students and visitors.
In addition, the project provides a focal point for multiple systems required to build a smart
environment (energy, environment, mobility, participation).
The budget for the project is very low at the moment, but it is been boosted by several
people considering it has a lot of potential benefits for everyone. The project team is mainly
young computer scientists, with the support of architects and other technicians from UJI.
The project is mostly based on ESRI “templates.” We can take advantage of new features
added by ESRI in the future, and our work and expertise can easily be applied to other
campuses and environments.
The objectives of the project are to investigate and develop methodologies and technology
to meet the following requirements: • Avoid multiplicities in data, services and applications to save maintenance, space and
dedicated staff; • Enable the spatial analysis of the data from our environment to assist in making decisions; • Publish and facilitate discovery and access to data, services and applications; • Involve the university community in participation, information provision and resource
maintenance; • Provide opportunities for UJI research groups to gain experience with the “Smart Cities”
technologies.
More specifically, the technical objectives to be achieved in this project are: • Investigate methods and technology to integrate corporate information in a spatially based
framework; • Develop and integrate basic services (search, access, download, visualization) of the above
information; • Design intelligent maps supported by a spatial database which is structured, efficient and
consistent; • Create new applications addressing specific needs (spatiotemporal analysis of resource use,
space management, routing, mobility) and take advantage of this way of representation and visualization;
T

2013 Specialist Meeting—Advancing the Spatially Enabled Smart Campus Huerta—24
• Enable role-based access to different levels of information and to create new content; • Create a campus web portal to provide a unique access point to all this information and
applications; • Create mobile applications for the (voluntary) collection of in- situ data to detect behavioural
patterns; • Create mobile applications to improve resources consumption and mobility habits.
Campuses have a lot of graphic and alphanumeric information, which, potentially is of great
interest for public use. The status of this information has several aspects to be improved, which
motivate this project: Duplicity: can cause consistency problems. Integration: campus information is currently separated and not always in compatible formats. Accessibility: Many applications and services are already in-place, however they operate from
separate platforms and are in many cases hard to find. Display: graphical representation on maps is easier to understand than tables and text reports. Analysis: The large amount of information available might be of great aid to assist in making
decisions. Participation: The project offers the university community tools for providing feedback.
Description of the project
The first step in the creation of this spatial information system is modelling campus information
and spaces to then build on top of this model, the tools as web services and applications. This
information was provided by university central services in multiple formats, in many cases difficult
to be integrated with other information available from our environment (weather, city streets, air
quality . . .). Similarly, an important part of the campus applications and services were already in
place and accessible through the corporate website, however they were working from
independent platforms and in many cases, without easy accessibility. So it has been a very costly
task to create the complete campus map from a variety of data sources.
The second step has been the connection of the project database (Local Government Data
Model) with the University corporate database. The essential information has been imported
from the UJI database to the project database and for the integration of both databases, several
RESTful web services have been created to query the UJI database, looking for a trade-off
between performance and maintainability. Also the sensitivity of the information is a big issue as
the European data protection laws are very restrictive.
The third step has been the implementation of the infrastructure to support the system
functionalities as: Creation of the multimodal routing network dataset, both outdoor and indoor Development of an indoor location system for all the university buildings Deployment of some new sensors such as video cameras and integration with existing sensors
such us proximity and presence sensors or electronic locks. Other sensors as parking usage, filling level of dumpsters or soil moisture are planned to be installed in the future.
The fourth step has been the development of tools such as the People & Place finder, the
Roting and Directions service, the Navigation service or the Service Request. Also other

2013 Specialist Meeting—Advancing the Spatially Enabled Smart Campus Huerta—25
applications are planned for the future as the Parking Assistant and applications based on
Geofencing.
Figures 1 and 2 show the project web portal , based on ESRI campus basemap template,
providing, among others, a mapping service for campus visualization and a place and person-
finder service, which displays the contact information and space use, dimensions and description,
and shows the best route to reach persons or offices. This alone represents a significant advance
because many universities offer similar services based on static campus maps in PDF format and
disconnected from the directory.
Other interesting applications are energy consumption monitoring, campus communication
with the city through transportation networks, such as bicycles, apartment and hotel search
according to their accessibility to services nearby, campus space reservation, and maintenance
(work order) requests.
Figure 1: Campus basemaps
Figure 2: Place/People finder
The project will develop apps designed with gaming techniques in order to attract more
users to participate in the provision of information and to educate the user on their habits.

2013 Specialist Meeting—Advancing the Spatially Enabled Smart Campus Huerta—26
Expected Benefits
The implementation of this project can be very beneficial for increasing visibility of the work and
services offered by different research groups, departments and services of the University,
enabling better knowledge sharing between the different stakeholders who are part of the
university community, and increasing their commitment and involvement with campus life.
More information, enriched by transversal contents, enables a real-time analysis that can
improve resource management and decision-making to encourage a change in consumer habits
such as commuting and ride-sharing.
With the establishment of a single access point to the different data, services and
applications we reduced multiplicities and minimized inconsistencies, enabling real-time
monitoring of the different types and sources of information that allow spatial analysis to
highlight operational patterns and opportunities for improvement in the management of
resources.
Another major advantage is that through greater openness and better visibility of the
information, it encourages the university community in all its diversity, to participate and to be
aware that their behaviour and contributions are useful for the proper operation of the Campus.

2013 Specialist Meeting—Advancing the Spatially Enabled Smart Campus Hurt—27
Industry Requirements for Smart Campus Infrastructure
INDY HURT
Research Coordinator Apple Inc.
Email: [email protected]
The views and opinions expressed here are my own and do not represent official company policy nor do they highlight any plans Apple may have now or in the future to support innovative campus map solutions.
he basic requirements of a campus map are typically accomplished with a wayfinding-
based model (Roth et al., 2009). This approach is designed to help the campus community
and visitors locate features and navigate on campus. A data model to accomplish these
requirements is no different from any other base map consisting of roads, paths, buildings,
parking areas, and other areas and points of interest. Nevertheless, standards are beneficial,
particularly when college campuses desire accurate representation on commercial mobile map
services.
Beyond base mapping, considering target audience characteristics helps us distinguish
between requirements for inward and outward facing services that can be built to deploy rich
content. Event feeds for arts, some lectures, and sporting events could be used to engage the
general public, while the campus community may benefit more from the addition of real time
spatially enabled class scheduling and on campus traffic patterns.
Deploying sensor networks across campus or employing citizens as sensors (Goodchild,
2007) invokes the need to protect privacy and safe guard the campus community from any
unintended use of the campus data. A new proposal and a review of existing approaches
described by (Gao et al., 2013) illustrates the research community’s efforts to address privacy as
it relates to trajectories and sensor networks. With this precaution in mind, what types of
location-based services should be owned solely by campuses? Which ones should be developed
by industry and private enterprise? Where can the stakeholders collaborate, and are we
prepared to be innovative when accessible visualization of rich content can be cartographically
difficult to accomplish? References
Michael F. Goodchild (2007) Citizens as Senors: The World of Volunteered Geography, GeoJournal 69: 4, 211–221, DOI: 10.1007/s10708-007-9111-y.
Robert E. Roth , Jamon Van Den Hoek , Andrew Woodruff, Aaron Erkenswick, Evangeline McGlynn
and Joel Przybylowski (2009) The 21st Century Campus Map: Mapping the University of Wisconsin-Madison, Journal of Maps, 5:1, 1–8, DOI: 10.4113/jom.2009.1036.
Sheng Gao, Jianfeng Ma, Weisong Shi, Guoxing Zhan and Cong Sun (2013) TrPF: A Trajectory Privacy-Preserving Framework for Participatory Sensing. IEEE Transactions on Information Forensics and Security 8: 6: 874–887, DOI: 10.1109/TIFS.2013.2252618.
T

2013 Specialist Meeting—Advancing the Spatially Enabled Smart Campus Jablonski—28
Advancing the Spatially Enabled Smart Campus
JON JABLONSKI
Department Head, Map and Imagery Laboratory Davidson Library
University of California, Santa Barbara Email: [email protected]
cademic libraries have always been a breeding ground for new technologies. Some of the
first large-scale computer networks were implemented in libraries. Pre-web technologies
such as gopher and hytelnet were designed to help navigate information resources such as
online book catalogs and government-produced information. The presence of these networks
made the library one of the few places where people other than scientists and engineers could
access the Internet (interestingly, public libraries continue to provide vital Internet access to
those unable to afford smartphones or broadband access at home).
Moreover, before electronic journals and broadband became ubiquitous, the library was
perhaps the only place on campus where faculty from radically different disciplines would meet
in the course of doing their work. The physicist and the philosopher would otherwise perhaps
only meet socially at the gym or the faculty club. The library continues to cut across disciplinary
boundaries. At UCSB we assist faculty who are grappling with emerging mandates to preserve
their research data, deposit their publications in open-access repositories, and digitize course
materials otherwise only available in print. We also cut also across the boundaries between
faculty, students, and the community by presenting general interest lectures, workshops, and
providing free access to scholarly resources not otherwise available to the public.
Spatial processes are built into many ordinary library business practices. While we promise to
borrow books regardless of their location via inter-library loan, space is actually an important
part of the process. Distance is a primary factor in choosing which library to request a book from.
However, the system we use also balances workloads and lend-to-borrow ratios. If UCSB is
borrowing too many books from Stanford and Stanford is experiencing high demand from other
libraries, the system we use will automatically re-route requests to more distant libraries. Even
the way books are arranged on the shelf is spatial. Because we use subject-based classification
schemes, the stacks are a manifestation of Tobler’s Law: books on similar topics are shelved near
each other.
Some libraries are now implementing systems that guide users from a record in the catalog
to the correct row of shelves in the stacks--essentially marrying the library catalog with a building
navigation system. Here at UCSB, we recently disabled a similar home-grown system that we
determined was too expensive to continue to maintain. However, our building is complicated to
navigate and we are currently moving massive amounts of materials in and out of the building as
well as changing the floor plan. We know our users need help getting to the remaining print
materials, so we are evaluating both FOSS and commercial products that will not only be more
easy to update, but will also get users closer to their target than the previous system.
A
2013 Specialist Meeting—Advancing the Spatially Enabled Smart Campus Jablonski—29
Another building navigation system under consideration will guide users towards available
computer workstations. Even with ubiquitous laptops, there continues to be high demand for
desktop computers in the library. Commercial systems have sprung up that show which
computers are currently available. In the future, we anticipate showing which areas of the library
have available chairs and tables. It is not a stretch of the imagination to suggest deploying
sensors that would measure ambient noise levels, offering users a choice between quiet,
contemplative spaces and active rooms filled with conversation.
At UCSB there is also a certain level of excitement in the library. We have an all-new
management team that is attempting to revive long-dormant collaborations with partners across
campus. The Alexandria Digital Library was designed and implemented by computer scientists,
geographers, and librarians working together, but the project has been left practically
untouched for the past eight years. Recently we have begun to identify pieces of this effort that
can be revived using current technologies. The first of these is the ADL Gazetteer, a place-name
dictionary that is combined with a feature-type vocabulary (are you looking for the state of
Mississippi or the Mississippi River?), spatial hierarchy (the city of Santa Barbara is within the
county of Santa Barbara), and temporal change (East Germany was only a place between the
years of 1949 and 1990). The gazetteer will be used as the spatial facet in a new, overarching
digital library system built on open source software.
We also have a major construction project underway, and are actively seeking input from our
user community on how the future library will operate. Will we continue to offer general desktop
computers, or do we need to focus on fewer but more specialized workstations? In an era where
many (if not most) library materials are available online, what is the best way to provide face-to-
face services to people in their departments or their dormitories? If neither the physicist nor the
philosopher need to come to the library to access their journals, what services can we offer to
continue the tradition of a trans-disciplinary venue?
Today, opportunities for library to contribute to enabling smart campuses are limited only by
time and money. Ever conscious of scarce resources, we continuously look for cost-effective
technologies that we can implement affordably. At the same time, we realize that it is vital for us
to contribute our expertise in information architecture and information seeking behavior to
campus-wide efforts. My participation in Advancing the Spatially Enabled Smart Campus will
provide an opportunity to discuss these issues with a wide variety of potential partners.
2013 Specialist Meeting—Advancing the Spatially Enabled Smart Campus Janelle—30
Questions for the Spatially Enabled Smart Person
on a Smart Campus
DONALD G. JANELLE Program Director, Center for Spatial Studies
University of California, Santa Barbara Professor Emeritus, Geography
Western University (Canada) Email: [email protected]
or much of my professional career, I have promoted the importance of documenting and
understanding the diurnal space-time patterns of human movements and activities in cities
(e.g., see Janelle, Goodchild, and Klinkenberg 1998; Janelle 2012). The recent research focus on
smart cities has demonstrated the theoretical insights and practical benefits that can be derived
from such documentation (e.g., Harrison, et al., 2010; Batty, et al., 2012). Clearly, the integration
of information and communications technologies (ICT) with geographically embedded and
mobile sensors has enabled flexible temporal and geographical referencing of data to display
information of all kinds—opening a plethora of research and problem-solving capabilities not
thought possible as few as ten years ago, much less four decades ago when I initiated research
on the space-time geographies of cities. But, now, I wonder—Where is this technology taking
us? Are there downsides? What are we giving up? What are the risks? In addressing these
questions, it is ironic that my responses are in the form of more questions. In large part, these
concerns derive from humanistic fears of change and from threats to the values embedded in
existing socio-economic structures and in traditional problem-solving practices. The questions
listed below are exemplary rather than exhaustive; I hope to add to this collection of queries
over the course of the specialist meeting. What should we guard against?
How can we make use of automated handheld, wearable, and vehicle
navigation/information tools without losing our innate human capabilities to think
spatially?
How can the individual exercise control over information access without being
overwhelmed by targeted automated information services?
Do we seek ICT-tethered dependence in structuring and carrying out our daily routines
and lifetime trajectories or can these technologies be designed to enhance our individual
autonomy over space and time?
Of course, the smart (cities/campuses/buildings/etc.) movement has emerged with a primary
focus to enable opportunities to bring our lives in better alignment with environmental and
social constraints. Indeed, there are enormous opportunities, some already underway, and
others not yet on the drawing boards. As educators, we need to be conversant in how these
technologies intersect with intellectual perspectives and to nurture those that promote
F
2013 Specialist Meeting—Advancing the Spatially Enabled Smart Campus Janelle—31
opportunities to engage students productively and creatively. There are significant opportunities
to use local campus environments as platforms for students to learn problem solving, research
approaches, and collaborative skills from a broad range of disciplinary perspectives that will
equip them for a lifetime of innovative and thoughtful engagement. What opportunities should we nurture?
Seeing time as a critical non-renewable resource in the context of the human life span,
how can the smart campus be an incubator where ICT design and deployment enhances
general human efficiency and effectiveness?
How do we move beyond our home-based smart campus to the global integration of
smart campuses?
In what ways can we contextualize the campus environment to address broader regional,
national, and global issues (including environmental sustainability, cognitive clarity, and
social cohesion)?
How can we create and demonstrate in the campus setting collaborative systems of
knowledge integration for framing and solving problems?
Can the campus position itself as an incubator for innovation through smart technologies,
especially by engaging students in conception, design, implementation, and evaluation?
I trust that this specialist meeting will address such questions and draw attention to the need for
integrating smart people in smart ways with smart infrastructures for smart outcomes. References Batty, M., K. Axhausen, ,G. Fosca, A. Pozdnoukhov, A. Bazzani, M. Wachowicz, G. Ouzounis, and Y.
Portugali, 2012. Smart Cities of the Future. The European Physical Journal, Special Topics 214: 481–518. Published with open access at Springerlink.com, DOI:10.1140/epjst/e2012-01703-3.
Harrison, C., B. Eckman, R. Hamilton, P. Hartswick, J. Kalagnanam, J. Paraszczak, and P. Williams, 2010. Foundations for Smarter Cities IBM Journal of Research & Development. 54 (4): 1–16. http://DOI. 10.1147/JRD.2010.2048257.
Janelle, D.G., M.F. Goodchild, and B. Klinkenberg (1998) The Temporal Ordering of Urban Space and Daily Activity Patterns for Population Role Groups. In: R.G. Golledge and M. Egenhofer, eds., GIS and Disaggregate Behavioral Travel Modeling, Special Issue, International Journal of Geographical Information, Analysis, Theory and Decision, 5(1–2): 117–137.
Janelle, D.G. (2012) Space-adjusting Technologies and the Social Ecologies of Place: Review and Research Agenda. International Journal of Geographic Information Sciences 26(12): 2239–2251. http://dx.doi.org/10.1080/13658816.2012.713958

2013 Specialist Meeting—Advancing the Spatially Enabled Smart Campus Karaffa—32
Advancing the Spatially Enabled Smart Campus
BRYAN KARAFFA
Computer Network Technician Department of Geography
University of California, Santa Barbara Email: [email protected]
he term “Smart Campus” is a very broad term that can be applied to campuses of varying
complexity. My belief is that a campus requires a greater level of complexity than a single
building or space. That is not to say that a single building or space wouldn’t benefit from some
of the strategies and methods used by a traditional Smart Campus. In general a campus today
would have buildings with various types of space assets, multiple infrastructures including but
not limited to transportation, utilities, and communications. I do not believe the term “Smart
Campus” should be based on the technological complexity of the infrastructure but rather the
campuses development plan. A campus that has just begun to implement some of the necessary
sensors and networks of a traditional Smart Campus, they can still see immediate benefits and
return on investment.
I am not informed to the entire Smart Campus infrastructure UCSB has developed to date
and whether or not UCSB is considered a “Smart Campus” or not. We have done work with
Physical Facilities who been implementing a system that logs and can help analyze the energy
usage data for the buildings on campus. This single component, which is included as a part of
most of the smart campus solutions that are available today, has given Physical Facilities an
incredible resource for analysis and determining usage patterns for the campus. By logging the
data to a relational database system with space and time functionality they are able to run
complex analytics on the datasets that weren’t possible with analog data. They have also been
working to replacing the existing electric meters which require manual monthly readings with
automated 15minute interval sensors. The new meters have greatly improved the data quality
and resolution. Lastly, since it is in a relational database system which is interoperable with many
programming languages, I have been able to leverage the dataset to bring transparency to the
campus and raise awareness regarding energy usage on campus via the UCSB Interactive
Campus Map.
There are many different solutions available for a campus that wants to become a Smart
Campus. Esri and IBM both make popular solutions and offer services to help implement these
solutions. For now, I don’t believe there is one solution that is better than the other. Campus
around the world can vary in size, resources, and requirements. It would be very hard, as an
engineer to produce a solution that fits every campus.
If I had to choose one for my own campus, I would most likely use the one that best suites
our needs, is widely adopted already, or has a high level of interoperability with other solutions.
A completely unique/proprietary Smart Campus solution wouldn’t allow for collaboration
T

2013 Specialist Meeting—Advancing the Spatially Enabled Smart Campus Karaffa—33
between other campuses nor utilize any tools that get developed by other campuses and
organizations.
There are some components which are included in all available Smart Campus solutions
available today. A database system with space and time functionality is almost always a critical
part of the Smart Campus infrastructure. The database system is an efficient way to store the
datasets and perform spatial and time-aware functions to the data. There are many different
solutions available to fill this requirement including but not limited to PostgreSQL, MongoDB,
Solr (powered by Lucene), MariaDB/MySQL. A communication infrastructure would be required
for the sensors and networks to interact. Currently TCP/IP over physical communications lines is
the most widely used and provides immensely levels of interoperability with connectivity to the
World Wide Web. Special considerations may need to be used and ultimately it would depend
on the sensor and implementation used.
Volunteered Geographic Information (VGI) has the potential to play a critical role in
gathering information, quality assurance, and decreasing the response time for data acquisition.
Smart phones and mobile devices are becoming ubiquitous among the general population.
“Citizens as sensors: the world of volunteered geography” by Mike Goodchild covers the idea of
using people’s mobile devices and VGI to build datasets. One idea I’ve had while working on the
UCSB Interactive Campus Map was to create a VGI module for the UCSB Interactive Campus
Map Phone App. The user would be able to opt-in (or not) and the module would collect
GPS+WiFi signal strength readings for the UCSB WiFi Network when they used the app. The
data would be automatically contributed to the UCSB ICM team which could produce a
continuously up to date wireless signal strength map. Smart phones could also be used to
contribute information during emergency situations as well. An “emergency” module could be
developed that interfaces with UCSB Emergency Management and/or the UCSB Police. The
specifications of the module would depend on their available resources and requirements.
UCSB already has infrastructure in place that can help them understand diurnal and seasonal
demographics of campus buildings and spaces. The energy usage data Physical Facilities is
collecting could be analyzed and used to predict periods of above/below average usage and
react accordingly. If they were able to log the energy usage per room instead of per building
(improve granularity of data), even more complex diurnal and seasonal patterns could be
discovered.
The UCSB Interactive Campus Map project has been another very successful project that has
brought students into the technical aspect of implementing these smart campus solutions. A
majority of the datasets the Interactive Campus Map references have been created by
undergraduate and graduate student volunteers. Some datasets were at the request of Facilities
Management, other were suggested and created from scratch by the students themselves. This
collaboration between the students and Facilities management has been beneficial for both
sides. It wasn’t until recently that we were able to collaborate due to quality assurance and
technical hurdles. The workspace the volunteers work in is versioned and isolated from the
authoritative datasets. Edits are required to go through a quality assurance and quality control

2013 Specialist Meeting—Advancing the Spatially Enabled Smart Campus Karaffa—34
process and can be imported into the authoritative datasets at their discretion. The students are
able to experience the unique challenges that come with working with real-world datasets (which
are usually imperfect) and Facilities Management can benefit from the volunteered work and
improved datasets.
The possibilities for what a Smart Campus can do or be are evolving as we learn more every
day. I feel that UCSB is beginning to take steps towards becoming a Smart Campus but there is
lots more that can be done. I am looking forward to the opportunity to learning more and
contributing what I have learned and experienced over the past year while working on the UCSB
Interactive Campus Map.
References
Goodchild, Michael F. 2007. Citizens as sensors: The world of volunteered geography.
GeoJournal 69.4: 211–221.

2013 Specialist Meeting—Advancing the Spatially Enabled Smart Campus Kessler—35
Advancing the Smart Campus with Open Data
CARSTEN KEßLER
Assistant Professor, Geographic Information Science Department of Geography
Hunter College City University of New York
Associate Director, Center for Advanced Research of Spatial Information Email: [email protected]
The Open Data University
Over the past years, several universities around the world have joined the open data movement.
The first initiative of this kind in Germany was started in Münster, with the Linked Open Data
University of Münster (LODUM) project.1 The goal of LODUM is to open up and connect the rich
data sources maintained by the university, both concerning administrative and research data.
Spatial aspects play an important role in many scientific resources, ranging from obvious
examples such as historic map collections to less obvious ones such as spatial analyses of active
pharmaceutical ingredients. On the administrative side, geographic information is required for
many planning aspects, from facility management to course scheduling down to the individual
student planning her classes (which is especially challenging at a non-campus school like
Münster, which has its buildings scattered across town).
The use of the Linked Data approach [3] provides a set of standards for semantic annotation
and integration. Following these principles, a number of datasets have been released and
enabled applications to evaluate scholarly activity [1] and for indoor navigation on campus [2],
among others. Moreover, the data published in LODUM drive the campus app,2 which supports
students in many of their day-to-day tasks. Since the beginning of 2013, the Linked Data for
eScience Services3 project explores the potential of this approach for applications in the library
context. Lessons learned
LODUM is just one example of such an open data initiative. A growing number of universities
have joined this movement, and platforms such as Linked Universities4 have been established for
exchange and communication between them. We anticipate that a data platform will become as
common as a website in the foreseeable future (both for universities and other public
institutions). However, currently, such initiatives still strongly depend on individual efforts, and
applications that put the published datasets to use are required to demonstrate the utility to a
broader public. Convincing administrators to give away data they often see as theirs can be hard,
despite the promise of improved data quality through transparency. Flagship applications such
1 http://lodum.de 2 http://app.uni-muenster.de 3 http://lodum.de/life 4 http://linkeduniversities.org

2013 Specialist Meeting—Advancing the Spatially Enabled Smart Campus Kessler—36
as apps for students or campus energy management5 are key to increase the willingness of the
campus “inhabitants” to contribute the data that enable a smart campus in the first place.
Moreover, they show administrators what can be done with open data once the rather abstract
data cleaning and integration process is complete. Such flagship services hence also help to
secure long-term funding. At the same time, coordination across different universities, especially
in terms of shared vocabularies used for data publication, ensures interoperability and makes it
easier to develop applications once, and then reuse them at other schools. Advancing the smart campus
While some promising first steps towards the smart campus enabled by open data have been
made, we only start to understand the fundamental changes this implies to scientific data
management and evaluation, as well as campus management and student services. Spatial data
is a key enabler for integration in this setting, allowing the scientist to join previously
disconnected datasets through their spatio-temporal references and retrieve relevant data
based on spatio-temporal scope. This bears a great potential for libraries, which are in the
process of redefining their role from literature management institutions towards data curation
and e-science service centers. The corresponding transformation process still leaves a number of
open research questions, especially concerning accessibility and modeling of spatio-temporal
data [4]. The experts to solve these problems, however, can actually be educated in the realm of
such a smart campus initiative. Project classes can get involved in developing prototypes for
required solutions, and graduate students can work on the theory involving topics such as
modeling, transparency, privacy, and usability—of published datasets, applications, and even
the campus itself. In the long run, a smart campus based on open data can become an
ecosystem that spans research, teaching, evaluation, startups, student services and
administration.
In order to reach this goal, a clear open data agenda is required for each campus, similar to
the one just released for New York City.6 This requires substantial change in many institutional
workflows and responsibilities concerning quality control and publication rights. Concerning
spatial data, more research is required to identify all datasets with direct and indirect spatial
references. The potential of these datasets for integration with other datasets needs to be
explored, especially concerning the development of new scientific and administrative services. In
order to reduce the efforts for these undertakings at each individual university and to jointly
develop standards for data annotation and publication, exchange and interaction between the
participating universities is vital. Bibliography
[1] Keßler, C. and Kauppinen, T.: Linked Open Data University of Münster—Infrastructure and
Applications. Demos at the 9th Extended Semantic Web Conference (ESWC2012), Heraklion,
Greece, May, 2012.
5 http://losangeles.usc.edu 6 http://www.nyc.gov/html/doitt/html/news/pr_092313.shtml

2013 Specialist Meeting—Advancing the Spatially Enabled Smart Campus Kessler—37
[2] Lasnia, D., Westermann, A., Tschorn, G., Weiss, P., Ogundele, K.: OpenFloorMap
Implementation. In A. Schwering, E. Pebesma, K. Behncke, (Eds.), Geo-informatik 2011: Geochange, ifgiprints, 41, Münster, Germany, 2011: 41–44.
[3] Berners-Lee, T. (2009) Linked Data—Design Issues. Available from
http://www.w3.org/DesignIssues/LinkedData.html
[4] Trame, J., Keßler, C., and Kuhn, W. (2013) Linked Data and Time—Modeling Researcher Life
Lines by Events. In Tenbrink, T., Stell, J. Galton, A., and Wood, Z.: Spatial Information Theory.
11th International Conference, COSIT 2013 Scarborough, UK, September 2013 Proceedings.
Springer LNCS 8116: 205–223.

2013 Specialist Meeting—Advancing the Spatially Enabled Smart Campus Kuhn—38
What Makes us Smarter on a Campus?
WERNER KUHN
Professor, Department of Geography Director, Center for Spatial Studies
University of California, Santa Barbara Email: [email protected]
n campuses, we tend to think of ourselves as being among the smartest people. Yet, some
of the ways in which we handle resources and opportunities are stuck in academic Stone
Age and could use some retooling. Surprisingly, our core business of research and teaching suffers
most from arcane resource and information management, characterized by proprietary and largely
inaccessible silos of research data and education materials. But universities also offer fantastic
interdisciplinary settings for efforts to improve this situation. The notion of a smart campus, with its roots in smart cities, has been used for a broad range
of ideas around the use of technologies in support of campus life and management, often
focused on building infrastructure. This specialist meeting takes stock of these ideas and
enlarges the spectrum further, by including knowledge infrastructures for research and teaching.
One can easily argue that an optimized management of campus resources and support for
campus “users” should include research and teaching resources and their use by scientists,
students, and administrators. The role of spatial enablement is, it turns out, equally or even more
beneficial in these tasks—and has hardly been tapped into so far.
My position at the meeting will be that, since it is tools that make us smart, we need to
design and evaluate tools for spatially and semantically enabled exposure and access to scientific contents. Based on an ongoing project at the University of Münster (http://lodum.de)
and a new initiative at UCSB’s Center for Spatial Studies (http://spatial.ucsb.edu), I argue that
such efforts are best planned and carried out in cooperation with campus libraries. The second
main allies are champions from disciplines that understand and promote the benefits of sharing
scientific data and linking them spatially and semantically.
In particular, my experience in these two efforts so far suggests thinking about best practices
along the following lines: 1. engage librarians and library technologists in discussions on how to spatio--‐temporally and
semantically enable access to library contents; 2. approach campus leadership, jointly with the library, and argue for coordinated efforts in the
context of mandates for open access, inter- and transdisciplinary research, cluster funding, scientometrics, e-learning, digitizing resources, improved and novel library services, etc.;
3. build experimental tools and platforms, in cooperation with champion users on campus (consider: genomics, brain research, digital humanities, economics . . .), to demonstrate the potential of opening up research data and making them spatio‐temporally searchable and analyzable.
It helps to set tangible and measurable goals for such efforts and discuss them with users
and stakeholders. What benefits should researchers, educators, students, and administrators
obtain from them?
O

2013 Specialist Meeting—Advancing the Spatially Enabled Smart Campus Kuhn—39
As a start, I suggest it should be easy for researchers to: • publish data and associated analyses, papers, presentations etc. • find and access data based on place, period, and properties • analyze the spatial and temporal variation of studied phenomena • combine data from multiple sources, spatio-temporally and semantically • analyze distributed data rather than download data for analysis.
Similar lists can easily be drawn up listing benefits for students (think of problem-driven
learning), administrators (consider evaluations) and any other actors on campus.
The bottom line argument for such efforts is that campuses, just like cities, compete for
residents. Researchers (like myself) tend to choose campuses offering the best environments for
a smart use of resources. As experts in spatial thinking and computing, we can propose a range
of unique selling points to campus administrators, based on the integrative roles played by
space and time.

2013 Specialist Meeting—Advancing the Spatially Enabled Smart Campus la Cour—40
Keys to Developing a Smart Campus: Communication and Collaboration
NIELS LA COUR
Senior Physical Planner, Campus Planning Division University of Massachusetts Amherst
Email: [email protected]
In Collaboration with ALEXANDER STEPANOV
ECO Department University of Massachusetts Amhers
Email: [email protected]
hen I started working at UMass in Facilities and Campus Planning six years ago, GIS was
a tool for making paper maps that hung on office walls. Now, UMass Amherst has
recently formed a GIS Steering Committee with high level membership that includes the CIO,
Vice Chancellor of Facilities and Campus Services, the Directors of Campus Planning, Design
and Construction Management, Physical Plant, the Vice Provost and Deans from several of the
colleges on campus. This marks the moment that the idea of an Enterprise GIS has become
institutionalized and will have the heft of the campus leadership behind its implementation. It is
now understood that GIS is more than paper maps. It is an information system with the
architecture and scalability to provide the framework for tying most of the other data and
information systems on campus together to create the basis of a Smart Campus. A key aspect of
this technology that makes it so valuable is the ability to share information and visualize it a
manner that fosters better communication and collaboration. Like most college and university facilities divisions, ours was primarily a CAD-oriented
operation with GIS used to print out the Campus Map. I was hired as a Planner, but mostly for
my GIS skills. A week before I started, my boss left and since my predecessor had been gone for
almost six months, most of the responsibilities had been reassigned. Since nobody really knew
what I did, except make maps, I had a lot of time to look around and reflect on how my new
environment worked, how it used technology, and what I could do to help. Seeing CAD all
around, I tried to take off my GIS evangelist hat and really think about the appropriate
technologies for this environment. I was fortunate to get involved in several new technology
initiatives which included the research and selection of a Computer Aided Facilities
Management (CAFM) system. In the end, I came to the conclusion that GIS is really the
technology that can tie all of the other data systems together and has the analytical and
visualization tools to be a truly enterprise decision support tool for all levels of decision makers.
The evolution of the technology to not only provide the scalability to allow the harnessing of
data within the buildings, not just the outside environment, plus making that data available in
easy to use online applications, just reinforces that conclusion.
W

2013 Specialist Meeting—Advancing the Spatially Enabled Smart Campus la Cour—41
Not only does GIS create a better environment for communication and collaboration,
elements essential for a Smart Campus, I would argue that it takes communication and
collaboration to implement the technology successfully. At UMass we have been fortunate that
collaboration was what got GIS started at the university through a joint project with the Town of
Amherst and Amherst College to do the initial flyover and basemapping project in 1999. By
partnering and combining funding, the initial project budget had well over half a million dollars
and we were able to do 1”= 40’ scale mapping with 2’ contours, surveyed all utility points and
had 0.25” resolution digital orthophotography for a very complete and accurate starting point.
Since then, the entities have collaborated to collect orthophotography again in 2004, a whole
new flyover and base mapping project that also included LiDAR to provide 1’ contours in 2009,
and are joining a regional collaborative effort to collect new orthophotography and LiDAR in
spring 2014. The University and the Town of Amherst were also collaborators and early
participants in ESRI’s community base mapping program and were featured early as an example
because of the richness of our data. The two entities were also the first to be recognized in a
press release when Google Earth launched its Cities in 3D program in 2008.
UMass benefitted again from collaboration when Campus Planning brought on board
Alexander Stepanov, then a Ph.D. student in Operations Research who had finished his M.A. in
Regional Planning at UMass, to assist me in the development of our GIS capabilities. With
Stepanov’s unique combination of insight into operations research, and ability to both see the
big picture and understand why the tools are needed, and also be able to do the hard core
programing, we began developing many ideas and prototypes for how to incorporate GIS into
the operations at the University. We started by using Applied Geographics General Purpose
Viewer (GPV), a stored procedures based application that uses ArcGIS to create an easy to use
interface for staff. These tools included the ability to view floor plans within building footprints,
utilities (linked with photos and record plans), public art on campus (with photos and info about
the artists), tree inventory and our historic building inventory and report. We also began
collaborating with a developer in Administration and Finance Systems (IT for operations) to
develop a prototype Project Information Management System (PIMS) that incorporated GIS web
parts into Sharepoint to provide access to all of the project management data through a map.
All of these prototypes were beginning to educate people that GIS was more than a paper map
and developed interest in using the technology for operations.
I believe that the big break for GIS at UMass came with the success of the Campus Master
Planning process. Campus Planning was charged with creating the first comprehensive master
plan for the campus in more than 40 years. We firmly believed that the process must be open,
transparent and include as much community participation as possible. We immediately began
thinking about how GIS could enhance the project more than just providing the traditional
mapping and analysis role, but as a tool to engage students, a traditionally hard to reach
population. Unfortunately we did not have the type of server environment to support heavy duty
use by a lot of people. That is where ESRI’s new Community Basemapping and online GIS
technology provided the answer. First we created the “Likes and Dislikes” app

2013 Specialist Meeting—Advancing the Spatially Enabled Smart Campus la Cour—42
(http://www.umass.edu/cp/maps.htm) that allowed the campus community to tell us what they
thought of the campus and once students saw the application at an event in the campus center,
news of it spread and so did the participation. Then we created the “Master Plan Explorer”
which allowed us to present the draft Master Plan and allow people to learn about it through
clicking on areas or new buildings and getting more information about it and tell us what they
thought. Now we are creating the “Campus Master Plan Story Map” to keep the plan alive and
accessible to people. The best moment was when the Chancellor endorsed the Master Plan and
said the thing that impressed him most was that it was supported by so many different quarters
of the campus community. The innovative use of GIS as a communication and collaborative tool
was a huge part of engaging the community, documenting their input and allowing them to see
it, and ultimately getting widespread knowledge and acceptance of the planning process, or
what we like to call “creating a culture of planning.”
UMass is now well on its way to creating a Smart Campus by developing the infrastructure to
bring information together and make it easily accessible to all decision makers in the many ways
they need it to visualize and understand it. We have hired Stepanov to a full-time GIS Architect
position that I fought hard to put under the IT infrastructure even though he still has an office in
Campus Planning, another example of collaboration. We now have great data, a powerful
hardware architecture, incredible software tools to support a Smart Campus. However, I would
argue that the work flows and procedures that we are developing, along with the cooperation
among the many people involved, are the real keys to the success of our endeavor. The
configuration of our GIS Steering Committee is reflective of the understanding that
communication and collaboration are keys to a Smart Campus.

2013 Specialist Meeting—Advancing the Spatially Enabled Smart Campus Lovegreen—43
Influencing Behavioral Change
through GIS/Smart Campus Initiatives
MO LOVEGREEN Director, Campus Sustainability
Executive Officer, Department of Geography University of California, Santa Barbara
Email: [email protected]
ow can we use GIS and the Smart Campus Initiatives to help us improve sustainability
efforts? Are there any best practices to help us garner high levels of participation? How do
we take advantage of campus data sets to display information? How do we spatially display this
data to so it makes sense to end users and helps influence and incentivize positive behavioral
change? These are just a few of the questions we are looking at from the sustainability perspective.
Let’s explore just one area, energy conservation, through behavioral change to look at this
issue. Energy conservation is an important component in any plan to reduce Greenhouse Gas
(GHG) emissions from building energy use. Our new President, Janet Napolitano, has set a
target of climate neutrality by 2025. In order to achieve this level of energy conservation it is
essential that a program inform energy consumers of their present and historical energy use,
provide them with examples of energy-saving measures and activities, and give frequent, even
real-time, feedback on how their energy use compares to “social norms.” In addition, a
successful program builds on making users “energy aware” by motivating individuals to get
involved, identifying and supporting committed individuals, and rewarding users for reducing
energy waste. A number of programs on campus induce behavioral change and reduce energy
waste, such as PowerSave Campus, LabRATS, and The Green Initiative Fund. However, more
robust efforts, like the Smart Campus Initiatives, need to be taken in order to meet the
aggressive emissions reduction goals our campus has set. UC Berkeley estimates that they will
see a persistent electricity consumption reduction of 3‐5% through their behavioral
change/energy incentive program,i and evidence from campus residence halls indicates that
even higher reductions are potentially achievable. UCSB forecasts a 5% reduction in total
electricity use through the Energy Incentive Program (EIP), which would reduce CO2 (e) emissions
by 3,149 MT CO2 E annually.
% Reduction Energy savings (kWh/
Year)
Electricity cost savings ($/year)
GHG Savings(MT
CO2E/yr)
Program costs
Payback Period
3% Reduction 6,390,595 $671,012.42 1,916 $558,750 8. 3 months
5% Reduction 10,651,001 $1,118,355.07 3,194 $558,750 4.9 months
10% Reduction 21,302,001 $2,236,710.13 6,388 $558,750 2.5 months
As part of the University of Cambridge’s Energy and Carbon Reduction Project, a laboratory
pilot program (that did not take advantage of GIS tools or spatial displays) at the university’s
H

2013 Specialist Meeting—Advancing the Spatially Enabled Smart Campus Lovegreen—44
Gurdon Institute utilized behavioral change towards energy use to successfully garner energy
reductions throughout a department.ii The pilot program achieved a 76% participation rate
across the department and achieved an overall reduction of 19% in energy usage over a 5-month
period.iii
Looking at behavioral changes as a portion of the mechanism to help fund programs is a
strategic way to move initiatives forward in the current financial climate at public universities. If
we can successfully develop visual imagery via GIS/Smart Campus initiatives to spatially display
information that could influence users, this same strategy could apply to the areas of waste,
water, procurement, food, the built environment, transportation, the landscape/biotic
environment, etc.
i Energy Incentive Program Design. Rep. University Of California, Berkeley, 1 Apr. 2012. Web. 3 Dec. 2013. ii University of Cambridge Energy and Carbon Reduction Project. (2012). Introducing Behavioral Change Towards Energy Use. Retrieved from http://www.gurdon.cam.ac.uk/downloads_public/green/Gurdon-behavioural-change.pdf iii University of Cambridge Energy and Carbon Reduction Project. (2012). Introducing Behavioral Change Towards Energy Use. Retrieved from http://www.gurdon.cam.ac.uk/downloads_public/green/Gurdon-behavioural-change.pdf
2013 Specialist Meeting—Advancing the Spatially Enabled Smart Campus Nelson—45
Campuses Need to be Fully Spatially Enabled
JAMES NELSON
Director of Planning Resources Department of Harvard Planning and Project Management
Harvard University Email: [email protected]
olleges and Universities strive “to create knowledge, to open the minds of students to that knowledge, and to enable students to take best advantage of their educational
opportunities.”1 A spatially enabled campus is better suited to the creation and dissemination knowledge and what is currently lacking to achieve a fully spatially enabled campus are methods of accurately determining individual location and presence. What needs to be in place for a spatially enabled campus? Many campuses have a geographic information system, space system, and facility and asset management system(s). Spatial enablement starts with having these systems in place and having them integrated by sharing common spatial nomenclature so data can be matched spatially. For example, floor plans georeferenced so that they are placed in the campus context and assets that are located by room identification and\or coordinates. This integration can be expanded to include human resources, financial, transportation, security and other systems. Not until a core of integrated spatially aware systems is in place can the full potential of an enabled campus realized – a campus where individuals can take full advantage of the campus context and a campus that can use the presence of individuals to support planning and operations. Until the location of the individual is accurately known there is no way to answer these questions: “how close is?”, “how to get there?”, “what is going on nearby?”, “what information should be conveyed to this person because they are here?”, “where is this person?” and “Is there anybody present?”.
Thinking big requires a campus that is spatially aware of the individual and critical assets in its entirety across its facilities both within and outside of buildings with a level of accuracy that is not achievable using current GPS and Wi-Fi methods. There must be locational infrastructure on which the campus population and visitors can rely. To achieve this end requires development of location technology and devices that are as ubiquitous as data jacks, life safety systems, and lighting fixtures. The technology is available now and all that is needed is the demand to create the financial incentive for development. Two methods of location are needed. The first is enablement of the individual through a smart device to accurately determine their location inside and outside of buildings and the second is the ability of campus systems to identify locations where individuals are present independent of the presence of a smart device. Privacy must be protected so sharing of location and individual identity should be left to the individual and presence detection needs to be anonymous.
One possibility for the individual to identify their location could be the development of a uniquely identifiable transmitter that incorporates ultrasound and radio waves (like blue tooth) that emits simultaneous sound and radio signals to enable smart devices to determine their precise location based on a dataset of transmitter locations, distance based on lag between
C

2013 Specialist Meeting—Advancing the Spatially Enabled Smart Campus Nelson—46
radio and sound wave, and triangulation of multiple sources. The ability to detect the presence of individuals in a location could be provided by sensors that detect motion and relay presence via wifi or other network system to a central system and database. This method of presence detection will provide better information for building usage, systems and emergency response than requiring the presence of a smart device (which can be present without a person or an individual may not have one).
The transmitters and sensors could be embedded in life safety or lighting systems equipment like exit signs, emergency lighting, or light switches. This would be similar to current implementation of motion detectors in the light switches. This way the devices can easily be incorporated into new construction and campus furniture and they can be easily retrofitted into existing facilities. They would need to be inexpensive, have low power requirements and remain functional in the event of a power outage. The technology, methodology, and algorithms should be unencumbered by licensing and patents to minimize costs. With the advent of building information modeling for new construction and renovations there is the capability to incorporate the devices into geo-referenced three dimensional models and extracting the transmitter and sensor locations. What opportunities does spatially enabling a campus create? A spatially enabled campus that enables individuals to be spatially aware of the campus context and that enables the campus to be aware of presence can be leveraged to support creation and dissemination of knowledge, to enable students to take greater advantage of the educational experience, and to allocated resources appropriately.
(1) Information collection that supports campus planning and operations so that facility systems, services and energy savings maximize resources for pedagogical priorities. This spatially aware information supports efficient use of space and energy, a safe campus environment and provides core information needed to support programming and physical planning. Information collection methods include user generated geographic information, crowd sourcing, presence information collection through sensors. Examples of applications include crowd sourcing facility condition issues, synthesis and analysis across time with spatially integrated systems and datasets to develop holistic campus models for usage of facilities over time to determine operational efficiencies, the ability to implement hoteling to reduce office space requirements, and development of dashboards that support operational activities in real time. Why clean a room that no one has been in since the last time it was vacuumed?
(2) Creation and dissemination of knowledge by reducing barriers to collaboration. Examples include ease of locating collaborators, arranging meeting locations, changes to teaching methodology whereby faculty hold office hours where the students are located by broadcasting availability and location.
(3) Geo-centric Information sharing by broadcasting information to individuals within a geographic area or posting information to a geographic location for public or group use. Examples include broadcasting educational, amenity related and emergency announcements to individuals within a portion of the campus.

2013 Specialist Meeting—Advancing the Spatially Enabled Smart Campus Nelson—47
(4) Campus Amenity that is used for social interaction.
Examples include peer to peer “this is where I am (or we are) now.” How can the case be made to spatially enable a campus? The case for a fully spatially enabled campus needs to be made with university administrators. Having industry examples that illustrate the usefulness of a spatially enabled campus will assist in this process. These examples should be focused on innovations in education, planning and\or operations that have led directly to improvements and\or savings. The examples need to be showcased in appropriate journals (not an ESRI publication) and should not focus on the spatial enabled campus but on the innovation itself. For example (hypothetically) an article in the Chronicle of Higher detailing a program by which faculty have dramatically increased their face time with students by moving office hours out of their offices into dynamic learning spaces (which by the way was made possible by a spatially enabled campus). For these examples and for full implementations, measurement should be in place to determine usefulness and return on investment. Usefulness might be measured by determining whether the spatial infrastructure is being used regularly and has been incorporated into systems and decision making. The ROI will need to be determined by demonstrating improvement in services, energy savings, and more efficient space use resulting in reduced space needs. We will likely find that over time the spatially enabled campus will be the expectation and not the exception. 1Harvard College Mission Statement

2013 Specialist Meeting—Advancing the Spatially Enabled Smart Campus Olivares—48
Sustainability and Smart Campuses
MIRIAM OLIVARES
GIS Coordinator Map and GIS Library
Texas A&M University Email: [email protected]
I. The Smart Campus
he implementation of sustainability in university settings is driven not only by the urgent
need to stop the depletion of the Earth and contribute to healthier communities, but also to
deal with limited operating budgets. The concept of sustainability was widely welcomed after
the private sector recognized economic gain derived from the implementation of sustainable
practices. The complexity and size of campuses offer opportunities to improve operations and
increase the efficiency of human and financial capital.
Smart campuses should operate with fewer resources and promote socially responsible
practices. Additionally, smart campuses should integrate cutting-edge technology not only to
operate campus components, but also to provide the most efficient and intelligent systems to
support research and teaching endeavors.
Some aspects to be considered to operate smart campuses are:
Efficient use of spaces and assets (i.e. online learning, e-surplus database management) Energy saving and efficiency (i.e. adequate indoor temperature, light auto-shutdown, student
schedule coupled with minimum transportation needs, electric car charging stations) Re-use of resources -less for more (i.e. water bottle refill stations, bike sharing and carpooling) Indigenous materials, native landscaping and composting, recycled water and efficient
irrigation practices Promoting new inventions and technology for green practices Upgrading obsolete buildings, infrastructure, vehicles and machinery Establishing intelligent systems to promote conducive learning environment (i.e. teaching
technology, air quality, human interaction with nature) Promoting among faculty members the implementation of new creative teaching methods to
effectively engage the digital-native generations
II. Leveraging on crowdsourcing and geospatial technologies The internet had increased exponentially the speed in which communication travels from citizen
to citizen and from communities to communities. Lessons learned and best practices from peer
institutions are shared rapidly through institutional channels as well as informal means of
communication such as social media. Sharing data of and within campuses is essential to
understand the way the components operate and interrelate; a master interactive map – with a
data mining mechanism- should be in place in any given smart campus. Proposing changes and
taking action in a timely manner, based on real-time data-driven analyses, may result in a more
efficient operation.
T

2013 Specialist Meeting—Advancing the Spatially Enabled Smart Campus Olivares—49
Smart campuses should leverage on volunteered geographic information (VGI) and geo-
enabled web services to increase community capacity building. The mission of the Office of
Sustainability at Texas A&M University is to educate the community about the importance of
sustainability and promote sustainable practices. I recently facilitated the collaboration between
the Office of Sustainability, the Map & GIS Library and the GeoInnovation Service Center. The 3-
unit group is planning a massive crowdsourcing data collection event, Crowdsourcing for
Aggieland Sustainability, to help identifying and interactively map all sustainable items across
campus, geotag any issues to be resolved or malfunctioning of campus features, and propose
wish-list items at specific locations. The outcome of this VGI event will help the Office of
Sustainability to review pressing reported issues, innovative proposed ideas, and also obtain an
inventory of sustainable initiatives present at Texas A&M. An existing green fund may allow
solving reported issues and implementing wishes proposed by the campus “citizens.” We plan
to rely on geospatial technology to display real-time data, allowing the “crowd” to
collaboratively and interactively collect the data while a needed interactive map will be
generated to integrate the sustainable components of our campus.
Likewise, other initiatives using smart devices can be launched to promote green practices. For
instance, campus users could rely on phone apps to measure individual gas savings by
measuring walking, biking or carpooling, apps to calculate the shortest route, apps to show
water or energy refill stations, etc. Currently, transportation services operate GPS-enabled mass
transit units, allowing riders to track buses location from their smart devices. Additional efforts
may be proposed and implemented to increase efficient and intelligent systems at our fingertips. III. Smart Campuses Fueling Intellectual Development Often times we learn about workshops and research groups studying water management on
campus, green roofs opportunities, energy-efficient building design, and other initiatives.
Interdisciplinary studies and research are promoted across campus to challenge students to
learn real cases and find real solutions.
The objective to generate a smart campus with sustainable grounds may fuel many
opportunities to innovative design, technology development and patents, critical thinking and
problem solving. The availability of databases and real issues to be solved can serve as a
learning lab for students, giving as a result an immersive educational experience. Programs of
community outreach can be promoted among different disciplines, allowing students to apply
successful concepts already tested within the campus settings. Funding to promote green and
collaborative initiatives can be offered to researchers and faculty members who lead research
and teaching endeavors. Texas A&M University has about 900 student-run organizations, each
organization could be required to launch at least one sustainable initiative. Teaching initiatives
should be modeled towards a smart campus and with the overall goal to fuel discovery and
enhance the learning experience of every undergraduate and graduate student.

2013 Specialist Meeting—Advancing the Spatially Enabled Smart Campus Olivares—50
Smart campuses can be promoted not only through a top-down approach with university
officers and administrators making decisions, but also as a grass-root movement with everyone
committed to generate and analyze accurate, real-time, relevant data.

2013 Specialist Meeting—Advancing the Spatially Enabled Smart Campus Potapenko—51
Advancing the Spatially Enabled Smart Campus
JOHN POTAPENKO Graduate Student, Department of Geography
University of California, Santa Barbara Email: [email protected]
he advent of high-resolution LiDAR (Light Detection And Ranging) data over the last
decade has created unique opportunities for integrating 3-dimensional structural
representation of urban and natural landscapes with traditional geospatial technologies. Spatial
maps and services are no longer restricted to portraying 2-D and 2.5-D layers of real world
objects – holistic structural representation of surfaces and objects with high spatial resolution is
now feasible. We contend that any modern “spatially enabled smart campus” should make use
of 3-D data when appropriate. A 3-dimensional representation of buildings, trees, and other
campus features not only enhances spatial navigation (e.g. real-world walk-throughs), but also
provides valuable urban land-use metrics that can be used to improve campus sustainability and
planning (e.g., calculating carbon footprint, solar insolation modeling, capturing changing
ecosystems, flood modeling, etc). Repeat observations of the campus allow for the creation of
4-D datasets, with the added temporal component documenting historic snapshots, campus
growth, and rates of change.
Aerial lidar provides sub-meter resolution data over large spatial extents (e.g., whole
cities/states), while terrestrial lidar provides cm-level resolution of smaller scenes (typically < 1
km, but can be larger depending on time and effort). Burgeoning, inexpensive, “portable” lidar
devices (e.g. Kinect sensor) provide possibilities of real-time use by the general, non-technical
population and can extend VGI (volunteered geographic information) to include 3-dimensional
data. The 3-D data can then be visually represented in a number of ways: laser point returns
(“point cloud”), constructed real-color surfaces (e.g. triangulated surface meshes of Triangulated
Irregular Networks, or TINs), as well as traditional high-resolution raster/vector products. The
data can be observed as a simulated 3-D experience through stereoscopic and anaglyphic
methods, or interactively projected on two-dimensional planes through 3-D computer graphics
rendering technologies (e.g. Google Earth and WebGL). The rise of modern GPU (Graphics
Processing Unit) accelerated web browsers over the last 1-2 years on desktop computers, tablets,
and mobile devices allows for 3-D data to be easily visualized and manipulated. Such
technological advances are “closing the gap” between expensive, technical lidar
devices/software and the common user – the commonplace “map” is quickly becoming a digital,
interactive, multi-layered, search-enhanced 3-D simulation/augmentation of the real world.
Adding a detailed 3-dimensional component to campus features has a number of immediate
benefits. Building areas and volumes can be accurately represented, providing a clear picture of
campus resource use. Accurate 3-D modeling of annual solar insolation distribution can be used
T
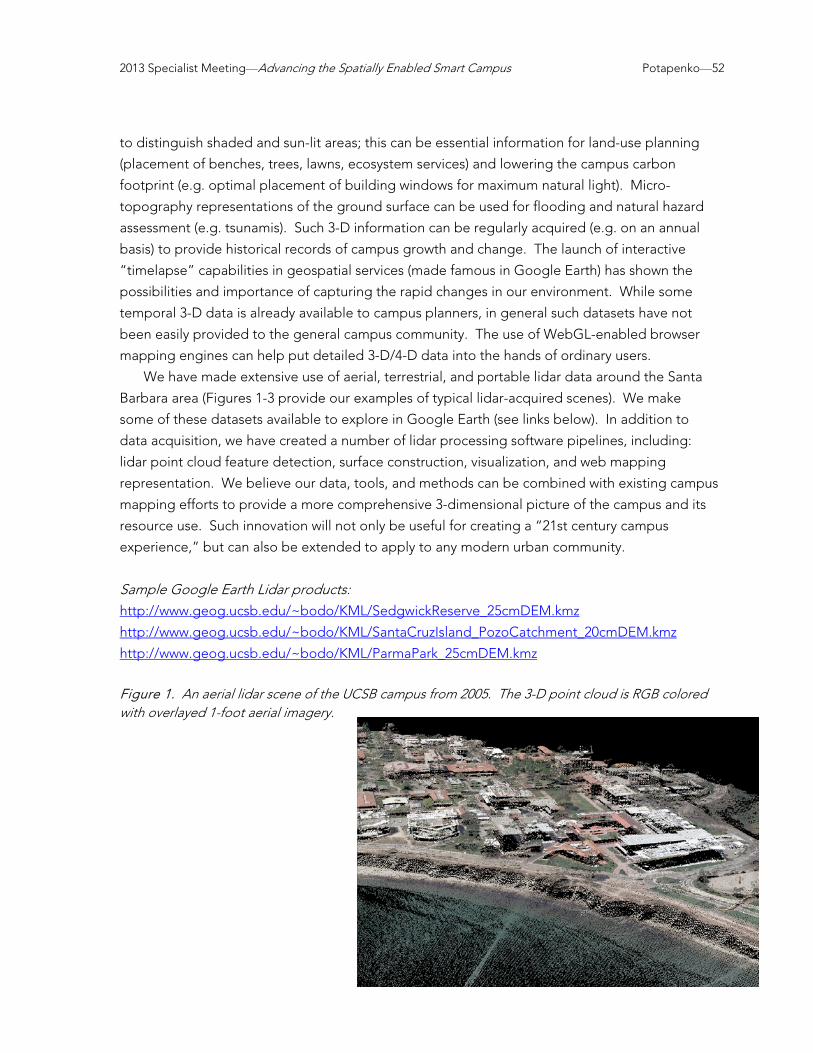
2013 Specialist Meeting—Advancing the Spatially Enabled Smart Campus Potapenko—52
to distinguish shaded and sun-lit areas; this can be essential information for land-use planning
(placement of benches, trees, lawns, ecosystem services) and lowering the campus carbon
footprint (e.g. optimal placement of building windows for maximum natural light). Micro-
topography representations of the ground surface can be used for flooding and natural hazard
assessment (e.g. tsunamis). Such 3-D information can be regularly acquired (e.g. on an annual
basis) to provide historical records of campus growth and change. The launch of interactive
“timelapse” capabilities in geospatial services (made famous in Google Earth) has shown the
possibilities and importance of capturing the rapid changes in our environment. While some
temporal 3-D data is already available to campus planners, in general such datasets have not
been easily provided to the general campus community. The use of WebGL-enabled browser
mapping engines can help put detailed 3-D/4-D data into the hands of ordinary users.
We have made extensive use of aerial, terrestrial, and portable lidar data around the Santa
Barbara area (Figures 1-3 provide our examples of typical lidar-acquired scenes). We make
some of these datasets available to explore in Google Earth (see links below). In addition to
data acquisition, we have created a number of lidar processing software pipelines, including:
lidar point cloud feature detection, surface construction, visualization, and web mapping
representation. We believe our data, tools, and methods can be combined with existing campus
mapping efforts to provide a more comprehensive 3-dimensional picture of the campus and its
resource use. Such innovation will not only be useful for creating a “21st century campus
experience,” but can also be extended to apply to any modern urban community.
Sample Google Earth Lidar products: http://www.geog.ucsb.edu/~bodo/KML/SedgwickReserve_25cmDEM.kmz
http://www.geog.ucsb.edu/~bodo/KML/SantaCruzIsland_PozoCatchment_20cmDEM.kmz
http://www.geog.ucsb.edu/~bodo/KML/ParmaPark_25cmDEM.kmz
Figure 1. An aerial lidar scene of the UCSB campus from 2005. The 3-D point cloud is RGB colored with overlayed 1-foot aerial imagery.
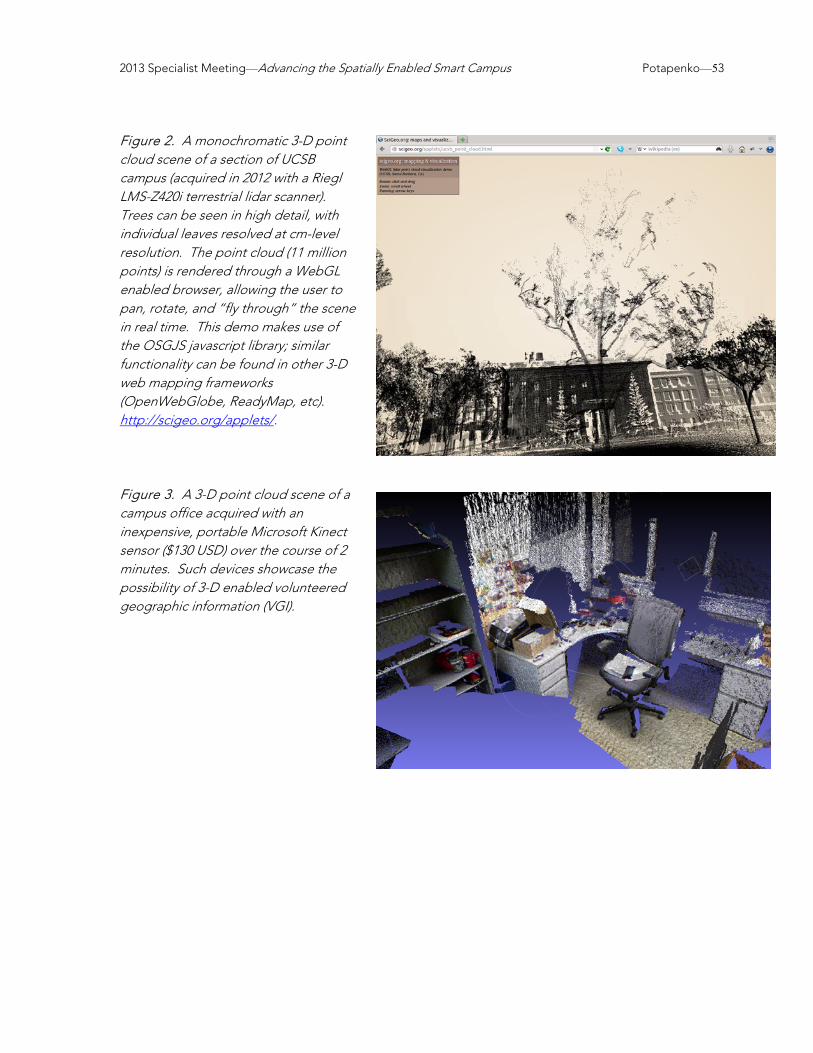
2013 Specialist Meeting—Advancing the Spatially Enabled Smart Campus Potapenko—53
Figure 2. A monochromatic 3-D point cloud scene of a section of UCSB campus (acquired in 2012 with a Riegl LMS-Z420i terrestrial lidar scanner). Trees can be seen in high detail, with individual leaves resolved at cm-level resolution. The point cloud (11 million points) is rendered through a WebGL enabled browser, allowing the user to pan, rotate, and “fly through” the scene in real time. This demo makes use of the OSGJS javascript library; similar functionality can be found in other 3-D web mapping frameworks (OpenWebGlobe, ReadyMap, etc). http://scigeo.org/applets/. Figure 3. A 3-D point cloud scene of a campus office acquired with an inexpensive, portable Microsoft Kinect sensor ($130 USD) over the course of 2 minutes. Such devices showcase the possibility of 3-D enabled volunteered geographic information (VGI).

2013 Specialist Meeting—Advancing the Spatially Enabled Smart Campus Pultar—54
Utilizing Mobile Devices for Sensor Networks
EDWARD PULTAR
President, Founder, Spatial Scientist Valarm
Email: [email protected] www.valarm.net
y position for this meeting takes advantage of the global proliferation of mobile devices
(e.g., phones, tablets, mini-PCs) combined with internal and external (via Bluetooth and
USB) sensors. Both today’s and yesterday’s mobile devices are powerful computers connected
to the Internet via cell networks and WiFi. They are plenty capable for monitoring, measuring,
and responding to environmental factors such as air quality, temperature, pressure, and humidity.
All sensor data (including GPS location) can be uploaded in real-time using 3G/4G networks
and/or WiFi to a web SaaS for mapping, visualization, graphing, analysis, and data download.
Whenever there is a loss of connectivity, data is stored locally on the device and uploaded
immediately upon the return of connectivity.
Some scenarios and use cases require regular intervals of data collection (e.g., every 10
seconds or every 15 minutes) such as asset tracking or remote environmental monitoring. Other
scenarios require responses based on critical thresholds of sensor values, e.g., send me a text
message when the temperature goes below 36 degrees Fahrenheit or when Volatile Organic
Compounds (VOCs) or CO2 reaches a level higher than 2000 ppm. Android devices are easily
capable of all of this plus a lot more that you can imagine when you start thinking about what
sensors are available and the connectivity of a phone.
Valarm is an Android app currently available that does what is described above. It is
compatible with a variety of sensors and has an integrated web SaaS ( Valarm Tools:
http://tools.valarm.net ) where all sensor data is uploaded for mapping, visualization, graphing,
data download and analysis. Combined with any power source (e.g., solar power, wall, vehicle
accessory port) Valarm provides affordable remote environmental monitoring, mobile data
acquisition, and asset / fleet tracking.
Currently supported sensors include, but are not limited to:
Motion / acceleration
Maximum speed
Maximum range
Distance to target
Ambient light
Microphone/audio
External power
Interval timer
OBD2 (vehicle speed, engine RPMs, coolant temperature, and throttle position)
Ambient temperature
M

2013 Specialist Meeting—Advancing the Spatially Enabled Smart Campus Pultar—55
Relative humidity
Barometric pressure
Electrical resistance (used for water levels, flood alerts, potentiometers, gases, switches,
soil moisture, leaf wetness, force-sensitive resistors, photo-resistors, and any sensor
which operates by altering resistance)
Air quality (CO2 and Volatile Organic Compounds, VOCs) Smart cities and campus are excellent scenarios for Valarm’s capabilities. All of the sensors
and other networks needed to enable smart campus services are already available and working
with Valarm: Android, USB & Bluetooth sensors, GPS, WiFi, 3G/4G cellular networks. Tracking
transit vehicles is one example where buses and public transit resources can be shared with the
public (e.g., where is the bus right now). However, at the same time these vehicles can use
Valarm to gather air quality data (e.g., VOCs) such that you and the public will be able to create
pollution maps in real-time and decide where and how you want to travel based on current
conditions.
All of the historical Valarm mobile sensor data can also be downloaded and analyzed by
researchers to examine trends and understanding diurnal and seasonal factors. What is the air
quality (VOCs & CO2) of the campus during the day vs. at night? How about noise, light, and
dust levels? Inside buildings and outdoors these sensors alert you to the presence of water and
flooding. How about a gas leak? Based on real-time indoor air quality (iAQ) conditions, Valarm
can not only send alerts but also trigger a switch to ameliorate the situation, i.e., open a window
and/or turn on a fan. Campus gardens, agriculture, hydroponics, viticulture, and other similar
scenarios also benefit from Valarm’s real-time remote environmental monitoring. Temperature,
humidity, and barometric pressure can be gathered at regular intervals to perform studies on
mildew and mold in plants (correlated with humidity values) and also predict plus avoid plant
damage or loss due to extreme cold or heat. Instant alerts also let you and/or the researcher
know when action needs to be taken to prevent an undesirable situation.
Smart campus databases and resources also contribute to teaching and research opportunities
for students and faculty. Faculty can ask students to use Valarm for affordable mobile data
acquisition. Students then gather geotagged sensor data with a mobile device and combine the
data with additional VGI then bring the data into a GIS for further analysis in 2D and 3D.
A recent example of Valarm being used for research is from Summer 2013 when Valarm was
used to assess biodiversity while learning about the environments and behavior of insects and
bees. This was a collaborative research project with the Page Museum at the La Brea Tar Pits, the
Entomology Department at the Los Angeles Natural History Museum, and the BioSCAN
biodiversity project. Valarm units were deployed to help this research and remotely monitor the
micro-climate at multiple bee hotels in the Los Angeles area. The goal of the project is to assess
biodiversity in local leafcutter bees (Megachile) and bee nest cell construction. More information
on this and other uses is available on Valarm’s blog at www.valarm.net.

2013 Specialist Meeting—Advancing the Spatially Enabled Smart Campus Pultar—56
Valarm gains an advantage over other sensor network technologies by utilizing commodity
hardware and not needing any custom development, every piece is already widely available
around the world. The mobility and flexibility of using phones, tablets, or any Android device is
another benefit. Mobile devices are only becoming more affordable yet they are powerful,
connected, compute-capable, and sensor compatible, which is something Valarm takes full
advantage of in order to let anyone in the world “Monitor Anything, Anywhere™.”
Figure 1. The Valarm app supports a variety of internal and external sensors (via USB & Bluetooth) for remote environmental monitoring,
mobile data acquisition, and asset tracking.
Figure 2. The Valarm app is integrated with the http://tools.valarm.net website where you can perform mapping, graphing, analysis, and download your sensor data.

2013 Specialist Meeting—Advancing the Spatially Enabled Smart Campus Ramasubramanian—57
Making the Business Case for the “Smart” Campus: Using Geo-spatial Data and VGI to Support
Transformational Leadership
LAXMI RAMASUBRAMANIAN Director, Urban Sustainability Extension Service
Associate Professor of Urban Planning and Design Hunter College, City University of New York
President, University Consortium for Geographic Information Science Email: [email protected]
Context he historical evolution of the American university has always been shaped by high minded
ideals of knowledge acquisition for its own sake, balanced with pragmatic concerns about
acquiring practical and marketable skills. At present, over 21 million students are enrolled to
attend one of over 4500 institutions of higher learning in the United States. Most of them are in
pursuit of academic credentials that can lead to gainful employment. Yet, the higher education
system is severely challenged by declining public investment, soaring costs related to
employees’ retirement and health benefits, and escalating student debt. As the nation’s
universities and colleges experience a crisis-induced transformation, it seems prudent to make a
business case for just about any issue that we want our campus leaders to focus their attention.
In this position paper, I intend to make three linked arguments – first, that addressing the issues
of sustainability and human-induced climate change is one of the most dominant challenges of
our time; second, that our colleges and universities are collectively well positioned to address
these challenges by using their physical settings and sites for pragmatic interventions in addition
to their more conventional contributions in the areas of research and teaching; third, that the
potential of the use of geospatial technologies to facilitate innovative decision-making about
sustainability and climate change at the campus level remains largely untapped. I will conclude
by describing some opportunities for institutional collaboration and action around these issues
where the engagement of industry and community partners can make a meaningful contribution.
In my presentation, I will discuss the specific case of Portland, Oregon. Why Sustainability, Why Now?
The impacts of rapid population growth and human-induced climate change have made
addressing sustainability one of the more pressing and challenging issues of our time. In the
literature and in accepted best practice, addressing sustainability often means considering the
triple bottom line— balancing economic, social, and environmental considerations to assure
smooth operations within an organization. For institutions of higher learning, championing the
sustainability agenda appropriately includes addressing the educational and research mission as
well. Beyond the philosophical and moral imperatives to consider sustainability, the threat of
human-induced climate change impacts on our cities and communities challenges leaders across
T

2013 Specialist Meeting—Advancing the Spatially Enabled Smart Campus Ramasubramanian—58
all sectors to work on practical and measurable interventions. In a recent study of 1000 CEOs
across the world that included 27 industry sectors in 103 countries, 29% of CEOs regarded
climate change as one of the most important sustainability challenges for the success of their
businesses while a full 67% of respondents indicated that business was “not doing enough” to
address global sustainability challenges (Accenture, 2013). One of the main points made by the
business sector is that there is a need to address the issue of scale— to understand the
magnitude of problems, to respond appropriately, and to move from incremental achievements
towards “a new global architecture” to balance the complexity of the challenges. Other
concerns raised by the business sector include the need for intelligent infrastructure that
supports collaborative decision making and supports a serious multi-directional dialog with a
variety of stakeholders. Enlightened business leaders recognize that they need to engage
government regulators, policymakers, industry peers, consumers, NGOs, investors, shareholders,
employees, and labor unions to achieve sustainability goals and address climate change and
associated challenges. What is the Role of the University in Promoting a Sustainability Agenda?
Universities and colleges have always been centers of innovative thinking. The American model
of the land grant/extension service program developed in the late 19th and early 20th century
firmly established the ideal of extending the knowledge and expertise present within the
academy in service of the region. While the traditional extension programs had many positive
benefits such as providing expertise and guidance to improve farming practices, they also
created a hierarchical relationship that sometimes devalued local knowledge and experience.
Yet, the land grant/extension service model, supported through government funding
fundamentally changed rural America. More recently, the student protests and activism of the
1960s helped foster university-based design/planning centers that focused on addressing
community concerns. These efforts, largely urban, developed innovative models of community
outreach and engagement to harness resources available within the university to respond to the
needs of the neighborhood surrounding the university. The community-university partnership
model, also supported with federal funding, has helped to shape urban America. In the 21st
century, there is an urgent need for universities and colleges to provide expertise, experience,
and guidance to address sustainability related challenges. Both models of university-based
engagement with communities can be usefully deployed to address sustainability challenges
and in fact many universities are doing exactly that. However, sustainability related activities and
investments in universities and colleges are largely uncoordinated. The physical configuration of
a typical American university campus with multiple physical locations and an increasingly
emergent online presence further compounds this problem. As our populations become
concentrated in urban areas, urban serving universities, in particular, have to directly confront
these challenges through direct services provision, training, and capacity building. Universities
can also serve as test beds for innovative ideas that are backed by “good” science and make the
science accessible to support individual and community empowerment. Lastly, the technological

2013 Specialist Meeting—Advancing the Spatially Enabled Smart Campus Ramasubramanian—59
and data infrastructure now allow for citizen science efforts in the area of addressing
sustainability challenges that offer great promise to support a distributed and decentralized
approach to problem solving. Campus Sustainability – Modeling and Embedding Best Practices
According to Ferdig (2007), “sustainability leadership reflects an emerging consciousness among
people who are choosing to live their lives and lead their organizations in ways that account for
their impact on the earth, society, and the health of local and global economies.” (p. 26). In the
context of the American university setting, the university is made up of at least three distinct
interest groups, administration/staff, faculty, and students. Thus, leadership on a university
campus to address sustainability challenges almost always requires conversations and processes
of work flows that are agreed upon through consensus before any actions can occur. Thus
advocacy becomes an integral element of leadership on university campuses. In addition,
university and campus leaders cannot use a narrow interpretation of sustainability in
energy/environmental terms alone and must consider social sustainability as well. There are
many successful models that support best practices in addressing sustainability challenges.
The American College and University President’s Climate Commitment (ACUPCC) is an
alliance of college and university presidents who have voluntarily chosen to use their positions of
leadership to create comprehensive climate action plans using collaborative and transparent
processes within their own institutions. The goal is to achieve climate neutrality (net zero) in
specific campus operations, promoting education, research, and development of specific
solutions to address climate change challenges and to publicly report on their progress. At the
end of 2012, 677 universities have signed the ACUPCC commitment directly and indirectly
engaging over 6 million students. 1583 GHG inventories and 465 climate action plans have been
submitted and these plans can be evaluated and monitored by the public. The ACUPCC
engages all sectors of the higher education spectrum from public to private, from community
colleges to research intensive universities, and in all 50 states.
The Sustainability Tracking, Assessment, and Rating System (STARS) developed by the
American Association of Sustainability in Higher Education (AASHE) is a reporting framework
designed by higher education professionals for higher education institutions to measure and
manage their sustainability performance. STARS is designed to:
Provide a framework for understanding sustainability in all sectors of higher education; Enable meaningful comparisons over time and across institutions using a common set of
measurements developed with broad participation from the campus sustainability community; Create incentives for continual improvement toward sustainability; Facilitate information sharing about higher education sustainability practices and performance; Build a stronger, more diverse campus sustainability community
(Source: https://stars.aashe.org/pages/engage/stars-overview.html)

2013 Specialist Meeting—Advancing the Spatially Enabled Smart Campus Ramasubramanian—60
In addition to these comprehensive efforts, there are many individual efforts ongoing at several
university campuses. In my presentation I will discuss the ongoing work of the Urban
Sustainability Extension Service at Hunter College and the work of the Institute for Sustainable
Solutions at Portland State University. If the participants at this meeting are in agreement with
my view that what can get measured can get managed— in other words, that assessments and
tracking are incredibly useful to support the cause of sustainability, then the ACUPCC’s efforts
and the STARS assessments must be applauded and supported by our GIScience community
and our expertise and experience must be linked within these reporting efforts. How can Geo-spatial Data and VGI Support These Efforts?
The ACUPCC Climate Action Plans and the STARS rating systems both track different activities
that occur on a university campus. In STARS, there is a focus on Academics; Engagement
(campus and public); Operations (including building management, grounds, dining, energy,
purchasing, water, waste, and transportation); and Planning and Administration. Similarly the
ACUPCC plans focus on investments in research, curriculum/teaching, and community
engagement in addition to measuring the impacts of new construction, transportation, and other
campus operations like purchasing. Both these systems are simplified to make reporting and
data collection less onerous. Yet, they focus on a static approach to data collection, measuring
information in specific reporting time intervals. In addition, both these efforts seem particularly
void of spatial thinking and reasoning.
I believe it would be an interesting challenge to explore how the ICT and visualization
experts assembled at the Spatial Campus meeting can engage with efforts from the higher
education community to develop a more robust data collection schema into the data collection
efforts. Engaging citizens (students, faculty, employees and administrators) as participants in the
data collection can be a big data challenge and an opportunity. It will be intriguing to explore
how the static data collection protocols can be transformed to be a more time-sensitive data
collection and analysis effort. It would be reasonable to expect that protocols be established to
support open source data tools used and that a transparent data infrastructure is adopted. In
addition, there will be a great need to support data and information literacy across the university
and facilitate protocols for data ownership and ethical data sharing including providing opt-out
options for people/groups who can choose “”not to be sensed” (Rockefeller Foundation, 2013).
Selected References ACUPCC, 2012. Celebrating Five Years of Climate Leadership: The Progress and Promise of the
American College and University Presidents’ Climate Commitment. Available from http://www.presidentsclimatecommitment.org/reporting/annual-report (retrieved 12/1/2013).
Aud, S., Wilkinson-Flicker, S., Kristapovich, P., Rathbun, A., Wang, X., and Zhang, J, 2013. The Condition of Education 2013 (NCES 2013-037). U.S. Department of Education, National Center for Education Statistics. Washington, DC. Retrieved [date] from http://nces.ed.gov/pubsearch (retrieved 12/1/2013).

2013 Specialist Meeting—Advancing the Spatially Enabled Smart Campus Ramasubramanian—61
Bertels, S. Papania, L, and Papania, D. 2010. Embedding sustainability in organizational culture: A
systematic review of the body of knowledge. Network for Business Sustainability. http://www.nbs.net/wp-content/uploads/Systematic-Review-Sustainability-and-Corporate-Culture.pdf (retrieved 12/1/2013).
Bressers, M. M. 2012. Sustainable Operations at Portland State University: Relevant Organizational Issues and a Path Forward. Thesis submitted in partial fulfilment for the requirements for the degree of Master in Urban Studies, Portland State University. Dissertations and Theses. Paper 504. http://pdxscholar.library.pdx.edu/open_access_etds (retrieved 12/1/2013).
Diamond, H. 2012. Empowering sustainability leaders: developing an authentic leadership identity. Leadership for Sustainability Education Comprehensive Papers. Paper 4. http://pdxscholar.library.pdx.edu/lse_comp/4 (retrieved 12/1/2013).
Dyer, G & J Andrews, undated. Higher Education’s Role in Adapting to a Changing Climate. American College and University Presidents’ Climate Commitment & Second Nature. Available from http://www.presidentsclimatecommitment.org/files/documents/higher-ed-adaptation.pdf (retrieved 12/1/2013).
Ferdig, M. (2007). Sustainability leadership: Co-creating a sustainable future. Journal of Change Management 7(1): 25–35. Gonzalez, N., L. Ramasubramanian, A. Ali, & A. Eichelkraut (2005). Organizing Partnerships for
Sustainable Community Economic Development: Lessons Learned from the University of Illinois-Chicago Neighborhoods Initiative. Journal of Higher Education Outreach and Engagement 10(2): 69–84.
Hayward, R and others, 2013. The UN Global Compact— Accenture CEO Study on Sustainability: Architects of a Better World. 2013. http://www.accenture.com/us-en/sustainability/Pages/sustainability-index.aspx (Retrieved 12/1/2013).
Molnar, C, Ritz, T, Heller, B and W. Solecki. 2011. Using Higher Education-Community Partnerships to Promote Urban Sustainability. Environment, Volume 53, 1, January/February 2011.
Second Nature, 2011. Institutionalizing sustainability. Viewpoints on sustainability. Volume 1, April 2011. Available from http://presidentsclimatecommitment.org/files/documents/briefing-papers/institutionalizing_sustainability.pdf (retrieved 12/1/2013).
Second Nature, 2011. Why public reporting matters. Viewpoints on sustainability. Volume 2, May 2011. Available from http://presidentsclimatecommitment.org/files/documents/briefing-papers/public_reporting.pdf (retrieved 12/1/2013) .
Seltzer, E, Bassett, E, Cortright, J, Shandas, V, and Smith, T. W, 2011. Making EcoDistricts: City-scale climate action one neighborhood at a time. Institute for Sustainable Solutions Publications. Paper 32. http://pdxscholar.library.pdx.edu/iss_pub/32 (retrieved 12/1/2013).
The Association for the Advancement of Sustainability in Higher Education (AASHE), 2013. The Sustainability Tracking, Assessment and Rating System (STARS). https://stars.aashe.org/
UK Department for Business Innovation and Skills, 2013. Smart Cities: Background Paper. Available from www.gov.uk/bis (retrieved 12/1/2013).
Perry, D and W. Wiewel (Eds.) 2011. The University as Urban Developer: Case Studies and Analysis. New York: M.E. Sharpe, Inc. in cooperation with the Lincoln Institute of Land Policy.

2013 Specialist Meeting—Advancing the Spatially Enabled Smart Campus Roche—62
Four Puzzle Pieces for
Advancing the Spatially Enabled Smart Campus
STÉPHANE ROCHE Professor, Geographical Information Sciences
Université Laval Email: [email protected]
an cities be smart enough without being spatially enabled? The answer is undoubtedly no
but it is not obvious. To be considered as spatially enabled, a community (city, local
government, society, university), must first consider location and spatial information as common
goods, and then make them available in order to stimulate innovation. Therefore, in order to
become spatially enabled, three conditions are required. First, community members have to be
“spatially literate.” Secondly, spatial enablement requires a conducive environment to open and
share spatial data. Last but not least, there is no possible spatial enablement without shared and
unified geospatial standards (Roche et al., 2012). For its part, the idea of the Smart City resulted
from a very aggressive strategy developed by Information Technologies giants, such as IBM or
CISCO, it was quickly taken up by researchers from various disciplines. Some of them see it as an
opportunity to rethink the notion of urbanisation with a more systemic approach, reintegrating the
concept of sustainable development into urban context. Some others associate the idea of Smart
City with an active commitment of citizens into urban innovation processes, thus overhauling city
governance through open and bottom-up procedures (government, data). Finally, the others take
this opportunity to advocate the fact that urban infrastructures based on the systematic use of
information and communication technologies show greater efficiency. Nevertheless, to date, no consensus has been reached from this proliferation of interests. In
order to understand the concepts underlying the Smart City, we have focussed on what
specialists had to say about it. I’m currently carrying out a meta-analysis from a corpus of 67
recent publications [24 peer-reviewed scientific papers, 23 studies published by private
companies and 20 reports (uses cases or case studies) published by local governments
(essentially cities)]. This corpus contains a total of 71 8923 words (33 542 distinct words). I do not
intent to go into the details of the lexicometric analysis in progress; yet, I would like to use the
preliminary results of this study to propose and discuss a draft framework for Spatially Enabled
Smart Campus.
The proposed framework is based on the four puzzles pieces shown on this figure, which
need to be properly organized by university stakeholders in order to
advance campus development. For implementing and maintaining
each of this puzzle parts the role of information and geospatial
technologies is crucial. A campus could be seen as a small city (e.g.,
Laval campus: 50,000 people, 40 buildings and a 1.8 km2 area). So in
term of administration and infrastructure management (building;
services: energy, water; BIM, transport . . . ) the issue is very similar to
C

2013 Specialist Meeting—Advancing the Spatially Enabled Smart Campus Roche—63
the one of a city. But the rationale of a university is very different: knowledge and universality are
the core business of Universities.
1) The digital campus aims at efficiently operating an infrastructure based on
communication and information technologies, networks and sensors so as to optimize campus’
“routine” operations, which could be called campus Operation System. GISciences can support
Smart campuses by dramatically enhancing this digital dimension, and in particular the university
informational infrastructure. When the concept of digital Earth is for instance applied to campus
contexts, it closely reflects this digital dimension. Indeed, ongoing work in the fields of SDI and
big data offer possible methodological and technological solutions to support campus in the
implementation of a digital model (e.g., a Lidar-based 3D model has been developed for the
Laval campus to serve multiple applications). More particularly, and to use the words of Craglia
et al. (2012), the next generation of digital campus will not be a single system but, rather,
multiple connected infrastructures (related to various physical components of the campus:
transportation, land organisation, BIM, as well as knowkedge components: online and mobile
courses, student services, research supports . . .) based on open access and participation across
multiple technological platforms that will address the needs of different audiences (student,
faculty (cross-disciplinary), citizens, etc.).
2) The open campus is a way to create methods of governance re-structured around
informational infrastructures and open services/data, based on collaboration and partnership to
improve the efficiency of the services provided to the university community (not only internal),
especially in terms of knowledge transfer, scientific mediation, participatory learning . . . This
“open democracy” dimension can benefit from the recent advances in GISciences. Indedd, the
concept of open democracy is threefold: cooperation (transversality and partnership),
participation (co-construction of public policy, consultation, debates) and transparency (open
data and dataviz: use of images). GISciences are particularly relevant in terms of participation
and transparency. For instance, they provide technological mechanisms and infrastructures to
develop access and delivery (location-based and mobile) platforms for open knowledge and
open course, ensuring their qualification (adding metadata and sharing students experiences)
adapted to various audiences and enhancing readability through multimedia and (carto) graphic
representations.
3) GISciences can also support the development of the intelligent campus dimension, that
is to say of the social infrastructure and civic spatial engagement practices. Crowdsourcing and
VGI, including location-based social networks (in Laval, the use of dedicated social medias are
exploding, including as a new teaching tools), stand out today as key geospatial data sources
indicative of the pulse of places. The connected campus community members, acting as active
sensors, have the capacity to contribute even more efficiently to the spatial intelligence of
campuses. Indeed, GISciences offer different types of potential support: the design of mobile
positioning technologies centred on the individual, and providing more user-friendly interfaces
for various applications (M-Learning, serious gaming as the one that has been developed in my
department for the green campus challenge . . . ) or teaching approaches to improve community

2013 Specialist Meeting—Advancing the Spatially Enabled Smart Campus Roche—64
members’ spatial skills and provide them with spatial thinking advanced abilities so that they
could use spatial analysis approach in various discipline.
4) A Smart campus is a place where students should become citizens, where they could be
part of renewing the forms of active citizenships built on the participatory involvement of all
community members, with a concern for innovation. The live campus dimension refers to a way
of seeing university campuses as living/fab labs that are continuously being reshaped (adaptive
to change). In this context, GeoDesign, with a big D (Goodchild, 2010), as part of GISciences,
provides innovative, creative, deliberative, uncertain, multi-actor, multi-scale and multi-thematic
methods and tools to design smart campus and impact on their physical and “senseable”
structure (e.g., the TEDxCity2.0 lab we have recently organized across the Laval campus with
external partners or the GeoHack meetings that have started in the campus in order to improve
community members’ spatial skills and help them to be more efficiently involved in its design.

2013 Specialist Meeting—Advancing the Spatially Enabled Smart Campus Schöning—65
Does a “Smart Campus” Create “Smart People”? From Smart Cities to Smart Campuses—Supporting the “Campus Citizens”
JOHANNES SCHÖNING
Assistant Professor, Computer Science Adjunct group-leader HCI research, Expertise Centre for Digital Media (EDM)
Hasselt University, Belgium Visiting Lecturer, University College London
Email: Email: [email protected]
have three simple rules to build a “Smart Campus”:
● Listen to your people.
● Make the invisible visible.
● Create experiences not services. There is no doubt that there are major challenges that future cities will face, not least a huge
increase in the populations living in urban areas. According to a United Nation report [1] every
second the global urban population grows by 2 people. Therefore the urban population is
expected to increase from 3.6 billion people in 2011 to 6.3 billion in 2050. In 2020 more than 700
cities will exist with populations of +1 million; today we have just 500 cities with populations of+1
million. The exploding urban population growth creates unprecedented challenges, among
which provision for water and sanitation are the most pressing and painfully felt when lacking [6].
Cities cannot be sustainable without ensuring reliable access to safe drinking water and
adequate sanitation. Therefore, many tech companies are investing in R&D to create ‘smart’
cities, with the goal of making our lives more efficient, better informed and hassle-free. Research
estimates that$16 billion USD will be spent annually by 2020 on core technologies in pursuit of
this goal. A recent trend has been to develop the “Internet of things” that can sense, connect
and mine a wealth of data about our cities, the environment and ourselves.
Our Intel Collaborative Research Institute on Sustainable Connected Cities1 [4] is concerned
with enhancing and changing how people live, interact and engage with cities. Our main goal is
to enhance city sustainability and improve citizen well-being. The Smart Campus an Incubator for a Smart City
While the interest in future cities and the future challenges are quite clear, the “millennium
challenges” of future campuses still remain unclear. Will it be the fact that campuses will have
“just” more students and less staff? Or more diverse groups of campus citizens, including many
more guests or visitors connected through the Internet to the groups and people working and
living on the campus? It is safe to say that each campus will have a unique set of challenges that
need to be addressed. Campuses are far more diverse than cities and harder to cluster into
categories than cities.
1www.cities.io
I

2013 Specialist Meeting—Advancing the Spatially Enabled Smart Campus Schöning—66
During the specialist meeting we would like to share our views (coming from a city
perspective) and best practices that we learned and researched within our center from a
computer science background, particularly focusing on human-computer interaction aspects
(HCI) to improve the campus experience of future campuses. We will focus on the following
three aspects:
1) The “Campus Citizens” are key to the success of any smart campus project.
Do not listen to McKinsey & Company2—listen to your people. Consultancy companies have
great plans in their drawers— plans for future cities and also campuses based on data. As
outlined earlier, our perspective in the Sustainable Connected Cities Institute is human-
centered. We have wide-ranging expertise and background in user experience, interaction
design, ethnography and ethnography, together with research in the built environment,
commerce, engineering, anthropology, the arts, and social psychology. We also work as inter-
disciplinary teams (with people from computer science, designers, ethnographers, and
psychologists among others) to make a real change to enrich and extend city dwellers lives. This
fits with the vision of Bell [1] of computers not just acting on our behalf and anticipating what we
want but also enabling people to be more creative, using state of the art computer technologies
and toolkits. Therefore we think it is crucial to focus on the “campus citizens” and their needs. A
campus comes alive because of the students, faculty, administration, service and visitors. It
should be more than “buildings controlled by a fancy dashboard.”
2) Misbalance between input and output
Many claims have been made about the potential benefits of embedding smart technologies in
cities that connect the infrastructures with our public spaces, streets, homes, mobile phones and
even our clothes could be tested before on university campuses to see possible impacts and
effect. We noticed that there is still a huge misbalance between this “input” and the “output”
back to the citizens. We will share our best practices and examples how ICT can change and
impact the behavior of citizens (city and campus citizens) by connecting them to the “invisible
data streams” of the city/campus as we for example did with the Tidy street project [2]. Others
have also successfully presented various project e.g. MIT’s Senseable Cities group3. We will
reflect on the list of services, output interfaces and ways how people can interact with the data
streams that have the potential to transform and shape a campus, especially having the role of
space in mind.
3) Striving for efficiency?
Besides being a mini-city, each campus has some unique characteristics that need to be taken
into account. By placing increasing numbers of sensors in all kinds of places that can be
monitored, we could collect real-time data about how our utilities are faring, our transport is
moving, our energy is being consumed, where things and people are and what they are doing,
2http://www.mckinsey.com/insights/urbanization/how_to_make_a_city_great3http://senseable.mit.edu/

2013 Specialist Meeting—Advancing the Spatially Enabled Smart Campus Schöning—67
with the hope to achieve a greater understanding of how our “places” work, what is needed to
make them work even better, and how to maintain them more efficiently when something breaks
down. Smart grids are being deployed in the background aiming to support the rapid and
effective contingency and capacity planning. This is “just” the homework that we need to do.
These enabling technologies are only the foundation for a successful future campus. We believe
that research on smart campuses should not strive for this super-efficiency of the underlying
technology. We argue that it is equally important for the “campus space” to consider the impact
of new campus technological developments on quality of life and create an atmosphere that will
help researchers and students conduct high quality teaching and research. The accumulation of vast amounts of campus sensor data should not become
overwhelming, making people feel disempowered or even disengaged. It should be designed
to support the main role the space plays in their lives: education, research, and creating a
pleasant campus experience. References [1] Bell, G., Dourish, P.: Yesterdays tomorrows: notes on ubiquitous computings dominant vision.
Personal and Ubiquitous Computing 11(2) (2007) 133–143. [2] Bird, J., & Rogers, Y. (2010). The pulse of tidy street: Measuring and publicly displaying
domestic electricity consumption. In Workshop on Energy Awareness and Conservation through Pervasive Applications (Pervasive 2010).
[3] Department of Economic: The Millennium Development Goals Report 2010. United Nations Publications (2010) [4] Schöning, J., Rogers, Y., Bird, J., Capra, L., McCann, J. A., Prendergast, D., & Sheridan, C.
(2012). Intel Collaborative Research Institute-Sustainable Connected Cities. In Ambient Intelligence (pp. 364–372). Springer Berlin Heidelberg.
[5] Yvonne Rogers, Licia Capra & Johannes Schöning: Beyond Smart Cities: Rethinking Urban Technology From a City Experience Perspective. Urban Pamphleteer: Future & Smart Cities, (1), (2013)
[6] United Nations Development Program. Human Development Report Office: Hu-man development report: Background papers. Human Development Report Office, United Nations Development Programme (2001)

2013 Specialist Meeting—Advancing the Spatially Enabled Smart Campus Scott—68
Spatiotemporal Visualization of Local Sensor Networks
for Action on Campus
MICHAEL S. SCOTT Professor of Geography
Salisbury University Email: [email protected]
he number of technologies that provide extremely detailed information about the operation
and activities on a college campus are burgeoning. From environmental monitoring of indoor
air quality to energy use to traffic flow to building access, the volume of spatio-temporal data that
is being captured is overwhelming. Given the complex, multi-dimensional and granular nature of
this data, it is often difficult for campus managers to make sense of it. Taking this voluminous data
stream and extracting the signal from the noise and then presenting that pattern in a way that is
actionable on the part of the manager are critical steps in advancing the spatially enabled smart
campus.
Spatiotemporal visualization as a research and commercial activity has existed since the
invention of computer cartography. Many techniques including map sequences, map animation,
exploratory spatial data analysis, multi-dimensional mapping, and scientific visualization have
been explored by geographers, cartographers, computer scientists, artists, and technicians at
leading software companies. Best practices, industry standards, and entire computer graphics
libraries have been developed for the display of spatiotemporal information, some more
compelling than others.
In the last decade or so, the rise of a particular type of visualization bears closer—the
dashboard. Dashboards, or sometimes expanded to business intelligence (BI) dashboards, is “a
data visualization tool that displays the current status of metrics and key performance indicators
for an enterprise (Rouse, 2010).” Just as the dials and indicators on a car dashboard give the
driver information about performance of the vehicle’s components, so too does a BI dashboard
give information about the performance of a business unit, often complete with red, yellow, or
green indicators tied to a predetermined performance goals. While the visualization techniques
used in these BI dashboards are not new (and often not particularly sophisticated), they are
worthy of examination because of their focus on a) actionable intelligence, b) the ability to drill
down into the data patterns in an active way, and c) the near-exclusion of the geographic
dimension of the data.
Salisbury University in Salisbury, Maryland recently completed the installation and testing of
a GIS-based indoor air quality and energy use monitoring system for our newest building on
campus (Esri, 2013). This system, named SpatialMMS and created by Spatial Systems Associates
of Columbia, Maryland, pulls data streams related to temperature, humidity, CO2 levels, and
energy consumption directly from the building automation system and displays them on maps of
the building space as well as time-series graphs. These visualizations are available to both
campus facilities managers and visitors to the building through a kiosk system. While the
T

2013 Specialist Meeting—Advancing the Spatially Enabled Smart Campus Scott—69
visualizations that are built into the system are functional, they are not particularly compelling or
sophisticated, nor are they actionable. However, my team at the Eastern Shore Regional GIS
Cooperative at Salisbury University have been developing and refining “spatial intelligence
dashboards” that could be used to reanimate the data from our campus building sensor network
and achieve a higher degree of understanding and insight. Examples of our open-source, cross-
platform data visualization tools are:
MD Dept of Labor, Licensing and Regulation Workforce Dashboard
http://www.dllr.state.md.us/workforcedashboard/
MD BayStat, Causes of the Problems and Solutions
http://baystat.maryland.gov/sources2.html
Caroline County (Maryland) Department of Emergency Services
http://www.esrgc.org/dashboards/carolinedes/
I believe that we have just scratched the surface with regard to the extraction of local sensor
network data for compelling and actionable visualizations. Harnessing open-source mapping
and graphing libraries for enabling a spatially-aware smart campus is likely to be an area of
exploration for some time to come.
Works Cited Rouse, M. (2010). “Business intelligence dashboard.” Retrieved from
http://searchbusinessanalytics.techtarget.com/definition/business-intelligence-dashboard Esri. (2013). “Campus sustainability.” Retrieved from
http://www.esri.com/library/casestudies/salisbury-university.pdf
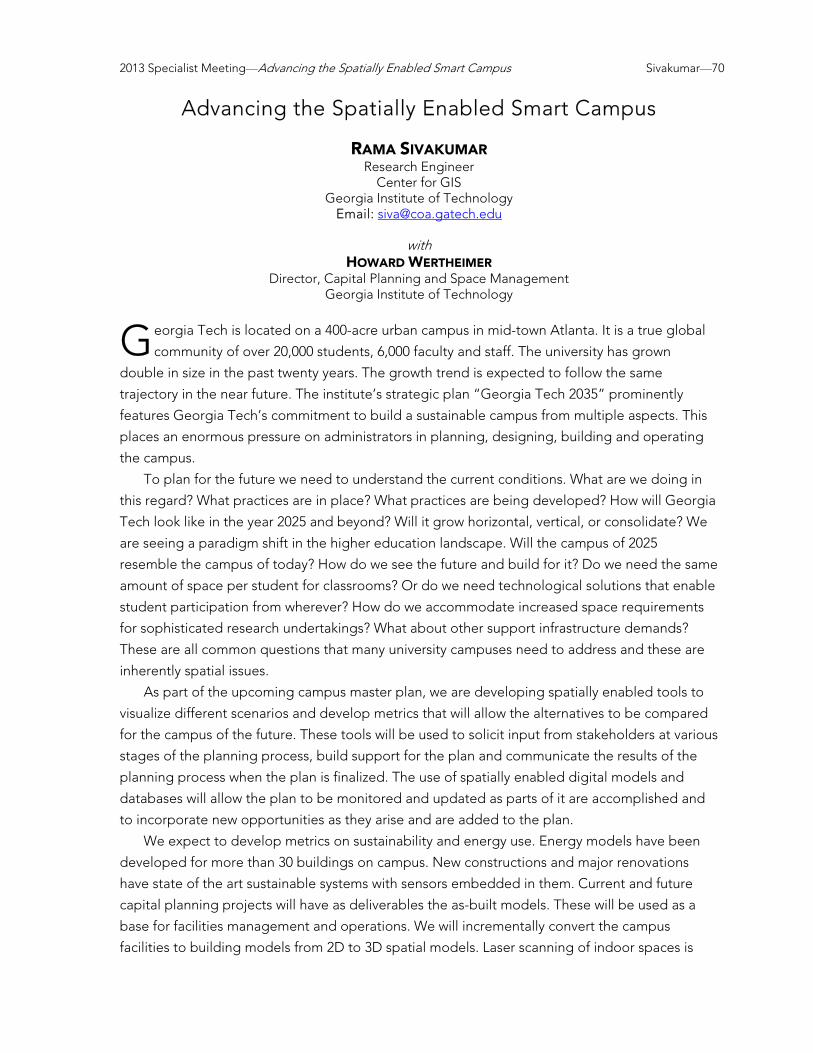
2013 Specialist Meeting—Advancing the Spatially Enabled Smart Campus Sivakumar—70
Advancing the Spatially Enabled Smart Campus
RAMA SIVAKUMAR
Research Engineer Center for GIS
Georgia Institute of Technology Email: [email protected]
with
HOWARD WERTHEIMER Director, Capital Planning and Space Management
Georgia Institute of Technology
eorgia Tech is located on a 400-acre urban campus in mid-town Atlanta. It is a true global
community of over 20,000 students, 6,000 faculty and staff. The university has grown
double in size in the past twenty years. The growth trend is expected to follow the same
trajectory in the near future. The institute’s strategic plan “Georgia Tech 2035” prominently
features Georgia Tech’s commitment to build a sustainable campus from multiple aspects. This
places an enormous pressure on administrators in planning, designing, building and operating
the campus.
To plan for the future we need to understand the current conditions. What are we doing in
this regard? What practices are in place? What practices are being developed? How will Georgia
Tech look like in the year 2025 and beyond? Will it grow horizontal, vertical, or consolidate? We
are seeing a paradigm shift in the higher education landscape. Will the campus of 2025
resemble the campus of today? How do we see the future and build for it? Do we need the same
amount of space per student for classrooms? Or do we need technological solutions that enable
student participation from wherever? How do we accommodate increased space requirements
for sophisticated research undertakings? What about other support infrastructure demands?
These are all common questions that many university campuses need to address and these are
inherently spatial issues.
As part of the upcoming campus master plan, we are developing spatially enabled tools to
visualize different scenarios and develop metrics that will allow the alternatives to be compared
for the campus of the future. These tools will be used to solicit input from stakeholders at various
stages of the planning process, build support for the plan and communicate the results of the
planning process when the plan is finalized. The use of spatially enabled digital models and
databases will allow the plan to be monitored and updated as parts of it are accomplished and
to incorporate new opportunities as they arise and are added to the plan.
We expect to develop metrics on sustainability and energy use. Energy models have been
developed for more than 30 buildings on campus. New constructions and major renovations
have state of the art sustainable systems with sensors embedded in them. Current and future
capital planning projects will have as deliverables the as-built models. These will be used as a
base for facilities management and operations. We will incrementally convert the campus
facilities to building models from 2D to 3D spatial models. Laser scanning of indoor spaces is
G

2013 Specialist Meeting—Advancing the Spatially Enabled Smart Campus Sivakumar—71
being done for newer spaces yielding accurate 3D representations of interior spaces. These new
capabilities are just being formed and models will serve as the platform for future assessment of
inventory, planning new initiatives, and for maintenance and operations. Developing both
standards for BIM modeling and protocols for data transfer and integration with spatially
enabled smart databases are critical. Real-time energy usage data gathered from across campus
buildings and facilities can be displayed to stakeholders through a dashboard like platform
potentially influencing to lower energy consumption.
Georgia Tech has greatly reduced its municipal water consumption during the past decade.
More than 40 different water harvesting systems with a combined Cistern capacity of over 2.5
million gallons have been implemented. Harvested water is used for landscape irrigation,
athletic fields, and for flushing toilets. These water harvesting systems have been mapped and
integrated in to the campus spatial database for visualization. Smart sensors that monitor water
inflow and outflow from the cisterns, sensors that detect leaks along irrigation channels, sensors
that read weather forecasts to auto adjust irrigation schedule before rain events occur are some
potential areas that would greatly enhance sustainability goal.
True to its sustainable practices, Georgia Tech recycles more than 1,300 tons of solid waste
each year at a cost of well over a million dollars per year. Recycling assets of all types from large
roll offs to dumpsters to small recycling containers are spread across the campus. Outside
contractors are tasked to empty these containers at a fixed schedule. Perhaps smart sensors can
help optimize solid waste recycling operation by triggering a demand driven service request
from the contractor for a potential cost savings. Operations can be monitored through spatially
enabled campus dashboard.
Parking is increasingly becoming an issue at Georgia Tech. More than 13,000 parking spaces
cover the 400 acre campus with several multi-story parking decks to surface spaces. Sensor
enabled parking systems that tell the campus community about available parking spaces on a
specific lot and a spatially enabled dashboard application that directs someone to the space will
be an ideal solution.
How to present and convince campus administration about the merits of spatially enabled
campus? With shrinking budgets these days, specifically public institutions like Georgia Tech
every dollar spent is looked at very closely. We need to create compelling cases to get support
from administration. A simple case in point is our recent tree inventory. In alignment with its
sustainability efforts, Georgia Tech has set an aggressive 50% canopy goal in its master plan.
Facilities and landscape services needed a reliable tree inventory to keep track and monitor
progress of canopy coverage towards stated goal. This business driver alone was not enough to
get resource support from the administration for a complete inventory. In the recent past,
number of trees of varying size and age has fallen around campus causing damage to property.
Luckily no people were harmed in these incidents. Campus risk management wanted to know if
landscape services were aware of health of fallen trees. Data was lacking to satisfactorily answer
the questions. This provided an opportunity for a complete tree survey of the campus. In
addition to the aesthetic beauty and canopy it provides, we wanted to quantify environmental

2013 Specialist Meeting—Advancing the Spatially Enabled Smart Campus Sivakumar—72
benefits of these trees such as carbon sequestered, rain water mitigated, and pollution removed.
Storm water engineers do not adequately consider trees in their design solutions. There is a
research gap at the present time. We took the opportunity to devise a spatially enabled smart
database that could cater to the business needs as well as the research needs. The combined
multifaceted benefits enabled us to garner support from the administration. The spatially
enabled inventory database of 11,500 trees with about 42 different attributes for each tree was
completed successfully last year. The inventory is being maintained continually. Georgia Tech is
positioning itself as an active living and learning laboratory in this effort. We are also in the
process of joining hands with US Forestry service and regional universities to develop a regional
database of tree inventory that supports eco analysis and multitude of related research
objectives. The tree inventory database is fast becoming a most commonly used database for
planning, operations, and research purposes. We believe that this is a good example of starting
small with a bigger and deeper reach. We are planning for sensor deployments on selected
significant trees on campus. For us, this would be one component of a complete dashboard
solution.
Resource crunch is real and it is here to stay. The new normal is doing more with less. We
need innovative solutions for complex issues that face us. Platforms for building technology
solutions are increasingly becoming affordable. As researchers and practitioners of geospatial
technology it is our role to look out the horizon and develop frameworks, standards,
specifications, procedures, and workflows to realize a spatially enabled smart campus. It is going
to be enabling world of sensors and it is going to grow at unbelievably fast and has a high
potential for never before seen efficiencies.
We envision scenarios where the Virtual Georgia Tech is an immersive and interactive portal
that supports navigation through the campus and an open-ended range of capabilities, built up
incrementally that relies heavily on spatially enabled smart platform. Time is now for smart
campuses.
Georgia Tech is fortunate to attract the best and brightest students. We just need to
educate them to think spatially. To enable desired solutions we need a good framework, we
need sound data models and well defined procedures. It must just work.
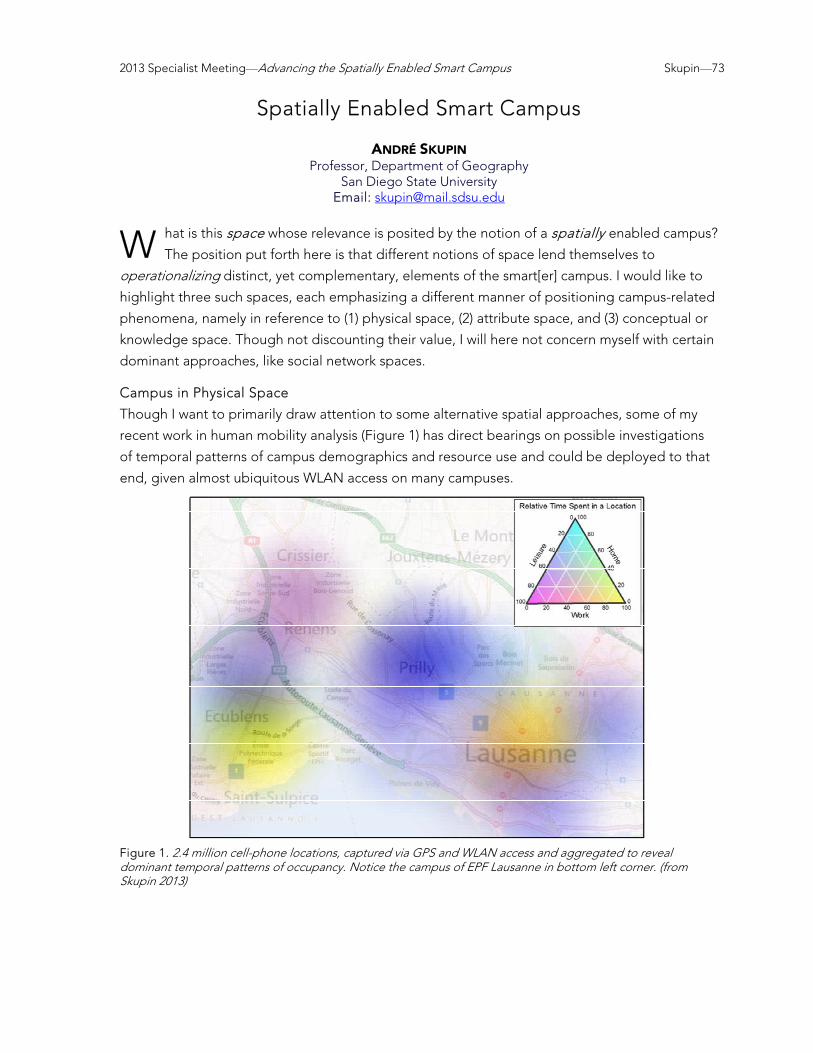
2013 Specialist Meeting—Advancing the Spatially Enabled Smart Campus Skupin—73
Spatially Enabled Smart Campus
ANDRÉ SKUPIN
Professor, Department of Geography San Diego State University
Email: [email protected]
hat is this space whose relevance is posited by the notion of a spatially enabled campus?
The position put forth here is that different notions of space lend themselves to
operationalizing distinct, yet complementary, elements of the smart[er] campus. I would like to
highlight three such spaces, each emphasizing a different manner of positioning campus-related
phenomena, namely in reference to (1) physical space, (2) attribute space, and (3) conceptual or
knowledge space. Though not discounting their value, I will here not concern myself with certain
dominant approaches, like social network spaces. Campus in Physical Space
Though I want to primarily draw attention to some alternative spatial approaches, some of my
recent work in human mobility analysis (Figure 1) has direct bearings on possible investigations
of temporal patterns of campus demographics and resource use and could be deployed to that
end, given almost ubiquitous WLAN access on many campuses.
Figure 1. 2.4 million cell-phone locations, captured via GPS and WLAN access and aggregated to reveal dominant temporal patterns of occupancy. Notice the campus of EPF Lausanne in bottom left corner. (from Skupin 2013)
W
2013 Specialist Meeting—Advancing the Spatially Enabled Smart Campus Skupin—74
Campus in Attribute Space
Higher education campuses are distributed sparsely in physical space, separated by tremendous
geographic distances. Meanwhile, compared to nearby surroundings, a campus environment will
often be markedly different, in terms of socio-economic composition, architecture, and
governance. All this lends itself to an insular approach to representing this social construct,
which is for example manifested in such views as "the campus as city". Conversely, the lived
experience of its inhabitants is however implicitly (through similar experience) and explicitly
(through networked communication) shared across hundreds of campuses, forming a special
community of shared interests that bridges geographic distance. Unless city state is a more apt
metaphor, I would argue that placing campuses in attribute space – defined by the multitude of
characteristics of the natural and built environment and its inhabitants – would support a very
different representation of campus environments. This could be done through a mix of
computational and visual means, leveraging authoritative data sources (Skupin and Esperbé
2011), individual experience (Burns and Skupin 2013), and social media artifacts. Among the
applications of such an approach is the data-driven delineation of "best practices" such that the
uniqueness or exchangeability of the specific campus context can be usefully elaborated. I
would of course advocate an integrated approach to representing campus-related phenomena
in physical and attribute space, also in support of improved understanding of the on-
campus/off-campus interface. Campus in Knowledge Space
The power of a spatial viewpoint can extent to a campus' ultimate raison d'être: the
development and cultivation of knowledge, as evident in the variety of educational, research,
and administrative practices that campus inhabitants are engaged in. To me, a campus that
would truly be spatially enabled would also be one in which spatial concepts (e.g., size, shape,
region, scale, etc.) are operationalized in order to make evident, communicate, and relate the
complex knowledge structures of diverse domains. Though much of my work during the last
decade has dealt with that issue, a just-finished research project (Ahearn et al 2013) has opened
up numerous new directions, all of which point to the power of a spatial perspective, from
performing n-dimensional overlays (Fig. 2) to the tracing of educational pathways.

2013 Specialist Meeting—Advancing the Spatially Enabled Smart Campus Skupin—75
Figure 2. The CfP of the Advancing the Spatially Enabled Smart Campus Specialist Meeting projected onto the hierarchically structured GIS&T Body of Knowledge. Darker colors and higher vertical position indicate a stronger match of the Specialist Meeting to the BoK. The highest matching elements at each of the four levels of the BoK hierarchy are highlighted.
References Ahearn, S.C., Icke, I., Datta, R., DeMers, M.N., Plewe, B., and Skupin, A. (2013) Re-Engineering the
GIS&T Body of Knowledge. International Journal of Geographical Information Science 27(11): 2227–2245.
Burns, R. and Skupin, A. (2013) Towards Qualitative Geovisual Analytics: A Case Study Involving Places, People, and Mediated Experience. Cartographica 48(3): 157–176.
Skupin, A. (2013, in press) A Visual Exploration of Mobile Phone Users, Land Cover, Time, and Space. Pervasive and Mobile Computing. (doi:10.1016/j.pmcj.2013.07.007)

2013 Specialist Meeting—Advancing the Spatially Enabled Smart Campus Stewart—76
Experiences from Designing a Campus
Flood Management Collaboration System
KATHLEEN STEWART Associate Professor
Department of Geographical and Sustainability Sciences The University of Iowa
Email: [email protected]
fter going through a devastating flood where more than 20 campus buildings sustained
damage in June 2008 due to flooding, and the Arts Campus was especially hard hit, the
University of Iowa Facilities Management (FM) organization was looking for new ideas and systems
to help ensure the University would be better prepared for future flood events. Our GIScience
research group developed a web-based flood management and collaboration system where
flooding, building vulnerabilities, and evacuation recommendations can be tracked and visualized
in real-time, along with action decisions by campus leadership that are input and displayed in
addition to the system recommendations. The real-time and predictive capabilities of the model
affords more time for FM teams to respond to at-risk situations, deploy strategies for erecting
flood barriers where needed, evacuate building contents, and plan possible road and building
closures. The timely evacuations of individuals from natural hazards, is a topic that has engaged
GIScience researchers (see e.g., recent research by Horner et al. 2011, Shekhar et al. 2012). Working with FM to develop the system, was very much a collaborative effort. We had
regular meetings with different stakeholders and tested the system several times in tabletop training exercises to make sure the kinds of information needed in a flood emergency were being provided by the system. An evaluation of the system outputs (e.g., evacuation recommendations) using historical flood data has also been carried out. The main elements of the system are: a web-based flood mapping and building vulnerability viewer that captures two possible modes, with full mitigation (e.g., flood barriers) in place, or with no mitigation in place (i.e., worst case scenario); and an interactive building status viewer where campus decision-makers can input and potentially override any recommendations made by the system regarding building evacuations (Figure 1).
The flood mapping and building vulnerability component involves a vulnerable buildings knowledge database that provides details on the location, elevation, and other properties of buildings in the floodplain, as well as the length of time needed to evacuate the building. Real-time and forecast hydrologic data is collected from the National Weather Service (http://water.weather.gov/) and includes hydrologic data consisting of stream gage discharge and stage information. This information is stored in a dynamic database and updated regularly. Historic, real-time and forecasted inputs are incorporated in the model, providing a temporal perspective for flood management. A real-time report is generated for system users as well as a forecast report. A web map viewer displays the campus, flood boundary, vulnerable buildings, and evacuations recommended based on system parameters in real-time. In this way, the spatial inputs (the flood inundation layers) are linked to temporal components (flood forecast information), and the space-time progression of risk to campus buildings is made available for
A

2013 Specialist Meeting—Advancing the Spatially Enabled Smart Campus Stewart—77
the broad range of campus decision-makers (FM, risk management, public safety, campus housing etc.) that work together when flooding threatens the campus.
Figure 1: Elements of the flood collaboration model (J. Fan).
The direct input of decision-makers is what makes this system especially interesting and relevant. Campus leadership uses the maps and reports generated by the system as a basis for their discussions and planning during a flood. Based on a number of factors, however, decision-makers may decide not to follow the system recommendation exactly, for example, delaying building evacuations that the system suggests should begin, or putting up barriers even before the system recommends the construction of floodwalls. An interactive and editable webpage in the system allows for such actions to be added to the system and the map display. In this way, everyone can see what is forecast and what actions have been taken, and a useful record of the decision-making process is captured and stored for post-hazard analysis.
While working with the UIowa FM team on the flood model was our first effort with smart campus applications, the outcome is that they are ready to form campus collaborations and more interested in what geospatial technology allows them to do. Clearly there are many opportunities relating to smart campus design and innovation. We are now exploring how to extend our spatiotemporal database that includes many campus geospatial features, to also model student dynamics, such that campus decision-makers can have a more comprehensive awareness of the space-time patterns of mobility on campus to support management functions. Further extensions to the flood management system are likely too as it would be possible to incorporate user-generated content in the system. For example, if individuals send out tweets about water on roads in one part of campus, this information can be geocoded and added to the map viewer display, adding to the real-time road inundation and flood boundary information. References
Horner, M., and Widener, M., 2011. The effects of transportation network failure on people’s accessibility to hurricane disaster relief goods: a modeling approach and application to a Florida case study. Natural Hazards 59(3): 1619–1634.

2013 Specialist Meeting—Advancing the Spatially Enabled Smart Campus Stewart—78
Shekhar, S., Yang, K., Gunturi, V., Manikonda, L., Oliver, D., Zhou, X., George, B., Kim, S., Wolff, J., Lu,
Q. 2012. Experiences with evacuation route planning algorithms. International Journal of Geographical Information Science 26(12): 2253–2265.
2013 Specialist Meeting—Advancing the Spatially Enabled Smart Campus Tarampi—79
Advancing the Spatially Enabled Smart Campus
MARGARET R. TARAMPI
Junior Research Fellow SAGE Center for the Study of the Mind University of California, Santa Barbara
Email: [email protected]
he “spatially enabled smart campus” alludes to two complimentary efforts—the spatially
enabled society and smart cities. The spatially enabled society refers to advances in the
management and organization of people, environments, and economies as a result of making
location and spatial information freely available to people and businesses. It is intended that the
availability of such information would encourage the development of creative goods and
products (Rajabifard, Bins, and Williamson, 2007). The focus is on spatial data infrastructures.
Smart cities, on the other hand, is a concept emerging from urban planning and urban design
that takes into account six interconnected dimensions—smart mobility, smart environment,
smart people, smart economy, smart governance and smart living. It is believed that sustainable
economic growth and effective, efficient governance can be achieved by investing in social and
environmental capital and infrastructures (Caragliu, Del Bo, and Nijkamp, 2009). The focus is on
improving cities by leveraging new technologies. The spatially enabled smart campus, therefore,
implies the merging of these two concepts in order to promote the broader goals of fostering
creativity and sustainable practices. This would suggest that key players in this venture would
likely include cognitive psychologists as well as architects.
While it is a useful exercise to imagine an ideal future smart campus given a blank slate, the
reality is that student enrollment is continuously increasing on our current campuses, and
existing infrastructure (both the built environment and spatial data infrastructures) cannot be
easily cast aside. So how does the idea of a smart campus work with our current standards?
As university communities—students, faculty, and staff— become more diverse,
consideration should be given to individual differences in spatial thinking (Hegarty and Waller,
2005; Newcombe and Shipley, in press). Spatial thinking is multifaceted involving the interrelated
abilities of understanding space, representation, and reasoning. It is central to everyday decision
making, communication, and navigation and is critical to success in the STEM (i.e., science,
technology, engineering and mathematics) disciplines (Newcombe and Shipley, in press; Wai,
Lubinski, and Benbow, 2009). As new systems and methods for doing things are developed to
compliment smart campus initiatives, these systems will only be efficient and effective if they are
designed with the cognitive abilities and limitations of the users in mind.
Additionally existing soft and hard infrastructures need to be retrofitted or adapted to meet
the growing demands of modern campuses. Given this context (adapting infrastructure v. new
infrastructure), how can we still achieve the goal of a spatially enabled smart campus? Is there a
way to phase the development of a smart campus that is also “smart” in that functionality or
productivity is not lost during any step of the process? Architects and designers are trained to
T

2013 Specialist Meeting—Advancing the Spatially Enabled Smart Campus Tarampi—80
solve problems given a set of constraints. They deal with the issue of sustainability on a large
scale. The role of the architect or designer in the spatially enabled smart campus is through the
design of physical infrastructures, which humanize the technology. They create the interface
through which people experience the smart campus physically and digitally.
Many stakeholders are clearly involved in advancing the spatially enabled smart campus—
political leaders, urban planners, engineers, etc. Each brings different expertise and agendas to
the conversation. As someone who is trained as an architect and a cognitive psychologist, I am
no different. To realize the spatially enabled smart campus, a holistic approach is necessary, that
considers both an integrative and an inclusive approach.
References: Caragliu, A., C. Del Bo, and P. Nijkamp (2009). Smart cities in Europe. Vrije Universiteit, Faculty of
Economics and Business Administration.
Hegarty, M. and D. Waller (2005). Individual differences in spatial abilities. In P. Shah and A.
Miyake (Eds.), The Cambridge handbook of visuospatial thinking (pp. 121–169). New York:
Cambridge University Press.
Newcombe, N. S. and T. F. Shipley (in press). Thinking about spatial thinking: New typology, new
assessments. In J. S. Gero (Ed.), Studying visual and spatial reasoning for design creativity.
New York, NY: Springer.
Rajabifard, A., A. Binns, and I. Williamson (2007). SDI design to facilitate spatially enabled society.
In A. Rajabifard (Ed.), Towards a Spatially Enabled Society (219–232). Melbourne: The
University of Melbourne.
Wai, J., D. Lubinski, and C. P. Benbow (2009). Spatial ability for STEM domains: Aligning over 50
years of cumulative psychological knowledge solidifies its importance. Journal of Educational Psychology 101(4): 817.
2013 Specialist Meeting—Advancing the Spatially Enabled Smart Campus Tulloch—81
Advancing the Spatially Enabled Smart Campus and
Environmental Planning and Design
DAVID TULLOCH Associate Director, Center for Remote Sensing and Spatial Analysis
Associate Professor, Landscape Architecture Rutgers University
Email: [email protected]
espite what seems like annual budget crises and ongoing fiscal stress on their systems we
see universities, large and small, investing in their campuses, less as collections of
classroom buildings but as extensive learning environments. The spaces and forms that
combine to shape the daily spatial experiences of these students create a series of opportunities
for spatial exploration and learning in an environment that is also generally information rich and
well-enabled with information technology. As a designer, the linkage of these spatial
experiences with technology and students excited about learning is an outstanding opportunity
for exploring space as well as themselves.
Typologies of activities in a spatially enabled smart campus
While it will surely be an obsolete model by the end of the workshop, I offer this model as a
starting point for considering some of the activities on smart campus. They are broken into living
and learning. Within those further specific emerge:
1) Living
a. Active—Students on larger campuses are increasingly relying on smart devices to
navigate the daily challenges of life. While the classic example might be finding their
way to classes on the first days of the semester, day-to-day living includes other uses.
Students find themselves employing smart campus technologies for communication,
monitoring their bus, finding a parking sense, tracking down friends or getting food.
b. Passive—Active campus spaces might be enhanced by sensors that respond to
student use of the space. In the evenings a central plaza might undergo multiple
changes in lighting in response to fluxuations in the numbers or locations of students
in the space. If students know that large crowds trigger a light show in a gathering
place, it might incentivize socialization that is designed to be safer/friendlier/more
academic. Maybe a group that completes laps around the library is rewarded with a
video that is projected on the sidewalk.
c. Crowdsourced—By contributing spatial data, students could help reshape their living
environment. Every few years paths could be redirected based on voting on smart
phones. Or campus designers could use data on shifting walking and biking patterns
to alter locations for bike racks, paths, obstacles, or even course offerings.
2) Learning—Smart campus applications could support a variety of approaches to learning:
a. Spatial—For our purposes spatial learning may seem the most obvious. Spatial
learning games like ARIS could be integrated into the campus experience. New
D

2013 Specialist Meeting—Advancing the Spatially Enabled Smart Campus Tulloch—82
students could be encouraged to explore a campus in a digital scavenger hunt. Basic
spatial cognition and fairly advanced social studies could all be taught using tools like
this. Since spatial literacy is enhanced by experiencing spaces, sequences, and
b. Topical—At larger diverse universities, there are a variety of topics that might benefit
from topical uses of smart campus applications. Landscape architecture students might
be guided around, plant to plant, in a digitally-led lesson in plant identification.
Engineering students use iPads to find different support systems for pedestrian
bridges or roof overhangs.
c. Collaborative—Technology is facilitating new ways of sharing creative and intellectual
work. Students who use their tablet for drawing and sketching could post their drawing
of the campus administration building in a digital map space where other sketchers
could post their as well. This exchange is common in an analog art class, but crosses
temporal dimensions with the technology. Further, if the sketches capture different
parts of the central quad, they could be stitched together to create a collaborative 3-d
sketched representation of the campus core.
d. Casual Inquiry—Curious students might find casual inquiry to be a great way to
engage their surroundings. Who is Barker Hall named after? Just capture the QR code
and get an answer on your smart phone. How do the wetlands on campus function? If
you walk close to them, maybe your smart device will provide a link to more
information?
e. Direct Inquiry—In some cases, student’s devices could be active tools for research. As
crowds move between larger spaces on campus, perhaps a tablet could be used to
monitor the movement based on the university’s own sensors spread through the
spaces. Similarly, questions about weather or microclimate might be answered through
live remote monitoring of sensors.
As the other position papers will inevitably show, this is not a complete list, but they may
provide some useful boxes for an eventually taxonomy of smart campus activities, both real and
imagined.

2013 Specialist Meeting—Advancing the Spatially Enabled Smart Campus Wallis—83
Using 3D GIS to Sustain our Campuses
PATRICK WALLIS
Facilities Practice Lead Senior Consultant,
Esri Professional Services Email: [email protected]
uildings account for nine percent of US gross domestic product and almost half the
country’s greenhouse gas emissions and energy use. The impact of development over the
last few decades is clear. With tools to forecast the impacts, the market and consumers would
have been better informed regarding more sustainable alternatives.
The buildings industry is still biased toward a paper-driven model, or one with unstructured
digital data having no real connection or spatial context to the world at large. One impact is the
persistence of erroneous building data within authoritative systems for educational institutions
and associated campuses. Another is the difficulty accessing and integrating it across multiple
systems. This certainly is not helpful when efficient and instant access to accurate building
information is required (National Institute of Science and Technology (NIST), 2004, pp. 3-1– 3-6).
Our campuses and the buildings within them are inherently 3D, so the foundation for smarter
buildings and campuses will not be based on paper, unstructured 2D systems, or even highly
structured 3D technologies that are difficult to integrate with other systems. To understand and
resolve the challenges facing those managing, working and living within campuses, systems
providing greater context for individual building objects are critical.
Geographic Information Systems (GIS) is emerging in a new role within the industry for better
communication, analysis, and interoperability. By restructuring Computer Aided Design (CAD)
and Building Information Model (BIM) technology to take advantage of the inherent spatial
relationships in a GIS, building information (BI) can be aggregated at all scales and integrated
with other management systems throughout the building lifecycle. GIS can be exploited to
provide key information for decision makers, so they can answer questions regarding the best
manner to develop and manage campuses. It enables improvement of the urban form by
providing the awareness needed to expose hidden patterns affecting performance, allowing
those deficiencies to be corrected; thereby, ensuring its future viability. For example, using 2D,
procedural, and Building Information Model (BIM) derived data to conduct urban growth
modeling, zoning change visualization, and view quality/impact assessment. Forecasting the
future is a fuzzy science, but one clear step we can take to reverse old and unfavorable trends is
to realize that GIS can and should play a key role in managing and sustaining campuses.
GIS technology can be exploited to provide key facility information for decision makers when
they need it. In this context it is used to answer questions regarding the best manner to develop
and manage campuses. This ability is largely a result of the relational database technology
underlying it, as well as the capacity for GIS to identify spatially related objects. Spatial
relationships allow GIS to merge different worlds of knowledge—it is significant and powerful
B

2013 Specialist Meeting—Advancing the Spatially Enabled Smart Campus Wallis—84
because it unearths and exposes related patterns that would otherwise go undiscovered. It is a
powerful system and enabling technology for shaping and managing campuses—one that:
● Provides a common and coordinated view, thereby increasing collaboration and understanding, while reducing risk and its associated costs.
● Enables visualization, analysis and comparison of possible alternatives to optimize performance, providing the analytical tools necessary for determining which strategy is the best short and long term solution.
● Can provide the support the building industry requires to realize more sustainable development practices and patterns.
The buildings industry is no doubt integral to the U.S. economy, having accounted for nearly
nine percent of all US gross domestic product (GDP) during since 1980 (Pacific Northwest
National Laboratory, 2010, 1.3.1, 1.3.2). It’s also an industry where the output (buildings) accounts
for almost half the country’s greenhouse gas emissions and energy use (National Research
Council (NRC), 2011, pp. S-2). With the benefit of hindsight these trends and the cumulative net
impact of previous individual actions become clear. Had there been tools available to forecast
the short- and long-term impacts of proposed development, the market, and consumers, would
have been better informed regarding more sustainable alternatives. In this manner, it would
have been possible for developers and architects to configure more efficient layouts to achieve
the same net square feet (NSF) as other alternatives with more gross square feet (GSF) for the
purpose of increasing profitability for developers and reducing energy costs for consumers.
It is clear today that enabling technology, such as GIS, provides industry managers and
executives the tools required to be better stewards of the built environment. The common and
coordinated awareness that GIS delivers provides a better understanding of the present. Shared
awareness enables stakeholders to visualize and analyze data regarding the built environment,
and its links to the world at large. This enables better collaboration among stakeholder
disciplines; thereby, reducing the unknowns, leading to lower project contingencies, risk and
cost.
By spatially organizing and linking the standards, policies and values that guide the
development and ultimate form of the built environment to the analysis required to achieve
shared awareness, GIS helps industry stakeholders to better understand the future. In this way,
GIS provides stakeholders the predictive capability needed to manage and actualize
performance of campuses. This ability allows decision makers to visualize performance and
virtualize scenarios to improve the campuses they manage, thus ensuring its future viability. For
example, it allows facility managers to abandon run-to-failure maintenance strategies, and
instead adopt strategies for preventative and reliability centered maintenance, which can
dramatically lengthen facility service lives, as well as reduce operating costs.
In conclusion, the past generation of ineffective communications and data interoperability
has been a big resource drain for building owners and managers, as well as for the campuses
where these buildings are located. Enabling smarter buildings and campuses requires us to
correct these deficiencies. Forecasting the future is generally a fuzzy science, but one clear step

2013 Specialist Meeting—Advancing the Spatially Enabled Smart Campus Wallis—85
to reverse old and unfavorable trends is to realize that a more practical CAD and BIM
technology, one with better GIS interoperability, can and should play a key role in managing and
sustaining the built environment and the world. As shown in the figures below, a GIS-based system for managing campus facilities can provide
facility and real property stakeholders at a campus the awareness required to manage it, as well as the technology, tools and processes required to actualize its potential for optimal performance. GIS for the facilities and real property is powered by a Facilities Information Model (FIM), which serves as the primary data source for all managed facilities, throughout the entire Facility Management (FM) lifecycle. Information contained in the FIM can be visualized in geographic space via the GIS, thereby providing users of the system a common and coordinated view of the built environment. By further linking the FIM to authoritative data sources, stakeholder workflows, needed reports, and relevant standards, GIS provides industry stakeholders a predictive capability essential for understanding the future, as well as for optimizing it.
Figure 1: High Level Business Architecture
Figure 2: Conceptual Technical Architecture

2013 Specialist Meeting—Advancing the Spatially Enabled Smart Campus Wallis—86
Works Cited National Institute of Science and Technology (NIST). (2004). NIST 04-867: Cost Analysis of Inadequate
Interoperability in the Capital Facilities Industry. Washington, DC: NIST. Pacific Northwest National Laboratory. (2010). Buildings Energy Data Book. Retrieved January 2012,
from U.S. Department of Energy: Energy Efficiency & Renewable Energy: http://btscoredatabook.net/ChapterIntro1.aspx

2013 Specialist Meeting—Advancing the Spatially Enabled Smart Campus Wilson—87
Creating a Spatially Enabled Smart Campus
JOHN P. WILSON
Spatial Sciences Institute University of Southern California
Email: [email protected]
he opportunity to conceive, design and build a smart campus seems close at hand for some
and still far away for others. For the technology providers who want to sell innovative
solutions for sensing, social networking and knowledge integration, the smart campus (much like
the smart city) is close at hand. For campus service providers responsible for real estate
acquisition, facilities management, transportation and parking services, student housing, food
and beverage services, class and classroom scheduling and public safety, among others, the
design, creation and realization of a smart campus may seem a long way off in the future. Faculty
and students with competing agendas may also participate and will often occupy some ill-
defined middle space by promoting one-off solutions that are tied to specific workflows (i.e.
writing code, implementing new proprietary or open source solutions) or interests (i.e. building
new technologies, evaluating existing technology solutions such as new building performance,
or conducting human subjects research). The realization of a smart campus will in all likelihood
require all of these individuals but the fundamental challenge is to prepare and build support for
a single, comprehensive vision and a series of nimble and evolving technologies and workflows
that can be deployed to accomplish this vision and incorporate new solutions as they become
available.
This single vision and the accompanying workflows that can incrementally move the campus
toward the desired goal would require support at the highest levels and would be best
organized around a series of campus services and their intended recipients: • Campus Services: These might include the scheduling of classrooms, allocation of research
space, provision and staffing of libraries and other specialized teaching and research facilities,
provision of housing for faculty, staff, and students living on or near campus, provision of health
care facilities and services, provision of recreation facilities and programs, provision of a range of
dining opportunities for faculty, staff, students and a variety of campus visitors, the construction
of new buildings and maintenance of existing buildings and related infrastructure, the provision
of a safe and productive environment, and the provision of maps, signs and other artifacts to
facilitate access to the various facilities and services that the university provides. • Campus Recipients (Participants): The intended recipients will include the current faculty,
staff, and students as well as prospective faculty and students, current and potential
collaborators, vendors, service providers, alumni, and a range of visitors (i.e. family and friends at
commencement, seminar and workshop participants, and fans attending sporting events,
concerts, plays, and festivals).
T

2013 Specialist Meeting—Advancing the Spatially Enabled Smart Campus Wilson—88
That said, the most important observation might be that things can get complicated very
quickly. Taking my own university, the University of Southern California as an example, we have
two main campuses (University Park and Health Sciences) located approximately 8 miles from
one another to the southwest and northeast of downtown, an expanding suite of satellite
operations (in Culver City and Marina del Ray, on Santa Catalina Island and using various
locations in and near Downtown Los Angeles), a rapidly expanding series of hospitals and health
clinics spread across the Los Angeles Metropolitan Region, and a variety of university-
sponsored, university-affiliated (i.e., fraternities and sororities) and private student housing
options located near and far from the aforementioned campus facilities. In addition, the
University will soon break ground on the largest mixed-use project (office, residential, and retail)
in the City of Los Angeles in the past quarter century. The vision for the University of Southern
California smart campus then would need to include all of these facilities and many of the
surrounding neighborhoods because campuses seldom have crisp borders and there is a
constant flow of people and materials linking the campus to the larger city and region.
The implementation plan, on the other hand, would need to focus on a series of specific
deliverables and milestones and preferably a clear set of priorities so that we can make
measurable progress over time. Some of these services would be provided by the appropriate
campus units (the CAD Services group within the USC Facility Management Services Department
for example) and others would be provided by outside firms, such as the contractors hired to
construct new buildings and related infrastructure (heating, cooling, electricity, water, gas,
landscaping, etc.). These activities will inevitably generate a variety of spatial products, such as
survey-grade data delineating property ownership and easements and building information
models. Some university-sponsored projects will also engage non-profits and these projects may
yield spatial data as well – an example would be USC’s recent partnership with the Advancement
Project to characterize community assets and identify place-based research opportunities
around the University Park campus. These activities and the accompanying spatial assets may
afford new opportunities for research and teaching. For example, colleagues in the Viterbi
School of Engineering have helped to build systems to: (1) track shuttles and report real-time
results to customers with mobile phones; (2) improve the scanning and interpretation closed
circuit video; and (3) model the performance of a series of recently constructed buildings using
embedded sensor systems.
For our part, the faculty, staff, and students affiliated with the USC Spatial Sciences Institute
have worked to build a series of collaborations that play to our strengths and advance our own
vision of a spatially enabled smart campus. The following list describes the kinds of deliverables
that will be provided:
• Installing and operating a community GPS base station at the Wrigley Marine Science
Center on Catalina Island.

2013 Specialist Meeting—Advancing the Spatially Enabled Smart Campus Wilson—89
• Creating a series of map-based tours and story maps to document and promote both
physical and virtual exploration of historically significant buildings and landmarks on the
University Park campus.
• Creating a 3-D model of the University Park campus complete with photo-realistic outdoor
and indoor facades and attributes depicting how interior and outdoor spaces are allocated
and used, and then building a 3-D routing service and pushing it out to the Web and a
variety of smart phone platforms.
• Creating a geocaching game to help new students explore the University Park campus
prior to the first day of classes.
• Creating a series of customized tours for individual schools, departments, and other units
and pushing these out to the Web and a variety of smart phone platforms.
The aforementioned examples barely scratch the surface and do little to illustrate how
spatially enabled knowledge infrastructures and sensor networks, such as those connected with
new buildings and closed circuit video systems, can be harnessed to promote spatially enabled
smart campuses. There are many opportunities and most universities will lack the commitment
and resources to pursue all of these opportunities simultaneously. This brings the discussion
back full circle to the need for thought leadership and the articulation of a vision and
accompanying priorities and workflows for building a state-of-the-art, spatially enabled smart
campus over many years.