2013 porcupine pellet plant - msu extension pellet plant business plan . ... markets, particularly...
TRANSCRIPT

1 | P a g e
2013
Porcupine Pellet Plant Business Plan
P O R C U P I N E P E L L E T P L A N T | B U S I N E S S P L A N P A G E 2
PORCUPINE PELLET PLANT | BUSINESS PLAN
REPORT DEVELOPED FOR: WESTERN UPPER PENINSULA PLANNING AND
DEVELOPMENT COMMISSION PO BOX 365
HOUGHTON, MI 49931 P (906) 482-7205 F: (906) 482-9032 [email protected]
WWW.WUPPDNR.ORG
REPORT PREPARED BY: RENEWABLE RESOURCE SOLUTIONS, LLC
1353 WEST HIGHWAY US 2, SUITE 2 CRYSTAL FALLS, MI 49920
P (906) 875-3720 F: (906) 875-3724
[email protected] WWW.RRS-LLC.ORG
Business Plan Finalized: March 2013
The figures and percentages used throughout this business plan are subject to change depending on the conditions of future markets, supply and demand, dollar value, local, state, and national economic status, and other unforeseeable variables. All information provided will be true to the best of Renewable Resource Solution’s (RRS) knowledge and any oversight or misrepresentation is unintentional. All information is presumed to be the most up-to-date information available as of the official publication date of each individual study. Direct research should be done for the most current information when looking for specific costs/prices in months/years following the publication of this plan. New technology and innovative practices are constantly being discovered and the most efficient systems and methods today could be outdated in the near future. This study is written to provide the most accurate information possible. It is known and understood that a large part of the information is either common knowledge or RRS’ previously compiled general data. It is also known and understood that with the completion of this business plan, RRS is free to utilize all non-proprietary information in any future studies or reports.

P O R C U P I N E P E L L E T P L A N T | B U S I N E S S P L A N P A G E 3
TABLE OF CONTENTS EXECUTIVE SUMMARY ....................................................................................................................... 6
WOOD ENERGY INDUSTRY BACKGROUND ...................................................................................................... 6 WORLDWIDE WOOD ENERGY INDUSTRY FORECAST OF GROWTH......................................................................... 7 ADVANTAGES OF WOOD ENERGY AS A GREEN BIOMASS FUEL ............................................................................ 7 FINANCIAL OVERVIEW .............................................................................................................................. 8
PRODUCTS AND SERVICES .................................................................................................................. 9
WOOD PELLET DEFINITION/DESCRIPTION ...................................................................................................... 9 WOOD PELLET PRODUCTION ............................................................................................................................. 9
POTENTIAL PRODUCTS .............................................................................................................................. 9 WOOD PELLETS ............................................................................................................................................... 9 WOOD PELLET ANIMAL BEDDING ..................................................................................................................... 10 SPECIALTY WOOD PELLETS .............................................................................................................................. 10 OTHER PRODUCTS ......................................................................................................................................... 10
RECOMMENDED PRODUCT MARKETS ......................................................................................................... 11
MARKETS AND MARKETING .............................................................................................................. 12
DEMAND OVERVIEW FOR CONVERTED BIOMASS PRODUCTS ............................................................................ 12 CURRENT AND FUTURE DEMAND ..................................................................................................................... 12 RESIDENTIAL USE (“PREMIUM” AND “STANDARD” GRADE) .................................................................................. 12 COMMERCIAL/INDUSTRIAL USE (“UTILITY” GRADE) ............................................................................................ 13 CURRENT AND PROJECTED EXPORT DEMAND ASSESSMENT .................................................................................. 13 WOOD PELLET STOVES ................................................................................................................................... 14 WOOD PELLET BOILERS FOR COMMERCIAL USE .................................................................................................. 15
MARKET AND ECONOMY OVERVIEW .......................................................................................................... 15 COMPETITION OVERVIEW ........................................................................................................................ 16
REGIONAL COMPETITION ................................................................................................................................ 16 BENCHMARKING OF EXISTING/PROPOSED PLANTS .............................................................................................. 17
MARKETING STRATEGY ........................................................................................................................... 18 PROPOSED PRODUCT ADVANTAGES .................................................................................................................. 18 PROPOSED PRODUCT NICHE ............................................................................................................................ 18 MARKET ANALYSIS......................................................................................................................................... 18 BIOMASS PRODUCT INDUSTRY TRENDS ............................................................................................................. 19 MARKETING STRATEGY ................................................................................................................................... 19 PRODUCT STRATEGY ...................................................................................................................................... 19 ADVERTISING AND PROMOTION ....................................................................................................................... 20
OPERATIONS ................................................................................................................................ 21
FORMS OF OWNERSHIP ........................................................................................................................... 21 LOCATION ............................................................................................................................................ 22
SITE RECOMMENDATION................................................................................................................................. 22 SITING RECOMMENDATIONS ........................................................................................................................... 22 PERMITTING AND ZONING .............................................................................................................................. 22 IMPACT ON LOCAL ROUNDWOOD MARKET ........................................................................................................ 22
ENVIRONMENTAL IMPACT ........................................................................................................................ 23

P O R C U P I N E P E L L E T P L A N T | B U S I N E S S P L A N P A G E 4
REQUIRED MANAGEMENT EXPERTISE ......................................................................................................... 23 ROUNDWOOD PROCUREMENT & INVENTORY CONTROL EXPERTISE ........................................................................ 23 MANAGEMENT EXPERTISE .............................................................................................................................. 23 PLANT MANAGER EXPERTISE ........................................................................................................................... 24
CAPACITY ............................................................................................................................................ 24 MANUFACTURING PROCESS ..................................................................................................................... 24
MANUFACTURING ......................................................................................................................................... 24 RAW MATERIAL ............................................................................................................................................ 24 DEBARKER .................................................................................................................................................... 24 CHIPPER ....................................................................................................................................................... 24 TRAMMEL SCREEN ......................................................................................................................................... 24 INITIAL HAMMER MILL ................................................................................................................................... 24 DRYERS ........................................................................................................................................................ 24 SECONDARY HAMMER MILL ............................................................................................................................ 25 TEMPERING TANKS ........................................................................................................................................ 25 THE PELLET MILL (PELLETIZER) ........................................................................................................................ 25 COOLING AND STORAGE ................................................................................................................................. 25 BAGGING AND BULK ...................................................................................................................................... 25
QUALITY CONTROL REQUIREMENTS ........................................................................................................... 25
FINANCIAL INFORMATION ................................................................................................................ 26 PROJECTED PROFITS ............................................................................................................................... 26
WOOD PELLET MILL EQUIPMENT AND COST ...................................................................................................... 26 FEEDSTOCK-RELATED EQUIPMENT & OTHER COSTS ............................................................................................ 26 INVESTMENT ................................................................................................................................................. 26 EQUITY ........................................................................................................................................................ 26 DEBT ........................................................................................................................................................... 26 NEW MARKETS TAX CREDIT PROGRAM (NMTC) ................................................................................................ 26
FEEDSTOCK COST AND AVAILABILITY .......................................................................................................... 26 RECONCILIATION TO PRICE USED IN PROJECTED PROFIT STATEMENT ...................................................................... 26 THE WOOD TO ENERGY PROCESS ..................................................................................................................... 26
PELLET REVENUE ................................................................................................................................... 26 COST OF PROJECT .................................................................................................................................. 26 SOURCE AND USE OF FUNDS..................................................................................................................... 27
FUNDING OPPORTUNITIES: GRANTS ................................................................................................................. 27 FUNDING OPPORTUNITIES: LOANS ................................................................................................................... 27 FUNDING OPPORTUNITIES: INCENTIVES ............................................................................................................. 28
DISTRIBUTION COSTS .............................................................................................................................. 30 OPERATING COSTS ................................................................................................................................. 30
RAW MATERIALS ........................................................................................................................................... 30 DIRECT LABOR .............................................................................................................................................. 30 FEEDSTOCK PROCUREMENT FEES, ELECTRICITY, AND RENTALS .............................................................................. 30 TRANSPORTATION COSTS ................................................................................................................................ 30 SUPPLIES (CONSUMABLE)................................................................................................................................ 30 PARTS AND MAINTENANCE ............................................................................................................................. 30 EQUIPMENT REPLACEMENT ............................................................................................................................. 30 INSURANCE .................................................................................................................................................. 30
FINANCIAL STATEMENTS .......................................................................................................................... 31

P O R C U P I N E P E L L E T P L A N T | B U S I N E S S P L A N P A G E 5
INCOME ....................................................................................................................................................... 31 PORCUPINE PELLET PLANT BALANCE SHEET | DECEMBER 31 ................................................................................ 31 PORCUPINE PELLET PLANT INCOME STATEMENT| FOR PERIOD ENDING DECEMBER 31 ............................................. 32 PORCUPINE PELLET PLANT CASH FLOW STATEMENT| FOR PERIOD ENDING DECEMBER 31........................................ 33
ASSUMPTIONS ...................................................................................................................................... 34 GROSS SALES ................................................................................................................................................ 34 COST OF SALES .............................................................................................................................................. 34 ADMINISTRATIVE COSTS ................................................................................................................................. 36
CONCLUSION ................................................................................................................................ 38 APPENDICES ................................................................................................................................. 40
APPENDIX I: RESOURCE ASSESSMENT ......................................................................................................... 41 WOOD SOURCES AND PROCUREMENT AREA DATA ............................................................................................. 41 REALISTIC PRICING OF AVAILABLE WOOD FUEL SOURCES ..................................................................................... 41 RESIDENTIAL FUEL COST COMPARISON PER MILLION BTU ................................................................................... 42 FEEDSTOCK AVAILABILITY CONSTRAINTS ............................................................................................................ 43 POTENTIAL WOOD HARVEST VOLUMES AVAILABLE ............................................................................................. 44 POTENTIAL LOGGING RESIDUE AVAILABLE ......................................................................................................... 45 OTHER POTENTIAL RESIDUE SOURCES ............................................................................................................... 45 VOLUME REALISTICALLY/ECONOMICALLY AVAILABLE ........................................................................................... 46
APPENDIX II: RAW MATERIAL OPTIONS ...................................................................................................... 47 APPENDIX III: PFI’S FUEL GRADE REQUIREMENTS FOR RESIDENTIAL AND COMMERCIAL WOOD PELLETS ..................... 48 APPENDIX IV: WESTERN UPPER MICHIGAN HOUSING AND BUSINESS INFORMATION ............................................. 49 APPENDIX V: POSSIBLE SOURCES OF WOOD RESIDUE ..................................................................................... 50 APPENDIX VI: FINAL ADJUSTMENTS TO THE AIR TOXICS STANDARDS FOR INDUSTRIAL, COMMERCIAL,
AND INSTITUTIONAL BOILERS AT AREA SOURCES FACILITIES ACTION .............................................. 51 APPENDIX VII: ONTONAGON COUNTY RAILROAD SYSTEM MAP ........................................................................ 54 APPENDIX VIII: ONTONAGON HARBOR INFORMATION ................................................................................... 55 APPENDIX IX: ONTONAGON RESOURCE ANALYSIS DATA ................................................................................. 56 APPENDIX X: FINANCIALS ........................................................................................................................ 61
SOURCE AND USE OF FUNDS ........................................................................................................................... 61 BALANCE SHEETS ........................................................................................................................................... 62 CASH FLOW STATEMENTS ............................................................................................................................... 67 INCOME STATEMENTS .................................................................................................................................... 72 PRODUCTION SCHEDULE ................................................................................................................................. 77 DEPRECIATION SCHEDULE ............................................................................................................................... 78 LOAN AMORTIZATION .................................................................................................................................... 79
APPENDIX XI: WHITE PINE EDUCATION STATISTICS ........................................................................................ 84 EDUCATIONAL ATTAINMENT IN ONTONAGON COUNTY ........................................................................................ 84
APPENDIX XII: LAYOUT OPTIONS ............................................................................................................... 86 APPENDIX XIII: WOOD PELLET DEALERS IN MICHIGAN AND WISCONSIN ............................................................. 87
REFERENCES ................................................................................................................................. 91

P O R C U P I N E P E L L E T P L A N T | B U S I N E S S P L A N P A G E 6
EXECUTIVE SUMMARY WOOD ENERGY INDUSTRY BACKGROUND
Wood and other biomass combustibles can be burned for heat, used to generate electricity, or be processed into liquid fuels. The USDA’s report on the North American Pellet Sector states that modern wood stoves convert 85% to 95% of the energy stored in the wood to heating the intended space. Using pelletized wood products is more efficient and economical than burning raw wood/biomass. In the US, the trend toward wood pellets as a heating fuel began during the 1970s energy crisis. According to the USDA, the increasing price of fossil fuels, such as propane and fuel oil, has created increased interest in the use of alternative fuels since 2000. In addition, natural disasters, such as Hurricane Katrina, also place great emphasis on the need for alternative energy production methods. Europe is years ahead of the US in developing alternative fuel production and markets, particularly in its wood pellet industry. As demand in Europe for pelletized wood increases, Europe looks to the US and Canada as a pellet source. Currently, very little forest industry residue is available in the Western Upper Peninsula due to the lack of traditional forest industry companies in this region. Without the start-up of substantial forest industry companies in this area, this situation will not change. This means that the majority of raw material for wood pellets will have to come directly from logging operations. For residential pellets, this would mean using traditional pulpwood material that would have to be debarked to meet the pellet specification requirements. For industrial pellets, whole tree or logging residue chips could be used since these pellets have higher ash standards. Traditional “pulpwood” markets do not appear to have the potential to rebound its early 2000s state, which will allow raw material typically used in those markets to be readily available for pellet production. The same would be true of whole tree chips since this material would be a combination of pulpwood and traditional logging residue. Processing and transportation of biomass chips is a major cost; therefore, it is critical to identify sources within a
short radius (30-50 miles) if biomass chips are used as a raw material. The future of the wood energy industry is based on tremendous speculation at this point. Two other pellet plants are in operation in Upper Michigan, one having a very small capacity (10,000 tons) and the other having a large capacity (100,000+ tons). There are five locations with wood pellet plants in Northern Wisconsin with 20,000+ tons of production (Niagara, Hayward, Ladysmith, Peshtigo, and Marathon). Before construction begins, an air permit needs to be in place. In Michigan, the permitting process is mandated by law to take no more than 180 days; this timeframe does not start until a complete application is submitted. Plant capacity, pellet production, and pellet consumption are increasing globally. Many nations are adopting carbon emission standards pertaining to energy production facilities whose chief source of power comes from fossil fuels. Co-firing with biomass in coal-burning plants is becoming a more frequent practice to meet emissions regulations. By using biomass in conjunction with fossil fuels, the facility is able to lower the overall carbon emissions and stay within emission regulations. According to the International Energy Association’s (IEA) Global Wood Pellet Industry Market and Trade Study, the wood pellet industry has more than doubled between 2006 and 2010. Grant opportunities such as the USDA Value-Added Grant, Department of Energy Grants, USDA Rural Development Renewable Energy Programs, Michigan Biomass Energy Program, Michigan Department of Energy, and the Michigan Community Development Block Grant Program are very positive for this plant. Many other financing options exist in addition to grants, such as the MEDC Capital Access Program, Small Business Administration Programs, and Charter One’s Job Creation Loan Program. In collaboration with grants and loans, the incentives for creating a wood pellet plant in White Pine include the Forest
P O R C U P I N E P E L L E T P L A N T | B U S I N E S S P L A N P A G E 7
Products Processing Renaissance Zones, Renewable Energy Renaissance Zones, the Personal Property Tax Relief in Distressed Communities, and the Industrial Property Tax Abatement. This study focuses on a residential wood pellet plant rather than an industrial wood pellet plant. The current demand for industrial wood pellets is very limited in the Great Lakes region, and without adoption of policies for renewable energy similar to Europe’s, it is unlikely to increase substantially. It is recommended that a site be obtained to allow for expansion into other production systems. These systems could be related to animal bedding shavings, wood flour, a co-generation plant, chemical extraction, pallet manufacture, etc. Having multiple systems on one site will more efficiently utilize the available wood resource. Four pellet presses running 24/7 would yield a much higher return than smaller production scenarios if the market exists for the total production volume.
WORLDWIDE WOOD ENERGY INDUSTRY FORECAST
OF GROWTH
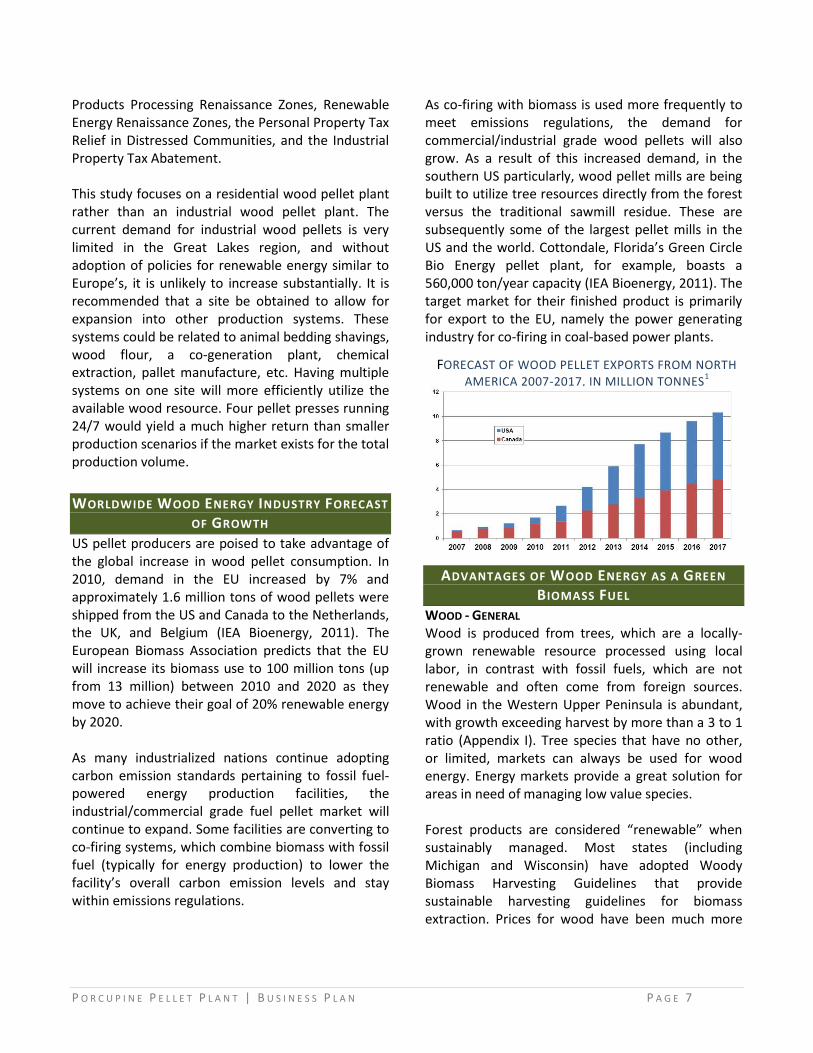
US pellet producers are poised to take advantage of the global increase in wood pellet consumption. In 2010, demand in the EU increased by 7% and approximately 1.6 million tons of wood pellets were shipped from the US and Canada to the Netherlands, the UK, and Belgium (IEA Bioenergy, 2011). The European Biomass Association predicts that the EU will increase its biomass use to 100 million tons (up from 13 million) between 2010 and 2020 as they move to achieve their goal of 20% renewable energy by 2020. As many industrialized nations continue adopting carbon emission standards pertaining to fossil fuel-powered energy production facilities, the industrial/commercial grade fuel pellet market will continue to expand. Some facilities are converting to co-firing systems, which combine biomass with fossil fuel (typically for energy production) to lower the facility’s overall carbon emission levels and stay within emissions regulations.
As co-firing with biomass is used more frequently to meet emissions regulations, the demand for commercial/industrial grade wood pellets will also grow. As a result of this increased demand, in the southern US particularly, wood pellet mills are being built to utilize tree resources directly from the forest versus the traditional sawmill residue. These are subsequently some of the largest pellet mills in the US and the world. Cottondale, Florida’s Green Circle Bio Energy pellet plant, for example, boasts a 560,000 ton/year capacity (IEA Bioenergy, 2011). The target market for their finished product is primarily for export to the EU, namely the power generating industry for co-firing in coal-based power plants.
ADVANTAGES OF WOOD ENERGY AS A GREEN
BIOMASS FUEL WOOD - GENERAL Wood is produced from trees, which are a locally-grown renewable resource processed using local labor, in contrast with fossil fuels, which are not renewable and often come from foreign sources. Wood in the Western Upper Peninsula is abundant, with growth exceeding harvest by more than a 3 to 1 ratio (Appendix I). Tree species that have no other, or limited, markets can always be used for wood energy. Energy markets provide a great solution for areas in need of managing low value species.
Forest products are considered “renewable” when sustainably managed. Most states (including Michigan and Wisconsin) have adopted Woody Biomass Harvesting Guidelines that provide sustainable harvesting guidelines for biomass extraction. Prices for wood have been much more
FORECAST OF WOOD PELLET EXPORTS FROM NORTH
AMERICA 2007-2017, IN MILLION TONNES1

P O R C U P I N E P E L L E T P L A N T | B U S I N E S S P L A N P A G E 8
stable than prices for fossil fuels in the past 30 years. Cost comparisons can be found in Appendix I. WOOD PELLETS There are a number of advantages of using wood pellets as a source of wood fuel, including: Uniform size and shape (1½” long x 1/4”-5/16”
diameter) and storage (bagged or on-site silo) Uniform moisture content (4-6%) Relatively simple heating technology (fewer
operation and maintenance requirements) High energy content by weight (roughly 7,750
BTU per pound at 6% moisture content) For heating, one ton of wood pellets equals
(BERC, 2007):
120 gallons of heating oil
170 gallons of propane
16,000 ft³ of natural gas
4,775 kilowatt hours (kWh) of electricity
Cost effective alternative heat energy source Paying $200/ton for pellets is the same as
paying (BERC, 2007):
$1.67 per gallon for heating oil
$1.18 per gallon for propane
$12.50 per 1,000 ft³ for natural gas
$0.04 per kWh for electricity
FINANCIAL OVERVIEW
Most costs can be determined fairly accurately, with raw material, labor, and electricity being the main costs. If residential pellets are made, it will need to be decided if a mix of species will be purchased or if only a few specific species will be utilized. Specific species demand may result in increased costs of raw material. Utilizing many species may increase production costs because processing may need to be adapted to the specific characteristics of each species or mix of species. Developing a high quality residential pellet will be essential to being a successful operation. A softwood pellet or a mixed (softwood/hardwood combination) residential pellet is currently in high demand, but the ability to adapt to changing demands and being able to produce other products should always be an option. These other products may include: Hardwood residential pellets, Commercial/industrial pellets, BBQ pellets, and Animal bedding pellets.
P O R C U P I N E P E L L E T P L A N T | B U S I N E S S P L A N P A G E 9
PRODUCTS AND SERVICES WOOD PELLET DEFINITION/DESCRIPTION The USDA defines the pelletization of wood as a process in which “raw wood is compacted into a homogeneous product with higher energy density and lower moisture content and made into uniformly sized cylindrical shapes, facilitating transportation, handling, and usage”.
WOOD PELLET PRODUCTION Optimum size in the Lake States (MI, MN, and WI) for a wood pellet plant is a four-press, 24/7, 100,000 ton per year plant, if adequate markets exist for the product. If demand is not adequate, an oversized plant can be built with the hope of demand increasing to match plant capacity in the near future. Alternatively, a plant can be built with the capacity to meet current demand at a lower profit level, with the expectation of future expansion as demand increases. A 100,000-ton, 24/7 pellet operation is typically optimum for procuring raw material at a fairly consistent price within a reasonable radius. Expansion beyond this size could lead to an increase in raw material prices. However, there is the potential that even the raw material required for a 100,000-ton plant could drive prices up, contingent upon other circumstances, such as competition from new companies or an increase in raw material use from existing companies. A production level of 100,000 tons is considered a goal for profitability because the costs of increasing production are typically not proportionate to the increased revenue up to that level of production.
POTENTIAL PRODUCTS
The following reviews the potential products that could be produced at the Porcupine Pellet Plant (PPP) facility, as well as potential byproducts and vertical integration opportunities. A list of raw material options can be found in Appendix II.
WOOD PELLETS RESIDENTIAL PELLETS DEFINITION Premium | In accordance with the Pellet Fuels Institute (PFI), the “Premium Grade” wood pellet standard
specifies that premium pellets will have inorganic ash content that shall be less than 1% and moisture content less than 8%. See Appendix III for a table of PFI’s pellet regulations. The standard further specifies that the pellet bulk density shall not be less than 40 lbs/cubic foot and the pellet fines shall not be more than 0.5% by weight. Fines are defined as particles that will pass through a 3mm (1/8") mesh screen. The pellets have a cylindrical form (approx. 1½” long x 1/4” diameter).
Standard | The “Standard Grade” wood pellet includes the same criteria as “Premium Grade” regarding
dimensions, but has a less stringent inorganic ash specification of less than 3% and a less stringent fines percentage of less than 1% per weight. The moisture content must be less than 10% and a bulk density of no less than 38 lbs/cubic foot.
COMMERCIAL/INDUSTRIAL PELLETS DEFINITION The “Utility Grade” (a.k.a. Commercial or Industrial Grade) wood pellet includes the same criteria as “Standard Grade” described above regarding bulk density, percentage of fines, and dimensions, but has a much less stringent inorganic ash specification than any wood pellet classified by PFI: more than 3%, but less than 6%. The moisture content must be less than 10%.

P O R C U P I N E P E L L E T P L A N T | B U S I N E S S P L A N P A G E 1 0
WOOD PELLET ANIMAL BEDDING Using wood pellets for animal bedding has become increasingly popular among stable and farm owners. The low moisture content of wood pellets allows for the bedding to be highly absorbent, up to four times their own weight. Additionally, the intensive production process of wood pellets removes many of the natural oils and eliminates the mold, bacteria, and aromatic hydrocarbons found in unprocessed wood bedding materials. Because wood pellets are screened to reduce fines, very little dust is created by the product. Disposal volume, in any given time period, compared to traditional bedding products, can be reduced by up to 50%. In addition, a mix of wood pellets and manure can be used as compost and fertilizer. This could be a substantial market, with the opportunity to have a significant portion of production go to this market if sustainable contracts could be secured. To date, aspen and pine are the preferred species for animal bedding. It is suggested that the plant design its capability to utilize both the heating wood pellet production along with animal bedding wood pellets. These markets, which would be year-round, can balance out the typically low demand periods in the summer months for heating pellets. The necessary species for bedding products are prevalent within the PPP procurement area.
SPECIALTY WOOD PELLETS BARBEQUE/SMOKER PELLETS Similar to residential heating, pellet grills are becoming increasingly popular for barbequing. Wood pellets in a variety of “flavors,” such as hickory, mesquite, apple, cherry, sugar maple, and oak, provide the energy source and infuse the food with flavor. According to an article published in the Forest Business Network1 in December 2012, the use of flavor-infused wood pellets for grilling is one of the most popular cooking trends in the country. Pellet grills are fueled by wood pellets loaded into a hopper affixed to the grill. This hopper auto-feeds the grill as needed through the connected thermostat, allowing the grill to maintain a specific internal temperature. According to the Hearth, Patio, and Barbeque Association, some pellet grills are now available in a dual-fuel unit that can switch over from pellet heat to gas when higher temperatures are needed. An attribute unique to a pellet grill is the ability to also use the grill to smoke meats.
OTHER PRODUCTS WOOD FLOUR As with pellets, wood flour has typically been produced from wood residue created from various wood manufacturing processes. As demand increases, the potential for creating wood flour from roundwood becomes more viable. Wood flour is pulverized and screened dry (8% - 10% moisture content), the finest grinds look like wheat flour. Most of the industry demands a product that is light in color and weight, highly absorptive, and resin-free. Having no bark and dirt is a requirement for this product (light colored wood species, such as white pine are preferred). The following products use wood flour: Composite decking, siding and railing Automotive components
Solidification Fillers for feed and plastic applications
WOOD SHAVINGS Some of the raw material used for wood pellets could also be used for wood shavings. It would also be a good fit with a wood boiler operation since waste from the shavings operation could be used for fuel. Wood shavings are used as bedding material for horses, sheep, and other farm animals.
1 “Adirondack manufacturer diversifies with apple-infused grilling pellets”, Colin Miller. Forest Business Network. December 2012.
www.forestbusinessnetwork.com/24206/adirondack-manufacturer-diversifies-with-apple-infused-grilling-pellets/
P O R C U P I N E P E L L E T P L A N T | B U S I N E S S P L A N P A G E 1 1
COMBINED HEAT AND POWER (CHP) A biomass energy plant could be an excellent fit with a wood pellet production facility; however, there are a number of factors that this co-dependent relationship may be contingent upon: The production cost of electricity versus the price
to purchase it from an outside source. The internal use of the thermal energy byproduct
created from the biomass plant in other on-site production processes including drying the wood chips for pelletizing.
The potential of residue created from the wood pellet or other on-site operations being used to fuel the biomass plant.
A premium for “green” energy, the company may be eligible for a Renewable Energy Credit (REC) from the state/federal government.
CHP is definitely an option since electricity is typically the second highest cost of pellet production after raw material costs. A CHP plant could provide electricity for operating the plant and heat for drying the raw material. PALLET MANUFACTURING If a residential pellet plant is built, a major spin-off could be the manufacture of pallets. Typically, one ton of pellets is put on one pallet, so if 30,000, 60,000, or 100,000 tons of residential bagged pellets are produced, the same number of pallets would be needed. This could be done in one of three ways: 1. An on-site sawmill cuts logs into lumber and then dries and manufactures the lumber into pallet parts. 2. Rough lumber is purchased and manufactured into pallet parts. 3. Pallet parts are purchased. With any of these three options, a pallet manufacturing process would be the final step. If either of the first two options is taken, a residue that could be used for raw material to make pellets or fuel for the drying process would be produced.
RECOMMENDED PRODUCT MARKETS For any wood pellet plant in the interior US at this time, it is imperative to produce a consistent, high-quality premium pellet. Producing a low ash softwood (pine/spruce) pellet or a pellet in combination with a hardwood species, such as aspen, will be essential to capturing a significant share of the premium residential pellet market. Industrial/commercial pellets should always be an option, especially if export prices to Europe and Asia make exporting profitable. There is also the potential to build a local/regional market for commercial pellets, such as what exists in northern Minnesota where a fish hatchery, casino, and school currently utilize wood pellets. There is also the possibility of the poultry industry utilizing pellet boilers due to several advantages over gas heat. With Minnesota being the top poultry-producing state in the country and currently not having any operating pellet plants, there is the potential to provide product by rail from the White Pine location. Animal bedding is a market that can provide year-round demand and help offset the peaks and valleys of heating pellet demand. This market is driven by customer preference. Some customers prefer pine, while others prefer aspen. Identifying a specific product for a specific market is critical. There can also be size preferences in the bedding/litter market with 11/64” pellets being a preference in some of these markets. Barbeque pellets is another good diversification product with a peak season opposite of the heating season, but it is a rather limited, though high-end, market. Utilizing local species, such as cherry, oak, and sugar maple, which are known for their “smokey” flavors, could help establish a foothold in this market. The economics of producing pallets on site should be studied to determine the level of bagged residential pellet production that it would make sense to produce pallets.

P O R C U P I N E P E L L E T P L A N T | B U S I N E S S P L A N P A G E 1 2
MARKETS AND MARKETING DEMAND OVERVIEW FOR CONVERTED BIOMASS PRODUCTS
CURRENT AND FUTURE DEMAND
US RENEWABLE ENERGY (WOOD^) CONSUMPTION: CONSUMED BY RESIDENTIAL AND COMMERCIAL SECTORS2
RESIDENTIAL USE (“PREMIUM” AND “STANDARD” GRADE) REGIONAL AND NATIONAL MARKET After Europe, North America has the largest pellet production capacity, which grew from 1.1 million tons in 2003 to nearly 7 million in 20113. The 2011 total production capacity in the US was 5.481 million tons and it is estimated that approximately 80% of pellets are consumed domestically for residential heating. Domestically, winter severity and the number of wood pellet stoves in operation will determine how much available market will exist. Residential stove and boiler markets are expected to continue growing along with advances in clean technology, awareness, and consumer desire for alternatives and cost savings. According to the Pellet Fuels Institute, just over 1 million US households used pellet fuel for heat in 2010 (up from 2009 Consumer Report estimates of 800,000). Domestically, pellets compete best against fuel oil, propane, and electricity, with natural gas prices being very similar to pellet prices in the last year. Three tons of pellet fuel will last the average homeowner one heating season. With an average price of $250/ton, the average homeowner can heat their home for around $750 per season, at an estimated cost of $19.05 per million BTU. North Americas’ Pellet Sector (2009) also states that in mid-Northern climate zones, pellet use in individual homes, per heating season, may rise to four tons of pellets and up to seven tons in the coldest regions. According to Rob Davis of Forest Energy Systems and former president of the Pellet Fuels Institute (PFI), the
2 U.S. Energy Information Administration / Annual Energy Review 2011. www.eia.gov/totalenergy/data/annual/pdf/aer.pdf 3 Analysis of Global Wood Pellets Market. Amisy Machinery. www.pellets-mill.com/htm/PelletsNews-cn/wood-pellets-global-market166.html
1,006
775 627
468 401 425
850 1,010
580 520 420 370 380 400 410 430 380 410 450 430 420 430
19 15 12 9 8 8 21 24 66 72 71 67 69 71 70 70 65 70 73 72 72 71
Residential (Trillion BTU) Commercial* (Trillion BTU) ^ Wood and wood-derived fuels P Preliminary Data * Commercial sector, including commercial CHP
and commercial electricity-only plants
30-Year Normal* 2011
^ A measure of how cold a location is over time relative to a base temperature, usually specified as 65˚F. Used in energy analysis as
an indicator of space heating energy requirements or use.
*Based on calculations 1971-2000
HEATING DEGREE-DAYS^ BY CENSUS DIVISION, 20111

P O R C U P I N E P E L L E T P L A N T | B U S I N E S S P L A N P A G E 1 3
current U.S. demand for residential pellets is about 2 million tons a year, which equates to a ratio of about 60 percent of production capacity being consumed domestically and the remaining 40 percent being exported (U.S. Endowment for Forestry, 2011). The Northern Midwest and Northeast have some of the highest demand for wood pellets due to winter severity and current residential home heating methods. A list of regional housing information can be found in Appendix IV.
COMMERCIAL/INDUSTRIAL USE (“UTILITY” GRADE) REGIONAL AND NATIONAL MARKET Schools are a good potential market for utility grade wood pellet heating because they typically have access to long-term (10-20 year), low-interest financing. Another potential market is outdoor pellet burners. With local zoning ordinances and the EPA potentially regulating outdoor wood burners, many manufacturers are developing outdoor pellet stoves. Information regarding numbers of regional businesses can be found in Appendix IV. With the current tightening of emissions and state-based emphasis on renewable energy production, there is a potential market to be realized with conversion of coal electric plants to a co-firing system (blend of coal and utility grade wood pellets).
MICHIGAN COAL-FIRED BOILERS IN PROCUREMENT AREA
City County Location Name Boiler Use
Fuel Type
Lake Linden Houghton Houghton Co.
Historical Society Antique
Coal/ Wood
Marquette Marquette Board of Light and
Power Power Coal
Marquette Marquette Presque Isle Power
Plant Power Coal
Marquette Marquette UP Generating Co. Power Coal*
Pelkie Baraga Pelkie Elementary
School Steam Heat
Coal
White Pine Ontonagon WPCR Power Coal*
*Pulverized coal
CURRENT AND PROJECTED EXPORT DEMAND ASSESSMENT PRESENT DEMAND According to the North American Wood Fiber Review (3Q/2011), though the US did not start exporting pellets until 2008 (85,000 tons shipped to the Netherlands), US export levels have expanded tremendously, reaching almost 600,000 tons in 2010. With almost 12 million tons of wood pellets consumed in Continental Europe in 2010 (about 20 percent higher than the previous year), demand in European countries such as Sweden, the Netherlands, Belgium, Italy, Denmark, and the UK continues to outpace domestic production. This imbalance in supply and demand has resulted in increased imports from neighboring countries and also from North America, with almost 50 percent of all wood pellets shipped in 2010 via Atlantic trade from North America being destined for the Netherlands and more than one-third to ports in the UK.
SHARES OF RESIDENTIAL, COMMERCIAL, AND INDUSTRIAL USES IN EACH EU27
COUNTRIES (2010)
Source: Poyry 2010 Study on wood pellets
P O R C U P I N E P E L L E T P L A N T | B U S I N E S S P L A N P A G E 1 4
FUTURE DEMAND Total shipments of wood pellets from the US and Canada to Europe has almost doubled in just two years. In fact, Denham Capital has projected that by 2015, the worldwide pellet market potential is 142 million tons at a value of $2.8 billion. Projections for demand in the European Union (E.U.) range from 305 million tons to 500 million tons by 2020 (U.S. Endowment for Forestry, 2011). This projection is further supported by an article by Chris Nelder, “The Missing Link to a $7 Billion Market” published on July 25, 2012
“[…] According to Jonathan Rager of Georgia-based Poyry Management Consulting, a 50 Mt [million ton] gap will open between global supply and demand for pellets by 2020. Western European demand will triple, from 11 Mt per year in 2010 to 35 Mt per year by 2020. For perspective, North American wood pellet production capacity was just 4.2 Mt in 2008 according to the U.S. Forest Service. North American pellet exports were just over 2 Mt in 2011, of which over half came from the southern US. […] The European wood pellet market alone will be roughly $7 billion a year by 2020. The U.S. could supply a big share of that – perhaps as much as $1 billion a year worth of exports. Globally, the opportunity is even greater, with China, Japan, and other Asian countries planning to increase their demand for pellets.”
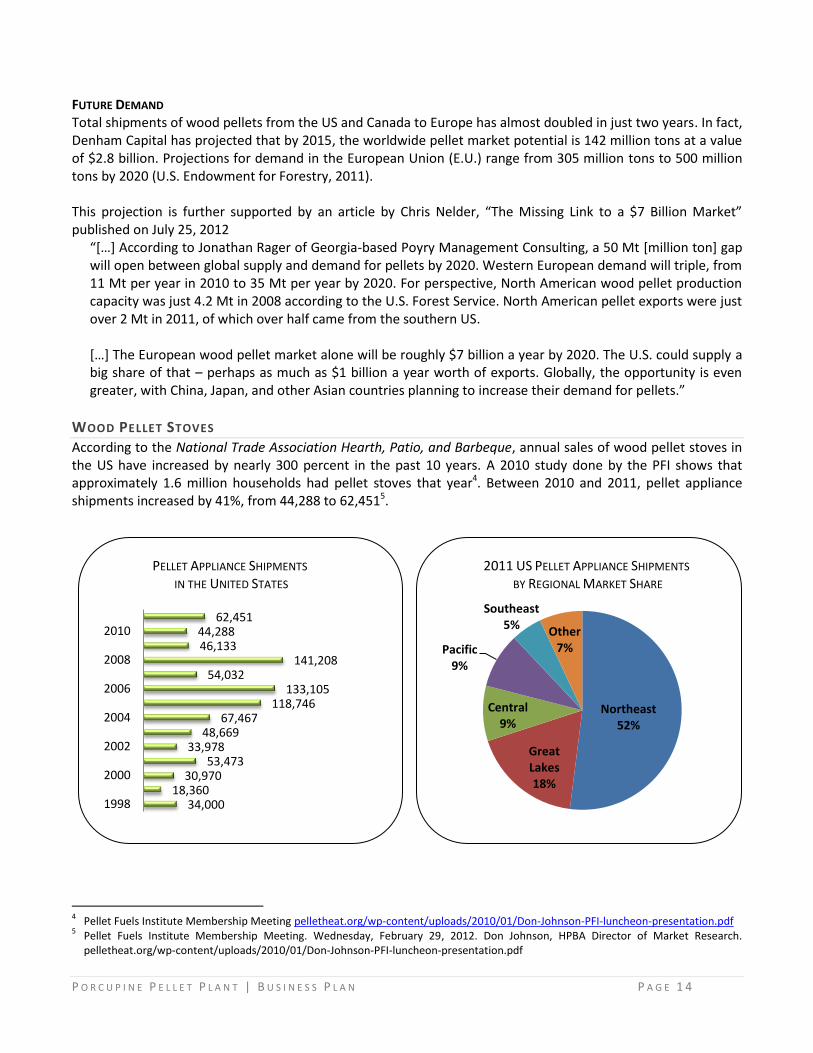
WOOD PELLET STOVES According to the National Trade Association Hearth, Patio, and Barbeque, annual sales of wood pellet stoves in the US have increased by nearly 300 percent in the past 10 years. A 2010 study done by the PFI shows that approximately 1.6 million households had pellet stoves that year4. Between 2010 and 2011, pellet appliance shipments increased by 41%, from 44,288 to 62,4515.
PELLET APPLIANCE SHIPMENTS
IN THE UNITED STATES 2011 US PELLET APPLIANCE SHIPMENTS
BY REGIONAL MARKET SHARE
4 Pellet Fuels Institute Membership Meeting pelletheat.org/wp-content/uploads/2010/01/Don-Johnson-PFI-luncheon-presentation.pdf
5 Pellet Fuels Institute Membership Meeting. Wednesday, February 29, 2012. Don Johnson, HPBA Director of Market Research.
pelletheat.org/wp-content/uploads/2010/01/Don-Johnson-PFI-luncheon-presentation.pdf
34,000 18,360
30,970 53,473
33,978 48,669
67,467 118,746
133,105 54,032
141,208 46,133 44,288
62,451
1998
2000
2002
2004
2006
2008
2010
Northeast 52%
Great Lakes 18%
Central 9%
Pacific 9%
Southeast 5%
Other 7%

P O R C U P I N E P E L L E T P L A N T | B U S I N E S S P L A N P A G E 1 5
RESIDENTIAL WOOD PELLET STOVE MARKET The wood pellet market for residential heating will continue to grow if the cost of fossil fuels continues to rise and technology costs decrease. It is relatively easy for homeowners to purchase and install a new pellet stove since they have relatively low capital costs and installation is simple with direct venting through the nearest wall. Like any market-driven product, demand for this product will be largely driven by economics and payback period. Work done by the Biomass Energy Resource Center (BERC)6 has shown that homeowners were most likely to install a wood pellet heating system if the payback period was within three years versus five years, and least likely to install if the payback was five to seven years. For a three-year payback period for the typical home installation, average oil prices would need to be $3.00+ per gallon. INDUSTRIAL/COMMERCIAL WOOD PELLET STOVE MARKET Use of non-residential pellet boilers in the US has been very limited. The main industrial use of pellets has been mixing them with coal to reduce emissions. This practice has been mainly experimental to date. There have been localized efforts in certain regions to utilize wood pellet boilers for public facilities such as schools and fish hatcheries and for private facilities such as restaurants, grocery stores, and greenhouses. There is currently some speculation about a wholesale change in the poultry industry to pellet/wood heat for a variety of reasons including decreased mortality rates and an overall healthier environment from wood heat.
WOOD PELLET BOILERS FOR COMMERCIAL USE Continuous refinement of smaller (500,000 BTU) commercial boilers to make them as efficient and economically affordable as possible is essential to increasing commercial pellet use in the US. Currently Wood Master of Red Lake Falls, MN, and Even Temp of Waco, NE are making serious efforts to sell their products. Concentrated marketing efforts will help grow this industry, along with assisting potential users to access grant funds to reduce capital costs. Initial capital commercial pellet boilers costs are one of the biggest hurdles to overcome.
MARKET AND ECONOMY OVERVIEW
CURRENT AND PROJECTED DEMAND |CURRENT RAW MATERIAL/FEEDSTOCK PRICE STRUCTURE
TYPE PRICE/TON (DELIVERED TO PLANT) ROUNDWOOD (MOST SPECIES)A $30-40 BIOMASS CHIPS
B $25-40 RESIDUE FROM FOREST INDUSTRY (SAWDUST, SHAVINGS, ETC.)C $10-60 A
Roundwood would come from area loggers as an alternative to traditional pulpwood markets. This roundwood could be debarked and chipped at the plant for premium pellet raw material.
B Biomass chips are produced by area loggers, tree services, and municipalities. These chips would be used to produce industrial pellets instead of premium pellets due to ash content.
C Appendix V lists all of the potential wood residue producers within a 50-mile radius of the plant site. The residue from these producers would be used to produce premium pellets.
6 Feasibility Study of Pellet Manufacturing in Chittenden County, Vermont. August 2011. Biomass Energy Resource Center.
www.sustainableheatingvt.org/files/docs/VSHIreport-FINAL_hi-res%20for%20print.pdf

P O R C U P I N E P E L L E T P L A N T | B U S I N E S S P L A N P A G E 1 6
COMPETITION OVERVIEW
REGIONAL COMPETITION Pellet production has increased as demand for wood pellets has increased. Production of a quality wood pellet with a marketing campaign to promote wood pellet heat will help create a balance between demand and supply of wood pellets. Additionally, wood pellet heating will be more attractive with innovations in pellet heating systems and bulk storage and as prices for fossil fuels increase. Currently the only commercial/industrial pellet manufacturer in the region is Renewafuel in Gwinn, which has operated sporadically over the past two years. Long-term plans for this plant are uncertain. The plant would be direct competition for market share. There are a number of primary mills and wood-fired CHP/boilers in the procurement area that may directly compete for raw materials.
OPERATIONAL WOOD PELLET PLANTS IN THE NORTHERN
GREAT LAKES REGION – 12/18/12
COMPANY CITY, STATE EST.
TONS/YR EST. TON
CAPACITY PRODUCT
VULCAN
WOOD
PRODUCTS VULCAN, MI 10,000 25,000
RESIDENTIAL, BEDDING
RENEWAFUEL GWINN, MI 100,000 COMMERCIAL
WOOD FIBERS NIAGARA, WI 40,000 65,000
RESIDENTIAL, BEDDING,
WOOD FLOUR, BBQ
GREAT LAKES
RENEWABLE
ENERGY
HAYWARD, WI
33,000 67,000 RESIDENTIAL,
BEDDING, BBQ
INDECK
LADYSMITH
BIOFUEL CTR.
LADYSMITH, WI
36,000 100,000 RESIDENTIAL,
BEDDING
MARTH WOOD
SHAVING
SUPPLY
PESTIGO AND
MARATHON, WI
68,000 125,000 RESIDENTIAL,
BEDDING, BBQ
WOOD-FIRED COMBINED HEAT & POWER (CHP) UNITS
LOCATED IN MI & WI7 (IN ADDITION TO THOSE ABOVE)
CITY, STATE FACILITY NAME APPLICATION CAPACITY
BARAGA, MI ALL-WOOD, INC. WOOD PRODUCTS 150 KW
ISHPEMING, MI ROBBINS WOODBURNING
COGEN PROJECT MISC. MFG 500 KW
L’ANSE, MI WARDEN ELECTRICAL GEN. 18 MW
7 Energy.gov and ICF International. Combined Heat and Power Units.
www.eea-inc.com/chpdata/States/WI.html; /MI.html
PRIMARY FOREST-INDUSTRY MILLS (PURCHASE FOREST PRODUCTS) CITY, STATE COMPANY TYPE
NORWAY, MI VERSO PAPER CO. PULP/PAPER/CHP CASPIAN, MI NEPCO ANIMAL BEDDING/PET LITTER
SAGOLA, MI LOUISIANA PACIFIC OSB/ WOOD BOILER
GWINN, MI POTLATCH LUMBER* ESCANABA, MI NEW PAGE PULP/PAPER/ CHP
PRENTICE, WI BIEWER LUMBER LUMBER* PARK FALLS, WI FLAMBEAU PAPER CO. PULP/PAPER/CHP
DULUTH, MN SAPPI PULP/PAPER/ WOOD BOILER
* PRODUCED FROM PULPWOOD SIZED MATERIAL
MICHIGAN WOOD BOILERS IN PROCUREMENT AREA CITY COUNTY LOCATION NAME BOILER USE
COVINGTON BARAGA COVINGTON REST HOME HOT WATER
THREE LAKES BARAGA THREE LAKES MOTEL HOT WATER
FELCH DICKINSON NORTH DICKINSON
SCHOOL HOT WATER
QUINNESEC DICKINSON INTERNATIONAL PAPER
CORP. POWER BOILER
SAGOLA DICKINSON LOUISIANA PACIFIC CORP. HOT WATER
BESSEMER GOGEBIC BESSEMER PLYWOOD
CORP. PROCESS
BOILER
BESSEMER GOGEBIC POWDERHORN LODGING
ASSOCIATION HOT WATER
IRONWOOD GOGEBIC BLACK RIVER LODGE HOT WATER
MARINESCO GOGEBIC NORCO OF MICHIGAN POWER BOILER
WAKEFIELD GOGEBIC WAKEFIELD HIGH SCHOOL STEAM HEAT
CALUMET HOUGHTON CALUMET HIGH SCHOOL STEAM HEAT
DOLLAR BAY HOUGHTON HORNER FLOORING CO. POWER BOILER
HOUGHTON HOUGHTON NORTHERN HARDWOOD
DIVISION PROCESS
BOILER
LAKE LINDEN HOUGHTON KALLIO REAL ESTATE HOT WATER
PAINSDALE HOUGHTON CAMP KITWIN HOT WATER
SIDNAW HOUGHTON WOOD DEVELOPMENT
CORP. POWER BOILER
AMASA IRON CONNOR SPORTS
FLOORING PROCESS
BOILER
CRYSTAL FALLS IRON BEV’S SUPPER CLUB HOT WATER
GWINN MARQUETTE SAWYER STEAM CO. POWER BOILER
ISHPEMING MARQUETTE ROBBINS FLOORING CO. POWER BOILER
ISHPEMING MARQUETTE RIDGE STREET APPT. HOT WATER
ISHPEMING MARQUETTE WAYSIDE CLUB HOT WATER
MARQUETTE MARQUETTE JILBERT’S DAIRY BARN POWER BOILER
BERGLAND ONTONAGON NORDINE’S FOODLAND HOT WATER
ROCKLAND ONTONAGON HENRY’S INN HOT WATER
WHITE PINE ONTONAGON WHITE PINE ELECTRIC
POWER POWER BOILER

BENCHMARKING OF EXISTING/PROPOSED PLANTS In keeping with growth projections, the international market for wood pellets (no specific grade) increased more than 200 percent between 2002 and 2006, causing global production to increase from 8 million tons in 2007 to more than 13 million tons in 2009 (U.S. Endowment for Forestry, 2011). Canada has been the major overseas supplier of pellets to Europe, reaching about one million tons in shipments in 2010. As demand for commercial/industrial grade wood pellets grows, so does the opportunity for exporting. As a result of this increased demand, wood pellet mills are being built to utilize roundwood versus historically utilized traditional primary sawmill residue, especially in the southern US. This has resulted in some of the largest pellet mills in the US and the world. Green Circle Bio Energy pellet plant in Cottondale,
FL has a 560,000 ton/year capacity, (IEA Bioenergy, 2011). The target market for their finished product is primarily for export to the EU, specifically the power generating industry for co-firing in coal-based power plants.
Georgia Biomass, in Waycross, GA officially opened its pellet facility in 2Q/11, paving the way for an additional consumption of 1.5 million green tons of wood fiber for pellet production. All production is expected to be exported to Europe.
New England Wood Pellets officially opened its 85,000 ton capacity pellet plant in Deposit, NY.
Trebio Renewable Biomass in Quebec, Canada should complete its new 130,000-ton capacity pellet plant in the next few months.
CURRENT NORTH AMERICAN PLANTS (INDUSTRIAL PELLETS FOR EXPORT)
COMPANY CITY, STATE CAPACITY
(TONS) STATUS GREEN CIRCLE BIO
ENERGY COTTONDALE,
FL 560,000 OPEN
GEORGIA BIOMASS WAYCROSS,
GA 750,000 OPEN
TREBIO RENEWABLE
BIOMASS QUEBEC, CAN 143,300 OPEN
ENVIVA AHOSKIE, NC 385,000 PROD. STARTING
NOV. 2012
WESTERVELT
RENEWABLE ENERGY ALICEVILLE, AL 308,642*
PROD. STARTING
NOV. 2012
GERMAN PELLETS TYLER, TX 550,000 CONST. STARTED
6/2012 ENVIVA PELLETS
SOUTHAMPTON SOUTHAMPTO
N, VA 551,146
CONST.STARTED
7/25/12
ENVIVA LP NORTHAMPTO
N, NC 551,146
“UNDER CONST.”
2012
F.E. WOOD & SONS BALDWIN, MA 300,000 “UNDER CONST.”
2012
POINT BIO ENERGY BATON
ROUGE, LA 440,000
PROPOSED 2013
STARTUP
FRAM RENEWABLES LUMBER CITY,
GA 138,000
PROPOSED 2012
STARTUP
ZILKHA BIOMASS SELMA, AL 440,000 PROPOSED 2013
STARTUP DRAX BIOMASS
INTERNATIONAL, INC. GLOSTER, MS 495,000 TBA DEC. 2012
ENVIRA VA 550,000 TBA NOV. 2012 ENVIRA NC 550,000 TBA NOV. 2012
GENERAL BIOFUELS
GEORGIA, LLC SANDERSVILLE,
GA 440,000
PROPOSED 2014
STARTUP
ENOVA ENERGY GROUP GA/SC 495,000 PROPOSED 2014
STARTUP
ENOVA ENERGY GROUP GA/SC 495,000 PROPOSED 2014
STARTUP
ENOVA ENERGY GROUP GA/SC 495,000 PROPOSED 2014
STARTUP
FRAM RENWABLE FUELS HAZLEHURST,
GA 550,000
PROPOSED 2ND
PLANT
*Expandable System – capacity to increase up to 617,284 tons.
P O R C U P I N E P E L L E T P L A N T | B U S I N E S S P L A N P A G E 1 8
MARKETING STRATEGY
PROPOSED PRODUCT ADVANTAGES Regarding residential pellets, having a consistently high quality product is the main advantage available to any pellet manufacturer. Inconsistent and poor quality pellets have been a major issue with many American residential pellet manufacturers. Producing a consistent softwood or mixed softwood/hardwood pellet will be a distinct advantage over many existing pellet plants. A professionally designed bag with accurate product information is essential to capturing residential pellet market share. Bear Mountain pellets (softwood), although one of the higher priced wood pellets on the market, is one of the most consistent sellers because of their product quality and name recognition. Being located on rail is an advantage over many existing pellet plants that can greatly reduce transportation costs and open up more distant markets.
PROPOSED PRODUCT N ICHE A variety of niches could exist, including: A substantial effort to promote residential wood pellet use in the Western Upper Peninsula would establish
a local, potentially loyal, market. This could involve setting up a subsidiary that manufactured or at least distributed and installed residential pellet stoves, which would establish vertical integration.
A business to manufacture/sell and/or install small-end commercial pellet boilers for resorts, ski lodges, businesses, municipal buildings, etc., would also help establish a definitive market.
BBQ pellets made from local tree species that have high demand in that market (cherry, sugar maple, oak) could help establish a small, but definitive, market.
Animal bedding made from aspen for horse stables/farms has potential (aspen availability has increased due to the closing of Smurfit Stone Plant).
Producing pallets for transporting pellets would be another step towards vertical integration and could be a source of some raw material for pellets. This could also potentially reduce pallet costs by up to 50%.
MARKET ANALYSIS Sales of pellet burning appliances fell during 2009 and 2010 (see the following table from the Hearth, Patio and Barbeque Association). However, a significant jump is expected in 2011 with the increase in oil prices.
U.S. HEARTH INDUSTRY UNIT SHIPMENTS – 2001-2010 Pellet Appliances 2001 2002 2003 2004 2005 2006 2007 2008 2009 2010
Freestanding Stoves & Inserts 53,473 33,978 48,669 67,467 118,749 133,106 54,032 141,208 46,133 44,269
% Change 73% -36% 43% 39% 76% 12% -59% 161% -67% -4%
There are approximately 1 million homes (PFI 2010) in the US using wood pellets for heat, via freestanding stoves, fireplace inserts, and even furnaces with an estimated equal number of appliances that have been purchased and are not in use for various reasons. Pellet fuel for heating can also be found in large-scale environments, such as schools and prisons. North American pellets are produced in manufacturing facilities in Canada and the US, and are available for purchase at fireplace dealers, nurseries, building supply stores, feed and garden supply stores and some discount merchandisers. The pellet stove has significant differences from traditional wood stoves. A major difference is the feedstock. Pellet stoves require pellets and cannot burn traditional firewood. The stove itself features convenient items not possible on conventional wood stoves. A hopper bin is integrated with the stove that may hold as much as 90 pounds of pellets, which are automatically fed by an auger to the combustion box. Thermostatic controls allow for precise monitoring of temperature. The stove has an installed price ranging from $2,000 to over $4,000
P O R C U P I N E P E L L E T P L A N T | B U S I N E S S P L A N P A G E 1 9
depending upon stove models, sizes, usage patterns, and housing characteristics. A full-use pellet stove will burn between 3-7 tons of pellets per year depending on house size and insulation/weatherization of the house. The European market is more advanced and mature than the domestic market due largely to European governments subsidizing wood pellet stoves for several years. This concept has been addressed in the American Recovery and Reinvestment Act. The act makes available, a consumer tax credit of up to 30% (maximum of $1,500) for consumers who purchase a biomass-burning stove that runs at 75%+ efficiency as measured using a lower heating value.
BIOMASS PRODUCT INDUSTRY TRENDS The trend towards biomass is much more apparent in Europe than in North America. In the US, renewable energy emphasis is much greater for solar, wind, and geo-thermal than for wood and other biomass. Wood is popular with many power companies trying to reach renewable energy goals because it is cheaper on a commercial scale than other options, but efficiency rates for electrical production are very low and are not an optimal use of wood. Propane and fuel oil users are the most logical targets for conversion to pellet fuel, as evident in the northeastern U.S. Current prices for natural gas have caused those initially interested in wood fuel to shelve their conversion plans. With the EPA Boiler MACT regulations recently being finalized, it is expected that many on-hold wood boiler installations will now be able to make a definitive decision on whether to move ahead or not. See Appendix VI for more information.
MARKETING STRATEGY Develop a substantial local market for PPP products by converting residences and businesses to pellet stoves
from fossil fuel or firewood appliances will be essential. Develop a consistently high quality residential pellet will help develop national markets. An on-rail location
will allow for economical shipping, compared to plants that only have a trucking option.
PRODUCT STRATEGY In order for PPP to succeed in its market segment, several key success factors must be realized: Pellet quality and consistency is the predominant concern among pellet appliance dealers and consumers.
Pellet stove dealers are reluctant to carry an unproven or inferior product. Stove dealers often have maintenance contracts with customers to ensure that their stoves are operating properly. The use of lower quality pellets will cause stoves to malfunction more often, which will increase the dealers’ costs of service contracts. Therefore dealers have an incentive to sell only high quality pellets as they can lower their servicing costs and maintain profitable margins.
Quality control needs to begin well before initial distribution of the PPP products to appliance dealers. The machinery startup period will be an important aspect of quality control and will result in the consumption of several hundred tons of feedstock. The purpose of the startup phase is to become familiar with the equipment and to minimize potential production problems in the long-term operations. PPP will experiment with different feedstocks, feedstock combinations, moisture content, production rate, and other variables to ensure the production of a consistent, high-quality product.
Control of sales growth will be important as producing a quality product and having the ability to fill orders in a timely fashion will be essential. The strategy will be to grow sales in conjunction with production capabilities.
Another aspect of securing/retaining markets is consistent packaging and wrapping of the product to ensure delivery of intact and undamaged product. This has been a failing of several regional manufacturers.
P O R C U P I N E P E L L E T P L A N T | B U S I N E S S P L A N P A G E 2 0
ADVERTISING AND PROMOTION PPP’s advertising efforts will initially concentrate on developing a dealer network that accepts PPP pellets and promotes them to their customers. This will be accomplished by providing dealers with samples, doing demonstrations, and acquiring feedback from dealers regarding methods to improve both product and service. Local advertising will consist of newspaper articles, mailings, and workshops that explain wood pellet heating and grant programs that might be available to offset initial pellet stove investments. Advertising in appropriate publications and at conferences/trade shows will also be implemented. PPP intends on making the PPP brand the premier pellet product in the Lake States region by concentrating on quality, as well as growing the company according to increasing demand for the high quality PPP product. Pellet manufacturing industry surveys indicate that there is considerable loyalty or allegiance that is fostered by word-of-mouth among dealers and consumers.
P O R C U P I N E P E L L E T P L A N T | B U S I N E S S P L A N P A G E 2 1
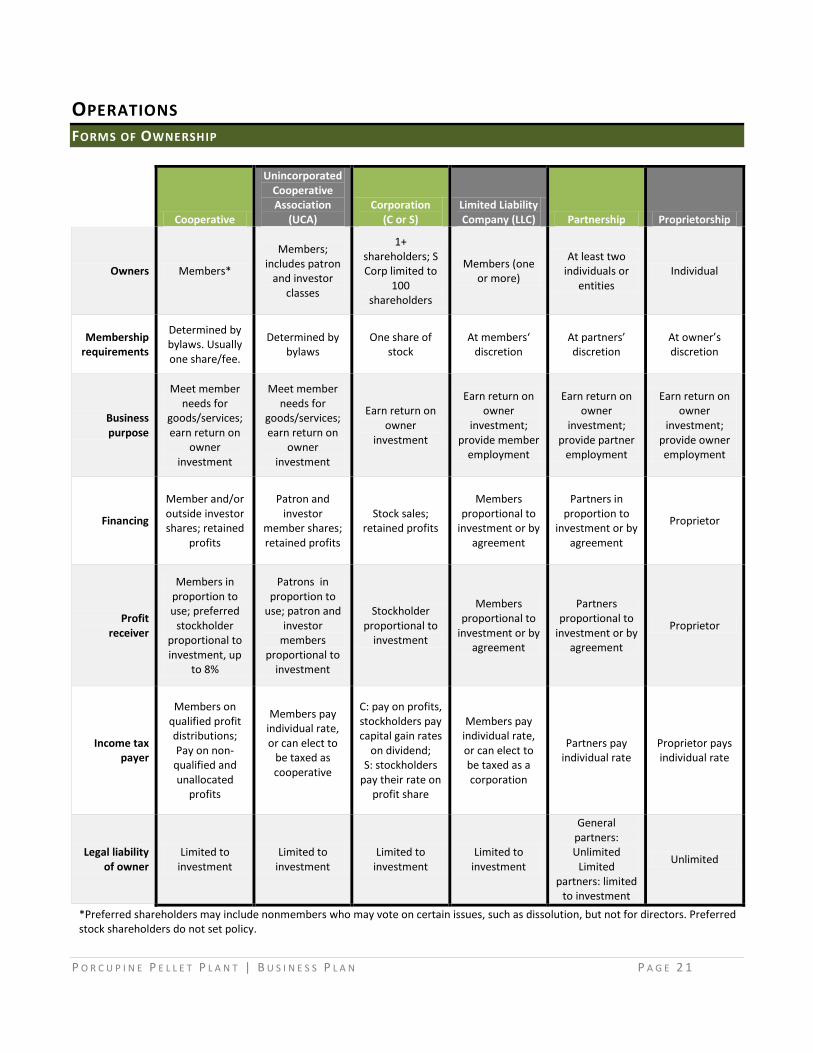
OPERATIONS FORMS OF OWNERSHIP
Cooperative
Unincorporated Cooperative Association
(UCA) Corporation
(C or S) Limited Liability Company (LLC) Partnership Proprietorship
Owners Members*
Members; includes patron
and investor classes
1+ shareholders; S Corp limited to
100 shareholders
Members (one or more)
At least two individuals or
entities Individual
Membership requirements
Determined by bylaws. Usually one share/fee.
Determined by bylaws
One share of stock
At members‘ discretion
At partners’ discretion
At owner’s discretion
Business purpose
Meet member needs for
goods/services; earn return on
owner investment
Meet member needs for
goods/services; earn return on
owner investment
Earn return on owner
investment
Earn return on owner
investment; provide member
employment
Earn return on owner
investment; provide partner
employment
Earn return on owner
investment; provide owner employment
Financing
Member and/or outside investor shares; retained
profits
Patron and investor
member shares; retained profits
Stock sales; retained profits
Members proportional to
investment or by agreement
Partners in proportion to
investment or by agreement
Proprietor
Profit receiver
Members in proportion to use; preferred
stockholder proportional to investment, up
to 8%
Patrons in proportion to
use; patron and investor
members proportional to
investment
Stockholder proportional to
investment
Members proportional to
investment or by agreement
Partners proportional to
investment or by agreement
Proprietor
Income tax payer
Members on qualified profit distributions; Pay on non-
qualified and unallocated
profits
Members pay individual rate, or can elect to
be taxed as cooperative
C: pay on profits, stockholders pay capital gain rates
on dividend; S: stockholders
pay their rate on profit share
Members pay individual rate, or can elect to be taxed as a corporation
Partners pay individual rate
Proprietor pays individual rate
Legal liability of owner
Limited to investment
Limited to investment
Limited to investment
Limited to investment
General partners: Unlimited
Limited partners: limited
to investment
Unlimited
*Preferred shareholders may include nonmembers who may vote on certain issues, such as dissolution, but not for directors. Preferred stock shareholders do not set policy.
P O R C U P I N E P E L L E T P L A N T | B U S I N E S S P L A N P A G E 2 2
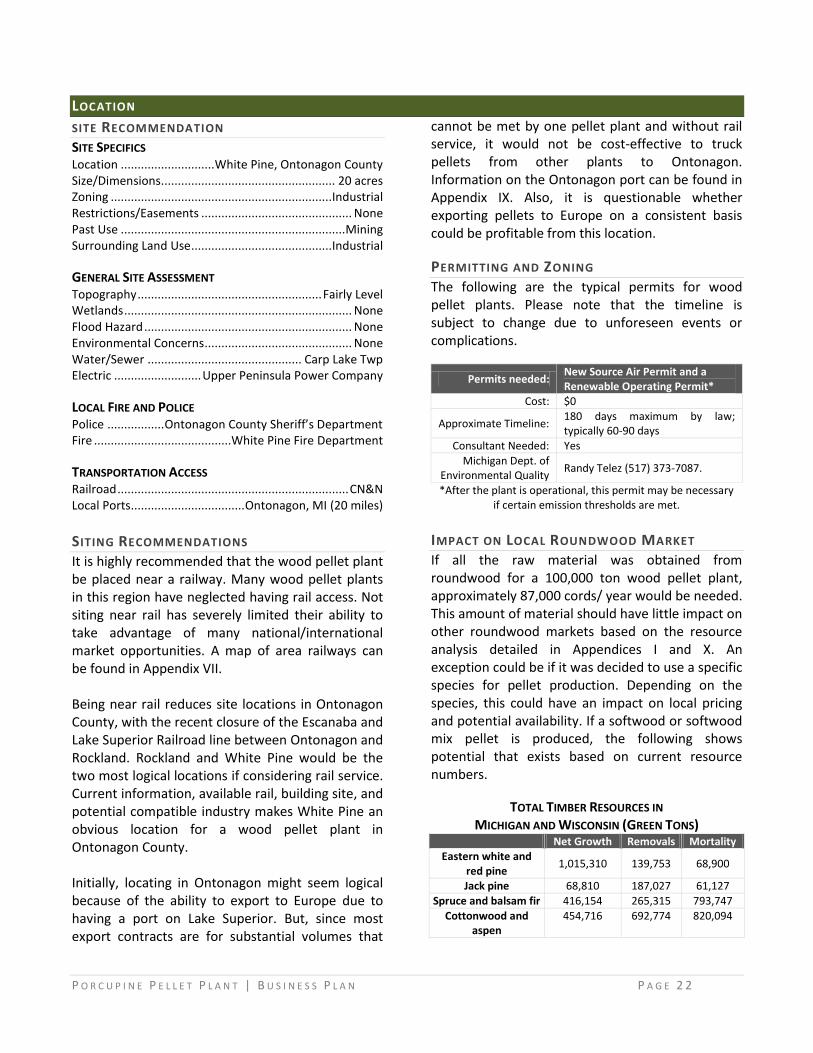
LOCATION
SITE RECOMMENDATION SITE SPECIFICS Location ............................ White Pine, Ontonagon County Size/Dimensions.................................................... 20 acres Zoning .................................................................. Industrial Restrictions/Easements ............................................. None Past Use ................................................................... Mining Surrounding Land Use .......................................... Industrial
GENERAL SITE ASSESSMENT Topography ....................................................... Fairly Level Wetlands .................................................................... None Flood Hazard .............................................................. None Environmental Concerns ............................................ None Water/Sewer .............................................. Carp Lake Twp Electric .......................... Upper Peninsula Power Company
LOCAL FIRE AND POLICE Police ................. Ontonagon County Sheriff’s Department Fire .........................................White Pine Fire Department
TRANSPORTATION ACCESS Railroad ..................................................................... CN&N Local Ports.................................. Ontonagon, MI (20 miles)
SITING RECOMMENDATIONS It is highly recommended that the wood pellet plant be placed near a railway. Many wood pellet plants in this region have neglected having rail access. Not siting near rail has severely limited their ability to take advantage of many national/international market opportunities. A map of area railways can be found in Appendix VII. Being near rail reduces site locations in Ontonagon County, with the recent closure of the Escanaba and Lake Superior Railroad line between Ontonagon and Rockland. Rockland and White Pine would be the two most logical locations if considering rail service. Current information, available rail, building site, and potential compatible industry makes White Pine an obvious location for a wood pellet plant in Ontonagon County. Initially, locating in Ontonagon might seem logical because of the ability to export to Europe due to having a port on Lake Superior. But, since most export contracts are for substantial volumes that
cannot be met by one pellet plant and without rail service, it would not be cost-effective to truck pellets from other plants to Ontonagon. Information on the Ontonagon port can be found in Appendix IX. Also, it is questionable whether exporting pellets to Europe on a consistent basis could be profitable from this location.
PERMITTING AND ZONING The following are the typical permits for wood pellet plants. Please note that the timeline is subject to change due to unforeseen events or complications.
Permits needed: New Source Air Permit and a Renewable Operating Permit*
Cost: $0
Approximate Timeline: 180 days maximum by law; typically 60-90 days
Consultant Needed: Yes
Michigan Dept. of Environmental Quality
Randy Telez (517) 373-7087.
*After the plant is operational, this permit may be necessary if certain emission thresholds are met.
IMPACT ON LOCAL ROUNDWOOD MARKET If all the raw material was obtained from roundwood for a 100,000 ton wood pellet plant, approximately 87,000 cords/ year would be needed. This amount of material should have little impact on other roundwood markets based on the resource analysis detailed in Appendices I and X. An exception could be if it was decided to use a specific species for pellet production. Depending on the species, this could have an impact on local pricing and potential availability. If a softwood or softwood mix pellet is produced, the following shows potential that exists based on current resource numbers.
TOTAL TIMBER RESOURCES IN MICHIGAN AND WISCONSIN (GREEN TONS)
Net Growth Removals Mortality Eastern white and
red pine 1,015,310 139,753 68,900
Jack pine 68,810 187,027 61,127
Spruce and balsam fir 416,154 265,315 793,747
Cottonwood and aspen
454,716 692,774 820,094

P O R C U P I N E P E L L E T P L A N T | B U S I N E S S P L A N P A G E 2 3
ENVIRONMENTAL IMPACT
See Appendices I and IX for resource assessment/ analysis data Renewable | Wood fuel has several environmental and economic advantages compared to fossil fuels. It is grown locally, causing it to have an economic impact on several levels (landowner, logger, log trucker, pellet plant labor, finished product trucker, and home/business owner that uses pellets). Trees are naturally regenerated, which means a dependable supply if harvested in a sustainable manner. Proper forest management will ensure that forests are not depleted and new stands of trees can be regenerated appropriately. Low Carbon Emissions | Wood combustion produces marginal net (approximately 5%) carbon dioxide (CO2) emissions. This is because the CO2 generated during wood combustion equals the CO2 consumed during the lifecycle of the tree. Transporting and processing wood using petroleum in the processing/ transportation equipment does generate some excess CO2. Minimal Metals and Sulfur | Wood fuel contains minimal heavy metals and has extremely low levels of sulfur; therefore, combusting wood fuel will not create acid rain pollution through sulfur emissions. Minimal Ash | Pellet fuel burns more completely than many other combustibles. Additionally, what ash is created can be used safely for a soil and cement amendment if the raw material is forest based. Controllable Particulates | Particulate emissions from wood are controllable through standard emission control devices such as bag houses, cyclone separators, fly-ash injectors, and electronic precipitators.
REQUIRED MANAGEMENT EXPERTISE
ROUNDWOOD PROCUREMENT & INVENTORY CONTROL EXPERTISE The most important aspect of procurement is developing raw-material quality control specifications that are adhered to while building long-term relationships with the suppliers who consistently meet specifications. Paying a fair price for a specific product will insure a steady supply of raw material. As loads are delivered, or shortly thereafter, they should be inspected to verify that they meet product specifications. A system needs to be in place to warn/penalize suppliers for bringing in non-compliant loads. Setting up a system to purchase by the cord as opposed to by the ton would eliminate the issue of suppliers trying to deliver when the wood is at its heaviest (wettest). Paying a bonus for drier wood would offer an incentive to suppliers to deliver drier wood as well as cut drying costs for the plant. During summer months, insects in the softwoods could be an issue. Debarking softwood as soon as possible will eliminate most insect problems.
MANAGEMENT EXPERTISE Having an experienced President/CEO to oversee everything from workforce hiring to raw material procurement to final product sales and shipping is essential to an efficiently operating plant. It is more beneficial to have an effective administrator/ manager than it is to have experience in the wood pellet industry. Having someone to oversee the entire operation in an efficient manner is critical. Having an effective marketing manager is as important as having a competent plant manager. While the plant manager is responsible for producing a high-quality product, the marketing manager is responsible for making

P O R C U P I N E P E L L E T P L A N T | B U S I N E S S P L A N P A G E 2 4
sure there is a paying consumer base to whom to distribute the product. This person is responsible for establishing a dealer network that is capable of utilizing all of the plant’s pellet production. Having a person experienced in the wood pellet industry, although not a must, would be highly recommended. Selecting a contractor with a proven record in pellet plant construction/layout is essential. There are numerous contractors who claim expertise in pellet plant construction/design, but there are very few with proven legitimate track records. It is highly recommended to go through the bidding process with a request for references and proof of successful operating pellet plants that they have constructed.
PLANT MANAGER EXPERTISE Having a plant manager with experience in producing a quality pellet from roundwood is recommended; at the very least bringing in an experienced consultant to train a plant manager is a necessity. One of the biggest problems in wood pellet manufacturing industry has been the switch from utilizing a consistent manufacturing residue (sawdust) to producing pellets using roundwood directly from the forest. Roundwood needs to be processed to a suitable consistency and moisture content. In addition, a wide range of issues from lack of a consistent species mix, excessive bark content, dirt/contaminant content, improper drying, and improper sizing of raw materials has caused numerous problems for many pellet plants
CAPACITY As mentioned earlier, a 100,000-ton plant with four pellet presses would yield the highest profit margin, however, there currently is not the demand to sustain a plant of this size, as illustrated by the table on page 18, This plan focuses on a three-pellet press operation with a plan to reach the 60,000 ton per year level in the third year. Reaching this level of production is essential to achieving long-term sustainability, keeping in mind a possible goal of expanding to a 100,000-ton operation in the future.
MANUFACTURING PROCESS
M A N U F A CT U R I N G The production of a high-quality pellet is essential to the plant’s success. Several factors influence pellet quality: pellet die specifications, roller design, raw material input consistency, and a properly trained workforce.
RA W MA T E R I A L Truckloads of raw materials will be brought to the site daily. A large percentage will be eight foot long pulpwood-sized material. By processing specific raw material in the same manner, the end product will have consistent moisture content, heat value, ash content, and burn characteristics.
DE B A R K E R All roundwood will be debarked by a contractor and piled for chipping.
CH I P P E R All debarked wood will be chipped by a contractor at the plant.
TR A M M E L S CR E E N From a hopper, the wood chips go through a trammel screen where oversized pieces are removed and fine dust is screened out.
IN I T I A L HA M M E R
M I LL A hammer mill will be located at the beginning of the milling process. This machine (the “hog”) takes wood chips and breaks them down into a consistent smaller size, making drying quick and consistent.
DR Y E R S Since whole green wood (approx. 45% moisture) will be used as the predominant raw material, it will have to be dried to a consistent moisture level at approximately 300˚F. A large triple pass drum dryer with a 12-ton per hour capacity will be used for drying.

P O R C U P I N E P E L L E T P L A N T | B U S I N E S S P L A N P A G E 2 5
SE C O N D A R Y
HA M M E R M I LL After drying, the material moves through this hammer mill to reduce the wood to sawdust-sized material.
TE M P E R I N G
TA N K S After the hammer mill properly sizes the material, it is held in a tempering tank for approximately 30 minutes to relax the fibers. There is typically one pre-pellet tempering tank for each pellet mill.
TH E PE L LE T M I L L
(PE L LE T I Z E R ) After the tempering, the processed wood is pressed through dies at high pressure. This process causes the material to heat up and release natural lignins in the wood that binds the material together. The pelletizer also determines the density, diameter, durability, and length of the pellet.
CO O LI N G A N D
ST O R A G E The pellets come out of the mill between 200˚F and 250˚F and in soft condition. A cooling tower is used to bring the temperature down and harden the pellets. After cooling, they are usually stored in a large silo to await bagging or bulk distribution.
BA G G I N G A N D
BU LK The industry’s common method for distribution will be used, which is to put the pellets into 40-pound plastic bags and stack them on pallets or skids. These pallets will contain one ton of fuel. Bagging pellets costs approximately $26 per ton, which includes plastic bags, pallets, outer cover bags, and shrink wrap, but excludes the labor and equipment to stack and wrap them. These pallets are then loaded on trucks or rail cars arranged for by the customer.
Bulk pellets will be loaded from the pellet mill silo directly into trucks for delivery to bulk storage containers at the customer’s location. The bulk trucks are more expensive than regular flatbed trucks, but are a much more efficient system of transferring and delivering pellets.
QUALITY CONTROL REQUIREMENTS
PPP pellets will provide stove retailers and consumers with a standard for product quality and supplier accountability. Testing will be conducted according to the Pellet Fuels Institute (PFI) standards. Each batch of pellets will undergo testing at the plant as specified by the PFI to ensure optimum characteristics, including:
1. Moisture Content – an indication of pellet quality as well as heating value 2. Pellet Fines – a measurement to limit any light dust 3. Other – bulk density, pellet diameter, pellet length, etc.
Additional Independent Testing (Also According to PFI Standards) Pellets will randomly be audited by an independent test lab. In addition, pellets will also be checked for:
1. Ash Content – the quantity of non-combustible minerals in the pellets 2. Heating Value – to determine how much heat is actually produced 3. Pellet Durability – an indication of the ability of the pellets to be transported 4. Chloride Concentration – sodium chloride and other salts can be highly corrosive

P O R C U P I N E P E L L E T P L A N T | B U S I N E S S P L A N P A G E 2 6
FINANCIAL INFORMATION PROJECTED PROFITS
WOOD PELLET MILL EQUIPMENT AND COST
$3,428,052
FEEDSTOCK-RELATED EQUIPMENT & OTHER COSTS
It is anticipated there will be an $8/ton cost for debarking and chipping.
INVESTMENT
Utilizing an existing building site on rail at the White Pine mine location is an essential part of this project. Exact appraisal value of the land has not been determined. Beyond the land value, the goal would be to raise $1.5 million in equity and obtain $4,799,000 in debt financing.
EQUITY
This business plan or a revised version will be presented to potential investors to secure equity.
DEBT
Numerous debt financing options exist, including traditional bank financing and grant/loans (listed in the “Source and Use of Funds” below).
NEW MARKETS TAX CREDIT PROGRAM (NMTC)8
The NMTC permits investors to receive a tax credit in exchange for making equity investments in specialized financial institutions called Community Development Entities (CDEs). The credit totals 39% of the original investment amount and is claimed over a period of 7 years (5% for each of the first 3 years, and 6% for each of the remaining 4 years). The CDE investment cannot be redeemed before the end of the 7-year period. To receive NMTC awards, the organization must be certified as a CDE: be a domestic corporation or partnership at the
time of application demonstrate a primary mission of serving or
providing investment capital for low-income communities or low-income persons
maintain accountability to residents of low-income communities through representation on a governing board or advisory board to the entity
8 Community Development Financials Institution Funds, http://www.cdfifund.gov/what_we_do/programs_id.asp?programID=5
FEEDSTOCK COST AND AVAILABILITY RECONCILIATION TO PRICE USED IN PROJECTED
PROFIT STATEMENT
The price of $35/ton is an estimate used in this plan throughout the years of operation for delivered roundwood. Although delivered prices have fluctuated for pulpwood at various plants throughout any given year, on average over the past 50 years pulpwood prices have stayed much lower than the inflation rate. Depending on the species and raw material specification, it may be possible to purchase materials for an even lower per ton rate. THE WOOD TO ENERGY PROCESS
Although relatively simple in explanation:
Tree is harvested and cut into 8’ lengths (pulpwood)
Pulpwood is delivered to PPP
Contractor debarks and chips pulpwood
Chips are hammermilled and dried
Wood is further reduced in size by a secondary hammermill and then pelletized
Pellets are then sold to dealer or end users In actuality, inefficiencies or failures at any step in the process after the wood is delivered to PPP can result in decreased profitability and even total plant failure.
PELLET REVENUE
Though prices have fluctuated from $150 to $200 per ton in this region, $170/ton has been a fairly consistent price for premium bagged pellets. One-ton tote prices have averaged $160/ton and bulk prices $150/ton. Other pellets such as animal bedding and BBQ pellets may become viable product options but initially residential pellets will be the primary product.
COST OF PROJECT The initial capital/construction costs will be $4 million, with $8.623 million being the annual operating costs for year three.
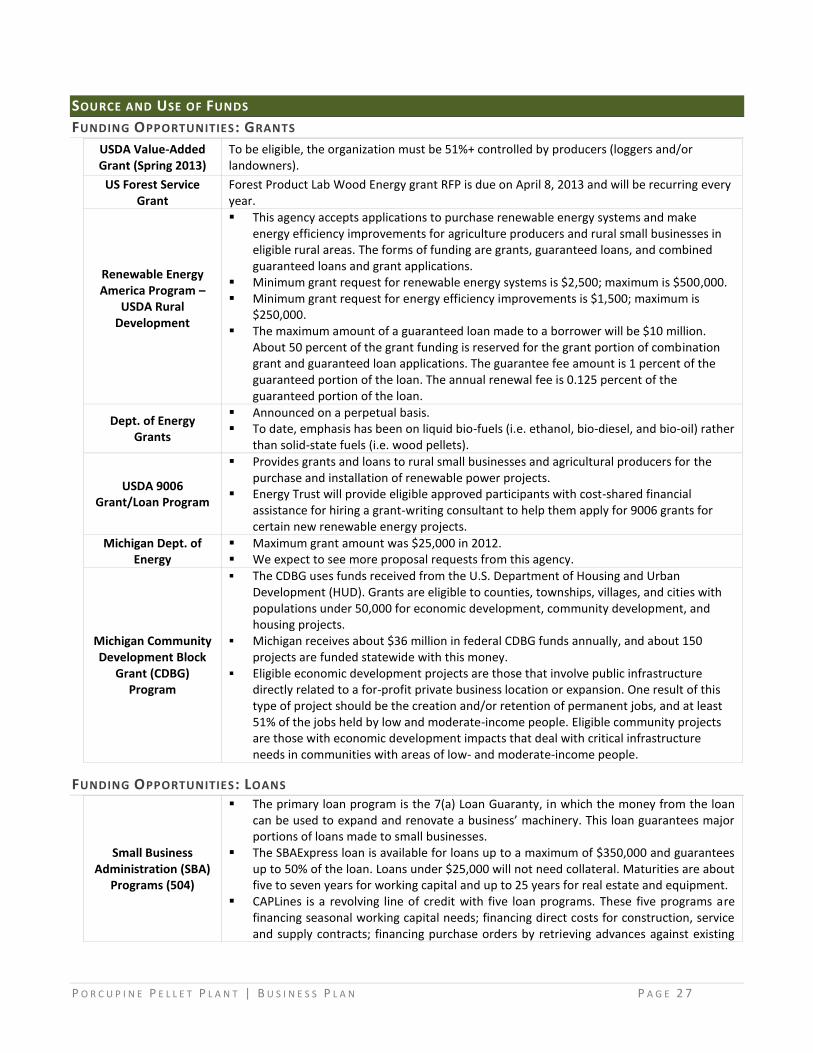
P O R C U P I N E P E L L E T P L A N T | B U S I N E S S P L A N P A G E 2 7
SOURCE AND USE OF FUNDS
FUNDING OPPORTUNITIES: GRANTS
USDA Value-Added Grant (Spring 2013)
To be eligible, the organization must be 51%+ controlled by producers (loggers and/or landowners).
US Forest Service Grant
Forest Product Lab Wood Energy grant RFP is due on April 8, 2013 and will be recurring every year.
Renewable Energy America Program –
USDA Rural Development
This agency accepts applications to purchase renewable energy systems and make energy efficiency improvements for agriculture producers and rural small businesses in eligible rural areas. The forms of funding are grants, guaranteed loans, and combined guaranteed loans and grant applications.
Minimum grant request for renewable energy systems is $2,500; maximum is $500,000. Minimum grant request for energy efficiency improvements is $1,500; maximum is
$250,000. The maximum amount of a guaranteed loan made to a borrower will be $10 million.
About 50 percent of the grant funding is reserved for the grant portion of combination grant and guaranteed loan applications. The guarantee fee amount is 1 percent of the guaranteed portion of the loan. The annual renewal fee is 0.125 percent of the guaranteed portion of the loan.
Dept. of Energy Grants
Announced on a perpetual basis. To date, emphasis has been on liquid bio-fuels (i.e. ethanol, bio-diesel, and bio-oil) rather
than solid-state fuels (i.e. wood pellets).
USDA 9006 Grant/Loan Program
Provides grants and loans to rural small businesses and agricultural producers for the purchase and installation of renewable power projects.
Energy Trust will provide eligible approved participants with cost-shared financial assistance for hiring a grant-writing consultant to help them apply for 9006 grants for certain new renewable energy projects.
Michigan Dept. of Energy
Maximum grant amount was $25,000 in 2012. We expect to see more proposal requests from this agency.
Michigan Community Development Block
Grant (CDBG) Program
The CDBG uses funds received from the U.S. Department of Housing and Urban Development (HUD). Grants are eligible to counties, townships, villages, and cities with populations under 50,000 for economic development, community development, and housing projects.
Michigan receives about $36 million in federal CDBG funds annually, and about 150 projects are funded statewide with this money.
Eligible economic development projects are those that involve public infrastructure directly related to a for-profit private business location or expansion. One result of this type of project should be the creation and/or retention of permanent jobs, and at least 51% of the jobs held by low and moderate-income people. Eligible community projects are those with economic development impacts that deal with critical infrastructure needs in communities with areas of low- and moderate-income people.
FUNDING OPPORTUNITIES: LOANS
Small Business Administration (SBA)
Programs (504)
The primary loan program is the 7(a) Loan Guaranty, in which the money from the loan can be used to expand and renovate a business’ machinery. This loan guarantees major portions of loans made to small businesses.
The SBAExpress loan is available for loans up to a maximum of $350,000 and guarantees up to 50% of the loan. Loans under $25,000 will not need collateral. Maturities are about five to seven years for working capital and up to 25 years for real estate and equipment.
CAPLines is a revolving line of credit with five loan programs. These five programs are financing seasonal working capital needs; financing direct costs for construction, service and supply contracts; financing purchase orders by retrieving advances against existing

P O R C U P I N E P E L L E T P L A N T | B U S I N E S S P L A N P A G E 2 8
inventory and accounts receivable; and consolidate short-term debt. Export Working Capital Program (EWCP) gives working capital financing for export
activities. This loan cannot be used to refinance fixed assets, marketing, or setting up operations abroad.
USDA Rural Development
Business and Industry Guaranteed Loans
(B&I)
A borrower may be a cooperative organization, corporation, partnership, or other legal entity organized and operated on a profit or nonprofit basis; an Indian tribe on a Federal or State reservation or other Federally recognized tribal group; a public body; or an individual. A borrower must be engaged in or proposing to engage in a business that will: Provide employment; Improve the economic or environmental climate; Promote the conservation, development, and use of water for aquaculture; or Reduce reliance on nonrenewable energy resources by encouraging the development
and construction of solar energy systems and other renewable energy systems. Loan purposes must be consistent with the general purpose contained in the regulation. They include, but are not limited to, the following: Business and industrial acquisitions when the loan will keep the business from closing,
prevent the loss of employment opportunities, or provide expanded job opportunities Business conversion, enlargement, repair, modernization, or development Purchase and development of land, easements, right-of-ways, buildings, or facilities Purchase of equipment, leasehold improvements, machinery, supplies, or inventory The total amount of Agency loans to one borrower must not exceed $10 million. The Administrator may, at the Administrator’s discretion, grant an exception to the $10 million limit for loans of $25 million under certain circumstances. The Secretary may approve guaranteed loans in excess of $25 million, up to $40 million, for rural cooperative organizations that process value-added agricultural commodities.
Michigan Economic Development
Corporation – Capital Access Program (CAP)
The CAP is an innovative program available through the Michigan Economic Development Corporation (MEDC) to assist businesses with capital needs. It uses small amounts of public resources to generate private bank financing, providing small Michigan businesses access to bank financing that might not otherwise be available. Direct Bank-Business Transaction Loans under CAP are private
transactions between bank and borrower.
MEDC plays no role in the bank’s decision to make the loan or in setting its terms.
Bank assumes the risk of the loan.
Flexible, Non-Bureaucratic CAP loans can be long or
short term, term loan, or line of credit.
Bank has flexibility to recast, extend, or refinance the loan to address needs of the business owner.
Eligible Borrowers CAP loans are
available to most businesses located in Michigan that satisfy the bank’s criteria.
FUNDING OPPORTUNITIES: INCENTIVES
Forest Products Processing
Renaissance Zones (FPPRZ)
The application process begins by having a community/company official(s) meet with a Michigan Economic Development Corporation (MEDC) account manager to discuss a project in detail. FPPRZ applications are turned in to the MEDC. The area in which an FPPRZ is proposed must approve a resolution for abatement of taxes and the applicants must show the positive economic impact the project will have on the municipal and state government. Facilities on this renaissance zone will not have to pay the following: Single Business Tax (SBT), state education tax, personal and real property taxes, and local income tax. Federal taxes, local bond obligations, school sinking funds, and special assessments will still be due. Forest product processing facilities in FPPRZs need to be current with all state and local taxes to be eligible for the benefits under the program.

P O R C U P I N E P E L L E T P L A N T | B U S I N E S S P L A N P A G E 2 9
Renewable Energy Renaissance Zone
(RERZ)
RERZs were created to promote renewable energy operations in Michigan. RERZs must contain the company’s renewable energy facility, but it may be located anywhere in Michigan. Eligible facilities include those that create energy, fuels, or chemicals directly from the wind, sun, trees, grasses, biosolids, algae, agricultural commodities, processed products from agricultural commodities, or residues from agricultural processes, wood or forest processes, food production and processing, or the paper products industry. The proposed wood pellet plant qualifies under this eligibility standard by creating energy directly from trees. If granted this renaissance zone, the facility would not have to pay state education taxes, personal and real property taxes, and local income taxes. Federal taxes, local bond obligations, school sinking funds, and special assessments would still be required.
Personal Property Tax Relief in Distressed
Communities
This allows distressed communities (defined under the MI State Housing Development Authority Act) and all county seats (defined under the Neighborhood Enterprise Zone Act) to decrease all new personal property taxes in certain geographic areas to increase economic development. Cities, villages, and townships in these distressed areas and all county seats are eligible. Carp Lake, White Pine’s township, falls into this category. Manufacturing, mining, research and development, wholesale trade, and office operations are all eligible projects. Retail businesses and casinos are not eligible. Eligible local areas may exempt new personal property in an industrial development district, a renaissance zone, an enterprise zone, a brownfield redevelopment zone, an empowerment zone, a tax increment financing district, a local development financing district, or a downtown development district. Length of abatement will be negotiated between the local community and the business, and the law does not have a maximum or minimum amount of years.
Industrial Property Tax Abatement
This provides incentives for MI manufacturers to build new plants, expand existing plants, renovate aging plants, or add new machinery and equipment. High-technology operations are also eligible. A written request must be sent to establish the district for the project. The request must be sent to the project area’s legislative body. Carp Lake Township, which contains White Pine, can grant tax abatements for both real property and personal property. A PA 198 provides approximately a 50 percent reduction in property liability for real property. A PA 328 provides 100 percent reduction in real personal property invested during the life of the zone. The tax abatement can be awarded for a period up to 12 years. Industrial plants that are eligible are those that mainly manufacture or process goods or materials by physical or chemical change. Offices, engineering, research and development, buildings, building improvements, machinery, equipment, furniture, fixtures, warehousing or parts distribution are also eligible for the tax exemption. Any buildings and/or equipment that existed prior to construction of a new facility are not exempt. Any structure(s) or equipment added after the completion of a project is fully taxable. Land is still taxable.

P O R C U P I N E P E L L E T P L A N T | B U S I N E S S P L A N P A G E 3 0
DISTRIBUTION COSTS
The goal will be to sell all products at the plant door with all transportation costs being born by the purchaser. However, PPP will have trucking and rail option identified with contact information for any interested purchasers.
OPERATING COSTS
RAW MATERIALS Raw materials are a major cost in the pellet process. The average raw material cost used for PPP in this plan is $35 per ton. This wood is used as the raw material input. To manufacture 60,000 tons of pellets requires approximately 120,000 tons of wood. When converting green (wet) tons of wood to arrive at the final product, i.e. pellets, we used a ratio of 2 tons of green wood residues, to a yield of one ton of pellets. This assumes an average input moisture content of approximately 45%, resulting in a 5% to 8% pellet moisture content output. Another 12,000 tons of wood is used as fuel to heat the dryer.
DIRECT LABOR There will be seven (7) or more people dedicated to the pellet facility per shift, plus a full time maintenance person, resulting in twenty-two (22) full-time direct labor employees. Bagging of the pellets will be an automated process ending with a robotic device to pack the pallets. The average salary and benefits is $30,800.
FEEDSTOCK PROCUREMENT FEES, ELECTRICITY,
AND RENTALS FEEDSTOCK PROCUREMENT Feedstock procurement costs have been figured into the administrative costs. ELECTRICITY COSTS The electricity used to power the pellet facility will be purchased from the local utility company. We anticipate using approximately 9,207,271 raw kWh to power the facility at full production. The price per kWh is expected to be $0.09229.
TRANSPORTATION COSTS Sold at the plant door, contract truckers will be used with the trucking price or rail car price being the responsibility of the purchaser.
SUPPLIES (CONSUMABLE) This includes the bags ($0.25 per bag), pallet caps ($2.50 per pallet) and the pallets ($7.50 per pallet), which is a total cost of approximately $22.50 to package a ton of pellets.
PARTS AND MAINTENANCE DIES AND ROLLERS Annual cost at full production will be approximately $210,000/yr. MAINTENANCE The pellet plant will require constant maintenance and will include at least one full-time maintenance worker, an on-call electrician, and a plant machine shop.
EQUIPMENT REPLACEMENT A list of all parts and when they were last replaced will be kept in the plant manager’s office. An inventory of frequently replaced parts will be kept on hand.
INSURANCE Insurance covers workers compensation, property, umbrella, and general liability. Proper insurance is important as fires in pellet plants can happen and fires in the dryers are common. The site will have fire suppression equipment and sensors will be installed in critical areas to detect any fires. The annual cost of these insurance overages, at full production, is $166,500.

P O R C U P I N E P E L L E T P L A N T | B U S I N E S S P L A N P A G E 3 1
FINANCIAL STATEMENTS
INCOME Detailed, monthly information regarding the financial statements can be found in Appendix X, but here is the general, annual overview of the balance sheet, income statement, and cash flows statement.
PORCUPINE PELLET PLANT BALANCE SHEET | DECEMBER 31
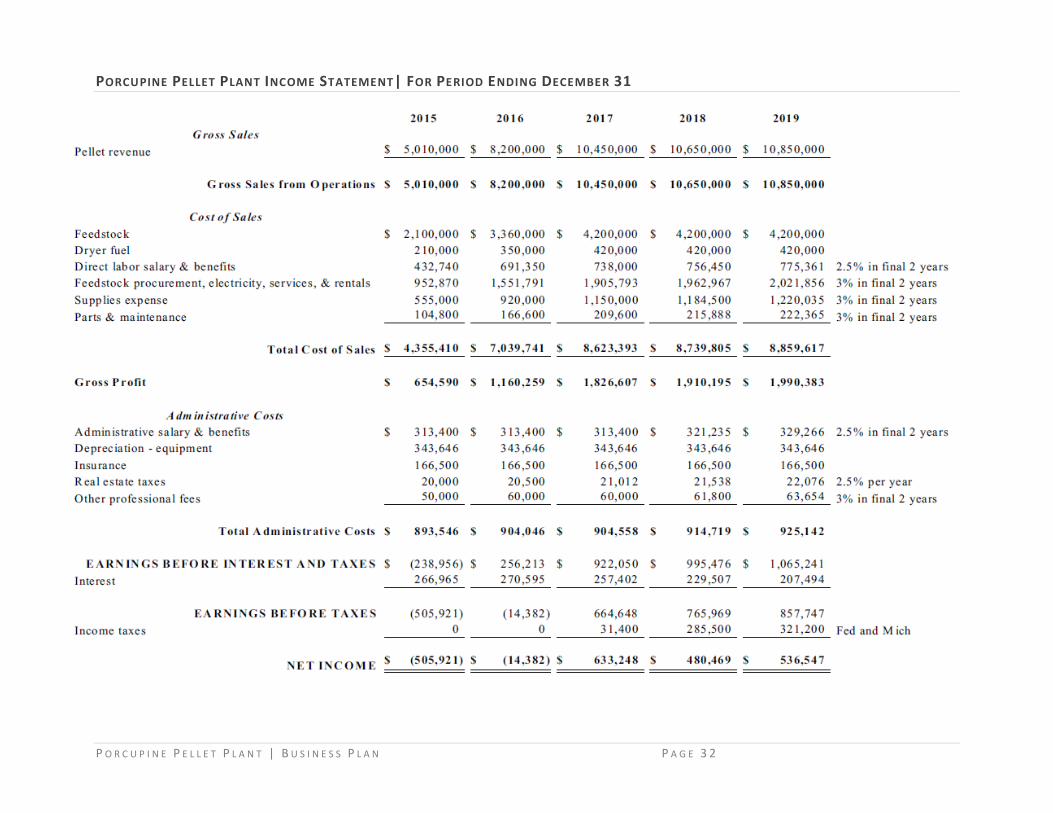
P O R C U P I N E P E L L E T P L A N T | B U S I N E S S P L A N P A G E 3 2
PORCUPINE PELLET PLANT INCOME STATEMENT| FOR PERIOD ENDING DECEMBER 31

P O R C U P I N E P E L L E T P L A N T | B U S I N E S S P L A N P A G E 3 3
PORCUPINE PELLET PLANT CASH FLOW STATEMENT| FOR PERIOD ENDING DECEMBER 31

P O R C U P I N E P E L L E T P L A N T | B U S I N E S S P L A N P A G E 3 4
ASSUMPTIONS
GROSS SALES
1 | Pellet Revenues 2015
(30,000 tons) 2016
(48,000 tons) 2017
(60,000 tons) 2018
(60,000 tons) 2019
(60,000 tons)
Premium bagged: $170-$186/ton
24,000 tons $4,080,000
40,000 tons $6,960,000
50,000 tons $8,900,0000
50,000 tons $9,100,000
50,000 tons $9,300,000
Premium totes: $160/ton
3,000 tons $480,000
4,000 tons $640,000
5,000 tons $800,000
5,000 tons $800,000
5,000 tons $800,000
Industrial bulk: $150/ton
3,000 tons $450,000
4,000 tons $600,000
5,000 tons $750,000
5,000 tons $750,000
5,000 tons $750,000
Total $5,010,000 $8,200,000 $10,450,000 $10,650,000 $10,850,000
COST OF SALES
Table 2 | Feedstock & Fuel 2015 2016 2017 2018 2019
Feedstock ratio to wood pellets manufactured
(2 to 1 ratio)
31,200 tons x 2
62,400 tons
49,200 tons x 2
98,400 tons
60,000 tons x 2
120,000 tons
60,000 tons x 2
120,000 tons
60,000 tons x 2
120,000 tons
Feedstock needed for fuel/year 6,000 tons 10,000 tons 12,000 tons 12,000 tons 12,000 tons
Total wood 68,400 tons 108,400 tons 132,000 tons 132,000 tons 132,000 tons
Average price/ton of wood $35 $35 $35 $35 $35 Total $2,394,000 $3,794,000 $4,620,000 $4,620,000 $4,620,000
3 | Direct Labor - salary and benefits 2015 2016 2017 2018 2019
General Labor
Staff size 12 18 18 18 18
Net salary ($10-$18 range) $26,000 $28,000 $30,000 $30,000 $30,000 Additional costs 10% 10% 10% 10% 10%
Gross salary (net salary x 1.1) $28,600 $30,800 $33,300 $33,300 $33,300
Total (size x gross salary) $343,200 $554,400 $599,400 $599,400 $599,400
Shift Foreman Staff size 2 3 3 3 3
Net salary $40,700 $41,500 $42,000 $42,000 $42,000
Additional costs 10% 10% 10% 10% 10%
Gross salary (net salary x 1.1) $44,770 $45,650 $46,200 $46,200 $46,200
Total foreman salaries $89,540 $136,950 $138,600 $138,600 $138,600
Total Direct Labor $432,740 $691,350 $738,000 $738,000 $738,000
4 | Feedstock Procurement, Electricity & Operating Costs 2015 2016 2017 2018 2019
kWhs price $424,870 $703,791 $849,739 $849,739 $849,739
Equipment operation $528,000 $848,000 $1,056,000 $1,056,000 $1,056,000
Total $952,870 $1,551,791 $1,905,793 $1,905,793 $1,905,793

P O R C U P I N E P E L L E T P L A N T | B U S I N E S S P L A N P A G E 3 5
Electricity estimated to be used to operate wood pellet mill 2015: 4,603,631 kWhs x $0.09229/kWh $424,870 2016: 7,625,866 kWhs x $0.09229/kWh $703,791
2017 - 2019: 9,207,271 kWhs x $0.09229/kWh $849,739/year
Estimated costs to operate debarker, grinder, and grapple (feeding) equipment per ton = $8.00 Total wood (per Assumption 2 above):
2015: 66,000 2016: 106,000
2017 - 2019: 132,000/year
Cost to operate equipment: 2015: $8.00/ton x 66,000 tons $528,000 2016: $8.00/ton x 106,000 tons $848,000
2017 - 2019: $8.00/ton x 132,000 tons $1,056,000/year
5 | Supplies (50,000 tons in 40-lb bags, 5,000 tons in one ton totes, 5,000 tons bulk) 2015 2016 2017 2018 2019
Pallets $180,000 $300,000 $375,000 $375,000 $375,000
Plastic pellet bags $300,000 $500,000 $625,000 $625,000 $625,000
One-ton totes $15,000 $20,000 $25,000 $25,000 $25,000
Hooders $60,000 $100,000 $125,000 $125,000 $125,000 Total $555,000 $920,000 $1,150,000 $1,150,000 $1,150,000
Year 2015: Pallets required to house bags of pellets for one year = 24,000
Price per pallet = $7.50 24,000 pallets x $7.50 = $180,000
Plastic pellet bags for one year = 1,200,000* Price per plastic bag = $0.25
Price per bag $0.25 x 1,200,000 = $300,000
One-ton totes: $5.00/bag x 3,000 totes = $15,000
Hooder cost per pallet = $2.50 Pallets required to house bags of pellets = 7,738
$2.50 Hooder per pallet x 24,000 (# of pallets per year) = $60,000 * (2,000 lbs. per ton @ 50,000 tons residential bagged per year)/ 40-lb bags
Year 2016:
Pallets required to house bags of pellets for one year = 40,000 Price per pallet = $7.50
40,000 pallets x $7.50 = $300,000
Plastic pellet bags for one year = 2,000,000* Price per plastic bag = $0.25
Price per bag $0.25 x 2,000,000 = $500,000
One-ton totes: $5.00/bag x 4,000 totes = $20,000
Hooder cost per pallet = $2.50 Pallets required to house bags of pellets = 7,738
$2.50 Hooder per pallet * 40,000 (# of pallets per year) $100,000 * (2,000 lbs. per ton @ 50,000 tons residential bagged per year)/ 40-lb bags

P O R C U P I N E P E L L E T P L A N T | B U S I N E S S P L A N P A G E 3 6
Years 2017 - 2019: Pallets required to house bags of pellets for one year = 50,000
Price per pallet = $7.50 50,000 pallets x $7.50 = $375,000 per year
Plastic pellet bags for one year = 2,500,000* Price per plastic bag = $0.25
Price per bag $0.25 x 2,500,000 = $625,000 per year
One-ton totes: $5.00/bag x 5,000 totes = $25,000 per year
Hooder cost per pallet = $2.50 # of pallets required to house bags of pellets = 7,738
$2.50 Hooder per pallet * 50,000 (# of pallets per year) = $125,000 per year *(2,000 lbs. per ton @ 50,000 tons residential bagged per year)/ 40-lb bags
6 | Parts & Maintenance (annual # of dies and rollers used per year) 2015 2016 2017 2018 2019
Die costs $40,000 $64,000 $80,000 $80,000 $80,000 Roller costs $64,800 $102,600 $129,600 $129,600 $129,600
Total $104,800 $166,600 $209,600 $209,600 $209,600
Year 2015 Year 2016 Years 2017-2019
Wood pellets manufactured requiring die change = 3,000 3,000 3,000 Dies per pellet line = 1 1 1
Pellet lines = 3 3 3 Dies required per year = 10 16 20 (rounded)
Cost for a new die = $4,000 $4,000 $4,000
Annual cost for dies: = $40,000 $64,000 $80,000
Wood pellets manufactured requiring roller change = 1,250 1,250 1,250 Rollers per pellet line = 2 2 2
Pellet lines = 3 3 3 Rollers for wood pellet mill = 6 4 64
Rollers required per year = 24 38 48 (rounded) Cost for a new roller = $2,700 $2,700 $2,700
Annual cost for roller: = $64,800 $102,600 $129,600
ADMINISTRATIVE COSTS 7 | Administrative Salary (guaranty payment) & Benefits
2015 2016 2017 2018 2019
President $75,000 $75,000 $75,000 $76,897 $78,797
Plant Manager (1) Industrial Production Manager
$69,700 $69,700 $69,700 $71,463 $73,229
Office Manager (1) Administrative Service Manager
$55,000 $55,000 $55,000 $56,391 $57,784
Clerical (1) Office Clerk (full-time)
$25,000 $25,000 $25,000 $25,632 $26,266
Clerical (1) Office Clerk (part-time)
$10,000 $10,000 $10,000 $10,252 $10,506
Marketing Manager $35,000 $35,000 $35,000 $35,885 $36,772
Average benefits * Plant share of taxes (FICA, unemployment, etc.)
$43,700 $43,700 $43,700 $44,805 $45,912
Total $313,400 $313,400 $313,400 $321,325 $329,266 Above data from the Michigan Labor Market Information, Occupational Employment Survey for region.
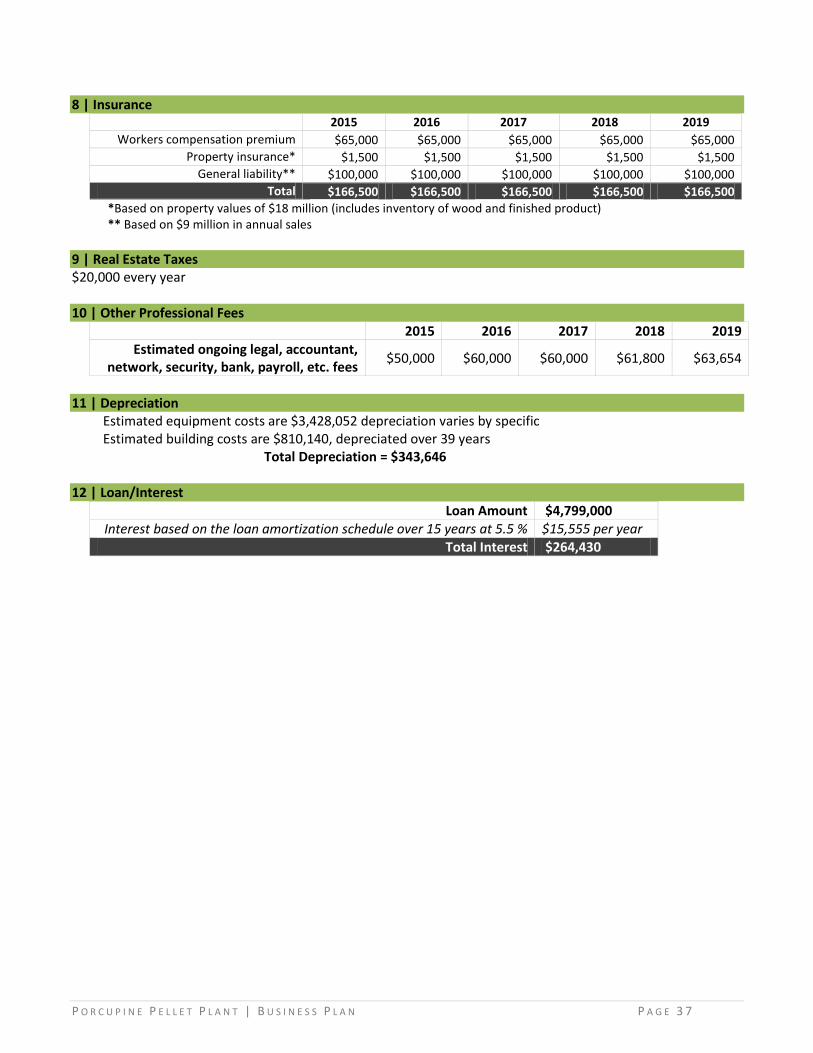
P O R C U P I N E P E L L E T P L A N T | B U S I N E S S P L A N P A G E 3 7
8 | Insurance 2015 2016 2017 2018 2019
Workers compensation premium $65,000 $65,000 $65,000 $65,000 $65,000
Property insurance* $1,500 $1,500 $1,500 $1,500 $1,500
General liability** $100,000 $100,000 $100,000 $100,000 $100,000
Total $166,500 $166,500 $166,500 $166,500 $166,500
*Based on property values of $18 million (includes inventory of wood and finished product) ** Based on $9 million in annual sales
9 | Real Estate Taxes $20,000 every year
10 | Other Professional Fees
2015 2016 2017 2018 2019 Estimated ongoing legal, accountant,
network, security, bank, payroll, etc. fees $50,000 $60,000 $60,000 $61,800 $63,654
11 | Depreciation
Estimated equipment costs are $3,428,052 depreciation varies by specific Estimated building costs are $810,140, depreciated over 39 years
Total Depreciation = $343,646 12 | Loan/Interest
Loan Amount $4,799,000 Interest based on the loan amortization schedule over 15 years at 5.5 % $15,555 per year
Total Interest $264,430
P O R C U P I N E P E L L E T P L A N T | B U S I N E S S P L A N P A G E 3 8
CONCLUSION This plan was prepared taking into consideration all the steps and processes involved with making pellets from roundwood. This not only adds cost, but a number of raw material and process variables also makes production of a consistent/high quality pellet challenging. This, compounded with the fact that production of pellets from roundwood is in its infancy in the US, makes for a lack of available expertise at the management level. Wood pellet plants in this region that utilize roundwood have had quality control issues, making it difficult to compete with high-end pellets, such as the “Bear Mountain” brand. Any plant that could produce a product comparable to “Bear Mountain” would, in all likelihood, be able to sell all they could produce at a premium price. Of course, it would still take a couple of years to establish this reputation and become known, but such a plant should have no problem being profitable far beyond what is projected in this plan. This plan was made for what has been the standard in the industry, not the exception. Also, if another wood industry plant is established in the area, another 5,000 tons or more of dry wood residue would be produced. A smaller-scale plant could be profitable because a majority of the equipment and processes associated with this plant could be eliminated. Obtaining raw material from forest industry residues makes the most economic sense, because using this source eliminates processing costs associated with using raw forest products. However, poor lumber markets, the movement of many forest industry companies to foreign countries, and increased raw material competition has reduced the supply and increased the price of mill residue. This type of raw material will be capable of supplying only a small percentage (<10%) of total feedstock. Potential sources of residue feedstock can be found in Appendix V. The next raw material option is bringing in chips from logging operations, which would be the preferred source for industrial pellets (3/8” and 3+ percent ash). Dirt content would have to be evaluated, especially with whole tree/pole length skidding operations. Currently, the industrial pellet market is very limited and should not be counted on. This could change if the price for industrial pellets in Europe increases by 25% or more, covering the cost of shipping to Europe. Bringing in roundwood to be debarked and chipped at the plant would require the highest amount of processing, but if residential (premium) pellets are the primary product, this will initially be the only option. Concentrating on producing a high-quality premium pellet by using only a few species of softwood (pine and spruce) with a possible mix of a softer hardwood, such as aspen, will help differentiate PPP pellets from many other pellet brands. The pitch found in pine and spruce gives them a higher BTU content than hardwood pellets. Currently, raw material availability will not be an issue; however, long-term sustainability of raw material supply cannot be assured due to other potential markets that may emerge. It is evident that many loggers struggle to find long-term sustainable markets for their wood products; therefore, a local company that pays fair prices on a timely basis with a consistent demand should be well-positioned to receive consistent supplies of raw materials. The permitting process in Michigan is mandated by law to take no more than 180 days; however, this timeframe does not start until a complete application is submitted. DEQ personnel gave estimates ranging from 30 to 90 days, typically, to complete the process. The location of markets and competition in these markets is possibly the biggest factor to consider. With five significant pellet plants in northern Wisconsin and one other residential pellet manufacturer in the Upper Peninsula at this time, the supply and production capacity in this region is substantial; however, only Great Lakes

P O R C U P I N E P E L L E T P L A N T | B U S I N E S S P L A N P A G E 3 9
Renewable Energy in Hayward, WI has concentrated on producing softwood pellets. Concentrating on this product would definitely give PPP the opportunity to get a substantial foothold in the softwood premium pellet market. Trans-ocean markets (Europe and Asia) currently have little indication of being profitable in the next year; however, until a plant is actually operational and producing a consistent volume of pellets, it will be difficult to ascertain the exact potential of these markets. Additionally, the fluctuating valuation of the dollar and shipping costs make an accurate assessment of foreign market potential nearly impossible until you have a marketable supply of pellets. All indications are that markets for premium ¼” pellets will continue to see growth as will the supply of these pellets. Producing a quality pellet while establishing a relationship with retail pellet dealers, pellet stove dealers, and wholesalers will help ensure a substantial portion of the market. Mild or harsh weather conditions can have a dramatic effect on this market. While the industrial pellet markets are tremendous in Europe, it only accounts for 5% of the pellet production in North America. Industrial pellets can be used to heat commercial and public buildings and for the generation of electricity. The benefit of pellets versus traditional wood fuel sources is easier handling and storage plus a consistent moisture content. Government incentives for conversion to renewable energy systems and/or green energy credits could give an immediate boost to this market potential. Another use for pellets is animal bedding. Animal bedding has the potential to be a significant year-round market, which can potentially help with cash flow concerns in the spring and summer months. Identifying sustainable markets and producing a quality product will be essential. Grant opportunities such as the USDA Value-Added Grant, Department of Energy Grants, USDA Rural Development Renewable Energy Programs, Michigan Biomass Energy Program, Michigan Department of Energy, and the Michigan Community Development Block Grant Program are very positive for this plant. Many other financing options exist in addition to grants, such as the MEDC Capital Access Program, and the Small Business Administration Programs. In collaboration with grants and loans, the incentives for creating a wood pellet plant in White Pine include the Forest Products Processing Renaissance Zones, Renewable Energy Renaissance Zones, the Personal Property Tax Relief in Distressed Communities, and the Industrial Property Tax Abatement. The two largest questions concerning the feasibility of this plant are markets and financing. Market demand will fluctuate with weather (severity of winter), increased use of pellets for heating, increased production with the pellet industry, foreign demand, and the emergence of new domestic markets (i.e. industrial pellet use and animal bedding). The bottom line on markets is that until pellets of a high quality are produced, there are no market guarantees. Financing can have almost as many variables as the market depending upon grants, government loans, investors, and financial institutions. It is recommended to keep options open on financial institutions as far into the process as possible. A plant that is operational in 2015 will be positioned to take advantage of the growing and emerging markets if the owners/managers of the plant are willing to adapt production to take advantage of them. If production is centered on one product without addressing consumer preferences and changing markets, it is likely that the plant will suffer financially from market fluctuations. Inversely, a plant willing to adapt its production will likely maintain sustainable profit margins and demand for their products while avoiding rollercoaster markets associated with adhering to one specific product.

P O R C U P I N E P E L L E T P L A N T | B U S I N E S S P L A N P A G E 4 0
APPENDICES

P O R C U P I N E P E L L E T P L A N T | B U S I N E S S P L A N P A G E 4 1
APPENDIX I: RESOURCE ASSESSMENT WOOD SOURCES AND PROCUREMENT AREA DATA Most of the wood will be procured from a specific radius of the project location. For the purposes of this assessment, White Pine, MI was considered as the plant location. County boundaries were used to increase accuracy and to take advantage of the availability of more in-depth data. This report looks at USFS Forest Inventory Analysis and other cited information for the following counties:
Michigan Wisconsin
Baraga Dickinson Gogebic Houghton
Iron Keweenaw Marquette Ontonagon
Ashland Iron Oneida Vilas
TABLE 1.1: ACRES OF SAMPLED NON-RESERVED FORESTLAND BY COUNTY AND OWNERSHIP
9
County ST National
Forest Dept of Defense
Other Federal State
Local (county, municipal, etc.)
Other non federal Private Totals
Baraga MI 43,025 - 4,518 71,978 3,232 4,064 401,485 528,301
Dickinson MI - - - 172,402 8,236 - 202,055 382,693
Gogebic MI 255,667 - - 7,308 70,952 - 313,561 647,487
Houghton MI 138,089 - - 47,990 - - 371,960 558,039
Iron MI 166,931 - - 76,568 - - 443,498 686,997
Keweenaw MI - - - 4,004 - - 192,285 196,289
Marquette MI 11,840 5,264 - 249,785 9,769 - 707,129 983,787
Ontonagon MI 271,480 - - 28,750 5,834 - 385,675 691,739
Ashland WI 163,430 - - 15,127 42,476 - 196,103 417,136
Iron WI - - - 77,795 172,740 - 201,088 451,624
Oneida WI 10,317 - - 87,746 89,135 5,239 434,429 626,866
Vilas WI 53,660 - - 139,802 47,242 - 272,754 513,458
Totals 1,114,439 5,264 4,518 979,255 449,616 9,303 4,122,022 6,684,416
REALISTIC PRICING OF AVAILABLE WOOD FUEL SOURCES There will be the opportunity to determine availability of fuel from a wide variety of sources when the project moves to the procurement phase. For the purpose of this study, primary emphasis will be put on obtaining forest-based products due to it being the most readily available source of woody raw material. PRICING OF AVAILABLE BIOMASS FUEL | CURRENT PRICE STRUCTURE – DELIVERED TO PLANT The following discusses the price range at which each potential raw material is available. Please note these prices are averages and vary depending upon mileage and, in the case of roundwood, certain species.
Type Price/Ton
Roundwood (most species) $30-40
Biomass Chips $25-40
Residue from Forest Industry (sawdust, shavings, etc.) $30-50
Wood Waste (urban, right-of-way, site conversions, etc.) $25-35
9 U.S. Department of Agriculture, Forest Service, North Central Research Station. Forest Inventory and Analysis National Program. 2011 Data. Counties
of interest: Michigan: Baraga, Dickinson, Gogebic, Houghton, Iron, Keweenaw, Marquette, and Ontonagon; Wisconsin: Ashland, Iron, Oneida, and Vilas.

P O R C U P I N E P E L L E T P L A N T | B U S I N E S S P L A N P A G E 4 2
RESIDENTIAL FUEL COST COMPARISON PER MILLION BTU10
Fuel Type Fuel Price Per Unit (dollars)
BTUs Per
Unit7 Heating Appliance Type
Efficiency Rating
EstimateC
Approx. Efficiency (%)
Fuel Cost Per Million Btu
Propane $2.85/ Gallon 71,900 Furnace or Boiler 78.0 78% $25.27
WoodB $200.00/Cord 5,740,000 Room Heater (Vented) 80 80%11 $43.55
Fuel Oil (#2) $3.93/ Gallon 115,000 Furnace or Boiler 78.0 78% $36.51
Electricity $0.117 kW hr 3,340 Furnace or Boiler 98.0 98% $35.03
Wood Pellets12
$215.00/Ton 13,600,000 Room Heater (Vented) 68.0 78% $16.71
Corn (kernels)B $200.00/Ton 14,000,000
6 Room Heater (Vented) 68.0 68% $21.01
Natural GasA $1.01/Therm
E 82,000 Furnace or Boiler 78.0 78% $5.25
Coal (Anthracite) $200.00/Ton 25,000,0006 Furnace/Boiler/Stove 75.0 75% $10.67
A. Natural gas is typically sold to residential customers in units of "therms," but may be sold in units of hundreds of cubic feet.
B. The heat content for a cord of wood varies by tree species and is greatly affected by moisture content; using the USDA Fuel
Calculator7, 50% moisture content wood is estimated to have 5,740,000 BTU per cord. The heat content of a unit (ton or bushel) of
corn can also vary widely.
C. The default values are the minimum efficiency standards set by the U.S. Department of Energy (DOE). Estimated “ratings” are
provided for heating equipment for which there are no DOE standards.
D. Air-Source Heat Pump Ratings: The actual heating efficiency and seasonal performance of a "conventional" air-source heat pump may
vary significantly from its rated heating season performance factor (HSPF). Below is a procedure for determining an adjusted HSPF for
your location for an air-source heat pump that uses only electric resistance heating as the auxiliary heat source. There are so-called
"dual-fuel" or "hybrid" heat pump systems that are basically a heat pump integrated with a forced-air combustion appliance that uses
natural gas, fuel oil, or propane. In general, these systems use the heat pump for heating until outside temperatures reach the low
40s/high 30s (˚F), then switch to the combustion appliance for heating.
E. One therm = 100,000 BTU, and is equivalent to about 97.752 cubic feet (or 0.978 ccf), when there are 1,023 BTU/cf. To convert prices
in $/Mcf (1,000 cubic feet) to $/therm, divide the $/Mcf price price by 10.23.
10 Heating Fuel Cost Calculator. US Energy Information Agency. Last updated 11/15/2012. www.eia.gov/neic/experts/heatcalc.xls. 11 USDA Forest Products Laboratory Fuel Value Calculator. http://www.fpl.fs.fed.us/documnts/techline/fuel-value-calculator.pdf 12 Avg. pellet prices for Lake States Area (OH, IL, IN, WI, MI, IA) http://www.hearth.com/talk/forums/wood-pellet-pricing-reports.29/?prefix_id=9
$43.94 $43.55 $43.55 $39.69
$28.19
$21.01 $16.71 $16.67
$12.86 $10.67
$0.00
$10.00
$20.00
$30.00
$40.00
$50.00
Fuel Cost Per Million Btu (dollars)
Propane (average) Wood (50% MC) Fuel Oil (#2) Kerosene
Electricity (average) Corn (kernels) Wood Pellets Wood Chips (bone dry)
Natural Gas (average) Coal (Anthracite)

P O R C U P I N E P E L L E T P L A N T | B U S I N E S S P L A N P A G E 4 3
FEEDSTOCK AVAILABILITY CONSTRAINTS When social, economical, ecological, technological, political, and other logistical constraints are applied to wood, the availability/sustainability of the supply is reduced considerably when compared to physical inventory alone. Emphasis should be placed on the continued/enhanced health and vitality of the forests and their resources. It is highly recommended that state-specific forest-based woody biomass harvesting guidelines be followed as they take management of all resources into consideration. To account for the above constraints, the assumptions of availability made herein are calculated using a percentage or ratio based on the above factors.
FIGURE 2.1: POTENTIAL WOOD SOURCES
Potential Woody
Biomass Sources*
Forest-Sourced Wood
Logging Residue
Harvest Residuals (limbs, tops, etc.)
Roundwood Pulpwood Sized Material
TSI or Forest Fuel Hazard Reduction
Treatments (specific species or areas)
Low Quality (Cull) Trees
Dead/Dying/ Diseased Trees
Salvage Fire, Wind, etc.
Urban-Sourced Woody Biomass
Arborist Operations (trees, limbs, etc.)
Right-of-Way/Land Clearing Operations
Industrial-Sourced Wood Residue
Bark Sawdust Wood
Shavings/Chips
Short Rotation Woody Crops
Willow Short Rotation Pine Hybrid Poplar
*Adapted from Kittler et al., 20102

P O R C U P I N E P E L L E T P L A N T | B U S I N E S S P L A N P A G E 4 4
POTENTIAL WOOD HARVEST VOLUMES AVAILABLE The following reviews the 2011 forest resource availability from all ownerships13 in the counties of interest using the USDA Forest Service Forest Inventory and Analysis National Program.
TABLE 3.1: MICHIGAN (BARAGA, DICKINSON, GOGEBIC, HOUGHTON, IRON, KEWEENAW, MARQUETTE, AND ONTONAGON COUNTY) Cubic Feet Green Tons14
Gross Annual Growth*
Net Annual Removals
Net Annual Mortality*
Net Annual Growth*
Gross Annual Growth*
Net Annual Removals
Net Annual Mortality*
Net Annual Growth*
National Forest* 50,089,031 7,771,612 20,774,231 21,543,188 1,458,288 226,262 604,819 627,207
National Park Service 4,490,958 - 4,490,958 - 130,749 - 130,749 -
Dept. of Defense 205,789 - 173,141 32,648 5,991 - 5,041 951
Other Federal 228,760 - - 228,760 6,660 - - 6,660
State* 40,798,922 12,265,727 14,931,152 13,602,043 1,187,817 357,103 434,704 396,009
County, municipal, etc. 6,771,982 2,174,701 1,878,852 2,718,429 197,159 63,314 54,701 79,144
Other non federal - - - - - - - -
Private 205,668,708 75,784,142 47,422,047 82,462,519 5,987,823 2,206,374 1,380,642 2,400,808
Total* 308,254,150 97,996,182 89,670,381 120,587,587 8,974,487 2,853,053 2,610,656 3,510,779
*Totals have been adjusted to reflect “reserved” acreage.
TABLE 3.2: WISCONSIN (ASHLAND, IRON, ONEIDA, AND VILAS COUNTY) Cubic Feet Green Tons18
Gross Annual Growth*
Net Annual Removals
Net Annual Mortality*
Net Annual Growth*
Gross Annual Growth*
Net Annual Removals
Net Annual Mortality*
Net Annual Growth*
National Forest* 17,270,912 328,066 5,447,579 11,495,267 502,824 9,551 158,600 334,672
National Park Service 748,598 - 748,598 - 21,795 - 21,795 -
Dept. of Defense - - - - - - - -
Other Federal - - - - - - - -
State* 20,458,772 6,732,783 4,860,818 8,865,171 595,635 196,018 141,518 258,100
County, municipal, etc. 19,950,616 3,145,541 4,632,303 12,172,772 580,841 91,579 134,865 354,397
Other non federal 471,368 - 102,581 368,787 13,723 - 2,987 10,737
Private 73,637,435 20,683,816 17,152,937 35,800,682 2,143,875 602,187 499,389 1,042,298
Total* 132,537,701 30,890,206 32,944,816 68,702,679 3,858,693 899,335 959,154 2,000,204
*Totals have been adjusted to reflect “reserved” acreage.
TABLE 3.3: TOTAL PROCUREMENT AREA (12-COUNTY AREA) Cubic Feet Green Tons18
Gross Annual Growth*
Net Annual Removals
Net Annual Mortality*
Net Annual Growth*
Gross Annual Growth*
Net Annual Removals
Net Annual Mortality*
Net Annual Growth*
National Forest* 67,359,943 8,099,678 26,221,810 33,038,455 1,961,112 235,813 763,420 961,879
National Park Service 5,239,556 - 5,239,556 - 152,544 - 152,544 -
Dept. of Defense 205,789 - 173,141 32,648 5,991 - 5,041 951
Other Federal 228,760 - - 228,760 6,660 - - 6,660
State* 61,257,694 18,998,510 19,791,970 22,467,213 1,783,452 553,121 576,222 654,109
County, municipal, etc. 26,722,598 5,320,242 6,511,155 14,891,201 778,000 154,893 189,565 433,541
Other non federal 471,368 - 102,581 368,787 13,723 - 2,987 10,737
Private 279,306,143 96,467,958 64,574,984 118,263,201 8,131,698 2,808,561 1,880,031 3,443,106
Total* 440,791,851 128,886,388 122,615,197 189,290,265 12,833,180 3,752,388 3,569,810 5,510,983
*Totals have been adjusted to reflect “reserved” acreage.
13 U.S. Department of Agriculture, Forest Service, North Central Research Station. Forest Inventory and Analysis National Program. 2011 Data. Counties of interest: Michigan: Baraga, Dickinson, Gogebic, Houghton, Iron, Keweenaw, Marquette, and Ontonagon; Wisconsin: Ashland, Iron, Oneida, and Vilas. 14 Cubic feet was converted to greent tons using 79 cu. ft. of solid wood per standard cord and 2.3 tons of wood per standard cord. These are averages used for the purpose of these conversions and are not meant to be absolute number.

P O R C U P I N E P E L L E T P L A N T | B U S I N E S S P L A N P A G E 4 5
POTENTIAL LOGGING RESIDUE AVAILABLE According to the most recent Michigan Timber Products Output and Use study (2006 data published in 2010) 15:
“The Western Upper Peninsula Forest Inventory Unit had the greatest harvest intensity [in the state of Michigan] in 2006, with an average of 26 cubic feet of total wood removals per acre of forest land.”
According to the Michigan DNR Draft Regional State Forest Management Plan: Western Upper Peninsula (Alger, Baraga, Dickinson, Gogebic, Houghton, Iron, Keweenaw, Marquette, and Ontonagon) – Executive Summary (October 2012), there are proposed [state] timber sales scheduled on approximately 118,256 acres over the next decade (or about 12,000 acres on average per year). Using a ratio of 0.24 green tons of biomass per green ton other products removed, the following table was derived using USFS FIA removal volumes from 2011.
TABLE 4.1: GREEN TONS OF LOGGING RESIDUE GENERATED BY INDUSTRIAL ROUNDWOOD HARVESTING ON ALL OWNERSHIPS
16 (2011) - COUNTIES OF INTEREST Michigan Wisconsin Total
National Forest 54,303 2,292 56,595
National Park Service - - -
Dept. of Defense - - -
Other Federal - - -
State 85,705 47,044 132,749
County, municipal, etc. 15,195 21,979 37,174
Other non federal - - -
Private 529,530 144,525 674,055
Total 684,733 215,840 900,573
OTHER POTENTIAL RESIDUE SOURCES VOLUME OF INDUSTRIAL WOOD RESIDUE
17 (GREEN TONS) – STATEWIDE
In 2006, Michigan’s primary wood-using industries generated 3 million green tons of wood residue (coarse and fine residues) and bark residue. Though there is a significant volume generated, nearly 46% of the mill residues generated were used for industrial fuelwood; pulp and composite product mills consumed 32% of the mill residues; miscellaneous uses (i.e livestock bedding, mulch, and small dimension lumber, etc.) consumed 19%; and residential fuelwood consumed 2%. This means that only 1% (roughly 30,000 green tons) of the mill residues generated in 2006 by Michigan’s primary industry went unused. Seventy-three percent of the industrial roundwood processed by Michigan’s primary wood-using mills were
hardwood species. Hard and soft maples, combined, accounted for 32% of the total volume processed. Other important species processed were aspen, balsam poplar, red pine, jack pine, and red oak.
15 United States Department of Agriculture Forest Service Northern Research Station. Resource Bulletin NRS-42. “2006 Michigan Timber Industry: An
Assessment of Timber Product Output and Use”. Ronald J. Piva and Anthony K. Weatherspoon. Published 2010. 16 Data extrapolated from U.S. Department of Agriculture, Forest Service, North Central Research Station. Forest Inventory and Analysis National Program.
2011. 17 United States Department of Agriculture Forest Service Northern Research Station. Resource Bulletin NRS-42. “2006 Michigan Timber Industry: An
Assessment of Timber Product Output and Use”. Ronald J. Piva and Anthony K. Weatherspoon. Published 2010.

P O R C U P I N E P E L L E T P L A N T | B U S I N E S S P L A N P A G E 4 6
VOLUME REALISTICALLY/ECONOMICALLY AVAILABLE LOGGING RESIDUES The following table shows the volume of recoverable logging residue based on procuring certain percentages of available logging residue. These percentages allow for competition and lack of biomass removal for various reasons. Totals below were developed using a ratio of .24 green tons of biomass per green ton of other products removed annually derived using USFS FIA removal volumes from 2011 (See Table 4.1).
TABLE 6.1: LOGGING RESIDUE AVAILABILITY Green Tons
State (Specified Counties)
Total Logging Res.
25% Recovered
50% Recovered
Michigan 684,733 171,183 342,366
Wisconsin 215,840 53,960 107,920
Total 900,573 225,143 450,286
In addition to the residue aforementioned, other sources of woody material may include primary and secondary forest industry companies, untreated waste (pallets), urban or R.O.W. tree removals/trimmings, and landfill brush dumps. This also does not include wood available from dead trees caused by weather events, insects, or disease as these volumes cannot be planned for or counted on in a specific year. In some years, it could account for a significant percentage of the woody biomass used at a woody biomass using facility. Additionally, wood available from other non-harvest activities (site preparation for planting, plantation release, invasive tree/shrub control, etc.) is not included in this figure. Once a site is chosen and fuel procurement planning begins, these additional sources would need to be contacted for potential material, but many of these sources already have markets for their residue and, though it is assumed a percentage of the material could come from these sources, logging residue would most likely be the primary fuel source. TIMBER STAND IMPROVEMENT/SALVAGE The following table shows the volume of recoverable forest mortality for timber stand improvement/salvage. Totals were developed using a salvage ratio of 20% per green ton of annual forest mortality derived using USFS FIA removal
volumes from 2011 based on procuring certain percentages (See Tables 3.1-3.4).
TABLE 6.2: TIMBER STAND IMPROVEMENT/SALVAGE Green Tons
State (Specified Counties)
Total Mortality
25% Recovered
50% Recovered
Michigan 522,131 130,533 261,066
Wisconsin 191,830 47,957 95,915
Total 713,961 178,490 356,981
BIOMASS HARVESTING (GROWING STOCK) The following table shows the volume of biomass available through dedicated biomass harvesting. Totals were developed using a harvest ratio of both 10% and 20% per green ton of net annual forest growth derived using USFS FIA growing stock volumes from 2011 based on procuring certain percentages (See Tables 3.1-3.4).
TABLE 6.3: BIOMASS HARVESTING – GROWING STOCK Green Tons
State (Specified Counties)
Total Net Ann. Growing Stock
Total Growing Stock
10% 20%
Michigan 702,156 70,216 140,431
Wisconsin 400,041 40,004 80,008
Total 1,102,197 110,220 220,439
VARIABLES Logging residue extraction on all properties can have a number of variables that affect it on-site: Soil Type Topography Soil Conditions (wet, dry, frozen) Long Skid Distance Other Uses for Tops (firewood, trail armoring) Company Not Equipped for Biomass Harvesting Landowner Goals for the Property Off-site variables that can affect biomass extraction: Price Paid by Receiving Plant Distance to Plant Availability/Ease of Use of Incentive Programs Other Markets for Product Biomass Harvesting Guidelines Buyer Specifications (i.e. species, form, moisture
content, etc.) Competition Among Buyers and Buyer Needs

P O R C U P I N E P E L L E T P L A N T | B U S I N E S S P L A N P A G E 4 7
APPENDIX II: RAW MATERIAL OPTIONS
There are typically two different options when developing a wood pellet plant: build a plant based on using green wood biomass from trees/vegetation or build one based on using dry residue materials from wood processing operations.
Regardless of raw material used, in order to be a successful wood pellet business, the plant must be able to produce a consistent product with predictable moisture and ash content.
Forest-Based Raw Material If pellets are made from roundwood or other woody biomass sources, extra steps are involved. In addition to the hammer mill used to form the pellets, using roundwood often requires the following additional processes: debarking, chipping, and drying. To dry roundwood or other woody biomass sources, large drying devices using enormous heat flow sources are typically required. A good rule of thumb is that it takes about 2.2 tons of green biomass to make 1 ton of finished wood pellet product (including heating fuel to dry raw material) due to the high moisture content of green biomass. Whole tree chips would be a feasible option as a wood resource for pellets; however, their use would be contingent on the following factors: 1. Size – the diameter of the tree is a factor due to other potential uses and bark content. 2. Species – bark thickness varies by species and can greatly affect the percentage of bark. 3. Thinning – trees taken from a thinning usually have less branch and crown development and consequently
have less bark than those trees removed in other types of timber harvesting. 4. Cost – utilizing the whole tree will have higher raw product cost. Tops could certainly be utilized for commercial pellets due to ash production being a more addressable issue in that setting. Top use in the residential market, due to stricter industry standards, would be contingent upon the following factors: 1. Species – bark percentages vary between different tree species. 2. Needle/leaf content – reduces BTUs and increases ash content. 3. Large-end diameter top – 5” diameter top will have a lower percentage of bark and more fiber than a 2”
diameter top. Secondary Industry-Based Raw Material Use of dry residue materials such as sawdust, shavings, and chips from the secondary wood industry may need to be further processed by a hammermill or similar equipment, but further drying is typically not necessary. Forming the Wood Pellets Once the product is dried to specifications and reduced to the desired size, steam conditioning is applied. Binding agents may also be added. These steps are taken to ensure that the pellets are durable and breakage during transport is reduced. During steam conditioning, the lignin in the wood is softened. This lignin (a chemical compound from the secondary cell walls of the wood) binds the cellulose together and allows the product to hold its pellet form. Additives may be used to improve the pelletizing process. Finished Product When these processes are finished, the product is forced through dies and cut to length. Once cut, these hot pellets are placed in a counter flow to allow the lignin to reset, harden, and form the pellet unit. When cooled, the pellets can be bagged to manufacturer/buyer specifications and shipped.
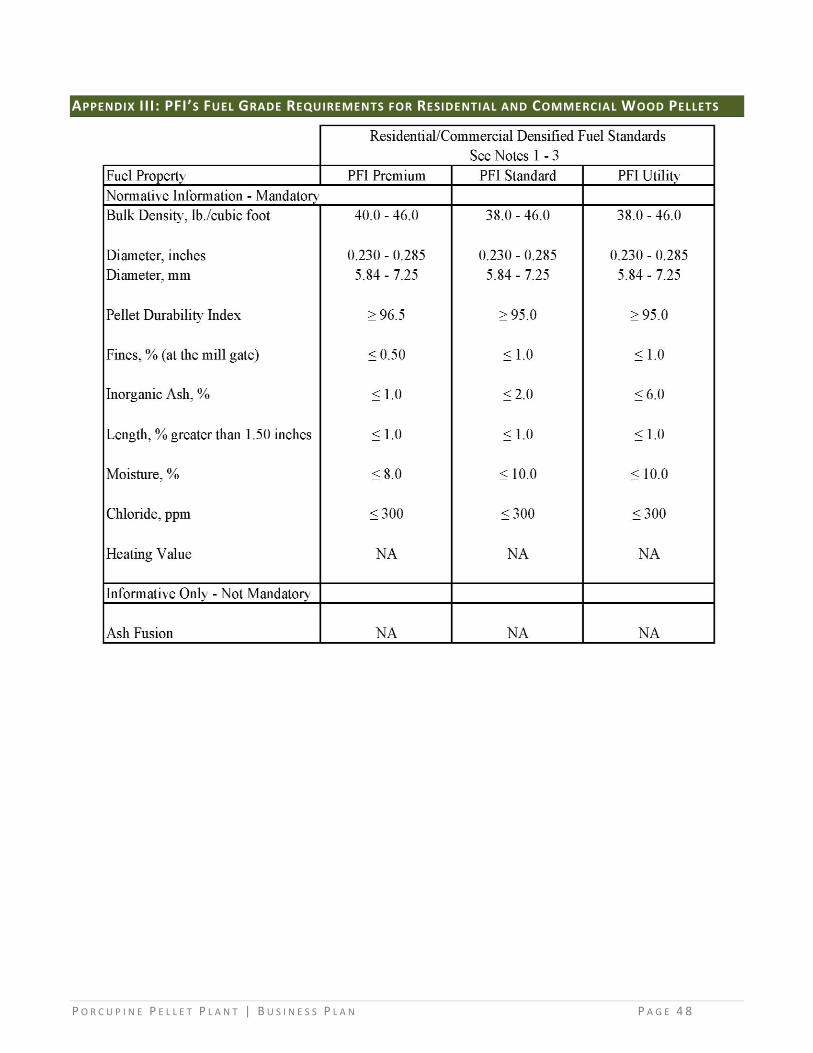
P O R C U P I N E P E L L E T P L A N T | B U S I N E S S P L A N P A G E 4 8
APPENDIX III: PFI’S FUEL GRADE REQUIREMENTS FOR RESIDENTIAL AND COMMERCIAL WOOD PELLETS
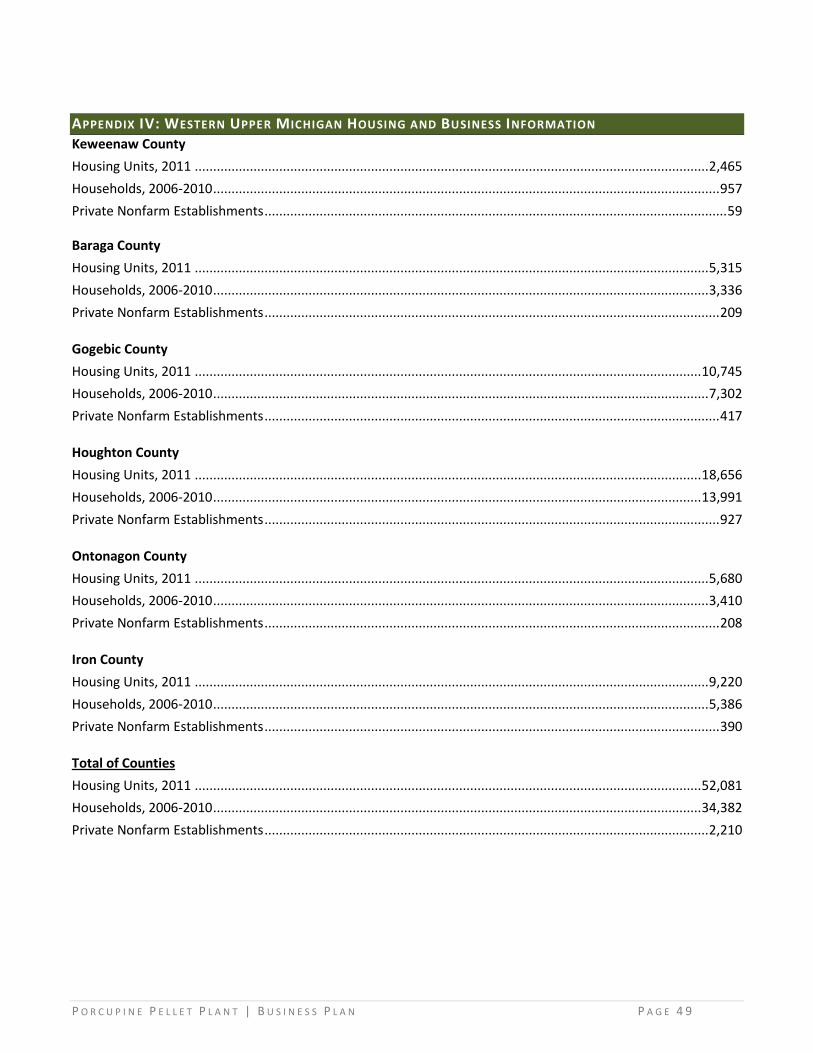
P O R C U P I N E P E L L E T P L A N T | B U S I N E S S P L A N P A G E 4 9
APPENDIX IV: WESTERN UPPER MICHIGAN HOUSING AND BUSINESS INFORMATION Keweenaw County
Housing Units, 2011 ............................................................................................................................................ 2,465
Households, 2006-2010 .......................................................................................................................................... 957
Private Nonfarm Establishments .............................................................................................................................. 59
Baraga County
Housing Units, 2011 ............................................................................................................................................ 5,315
Households, 2006-2010 ....................................................................................................................................... 3,336
Private Nonfarm Establishments ............................................................................................................................ 209
Gogebic County
Housing Units, 2011 .......................................................................................................................................... 10,745
Households, 2006-2010 ....................................................................................................................................... 7,302
Private Nonfarm Establishments ............................................................................................................................ 417
Houghton County
Housing Units, 2011 .......................................................................................................................................... 18,656
Households, 2006-2010 ..................................................................................................................................... 13,991
Private Nonfarm Establishments ............................................................................................................................ 927
Ontonagon County
Housing Units, 2011 ............................................................................................................................................ 5,680
Households, 2006-2010 ....................................................................................................................................... 3,410
Private Nonfarm Establishments ............................................................................................................................ 208
Iron County
Housing Units, 2011 ............................................................................................................................................ 9,220
Households, 2006-2010 ....................................................................................................................................... 5,386
Private Nonfarm Establishments ............................................................................................................................ 390
Total of Counties
Housing Units, 2011 .......................................................................................................................................... 52,081
Households, 2006-2010 ..................................................................................................................................... 34,382
Private Nonfarm Establishments ......................................................................................................................... 2,210

P O R C U P I N E P E L L E T P L A N T | B U S I N E S S P L A N P A G E 5 0
APPENDIX V: POSSIBLE SOURCES OF WOOD RESIDUE
Company Type/Products Address County Annual
Production
Horner Flooring Company Hardwood flooring/sports flooring
P.O. Box 380 23400 Hellmen Ave. Dollar Bay, MI 49922
Houghton 501-1000
MBF
Northern Hardwoods Sawmill and/or planing mill P.O. Box 189 45807 M-26 South Range, MI 49963
Houghton 5001 + MBF
22 mmbf
Connor Sports Flooring Corp. Sports flooring P.O. Box 246 251 Industrial Park Rd. Amasa, MI 49903
Iron 5001+MBF
Magiglide, Inc. Doors, wood, and covered wood
257 Industrial Park Rd. Crystal Falls, MI 49920
Iron 501-1000
MBF
Pine River Hardwoods, LLC. Sawmill, lumber, kiln drying, sawdust, and chips
225 Corral Road Amasa, MI 49903
Iron 5001+ MBF
Sculptured Log Homes, Inc. Log cabins, prefabricated: wood furniture
160 Groulx Lane Gaastra, MI 49927
Iron
Keweenaw Specialty Woods, Inc.
Flooring, hardwood, Moldings, wood and covered wood
P.O. Box 425 46 Mohawk St. Mohawk, MI 49950
Keweenaw 101-500 MBF
Tomahawks Log & Country Homes, Inc.
Log Cabins, prefabricated; wood, buildings, commercial
HC-1, Box 155 Mohawk, MI 49930
Keweenaw 1001-3000
MBF
Bessemer Plywood Corporation
Mill P.O. Box 76 1000 Yale Ave. Bessemer, MI 49911
Gogebic 60MM SQFT
Bratu’s Hardwood Interiors Sawmill and planing mill E1382 Lake Rd Ironwood, MI 49938
Gogebic 101-500 MBF
Lagrew Lumber & Hardware Sawmill and planing mill N14511 Black River Rd.
Ironwood, MI 49938 Gogebic 101-500 MBF
Ottawa Forest Products, Inc. Sawmill and planing mill P.O. Box 99
1243 Wall St. Ironwood, MI 49938
Gogebic 5001 + MBF
20,000 Cords 11 MMBF
Baraga Lumber, Besse Forest Products Group
Sawmill and planing mill 802 Michigan Ave. Baraga, MI 49908
Baraga 5001 + MBF
Collin Bros. Sawmill, Inc.
Sawmill and planing mill P.O. Box 265 L’Anse Industrial Park, Lot #8 L’Anse, MI 49946
Baraga
Erickson Lumber, Inc. Sawmill P.O. Box 66 L’Anse, MI 49946
Baraga 5001 + MBF
Milkevich Corp. Logging (provides biomass) 511 Putnam St. Wakefield, MI 49968
Gogebic 130,000 Ton
Chips
P O R C U P I N E P E L L E T P L A N T | B U S I N E S S P L A N P A G E 5 1
APPENDIX VI: FINAL ADJUSTMENTS TO THE A IR TOXICS STANDARDS FOR INDUSTRIAL, COMMERCIAL, AND
INSTITUTIONAL BOILERS AT AREA SOURCES FACILITIES ACTION On December 20, 2012, the U.S. Environmental Protection Agency (EPA) finalized a specific set of adjustments to Clean Air Act standards, originally finalized in March 2011, for boilers and certain solid waste incinerators. These adjustments maintain extensive public health protections achieved by the March 2011 standards by reducing toxic air pollution, including mercury and particle pollution. At the same time, these adjustments increase the rules’
flexibility and address concerns raised by stakeholders. The specific set of adjustments address new data
provided to the agency and additional information about real-world performance and conditions under which affected boilers and incinerators operate.
These adjustments maintain the dramatic cuts in the cost of implementation that were achieved in the final standards issued in March 2011.
This fact sheet summarizes the final adjustments to the “National Emission Standards for Hazardous Air Pollutants for Area Sources: Industrial, Commercial, and Institutional Boilers.” Boilers burn coal and other substances such as oil or biomass (e.g., wood) to produce steam and/or hot water, which is then used for energy or heat. They can also burn non-waste materials but do so usually only in small amounts. Industrial boilers are used in manufacturing,
processing, mining, refining or any other industry. Commercial and institutional boilers are used in
commercial establishments, medical centers, educational facilities and municipal buildings.
The majority of area source boilers covered by this rule are located at commercial and institutional facilities.
The final adjustments do not change the intended coverage of the air toxics standards for industrial, commercial, and institutional boilers and will not affect the estimated emission reductions, control costs or the benefits of the standards in substance. The adjustments do not impose any additional regulatory requirements beyond those imposed by the previously promulgated boiler area source standards and, in fact, will afford relief to some boilers. There are approximately 1.3 million boilers located at areas source facilities that run on natural gas. They are not covered by the final standards or these adjustments. The area source standards covers approximately 183,000 boilers located at 92,000 area source facilities. Of the 183,000 covered units, approximately 182,400 (over 99%) need only to conduct periodic tune-ups, and some of these also need to perform a one-time energy assessment.
Approximately 600 coal-burning units (less than 1%), that represent the largest of these sources, are required to meet emission limits. These adjustments will make it easier for owners and operators, as well as state and local agencies, to understand and implement the applicable requirements of the air toxics standards. ADJUSTMENTS TO FINAL STANDARDS EPA is issuing adjustments to the March 2011 standards based on evaluation of additional information provided to the agency since that time, including the following key changes: Extending by two years the initial compliance date for
existing area source boilers subject to the tune-up requirement.
Revising the deadline for initial notification for existing area source boilers to no later than January 20, 2014.
Revising provisions for existing dual-fuel fired units that fuel switch from gas to coal, biomass or oil such that they would still be considered existing sources.
Providing subcategories for seasonally-operated boilers and limited-use boilers.
Requiring tune-ups every five years, instead of every two, for certain area source boilers: seasonally-operated units, limited-use units, small oil-fired units and units with oxygen trim systems.
Clarifying that temporary boilers and residential boilers are not part of the source categories being regulated.
Revising particulate matter (PM) emission limit requirements such that combustion of oil meeting certain sulfur content requirements by new oil-fired boilers is considered an alternative method of meeting the PM emission standard and that such units are not required to meet the PM emission limit.
Reducing the fuel sampling and performance testing requirements such that after demonstration of initial compliance, under certain circumstances, further fuel sampling for boilers subject to a mercury emission limit and further PM performance testing for boilers subject to a PM emission limit is not required.
Providing the option of continuous emissions monitoring to demonstrate continuous compliance with the carbon monoxide (CO) emission limit.
More clearly defining the scope of the energy assessment and allowing for more streamlined assessments, including allowing sources already operating under certain energy management programs to satisfy the assessment requirement.
P O R C U P I N E P E L L E T P L A N T | B U S I N E S S P L A N P A G E 5 2
BENEFITS AND COSTS The benefits and costs for these adjustments are, in substance, the same as those for the March 2011 final standards. EPA estimates that the final standards will reduce nationwide emissions from existing and new area source
boilers by approximately: o 330 tons per year (tpy) of total air toxics,
90 pounds per year of mercury,
320 tpy of non-mercury metals,
9 tpy of polycyclic organic matter, and
2,500 tpy of PM. These emission reductions will lead to significant annual health benefits. In 2014, these standards will protect public health by avoiding:
24 to 61 premature deaths,
17 cases of chronic bronchitis,
40 nonfatal heart attacks,
40 hospital and emergency room visits,
38 cases of acute bronchitis,
800 cases of respiratory symptoms,
3,200 days when people miss work or school,
420 cases of aggravated asthma, and
19,000 days when people must restrict their activities. EPA estimates that the value of the benefits associated with reduced exposure to fine particles are $210 million to $520 million in the year 2015. EPA is not able to estimate the benefits associated with reducing exposure to air toxics or other air pollutants, ecosystem effects, or visibility impairment because of data limitations. However, the standards will cut emissions of pollutants that are of particular concern for children. Mercury and lead can adversely affect developing brains – including effects on IQ, learning and memory. The vast majority of area source boilers are estimated to be located at commercial and institutional facilities and generally owned or operated by small entities. EPA has limited the impact of the rulemaking on small entities by requiring that only existing coal-fired boilers meet emission limits for mercury and CO, establishing work practices or management practices, instead of emission limits, for existing small coal-fired boilers of less than 10 million British thermal units per hour of heat input and all existing biomass boilers and oil-fired boilers, and exempting most area source boilers from Clean Air Act (CAA) Title V permit requirements. EPA estimates that approximately 6,800 new area source boilers will be installed over the next 3 years.
EPA estimates that the cost for the final standards will be approximately $490 million per year. This includes costs we expect industry to incur to comply as well as the standards’ broader impact on the economy. We do not expect that these adjustments will result in any meaningful increase in the estimated costs to comply with the standards but will result in a decrease in burden on small facilities. SEPARATE BUT RELATED ACTIONS EPA has finalized adjustments to the rule to reduce emissions of toxic air pollutants from new and existing industrial, commercial and institutional boilers and process heaters located at major source facilities. A major source facility has the potential to emit more than 10 tpy of any single air toxic or more than 25 tpy of any combination of air toxics. EPA has also finalized adjustments to a rule to reduce air toxics from Commercial and Industrial Solid Waste Incinerators (CISWI). This final rule reflects the agency’s final definition of non-hazardous solid waste. EPA revised the non-hazardous secondary materials (NHSM) rule. This rule provides the standards and procedures for identifying whether non-hazardous secondary materials are solid waste under the Resource Conservation and Recovery Act when used as fuels or ingredients in combustion units such as boilers or solid waste incinerators. Information on these actions is available at http://www.epa.gov/airquality/combustion/actions.html. BACKGROUND On March 21, 2011, EPA promulgated national air toxics standards for area source industrial, commercial and institutional boilers. On the same day, EPA also promulgated national air toxics standards for major source industrial, commercial, and institutional boilers and for CISWI. On March 21, 2011, EPA also published a notice initiating the reconsideration of certain aspects of the final rule for area source industrial, commercial and institutional boilers, as well as the final rules for major source industrial, commercial, and institutional boilers and for CISWI. The final rules reflect reasonable approaches consistent with the requirements of the CAA. However, some of the issues identified in comments on the 2010 proposed rules raised difficult technical issues that the agency believed would benefit from additional public involvement. In addition, the agency wanted to ensure the public had ample opportunity

P O R C U P I N E P E L L E T P L A N T | B U S I N E S S P L A N P A G E 5 3
to comment on changes in the final rule that were not in the proposal. In the March 21, 2011 notice initiating reconsideration, EPA identified four issues for the area source boilers rule for which reconsideration and additional opportunity for public review and comment should be given. These included:
Establishment of standards for biomass and oil-fired area source boilers based on generally available control technology (GACT);
Providing an affirmative defense for malfunction events for area source boilers;
Setting PM standards under GACT for oil-fired area source boilers; and
Certain findings regarding the applicability of title V permitting requirements for area source boilers.
Following promulgation, EPA received petitions for reconsideration of certain provisions in the final rule and, on December 23, 2011, EPA published a notice proposing reconsideration of, and requesting comment on, certain specific issues:
Establishing separate requirements for seasonally operated boilers;
Clarifying that temporary boilers are excluded from the source category;
Clarifying the initial compliance schedule for existing boilers subject to tune-ups;
Defining periods of gas curtailment;
Providing an optional CO compliance mechanism using a continuous emission monitoring system (CEMS);
Averaging times for parameter monitoring;
Providing an affirmative defense for malfunction events;
Adjusting frequency of tune-up work practices for very small units;
Selecting a 99 percent confidence interval for setting the CO emission limit;
Establishing GACT-based limits for biomass and oil-fired boilers;
Scope and duration of the energy assessment and deadline for completing the assessment;
Establishing GACT-based limits for PM at new oil-fired boilers; and
Exempting area sources from title V permitting requirements.
FOR MORE INFORMATION To download this notice from EPA’s Web site, go to: http://www.epa.gov/airquality/combustion/actions.html. Today’s action and other background information are also available either electronically at http://www.regulations.gov, EPA’s electronic public docket and comment system, or in hardcopy at the EPA Docket Center’s Public Reading Room.
The Public Reading Room is located in the EPA Headquarter Library, Room Number 3334, in the EPA West Building, 1301 Constitution Avenue, NW, Washington, DC. Hours of operation are 8:30 a.m. to 4:30 p.m. eastern standard time, Monday through Friday, excluding Federal holidays.
Visitors are required to show photographic identification, pass through a metal detector and sign the EPA visitor log. All visitor materials will be processed through an X-ray machine as well. Visitors will be provided a badge that must be visible at all times.
Materials for this action can be accessed using Docket ID No. EPA-HQ-OAR-2008-0790.
For further information about the rule, contact Ms. Mary Johnson of the EPA’s Office of Air Quality Planning and Standards, Sector Policies and Programs Division, Energy Strategies Group, at (919) 541-5025 or by e-mail at [email protected].
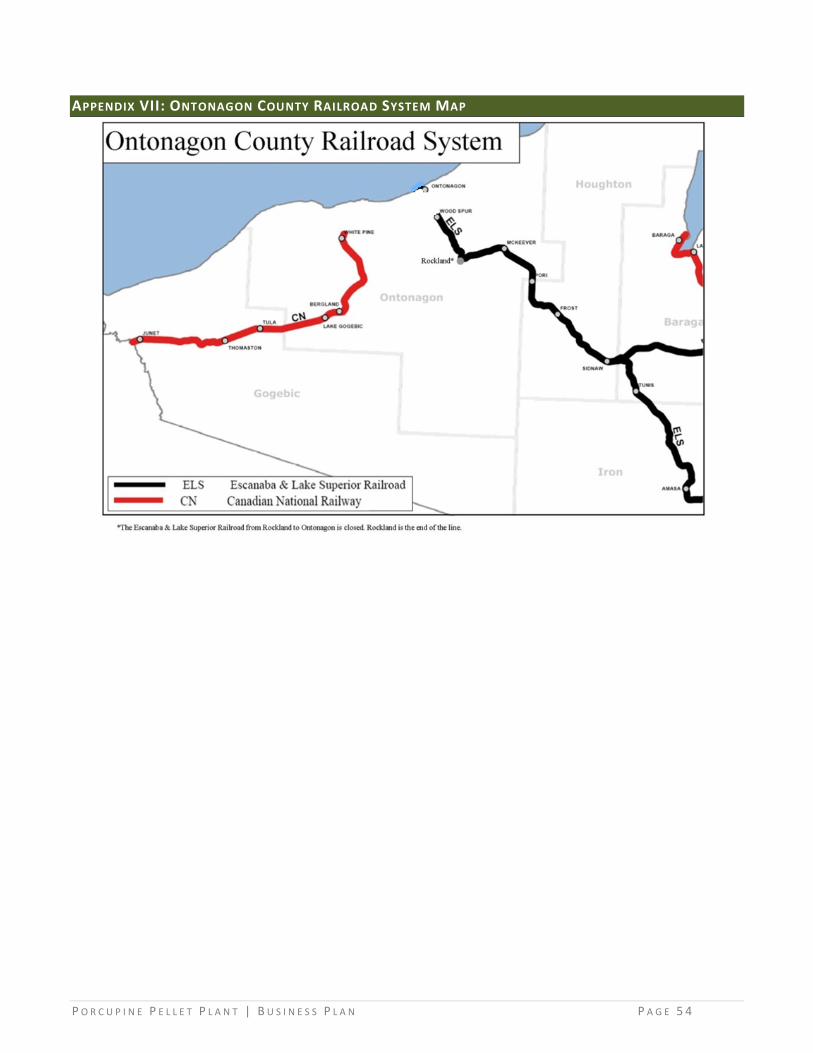
P O R C U P I N E P E L L E T P L A N T | B U S I N E S S P L A N P A G E 5 4
APPENDIX VII: ONTONAGON COUNTY RAILROAD SYSTEM MAP

P O R C U P I N E P E L L E T P L A N T | B U S I N E S S P L A N P A G E 5 5
APPENDIX VIII: ONTONAGON HARBOR INFORMATION
“Ontonagon harbor consists of two parallel piers, 250 feet apart, extending in a NW 3/4 N direction from the mouth of the Ontonagon River. The west pier extends into the lake 1,700 feet from the shoreline and projects 150 feet beyond the east pier; the outer 150 feet is without superstructure, and vessels entering at night should be aware of the submerged cribs. The east pier projects 1,950 feet into the lake beyond the shoreline (the shorelines are not opposite each other.) The bar outside the piers continues to advance, and the channel across it is uncertain and shifting. A channel 100 feet wide has been dredged at Ontonagon, having an available depth of 16 feet from the inner end of the government piers to the merchandise dock. This places the dock in good condition permitting all vessels, except a few of the larger ones, to enter.”18
18
http://www.ontonagonmi.org/boating.html
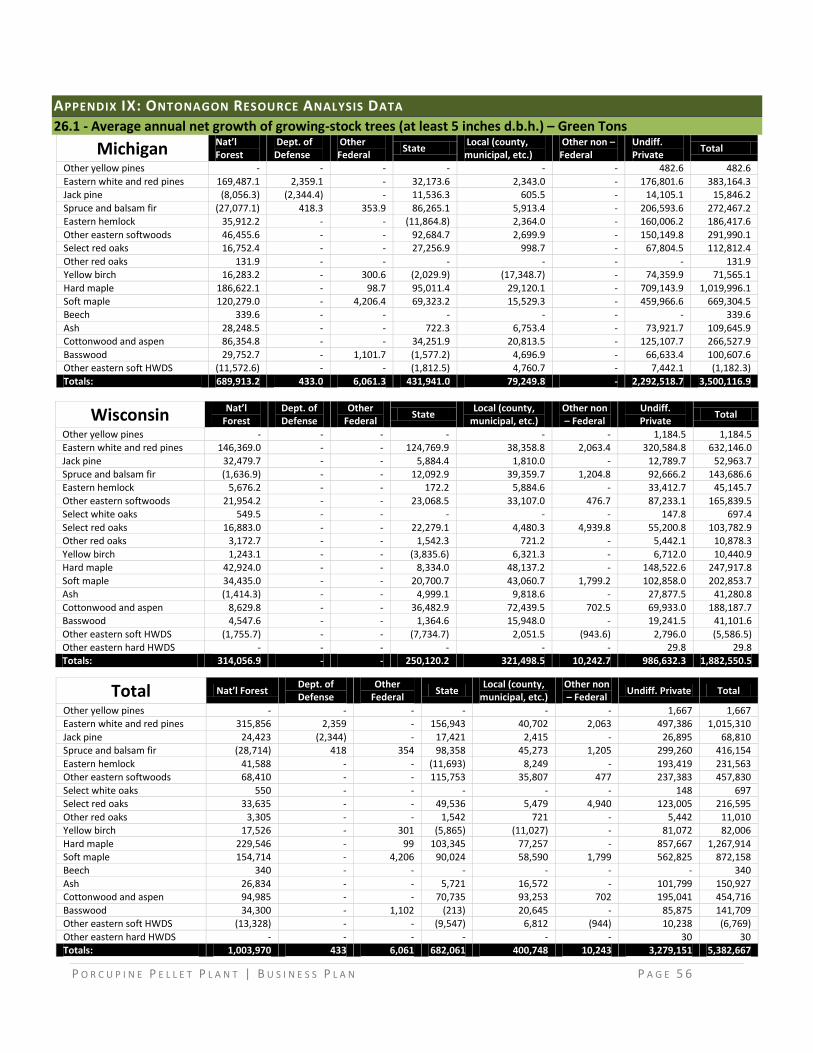
P O R C U P I N E P E L L E T P L A N T | B U S I N E S S P L A N P A G E 5 6
APPENDIX IX: ONTONAGON RESOURCE ANALYSIS DATA
26.1 - Average annual net growth of growing-stock trees (at least 5 inches d.b.h.) – Green Tons
Michigan Nat’l Forest
Dept. of Defense
Other Federal
State Local (county, municipal, etc.)
Other non – Federal
Undiff. Private
Total
Other yellow pines - - - - - - 482.6 482.6
Eastern white and red pines 169,487.1 2,359.1 - 32,173.6 2,343.0 - 176,801.6 383,164.3 Jack pine (8,056.3) (2,344.4) - 11,536.3 605.5 - 14,105.1 15,846.2
Spruce and balsam fir (27,077.1) 418.3 353.9 86,265.1 5,913.4 - 206,593.6 272,467.2 Eastern hemlock 35,912.2 - - (11,864.8) 2,364.0 - 160,006.2 186,417.6
Other eastern softwoods 46,455.6 - - 92,684.7 2,699.9 - 150,149.8 291,990.1 Select red oaks 16,752.4 - - 27,256.9 998.7 - 67,804.5 112,812.4
Other red oaks 131.9 - - - - - - 131.9 Yellow birch 16,283.2 - 300.6 (2,029.9) (17,348.7) - 74,359.9 71,565.1
Hard maple 186,622.1 - 98.7 95,011.4 29,120.1 - 709,143.9 1,019,996.1 Soft maple 120,279.0 - 4,206.4 69,323.2 15,529.3 - 459,966.6 669,304.5 Beech 339.6 - - - - - - 339.6
Ash 28,248.5 - - 722.3 6,753.4 - 73,921.7 109,645.9 Cottonwood and aspen 86,354.8 - - 34,251.9 20,813.5 - 125,107.7 266,527.9
Basswood 29,752.7 - 1,101.7 (1,577.2) 4,696.9 - 66,633.4 100,607.6 Other eastern soft HWDS (11,572.6) - - (1,812.5) 4,760.7 - 7,442.1 (1,182.3)
Totals: 689,913.2 433.0 6,061.3 431,941.0 79,249.8 - 2,292,518.7 3,500,116.9
Wisconsin Nat’l Forest
Dept. of Defense
Other Federal
State Local (county,
municipal, etc.) Other non – Federal
Undiff. Private
Total
Other yellow pines - - - - - - 1,184.5 1,184.5 Eastern white and red pines 146,369.0 - - 124,769.9 38,358.8 2,063.4 320,584.8 632,146.0
Jack pine 32,479.7 - - 5,884.4 1,810.0 - 12,789.7 52,963.7 Spruce and balsam fir (1,636.9) - - 12,092.9 39,359.7 1,204.8 92,666.2 143,686.6 Eastern hemlock 5,676.2 - - 172.2 5,884.6 - 33,412.7 45,145.7
Other eastern softwoods 21,954.2 - - 23,068.5 33,107.0 476.7 87,233.1 165,839.5 Select white oaks 549.5 - - - - - 147.8 697.4
Select red oaks 16,883.0 - - 22,279.1 4,480.3 4,939.8 55,200.8 103,782.9 Other red oaks 3,172.7 - - 1,542.3 721.2 - 5,442.1 10,878.3
Yellow birch 1,243.1 - - (3,835.6) 6,321.3 - 6,712.0 10,440.9 Hard maple 42,924.0 - - 8,334.0 48,137.2 - 148,522.6 247,917.8
Soft maple 34,435.0 - - 20,700.7 43,060.7 1,799.2 102,858.0 202,853.7 Ash (1,414.3) - - 4,999.1 9,818.6 - 27,877.5 41,280.8
Cottonwood and aspen 8,629.8 - - 36,482.9 72,439.5 702.5 69,933.0 188,187.7 Basswood 4,547.6 - - 1,364.6 15,948.0 - 19,241.5 41,101.6
Other eastern soft HWDS (1,755.7) - - (7,734.7) 2,051.5 (943.6) 2,796.0 (5,586.5) Other eastern hard HWDS - - - - - - 29.8 29.8 Totals: 314,056.9 - - 250,120.2 321,498.5 10,242.7 986,632.3 1,882,550.5
Total Nat’l Forest Dept. of Defense
Other Federal
State Local (county,
municipal, etc.) Other non – Federal
Undiff. Private Total
Other yellow pines - - - - - - 1,667 1,667 Eastern white and red pines 315,856 2,359 - 156,943 40,702 2,063 497,386 1,015,310
Jack pine 24,423 (2,344) - 17,421 2,415 - 26,895 68,810 Spruce and balsam fir (28,714) 418 354 98,358 45,273 1,205 299,260 416,154
Eastern hemlock 41,588 - - (11,693) 8,249 - 193,419 231,563 Other eastern softwoods 68,410 - - 115,753 35,807 477 237,383 457,830
Select white oaks 550 - - - - - 148 697 Select red oaks 33,635 - - 49,536 5,479 4,940 123,005 216,595
Other red oaks 3,305 - - 1,542 721 - 5,442 11,010 Yellow birch 17,526 - 301 (5,865) (11,027) - 81,072 82,006
Hard maple 229,546 - 99 103,345 77,257 - 857,667 1,267,914 Soft maple 154,714 - 4,206 90,024 58,590 1,799 562,825 872,158 Beech 340 - - - - - - 340
Ash 26,834 - - 5,721 16,572 - 101,799 150,927 Cottonwood and aspen 94,985 - - 70,735 93,253 702 195,041 454,716
Basswood 34,300 - 1,102 (213) 20,645 - 85,875 141,709 Other eastern soft HWDS (13,328) - - (9,547) 6,812 (944) 10,238 (6,769)
Other eastern hard HWDS - - - - - - 30 30 Totals: 1,003,970 433 6,061 682,061 400,748 10,243 3,279,151 5,382,667
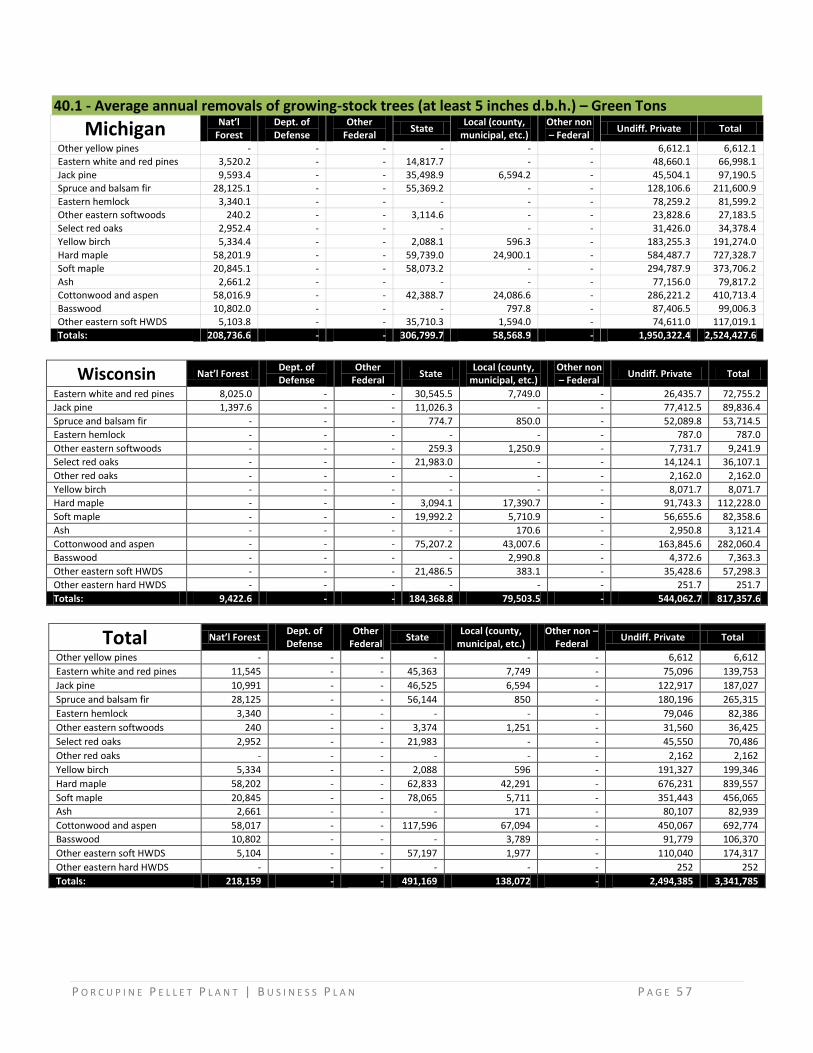
P O R C U P I N E P E L L E T P L A N T | B U S I N E S S P L A N P A G E 5 7
40.1 - Average annual removals of growing-stock trees (at least 5 inches d.b.h.) – Green Tons
Michigan Nat’l
Forest Dept. of Defense
Other Federal
State Local (county,
municipal, etc.) Other non – Federal
Undiff. Private Total
Other yellow pines - - - - - - 6,612.1 6,612.1 Eastern white and red pines 3,520.2 - - 14,817.7 - - 48,660.1 66,998.1
Jack pine 9,593.4 - - 35,498.9 6,594.2 - 45,504.1 97,190.5 Spruce and balsam fir 28,125.1 - - 55,369.2 - - 128,106.6 211,600.9
Eastern hemlock 3,340.1 - - - - - 78,259.2 81,599.2 Other eastern softwoods 240.2 - - 3,114.6 - - 23,828.6 27,183.5
Select red oaks 2,952.4 - - - - - 31,426.0 34,378.4
Yellow birch 5,334.4 - - 2,088.1 596.3 - 183,255.3 191,274.0
Hard maple 58,201.9 - - 59,739.0 24,900.1 - 584,487.7 727,328.7
Soft maple 20,845.1 - - 58,073.2 - - 294,787.9 373,706.2
Ash 2,661.2 - - - - - 77,156.0 79,817.2 Cottonwood and aspen 58,016.9 - - 42,388.7 24,086.6 - 286,221.2 410,713.4
Basswood 10,802.0 - - - 797.8 - 87,406.5 99,006.3 Other eastern soft HWDS 5,103.8 - - 35,710.3 1,594.0 - 74,611.0 117,019.1
Totals: 208,736.6 - - 306,799.7 58,568.9 - 1,950,322.4 2,524,427.6
Wisconsin Nat’l Forest Dept. of Defense
Other Federal
State Local (county,
municipal, etc.) Other non – Federal
Undiff. Private Total
Eastern white and red pines 8,025.0 - - 30,545.5 7,749.0 - 26,435.7 72,755.2
Jack pine 1,397.6 - - 11,026.3 - - 77,412.5 89,836.4
Spruce and balsam fir - - - 774.7 850.0 - 52,089.8 53,714.5
Eastern hemlock - - - - - - 787.0 787.0
Other eastern softwoods - - - 259.3 1,250.9 - 7,731.7 9,241.9
Select red oaks - - - 21,983.0 - - 14,124.1 36,107.1
Other red oaks - - - - - - 2,162.0 2,162.0
Yellow birch - - - - - - 8,071.7 8,071.7
Hard maple - - - 3,094.1 17,390.7 - 91,743.3 112,228.0
Soft maple - - - 19,992.2 5,710.9 - 56,655.6 82,358.6
Ash - - - - 170.6 - 2,950.8 3,121.4
Cottonwood and aspen - - - 75,207.2 43,007.6 - 163,845.6 282,060.4
Basswood - - - - 2,990.8 - 4,372.6 7,363.3
Other eastern soft HWDS - - - 21,486.5 383.1 - 35,428.6 57,298.3
Other eastern hard HWDS - - - - - - 251.7 251.7
Totals: 9,422.6 - - 184,368.8 79,503.5 - 544,062.7 817,357.6
Total Nat’l Forest Dept. of Defense
Other Federal
State Local (county,
municipal, etc.) Other non –
Federal Undiff. Private Total
Other yellow pines - - - - - - 6,612 6,612
Eastern white and red pines 11,545 - - 45,363 7,749 - 75,096 139,753
Jack pine 10,991 - - 46,525 6,594 - 122,917 187,027
Spruce and balsam fir 28,125 - - 56,144 850 - 180,196 265,315
Eastern hemlock 3,340 - - - - - 79,046 82,386
Other eastern softwoods 240 - - 3,374 1,251 - 31,560 36,425
Select red oaks 2,952 - - 21,983 - - 45,550 70,486
Other red oaks - - - - - - 2,162 2,162
Yellow birch 5,334 - - 2,088 596 - 191,327 199,346
Hard maple 58,202 - - 62,833 42,291 - 676,231 839,557
Soft maple 20,845 - - 78,065 5,711 - 351,443 456,065
Ash 2,661 - - - 171 - 80,107 82,939
Cottonwood and aspen 58,017 - - 117,596 67,094 - 450,067 692,774
Basswood 10,802 - - - 3,789 - 91,779 106,370
Other eastern soft HWDS 5,104 - - 57,197 1,977 - 110,040 174,317
Other eastern hard HWDS - - - - - - 252 252
Totals: 218,159 - - 491,169 138,072 - 2,494,385 3,341,785

P O R C U P I N E P E L L E T P L A N T | B U S I N E S S P L A N P A G E 5 8
33.1 - Average annual mortality of growing-stock trees (at least 5 inches d.b.h.) – Green Tons
Michigan Nat’l Forest Dept. of Defense
Other Federal
State
Local (county,
municipal, etc.)
Other non – Federal
Undiff. Private Total
Other yellow pines - - - - - - 553.9 553.9
Eastern white and red pines 19,085.3 - - 5,686.9 - - 11,872.2 36,644.4
Jack pine 20,886.6 4,922.6 - 6,576.4 207.7 - 10,345.7 42,938.9
Spruce and balsam fir 199,261.8 - - 76,709.5 6,526.0 - 333,460.8 615,958.1
Eastern hemlock 8,989.7 - - 30,085.8 - - 47,766.6 86,842.1
Other eastern softwoods 6,013.0 - - 6,334.9 - - 62,553.4 74,901.4
Select red oaks - - - - - - 4,767.6 4,767.6
Yellow birch 8,201.0 - - 14,001.5 23,886.4 - 67,045.8 113,134.7
Hard maple 48,976.0 - - 15,909.1 3,881.4 - 151,640.1 220,406.6
Soft maple 20,267.7 - - 8,647.5 878.2 - 74,122.4 103,915.8
Ash 8,353.9 - - 21,832.9 1,231.1 - 30,360.1 61,778.0
Cottonwood and aspen 109,630.0 - - 132,785.1 3,620.4 - 276,598.8 522,634.4
Basswood 7,282.0 - - 15,737.5 - - 20,085.3 43,104.7
Other eastern soft HWDS 36,910.7 - - 21,800.8 - - 113,914.4 172,625.9
Totals: 493,857.6 4,922.6 - 356,107.8 40,231.2 - 1,205,087.2 2,100,206.5
Wisconsin Nat’l Forest Dept. of Defense
Other Federal
State Local (county,
municipal, etc.) Other non – Federal
Undiff. Private
Total
Eastern white and red pines 15,358.4 - - 1,872.8 7,068.1 - 7,956.5 32,255.8
Jack pine 14,290.8 - - - 998.0 - 2,899.5 18,188.3
Spruce and balsam fir 41,155.1 - - 32,953.8 26,086.8 1,013.9 76,578.8 177,788.4
Eastern hemlock - - - 12,031.9 1,478.1 - 9,685.8 23,195.8
Other eastern softwoods 741.6 - - 1,742.8 4,814.1 - 5,544.6 12,843.1
Select red oaks 541.1 - - 2,573.3 1,838.6 - 2,282.0 7,235.1
Other red oaks - - - - - - 3,345.5 3,345.5
Yellow birch 5,601.0 - - 8,166.4 173.7 - 8,953.0 22,894.1
Hard maple 6,594.3 - - 5,642.0 14,672.2 - 22,736.0 49,644.5
Soft maple 6,311.7 - - 171.2 4,808.0 - 9,387.3 20,678.2
Ash 10,094.4 - - - 2,673.0 - 7,010.6 19,778.0
Cottonwood and aspen 26,158.2 - - 41,085.4 36,015.6 - 194,200.9 297,460.1
Basswood 1,901.0 - - 317.1 793.6 - 4,080.9 7,092.5
Other eastern soft HWDS 11,211.3 - - 21,814.3 8,143.8 1,873.6 59,853.9 102,897.0
Totals: 139,958.8 - - 128,371.0 109,563.5 2,887.5 414,515.3 795,296.0
Total Nat’l Forest Dept. of Defense
Other Federal
State Local (county,
municipal, etc.) Other non – Federal
Undiff. Private Total
Other yellow pines - - - - - - 554 554
Eastern white and red pines 34,444 - - 7,560 7,068 - 19,829 68,900
Jack pine 35,177 4,923 - 6,576 1,206 - 13,245 61,127
Spruce and balsam fir 240,417 - - 109,663 32,613 1,014 410,040 793,747
Eastern hemlock 8,990 - - 42,118 1,478 - 57,452 110,038
Other eastern softwoods 6,755 - - 8,078 4,814 - 68,098 87,744
Select red oaks 541 - - 2,573 1,839 - 7,050 12,003
Other red oaks - - - - - - 3,345 3,345
Yellow birch 13,802 - - 22,168 24,060 - 75,999 136,029
Hard maple 55,570 - - 21,551 18,554 - 174,376 270,051
Soft maple 26,579 - - 8,819 5,686 - 83,510 124,594
Ash 18,448 - - 21,833 3,904 - 37,371 81,556
Cottonwood and aspen 135,788 - - 173,871 39,636 - 470,800 820,094
Basswood 9,183 - - 16,055 794 - 24,166 50,197
Other eastern soft HWDS 48,122 - - 43,615 8,144 1,874 173,768 275,523
Totals: 633,816 4,923 - 484,479 149,795 2,888 1,619,603 2,895,502

P O R C U P I N E P E L L E T P L A N T | B U S I N E S S P L A N P A G E 5 9
Average annual gross growth (at least 5 inches d.b.h.) – Green Tons
Michigan Nat’l Forest Dept. of Defense
Other Federal
State Local (county,
municipal, etc.) Other non – Federal
Undiff. Private Total
Other yellow pines - - - - - - 7,648.6 7,648.6
Eastern white and red pines 192,092.6 2,359.1 - 52,678.1 2,343.0 - 237,333.9 486,806.7
Jack pine 22,423.6 2,578.1 - 53,611.6 7,407.3 - 69,954.8 155,975.5
Spruce and balsam fir 200,309.9 418.3 353.9 218,343.9 12,439.4 - 668,161.0 1,100,026.3
Eastern hemlock 48,241.9 - - 18,221.1 2,364.0 - 286,032.0 354,859.0
Other eastern softwoods 52,708.9 - - 102,134.3 2,699.9 - 236,531.9 394,075.0
Select red oaks 19,704.7 - - 27,256.9 998.7 - 103,998.1 151,958.4
Other red oaks 131.9 - - - - - - 131.9
Yellow birch 29,818.6 - 300.6 14,059.6 7,133.9 - 324,661.1 375,973.8
Hard maple 293,800.0 - 98.7 170,659.5 57,901.5 - 1,445,271.8 1,967,731.4
Soft maple 161,391.8 - 4,206.4 136,043.9 16,407.5 - 828,876.9 1,146,926.6
Beech 339.6 - - - - - - 339.6
Ash 39,263.6 - - 22,555.2 7,984.6 - 181,437.8 251,241.1
Cottonwood and aspen 254,001.7 - - 209,425.7 48,520.6 - 687,927.7 1,199,875.7
Basswood 47,836.8 - 1,101.7 14,160.2 5,494.7 - 174,125.1 242,718.6
Other eastern soft HWDS 30,441.8 - - 55,698.6 6,354.7 - 195,967.5 288,462.6
Totals: 1,392,507.4 5,355.5 6,061.3 1,094,848.6 178,049.9 - 5,447,928.2 8,124,750.9
Wisconsin Nat’l Forest Dept. of Defense
Other Federal
State Local (county,
municipal, etc.) Other non – Federal
Undiff. Private Total
Other yellow pines - - - - - - 1,184.5 1,184.5
Eastern white and red pines 169,752.4 - - 157,188.2 53,175.9 2,063.4 354,977.1 737,157.0
Jack pine 48,168.1 - - 16,910.6 2,808.0 - 93,101.7 160,988.4
Spruce and balsam fir 39,518.2 - - 45,821.4 66,296.4 2,218.7 221,334.9 375,189.5
Eastern hemlock 5,676.2 - - 12,204.0 7,362.6 - 43,885.5 69,128.4
Other eastern softwoods 22,695.8 - - 25,070.6 39,171.9 476.7 100,509.5 187,924.5
Select white oaks 549.5 - - - - - 147.8 697.4
Select red oaks 17,424.1 - - 46,835.3 6,318.9 4,939.8 71,606.9 147,125.1
Other red oaks 3,172.7 - - 1,542.3 721.2 - 10,949.5 16,385.8
Yellow birch 6,844.0 - - 4,330.8 6,495.1 - 23,736.7 41,406.7
Hard maple 49,518.3 - - 17,070.1 80,200.1 - 263,001.9 409,790.3
Soft maple 40,746.7 - - 40,864.2 53,579.6 1,799.2 168,900.8 305,890.5
Ash 8,680.1 - - 4,999.1 12,662.2 - 37,838.8 64,180.2
Cottonwood and aspen 34,788.0 - - 152,775.5 151,462.7 702.5 427,979.5 767,708.2
Basswood 6,448.6 - - 1,681.6 19,732.3 - 27,694.9 55,557.5
Other eastern soft HWDS 9,455.6 - - 35,566.2 10,578.5 930.0 98,078.6 154,608.8
Other eastern hard HWDS - - - - - - 281.5 281.5
Totals: 463,438.2 - - 562,860.0 510,565.4 13,130.2 1,945,210.2 3,495,204.1
Total Nat’l Forest Dept. of Defense
Other Federal
State Local (county,
municipal, etc.) Other non –
Federal Undiff. Private Total
Other yellow pines - - - - - - 8,833.2 8,833.2
Eastern white and red pines 361,845.0 2,359.1 - 209,866.3 55,518.9 2,063.4 592,311.0 1,223,963.7
Jack pine 70,591.7 2,578.1 - 70,522.3 10,215.3 - 163,056.5 316,963.9
Spruce and balsam fir 239,828.1 418.3 353.9 264,165.3 78,735.8 2,218.7 889,495.9 1,475,215.8
Eastern hemlock 53,918.1 - - 30,425.1 9,726.6 - 329,917.5 423,987.4
Other eastern softwoods 75,404.7 - - 127,204.9 41,871.9 476.7 337,041.4 581,999.5
Select white oaks 549.5 - - - - - 147.8 697.4
Select red oaks 37,128.9 - - 74,092.3 7,317.6 4,939.8 175,605.0 299,083.5
Other red oaks 3,304.6 - - 1,542.3 721.2 - 10,949.5 16,517.7
Yellow birch 36,662.6 - 300.6 18,390.5 13,629.0 - 348,397.8 417,380.5
Hard maple 343,318.2 - 98.7 187,729.6 138,101.5 - 1,708,273.6 2,377,521.6
Soft maple 202,138.5 - 4,206.4 176,908.0 69,987.1 1,799.2 997,777.7 1,452,817.1
Beech 339.6 - - - - - - 339.6
Ash 47,943.6 - - 27,554.3 20,646.8 - 219,276.6 315,421.3
Cottonwood and aspen 288,789.7 - - 362,201.2 199,983.3 702.5 1,115,907.2 1,967,583.9
Basswood 54,285.4 - 1,101.7 15,841.8 25,227.0 - 201,820.1 298,276.0
Other eastern soft HWDS 39,897.5 - - 91,264.8 16,933.2 930.0 294,046.1 443,071.4
Other eastern hard HWDS - - - - - - 281.5 281.5
Totals: 1,855,945.7 5,355.5 6,061.3 1,657,708.6 688,615.3 13,130.2 7,393,138.5 11,619,955.0
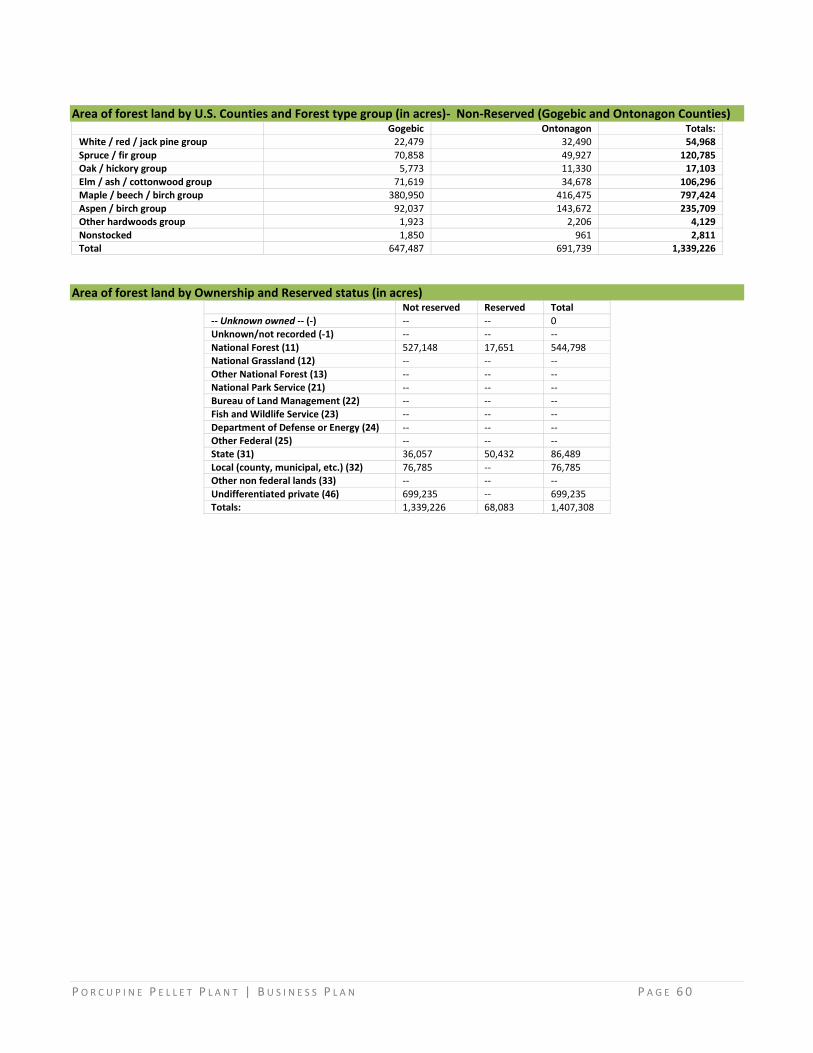
P O R C U P I N E P E L L E T P L A N T | B U S I N E S S P L A N P A G E 6 0
Area of forest land by U.S. Counties and Forest type group (in acres)- Non-Reserved (Gogebic and Ontonagon Counties) Gogebic Ontonagon Totals: White / red / jack pine group 22,479 32,490 54,968
Spruce / fir group 70,858 49,927 120,785 Oak / hickory group 5,773 11,330 17,103
Elm / ash / cottonwood group 71,619 34,678 106,296 Maple / beech / birch group 380,950 416,475 797,424
Aspen / birch group 92,037 143,672 235,709 Other hardwoods group 1,923 2,206 4,129
Nonstocked 1,850 961 2,811 Total 647,487 691,739 1,339,226
Area of forest land by Ownership and Reserved status (in acres) Not reserved Reserved Total
-- Unknown owned -- (-) -- -- 0 Unknown/not recorded (-1) -- -- --
National Forest (11) 527,148 17,651 544,798 National Grassland (12) -- -- --
Other National Forest (13) -- -- -- National Park Service (21) -- -- --
Bureau of Land Management (22) -- -- -- Fish and Wildlife Service (23) -- -- --
Department of Defense or Energy (24) -- -- -- Other Federal (25) -- -- -- State (31) 36,057 50,432 86,489
Local (county, municipal, etc.) (32) 76,785 -- 76,785 Other non federal lands (33) -- -- --
Undifferentiated private (46) 699,235 -- 699,235 Totals: 1,339,226 68,083 1,407,308

P O R C U P I N E P E L L E T P L A N T | B U S I N E S S P L A N P A G E 6 1
APPENDIX X: FINANCIALS
SOURCE AND USE OF FUNDS
Porcupine Pellet Plant
Source and Use of Funds
December 31, 2014
USE OF FUNDS: Building and Equipment 4,358,193
Start-Up Costs 156,700
Wood Inventory (45 Days) 288,750
Bags and Pallets (45 Days) 60,000
Fuel for Equipment (30 Days) 425
Working Capital (90-Day Cash Outlay) 1,348,726
Capitalized Interest 86,206
TOTAL FUNDS REQUIRED 6,299,000
SOURCE OF FUNDS: Owners' Equity 1,500,000
Loan/Bond 4,799,000
TOTAL FUNDS PROVIDED 6,299,000
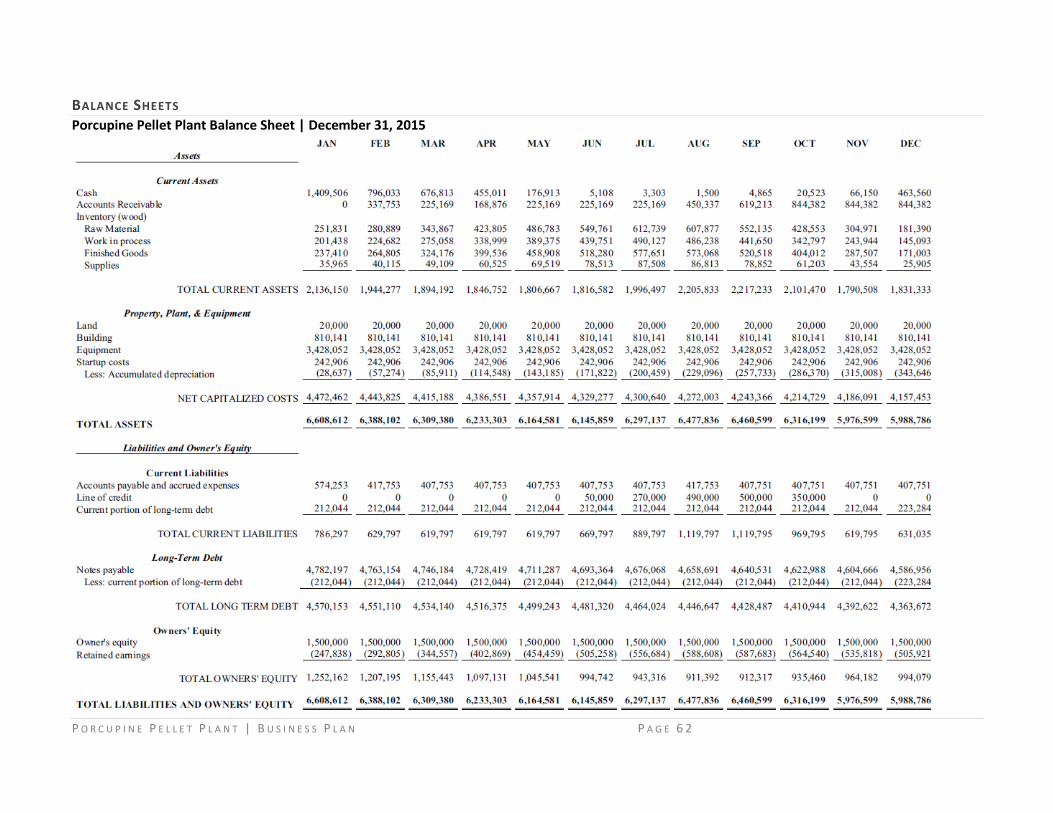
P O R C U P I N E P E L L E T P L A N T | B U S I N E S S P L A N P A G E 6 2
BALANCE SHEETS Porcupine Pellet Plant Balance Sheet | December 31, 2015

P O R C U P I N E P E L L E T P L A N T | B U S I N E S S P L A N P A G E 6 3
Porcupine Pellet Plant Balance Sheet | December 31, 2016
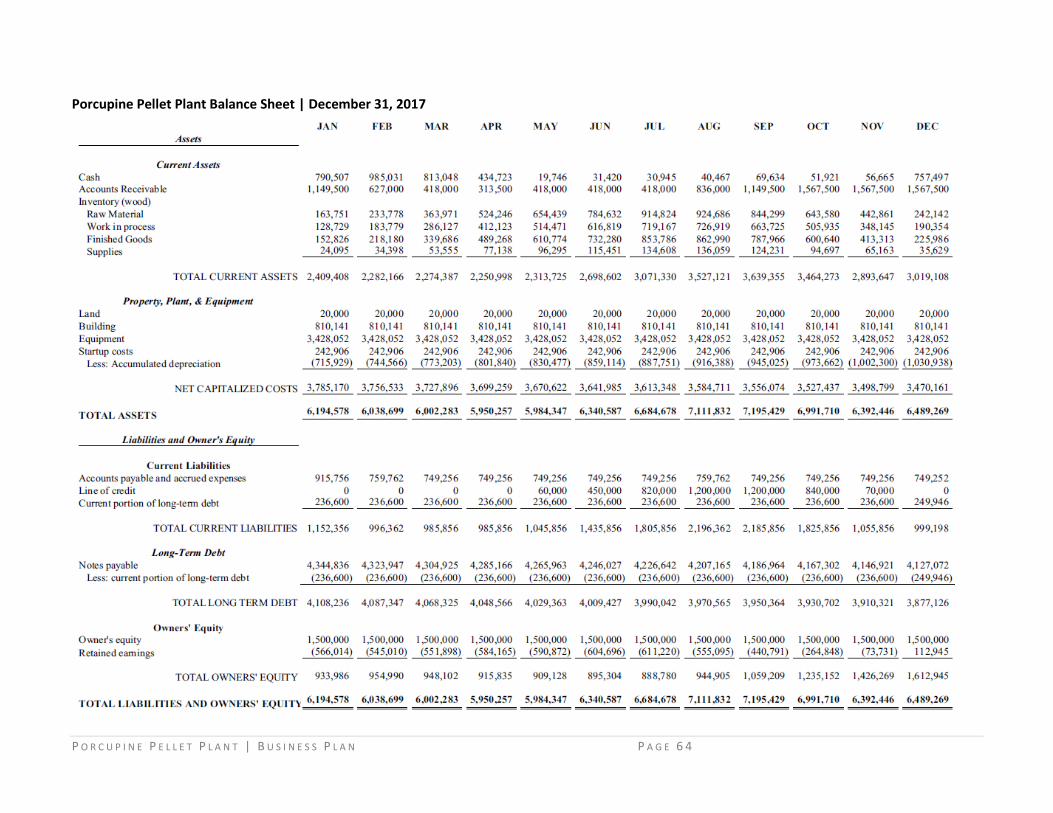
P O R C U P I N E P E L L E T P L A N T | B U S I N E S S P L A N P A G E 6 4
Porcupine Pellet Plant Balance Sheet | December 31, 2017

P O R C U P I N E P E L L E T P L A N T | B U S I N E S S P L A N P A G E 6 5
Porcupine Pellet Plant Balance Sheet | December 31, 2018

P O R C U P I N E P E L L E T P L A N T | B U S I N E S S P L A N P A G E 6 6
Porcupine Pellet Plant Balance Sheet | December 31, 2019

P O R C U P I N E P E L L E T P L A N T | B U S I N E S S P L A N P A G E 6 7
CASH FLOW STATEMENTS Porcupine Pellet Plant Cash Flow Statement | December 31, 2015

P O R C U P I N E P E L L E T P L A N T | B U S I N E S S P L A N P A G E 6 8
Porcupine Pellet Plant Cash Flow Statement | December 31, 2016
P O R C U P I N E P E L L E T P L A N T | B U S I N E S S P L A N P A G E 6 9
Porcupine Pellet Plant Cash Flow Statement | December 31, 2017
P O R C U P I N E P E L L E T P L A N T | B U S I N E S S P L A N P A G E 7 0
Porcupine Pellet Plant Cash Flow Statement | December 31, 2018

P O R C U P I N E P E L L E T P L A N T | B U S I N E S S P L A N P A G E 7 1
Porcupine Pellet Plant Cash Flow Statement | December 31, 2019

P O R C U P I N E P E L L E T P L A N T | B U S I N E S S P L A N P A G E 7 2
INCOME STATEMENTS Porcupine Pellet Plant Income Statement | December 31, 2015

P O R C U P I N E P E L L E T P L A N T | B U S I N E S S P L A N P A G E 7 3
Porcupine Pellet Plant Income Statement | December 31, 2016

P O R C U P I N E P E L L E T P L A N T | B U S I N E S S P L A N P A G E 7 4
Porcupine Pellet Plant Income Statement | December 31, 2017

P O R C U P I N E P E L L E T P L A N T | B U S I N E S S P L A N P A G E 7 5
Porcupine Pellet Plant Income Statement | December 31, 2018
P O R C U P I N E P E L L E T P L A N T | B U S I N E S S P L A N P A G E 7 6
Porcupine Pellet Plant Income Statement | December 31, 2019

P O R C U P I N E P E L L E T P L A N T | B U S I N E S S P L A N P A G E 7 7
PRODUCTION SCHEDULE
JAN FEB MAR APR MAY JUN JUL AUG SEP OCT NOV DEC
Assets
Current Assets
Cash 855,138 918,952 729,016 385,331 9,646 5,961 12,275 8,589 12,654 7,569 11,135 217,501
Accounts Receivable 902,000 492,000 328,000 246,000 328,000 328,000 328,000 656,000 902,000 1,230,000 1,230,000 1,230,000
Inventory (wood)
Raw Material 120,921 182,686 293,043 427,695 538,052 648,408 758,764 771,938 712,223 555,325 398,427 241,530
Work in process 97,016 146,571 235,111 343,144 431,684 520,224 608,765 619,334 571,424 445,543 319,662 193,782
Finished Goods 114,724 173,324 278,025 405,777 510,477 615,178 719,879 732,377 675,723 526,865 378,008 229,152
Supplies 17,708 26,753 42,914 62,632 78,793 94,954 111,115 113,044 104,299 81,323 58,346 35,370
TOTAL CURRENT ASSETS 2,107,507 1,940,286 1,906,109 1,870,579 1,896,652 2,212,725 2,538,798 2,901,282 2,978,323 2,846,625 2,395,578 2,147,335
Property, Plant, & Equipment
Land 20,000 20,000 20,000 20,000 20,000 20,000 20,000 20,000 20,000 20,000 20,000 20,000
Building 310,141 310,141 310,141 310,141 310,141 310,141 310,141 310,141 310,141 310,141 310,141 310,141
Equipment 3,428,052 3,428,052 3,428,052 3,428,052 3,428,052 3,428,052 3,428,052 3,428,052 3,428,052 3,428,052 3,428,052 3,428,052
Startup costs 242,906 242,906 242,906 242,906 242,906 242,906 242,906 242,906 242,906 242,906 242,906 242,906
Less: Accumulated depreciation -358,394 -385,963 -413,532 -441,101 -468,670 -496,239 -523,808 -551,377 -578,946 -606,514 -634,082 -661,650
NET CAPITALIZED COSTS 3,642,705 3,615,136 3,587,567 3,559,998 3,532,429 3,504,860 3,477,291 3,449,722 3,422,153 3,394,585 3,367,017 3,339,449
TOTAL ASSETS 5,750,212 5,555,422 5,493,676 5,430,577 5,429,081 5,717,585 6,016,089 6,351,004 6,400,476 6,241,210 5,762,595 5,486,784
Liabilities and Owner's Equity
Current Liabilities
Accounts payable and accrued expenses 798,966 642,716 632,466 632,466 632,466 632,466 632,466 642,716 632,465 632,465 632,465 632,465
Line of credit 0 0 0 0 50,000 390,000 740,000 1,080,000 1,110,000 900,000 350,000 0
Current portion of long-term debt 223,284 223,284 223,284 223,284 223,284 223,284 223,284 223,284 223,284 223,284 223,284 236,600
TOTAL CURRENT LIABILITIES 1,022,250 866,000 855,750 855,750 905,750 1,245,750 1,595,750 1,946,000 1,965,749 1,755,749 1,205,749 869,065
Long-Term Debt
Notes payable 4,569,163 4,549,909 4,531,943 4,513,210 4,495,072 4,476,172 4,457,861 4,439,465 4,420,314 4,401,742 4,382,421 4,363,672
Less: current portion of long-term debt -223,284 -223,284 -223,284 -223,284 -223,284 -223,284 -223,284 -223,284 -223,284 -223,284 -223,284 -236,600
TOTAL LONG TERM DEBT 4,345,879 4,326,625 4,308,659 4,289,926 4,271,788 4,252,888 4,234,577 4,216,181 4,197,030 4,178,458 4,159,137 4,127,072
Owners' Equity
Owner's equity 1,000,000 1,000,000 1,000,000 1,000,000 1,000,000 1,000,000 1,000,000 1,000,000 1,000,000 1,000,000 1,000,000 1,000,000
Retained earnings -617,916 -637,203 -670,733 -715,099 -748,457 -781,053 -814,238 -811,177 -762,303 -692,997 -602,291 -509,353
TOTAL OWNERS' EQUITY 382,084 362,797 329,267 284,901 251,543 218,947 185,762 188,823 237,697 307,003 397,709 490,647
TOTAL LIABILITIES AND OWNERS' EQUITY 5,750,212 5,555,422 5,493,676 5,430,577 5,429,081 5,717,585 6,016,089 6,351,004 6,400,476 6,241,210 5,762,595 5,486,784
JAN FEB MAR APR MAY JUN JUL AUG SEP OCT NOV DEC
PRODUCTION TONS-2015 2,600 2,600 2,600 2,600 2,600 2,600 2,600 2,600 2,600 2,600 2,600 2,600 31,200
SOLD TONS 0 -2,022 -1,348 -1,011 -1,348 -1,348 -1,348 -2,697 -3,710 -5,056 -5,056 -5,056 -30,000
REMAINING TONS 2,600 3,178 4,430 6,019 7,271 8,523 9,775 9,678 8,568 6,112 3,656 1,200
PRODUCTION TONS-2016 4,100 4,100 4,100 4,100 4,100 4,100 4,100 4,100 4,100 4,100 4,100 4,100 49,200
SOLD TONS -5,280 -2,880 -1,920 -1,440 -1,920 -1,920 -1,920 -3,840 -5,280 -7,200 -7,200 -7,200 -48,000
REMAINING TONS 20 1,240 3,420 6,080 8,260 10,440 12,620 12,880 11,700 8,600 5,500 2,400
PRODUCTION TONS-2017 5,000 5,000 5,000 5,000 5,000 5,000 5,000 5,000 5,000 5,000 5,000 5,000 60,000
SOLD TONS -6,600 -3,600 -2,400 -1,800 -2,400 -2,400 -2,400 -4,800 -6,600 -9,000 -9,000 -9,000 -60,000
REMAINING TONS 800 2,200 4,800 8,000 10,600 13,200 15,800 16,000 14,400 10,400 6,400 2,400
PRODUCTION TONS-2018 5,000 5,000 5,000 5,000 5,000 5,000 5,000 5,000 5,000 5,000 5,000 5,000 60,000
SOLD TONS -6,600 -3,600 -2,400 -1,800 -2,400 -2,400 -2,400 -4,800 -6,600 -9,000 -9,000 -9,000 -60,000
REMAINING TONS 800 2,200 4,800 8,000 10,600 13,200 15,800 16,000 14,400 10,400 6,400 2,400
Porcupine Pellet Plant
Balance Sheet
December 31, 2016
Porcupine Pellet Plant
Production Schedule in Tons
December 31, 2016

P O R C U P I N E P E L L E T P L A N T | B U S I N E S S P L A N P A G E 7 8
DEPRECIATION SCHEDULE PORCUPINE PELLET PLANT
DEPRECIATION SCHEDULE |APPLIED TO ALL YEARS EXCEPT CONSTRUCTION
DATE
COST
ANNUAL DEPREC DESCRIPTION IN SVC METHOD LIFE
LAND 1/1/2015 0:00 20,000 0
TOTAL LAND
BUILDING 1/1/2015 0:00 S/L 39 500,000 12,821
BUILDING IMPROVMENTS 1/1/2015 0:00 S/L 39 272,640 6,991
ENGINEERING/PERMITS 1/1/2015 0:00 S/L 39 37,500 962
TOTAL BUILDING 810,140 20,773
DIGITAL TRUCK SCALE 1/1/2015 0:00 S/L 15 120,000 8,000
INSTRUMENTATION 1/1/2015 0:00 S/L 10 66,000 6,600
HANDLING EQUIPMENT 1/1/2015 0:00 S/L 7 73,404 10,486
RAW MATERIAL HANDLING EQUIP 1/1/2015 0:00 S/L 10 876,510 87,651
DRYING EQUIPMENT 1/1/2015 0:00 S/L 15 477,613 31,841
BIOMASS FUEL STORAGE 1/1/2015 0:00 S/L 15 12,000 800
DRY RAY MATERIAL EQUIPMENT 1/1/2015 0:00 S/L 10 181,848 18,185
PELLETING EQUIPMEMT 1/1/2015 0:00 S/L 10 857,630 85,763
COOLING, SCREENING 1/1/2015 0:00 S/L 15 269,227 17,948
PELLET BULK STORAGE 1/1/2015 0:00 S/L 15 5,000 333
BAGGING EQUIPMENT 1/1/2015 0:00 S/L 10 136,500 13,650
OFFICE EQUIPMENT 1/1/2015 0:00 S/L 5 14,500 2,900
ENGINEERING/PERMITS 1/1/2015 0:00 S/L 15 337,820 22,521
TOTAL EQUIPMENT 3,428,052 306,679
ADMIN - SALARY AND BENEFITS 1/1/2015 0:00 S/L 15 156,700 10,447
CAPITALIZED INTEREST 1/1/2015 0:00 S/L 15 86,206 5,747
TOTAL STARTUP COSTS 242,906 16,194
TOTAL CAPITALIZED COSTS 4,501,098 343,646

P O R C U P I N E P E L L E T P L A N T | B U S I N E S S P L A N P A G E 7 9
LOAN AMORTIZATION PORCUPINE PELLET PLANT
LOAN AMORTIZATION | 31-Dec-14
PAYMENT INTEREST PRINCIPAL BALANCE ASSUME $1,500,000 EQUITY FROM OWNERS 0 CONSTRUCTION LOAN (5.5% FOR ONE YEAR - NO PAY YEAR ONE)
1-Apr-14 NEW LOAN -50,000 50,000 1-Jul-14 686 -2,350,000 2,400,000
1-Oct-14 33,271 -967,000 3,367,000 1-Dec-14 30,949 -1,345,000 4,712,000
31-Dec-14 21,301 4,712,000 0 86,206 -4,712,000
TERM LOAN (5.5% OVER LIFE OF LOAN - 15 YEAR AMORTIZATION)
31-Dec-14 NEW LOAN 4,799,000 31-Dec-14 PAY'T (ACCRUED INT) 86,206 86,206 0 4,799,000 31-Jan-15 PAYMENT 39,220 22,417 16,803 4,782,197 28-Feb-15 PAYMENT 39,220 20,177 19,043 4,763,154 31-Mar-15 PAYMENT 39,220 22,250 16,970 4,746,184 30-Apr-15 PAYMENT 39,220 21,455 17,765 4,728,419
31-May-15 PAYMENT 39,220 22,088 17,132 4,711,287 30-Jun-15 PAYMENT 39,220 21,298 17,922 4,693,364 31-Jul-15 PAYMENT 39,220 21,924 17,296 4,676,068
31-Aug-15 PAYMENT 39,220 21,843 17,377 4,658,691 30-Sep-15 PAYMENT 39,220 21,060 18,160 4,640,531 31-Oct-15 PAYMENT 39,220 21,677 17,543 4,622,988 30-Nov-15 PAYMENT 39,220 20,898 18,322 4,604,666 31-Dec-15 PAYMENT 39,220 21,509 17,711 4,586,956
556,847 344,802 212,044
31-Jan-16 PAYMENT 39,220 21,427 17,793 4,569,163 29-Feb-16 PAYMENT 39,220 19,967 19,253 4,549,909 31-Mar-16 PAYMENT 39,220 21,254 17,966 4,531,943 30-Apr-16 PAYMENT 39,220 20,487 18,733 4,513,210
31-May-16 PAYMENT 39,220 21,082 18,138 4,495,072 30-Jun-16 PAYMENT 39,220 20,320 18,900 4,476,172 31-Jul-16 PAYMENT 39,220 20,909 18,311 4,457,861
31-Aug-16 PAYMENT 39,220 20,824 18,396 4,439,465 30-Sep-16 PAYMENT 39,220 20,069 19,151 4,420,314 31-Oct-16 PAYMENT 39,220 20,648 18,572 4,401,742 30-Nov-16 PAYMENT 39,220 19,898 19,322 4,382,421 31-Dec-16 PAYMENT 39,220 20,471 18,749 4,363,672
470,640 247,356 223,284
31-Jan-17 PAYMENT 39,220 20,384 18,836 4,344,836 28-Feb-17 PAYMENT 39,220 18,332 20,888 4,323,947 31-Mar-17 PAYMENT 39,220 20,198 19,022 4,304,925 30-Apr-17 PAYMENT 39,220 19,461 19,759 4,285,166
31-May-17 PAYMENT 39,220 20,017 19,203 4,265,963 30-Jun-17 PAYMENT 39,220 19,284 19,936 4,246,027 31-Jul-17 PAYMENT 39,220 19,834 19,386 4,226,642
31-Aug-17 PAYMENT 39,220 19,744 19,476 4,207,165 30-Sep-17 PAYMENT 39,220 19,019 20,201 4,186,964 31-Oct-17 PAYMENT 39,220 19,558 19,662 4,167,302 30-Nov-17 PAYMENT 39,220 18,838 20,382 4,146,921 31-Dec-17 PAYMENT 39,220 19,371 19,849 4,127,072
470,640 234,040 236,600

P O R C U P I N E P E L L E T P L A N T | B U S I N E S S P L A N P A G E 8 0
PAYMENT INTEREST PRINCIPAL BALANCE 31-Jan-18 PAYMENT 39,220 19,279 19,942 4,107,130 28-Feb-18 PAYMENT 39,220 17,329 21,891 4,085,239 31-Mar-18 PAYMENT 39,220 19,083 20,137 4,065,102 30-Apr-18 PAYMENT 39,220 18,376 20,844 4,044,259
31-May-18 PAYMENT 39,220 18,892 20,328 4,023,930 30-Jun-18 PAYMENT 39,220 18,190 21,030 4,002,901 31-Jul-18 PAYMENT 39,220 18,698 20,522 3,982,379
31-Aug-18 PAYMENT 39,220 18,603 20,617 3,961,762 30-Sep-18 PAYMENT 39,220 17,909 21,311 3,940,451 31-Oct-18 PAYMENT 39,220 18,407 20,813 3,919,638 30-Nov-18 PAYMENT 39,220 17,719 21,501 3,898,137 31-Dec-18 PAYMENT 39,220 18,209 21,011 3,877,126
470,640 220,694 249,946
31-Jan-19 PAYMENT 39,220 18,111 21,109 3,856,017 28-Feb-19 PAYMENT 39,220 16,269 22,951 3,833,066 31-Mar-19 PAYMENT 39,220 17,905 21,315 3,811,751 30-Apr-19 PAYMENT 39,220 17,231 21,989 3,789,762
31-May-19 PAYMENT 39,220 17,703 21,517 3,768,245 30-Jun-19 PAYMENT 39,220 17,035 22,185 3,746,060 31-Jul-19 PAYMENT 39,220 17,499 21,721 3,724,338
31-Aug-19 PAYMENT 39,220 17,397 21,823 3,702,516 30-Sep-19 PAYMENT 39,220 16,737 22,483 3,680,033 31-Oct-19 PAYMENT 39,220 17,190 22,030 3,658,003 30-Nov-19 PAYMENT 39,220 16,536 22,684 3,635,319 31-Dec-19 PAYMENT 39,220 16,981 22,239 3,613,081
470,640 206,595 264,045
31-Jan-20 PAYMENT 39,220 16,878 22,342 3,590,738 29-Feb-20 PAYMENT 39,220 15,691 23,529 3,567,209 31-Mar-20 PAYMENT 39,220 16,663 22,557 3,544,653 30-Apr-20 PAYMENT 39,220 16,024 23,196 3,521,456
31-May-20 PAYMENT 39,220 16,450 22,770 3,498,686 30-Jun-20 PAYMENT 39,220 15,816 23,404 3,475,282 31-Jul-20 PAYMENT 39,220 16,234 22,986 3,452,296
31-Aug-20 PAYMENT 39,220 16,126 23,094 3,429,202 30-Sep-20 PAYMENT 39,220 15,502 23,718 3,405,484 31-Oct-20 PAYMENT 39,220 15,908 23,312 3,382,172 30-Nov-20 PAYMENT 39,220 15,289 23,931 3,358,241 31-Dec-20 PAYMENT 39,220 15,687 23,533 3,334,708
470,640 192,268 278,373
31-Jan-21 PAYMENT 39,220 15,577 23,643 3,311,065 28-Feb-21 PAYMENT 39,220 13,970 25,250 3,285,815 31-Mar-21 PAYMENT 39,220 15,349 23,871 3,261,944 30-Apr-21 PAYMENT 39,220 14,746 24,474 3,237,470
31-May-21 PAYMENT 39,220 15,123 24,097 3,213,373 30-Jun-21 PAYMENT 39,220 14,526 24,694 3,188,679 31-Jul-21 PAYMENT 39,220 14,895 24,325 3,164,354
31-Aug-21 PAYMENT 39,220 14,781 24,439 3,139,916 30-Sep-21 PAYMENT 39,220 14,194 25,026 3,114,890 31-Oct-21 PAYMENT 39,220 14,550 24,670 3,090,220 30-Nov-21 PAYMENT 39,220 13,969 25,251 3,064,970 31-Dec-21 PAYMENT 39,220 14,317 24,903 3,040,067
470,640 175,999 294,641

P O R C U P I N E P E L L E T P L A N T | B U S I N E S S P L A N P A G E 8 1
PAYMENT INTEREST PRINCIPAL BALANCE 31-Jan-22 PAYMENT 39,220 14,201 25,019 3,015,048 28-Feb-22 PAYMENT 39,220 12,721 26,499 2,988,549 31-Mar-22 PAYMENT 39,220 13,960 25,260 2,963,289 30-Apr-22 PAYMENT 39,220 13,396 25,824 2,937,465
31-May-22 PAYMENT 39,220 13,722 25,498 2,911,966 30-Jun-22 PAYMENT 39,220 13,164 26,056 2,885,910 31-Jul-22 PAYMENT 39,220 13,481 25,739 2,860,171
31-Aug-22 PAYMENT 39,220 13,361 25,859 2,834,311 30-Sep-22 PAYMENT 39,220 12,813 26,407 2,807,904 31-Oct-22 PAYMENT 39,220 13,116 26,104 2,781,800 30-Nov-22 PAYMENT 39,220 12,575 26,645 2,755,155 31-Dec-22 PAYMENT 39,220 12,870 26,350 2,728,805
470,640 159,379 311,262
31-Jan-23 PAYMENT 39,220 12,747 26,473 2,702,332 28-Feb-23 PAYMENT 39,220 11,402 27,818 2,674,514 31-Mar-23 PAYMENT 39,220 12,493 26,727 2,647,787 30-Apr-23 PAYMENT 39,220 11,969 27,251 2,620,536
31-May-23 PAYMENT 39,220 12,241 26,979 2,593,558 30-Jun-23 PAYMENT 39,220 11,724 27,496 2,566,062 31-Jul-23 PAYMENT 39,220 11,987 27,233 2,538,829
31-Aug-23 PAYMENT 39,220 11,859 27,361 2,511,468 30-Sep-23 PAYMENT 39,220 11,353 27,867 2,483,601 31-Oct-23 PAYMENT 39,220 11,601 27,619 2,455,983 30-Nov-23 PAYMENT 39,220 11,102 28,118 2,427,865 31-Dec-23 PAYMENT 39,220 11,341 27,879 2,399,986
470,640 141,821 328,819
31-Jan-24 PAYMENT 39,220 11,211 28,009 2,371,977 29-Feb-24 PAYMENT 39,220 10,365 28,855 2,343,122 31-Mar-24 PAYMENT 39,220 10,945 28,275 2,314,847 30-Apr-24 PAYMENT 39,220 10,464 28,756 2,286,092
31-May-24 PAYMENT 39,220 10,679 28,541 2,257,551 30-Jun-24 PAYMENT 39,220 10,205 29,015 2,228,536 31-Jul-24 PAYMENT 39,220 10,410 28,810 2,199,726
31-Aug-24 PAYMENT 39,220 10,275 28,945 2,170,781 30-Sep-24 PAYMENT 39,220 9,813 29,407 2,141,375 31-Oct-24 PAYMENT 39,220 10,003 29,217 2,112,157 30-Nov-24 PAYMENT 39,220 9,548 29,672 2,082,486 31-Dec-24 PAYMENT 39,220 9,728 29,492 2,052,993
470,640 123,647 346,993
31-Jan-25 PAYMENT 39,220 9,590 29,630 2,023,363 28-Feb-25 PAYMENT 39,220 8,537 30,683 1,992,680 31-Mar-25 PAYMENT 39,220 9,308 29,912 1,962,768 30-Apr-25 PAYMENT 39,220 8,873 30,347 1,932,421
31-May-25 PAYMENT 39,220 9,027 30,193 1,902,228 30-Jun-25 PAYMENT 39,220 8,599 30,621 1,871,607 31-Jul-25 PAYMENT 39,220 8,743 30,477 1,841,130
31-Aug-25 PAYMENT 39,220 8,600 30,620 1,810,510 30-Sep-25 PAYMENT 39,220 8,185 31,036 1,779,475 31-Oct-25 PAYMENT 39,220 8,312 30,908 1,748,567 30-Nov-25 PAYMENT 39,220 7,904 31,316 1,717,251 31-Dec-25 PAYMENT 39,220 8,022 31,198 1,686,053
470,640 103,700 366,940
P O R C U P I N E P E L L E T P L A N T | B U S I N E S S P L A N P A G E 8 2
PAYMENT INTEREST PRINCIPAL BALANCE 28-Feb-26 PAYMENT 39,220 6,982 32,239 1,622,471 31-Mar-26 PAYMENT 39,220 7,579 31,641 1,590,829 30-Apr-26 PAYMENT 39,220 7,191 32,029 1,558,801
31-May-26 PAYMENT 39,220 7,282 31,938 1,526,862 30-Jun-26 PAYMENT 39,220 6,902 32,318 1,494,545 31-Jul-26 PAYMENT 39,220 6,981 32,239 1,462,306
31-Aug-26 PAYMENT 39,220 6,831 32,389 1,429,917 30-Sep-26 PAYMENT 39,220 6,464 32,756 1,397,161 31-Oct-26 PAYMENT 39,220 6,526 32,694 1,364,467 30-Nov-26 PAYMENT 39,220 6,168 33,052 1,331,415 31-Dec-26 PAYMENT 39,220 6,219 33,001 1,298,415
470,640 83,002 387,638
31-Jan-27 PAYMENT 39,220 6,065 33,155 1,265,260 28-Feb-27 PAYMENT 39,220 5,338 33,882 1,231,378 31-Mar-27 PAYMENT 39,220 5,752 33,468 1,197,910 30-Apr-27 PAYMENT 39,220 5,415 33,805 1,164,105
31-May-27 PAYMENT 39,220 5,438 33,782 1,130,323 30-Jun-27 PAYMENT 39,220 5,110 34,110 1,096,213 31-Jul-27 PAYMENT 39,220 5,121 34,099 1,062,114
31-Aug-27 PAYMENT 39,220 4,961 34,259 1,027,855 30-Sep-27 PAYMENT 39,220 4,646 34,574 993,281 31-Oct-27 PAYMENT 39,220 4,640 34,580 958,701 30-Nov-27 PAYMENT 39,220 4,334 34,886 923,815 31-Dec-27 PAYMENT 39,220 4,315 34,905 888,910
470,640 61,136 409,504
31-Jan-28 PAYMENT 39,220 4,152 35,068 853,843 29-Feb-28 PAYMENT 39,220 3,731 35,489 818,354 31-Mar-28 PAYMENT 39,220 3,823 35,397 782,957 30-Apr-28 PAYMENT 39,220 3,539 35,681 747,276
31-May-28 PAYMENT 39,220 3,491 35,729 711,547 30-Jun-28 PAYMENT 39,220 3,217 36,003 675,543 31-Jul-28 PAYMENT 39,220 3,156 36,064 639,479
31-Aug-28 PAYMENT 39,220 2,987 36,233 603,246 30-Sep-28 PAYMENT 39,220 2,727 36,493 566,753 31-Oct-28 PAYMENT 39,220 2,647 36,573 530,180 30-Nov-28 PAYMENT 39,220 2,397 36,823 493,357 31-Dec-28 PAYMENT 39,220 2,305 36,915 456,442
470,640 38,171 432,469
31-Jan-29 PAYMENT 39,220 2,132 37,088 419,354 28-Feb-29 PAYMENT 39,220 1,769 37,451 381,903 31-Mar-29 PAYMENT 39,220 1,784 37,436 344,467 30-Apr-29 PAYMENT 39,220 1,557 37,663 306,804
31-May-29 PAYMENT 39,220 1,433 37,787 269,017 30-Jun-29 PAYMENT 39,220 1,216 38,004 231,014 31-Jul-29 PAYMENT 39,220 1,079 38,141 192,873
31-Aug-29 PAYMENT 39,220 901 38,319 154,554 30-Sep-29 PAYMENT 39,220 699 38,521 116,032 31-Oct-29 PAYMENT 39,220 542 38,678 77,354 30-Nov-29 PAYMENT 39,220 350 38,870 38,484 31-Dec-29 PAYMENT 38,664 180 38,484 0
470,084 13,642 456,442
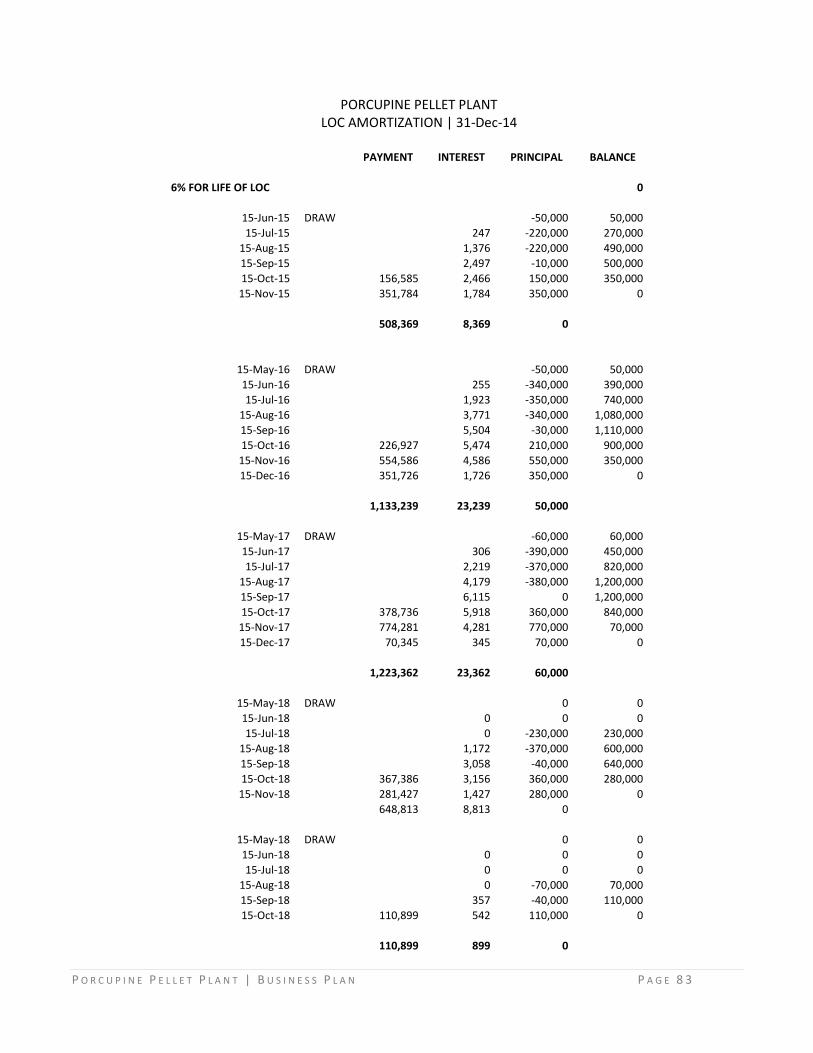
P O R C U P I N E P E L L E T P L A N T | B U S I N E S S P L A N P A G E 8 3
PORCUPINE PELLET PLANT LOC AMORTIZATION | 31-Dec-14
PAYMENT INTEREST PRINCIPAL BALANCE
6% FOR LIFE OF LOC 0
15-Jun-15 DRAW -50,000 50,000
15-Jul-15 247 -220,000 270,000
15-Aug-15 1,376 -220,000 490,000
15-Sep-15 2,497 -10,000 500,000
15-Oct-15 156,585 2,466 150,000 350,000
15-Nov-15 351,784 1,784 350,000 0
508,369 8,369 0
15-May-16 DRAW -50,000 50,000
15-Jun-16 255 -340,000 390,000
15-Jul-16 1,923 -350,000 740,000
15-Aug-16 3,771 -340,000 1,080,000
15-Sep-16 5,504 -30,000 1,110,000
15-Oct-16 226,927 5,474 210,000 900,000
15-Nov-16 554,586 4,586 550,000 350,000
15-Dec-16 351,726 1,726 350,000 0
1,133,239 23,239 50,000
15-May-17 DRAW -60,000 60,000
15-Jun-17 306 -390,000 450,000
15-Jul-17 2,219 -370,000 820,000
15-Aug-17 4,179 -380,000 1,200,000
15-Sep-17 6,115 0 1,200,000
15-Oct-17 378,736 5,918 360,000 840,000
15-Nov-17 774,281 4,281 770,000 70,000
15-Dec-17 70,345 345 70,000 0
1,223,362 23,362 60,000
15-May-18 DRAW 0 0
15-Jun-18 0 0 0
15-Jul-18 0 -230,000 230,000
15-Aug-18 1,172 -370,000 600,000
15-Sep-18 3,058 -40,000 640,000
15-Oct-18 367,386 3,156 360,000 280,000
15-Nov-18 281,427 1,427 280,000 0
648,813 8,813 0
15-May-18 DRAW 0 0
15-Jun-18 0 0 0
15-Jul-18 0 0 0
15-Aug-18 0 -70,000 70,000
15-Sep-18 357 -40,000 110,000
15-Oct-18 110,899 542 110,000 0
110,899 899 0

P O R C U P I N E P E L L E T P L A N T | B U S I N E S S P L A N P A G E 8 4
APPENDIX XI: WHITE PINE EDUCATION STATISTICS
EDUCATIONAL ATTAINMENT IN ONTONAGON COUNTY19
The data for Ontonagon County contains data for the following areas: Ontonagon, Bergland, Bruce Crossing, Mass City, Rockland, Trout Creek, White Pine, Ewen, and Kenton.
2010 Highest Education Level Attained (Population Age 25+)
Ontonagon County
Michigan United States
Did Not Complete High School 601 12.33% 801,925 12.51% 30,370,155 15.35% Completed High School 2,171 44.55% 2,047,609 31.95% 57,863,097 29.24% Some College 969 19.89% 1,450,524 22.63% 40,691,836 20.56% Completed Associate Degree 393 8.06% 532,229 8.30% 14,841,627 7.50% Completed Bachelors Degree 494 10.14% 994,506 15.52% 34,682,582 17.52% Completed Graduate Degree 245 5.03% 582,200 9.08% 19,465,340 9.84%
19
http://www.clrsearch.com/White-Pine-Demographics/MI/Education-Level-and-Enrollment-Statistics

P O R C U P I N E P E L L E T P L A N T | B U S I N E S S P L A N P A G E 8 5
2010 Education Enrollment (Population Age 3+)
Ontonagon County Michigan United States
Education Index 60 92 100 Public Preprimary 46 0.73% 88,143 0.93% 2,320,253 0.79% Private Preprimary 0 0.00% 75,506 0.79% 3,082,467 1.05% Public School 1,009 15.99% 1,692,754 17.76% 51,414,159 17.44% Private School 9 0.14% 201,669 2.12% 6,042,324 2.05% Public College 149 2.36% 576,802 6.05% 15,574,165 5.28% Private College 26 0.41% 121,157 1.27% 5,180,193 1.76% Not Enrolled in School 5,070 80.36% 6,772,747 71.08% 211,257,159 71.64%

P O R C U P I N E P E L L E T P L A N T | B U S I N E S S P L A N P A G E 8 6
APPENDIX XII: LAYOUT OPTIONS
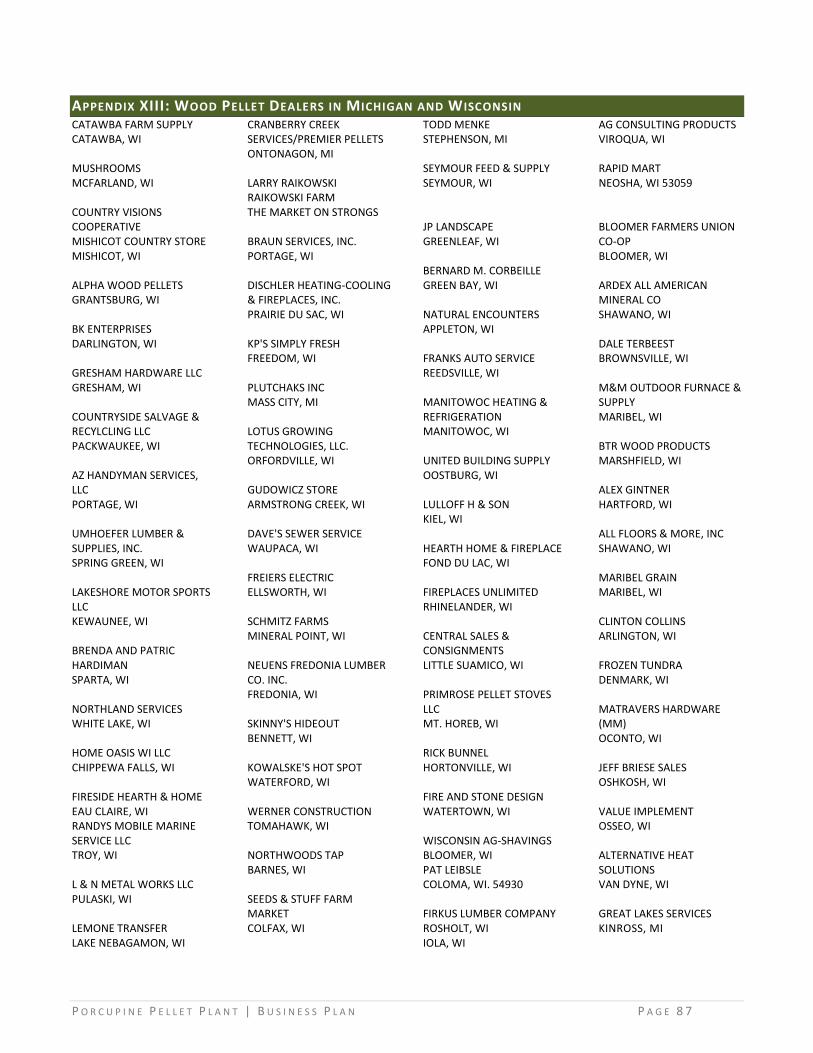
P O R C U P I N E P E L L E T P L A N T | B U S I N E S S P L A N P A G E 8 7
APPENDIX XIII: WOOD PELLET DEALERS IN MICHIGAN AND W ISCONSIN
CATAWBA FARM SUPPLY CATAWBA, WI MUSHROOMS MCFARLAND, WI COUNTRY VISIONS COOPERATIVE MISHICOT COUNTRY STORE MISHICOT, WI ALPHA WOOD PELLETS GRANTSBURG, WI BK ENTERPRISES DARLINGTON, WI GRESHAM HARDWARE LLC GRESHAM, WI COUNTRYSIDE SALVAGE & RECYLCLING LLC PACKWAUKEE, WI AZ HANDYMAN SERVICES, LLC PORTAGE, WI UMHOEFER LUMBER & SUPPLIES, INC. SPRING GREEN, WI LAKESHORE MOTOR SPORTS LLC KEWAUNEE, WI BRENDA AND PATRIC HARDIMAN SPARTA, WI NORTHLAND SERVICES WHITE LAKE, WI HOME OASIS WI LLC CHIPPEWA FALLS, WI FIRESIDE HEARTH & HOME EAU CLAIRE, WI RANDYS MOBILE MARINE SERVICE LLC TROY, WI L & N METAL WORKS LLC PULASKI, WI LEMONE TRANSFER LAKE NEBAGAMON, WI
CRANBERRY CREEK SERVICES/PREMIER PELLETS ONTONAGON, MI LARRY RAIKOWSKI RAIKOWSKI FARM THE MARKET ON STRONGS BRAUN SERVICES, INC. PORTAGE, WI DISCHLER HEATING-COOLING & FIREPLACES, INC. PRAIRIE DU SAC, WI KP'S SIMPLY FRESH FREEDOM, WI PLUTCHAKS INC MASS CITY, MI LOTUS GROWING TECHNOLOGIES, LLC. ORFORDVILLE, WI GUDOWICZ STORE ARMSTRONG CREEK, WI DAVE'S SEWER SERVICE WAUPACA, WI FREIERS ELECTRIC ELLSWORTH, WI SCHMITZ FARMS MINERAL POINT, WI NEUENS FREDONIA LUMBER CO. INC. FREDONIA, WI SKINNY'S HIDEOUT BENNETT, WI KOWALSKE'S HOT SPOT WATERFORD, WI WERNER CONSTRUCTION TOMAHAWK, WI NORTHWOODS TAP BARNES, WI SEEDS & STUFF FARM MARKET COLFAX, WI
TODD MENKE STEPHENSON, MI SEYMOUR FEED & SUPPLY SEYMOUR, WI JP LANDSCAPE GREENLEAF, WI BERNARD M. CORBEILLE GREEN BAY, WI NATURAL ENCOUNTERS APPLETON, WI FRANKS AUTO SERVICE REEDSVILLE, WI MANITOWOC HEATING & REFRIGERATION MANITOWOC, WI UNITED BUILDING SUPPLY OOSTBURG, WI LULLOFF H & SON KIEL, WI HEARTH HOME & FIREPLACE FOND DU LAC, WI FIREPLACES UNLIMITED RHINELANDER, WI CENTRAL SALES & CONSIGNMENTS LITTLE SUAMICO, WI PRIMROSE PELLET STOVES LLC MT. HOREB, WI RICK BUNNEL HORTONVILLE, WI FIRE AND STONE DESIGN WATERTOWN, WI WISCONSIN AG-SHAVINGS BLOOMER, WI PAT LEIBSLE COLOMA, WI. 54930 FIRKUS LUMBER COMPANY ROSHOLT, WI IOLA, WI
AG CONSULTING PRODUCTS VIROQUA, WI RAPID MART NEOSHA, WI 53059 BLOOMER FARMERS UNION CO-OP BLOOMER, WI ARDEX ALL AMERICAN MINERAL CO SHAWANO, WI DALE TERBEEST BROWNSVILLE, WI M&M OUTDOOR FURNACE & SUPPLY MARIBEL, WI BTR WOOD PRODUCTS MARSHFIELD, WI ALEX GINTNER HARTFORD, WI ALL FLOORS & MORE, INC SHAWANO, WI MARIBEL GRAIN MARIBEL, WI CLINTON COLLINS ARLINGTON, WI FROZEN TUNDRA DENMARK, WI MATRAVERS HARDWARE (MM) OCONTO, WI JEFF BRIESE SALES OSHKOSH, WI VALUE IMPLEMENT OSSEO, WI ALTERNATIVE HEAT SOLUTIONS VAN DYNE, WI GREAT LAKES SERVICES KINROSS, MI

P O R C U P I N E P E L L E T P L A N T | B U S I N E S S P L A N P A G E 8 8
LAKEWOODS RESORT CABLE, WI A-1 CHIMNEY SERVICES SLINGER, WI P-TECH INTEGRATION, LLC MUKWONAGO, WI LAMPERTS STURGEON BAY, WI ERICKSON FOREST PRODUCTS KENNAN, WI NORTHLAND FOODS POPLAR, WI AMERICAN HOME FIREPLACE SALEM, WI STONEHOUSE WINDOWS & DOORS ISHPEMING, MI MARY UGOREPZ EDGAR, WI SUNBURST SALES, LLC RIPON, WI MB PELLETS BELGIUM, WI PS SEASONING/PRO SMOKER IRON RIDGE, WI RYMER HEATING CRIVITZ, WI FAMILY FARMS, INC. ELEVA, WI SUNSHINE TREES ANTIGO, WI ARDISAM CUMBERLAND, WI SHIELDS HEATING FIREPLACE BARABOO, WI COUNTRY PRIDE COOP SPOONER, WI UNITY CUSTOM SERVICES
BALSAM LAKE, WI RAINBOW HOME CENTER RICE LAKE, WI DAIZY SWEEPS COLUMBUS, WI RALPH HAMM MAUSTON, WI 53948 JANSSEN SAWMILL SIREN, WI HAYWARD MERCHANTILE CO, LLC. HAYWARD, WI ROYALL MFG, INC. ELROY, WI AUTO VALUE OF L’ ANSE L'ANSE, MI WAUTOMA HARDWARE WAUTOMA, WI GLENOAK LUMBER & MILLING MONTELLO, WI BRIAN’S PELLET SALES COUDEREY, WI JIM’S ALTERNATIVE ENERGY STORE LLC CAMERON, WI BENDER MACHINE WORKS HAYWARD, WI LAMPERTS LUMBER YARD SISTERBAY, WI KETTLE MORAINE TOWN & COUNTRY LLC KEWASKUM, WI LAKE SUPERIOR EVERGREENS BRULE, WI LAKE STATES-LUMBER SPARTA, WI KONTEKA WHITE PINE, MI TRIBOVICH CONSTRUCTION, LLC. BAYFIELD, WI
ACE HARDWARE WESTON SCHOLFIELD, WI BURKUM MILLING COMPANY SOILDERS GROVE, WI HUBBARD RACING, INC. STEPHENSON, MI NORBERT HENKE WESTFIELD, WI CUSTOM WOOD PELLETS MIKANA, WI STONER’S ON MAIN WHEELER, WI GBM, LLC. HOLCOMBE, WI ARCH NORTH HEATING & COOLING BARNES, WI LAMPERTS RIDGELAND, WI WOOD STOVES AND MORE MINONG, WI TWIN WATERS ENERGY ST. GERMAIN, WI KARAM MANUFACTURING, INC. BERLIN, WI OUDOOR WOODSTOVE SPECIALISTS,LLC ONEIDA, WI ECONOMY FEED MILL BLOOMINGTON, WI RICK’S ALTERNATIVE ENERGY CORNELL, MI WOODRUFF HARDWARE INC. WOODRUFF, WI J&S PELLETS ESCANABA, MI AUGUSTA TRUE VALUE HARDWARE AUGUSTA, WI
HUNDT IMPLEMENT, INC CASHTON, WI CHIMNEY SPECIALISTS, INC. HIGHLAND, WI RISLEY PELLET SOLUTIONS MONTICELLO, WI A-Z TOWN AND COUNTRY, LLC. COLBY, WI FARMERS IMPLEMENT, LLC ALLENTON, WI FEDERATION COOPERATIVE BLACK RIVER FALLS, WI BLAINS FARM & FLEET RICE LAKE, WI SPOONER LAMPERTS SPOONER, WI ST. CROIX FALLS LAMPERTS ST. CROIX FALLS, WI FULLER LOG & LUMBER PRARIE DU CHIEN, WI LOYAL FARM AND HOME CENTER LOYAL, WI CO-OP HARDWARE HANK IRON RIVER, WI KNOECK, INC. WAUSAU, WI BAY AREA POOL & SPA, INC. ESCANABA, MI NORTHWEST WI ENT, INC. TREGO, WI ANCO COMPANY MASON, WI MEDFORD FARM & HOME CENTER MEDFORD, WI AFFORDABLE PELLETS WISCONSIN RAPIDS, WI

P O R C U P I N E P E L L E T P L A N T | B U S I N E S S P L A N P A G E 8 9
DOUBLE D DAIRY ANTIGO, WI FREDERIC HARDWARE FREDERIC, WI VALUE IMPLEMENT ARCADIA, WI NORTHWOODS TRAILERS MARION, WI NORTHERN STOVE & PELLET HOUGHTON, MI TOP HAT FIREPLACE & CHIMNEY MADISON, WI BITTNERS LUMBER, LLC. SOUTH PRAIRIE FARM, WI LOYD’S PELLET SALES RIO, WI WARMING TRENDS, INC. ONALASKA, WI DAN'S FEED BIN SUPERIOR, WI B & M BIOMASS BARRON, WI BOSSERT FIREPLACE SHOPPE MINERAL POINT, WI TRUE VALUE HARDWARE AMERY, WI CULLIGAN WATER CONDITIONING OF ASHLAND ASHLAND, WI NATURES HEAT NECEDAH, WI FREIERS FIREPLACE SOURCE HUDSON, WI UP NORTH TRADERS SAYNER, WI STONEY MEADOWS SALES, LLC. PITTSVILLE, WI
NORTHWOODS FLOORING & HOME CENTER, LLC. PARK FALLS, WI SEASONAL POWER TOYS BIRCHWOOD, WI EXLAND FEED MILL EXLAND, WI HARRINGTON RIDGE COAL & STOVE HANCOCK, MI PLUM CITY FEED MILL PLUM CITY, WI PALCHIK'S PELLETS LLC EAU CLAIRE, WI ONEIDA CONCRETE PRODUCTS, INC. RHINELANDER, WI CONCRETE PRODUCTS, INC. EAGLE RIVER, WI TRACTOR CENTRAL SHELDON, WI ASHLAND ACE HARDWARE ASHLAND, WI D&D FARM SUPPLY ARCADIA, WI HOMESTEAD COUNTRY STOVES, LLC. TOMAH, WI EARTH SENSE ENERGY SYSTEMS, INC. DALE, WI BRIAN HEMPLEMAN THORP, WI S.D. CEDAR PRODUCTS ARBOR VITAE, WI BUCHHOLZ FEED STORE, INC. LADYSMITH, WI BARRY’S BUILDERS SUPPLY BRUCE, WI
ASSOCIATED MERCHANTS, INC. BEAVER DAM, WI HAYNES ENTERPRISE - CENTRAL OUTDOOR HEATING PHILLIPS, WI OFSTAD SALES AND SERVICE GURNEY/SAXON, WI ROLLRITE OVERHEAD DOORS PICKEREL, WI KELA CONSTRUCTION, INC. HANCOCK, MI GREAT AMERICAN HOMES & FIREPLACE MENOMONIE, WI TRAP N FISH, INC. WINTER, WI TRI COUNTY HEATING & COOLING CRANDON, WI J&J FOREST PRODUCTS GLENWOOD CITY, WI MORGAN WOOD PRODUCTS, LLC. OCONTO FALLS, WI ACE HARDWARE OF CALUMET CALUMET, MI WASHINGTON ISLAND WASHINGTON ISLAND, WI ST. CROIX FALLS - DO-IT ST. CROIX FALLS, WI ADAMS - DO-IT ADAMS, WI AMERY - DO-IT AMERY, WI AUGUSTA - DO-IT AUGUSTA, WI CHETEK LAMPERTS CHETEK, WI
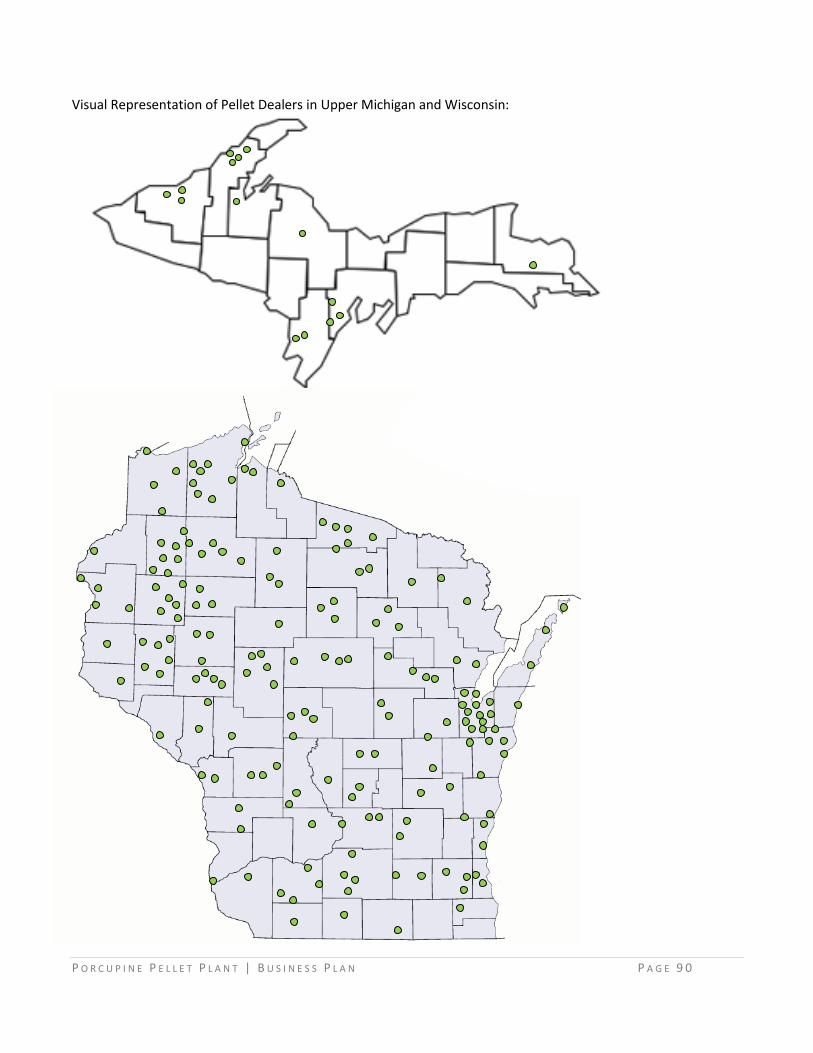
P O R C U P I N E P E L L E T P L A N T | B U S I N E S S P L A N P A G E 9 0
Visual Representation of Pellet Dealers in Upper Michigan and Wisconsin:

P O R C U P I N E P E L L E T P L A N T | B U S I N E S S P L A N P A G E 9 1
REFERENCES Cocchi, M., Nikolaisen, L., Junginger, M., Heiniomö, J., Bradley, D., Hess, R., Jacobson, J., Ovard, L.P., Thrän, D., Henning, C., Deutmeyer, M., Shcouwenberg, P.P., & Marchal, D. (2011). Global wood pellet industry market and trade study. Retrived from The International Energy Agency’s Bio Energy Website: http://www.bioenergytrade.org/downloads/t40-global-wood-pellet-market-study_final.pdf Consumer Reports (2009) Buyer’s guide to pellet- and wood-burning stoves, the pros, cons and costs vs. natural gas, oil, and coal. Retrieved October 4, 2012 from: http://www.consumerreports.org/cro/appliances/heating-cooling-and-air/wood-stoves/buyers-guide-to-pellet-and-wood-burning-stoves-1-07/overview/0701_pellet-stove.htm European Biomass Association (2011). Annual Report 2011. Brussels. Pellet Fuels Institute (2011). Pellet fuels institute residential/commercial densified fuel QA/QC handbook. Arlington, VA. Pellet Fuels Institute (2011). Pellet fuels institute standard specification for residential/commercial densified fuel. Arlington, VA. Pellet Fuels Institute (2011). Who is PFI?. Retrieved October 29, 2012, from the Pellet Fuels Institute website: http://pelletheat.org/about-us/who-is-pfi/ Pellet Fuels Institute (2011). PFI Standard program launched. Retrieved October 29, 2012, from the Pellet Fuels Institute website: http://pelletheat.org/pfi-standards/pfi-standards-program/ Pellet Fuels Institute (2011). Legislation. Retrieved October 29, 2012, from the Pellet Fuels Institute website: http://pelletheat.org/government-affairs/legislation/ Pirraglia, A., Gonzalez, R., Saloni, D. (2010). Techno-economical analysis of wood pellets production for U.S. manufactures. BioResources 5(4) 2374-2390. United Nations Framework Convention on Climate Change (1012). Kyoto Protocol. Retrived October 24, 2012, from: http://unfccc.int/kyoto_protocol/items/2830.php United States Department of Agriculture Forest Service Forest Products Laboratory (2009). North America’s wood pellet sector. Madison, WI: Spelter, H., Toth, D. United States Energy Information Administration (2012). Annual Energy Outlook 2012 with Projections to 2035. (DOE/EIA – 0383(1012)