2013 customer satisfaction survey subway -...
TRANSCRIPT

2013 Customer Satisfaction Survey
Subway
New York City Transit 1

Subway Survey Context
• Unprecedented damage to the subway system from Superstorm Sandy – Weekend shutdowns of Greenpoint Tunnel started shortly before survey
– Widespread praise for MTA recovery efforts from Superstorm Sandy
• MTA fares and tolls increased in March 2013
• Spike in the number of persons falling or pushed onto tracks – Followed by a comprehensive platform safety communications campaign
• Fastrack continued its fast and cost-efficient repairs
• Continued strong subway car reliability performance/MDBF
• Bottom Line: Continued increases in subway ridership
New York City Transit 2
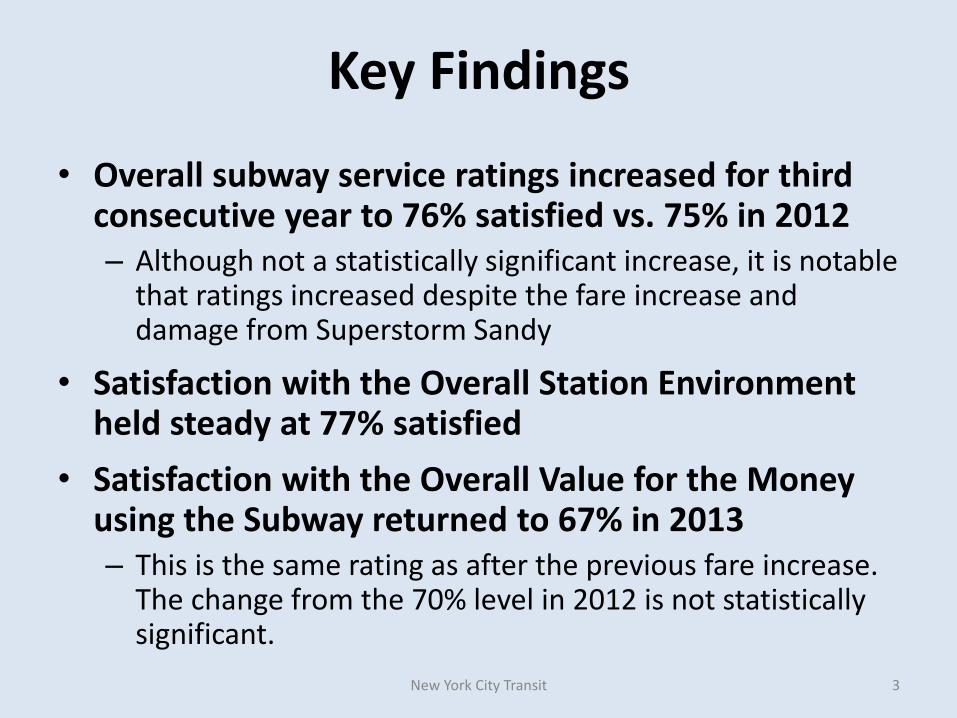
Key Findings
• Overall subway service ratings increased for third consecutive year to 76% satisfied vs. 75% in 2012 – Although not a statistically significant increase, it is notable
that ratings increased despite the fare increase and damage from Superstorm Sandy
• Satisfaction with the Overall Station Environment held steady at 77% satisfied
• Satisfaction with the Overall Value for the Money using the Subway returned to 67% in 2013 – This is the same rating as after the previous fare increase.
The change from the 70% level in 2012 is not statistically significant.
New York City Transit 3

Key Findings (continued)
• Subway platform safety communications campaign reached almost three-quarters of customers:
– 73% of customers recall platform safety messages
• Safety campaign received high marks from customers: 86% of those recalling platform safety messages are satisfied with them, including 90% on the A Division and 80% on the B Division
– Better PA systems accompany countdown clocks
• Most customers (82%) are satisfied with their safety while standing on platforms
New York City Transit 4

Overall Customer Satisfaction
59% 60%
13%19% 20% 18%
61%60%60% 58%
16%16%
2013 2012 2011 2013 2012 2011
Overall Subway Service
Subway Line Used Most
76%
Top Area = Very Satisfied Bottom Area = Satisfied
75% 74% 79% 78% 78%
New York City Transit 5 Very satisfied + satisfied may not equal total due to rounding.

2013 Fare Increase Affected Value Ratings, But Not Overall Satisfaction with Subway Service
New York City Transit 6
76% 75% 74%
71%
67%
70%
67%
64%
2013 2012 2011 2010
Subway Service Value for the Money
Fare Increases

Satisfaction with Subway Service Performance
23% 22% 21% 20% 24% 27%26%
55%59%58%60%60%58%61% 59%58%59%60% 59%
22%22% 23%23%21%
2013 2012 2011 2013 2012 2011 2013 2012 2011 2013 2012 2011
Overall Service Reliability
Predictability of Subway Travel
Time
Maintaining Subway Cars So
They Do Not Break Down or Cause Delays
How Fast the Subway Gets
You Where You Want to Go
81% 84% 82% 79% 81%
77% 82% 83%
80% 84% 86% 81%
New York City Transit 7 Very satisfied + satisfied may not equal total due to rounding.

Satisfaction with Subway Safety and Security
21% 35% 33% 30%26%
25%
17% 14%
56%53%61%58%57%59%64%
56%58% 61%54% 53%
23%18% 28%
15%
2013 2012 2011 2013 2012 2011 2013 2012 2011 2013 2012 2011
81%
Overall Safety and Security
Safety from Mechanical Accidents
Personal Security before
8 p.m.
Personal Security after
8 p.m.
82% 83% 89% 89% 89%
83% 86% 86%
71% 67%
72%
New York City Transit 8
Very satisfied + satisfied may not equal total due to rounding.

Satisfaction with Information and Communications about Service
58%47%
17%30% 31% 21%
40%56%53%
41%
20%20%
2013 2012 2011 2013 2012 2011
Overall Information and Communications about
Subway Service
Knowing How Long You Have to Wait for the Next Train to Arrive
73% 79% 73% 71% 72% 68%
New York City Transit 9
Very satisfied + satisfied may not equal total due to rounding.

Satisfaction with Announcements on Subway Trains
46%54% 50% 46% 48% 51% 49%
19%23% 24% 20%
18% 19%22% 23%
20%
53%52%45%44%52%
21%21%21%
2013 2012 2011 2013 2012 2011 2013 2012 2011 2013 2012 2011
Clarity of Announcements
Usefulness of Announcements:
During Normal Service
Usefulness of Announcements:
Unplanned Delays
Usefulness of Announcements: Planned Service
Changes
65% 67% 64%
75% 76% 74%
67% 67% 67% 72%
75% 69%
New York City Transit 10
Very satisfied + satisfied may not equal total due to rounding.

Satisfaction with the Comfort and Convenience of Using the Subway
New York City Transit 11
62%
38%
57% 55% 57%
23%
8% 6% 8%
24% 27% 27%
35%
61%60%
39%
21%22%
2013 2012 2011 2013 2012 2011 2013 2012 2011
Overall Comfort and Convenience of Using
the Subway
Keeping Trains from Getting Too Crowded
during Rush Hours
Comfort of Temperature on
Subway Cars
82% 83% 84%
43% 45% 46%
81% 82% 84%
Very satisfied + satisfied may not equal total due to rounding.

Satisfaction with Cleanliness of Subway Cars
New York City Transit 12
55% 52% 55% 50%59%
52% 52%
15%17% 19% 16%
18%18%
15% 16% 16%
52%54%60%58%51%
23%20%16%
2013 2012 2011 2013 2012 2011 2013 2012 2011 2013 2012 2011
Overall Cleanliness of Subway Cars
Keeping Floors and Seats
Clean
Windows Clean with No
Scratchiti
Having no Litter in Subway Cars
74% 75% 75% 71% 71% 68%
73% 74% 77%
67% 69%
67%
Very satisfied + satisfied may not equal total due to rounding.

Satisfaction with Subway Conductors
• Satisfaction with the courtesy and helpfulness of subway conductors decreased to 82% in 2013 vs. 83% in 2012, a non-statistical change
New York City Transit 13
56%
24%
55%60%
27%22%
2013 2012 2011
82% 83% 80%
Very satisfied + satisfied may not equal total due to rounding.

Satisfaction with Subway Stations
New York City Transit 14
60% 58% 60% 61% 59%
15% 24% 25% 21% 21% 20% 21%
55%63%61% 56%
17%16%
2013 2012 2011 2013 2012 2011 2013 2012 2011
Overall Station Environment
Station Use Most Often Near Home
Station Use Most Often Near Work
77% 77% 78% 79% 81% 79% 81% 82% 80%
Very satisfied + satisfied may not equal total due to rounding.

Satisfaction with Overall Station Cleanliness
New York City Transit 15
52% 56% 53% 49% 53% 55% 55%
16% 16% 21% 17%13% 14%
25% 27% 20%
55%55%56%55% 54%
18%21%17%
2013 2012 2011 2013 2012 2011 2013 2012 2011 2013 2012 2011
Overall Cleanliness of
Stations
Keeping Stations Litter
Free
Keeping Station Clean from Dirt
and Grime
Keeping Graffiti off Walls, Signs,
Etc.
71% 75% 73% 66% 67% 67%
80% 82% 78% 71% 72% 72%
Very satisfied + satisfied may not equal total due to rounding.

Satisfaction with Maintenance and Repair of Stations
New York City Transit 16
65% 67%
82% 84% 77%
88%
75% 80% 78%
60% 58% 56% 58% 61%51% 50%
15% 22% 27% 18% 28% 25%
17%
50%58%60%59% 55%
14%14%
30%20%18%
2013 2012 2011 2013 2012 2011 2013 2012 2011 2013 2012 2011
Overall Maintenance
and Repair
Condition of Stairs and Handrails
Station Lighting
Condition of Walls and Ceilings
85%
64%
80%
Very satisfied + satisfied may not equal total due to rounding.

Satisfaction with MetroCard Equipment
New York City Transit 17
53% 56%
26% 26% 29% 24%
53%55%55% 54%
29%24%
2013 2012 2011 2013 2012 2011
Working Condition of MetroCard Vending Machines
Working Condition of MetroCard Swipe Readers at Turnstiles
79% 82% 81% 79% 83% 80%
Very satisfied + satisfied may not equal total due to rounding.

Satisfaction with Availability of Information in Stations
New York City Transit 18
58% 56% 50% 48% 50%
18% 34% 30% 29%23% 16%
53%59%58% 57%
23%22%22%
2013 2012 2011 2013 2012 2011 2013 2012 2011
Overall Availability of Information in
Stations
Signs Directing You to Exits and Transfer
Locations
Clarity of Announcements on Station Platforms
80% 87%
80% 77% 87% 85%
73% 71% 67%
Very satisfied + satisfied may not equal total due to rounding.

Satisfaction with Information about Service Delays and Diversions
New York City Transit 19
50%59%
13%23% 22% 18%
55%51%51% 55%
17%18%
2013 2012 2011 2013 2012 2011
Information in Station about Unscheduled Delays
Information in Station about Planned Service Changes
69% 67% 64%
78% 78% 76%
Very satisfied + satisfied may not equal total due to rounding.

Satisfaction with Personal Security in Stations
New York City Transit 20
61% 62%53% 56%
20% 27% 29%26%
17%
55%58%62%58% 56%
19% 17%20%23%
2013 2012 2011 2013 2012 2011 2013 2012 2011
Overall Personal Security in Station
Your Sense of Personal Security
Before 8 p.m.
Your Sense of Personal Security
After 8 p.m.
82% 82% 82% 86% 85% 88%
74% 69% 72%
Very satisfied + satisfied may not equal total due to rounding.

Satisfaction with Safety in Stations
New York City Transit 21
14% 17% 12%
54% 58%53%56%
26%
2013 2013 2012 2011
Your Personal Safety Standing on Platforms
Keeping Platforms from Getting Too Crowded During Rush Hours
82% 70% 71% 66%
Attribute rated for first time in 2013
Very satisfied + satisfied may not equal total due to rounding.

Platform Safety Communications Campaign: Customer Awareness and Satisfaction
New York City Transit 22
33%
53%
86% 73%
Recall Platform Safety Messages
(Only Asked in 2013)
Satisfaction with Platform Safety Messages
(Only Asked in 2013, Among Those Who Recalled Safety Messages)

SURVEY METHODOLOGY
• The MTA conducted its annual customer satisfaction survey for New York City Transit (NYCT) subway and local bus operations between June 11 and 30, 2013.
• The Citywide telephone survey interviewed 1,729 New York City residents throughout the five boroughs using random samples of landline and cell phone numbers.
• In-depth interviews were conducted with 1,201 customers who had taken at least one ride in the past 30 days on a subway and/or local bus. The average length for the full survey was 28 minutes. The margin of error is 3.8 percentage points.
• The remaining 528 contacts did not ride the subway or local bus in the past 30 days and were asked demographic questions only for use in weighting total survey results to the latest census data for New York City residents 18 years of age and older.
New York City Transit 23

New York City Transit 24
CUSTOMER SATISFACTION RATINGS FOR SUBWAY SERVICE
N =
TOTAL SATISFIED 2010 2011 2012 2013 1082 1009 1018 1039
% % % % OVERALL SUBWAY SERVICE 71 74 75 76 OVERALL SUBWAY SERVICE ON LINE USE MOST 77 78 78 79 SERVICE FREQUENCY 72 79 79 78 OVERALL RELIABILITY OF SERVICE 76 82 84 81
The predictability of subway travel time 74 77 81 79 Maintaining subway cars so they do not break down and cause delays NA 80 83 82 How fast the subway gets you where you want to go 83 81 86 84
OVERALL SAFETY AND SECURITY 77 83 82 81 Safety from mechanical accidents 85 89 89 89 Overall personal security in the subway BEFORE 8 p.m. 80 86 86 83 Overall personal security in the subway AFTER 8 p.m. 65 72 67 71
OVERALL INFORMATION AND COMMUNICATIONS ABOUT SUBWAY SERVICE 63 73 79 73 Knowing how long you have to wait for the next train to arrive NA 68 72 71 Clarity of announcements on subway trains 56 64 67 65 Usefulness of announcements on trains during normal service 67 74 76 75 Usefulness of announcements on trains during unplanned delays 64 67 67 67 Usefulness of announcements on trains during planned service changes NA 69 75 72
OVERALL COMFORT AND CONVENIENCE OF USING THE SUBWAY 78 84 83 82 Keeping subway trains from getting too crowded during rush hours 44 46 45 43 Comfort of temperature on subway cars 79 84 82 81
OVERALL CLEANLINESS OF SUBWAY CARS 68 75 75 74 Keeping floors and seats clean NA 68 71 71 Keeping subway car windows clean with no scratchiti NA 77 74 73 Having no litter in subway cars NA 67 69 67 Keeping graffiti off subway car walls NA 82 82 82
OVERALL COURTESY AND HELPFULNESS OF SUBWAY CONDUCTORS 77 80 83 82 OVERALL VALUE FOR THE MONEY USING THE SUBWAY 64 67 70 67

New York City Transit 25
CUSTOMER SATISFACTION RATING OF SUBWAY STATIONS
N =
TOTAL SATISFIED 2010 2011 2012 2013 1048 1006 1007 1027
% % % % STATION USE MOST OFTEN NEAR HOME 77 79 81 79 STATION USE MOST OFTEN NEAR WORK/SCHOOL 74 80 82 81 OVERALL STATION ENVIRONMENT 71 78 77 77
Escalators in subway NA 75 82 83 Elevators in subway NA 73 76 73 Courtesy and helpfulness of station agents NA 81 85 82
OVERALL STATION CLEANLINESS 64 72 72 71 Keeping station litter free NA 73 75 71 Keeping station clean from dirt and grime NA 67 67 66 Keeping graffiti off walls, signs, etc. NA 78 82 80
OVERALL MAINTENANCE AND REPAIR OF STATION 68 75 80 78 Condition of stairs and handrails 72 77 82 80 Station lighting 81 85 88 84 Working condition of MetroCard vending machines NA 81 82 79 Working condition of MetroCard swipe readers at turnstiles NA 80 83 79 Condition of walls and ceilings NA 64 67 65
OVERALL AVAILABILITY OF INFORMATION IN STATION 67 77 80 80 Signs directing you to exits and transfer locations 82 85 87 87 Clarity of announcements on station platforms 59 67 71 73 Information in station about unscheduled delays 56 64 67 69 Announcements about standing away from the edge of the platform* NA NA NA 86 Information in station about planned service changes 69 76 78 78
OVERALL PERSONAL SECURITY IN STATION 76 82 82 82 Your personal safety standing on subway platforms NA NA NA 82 Your sense of personal security in the station BEFORE 8 p.m. NA 88 85 86 Your sense of personal security in the station AFTER 8 p.m. NA 72 69 74
KEEPING STATION PLATFORMS FROM GETTING TOO CROWDED DURING RUSH HOURS 65 70 71 66
* Includes only those respondents that recall hearing platform safety announcements.