2013 crop market outlook
DESCRIPTION
2013 Crop Market Outlook. OK State Extension Webcast Apr. 15, 2013 Chad Hart Associate Professor/Crop Markets Specialist [email protected] 515-294-9911. U.S. Corn Supply and Use. Source: USDA-WAOB, for 2009-12. U.S. Soybean Supply and Use. Source: USDA-WAOB, for 2009-12. - PowerPoint PPT PresentationTRANSCRIPT
Extension and Outreach/Department of Economics
2013 Crop Market Outlook
OK State Extension WebcastApr. 15, 2013
Chad HartAssociate Professor/Crop Markets Specialist
Extension and Outreach/Department of Economics
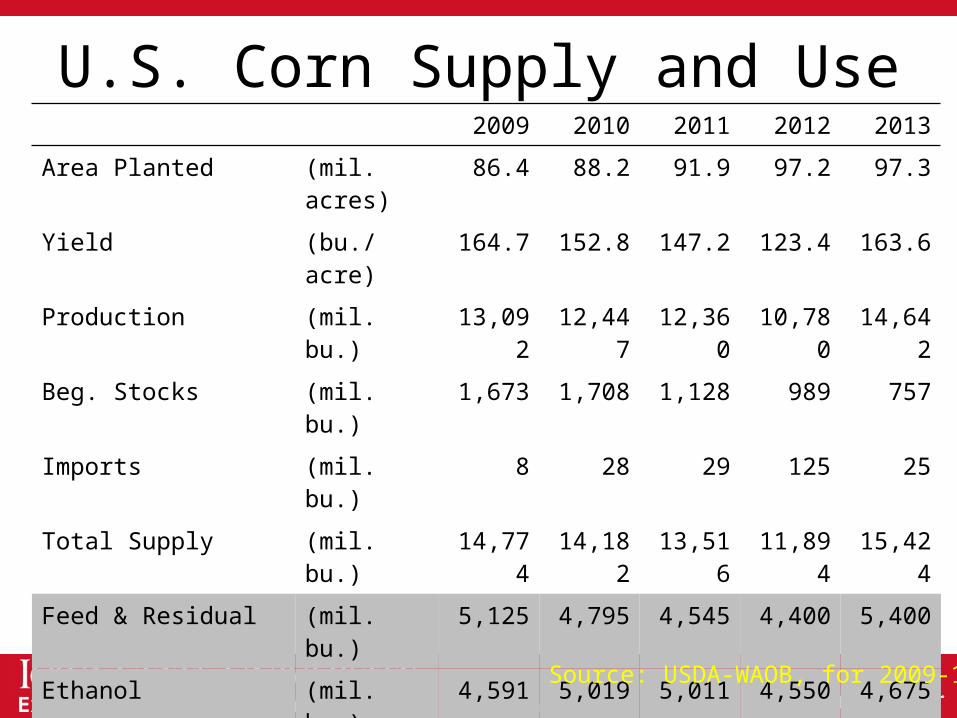
U.S. Corn Supply and Use2009 2010 2011 2012 2013
Area Planted (mil. acres) 86.4 88.2 91.9 97.2 97.3
Yield (bu./acre) 164.7 152.8 147.2 123.4 163.6
Production (mil. bu.) 13,092 12,447 12,360 10,780 14,642
Beg. Stocks (mil. bu.) 1,673 1,708 1,128 989 757
Imports (mil. bu.) 8 28 29 125 25
Total Supply (mil. bu.) 14,774 14,182 13,516 11,894 15,424
Feed & Residual (mil. bu.) 5,125 4,795 4,545 4,400 5,400
Ethanol (mil. bu.) 4,591 5,019 5,011 4,550 4,675
Food, Seed, & Other (mil. bu.) 1,370 1,407 1,428 1,387 1,435
Exports (mil. bu.) 1,980 1,834 1,543 800 1,500
Total Use (mil. bu.) 13,066 13,055 12,527 11,137 13,010
Ending Stocks (mil. bu.) 1,708 1,128 989 757 2,414
Season-Average Price ($/bu.) 3.55 5.18 6.22 6.90 4.80
Source: USDA-WAOB, for 2009-12

Extension and Outreach/Department of Economics
U.S. Soybean Supply and Use2009 2010 2011 2012 2013
Area Planted (mil. acres) 77.5 77.4 75.0 77.2 77.1
Yield (bu./acre) 44.0 43.5 41.9 39.6 44.5
Production (mil. bu.) 3,359 3,329 3,094 3,015 3,387
Beg. Stocks (mil. bu.) 138 151 215 169 125
Imports (mil. bu.) 15 14 16 20 15
Total Supply (mil. bu.) 3,512 3,495 3,325 3,204 3,527
Crush (mil. bu.) 1,752 1,648 1,703 1,635 1,660
Seed & Residual (mil. bu.) 110 130 90 95 135
Exports (mil. bu.) 1,499 1,501 1,362 1,350 1,500
Total Use (mil. bu.) 3,361 3,280 3,155 3,080 3,295
Ending Stocks (mil. bu.) 151 215 169 125 232
Season-Average Price ($/bu.) 9.59 11.30 12.50 14.30 10.50
Source: USDA-WAOB, for 2009-12

Extension and Outreach/Department of Economics
March 1 Corn Stocks
Trade Expectations = 5 billion bushels
Extension and Outreach/Department of Economics
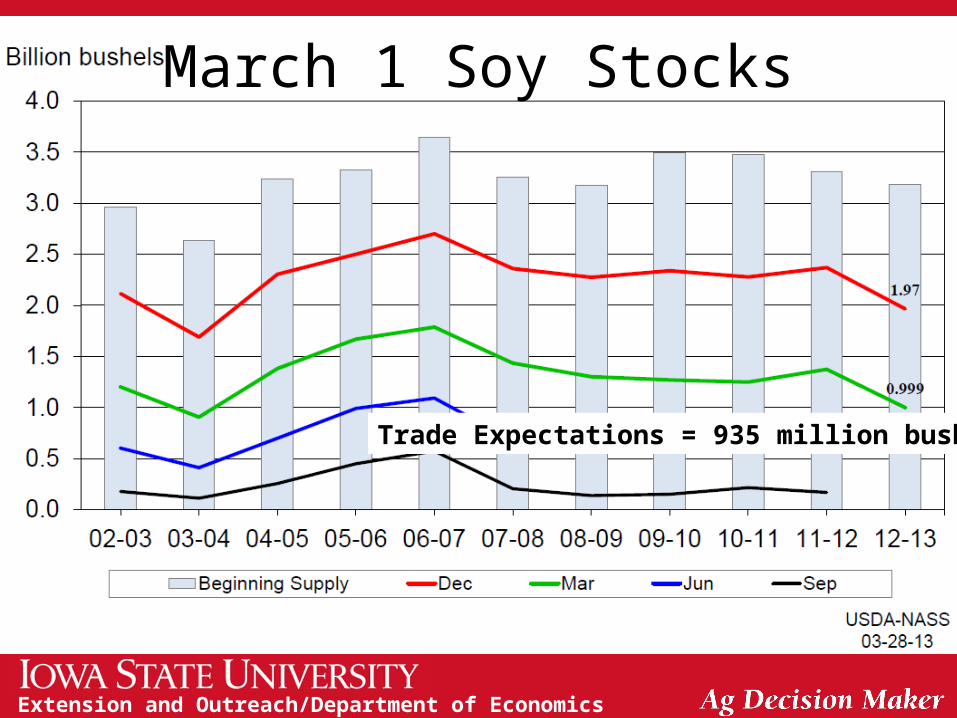
March 1 Soy Stocks
Trade Expectations = 935 million bushels
Extension and Outreach/Department of Economics
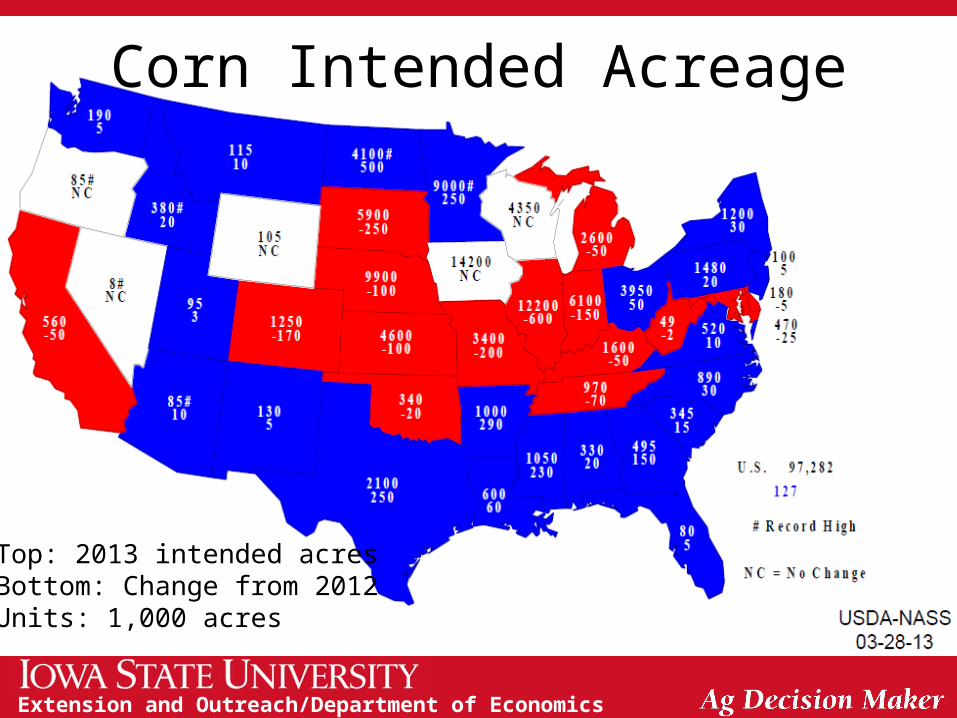
Corn Intended Acreage
Top: 2013 intended acresBottom: Change from 2012Units: 1,000 acres
Extension and Outreach/Department of Economics
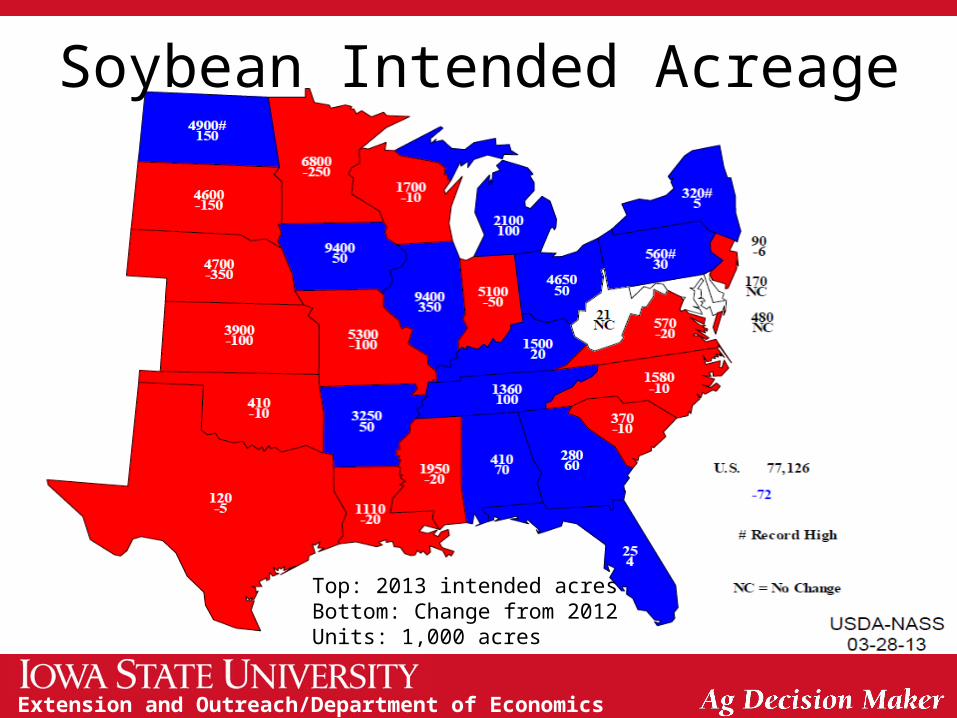
Soybean Intended Acreage
Top: 2013 intended acresBottom: Change from 2012Units: 1,000 acres

Extension and Outreach/Department of Economics
Total Intended Acreage
Top: 2013 intended acresBottom: Change from 2012Units: 1,000 acres
Extension and Outreach/Department of Economics
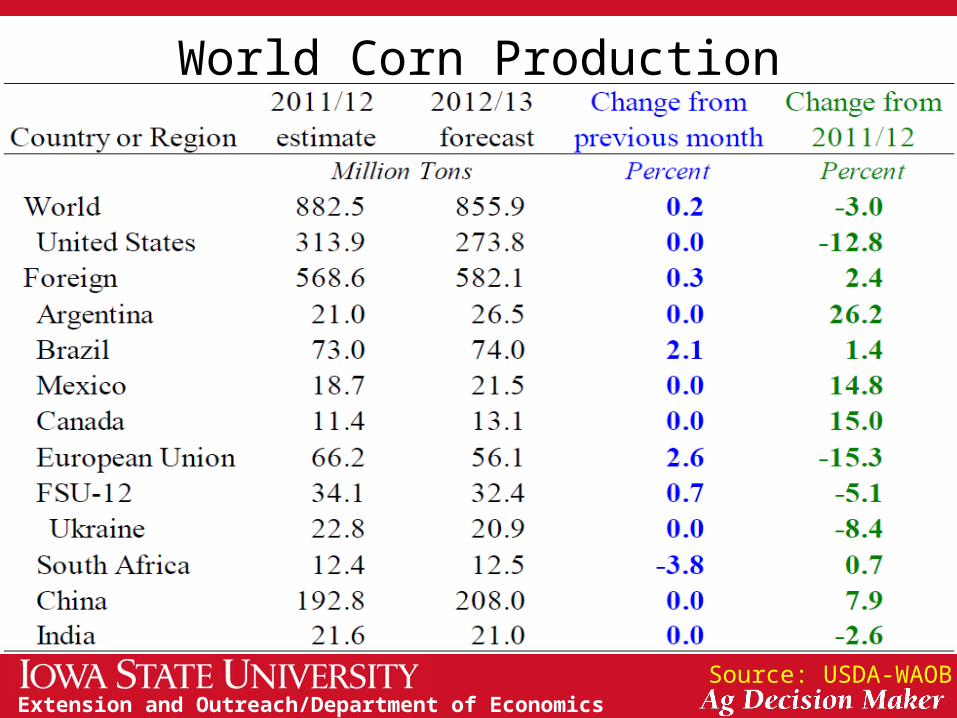
World Corn Production
Source: USDA-WAOB

Extension and Outreach/Department of Economics
World Soybean Production
Source: USDA-WAOB
Extension and Outreach/Department of Economics
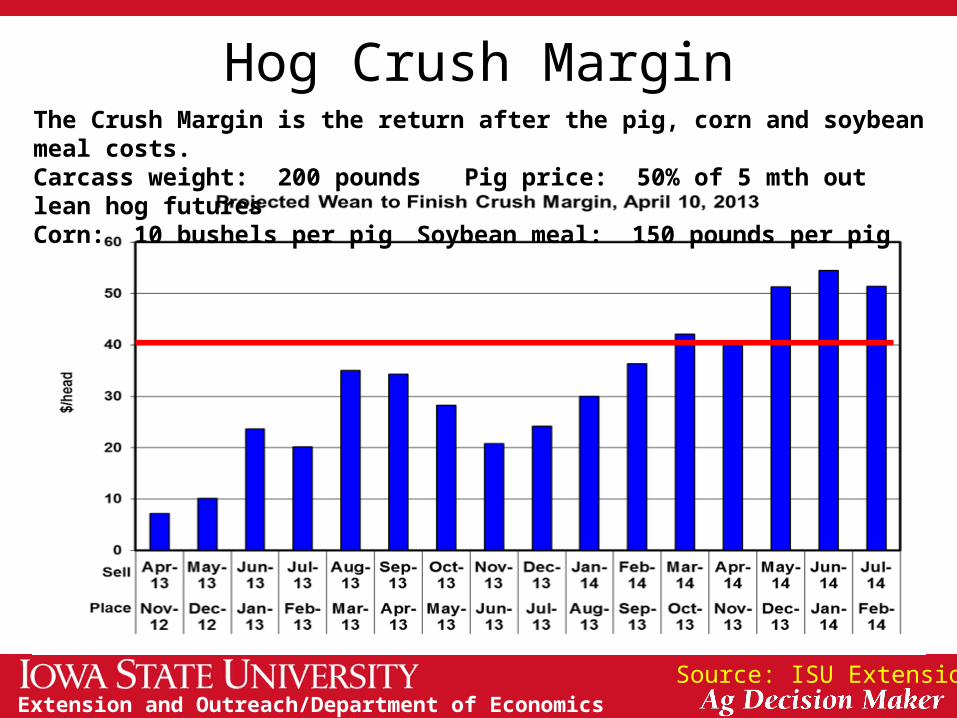
Hog Crush Margin
Source: ISU Extension
The Crush Margin is the return after the pig, corn and soybean meal costs.Carcass weight: 200 pounds Pig price: 50% of 5 mth out lean hog futuresCorn: 10 bushels per pig Soybean meal: 150 pounds per pig
Extension and Outreach/Department of Economics
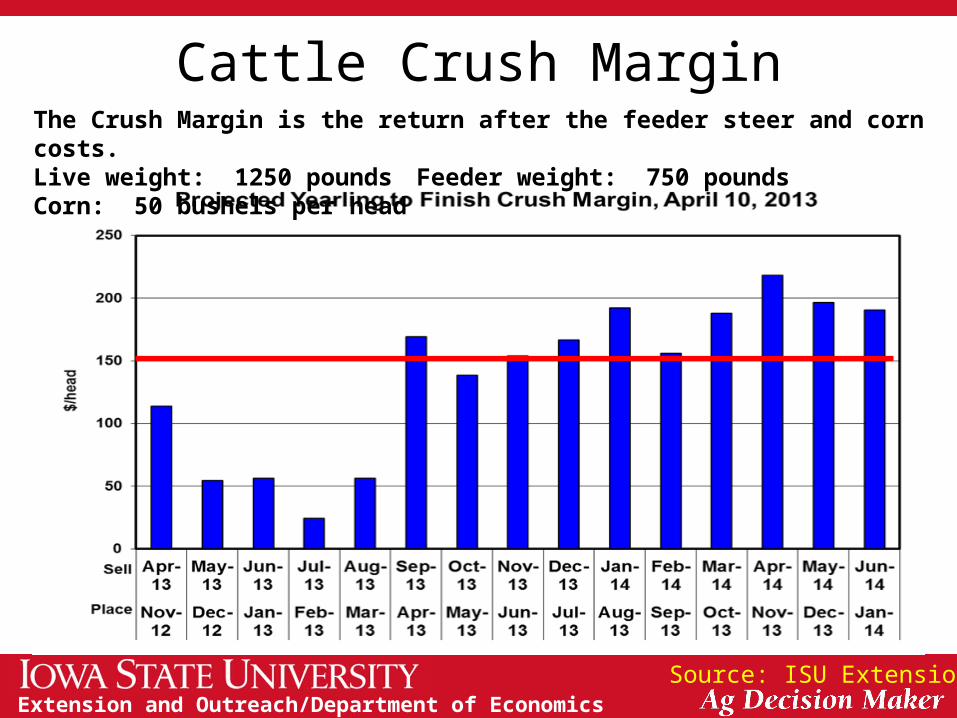
Cattle Crush Margin
Source: ISU Extension
The Crush Margin is the return after the feeder steer and corn costs.Live weight: 1250 pounds Feeder weight: 750 pounds Corn: 50 bushels per head

Extension and Outreach/Department of Economics
U.S. Meat Production & Prices
Source: USDA-WAOB
Extension and Outreach/Department of Economics
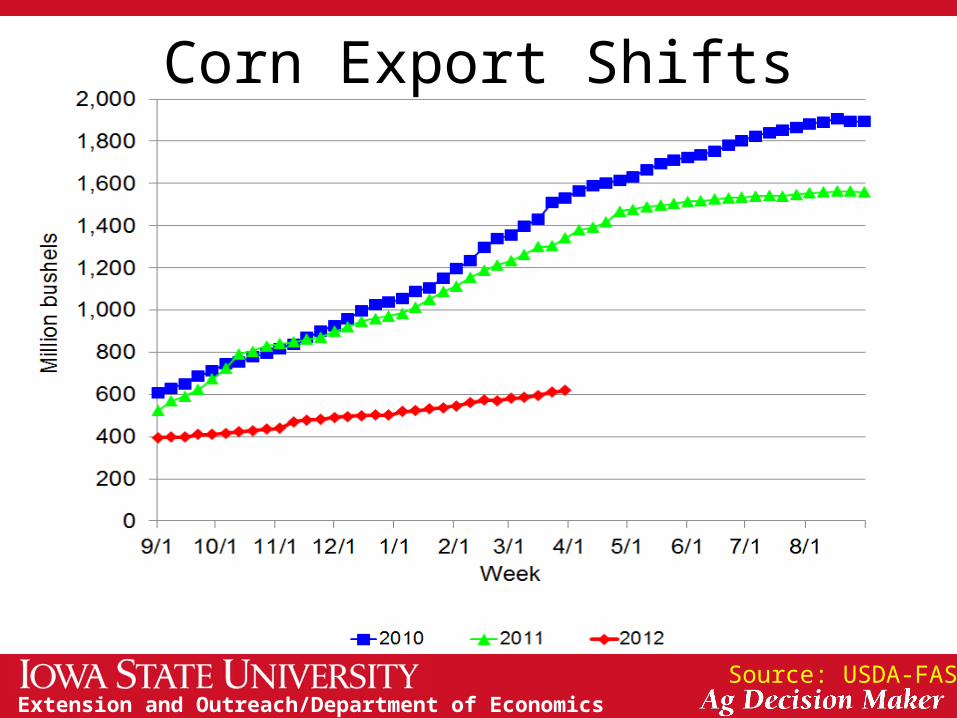
Corn Export Shifts
Source: USDA-FAS
Extension and Outreach/Department of Economics
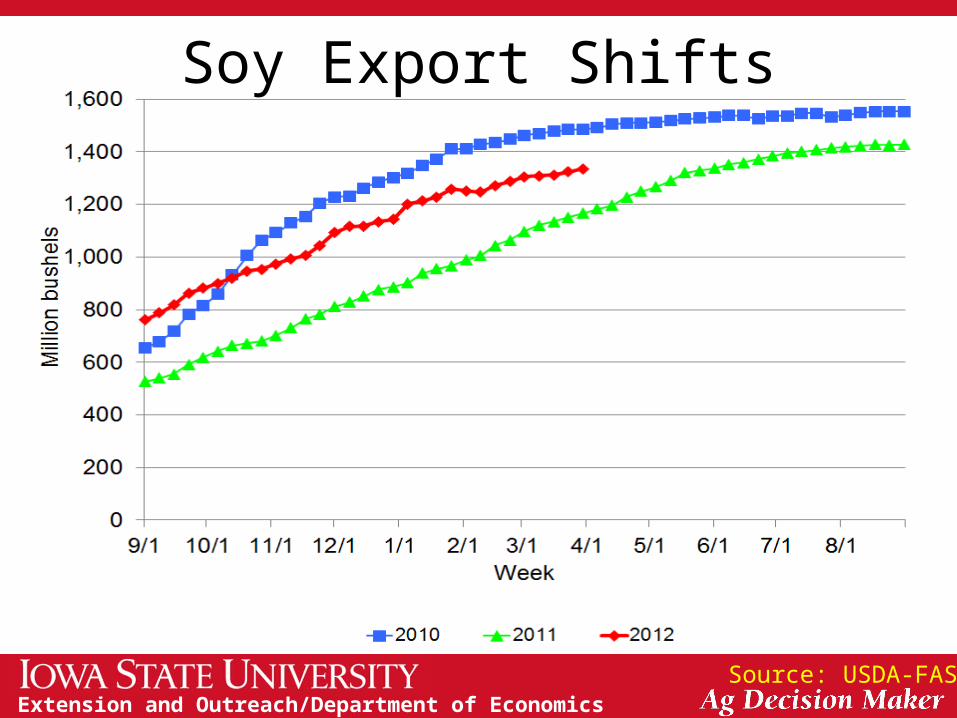
Soy Export Shifts
Source: USDA-FAS
Extension and Outreach/Department of Economics
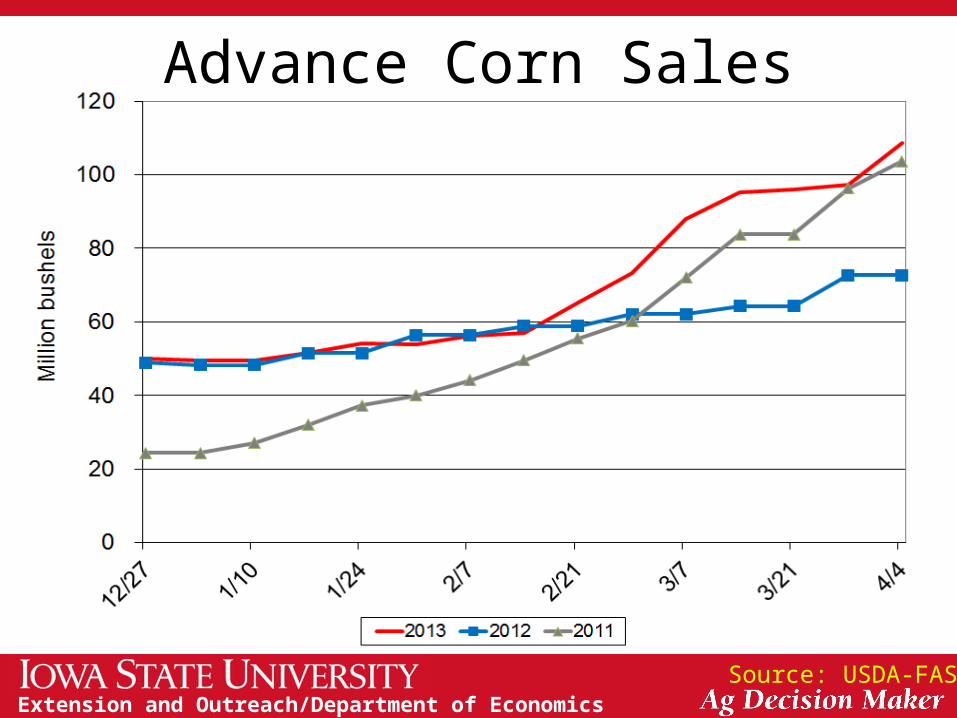
Advance Corn Sales
Source: USDA-FAS
Extension and Outreach/Department of Economics
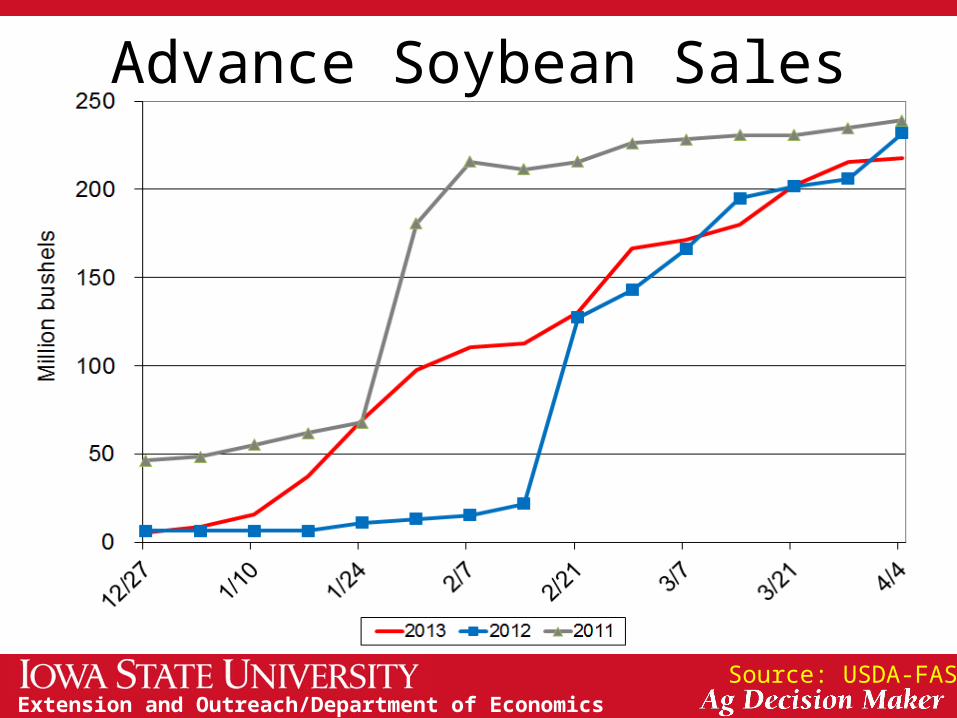
Advance Soybean Sales
Source: USDA-FAS
Extension and Outreach/Department of Economics
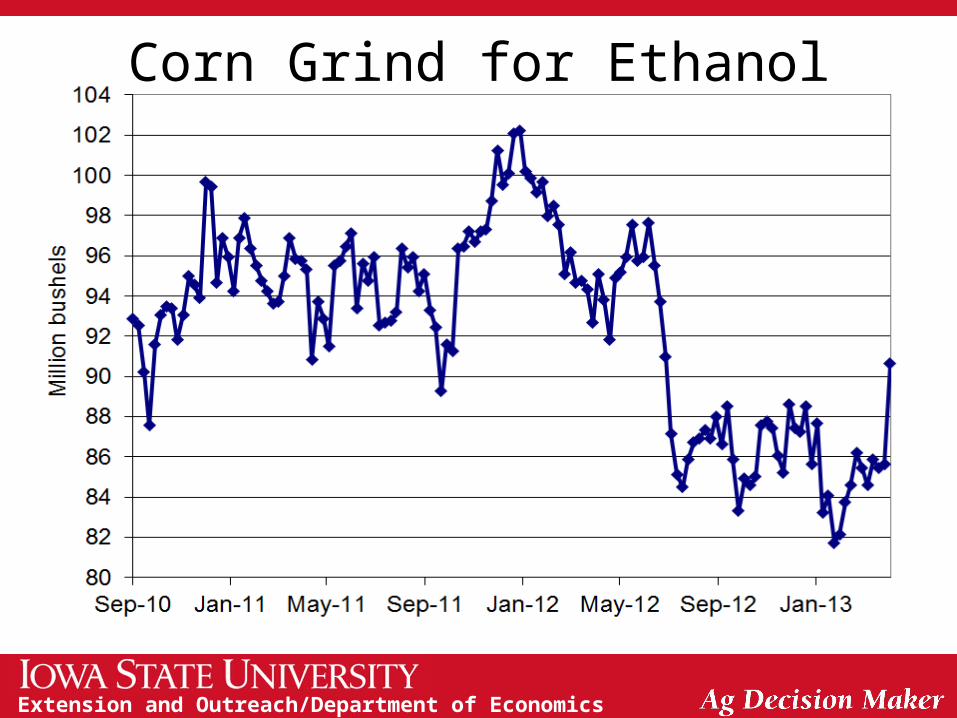
Corn Grind for Ethanol
Extension and Outreach/Department of Economics
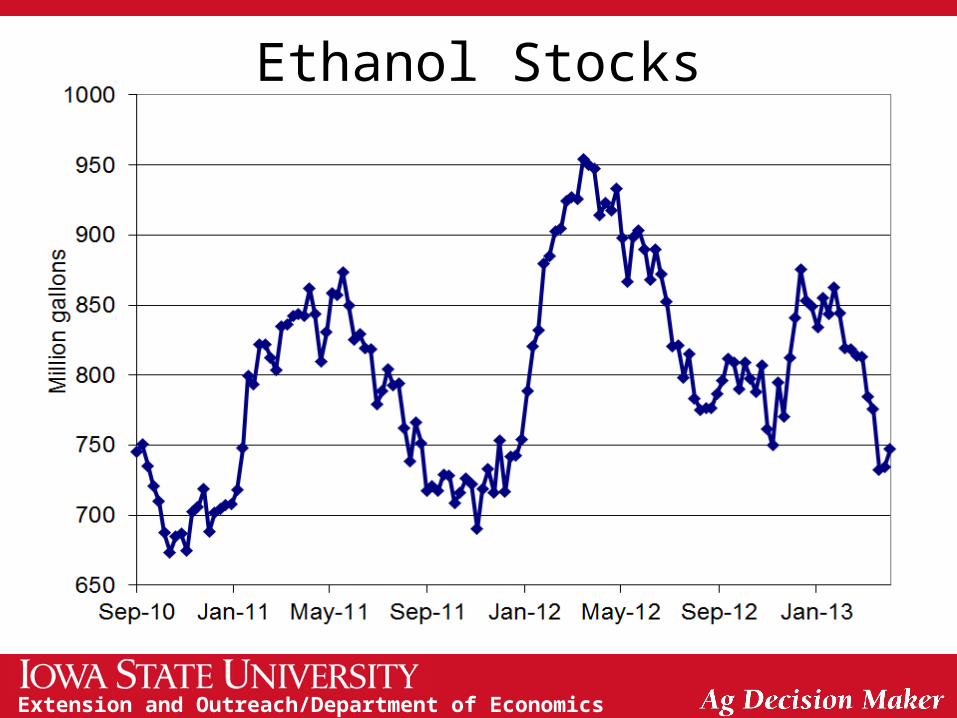
Ethanol Stocks

Extension and Outreach/Department of Economics
Current Corn Futures
Source: CME Group, 4/11/2013
5.11 5.08
Extension and Outreach/Department of Economics
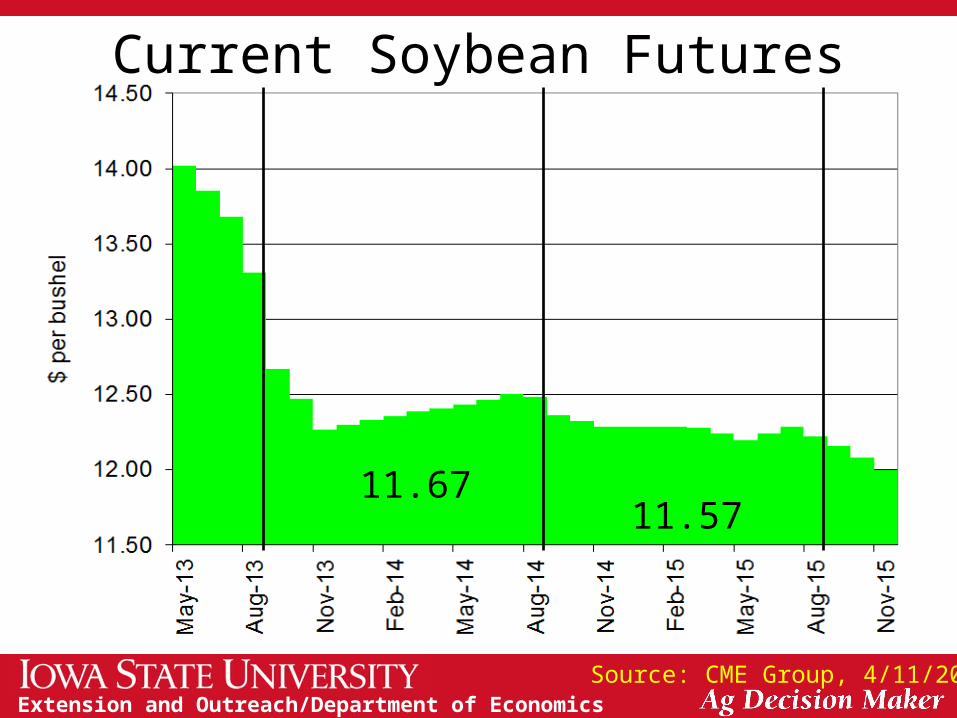
Current Soybean Futures
Source: CME Group, 4/11/2013
11.6711.57

Extension and Outreach/Department of Economics
Corn Prices vs. Costs

Extension and Outreach/Department of Economics
Soy Prices vs. Costs
Extension and Outreach/Department of Economics

Extension and Outreach/Department of Economics
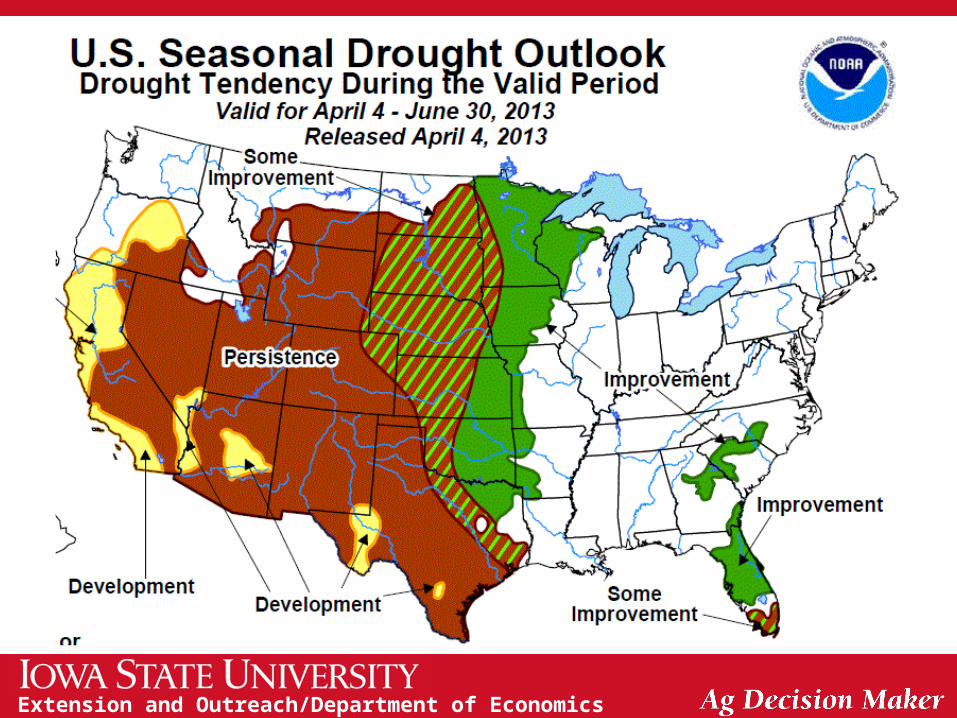
3 Month Outlook - Precip
Extension and Outreach/Department of Economics
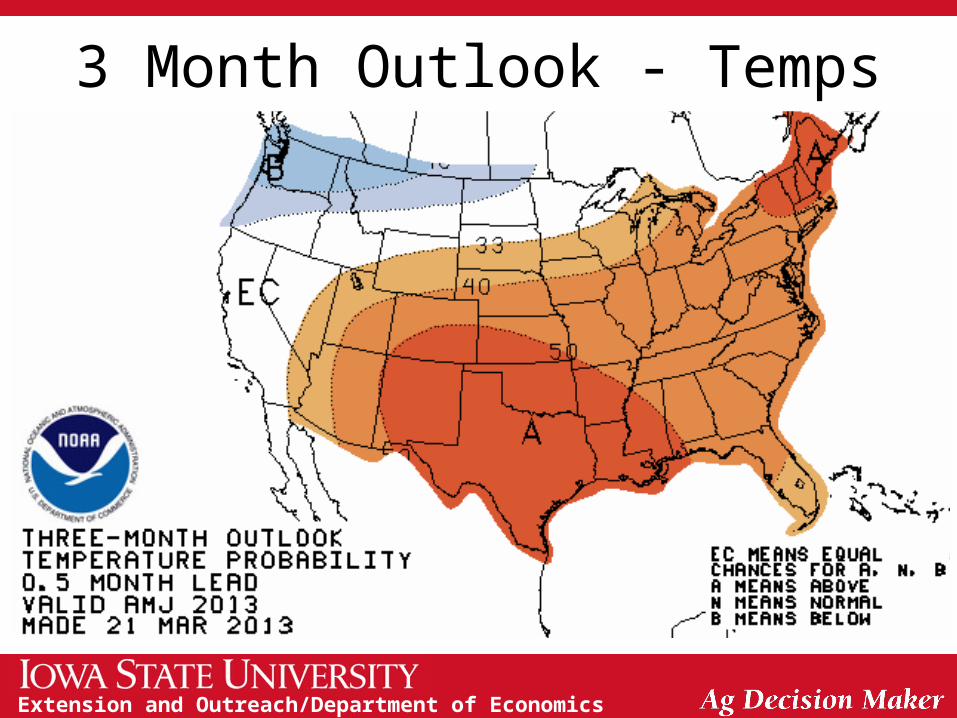
3 Month Outlook - Temps
Extension and Outreach/Department of Economics
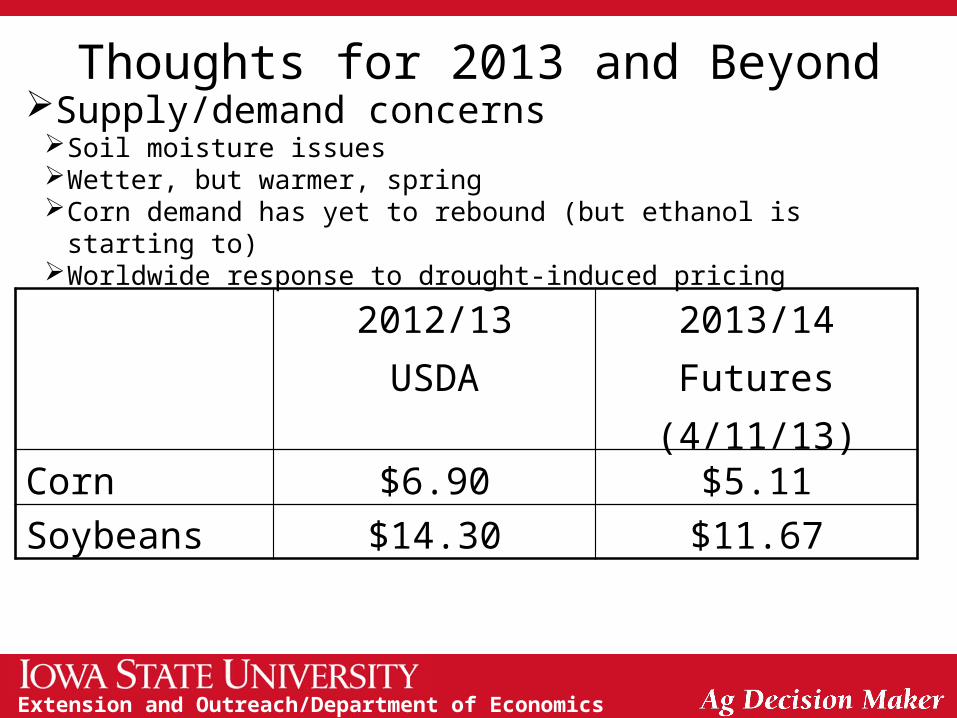
Thoughts for 2013 and BeyondSupply/demand concernsSoil moisture issuesWetter, but warmer, springCorn demand has yet to rebound (but ethanol is starting to)Worldwide response to drought-induced pricing
2012/13USDA
2013/14Futures(4/11/13)
Corn $6.90 $5.11
Soybeans $14.30 $11.67
Extension and Outreach/Department of Economics
Thank you for your time!
Any questions?
My web site:http://www.econ.iastate.edu/~chart/
Iowa Farm Outlook:http://www.econ.iastate.edu/ifo/
Ag Decision Maker:http://www.extension.iastate.edu/agdm/