2013 comd fertilizer_presentation
TRANSCRIPT

Global Fertilizer Market OutlookScotiabank Commodities Outlook Conference
Toronto, January 2013
Dr. Peter HarrissonConsultant, Fertilizers
: +44 207 903 2249: [email protected]
: www.crugroup.com
2
Presentation overview
Introduction to N, P & K markets
How do agricultural market interact with fertilizer markets?
Fertilizer affordability in India
Supply side response to high prices
Points to watch across N, P & K
Nutrient outlook in summary
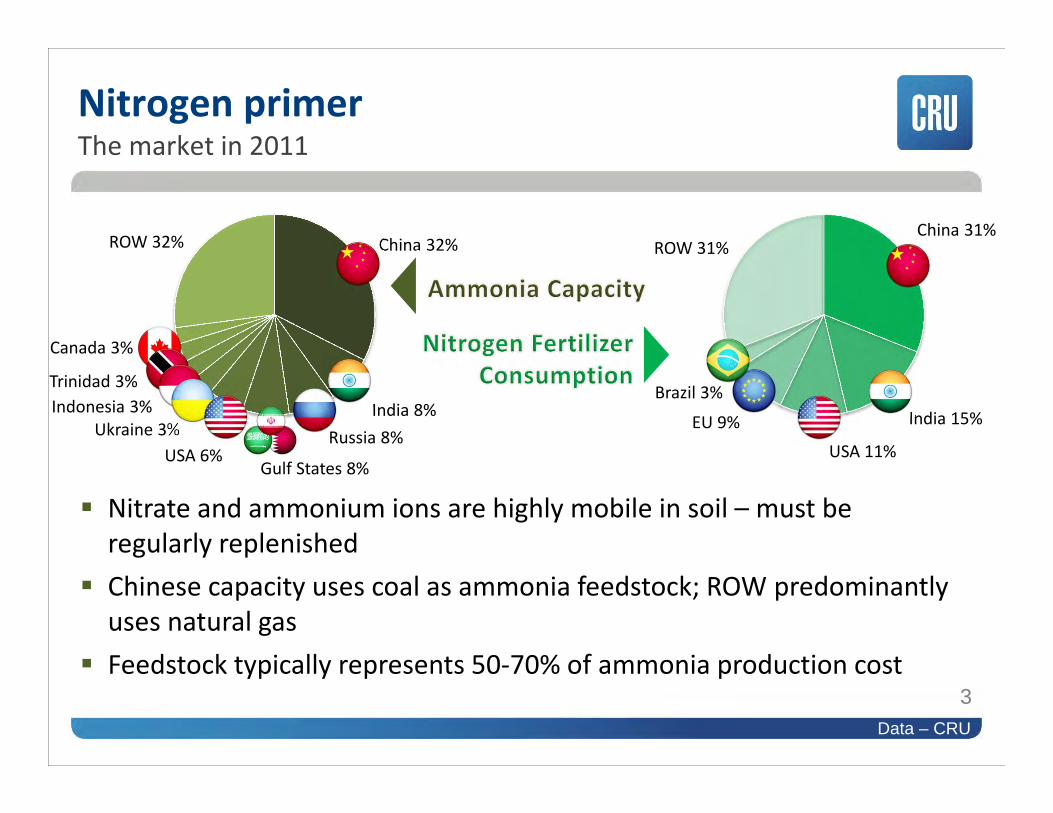
Nitrate and ammonium ions are highly mobile in soil – must be regularly replenished
Chinese capacity uses coal as ammonia feedstock; ROW predominantly uses natural gas
Feedstock typically represents 50‐70% of ammonia production cost
Nitrogen primerThe market in 2011
3
China 32%
India 8%
USA 6%Russia 8%
Indonesia 3%Ukraine 3%
Trinidad 3%
Canada 3%
Gulf States 8%
ROW 32% ROW 31%China 31%
India 15%
USA 11%EU 9%
Brazil 3%
Data – CRU

75% of identified phosphate rock reserves are in Morocco (IFDC 2011 estimate)
Producers may be vertically integrated or purchase phosphate rock and/or phosphoric acid
China and USA are largely self‐sufficient, India is major importer
Phosphate primerThe market in 2011
4
China 33%
USA 14%Morocco 15%Russia 5%
Tunisia 4%
Brazil 3%
China 30%
India 16%
USA 10%Brazil 9%
Saudi Arabia 3%
ROW 24% ROW 35%
Data – CRU

Cereals require less K than N & P, some crops like sugar cane and oil palm require high K
Little overlap between areas of high production and areas of high demand Canpotex and BPC handle 60‐70% of seaborne trade
Potash primerThe market in 2011
5
Canada 35%
Russia 17%Belarus 11%
USA 16%
Brazil 15%
China 19%
Germany 7%
Israel 6%
China 6%
Jordan 4%
India 8%EU 11%
Indonesia &Malaysia 9%
ROW 14%ROW 22%
Data – CRU

6million tonnes nutrient
0
5
10
15
20
N P K
0
5
10
15
20
N P K
0
5
10
15
20
N P K
0
5
10
15
20
N P K
0
10
20
30
40
50
N P K
Brazil
USA
Europe
India
China
China28%
India16%
USA12%
EU10%
Brazil6%
ROW28%
Total fertilizer demand by region
Fertilizer demand by region>70% fertilizer consumption is in China, India, USA, Europe and Brazil
Data – CRU
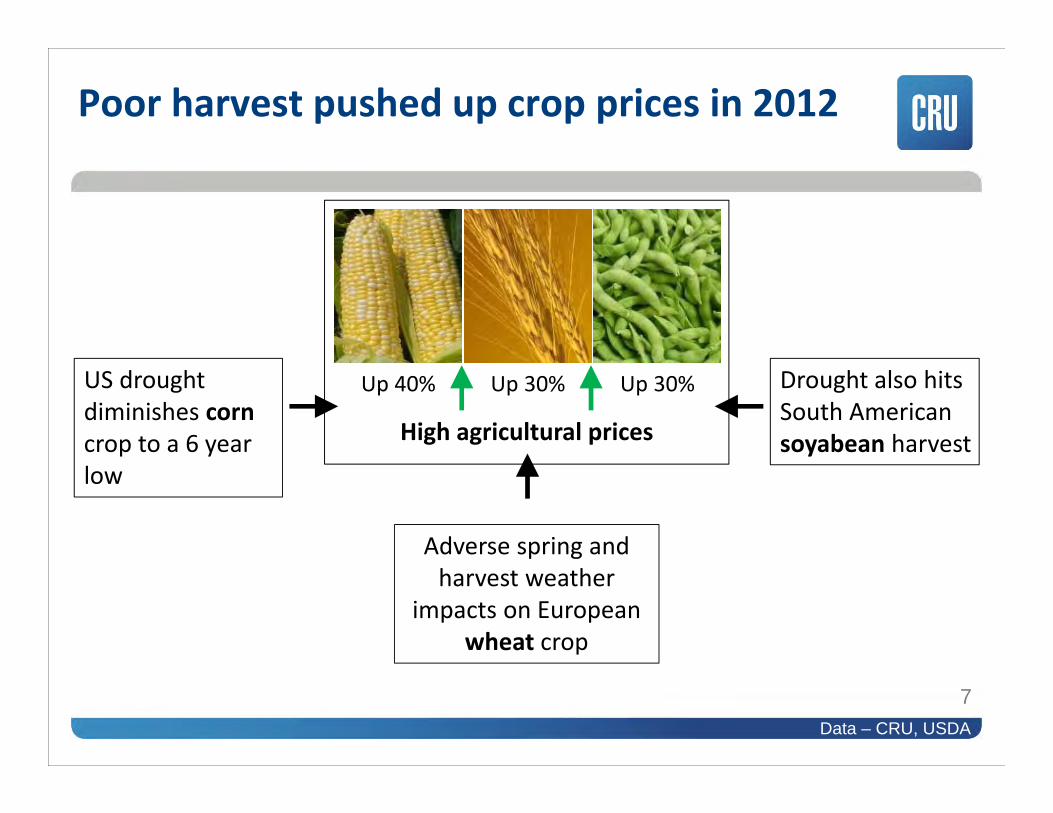
Poor harvest pushed up crop prices in 2012
7
US drought diminishes corn crop to a 6 year low
Drought also hits South American soyabean harvest
Adverse spring and harvest weather
impacts on European wheat crop
High agricultural prices
Up 40% Up 30% Up 30%
Data – CRU, USDA

8
United States2012 defined by drought
At the peak 80% of USA abnormally dry with >60% in drought
0
20
40
60
80
100
%
US drought area
Data – USDA

9
What is the impact on 2013? High corn plantings to trigger high application, particularly for N Increased crop areas expected to outweigh nutrient build up in soil
APPARENT DEMANDH1 2012 vs. H1 2011
Urea/Ammonia -2%
DAP -7%
MOP -28%
United States2012 defined by drought
01020304050607080
May Jun Jul Aug Sep Oct
%
Corn crop rating (% Good-Excellent)
2011 2012 5-yr ave
Data –CRU, USDA
10
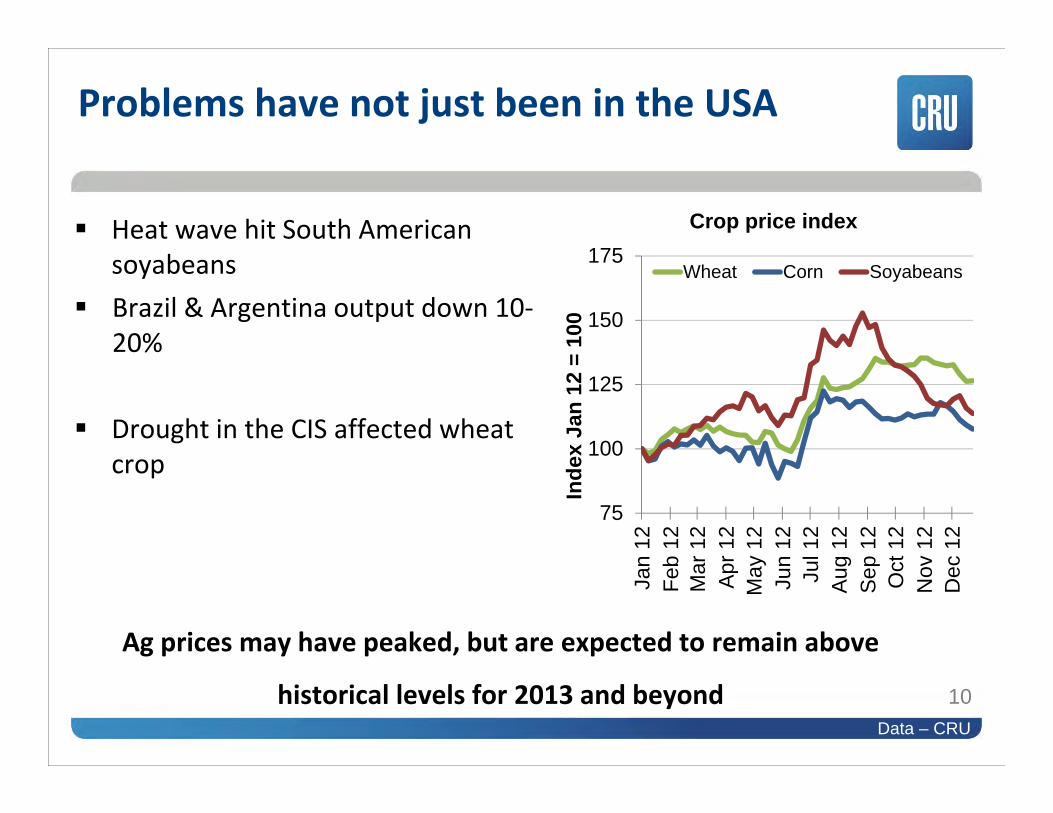
Heat wave hit South American soyabeans
Brazil & Argentina output down 10‐20%
Drought in the CIS affected wheat crop
Ag prices may have peaked, but are expected to remain above
historical levels for 2013 and beyond
Problems have not just been in the USA
75
100
125
150
175
Jan
12Fe
b 12
Mar
12
Apr
12
May
12
Jun
12Ju
l 12
Aug
12
Sep
12
Oct
12
Nov
12
Dec
12
Inde
x Ja
n 12
= 1
00
Crop price index
Wheat Corn Soyabeans
Data – CRU

50
100
150
200
250
300
350
400
2003
2004
2005
2006
2007
2008
2009
2010
2011
2012
Jan
2006
= 1
00
Fertilizer Affordability Indices
Index of Crop Prices Index of Fertilizer Prices
Correlation 80%
2003-06 “normal” but balances tightening & prices trending up
Markets move to a new “normal”
Drought in the Americas
Fertilizer prices follow crop pricesHave crop and fertilizer markets moved to a new “normal”?
11Data – CRU
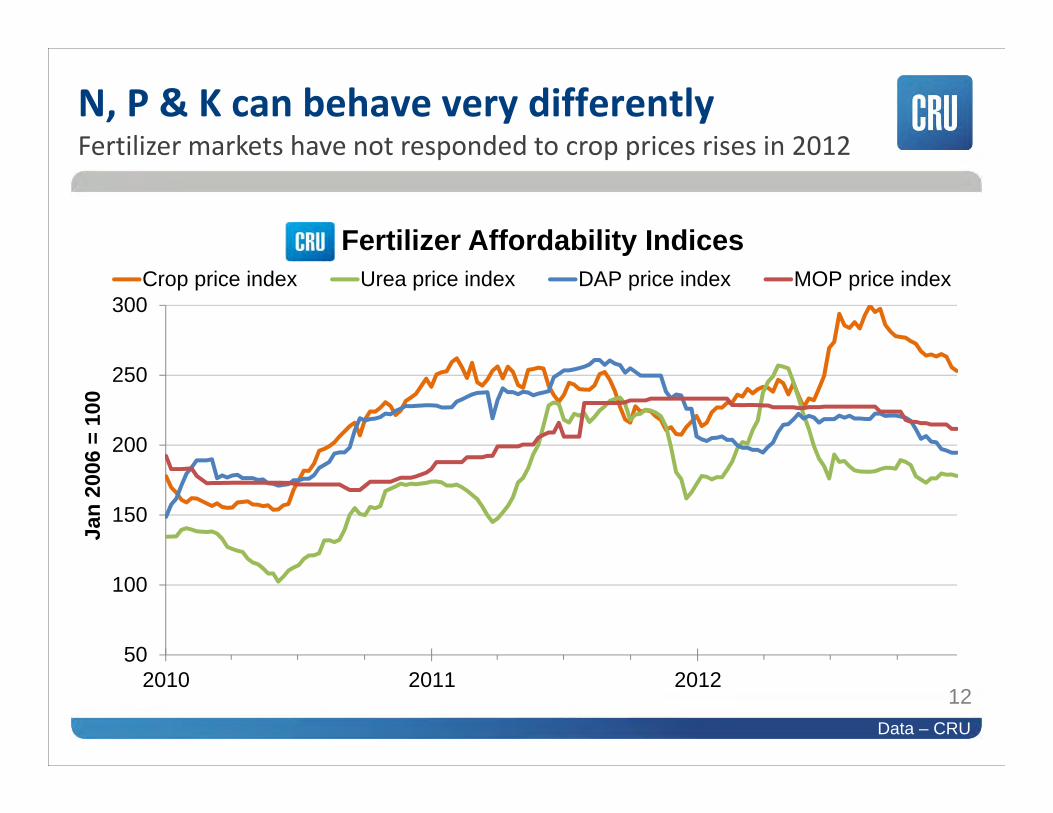
50
100
150
200
250
300
2010 2011 2012
Jan
2006
= 1
00
Fertilizer Affordability IndicesCrop price index Urea price index DAP price index MOP price index
12
N, P & K can behave very differentlyFertilizer markets have not responded to crop prices rises in 2012
Data – CRU
13
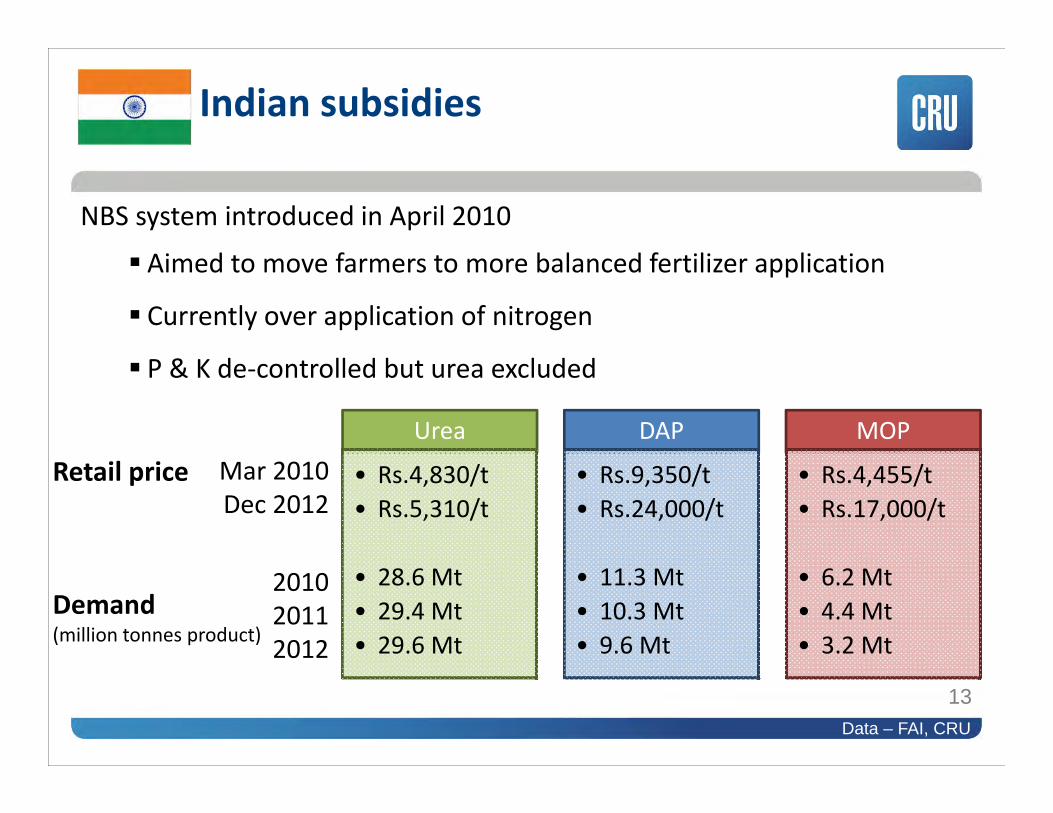
NBS system introduced in April 2010
Aimed to move farmers to more balanced fertilizer application
Currently over application of nitrogen
P & K de‐controlled but urea excluded
Urea
• Rs.4,830/t• Rs.5,310/t
• 28.6 Mt• 29.4 Mt• 29.6 Mt
DAP
• Rs.9,350/t• Rs.24,000/t
• 11.3 Mt• 10.3 Mt• 9.6 Mt
MOP
• Rs.4,455/t• Rs.17,000/t
• 6.2 Mt• 4.4 Mt• 3.2 Mt
201020112012
Mar 2010Dec 2012
Retail price
Demand(million tonnes product)
Indian subsidies
Data – FAI, CRU

14
What are the solutions? Lower import prices Higher or rebalanced government
subsidy Stronger Rupee
How much does the Indian farmer pay?What is the future for the subsidy regime?
What are the problems? P & K unaffordable in relation to N Farmers pushed towards buying
urea over DAP & MOP Reduced P & K application not
sustainable in the medium term
Urea DAP MOPIndia CFR
(December 2012) $400/t $580/t $490/t
Price to farmer(December 2012) $100/t $400/t $300/t
Data – CRU Fertilizer Week

50
52
54
56
58
60
2011 2012 2013 2014 2015
million tonn
es DAP
Existing China Saudi Arabia Morocco
15
150
160
170
180
190
200
210
220
230
2011 2012 2013 2014 2015
million tonn
es urea
Existing China MENA ROW
50
55
60
65
70
75
80
85
90
2011 2012 2013 2014 2015
million tonn
es KCl
Existing Canada Russia ROW
26%additional
capacity by 2015
53%share of new capacity in
Canada
MOPDAPUrea
28%additional
capacity by 2015
57%share of new capacity in
China
9%additional
capacity by 2015
Morocco
No net capacity
gain outside China, Saudi
Arabia & Morocco
Supply side response to high pricesCapacity addition greatest in N & K
Data – CRU
16
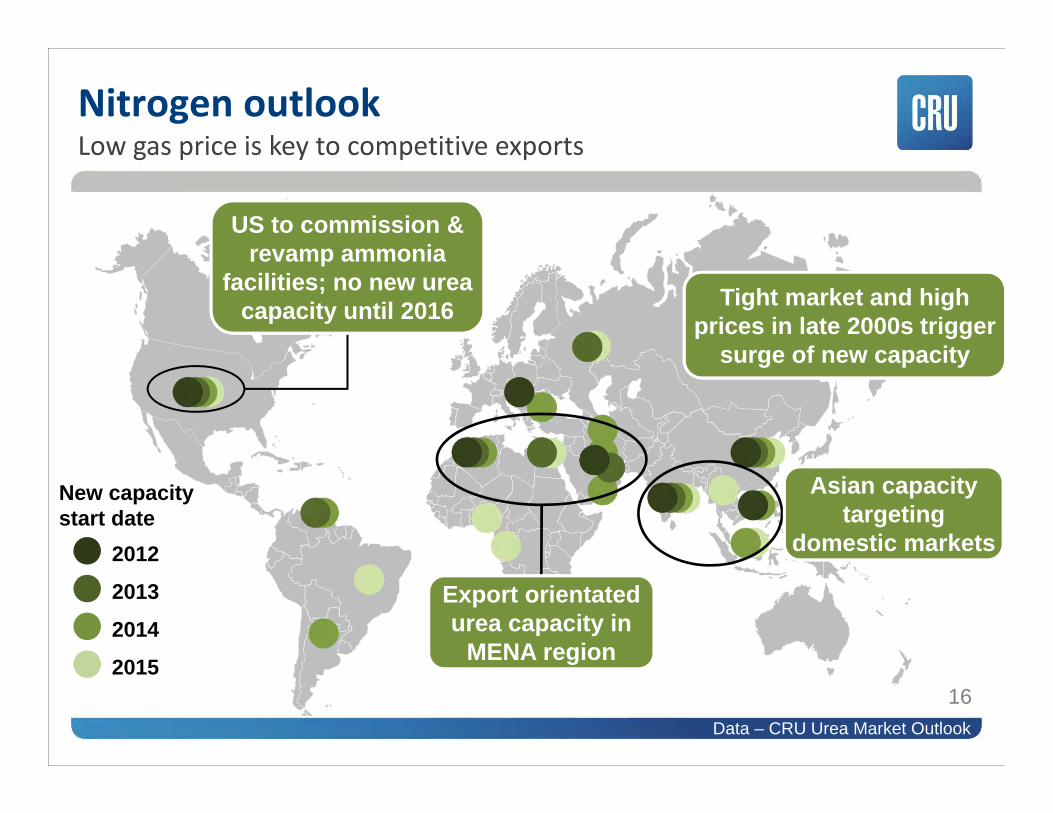
Nitrogen outlookLow gas price is key to competitive exports
2012
2013
2014
2015
Tight market and high prices in late 2000s trigger
surge of new capacity
US to commission & revamp ammonia
facilities; no new urea capacity until 2016
Export orientated urea capacity in
MENA region
Asian capacity targeting
domestic markets
New capacity start date
Data – CRU Urea Market Outlook
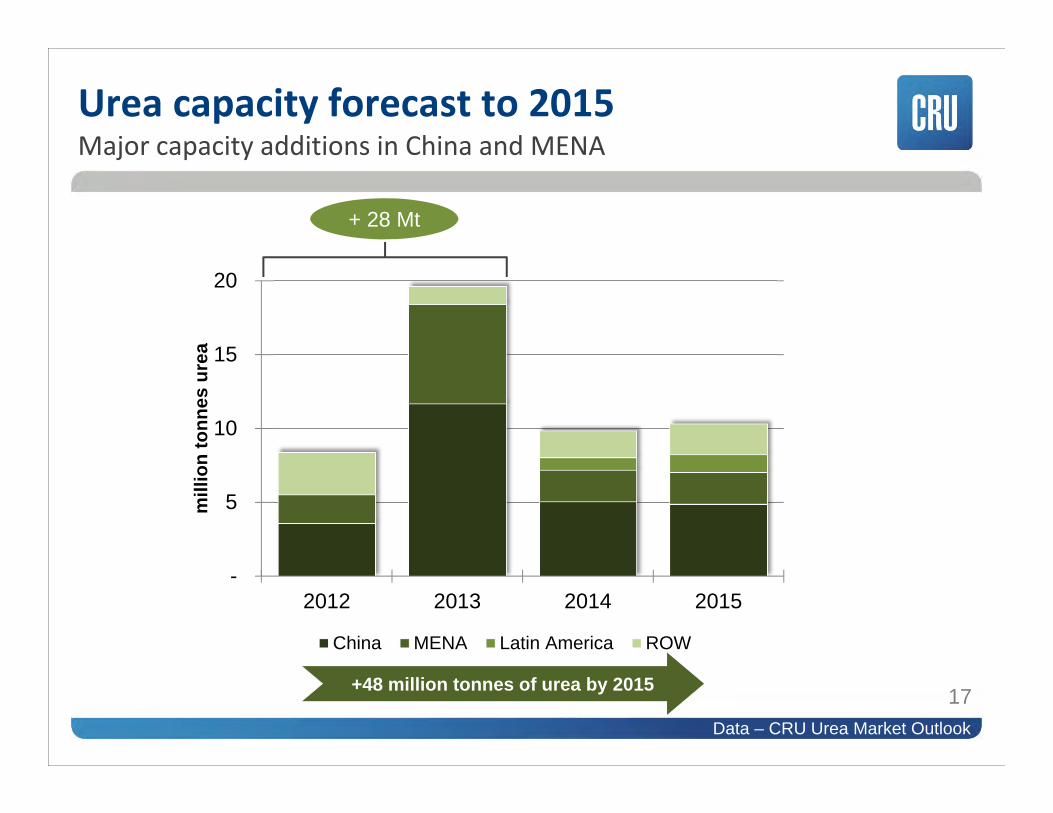
-
5
10
15
20
2012 2013 2014 2015
mill
ion
tonn
es u
rea
China MENA Latin America ROW
17+48 million tonnes of urea by 2015
+ 28 Mt
Urea capacity forecast to 2015Major capacity additions in China and MENA
Data – CRU Urea Market Outlook

18
List of Potential New ProjectsUS Import Dependence
15.8 Mtof major N fertilizers
importedin 2011
OCI / Iowa Fertilizer Company (IFCo) (2015)Summit’s Texas Clean Energy Project (TCEP) (2015)Ohio Valley Resources (OVR) (2016)CHS Inc (2017)JV between IFFCO, KIT, and a Canadian partner (2017)Dyno Nobel / Incitec Pivot (2018)
Rentech Nitrogen (2013)PCS (2014)CF Industries (2015)Yara (2016)
+ expansions and re‐starts
5.5 Mturea
US shale gas Can the US move towards Nitrogen self‐sufficiency?
3.0 million t/y N capacity added by 2015; 4.0 million t/y by 2017
Data – CRU Urea Market Outlook
19
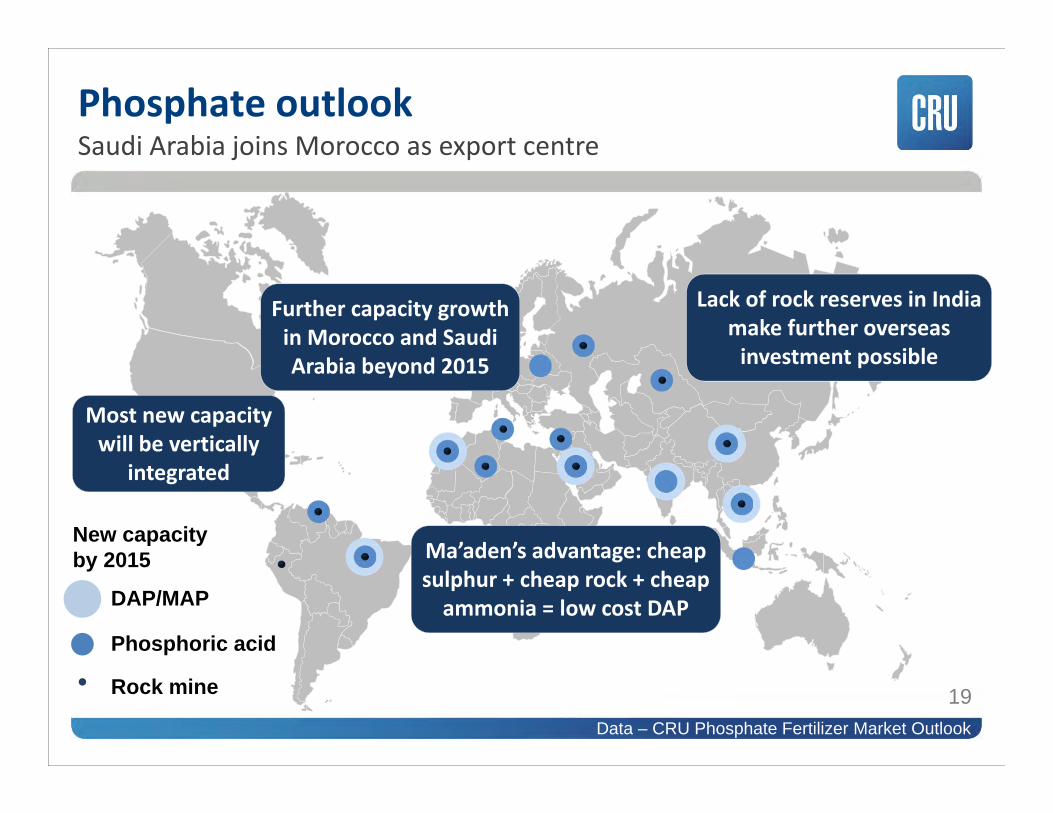
DAP/MAP
Phosphoric acid
Rock mine
New capacity by 2015
Phosphate outlookSaudi Arabia joins Morocco as export centre
Most new capacity will be vertically
integrated
Further capacity growth in Morocco and Saudi Arabia beyond 2015
Lack of rock reserves in India make further overseas investment possible
Ma’aden’s advantage: cheap sulphur + cheap rock + cheap ammonia = low cost DAP
Data – CRU Phosphate Fertilizer Market Outlook
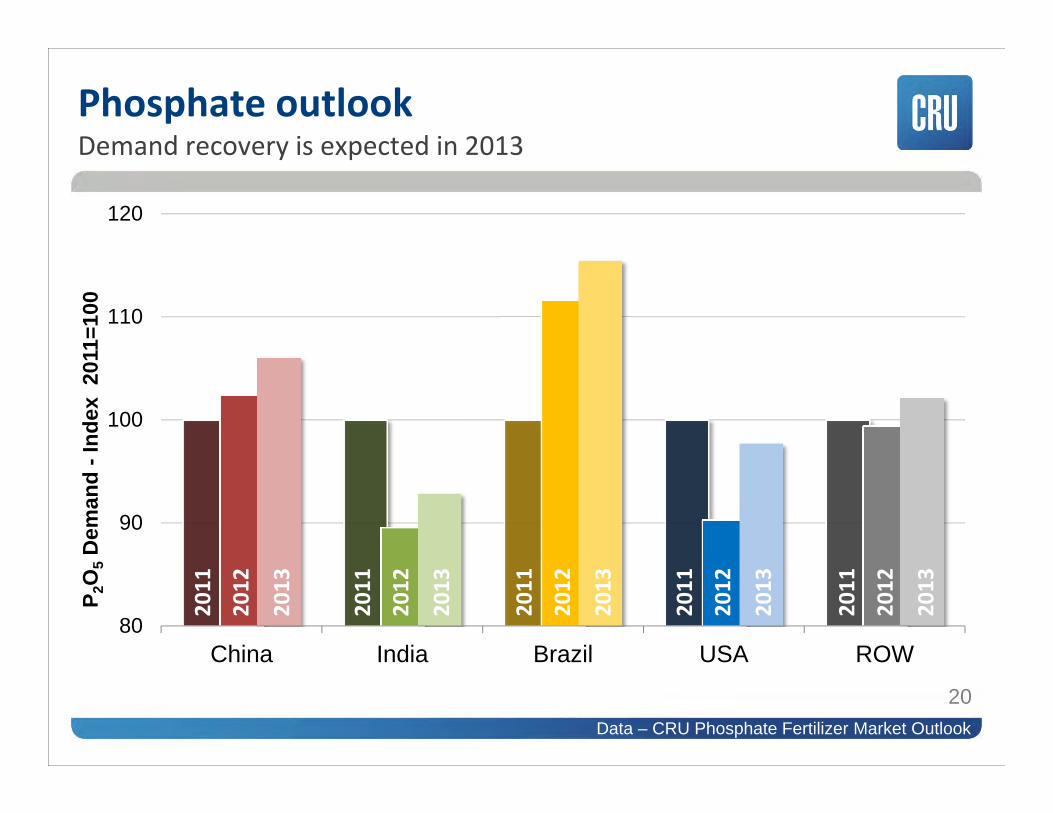
80
90
100
110
120
China India Brazil USA ROW
P 2O
5D
eman
d -I
ndex
201
1=10
0
20
Phosphate outlookDemand recovery is expected in 2013
2011
2012
2013
2011
2012
2013
2011
2012
2013
2011
2012
2013
2011
2012
2013
Data – CRU Phosphate Fertilizer Market Outlook

20
30
40
50
60
70
2001 2002 2003 2004 2005 2006 2007 2008 2009 2010 2011 2012 2013 2014 2015
million tonn
es KCl
KCl deliveries
21
Potash outlookHigh prices have had a dampening effect on demand
no net growth
Data – CRU Potassium Chloride Market Outlook

22
Potash outlookHigh prices have had a dampening effect on demand
• Prices have fallen back which should aid demand
• China H1 2013 contract price down by $70/t to $400/t CFR
• Forecast is based on return to growth (agricultural requirements win out)
• Risk that prices will continue to depress growth e.g. India
20
30
40
50
60
70
2001 2002 2003 2004 2005 2006 2007 2008 2009 2010 2011 2012 2013 2014 2015
million tonn
es KCl
KCl deliveries
no net growth
Data – CRU Potassium Chloride Market Outlook

23
50
60
70
80
90
2011 2012 2013 2014 2015
million tonn
es KCl
Existing Brownfield Greenfield
15% of additions are in greenfield
85% of additions are brownfield
Capacity forecast indicates extra 17million t/y capacity by 2015
Major greenfield projects are under construction with commissioning
after 2015
Potash outlookBrownfield capacity additions in the near term
Data – CRU Potassium Chloride Market Outlook

24
Cereals outlook is positive for N demandN : P/K ratios have risen amid volatile fertilizer prices
Major urea capacity additions in MENA & China High cost areas (e.g. Europe) to come under cost pressureGlobal operating rates projected to fall 86%75% Prices forecast to fall towards SRMC: Urea $350/t FOB Limited addition to ammonia capacity
Policy changes are a significant risk to the outlook China export tariffs Indian urea subsidy reform Indian embargo on Iranian exports
Nitrogen points to watch

25
Indian subsidy issues of major significance Largest global DAP importer Phosphoric acid contract to India agreed at $770/t CFR, down $85/t DAP price not yet agreed but recent spot sale at $535/t CFR India (Jan 2012) How far will demand recover in 2013?
Slower capacity growth than N & KOCP in powerful position – now joined by Ma’adenUS market supply stable but concerns over rock resources
Prices turning upwards in 2013 if India turns round
Phosphate points to watch
26
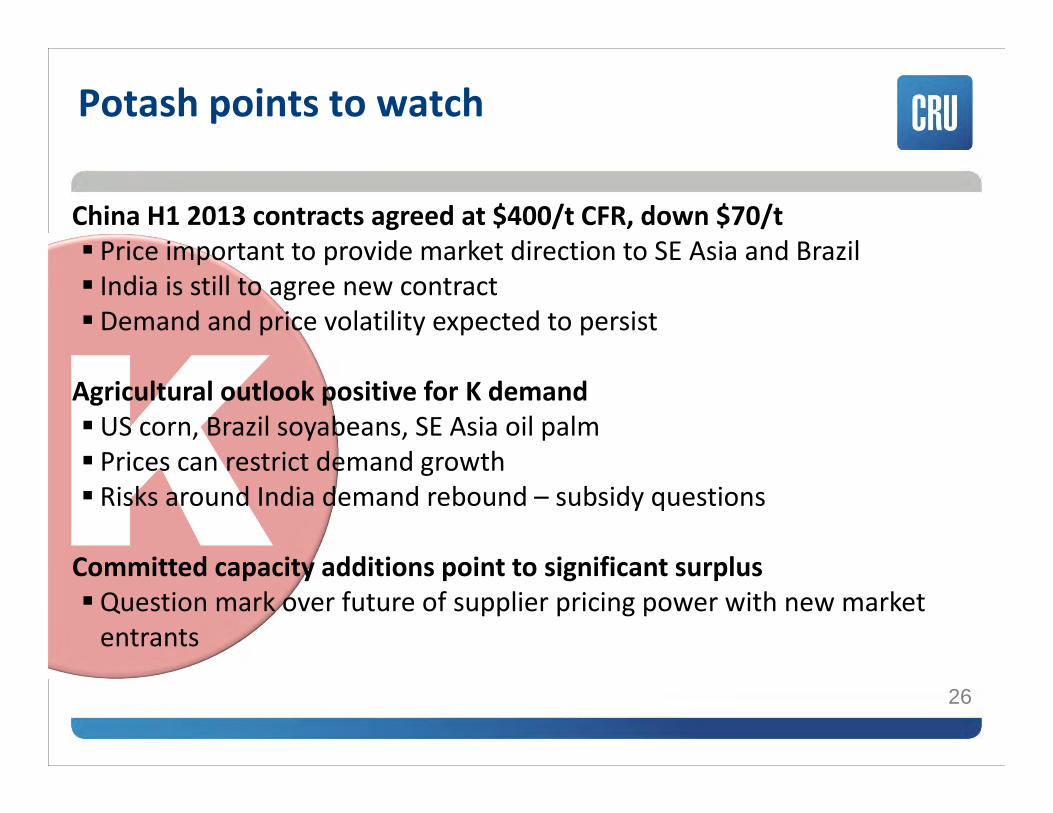
China H1 2013 contracts agreed at $400/t CFR, down $70/t Price important to provide market direction to SE Asia and Brazil India is still to agree new contract Demand and price volatility expected to persist
Agricultural outlook positive for K demandUS corn, Brazil soyabeans, SE Asia oil palm Prices can restrict demand growth Risks around India demand rebound – subsidy questions
Committed capacity additions point to significant surplusQuestion mark over future of supplier pricing power with new market entrants
Potash points to watch
27
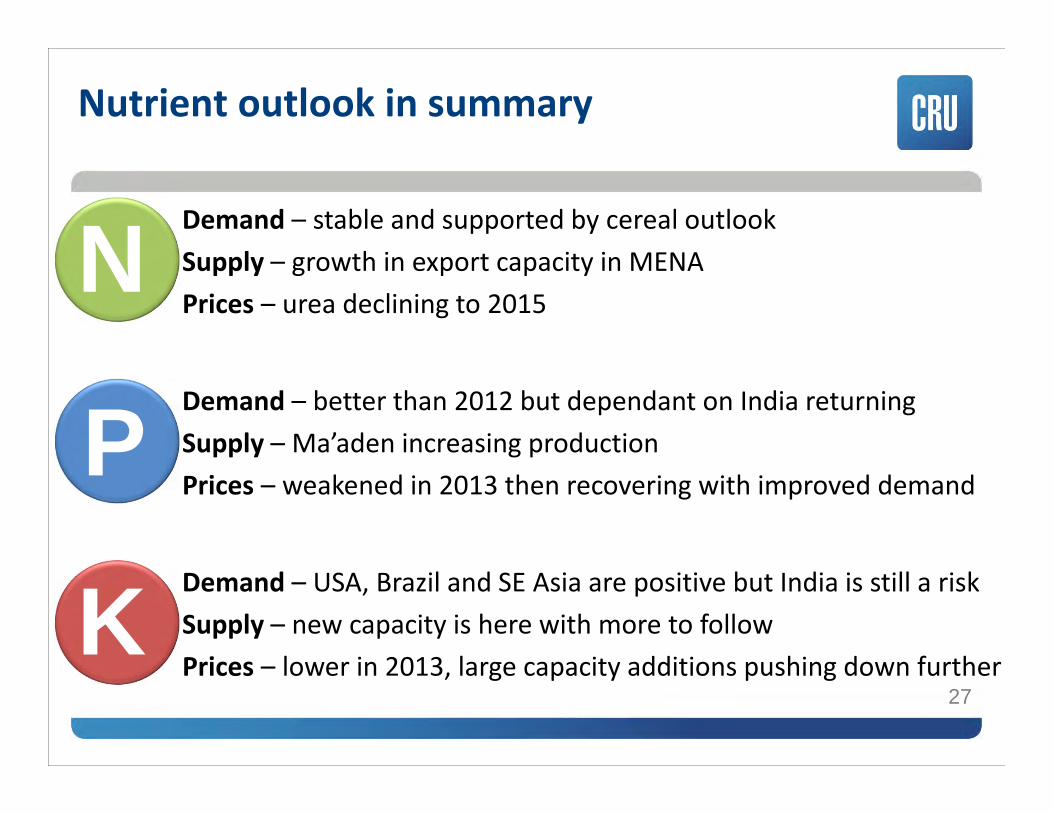
Demand – stable and supported by cereal outlookSupply – growth in export capacity in MENAPrices – urea declining to 2015
N
Demand – USA, Brazil and SE Asia are positive but India is still a riskSupply – new capacity is here with more to followPrices – lower in 2013, large capacity additions pushing down further
K
Demand – better than 2012 but dependant on India returningSupply – Ma’aden increasing productionPrices – weakened in 2013 then recovering with improved demand
P
Nutrient outlook in summary

28
MARKET OUTLOOK SERVICES Ammonia Urea Phosphate Rock Phosphate Fertilizer Potassium Chloride Sulphur Sulphuric Acid
Dr. Peter HarrissonConsultant, Fertilizers: +44 207 903 2249: [email protected]: www.crugroup.com
Thank you for your attention
COST SERVICES Nitrogen Fertilizers Potassium Chloride Phosphate Rock Phosphate Fertilizers
MULTI CLIENT SERVICES UAN Ammonium Nitrate Explosive grade ammonium nitrate Animal Feed Phosphates Potassium Sulphates/Nitrates
