2013 colliers global office outlook
TRANSCRIPT
2013 OUTLOOKGLOBAL Office
www.cOLLiers.cOm
2012 | office
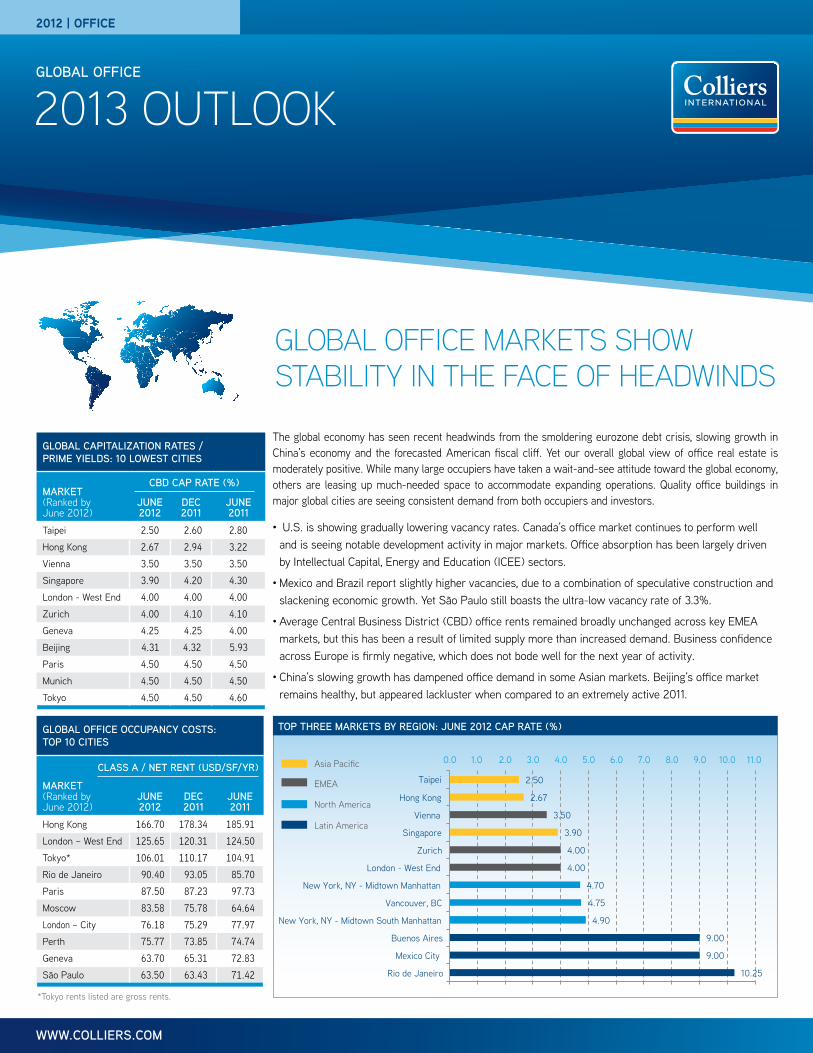
The global economy has seen recent headwinds from the smoldering eurozone debt crisis, slowing growth in China’s economy and the forecasted American fiscal cliff. Yet our overall global view of office real estate is moderately positive. While many large occupiers have taken a wait-and-see attitude toward the global economy, others are leasing up much-needed space to accommodate expanding operations. Quality office buildings in major global cities are seeing consistent demand from both occupiers and investors.
•●U.S. is showing gradually lowering vacancy rates. Canada’s office market continues to perform well and is seeing notable development activity in major markets. Office absorption has been largely driven by Intellectual Capital, Energy and Education (ICEE) sectors.
•Mexico and Brazil report slightly higher vacancies, due to a combination of speculative construction and slackening economic growth. Yet São Paulo still boasts the ultra-low vacancy rate of 3.3%.
•Average Central Business District (CBD) office rents remained broadly unchanged across key EMEA markets, but this has been a result of limited supply more than increased demand. Business confidence across Europe is firmly negative, which does not bode well for the next year of activity.
•China’s slowing growth has dampened office demand in some Asian markets. Beijing’s office market remains healthy, but appeared lackluster when compared to an extremely active 2011.
GLOBAL OFFICE MARKETS SHOW STABILITY IN THE FACE OF HEADWINDS
GLOBAL cAPiTALiZATiON rATes /Prime YieLDs: 10 LOwesT ciTies
mArKeT (Ranked byJune 2012)
JUNe 2012
Dec 2011
JUNe 2011
Taipei 2.50 2.60 2.80 Hong Kong 2.67 2.94 3.22 Vienna 3.50 3.50 3.50 Singapore 3.90 4.20 4.30 London - West End 4.00 4.00 4.00 Zurich 4.00 4.10 4.10 Geneva 4.25 4.25 4.00 Beijing 4.31 4.32 5.93 Paris 4.50 4.50 4.50 Munich 4.50 4.50 4.50 Tokyo 4.50 4.50 4.60
GLOBAL Office OccUPANcY cOsTs:TOP 10 ciTies
mArKeT (Ranked byJune 2012)
JUNe2012
Dec 2011
JUNe 2011
Hong Kong 166.70 178.34 185.91 London – West End 125.65 120.31 124.50 Tokyo* 106.01 110.17 104.91Rio de Janeiro 90.40 93.05 85.70Paris 87.50 87.23 97.73Moscow 83.58 75.78 64.64London – City 76.18 75.29 77.97Perth 75.77 73.85 74.74Geneva 63.70 65.31 72.83São Paulo 63.50 63.43 71.42
cBD cAP rATe (%)
cLAss A / NeT reNT (UsD/sf/Yr)
10.25
9.00
9.00
4.90
4.75
4.70
4.00
4.00
3.90
3.50
2.67
2.50
0.0 1.0 2.0 3.0 4.0 5.0 6.0 7.0 8.0 9.0 10.0 11.0
Rio de Janeiro
Mexico City
Buenos Aires
New York, NY - Midtown South Manhattan
Vancouver, BC
New York, NY - Midtown Manhattan
London - West End
Zurich
Singapore
Vienna
Hong Kong
Taipei
Asia Paci�c
EMEA
North America
Latin America
TOP Three mArKeTs BY reGiON: JUNe 2012 cAP rATe (%)
*Tokyo rents listed are gross rents.

P. 2 | cOLLiers iNTerNATiONAL
trends and forecast | 2012 | office | GLoBAL
Panama City 4,226,862
Singapore 3,896,532
Shanghai 5,480,466
New York, NY - Downtown Manhattan
Rio de Janeiro 7,661,260
Mexico City 8,481,452
Jakarta 9,228,884
Beijing 9,827,581
Tokyo 11,325,147
São Paulo 14,641,067
MARKET JUNE 2012
5,200,000
6.5%$22.80
4.7%$35.80
6.5%$22.80
4.7%$35.80
4.75%$34.53
6%$21.64
5.5%$41.92
6.5%$16.85
6.5%$13.71
5.6%$24.71
6.2%$20.61
6%$25.63
4.9%$25.875%
$23.14
7.8%$11.49
0%$36.8
$100 or more
$50 to $100
$25 to $50
less than $25
N/A
New York-Downtown
Victoria
VancouverCalgary
Seattle
Boston
New York-Midtown South
New York-Midtown
Montreal
Chicago
Denver
San Francisco
Atlanta
Houston
Average Class A Net Rents and Cap Rates – June 2012
TOP 10 Office mArKeTs wiTh The mOsT sPAce UNDer cONsTrUcTiON (sqUAre feeT)
O�ce demand to remain stable
O�ce demand to increase
O�ce demand to decrease
Office Demand Outlook ArrowsGLOBAL 2013 fOrecAsT: •Expect only modest improvement in North American office vacancy rates over
the next two years, with the exception of a few strong ICEE markets.•Central and Eastern Europe are feeling the effects of economic stagnation.
Greater certainty in the eurozone is still some ways away, although a continued improvement in activity is expected by mid-2013.
•Rents in UK regional markets should remain stable due to the lack of Grade A space. Most markets will reach a ‘tipping point’ by mid-2013 at which time further rental growth is expected.
•The outlook for the Beijing office property market, especially in the Class A sector, should continue to be positive; with investment market in the office property sector to also remain strong.
> UNiTeD sTATes Office DemAND DriVeN BY Tech, eNerGY Intellectual Capital, Energy and Education (ICEE) markets continue to generate a disproportionate share of office absorption in the US, and nine of the 10 US markets with the highest Q2 absorption have strong ICEE industries, led by Houston, Oklahoma City and Boston. The average vacancy rate was 140 basis points lower in ICEE-dominated markets.
For the first time in nearly five years, in Q1 2012, the US office vacancy rate dropped below 15%. The rate continued to decline by 13 basis points to 14.29% in Q2. New supply is delivered to the market at approximately the same pace as the trailing five-quarter average. With 38.4 million square feet of new construction still underway, additions to supply will impede improvement in occupancy or rental rates over the next four to eight quarters.
United states: 2013 OutlookCBD office buildings are outperforming the suburbs as companies consolidate operations into the central core of Metropolitan Service Areas (MSAs), and this trend will continue in 2013. Large spaces are in stronger demand as a result of this consolidation. As in 2012, landlords will be able to increase rents for large space users at lease renewal.
Professional and business service employment accounted for approximately one-third of the monthly job growth in 2012, averaging 150,000 per month.
However, the fate of the office vacancy rate does not merely depend upon an increase in office workers; new construction also plays a role in the calculation. As a result, the 2012 vacancy rate’s drop below 15% is not likely to be bettered by a 14% vacancy rate in 2013. Look for only modest improvement in office vacancy rates over the next two years.
> resOUrces sUPPOrTiNG cANADiAN DemAND, BOND rATes DriViNG iNVesTmeNT Observers expect continued slow and steady economic performance, with no exceptional wins or losses on the radar for Canada. The divide between the east and west is firmly entrenched, with the energy and mining sectors driving stronger results in Alberta, Saskatchewan and British Columbia. Ontario and Quebec will post more moderate growth, as the economy in the United States gradually improves, exports gather speed and the manufacturing sector recovers.
canada: 2013 OutlookEconomic growth will be impacted by a retraction of government stimulus spending and weakening consumer activity as household debt curtails retail sales growth. The fundamentals of all major office markets continue to be very solid, with the national vacancy rate under 6%. Demand for office space will be muted in the east, while resource-oriented western markets continue to be hot.
As a result, 2012 should end with a steady performance, with a further pick-up in
Rents are US$/SF/YR.

trends and forecast | 2012 | office | GLoBAL
P. 3 | cOLLiers iNTerNATiONAL
9%$31.20
Mexico City
10.25%$90.40
9%$34.21
Rio de Janeiro
Buenos Aires
$100 or more
$50 to $100
$25 to $50
less than $25
N/A
Average Class A Net Rents and Cap Rates – June 2012
São Paolo Skyline
growth commencing in 2013. The investment market will continue to be very active while bond rates remain low and investors turn to real estate as a safe yield-producing investment. Key risks on the Canadian radar are the fragile condition of Europe, the U.S. Fiscal Cliff and slowing growth in resource-hungry emerging economies.
> meXicO’s ecONOmic GrOwTh DriVes Office DemAND AND cONsTrUcTiON Mexico City saw the construction of more than 2.1 million square feet of office space in the first half of 2012, which has pushed up overall vacancy rates. 893,405 square feet were absorbed in the first quarter of 2012 and more than 1.9 million square feet in the second.
This 100% increase in market activity is to some extent due to the addition of buildings with pre-leased space to the inventory. It is worth noting that even with increased inventory, average rental rates did not show significant fluctuations and remained relatively stable.
mexico: 2013 OutlookThe Mexican economy will continue to advance at a steady pace, with employment and wages showing slight increases and a GDP growth rate that is expected to reach 3.7% by the end of 2012, and continue this trajectory in 2013. The recently elected Institutional Revolutionary Party presidential candidate Enrique Peña Nieto will push for some energy and labor reforms, however the initiatives of the new administration should not significantly shift Mexico’s growth trajectory.
> sÃO PAULO BOAsTs LOw VAcANcY, ALThOUGh ABsOrPTiON hAs mODerATeD Brazil’s dynamic economy of recent years has contributed to a new global perception of Brazil as a hub for investment and capital. The cities of Rio de Janeiro and São Paulo have a combined Class A office inventory of more than 26 million square feet and Rio de Janeiro has no room for new buildings in its downtown. The average vacancy across both cities is 6.8%. Rio de Janeiro’s vacancy is 10.4% while São Paulo’s is only 3.3%.
Brazil: 2013 OutlookDespite low vacancy rates, there has been some moderation in office demand. The average asking lease prices decreased by 0.7% from Q1 to Q2 2012 in São Paulo and Rio de Janeiro. Net absorption in Q2 was the lowest it has been since the third quarter of 2009. Therefore, we predict slackening demand and limited supply will provide only a slight increase in occupancy and rental rates through 2013.
Rental rate changes are calculated using period US$ exchange rates and may reflect fluctuations in currency exchanges. Rents are US$/SF/YR.

P. 4 | cOLLiers iNTerNATiONAL
trends and forecast | 2012 | office | GLoBAL
Helsinki at dusk
4.5%$87.50
4.25%$63.70
Stockholm
Copenhagen
4.5%$87.50
4.25%$63.70
5%$20.56
5%$26.81
4.5%$38.81
4.75%$61.74
4%$47.04
4%$125.65
3.5%$26.11
4.7%$31.05
Stockholm
Copenhagen
Paris
Berlin
Munich
Geneva
Zurich
London
Vienna
Hamburg
Average Class A Net Rents and Cap Rates – June 2012
$100 or more
$50 to $100
$25 to $50
less than $25
N/A
across AsiaPac and the Americas. Greater certainty in the eurozone is still some ways away, although a continued improvement in activity is expected by mid-2013.
> UNiTeD KiNGDOm sTiLL seeN As sAfe eNVirONmeNT fOr reAL esTATe iNVesTmeNT Despite the fact that the UK economy saw a surge in Q3 12, the economy will finish the year on a weaker note. Nevertheless, relative political and economic stability continues to augment the perception of Britain as a ‘safe haven’ for direct investment in real estate. As a eurozone outsider, the UK has benefited, attracting strong capital flows not only from eurozone countries, but also from North America, Asia, and the Middle East. Prime office yields are stable at around 4% in London’s West End and between 5% and 5.25% in the City.
London remains the top European office investment market with a 20%+ y/y increase in sales volume in H1 12. The vacancy rate in Central London was stable between H2 11 and H2 12 at 6.9%. Several UK markets have seen disappointing take-up levels so far in 2012, although London’s West End has seen an increase in pre-leasing activity and rents are still climbing.
United Kingdom: 2013 OutlookRents in UK regional markets should remain stable due to the lack of Grade A space. Speculative construction has been absent from these markets since 2008 and this trend is projected to continue. Most markets will reach a ‘tipping point’ by mid-2013 at which time further rental growth is expected. Rents in Central London will also come under upward pressure with the West End market set to see new historical highs for prime rents.
> sUsTAiNeD DemAND iN GermAN Office mArKeT After a mild contraction in Q4 11, the German economy bounced back with GDP growth in Q1 12 reaching 0.5% q/q. Since then the growth rate has tapered off to 0.2% q/q in Q3 12. The exposure of German banks to the Spanish property market remains a worrying factor, but export growth is also a worry as world trade has slowed.
Take-up in the six main German office markets stood at approximately 13.9 million square feet in the first half of 2012, which represents a 9% y/y decline. Nevertheless, the overall vacancy rate fell from 9.7% in H1 11 to 8.4% in 2012. Demand from
> LOw cONfiDeNce fOr emeA BUsiNesses, BUT BriGhT sPOTs PersisT The first half of 2012 was dominated by economic stagnation across Europe. The eurozone contracted by 0.2% quarter-over-quarter in Q2 12 and re-entered technical recession in Q3 12 with a 0.1% q/q contraction. Central and Eastern Europe are feeling the effects. Positive indicators for H1 12 in Germany and France have given way to more sobering numbers with manufacturing and service purchasing manager indices suggesting a further period of economic uncertainty and stagnation. Both economies expanded by a modest 0.2% q/q in Q3 12 and this was not enough to counter balance contractions in the eurozone periphery
emeA: 2013 OutlookAverage CBD office rents remain broadly unchanged across key EMEA markets; in most cases this has been the result of limited supply, rather than robust demand. A 13% y/y drop in the volume of investment transactions was recorded across Europe in the first part of 2012. Despite sagging business confidence across EMEA, Q3 12 transaction levels saw a modest rise, although the increase is lagging better results in
Rental rate changes are calculated using period US$ exchange rates and may reflect fluctuations in currency exchanges Rents are US$/SF/YR.

trends and forecast | 2012 | office | GLoBAL
P. 5 | cOLLiers iNTerNATiONAL
London, England
current political instability is also a factor. However, the majority of eastern European countries are expected to post positive GDP growth in 2012; the regional economy as a whole is expected to grow by 2.7%. Poland, Russia and Turkey, alongside dynamic economies such as Latvia, are helping drive growth in the region.
In line with a decline in economic conditions, office space demand contracted by 24% compared to leasing activity in 2011. Almost all markets were below the demand levels seen in the second half of 2011, with the exceptions of Warsaw, Prague and Zagreb. Nevertheless, rents have remained stable across the region, with a notable 10.3% increase recorded in Moscow. The volume of investment transactions also fell in comparison to the same period of 2011, mainly as a result of reduced debt finance availability. This has kept transactions focused on the larger, more liquid Polish and Russian markets.
cee: 2013 OutlookWe expect the transaction trend focusing investment on larger, more liquid markets (mentioned above) will continue over the next 12 months. We also expect to see subdued activity from both demand and supply in the near term, with continued divergence in activity by geography. Market uncertainty combined with restricted construction finance availability will continue to constrain new supply. This should keep vacancy rates at current levels in most markets.
> sOUTherN eUrOPe’s reNTs sTiLL fALLiNG; miDDLe eAsT hAmPereD BY OVersUPPLY There was further weakening in the headline-grabbing markets of Southern Europe. Athens saw a 7.1% decrease in asking rents and Madrid recorded a 2.1% fall. Vienna saw a slight increase in CBD rental levels in the first half of 2012, while the rents in the Benelux markets recorded no changes. Geneva saw a marginal fall in rents. A decrease in rents is expected in Swiss
professional services firms has been steady and may explain some of the notable rental increases; there have been sustained lettings of higher-priced space in central locations. The two most expensive locations for office investment remain Hamburg with prime yields of 4.7% and Munich at 4.5%. These low yields are a result of high demand for a limited amount of new supply. Investors remain focused on these markets due to continued good turnover figures, but also these market have a degree of safe haven status as leading markets in what is perceived as the most stable member of the eurozone.
Germany: 2013 OutlookConsidering the economic environment, the German office leasing market has held up well and will remain stable in 2013. Underlying leasing demand, together with current rental contract negotiations, suggest some modest growth in take-up volumes. Investors will continue to look for opportunities across the German markets and prices are expected to remain stable.
> freNch Office mArKeT iN sTATe Of eqUiLiBriUm, YeT feArs remAiN Against an unsettled economic backdrop, the core sectors of France’s commercial real estate market have proven resilient. While supply and demand appear to be in equilibrium, fears of new imbalances are linked to expectations of further economic deterioration.
Take-up of office space in Île-de-France has held up well and stood at over 10 million square feet in the first half of 2012. This number was down only slightly year-over-year. Transactions involving small units maintained pace, but leasing transactions for medium-sized suites are down significantly. The supply of new and second-generation office space (available within a year) declined by 11% in the past six months. Rental rates have stabilized in high-quality buildings. However, a correction in rental values for lower-quality, second-generation space in the future may develop.
Commercial property commitments in France in the first half of 2012 represented a year-over-year increase of 18%. Transactional evidence suggests no significant change in office yields which, on the best properties, range from 4.5 to 5.5% in the Paris CBD. Paris is also seeing safe haven investment due to its status as an important international financial node.
france: 2013 OutlookThe trend of shrinking office space availability is expected to be reversed as a number of new construction projects complete in 2013. Despite increased supply, the market is expected to remain stable, provided no unforeseen economic setbacks occur. International investors will continue to track Paris for new opportunities.
> iNVesTOr DemAND KeePs Office YieLDs LOw iN cOre NOrDic mArKeTs The Nordic growth rates (2013 GDP forecasts range from 1.4% to 2.1%) are relatively strong when seen against core European markets. AAA credit ratings for Denmark, Finland, Norway and Sweden have supported the perception that Nordic markets are safe destinations for capital.
Office investors have shown great appetite for property in primary locations, pushing up the yield spread between primary and secondary Nordic markets. The number of investment transactions has been increasing. Denmark and Sweden in particular have seen a higher volume of cross-border transactions.
Nordics: 2013 OutlookA modest increase in investment activity is expected in 2013, particularly concentrated in primary Nordic markets and from international investors; a shift in preference among tenants to cost-effective, modern and green office buildings is also likely. Leasing markets will remain stable.
> cee sees LOwer Office DemAND DesPiTe POsiTiVe ecONOmY Although, the Central and Eastern Europe (CEE) region is showing more economic growth than Western Europe, the region is vulnerable to Western European economic performance. This has been very apparent in Hungary and the Czech Republic whose economies both contracted over the first half of 2012. Both countries are very dependent on trade with the western European core, although

P. 6 | cOLLiers iNTerNATiONAL
trends and forecast | 2012 | office | GLoBAL
Buenos Aires USDBeijing CNY
Stuttgart EURSão Paulo BRL
Moscow USDDenver, CO USDChicago, IL USDCalgary, AB CADBogotá USDJakarta IDR
MARKET
QUOTED CURRENCY
UNITS OF MEASUREMENT
TIME PERIOD
JUNE2012
DEC2011 CHANGE
SMSMSFSFSFSMSMSMSMSM
MonthMonthYearYearYear
MonthMonthMonthMonthMonth
242,192.0033.0042.6216.8513.71
75.0019.00
114.5030.70336.11
174,249.0027.4036.0014.5012.19
68.0017.50
106.0028.60313.69
39.0%20.4%18.4%16.2%12.5%10.3%8.6%8.0%7.3%7.1%
mAJOr Office mArKeTs wiTh The LArGesT PeriOD chANGe iN reNT
2.67%$166.70
7.5%$58.94
7.32%$34.427.06%
$47.35
6.9%$60.85
4.32%$58.94
3.9%$63.35
2.5%$27.64
7.5%$36.13
Canberra
Sydney
Brisbane
Adelaide
Melbourne
Beijing
Hong Kong
Tokyo
Singapore
Taipei
$100 or more
$50 to $100
$25 to $50
less than $25
Market with gross-rent data only Canberra
Sydney
Brisbane
Adelaide
4.5%$106.01
Average Class A Net Rents and Cap Rates – June 2012
“ The unresolved Europeandebt crisis and slowing economic growth in China have eroded Hong Kong’s economic growth prospects. Inflationary pressure from the third round of US quantitative easing is expected to push up real estate values, where the local currency is pegged to the US dollar.”
markets, due to poor demand levels; the strength of the local currency is impacting business activity substantially. Switzerland and Austria also saw significant declines in office investment activity in comparison to the first half of 2011.
southern europe: 2013 OutlookFurther falls in rental levels are expected. With low occupational demand and creeping investment volumes, prime office yields will continue to soften further in Athens, Milan, Madrid and Rome. The largest increase in 2012 was recorded in Lisbon, at 50 basis points.
Across the Middle East, political and economic uncertainty continues to translate into poor performance in local real estate markets, with low demand from both tenants and investors. A further weakening of the Cairo market was noticeable, as well as major declines in rents in the main office markets of UAE and Saudi Arabia, where significant oversupply was the cause.
> Office DemAND frOm fiNANciAL AND mAiNLAND cOmPANies iN hONG KONG The unresolved European debt crisis and slowing economic growth in China have eroded Hong Kong’s economic growth prospects. Inflationary pressure from the third round of US quantitative easing is expected to push up real estate values, where the local currency is pegged to the US dollar.
Office rents showed signs of stabilization in 3Q 2012 due largely to the solid demand from a range of medium-sized financial companies and the support of mainland enterprises. Leasing demand was soft in the city’s Class A office market. Overall net absorption fell 26% quarter-over-quarter to 386,000 square feet in 3Q 2012.
hong Kong: 2013 OutlookDue to the limited supply of Class A office buildings for lease, the vacancy rate on Hong Kong Island will remain low in 2013, with the exception of Central/ Admiralty, where falling demand for top-tier office premises is anticipated to cause the vacancy rate to edge up further. Overall, the average vacancy rate will settle around its historical average of 5% by the end of 2012.
With the external uncertainties and tightening of mortgage lending criteria, investment sentiment in the office market weakened during 3Q 2012. The average yield of Hong Kong Class A offices compressed 20 basis points to 3.1% in July 2012. The decrease in Class A office yield reflected the strong demand for Class A offices by investors.
> New Office cONsTrUcTiON AND PreLeAsiNG AcTiViTY iN shANGhAi The average rental rate for Class A office space in Shanghai continues to grow. Citywide, vacancy increased to 9.5% due to the launch of five new projects in the downtown area, including the high-profile L’Avenue and SOHO Century Avenue. A number of high-profile leases were signed, including Adidas’ 187,293 square feet in Shanghai International Commerce Center for their new China
headquarters and Danone Group’s securing of 76,435 square feet at Kerry Parkside.
Average gross yields in Shanghai’s Class A office sector declined to 5.8% during the third quarter, a decrease of 10 basis points from the previous quarter.
shanghai: 2013 OutlookThe limited number of recent land transactions indicate that developers still remain cautious about making land acquisitions for further commercial development.
> BeiJiNG office MARKeT SeeS NARRoWiNG AVAiLABiLiTY Despite weak economic performance in many developed economies, Beijing, as the capital of China, will continue to attract overseas and domestic enterprises as they establish or expand their offices. Beijing’s overall office property market was stable in the first half of 2012. The disequilibrium between supply and demand remained unchanged as new completion was limited, leading to a continued narrowing availability across the board.
Rental rate changes are calculated using period US$ exchange rates and may reflect fluctuations in currency exchanges. Rents are US$/SF/YR.
* - Change in rent as measured in local currency, unit of measurement and time period.

trends and forecast | 2012 | office | GLoBAL
P. 7 | cOLLiers iNTerNATiONAL
Although demand from both multinationals and domestic enterprises was firm, the leasing market in the first half of 2012 appeared lackluster when compared to the extremely active year of 2011. The average net effective rent continued to climb, but the growth momentum softened, associated with declining transaction volume. The office property investment market was also active, evidenced by several transactions concluded during the review period.
Beijing: 2013 OutlookThe outlook for the Beijing office property market, especially in the Class A sector, should continue to be positive. However, negotiations between landlords and tenants could become more elastic in the near term. The investment market in the office property sector of Beijing will remain active.
> ToKYo office USeRS TAKe ADVANTAGe of oVeRSUPPLY The Tokyo Class A office market continues to experience frequent tenant relocations as occupiers take advantage of an oversupply by upgrading the quality of their office space while reducing overall rents. Office development has been concentrated in three central wards of Tokyo, with 2012 marking the second-biggest year for new office construction since 2003. Office properties in Tokyo’s central business districts and major cities are enjoying the greatest interest from institutional investors, with more than 80% of investment capital focused in the central six wards of Tokyo, according to data from RCA. More than half of the total transaction volume in Japan is made up of office property sales. Tokyo ranked fourth globally in volume of office property transactions valued over $10 million per asset in the past 12 months.
Tokyo: 2013 OutlookHigher vacancy rates have accompanied the new supply from 2012, however vacancy should begin to decline again soon. Class A rents are stabilizing, with some properties showing rental rate increases. Although average rents will decline slightly through the end of 2012, we project they will begin to increase moderately in late 2013.
> SeoUL SeeS DRoPPiNG VAcANcY DeSPiTe NeW office coNSTRUcTioN A number of Class A office buildings have come online in Seoul in the last year in both the Central Business District (CBD) and Yeouido Business District (YBD) . This construction came on the heels of the successful launch of the International Finance Centre(IFC) in the Yeouido Business District’s (YBD) first Class A office building in 2011.
Yokohama Skyline
Over 1.7 million square feet of new office space entered Seoul’s office market in the first half of 2012, with the completion of the K Twin Tower in the Central Business District and three buildings in the Gangnam Business District (GBD). New supply is expected to continue to edge up in the CBD and YBD.
The vacancy rate for offices in Seoul fell 0.76% in the first half of 2012 to 6.97%. There was almost no vacancy in the area’s Class A+ office buildings, which had an average vacancy rate of 0.11%. The average rent for an office in Seoul in the first half of 2012 increased by 4.46% over the previous period. The net absorption in Seoul’s office market during 2Q 2012 increased remarkably from the previous quarter to nearly 1.6 million square feet.
seoul: 2013 OutlookLow supply, increased rental rates and a slight decrease in vacancy point to moderate improvement in the Seoul market in 2013. However, new supply will keep strong gains in rent or occupancy in check.
> SiNGAPoRe cLASS A ceNTRAL BUSiNeSS DiSTRicT ReNTS To fALL The global economic environment has weighed down Singapore’s office leasing activity, pushing average Class A gross rents in the CBD down by 5.4%. This represented a reversal of the rental growth trend that had been steadily gaining steam since the office market bottomed out in the end of 2009.
singapore: 2013 OutlookLowered office rents will improve Singapore’s competitive edge as a regional hub for business. Overall CBD office space vacancy rates inched down from 12.8% in December 2011 to 12.6% in June 2012. There is a threat of an impending supply overhang. In addition to the steady lineup of new office buildings that will be completed over the next four years, a substantial amount of secondary space could be returned to the market upon lease expiration as existing tenants move to new premises. CBD Class A office rents are expected to continue decline through 2013.
> SLoWiNG ecoNoMY ReiNS iN iNDiAN office DeMAND India’s economic growth has slowed, a result of uncertainties in domestic policy, the cumulative impact of monetary tightening and slackening of external demand. Rental rates for Class A office space in Mumbai will remain stable across most submarkets. In Delhi, Class A rents increased by 2% to 7% over the previous quarter in popular locations such as Connaught Place and Nehru Place, while 4% to 10% drops were seen in Jasola and Saket.

P. 8 | cOLLiers iNTerNATiONAL
trends and forecast | 2012 | office | GLoBAL
Brisbane, Australia
While construction activities remained moderate in Mumbai in Q2 2012, Dehli saw fast-paced activity in a newly developed area near Delhi Airport named Aerocity. Two projects located at Aerocity, Aria Signature Office and IBIS Commercial Tower, developed by JW Marriot and IBIS Hotel respectively, added approximately 200,000 square feet of Class A space to the market.
india: 2013 OutlookGoing forward, the rental values for Class A office space are expected to remain stable in almost all Delhi and Mumbai submarkets.
> foReiGN iNVeSToRS AccoUNT foR HALf of AUSTRALiAN PRoPeRTY PURcHASeS The Australian economy continues to show signs of strength, with GDP growth of 3.7% recorded in the first nine months of 2012. This relatively strong growth is no doubt a contributor to strong foreign interest in Australian property, with offshore purchasers now accounting for around a half of all purchases in 2012.
Although economic growth is strong, the two-speed nature of Australia’s economy means that some office markets are performing far better than others from a tenant demand perspective. In particular, office markets in the resource-rich states of Western Australia and Queensland are showing stronger rental growth than the larger economies of Victoria and New South Wales. However, investment patterns are not following leasing demand. Demand for office assets is higher in Sydney and Melbourne CBDs, even though these cities are both seeing a decline in rents.
Australia: 2013 OutlookThere is a strong outlook for investment in Australian office markets. Although foreign purchasers are dominating at present, local Australian REITS have now recapitalized and Australian pension funds have also expressed interest in increasing
allocations to direct property. This means that the demand for prime assets is going to become more competitive in 2013. However, the outlook for rental growth is more limited. It is likely we will see some growth in Brisbane and Perth CBD rents, while Melbourne and Sydney CBD rents remain flat in 2013.
> NeW eARTHQUAKe PoLicieS iN NeW ZeALAND HiT cBD officeThe implementation of earthquake-prone buildings policies has had a profound effect on the New Zealand CBD office market over the last 12 months. The process of obtaining an engineering evaluation while maintaining insurance has been an expensive exercise for institutions and private owners. Wellington has been hit the hardest.
Leasing activity at the top end of the market has remained firm in Wellington as a result of the growing number of office tenants looking to move away from buildings perceived to be earthquake-prone, and this has helped keep prime rentals buoyant. However, the Auckland CBD office market has been the stronger performer of the two cities. Prime CBD office space remains tight in buildings around the CBD.
New Zealand: 2013 OutlookThe economic climate in New Zealand remains muted over the next few years and the complexity surrounding the Wellington office market hinders any chance of seeing sustained rental growth in the next few years. Less fortunate are owners of the older Class C or even B buildings who face a nasty cocktail of decreasing value and demand, along with increasing insurance costs. Auckland is more resilient, supported by job growth prospects and likely economic growth. Landlords of better-quality buildings in both Auckland and Wellington can anticipate an increase in rental in the next 12 months.

P. 9 | cOLLiers iNTerNATiONAL
trends and forecast | 2012 | office | GLoBAL
LOcAL meAsUre / cUrreNcY cBD reNTs
mArKeT cOUNTrY UNiTqUOTeD
cUrreNcYTime
PeriOD
eXchANGerATe (UsD)
JUNe 30, 2012
AVerAGecLAss A NeT reNT
AVerAGecLAss A
GrOss reNT
AVerAGecLAss A NeT reNT
AVerAGecLAss A GrOss reNT
cBD cAP rATe
/ PrimeYieLD (%)
AsiA PAcific
Adelaide Australia SM AUD Year 0.98 380.00 485.00 36.13 46.11 7.50
Brisbane Australia SM AUD Year 0.98 620.00 750.00 58.94 71.30 7.50 Canberra Australia SM AUD Year 0.98 362.00 440.00 34.42 41.83 7.32 Melbourne Australia SM AUD Year 0.98 498.00 617.00 47.35 58.66 7.06 Perth Australia SM AUD Year 0.98 797.00 956.00 75.77 90.89 8.00 Sydney Australia SM AUD Year 0.98 640.00 776.00 60.85 73.78 6.90 Beijing China SM CNY Month 6.36 336.11 366.11 58.94 64.20 4.31 Chengdu China SM CNY Month 6.36 145.28 164.33 25.48 28.82 7.60 Hong Kong China SF HKD Month 7.76 107.76 125.14 166.70 193.58 2.67 Shanghai China SM CNY Month 6.36 307.00 261.00 45.77 53.81 4.50Jakarta Indonesia SM IDR Month 9,385.00 242,192.00 299,588.00 28.76 35.58 8.10 Tokyo Japan SM JPY Year 79.82 91,113.00 106.01 4.50 Auckland New Zealand SM NZD Year 1.25 334.00 466.00 24.86 34.69 8.40 Wellington New Zealand SM NZD Year 1.25 343.00 442.00 25.53 32.90 8.19 Makati City Philippines SM PHP Month 41.82 895.00 23.85 9.00 Singapore Singapore SF SGD Month 1.27 6.68 8.45 63.35 80.13 3.90 Seoul South Korea SM KRW Month 1,141.15 64,575.00 23,896.00 63.06 23.34 6.00 Taipei Taiwan SM TWD Month 29.80 739.00 887.00 27.64 33.17 2.50 Bangkok Thailand SM THB Month 31.55 680.00 725.00 24.02 25.61 8.30 eUrOPe, miDDLe eAsT AND AfricA (emeA)Tirana Albania SM EUR Month 0.79 15.50 21.87 14.00Vienna Austria SM EUR Month 0.79 18.50 26.11 3.50 Antwerp Belgium SM EUR Month 0.79 10.40 14.68 7.00 Brussels Belgium SM EUR Month 0.79 15.00 21.17 6.00 Sofia* Bulgaria SM EUR Month 0.79 9.00 12.70 9.00 Zagreb* Croatia SM EUR Month 0.79 12.50 17.64 9.00 Prague* Czech Republic SM EUR Month 0.79 15.50 21.87 6.50 Copenhagen Denmark SM DKK Month 5.87 108.30 20.56 5.00 Cairo Egypt SM USD Month 1.00 21.75 24.24 9.00 Tallinn Estonia SM EUR Month 0.79 13.40 18.91 7.50 Bordeaux France SM EUR Month 0.79 13.50 19.05 6.50 Lyon France SM EUR Month 0.79 18.80 26.53 6.00 Marseille France SM EUR Month 0.79 15.90 22.44 6.15 Paris France SM EUR Month 0.79 62.00 87.50 4.50 Berlin Germany SM EUR Month 0.79 19.00 26.81 5.00 Düsseldorf Germany SM EUR Month 0.79 23.00 32.46 5.20 Frankfurt Germany SM EUR Month 0.79 30.00 42.34 5.20 Hamburg Germany SM EUR Month 0.79 22.00 31.05 4.70 Munich Germany SM EUR Month 0.79 27.50 38.81 4.50 Stuttgart Germany SM EUR Month 0.79 19.00 26.81 5.40 Athens* Greece SM EUR Month 0.79 13.00 18.35 7.75 Budapest* Hungary SM EUR Month 0.79 12.50 17.64 7.75 Dublin Ireland SM EUR Month 0.79 20.00 28.23 7.50 Milan Italy SM EUR Month 0.79 40.00 56.45 5.50
Rome Italy SM EUR Month 0.79 29.00 40.93 5.85
Riga Latvia SM EUR Month 0.79 12.00 16.94 8.00
Vilnius Lithuania SM EUR Month 0.79 13.50 19.05 8.50
Amsterdam Netherlands SM EUR Month 0.79 17.80 25.12 6.65
meAsUrecBD reNT
LOcAL cUrreNcYcBD reNT Us
DOLLArs/sq fT/Yr
* rents reflect combined A and B class.

trends and forecast | 2012 | office | GLoBAL
P. 10 | cOLLiers iNTerNATiONAL
Oslo Norway SM NOK Year 5.96 3,250.00 50.65 5.50
Warsaw* Poland SM EUR Month 0.79 22.20 31.33 6.50
Lisbon Portugal SM EUR Month 0.79 15.21 21.47 8.00
Bucharest* Romania SM EUR Month 0.79 15.00 21.17 8.00
Moscow* Russia SM USD Month 1.00 75.00 83.58 9.50
Saint Petersburg Russia SM USD Month 1.00 33.00 36.78 10.00
Jeddah Saudi Arabia SM SAR Year 3.75 934.00 23.13
Riyadh Saudi Arabia SM SAR Year 3.75 1,130.00 27.99 10.00
Belgrade* Serbia SM EUR Month 0.79 15.50 21.87 9.00
Bratislava* Slovakia SM EUR Month 0.79 11.00 15.52 7.50
Madrid Spain SM EUR Month 0.79 23.50 33.17 5.90
Stockholm Sweden SM SEK Year 6.92 4,600.00 61.74 4.75
Geneva Switzerland SM CHF Month 0.95 54.17 63.70 4.25
Zurich Switzerland SM CHF Month 0.95 40.00 47.04 4.00
Istanbul Turkey SM USD Month 1.00 28.67 31.95 7.00
Kyiv* Ukraine SM USD Month 1.00 23.00 25.63 12.00
Abu Dhabi United Arab Emirates SM USD Month 1.00 30.46 33.95
Dubai United Arab Emirates SM USD Month 1.00 32.90 36.67 10.00
Belfast United Kingdom SF GBP Year 0.64 12.50 19.63 6.25
Birmingham United Kingdom SF GBP Year 0.64 21.00 32.98 6.00
Bristol United Kingdom SF GBP Year 0.64 24.00 37.70 6.25
Edinburgh United Kingdom SF GBP Year 0.64 21.00 32.98 6.00
Glasgow United Kingdom SF GBP Year 0.64 23.00 36.12 6.00
London – City United Kingdom SF GBP Year 0.64 48.50 76.18 5.25
London – West End United Kingdom SF GBP Year 0.64 80.00 125.65 4.00
Manchester United Kingdom SF GBP Year 0.64 22.00 34.55 6.00
LATiN AmericA
Buenos Aires Argentina SM USD Month 1.00 30.70 35.75 34.21 39.84 9.00
Rio de Janeiro Brazil SM BRL Month 2.01 163.00 186.50 90.40 103.43 10.25
São Paulo Brazil SM BRL Month 2.01 114.50 137.00 63.50 75.98 10.25
Bogotá Colombia SM USD Month 1.00 33.00 36.20 36.78 40.34 8.25
San José Costa Rica SM USD Month 1.00 17.75 19.48 19.78 21.71 10.76
Mexico City Mexico SM USD Month 1.00 28.00 31.00 31.20 34.55 9.00
Panama City Panama SM USD Year 1.00 20.00 24.00 1.86 2.23 9.50
Lima Peru SM USD Month 1.00 20.00 20.60 22.29 22.96 12.50
NOrTh AmericA
Calgary, AB Canada SF CAD Year 1.02 42.62 62.00 41.92 60.98 5.50
Edmonton, AB Canada SF CAD Year 1.02 23.20 41.44 22.82 40.76
LOcAL meAsUre / cUrreNcY cBD reNTs
mArKeT cOUNTrY UNiTqUOTeD
cUrreNcYTime
PeriOD
eXchANGerATe (UsD)
JUNe 30, 2012
AVerAGecLAss A NeT reNT
AVerAGecLAss A
GrOss reNT
AVerAGecLAss A NeT reNT
AVerAGecLAss A GrOss reNT
cBD cAP rATe
/ PrimeYieLD (%)
eUrOPe, miDDLe eAsT AND AfricA (emeA) continued
meAsUrecBD reNT
LOcAL cUrreNcYcBD reNT Us
DOLLArs/sq fT/Yr
* rents reflect combined A and B class.

P. 11 | cOLLiers iNTerNATiONAL
trends and forecast | 2012 | office | GLoBAL
Guelph, ON Canada SF CAD Year 1.02 11.47 23.10 11.28 22.72 7.25
Halifax, NS Canada SF CAD Year 1.02 17.03 32.36 16.75 31.83
Montréal, QC Canada SF CAD Year 1.02 23.18 42.00 22.80 41.31 6.50
Ottawa, ON Canada SF CAD Year 1.02 26.79 49.30 26.35 48.49 6.95
Regina, SK Canada SF CAD Year 1.02 24.70 40.40 24.30 39.74 7.00
Saskatoon, SK Canada SF CAD Year 1.02 25.00 38.00 24.59 37.38 7.00
Toronto, ON Canada SF CAD Year 1.02 29.20 58.40 28.63 57.25
Vancouver, BC Canada SF CAD Year 1.02 35.10 55.00 34.53 54.10 4.75
Victoria, BC Canada SF CAD Year 1.02 22.00 36.00 21.64 35.41 6.00
Waterloo Region, ON Canada SF CAD Year 1.02 13.65 25.28 13.43 24.87 7.25
Atlanta, GA United States SF USD Year 1.00 11.49 22.99 11.49 22.99 7.80
Bakersfield, CA United States SF USD Year 1.00 9.31 17.40 9.31 17.40
Baltimore, MD United States SF USD Year 1.00 12.22 23.22 12.22 23.22
Birmingham, AL United States SF USD Year 1.00 20.92 20.92 20.92 20.92
Boise, ID United States SF USD Year 1.00 14.71 20.71 14.71 20.71
Boston, MA United States SF USD Year 1.00 25.63 45.63 25.63 45.63 6.00
Charleston, SC United States SF USD Year 1.00 20.09 30.09 20.09 30.09 8.00
Charlotte, NC United States SF USD Year 1.00 23.80 23.80 23.80 23.80
Chicago, IL United States SF USD Year 1.00 16.85 37.35 16.85 37.35 6.50
Cincinnati, OH United States SF USD Year 1.00 13.72 23.22 13.72 23.22 9.75
Cleveland, OH United States SF USD Year 1.00 22.00 22.00 22.00 22.00
Columbia, SC United States SF USD Year 1.00 19.39 19.39 19.39 19.39
Columbus, OH United States SF USD Year 1.00 11.23 19.89 11.23 19.89
Dallas/Fort Worth, TX
United States SF USD Year 1.00 15.00 25.00 15.00 25.00
Denver, CO United States SF USD Year 1.00 13.71 29.56 13.71 29.56 6.50
Detroit, MI United States SF USD Year 1.00 23.63 23.63 23.63 23.63 12.00
Fresno, CA United States SF USD Year 1.00 15.90 24.00 15.90 24.00 9.00
Ft. Lauderdale-Broward, FL United States SF USD Year 1.00 17.58 31.08 17.58 31.08
Grand Rapids, MI United States SF USD Year 1.00 11.38 19.33 11.38 19.33 9.25
Hartford, CT United States SF USD Year 1.00 10.40 22.90 10.40 22.90
Honolulu, HI United States SF USD Year 1.00 18.48 35.16 18.48 35.16
Houston, TX United States SF USD Year 1.00 36.80 36.80 36.80 36.80
Indianapolis, IN United States SF USD Year 1.00 11.55 19.05 11.55 19.05 8.00
Jacksonville, FL United States SF USD Year 1.00 9.54 19.44 9.54 19.44
Kansas City, MO United States SF USD Year 1.00 11.04 19.04 11.04 19.04
Las Vegas, NV United States SF USD Year 1.00 19.84 30.84 19.84 30.84
Little Rock, AR United States SF USD Year 1.00 8.89 15.59 8.89 15.59 9.50 Los Angeles, CA United States SF USD Year 1.00 20.36 36.36 20.36 36.36 6.90 Louisville, KY United States SF USD Year 1.00 19.06 19.06 19.06 19.06
LOcAL meAsUre / cUrreNcY cBD reNTs
mArKeT cOUNTrY UNiTqUOTeD
cUrreNcYTime
PeriOD
eXchANGerATe (UsD)
JUNe 30, 2012
AVerAGecLAss A NeT reNT
AVerAGecLAss A
GrOss reNT
AVerAGecLAss A NeT reNT
AVerAGecLAss AGrOss reNT
cBD cAP rATe
/ Prime YieLD(%)
meAsUrecBD reNT
LOcAL cUrreNcYcBD reNT Us
DOLLArs/sq fT/Yr

trends and forecast | 2012 | office | GLoBAL
P. 12 | cOLLiers iNTerNATiONAL
LOcAL meAsUre / cUrreNcY cBD reNTs
mArKeT cOUNTrY UNiTqUOTeD
cUrreNcYTime
PeriOD
eXchANGerATe (UsD)
JUNe 30, 2012
AVerAGecLAss A NeT
reNT
AVerAGecLAss A
GrOss reNT
AVerAGecLAss A NeT reNT
AVerAGecLAss AGrOss reNT
cBD cAP rATe
/ Prime YieLD(%)
NOrTh AmericA continued
Memphis, TN United States SF USD Year 1.00 8.26 16.71 8.26 16.71
Miami-Dade, FL United States SF USD Year 1.00 24.73 40.23 24.73 40.23
Milwaukee, WI United States SF USD Year 1.00 8.57 19.60 8.57 19.60
Minneapolis, MN United States SF USD Year 1.00 5.48 15.25 5.48 15.25
Nashville, TN United States SF USD Year 1.00 21.77 21.77 21.77 21.77 6.50
New York, NY - Downtown Manhattan
United States SF USD Year 1.00 23.14 47.62 23.14 47.62 5.00
New York, NY - Midtown Manhattan
United States SF USD Year 1.00 35.80 70.34 35.80 70.34 4.70
New York, NY - Midtown South Manhattan
United States SF USD Year 1.00 25.87 47.26 25.87 47.26 4.90
Oakland, CA United States SF USD Year 1.00 17.80 31.80 17.80 31.80 7.50
Oklahoma City, OK United States SF USD Year 1.00 17.78 17.78 17.78 17.78
Omaha, NE United States SF USD Year 1.00 10.88 19.88 10.88 19.88
Orlando, FL United States SF USD Year 1.00 13.23 24.23 13.23 24.23 8.50
Philadelphia, PA United States SF USD Year 1.00 14.86 26.50 14.86 26.50 8.00
Phoenix, AZ United States SF USD Year 1.00 10.70 23.70 10.70 23.70
Pittsburgh, PA United States SF USD Year 1.00 11.86 22.61 11.86 22.61 8.26
Portland, OR United States SF USD Year 1.00 14.74 24.74 14.74 24.74
Raleigh/Durham/Chapel Hill, NC United States SF USD Year 1.00 23.41 23.41 23.41 23.41
Reno, NV United States SF USD Year 1.00 21.73 21.73 21.73 21.73
Sacramento, CA United States SF USD Year 1.00 25.39 32.64 25.39 32.64
San Diego, CA United States SF USD Year 1.00 13.82 28.68 13.82 28.68
San Francisco, CA United States SF USD Year 1.00 24.71 44.81 24.71 44.81 5.60
San Jose - Silicon Valley United States SF USD Year 1.00 16.61 33.11 16.61 33.11
Savannah, GA United States SF USD Year 1.00 12.15 19.15 12.15 19.15 9.50
Seattle/Puget Sound, WA United States SF USD Year 1.00 20.61 30.63 20.61 30.63 6.20
St. Louis, MO United States SF USD Year 1.00 6.97 17.47 6.97 17.47 9.75
St. Paul, MN United States SF USD Year 1.00 4.08 13.17 4.08 13.17
Stamford, CT United States SF USD Year 1.00 25.34 38.84 25.34 38.84 8.00
Stockton, CA United States SF USD Year 1.00 16.88 20.64 16.88 20.64 8.50
Tampa Bay, FL United States SF USD Year 1.00 14.15 23.15 14.15 23.15 8.00
Walnut Creek/Pleasanton, CA United States SF USD Year 1.00 27.60 27.60 27.60 27.60 8.00
Washington DC United States SF USD Year 1.00 31.19 53.19 31.19 53.19 5.75
West Palm Beach/Palm Beach County, FL United States SF USD Year 1.00 22.25 37.25 22.25 37.25 8.50
White Plains, NY United States SF USD Year 1.00 18.26 32.06 18.26 32.06 8.00
meAsUrecBD reNT
LOcAL cUrreNcYcBD reNT Us
DOLLArs/sq fT/Yr

trends and forecast | 2012 | office | GLoBAL
www.cOLLiers.cOm
class A Gross rent – The average rent quoted per square foot per annum for Class A office building within the CBD plus additional costs such as property taxes, service charges or operating expenses.
class A Net rent – The average rent quoted per square foot per annum for a Class A office building within the CBD.
class A (Prime) Buildings – Most prestigious building competing for premier office users with rents above average for the area. Buildings have high quality standard for finishes, state-of-the-art systems, exceptional accessibility and a definite market presence.
Characterized by: Prime central locations; first-class tenant improvements; on-site parking; state of the art elevators and HVAC systems; concrete and steel construction; contemporary design and architecture; high quality of upkeep and maintenance; ability to command a premium rent within the relevant market. The Class A building designation implies that the size of the building is “significant” in accordance with the market.
> AmericAs
James [email protected]
> eUrOPe, miDDLe eAsT AND AfricA
mark charltonUnited [email protected]
Bruno [email protected]
Damian harringtonEastern [email protected]
GLOBAL reseArch cONTAcTs
GLOssArY
quoted currency – The currency quoted locally in all lease transactions. Not necessarily national currency. (Note: Chile utilizes Unidad de Fomento, which equals USD 24.30)
Time Period – The standard way in which leases are quoted. Usually on a per month or per year basis.
existing inventory – Existing office floor space (Classes A, B and C) within each city’s CBD (central business district).
Under construction – The total office floor space (Classes A, B and C) within each city’s CBD (central business district) which is under construction, but not yet completed, giving an indication of the development pipeline for each market. This includes both available and pre-let floor space.
Unit – The normal convention locally in which area is measured. Usually on a per square foot or per square meter basis.
Vacancy rate (%) – The percentage of the inventory (total completed office floor space, Classes A, B and C, within the CBD) which is unoccupied.
cOLLiers iNTerNATiONAL
601 Union Street, Suite 4800Seattle, WA 98101TeL +1 206 695 4200
Copyright © 2012 Colliers International.
The information contained herein has been obtained from sources deemed reliable. While every reasonable effort has been made to ensure its accuracy, we cannot guarantee it. No responsibility is assumed for any inaccuracies. Readers are encouraged to consult their professional advisors prior to acting on any of the material contained in this report.
Accelerating success.
reGiONAL AUThOrs/cONTriBUTOrs
James Cook (U.S.)Jeff Simonson (U.S.)KC Conway (U.S.)Cliff Plank (U.S.)Flavio Gómez Aranzubia (Mexico)Zuzanna Baranowska (EMEA)Mark Charlton (U.K.)Dr. Walter Boettcher (U.K)Yumiko Yasada (Japan)Simon Lo (Asia)Nerida Conisbee (Austrialia)Ian MacCulloch (Canada)Alan McMahon (New Zealand)Chia Siew-Chuin (Singapore)Arthur Yim (Hong Kong)Damian Harrington (CEE)Carlby Xie (North China)
522 offices in 62 countries on 6 continentsUnited States: 147Canada: 37Latin America: 19EMEA: 118Asia Pacific: 201
• $1.8 billion in annual revenue
• 1.25 billion square feet under management
• More than 12,300 professionals
Lauren Chlebowski | Global Brand Designer
> AsiA PAcific
simon [email protected]
Nerida conisbeeAustralia/New [email protected]
Amit [email protected]
Yumiko [email protected]