2013 attainment report - maryland department of transportation
TRANSCRIPT

on Transportation System PerformanceImplementing the Maryland Transportation Plan &
Consolidated Transportation Program
2013 AnnualAttainment Report
Martin O’Malley, GovernorAnthony G. Brown, Lt. Governor
Darrell B. Mobley, Acting Secretary

Darrell B. MobleyMaryland Acting Secretary of Transportation
On behalf of Governor Martin O’Malley, I am pleased to present Maryland’s 2013 Annual Attainment Report on Transportation System Performance. Every year, the Maryland Department of Transportation (MDOT) publishes the Annual Attainment Report to assess our progress and to identify future strategies necessary to improve the transportation services we deliver to Marylanders. Under Governor O’Malley’s leadership, we continue to place a high priority on preserving and improving the State’s transportation system, while supporting Maryland’s economic competitiveness, environmental stewardship and quality of life.
In recent years, limited resources for transportation investment resulting from the economic downturn and uncertainty in the stability of federal transportation funding has influenced how MDOT makes decisions about prioritizing investments. MDOT continues to manage our assets carefully and efficiently by controlling costs, closely monitoring revenues and expenditures, capitalizing on federal grant opportunities and partnering with local governments and the private sector in creative ways to address transportation funding challenges.
In FY2012, MDOT secured new federal grant awards that include $40 million to replace the aging Kirk Avenue bus facility in Baltimore City and $10 million to construct a missing link in the Anacostia Riverwalk Trail between Bladensburg and Washington, D.C. Through the Seagirt Marine Terminal public-private partnership with Ports America Chesapeake, Maryland has already saved hundreds of millions of dollars in capital improvements at Seagirt, including the completion of a new 50-foot deep berth. These improvements put Baltimore in the enviable position of being one of only two ports on the East Coast that can handle the bigger ships that will use the newly widened Panama Canal when it is completed in 2015.
There are encouraging signs that the economic picture is improving, given recent activity at two of Maryland’s transportation hubs – Baltimore/Washington International Thurgood Marshall Airport (BWI Marshall) and the Port of Baltimore. BWI Marshall is on pace to eclipse its annual passenger record after setting an all-time monthly record for passengers in July 2012,
i
M e s s a g e f r o M t h e :
acting secretary of transportation
and 2011 was the busiest year to date. The Port of Baltimore set all-time monthly cargo records in April and July of 2012, with general cargo tonnage up 11 percent over 2011. Extensive investments have been made over the past few years to expand and maintain these two critical transportation assets, and with new investments underway, including a terminal expansion at BWI Marshall, we expect they will continue to generate significant economic activity.
Careful management of our financial resources has permitted us to continue to maintain and improve our transportation system. In FY2012, the Maryland Aviation Administration (MAA), Maryland Transit Administration (MTA), and State Highway Administration (SHA), completed eleven major projects to improve the operation, capacity, and safety and security of the transportation system. In addition, MDOT and its modal agencies completed 228 system preservation projects that help to maintain Maryland’s transportation system.
In addition to helping build Maryland’s economy and improving the transportation system, MDOT remains focused on building a more environmentally sustainable transportation network. As part of Governor O’Malley’s Smart, Green & Growing initiative, MDOT implements programs to facilitate walking and bicycling as low-cost, environmentally friendly and healthy transportation options. In 2012, as part of Governor O’Malley’s CycleMaryland initiative, more than 50 grants totaling $7.8 million were awarded to create new bikeway connections and to bring bikeshare stations to Maryland. Additionally, we invested nearly $11.5 million in bicycle and pedestrian retrofit projects. Maryland continues to improve in the national ranking of Bicycle Friendly States, moving from number 10 to number 8, in the League of American Bicyclists 2012 review.
In the past two years, SHA, the Maryland Transportation Authority (MDTA), and the Intercounty Connector (ICC/MD200) project team have received 16 different awards as part of the successful completion and opening of the ICC/MD200 from I-370 to I-95. We are proud to announce that in 2012, for the second year in a row, MDOT received national recognition from the Association of Government Accountants for both our annual Attainment Report and performance management programs. We invite you to review our annual performance results in this 12th edition, as we continue to move forward in improving our transportation system, helping improve Maryland’s economy, protecting and enhancing our environment and Maryland’s quality of life.
Acronym AgencymDoT Maryland Department of TransportationmAA Maryland Aviation AdministrationmPA Maryland Port AdministrationmTA Maryland Transit AdministrationmDTA Maryland Transportation AuthoritymVA Motor Vehicle AdministrationSHA State Highway Administration
The State of maryland also supports:WmATA Washington Metropolitan Area Transit Authority
Maryland Transportation Agencies

message from the Secretary of Transportation_______________ i
Summary _______________________________________________ iii
Introduction & overview _________________________________ 1
Quality of Service _______________________________________ 13
Safety & Security _______________________________________ 19
System Preservation & Performance ______________________ 25
environmental Stewardship ______________________________ 35
connectivity for Daily Life _______________________________ 43
glossary _______________________________________________ 51
List of Performance measures ____________________________ 52
i i
table of Contents

i i i
goal–Quality of Service
• Total maintenance expenditures increased back to pre-fiscal year(FY) 2010 levels, allowing SHA to address maintenance that was deferred in previous years and to place emphasis on maintenance that helps to improve water quality consistent with Chesapeake Bay restoration goals.
• OntimeperformanceofMTAservicesinFY2012improvedorremainedon-par with FY2011 performance except local bus and light rail which both decreased by 2%. MTA has invested in Automatic Vehicle Location Systems (AVL) to obtain a more accurate picture of local bus performance and to better inform route planning.
• Averagetruckturn-aroundtimeatSeagirtMarineTerminaldecreasedto30 minutes, its lowest time for a pick-up or drop-off since performance tracking started in 2001.
• CustomervisittimeatMVAbranchofficesdecreasedforthefifthyearin a row to 27 minutes and customers rating service as “good” or “very good” at MVA branch offices increased to 91%.
• TheMAAbeganconstructiononamajorterminalenhancementprojectat BWI Marshall, planned for completion in the summer of 2013. The project includes a new security checkpoint and expanded gate and concourse areas with new services for airport travelers.
• The number of toll transactions increased by seven million and thepercent of toll transactions collected electronically increased to 71% in FY2012 due to the opening of the ICC/MD 200 from MD 97 to I-95 and a public outreach campaign to encourage use of E-ZPass®.
• MDTA’sVehicleRecoveryTechnicians(VRT)assisted35,000motoristsalong eight toll facilities.
goal–Safety & Security
• TheCY2011fatalityrateof0.87fatalitiesper100millionmilestraveledon Maryland roadways is equivalent to nine less fatalities on Maryland roads in 2011 compared to 2010. The fatality rate in Maryland is 20% lower than the estimated CY2011 national rate of 1.09.
• ThenumberofpedestrianfatalitiesandinjuriesonallroadsinMarylandis estimated to remain slightly below the 10-year annual average of 105 fatalities. In 2011, the SHA established an official pedestrian safety task force, identified 24 high-crash locations across Maryland to focus additional resources, and has adopted an official Complete Streets policy for all SHA projects, to help address this priority issue.
• BasedonpreliminarydataforCY2012,thepreventableaccidentratesonMTA local bus services is anticipated to decrease almost 35% compared to CY2011. The decrease is attributed to new MTA programs to increase operator accountability through re-training and corrective action.
• AnnualsafetyinspectionsbytheFederalAviationAdministrationatBWIMarshall showed passage of inspection and compliance with all federal mandates, and annual safety inspections by the U.S. Coast Guard at all MPA-owned facilities at the Port of Baltimore showed compliance or exceeding compliance of all federal mandates.
goal–System Preservation & Performance
• SHA’s traffic monitoring, traveler information, incident management andtraffic management program, known as the Coordinated Highways Action Response Team (CHART), saved Marylanders approximately $1.1 billion in vehicle travel costs in CY2011.
• Asaresultofanaggressivebridgerehabilitationprogram,thenumberofSHA bridges that are structurally deficient decreased from 106 bridges in April 2011 to 97 bridges in April 2012.
• Passengersperrevenuevehiclemile,ameasureofMTAserviceproductivity,increased or stayed constant across all MTA modes in FY2012, including a 17% increase for local bus.
• MTAoperatingcostperpassengertrip,ameasureofMTAserviceefficiency,increased for all modes in FY2012 due to rising fuel costs, labor costs and contract increases, however cost growth remains in line or below historical trends.
• Use of MVA’s Alternative Service Delivery (ASD) methods (e.g., servicesavailable on-line and through MVA Kiosks) increased five percentage points from FY2011 levels while average cost per transaction continued to steadily decrease, remaining below MVA’s $14 per transaction target.
• Whencostperenplanedpassenger(CPE)dataisadjustedforinflation,theCPE passenger at BWI Marshall decreased slightly in FY2012 to $9.29, while the average cost for comparable nearby airports continues to increase ($15.50 in 2012).
• MPAdoubled itsnetoperating incomeinFY2012to$18.5milliondue inpart to savings from ongoing public-private partnerships and cargo tonnage and cruise ship passenger volumes that exceeded budgeted expectations for FY2012.
Below are some of the performance results over the past year contained in this 2013 report.
summary
summ
aryi v
goal–environmental Stewardship
• SHA exceeded goals for miles of stream restoration (5.7 miles byend of FY2011) and met goals for acres of wetlands restoration (200 acres by end of FY2012). SHA has identified $138.2 million in the FY2013–FY2018 CTP to focus environmental stewardship activities on helping Maryland meet new water quality standards for restoring the Chesapeake Bay.
• TheMPAsupportedattainmentofairqualitystandardsandMaryland’sGreenhouse Gas Reduction Act by investing in four container cranes, which can lift 187,300 pounds of cargo and are fully electric, emitting no diesel emissions.
• SHAhasevolveditsfleetoverthelastsevenyearsresultingina21%decline in fuel consumption. A 3% increase in FY2012 is representative of SHA reaching a plateau in achieving maximum fleet efficiency. SHA is continuing to enforce anti-idling policies, and in FY2012 purchased three hybrid and 15 flex-fuel vehicles.
• The number of vehicles tested at MVAVehicle Emissions InspectionProgram (VEIP) stations increased to over 1.7 million in FY2012, with 91% of vehicles in compliance.
• MTAadded57newdiesel-hybridbusestoitsfleetinFY2012,increasingthe number of hybrid buses in MTA’s fleet to 268 buses, or 40% of the entire fleet. In tests comparing hybrid buses to diesel buses, hybrids use 20% less fuel and are up to 50% quieter.
goal–connectivity for Daily Life
• InCY2011,congestiononMaryland’sfreewaysandarterialsremainedat levels consistent with the last 10 years of performance. SHA has improved operations on arterials through the retiming of 298 signals in CY2011. In addition, MDTA and SHA are continuing critical capacity expansion projects, including the I-95 express lane project.
• AverageweekdayridershipacrossMTAservices(allmodes)increasedby 2% in FY2012 and has increased by 18% since 2006.
• BWI Marshall increased the number of nonstop markets served, upfrom 75 in FY2011 to 76 in FY2012.
• TotalgeneralcargoattheMPA’spublicterminalsreachednearlyninemillion tons in 2011, which is second only to volumes in 2008; foreign cargo tonnage for the whole Port of Baltimore increased to 37.8 million tons, its third highest level on record.
• MVA continues to meet the needs of partner government and non-governmental agencies by maintaining system availability above 99% and continuing improvements to system security and access.
• MDTAdiscontinuedtheHatemBridgeAutomaticVehicleIdentification(AVI) decal toll collection process and added two new E-ZPass® only lanes at the Hatem Bridge (US 40) Toll Plaza expanding use of the E-ZPass® in Maryland.
Please visit MDOT’s transportation highlights at: http://www.mdot.maryland.gov/ Office%20of%20Planning%20and%20Capital%20Programming/Dashboard/Final/Introduction
Each year, the Maryland Department of Transportation (MDOT) provides a transparent evaluation of the performance of the Maryland transportation system in the form of the Annual Attainment Report on Transportation System Performance. The Annual Attainment Report reviews performance trends for all modes of transportation within the state, indicating the progress towards achieving the goals and objectives in the Maryland Transportation Plan (MTP) and through the Consolidated Transportation Program (CTP).
MDOT has published the Attainment Report annually since 2002, presenting performance results for Maryland’s multimodal transportation system, focusing on – the user’s experience, safety and security, system condition, protection of Maryland’s natural environment, balanced growth and development and support of economic growth.
The 2013 Attainment Report provides a discussion of how MDOT and its agencies are working together to achieve the goals of the MTP. Each chapter provides a clear accounting of the progress that has been made, as well as future strategies where additional emphasis might be required for success. The five chapters, consistent with the five goals of the MTP, include:
Quality of Service: Enhance users’ access to, and positive experience with, all MDOT transportation services;
Safety & Security: Provide transportation assets that maximize personal safety and security in all situations;
System Preservation & Performance: Protect Maryland’s investment in its transportation system to preserve existing assets and maximize the efficient use of resources and infrastructure;
environmental Stewardship: Develop transportation policies and initiatives that protect the natural, community and historic resources of the State and that encourage development in areas best able to support growth; and
connectivity for Daily Life: Support continued economic growth in the state through strategic investments.
Transportation System HighlightsTravel by Land
• MarylandTransitAdministration (MTA) ridership reached153millionin FY2012, including 40.9 million on Locally Operated Transit Systems (LOTS). In addition, Maryland ridership on the Washington Metropolitan Area Transit Authority (WMATA) system is comparable from last year, at nearly 124.5 million riders in Maryland in 2012.
• InFY2012,theCoordinatedHighwaysActionResponseTeam(CHART)incident management program responded to and cleared more than 17,000 incidents and assisted more than 27,000 stranded motorists.
• SHA completed seven major bridge and highway projects in FY2012including widening of the Baltimore-Washington Parkway (from I-695 to I-195) in Anne Arundel County, upgrades to MD 404 (Shore Highway) in Caroline County and improvements to MD 5 (Branch Avenue) in Prince George’s County. In addition, SHA completed rehabilitation projects on 42 highway segments and 44 bridges in FY2012, totaling over $100 million invested in the preservation of Maryland’s highway system.
• TheSHAandtheMDTAcontinuetoplacespecialemphasisonimprovingthe condition of bridges, a special area of primary focus for the State. Major MDTA bridges including the Chesapeake Bay Bridge (US 50), the Francis Scott Key Bridge (I-695), the Millard E. Tydings Bridge (I-95) and the Governor Harry W. Nice Bridge (US 301) are planned to undergo major preservation and maintenance activities in the FY2013–FY2018 CTP. SHA is planning for numerous bridge projects including the superstructure replacement of the MD 193 bridge over I-495, the replacements of the Middletown Rd. bridge over I-83 and the MD 4 bridge over MD 223, as well as multiple ongoing bridge replacements on I-695, including at MD 144 and MD 372.
• Recent multimodal planning efforts have focused on implementingTransit-Oriented Development (TOD) projects at 15 designated locations across Maryland.
• Over 12.1 million Motor Vehicle Administration (MVA) transactionswere processed in FY2012, including eMVA and walk-in transactions at MVA’s branch office locations.
1
Travel by Air
• More than 22 million passengers flew through Baltimore/WashingtonInternational Thurgood Marshall Airport (BWI Marshall) to U.S. and international destinations in CY2011.
• On average, 680 commercial flights arrive or depart from BWI Marshall each day.
• Thereare18publicly-ownedairportsand18privately-ownedairportswithpublic use available to Marylanders.
• TheBWIMarshall FireandRescueDepartmentdispatchedequipment forlocal emergencies 1,306 times in FY2012.
Travel by Water
• Port foreign cargo tonnage increased to 37.8 million tons in CY2011,which was the third highest tonnage for the whole Port. Maryland Port Administration’s (MPA) general cargo tonnage increased to a record high of 9.3 million in FY2012.
• InCY2012,100internationalcruisesembarkedanddebarkedattheMPACruise Maryland terminal.
Introduction &overview

Introduction & overview
2
Transportation Priorities, Policy and Investment Integrating multimodal Transportation
MDOT is unique among state departments of transportation in that it has direct coordination and oversight of multiple modes of transportation in the state. This structure allows MDOT to facilitate the strategic development of Maryland’s intermodal transportation network across the following five transportation agencies:
• maryland Aviation Administration (mAA) operates BWI Marshall and Martin State Airport, a general aviation/reliever airport northeast of Baltimore;
• maryland Port Administration (mPA) promotes the Port of Baltimore as a leading hub for cargo and for cruise activity;
• maryland Transit Administration (mTA) provides local and regional public transit services on bus and rail, as well as grant funding and technical assistance to LOTS across Maryland;
• motor Vehicle Administration (mVA) is the gateway to Maryland transportation infrastructure providing a host of services for vehicles and drivers, including registration and licensing; and
• State Highway Administration (SHA) manages the State’s highway system, which includes 17,042 lane miles of roads and 2,578 bridges.
In addition, the MDOT Secretary serves as Chairman of the:
• maryland Transportation Authority (mDTA), which owns, operates and maintains the State’s eight toll facilities; and
• Supports the Washington metropolitan Area Transit Authority (WmATA) which operates Metrorail and Metrobus services that connect Washington, Maryland and Virginia.
guiding maryland’s Transportation System
Every year MDOT publishes the State Report on Transportation (SRT) that includes the MTP, the CTP and the Attainment Report. These three documents present the full range of MDOT’s transportation activities, including: setting long range goals for transportation in Maryland; prioritizing, funding, and implementing a six-year capital program; and, tracking accomplishments and overall performance of the transportation system.
The MTP provides a 20-year vision for transportation in Maryland. It provides goals and objectives to guide how transportation enhances Maryland’s economy, the environment, and how it supports quality of life for Marylanders. The update of the MTP is currently being developed. Over the coming year the development process will include extensive outreach to citizens, stakeholders groups and other State agencies to gather input on Maryland’s transportation vision and goals for the next 20 years.
The CTP is the six-year capital budget outlook for all transportation projects for MDOT’s Modal Administrations and the Authority. This year’s CTP (FY2013–FY2018) responds to the goals of the 2009 MTP, reflects the priorities of the O’Malley/Brown Administration, is influenced by the concerns of the public and local governments, and addresses all Federal and State mandates related to transportation.
ensuring Strategic Transportation Investments
To ensure that every dollar available for transportation in Maryland is efficiently spent, MDOT employs a strategic decision making process, using specific criteria to prioritize programs and projects under consideration for inclusion in the CTP. This process is used to ensure transparency and accountability, and to clarify how each major capital project is responsive to the goals of the MTP and is linked to local and regional Metropolitan Planning Organization (MPO) plans. The process also ensures that MDOT supports existing project commitments, meets all Federal and other legal mandates, and optimizes the State’s ability to maximize Federal revenue opportunities.
MDOT works together with residents, local jurisdictions and local and State elected officials to include projects in the CTP that address critical safety issues, preserve existing investments, support local and/or statewide economic development, protect the environment, enhance multimodal transportation services and improve accessibility throughout the state. For each major project in the CTP, there is a Project Information Form that describes the project objective, current status, justification, consistency with MTP and Smart Growth goals, and funding by project phase over the six-year program cycle. This information provides Marylanders with a transparent view of all components of MDOT’s transportation investments.
Promoting Sustainable Transportation
MDOT recognizes the importance of Maryland’s sensitive ecological system through a proactive approach for integrating environmental protection, compliance, and sustainability into the policies, planning, and day-to-day operations of all the Modal Administrations and the Authority. In addition to agency-specific environmental initiatives, MDOT coordinates with State, local and Federal partners to ensure that transportation investments minimize negative impacts to our environment. MDOT achieves this by using the State’s Green Infrastructure Plan and Chesapeake Bay restoration priorities as a guide for project mitigation activities, such as wetland restoration and tree planting, and for reducing the impact of existing infrastructure and services with new storm water management technologies and energy efficient and low emissions technologies. Together these approaches help to reduce the impacts of our activities on human health, the natural environment and the global climate. A selection of this year’s new and ongoing initiatives includes:
• Implementation of Smart, Green & Growing initiatives, designed to create a more sustainable future for Maryland, including adopting Smart Growth policies, improving transit and supporting community revitalization.
• Managementofstormwaterrunofffrommultimodaltransportationinfrastructure to promote healthier, cleaner habitats and reduce pollution in the Chesapeake Bay.
• Identification and tracking of transportation infrastructurevulnerable to the impacts of climate change and developing strategies to address these impacts in cooperation with the development of Maryland’s Climate Action Plan.
• Promotion of lower emission travel modes, technologies, andpractices, including Travel Demand Management (TDM), walking, bicycling, hybrid and electric transit and fleet vehicles, and the expansion of alternative fueling infrastructure, including electricity, at locations such as MDOT headquarters, BWI Marshall and park-and-ride lots across the state.
• ParticipationintheElectricVehicleInfrastructureCouncil,createdthrough State legislation in 2011 to develop strategies to facilitate the successful widespread integration of electric vehicles and electric vehicle infrastructure into the transportation system.

Transportation Trust Fund Sources
FY2013-FY2018 CTP
3
Intr
oduc
tion
& o
verv
iew
Operating Revenue (10%)
Bonds (8%)
Federal-aid (18%)
Other (2%)
Motor Fuel Taxes (19%)
Vehicle Titling Taxes (21%)
Registration & MVA Fees (18%)
Corporate Income Taxes (4%)
maryland’s Investment in Transportation
A primary component of developing the CTP is establishing funding levels for multimodal transportation investments across the full scope of transportation system development and preservation activities in Maryland. MDOT applies fiscal resources from the Transportation Trust Fund (TTF), a dedicated account generated through taxes, fees, bond proceeds and federal funds, towards projects and programs across all MDOT offices and the modal agencies. This integrated fund enables the direct linkage between multimodal transportation planning and transportation solutions, supporting priority operating and capital needs across the state. MDOT works with the available and forecasted resources of the TTF, which are heavily influenced by the state and national economic conditions, projections of State transportation revenue and the availability of federal funding.
On June 6, 2012, the President signed into law the Moving Ahead for Progress in the 21st Century (MAP-21) P.L. 112-141 - new legislation that establishes federal funding for highway and transit programs and sets national, statewide and metropolitan transportation planning and policy direction for the next two years. Since MAP-21 did not increase funding levels, and did not address the long-term solvency of the Federal Highway Trust Fund, MDOT expects its federal receipts (approximately $580.0 million for highways and $170.0 million for transit) to be used for committed capital program projects and for continued system preservation.
MDOT carefully manages and applies all available funds to ensure the most efficient expenditure of dollars to serve Maryland’s transportation needs, and to support economic success in the state. For example, in the FY2013–FY2018 CTP, $921.8 million is programmed in FY2013 towards system preservation to fund maintenance of current assets, which protects and ensures safe operation of Maryland transportation agencies’ investments. MDOT and its modes also track the “percentage of budgeted dollars expended” as a way to compare the budget with borrowing levels and to avoid unnecessary borrowing. In FY2012, for example, MDOT expended 95% of its budgeted dollars, meeting its goal of 90%, and MTA spent 99% of its estimated FY2012 budget.
MDOT’s capital and operating budget allocations, CTP funding levels over the last decade, the FY2013–FY2018 CTP funding sources, capital and operating budgets by Modal Administration and WMATA are shown in the following pie charts. As MDTA is independently funded through separate sources, its capital and operating budget are shown separately.
generating Jobs for maryland
Demand for transportation services, including modernization and expansion projects that enhance Maryland’s highways, public transportation, and freight facilities, and more, continue to generate jobs for Maryland residents.
As of June 2012, Maryland had designated 15 TOD sites. These projects, which create livable communities that support transit, by locating residences and business adjacent to transit stations, also generate job opportunities. For example, at the White Flint TOD site, in Montgomery County, the new Pike & Rose project will transform 24 acres of asphalt parking lots and an auto-oriented strip retail commercial center into a vibrant, walkable community with housing, retail, office and public spaces. This development is projected to generate 550 permanent jobs on-site and bring in $3.7 million in tax revenue.
Construction projects of all sizes also put Maryland residents to work, including a new $8.1 million dollar project to continue moving forward with access improvements at the Branch Avenue Metro Station in Prince George’s County. This investment puts people to work, relocating utilities required to eventually build a new four-lane access roadway to the Metro station.
The Port of Baltimore alone generates about 14,630 direct jobs to handle the millions of tons of waterborne cargo that comes across the Port’s docks every year, while in total, 108,000 jobs in Maryland are linked to Port activities.
Pursuing and winning federal grants for large-scale transportation improvements has also produced economic benefits for Maryland residents. MDOT was awarded $40.0 million to replace Baltimore’s 65-year-old Kirk Division Bus Facility with two sustainable “green” buildings. This project will put Marylanders to work modernizing and replacing the aging transit facility, and will house more than 350 MTA employees when completed.

Introduction & overview
4
MDOT Capital Budget (Millions) FY2013-FY2018 CTP*
* The FY2013-FY2018 CTP totals about $9.8 billion; $8.9 billion of which comes through the Trust Fund and $0.9 billion from “Other” fund sources.
Total MDOT Capital Budget - $10.13 Billion
MPA, $825.4 (8%)
MVA, $109.3 (1%)
MTA, $1,827.7 (18%)
WMATA, $1,412.4(14%)
SHA, $4,989.3 (49%)
TSO, $303.8 (3%)
MAA, $658.4 (7%)
MDTA Capital Budget (Millions) FY2013-FY2018 CTP
Total MDTA Capital Budget (Including ICC) – $2.26 Billion
System Preservation, $1,699.4 (75%)
System Enhancement (including ICC/MD 200), $564.6 (25%)
Total MDOT Operating Budget: $1.61 Billion
MTA, $658.5 (41%)
MPA, $46.7 (3%)
WMATA, $263.9 (16%)
MVA, $171.1 (11%)
TSO, $79.5 (5%)
MAA, $176.5 (11%)
SHA, $215.1 (13%)
Total MDTA Operating Budget - $258.7 Million
Administrative/General Costs, $72.0 (27.9%)
Division of Operations, $103.1 (39.9%)
Authority Police, $51.0 (19.7%)
Authority Police BWI Marshall/Port,
$23.9 (9.2%)
Maryland State Police, $8.6 (3.3%)
MDOT Operating Budget (Millions) FY2013
MDTA Operating Budget (Millions) FY2013
MDOT Total Capital Program Levels (Billions)
C o n s o l i d at e d t r a n s p o rtat i o n p r o g r a m
20
12
do
ll
ar
s (
Bil
lio
ns)
(CP
I A
dju
ste
d)
$6.0
$4.0
$2.0
$0.0
$8.0
$10.0
$12.0
11-16
9.8
04-09
10.3
05-10
9.4
06-11
10.6
07-12
10.5
08-13
9.9
09-14
11.3
10-15
9.1 10.1
12-17
9.8
13-18

5
Intr
oduc
tion
& o
verv
iew
Transportation Mobility andAccessibilityAccommodating Travel Demand
In 2011, Marylanders, visitors and freight drivers drove a total of 56.1 billion vehicle miles, approximately 100 million less miles than were travelled in 2010. Total transit ridership in Maryland in FY2012 (July 2011 to June 2012) eclipsed FY2011 by over 2.3 million transit trips (a 2% increase), hitting its highest level ever.
The economic downturn has resulted in driving levels from 2008 through the present holding steadily below the 2007 record of nearly 57 billion vehicle miles traveled. Over this same period, transit ridership in Maryland has continued to grow, from 96.7 million trips in FY2007 to over 112.1 million trips in FY2012. The combination of higher and more variable gas prices and MDOT programs to expand transit services and rider support programs are partially responsible for these trends.
Growing traveler and freight demand are forecast to increase the number of licensed drivers and registered vehicles in Maryland by 23% and 40% respectively by 2026. Many of these will be new users who will interact with the MVA to obtain their licenses and permits and to register their vehicles. To manage resources effectively to accommodate this demand, the MVA now employs Alternative Delivery Services (ADS), such as online registration.
Looking forward, MDOT expects that continued population and economic growth in Maryland will lead to significant growth in travel demand across all modes over the next 30 years. Maryland’s population in 2011, according to the American Community Survey, was 5,828,289, representing a 1%
C a l e n d a r Y e a r
nu
mb
er
of
Ve
hiC
le
mil
es
tr
aV
el
ed
(B
illi
on
s)
50.0
49.0
52.0
51.0
54.0
53.0
56.0
55.0
57.0
58.0
Annual Number of Vehicle Miles Traveled
56.2
2010
53.8
2002
54.7
2003
55.1
2004
56.6
2005
56.6
2006
56.8
2007
56.1
2008
55.6
2009
56.1
2011
56.1
2012*
* 2012 data is estimated.
increase from 2010. Evidence supporting the conclusion for long-term growth in travel demand is substantiated by projections developed by the Maryland Department of Planning, which show that by 2040, Maryland’s population will be over 6.8 million, an increase of 19% from 5.8 million today. This population growth is attributed in part to projected strong growth in jobs in Maryland, by over 22% from 2010 to 2040.
Where this population and employment growth occurs in Maryland will shape the types of demand on Maryland’s future transportation system, and the requirements to address that demand. The high cost of adding new capacity means that Maryland cannot simply build more highway lane miles or transit corridors to address vehicle miles of travel (VMT) growth, but must rather find ways to get the most out of the existing network. While this includes strategic capacity additions, SHA, MDTA, and MTA are also finding ways to increase the effectiveness of the existing roadway and transit network by operations strategies such as improved signal timing and coordination, faster incident response time, improved traveler information systems, priority transit systems and variable pricing on toll facilities, among others. Addressing travel demand also means encouraging land use and development design in a manner that supports transit use, walking, and bicycling and providing options for travelers as an alternative to driving. A balanced multimodal approach and thoughtful land use can provide forward thinking solutions to growing demand.
Governor O’Malley and Lieutenant Governor Brown announcing the opening of the Intercounty Connector (MD 200)

Introduction & overview
6
2005 2006 2007 2008 2009 2010 2011 2012
Registered Vehicles 4,604 4,690 4,752 4,774 4,736 4,816 4,809 4,822
Driver’s Licenses Issued 3,846 3,895 3,937 3,995 4,049 4,082 4,083 4,102
Motorcycle Licenses 221 230 237 244 252 257 217 224
Commercial Driver’s Licenses 153 160 164 167 168 170 173 177
MVA Transactions Per Year 11,991 12,562 12,542 12,388 12,263 11,011 11,917 12,139
MVA Transactions (thousands)
Induced Travel
When transportation conditions are improved to help accommodate growing travel demand and reduce congestion, one result that can occur is an additional increase in trips or travel distance – known as induced travel. While induced travel can be an indication of economic growth and increase in new travel options, it also may lead to increased air pollution, energy consumption and noise. It also means that the expected benefits of capacity improvements, as measured by congestion relief and travel time savings, may not be sustainable. Because of these potential negative impacts, MDOT and its partners are proactively managing induced travel through a number of approaches.
For example, MDOT works with other State and local partners to promote Smart Growth policies aimed at focusing growth in existing developed areas, or in targeted new growth areas (such as TOD). This approach manages induced travel by helping to build communities that are naturally more supportive of residents and employees completing trips using alternative modes. MDOT is an active partner with other State and local agencies in TOD, including ongoing construction at the Twinbrook TOD in Montgomery County (Phase II), Reisterstown Plaza TOD in Baltimore City and Owings Mills Town Center TOD in Baltimore County; completion of a TOD Master Plan for Aberdeen in Harford County; and continuing coordination with development teams who have initiated design work and the permitting process across multiple other sites in Maryland.

7
Intr
oduc
tion
& o
verv
iew
Balancing the multimodal Approach
Effective management of Maryland’s transportation system requires a balanced multimodal and multidisciplinary approach to expand mobility and improve transportation safety for all Marylanders. MDOT promotes the collaboration of professionals across many disciplines and reaches out to Marylanders from all areas of the state to identify the greatest transportation challenges and develop cost effective solutions to address them.
MDOT continues to direct funding to programs that encourage walking and bicycling and includes accommodation for pedestrians and bicyclists in roadway and transit projects whenever possible. While non-motorized travel currently accounts for a small fraction of total trips, that amount is growing and is an important component of the transportation system. Well-designed and safe pedestrian and bicycle facilities are relatively inexpensive, have minimal environmental impact and support public health. The $151.0 million programmed for bicycle and pedestrian projects in the FY2013–FY2018 CTP and the introduction of the new Maryland Bikeshare and Bikeways programs highlight Maryland’s ongoing commitment to improving bicycle and pedestrian mobility.
MDOT, through its support of multiple transit modes, helps expand mobility for all Marylanders. The MTA operates Local and Commuter Buses, Light Rail, Baltimore Metro Subway, MARC Train Service and a comprehensive Paratransit (Mobility) system. MTA also manages the Taxi Access system, and directs funding and statewide assistance to LOTS in each of Maryland’s 23 counties, Baltimore City, Annapolis and Ocean City, providing approximately $69.6 million in Federal and State grants in 2012. Through a regional compact, MDOT also supports WMATA, which provides transit service for Marylanders living and working in the Washington, DC region.
MDOT applies a balanced, multimodal approach to the multiyear implementation of the State’s Base Realignment and Closure (BRAC) Action Plan. In FY2012, approximately $20 million was expended and in FY2013, approximately $98 million is expected to be spent on directly-related BRAC projects. Elements programmed in the FY2013–FY2018 CTP that specifically address BRAC activities include intersection improvements, transit improvements, park-and-ride lot expansions, operations and maintenance efforts and system preservation projects. Under the BRAC Intersection Improvement Program, SHA analyzed projected near-term traffic impacts at 117 heavily impacted intersections and identified 19 intersections for improvement. MDOT and MTA are also collaborating with the U.S. Department of Defense and local officials to advance and expand successful TDM programs to support the growth of military installations due to BRAC. MDOT’s BRAC strategy works in concert with its commitment to TOD and Smart Growth. For example, the City of Aberdeen’s TOD Master Plan, developed with the assistance of MDOT, MTA and SHA, provides the opportunity to leverage the value of the land and redevelopment opportunities around the MARC/Amtrak station to address growth and change as a result of BRAC activities relocating to Aberdeen Proving Grounds.

Introduction & overview
8Transit Ridership–MTA Direct-Operated Services (thousands)
lo
Ca
l b
us
69,315
2010
66,736
2003
63,793
2004
63,241
2005
63,526
2006
64,272
2007
66,684
2008
69,846
2009
25,000
0
50,000
75,000
72,520
2011
lig
ht
ra
il
8,655
2011
7,387
2003
5,818
2004
4,875
2005
5,401
2006
7,122
2007
7,963
2008
8,712
2009
8,158
2010
15,000
0
30,000
f i s C a l Y e a r
ba
lt
imo
re
me
tr
o
20112003 2004 2005 2006 2007 2008 2009 2010
14,58813,196 12,426 12,863 12,919 13,226 13,955 13,567 13,364
15,000
0
30,000
Transit Ridership–Contracted Services and LOTS (thousands)
ma
rC
Co
nt
ra
Ct
ed
Co
mm
ut
er
bu
s 4,097
2011*
2,563
2003
2,704
2004
2,954
2005
3,193
2006
3,366
2007
3,716
2008
3,972
2009
3,859
2010
5,000
0
10,000
lo
ts
45,700**
2010
34,108
2003
34,745
2004
37,752
2005
40,694
2006
42,066
2007
42,118
2008
45,635**
2009
30,000
0
60,000
40,243**
2011
mo
bil
itY
pa
ra
tr
an
sit
& t
ax
i a
CC
es
s
1,660
2011
564
2003
542
2004
720
2005
965
2006
1,240
2007
1,385
2008
1,450
2009
1,485
2010
5,000
0
10,000
8,233
2011
6,336
2003
6,727
2004
6,884
2005
7,275
2006
7,505
2007
7,898
2008
8,081
2009
8,096
2010
5,000
0
10,000
f i s C a l Y e a r
f i s C a l Y e a r
Wm
at
a
123,177
20112003 2004 2005
120,534
2006
121,688
2007
125,939
2008
128,655
2009
123,588
2010
40,000
0
80,000
120,000
160,000
WMATA–Maryland-Only Transit Ridership*** (Rail, Bus, MetroAccess) (thousands)
110,384 112,220 115,139
73,579
2012
8,540
2012
2012
15,364
* 2011 data was revised from the 2012 Report.
** Data is estimated.
*** Maryland-only WMATA Ridership is an estimate: Maryland Metrorail ridership is calculated based on the 2007 rail passenger survey; Maryland Metrobus ridership is derived from ridership counts by line as of September, 2011; and Maryland MetroAccess ridership is from fiscal year 2011 actual ridership counts.
8,452
2012
4,290
2012
1,900
2012
40,908**
2012
124,451
2012

9
Intr
oduc
tion
& o
verv
iew
Providing Commuting ChoicesCommuters consider many criteria when choosing their travel mode to work, time and cost being the major factors. In 2011, based on data from the U.S. Census Bureau’s American Community Survey, Marylanders experienced an average commute time of 32.2 minutes, representing the longest average commute to work time in the nation. Many Marylanders continue to commute by driving alone due to personal needs, business requirements, or lack of other convenient travel options. In 2011, 73.3% of Maryland commuters drove alone. This share is well below the national average and places Maryland in the top 10 states with the lowest average drive alone to work mode share.
Maryland commuters shift commute preferences towards options other than driving alone as new opportunities are made available and as the cost of commuting by vehicle continues to be highly variable. MDOT works with MPOs, local governments, and other private and not-for-profit partners to deploy a variety of TDM strategies that support alternatives to driving alone such as traveler information, ridesharing, teleworking and variable pricing infrastructure programs. These activities are paying dividends – in 2011, Maryland commuters chose transit more frequently than commuters in any other state, with an average 9.2% transit commute to work share.
As part of Governor O’Malley’s Cycle Maryland initiative, in FY2012, MDOT kicked off the Maryland Bikeways Program and Maryland Bikeshare Program. The Bikeways Program supports planning, design and construction of projects that create and improve bicycle connections in Maryland to key destinations like work, school and shopping. The Bikeshare Program provides grants to help Maryland communities plan, establish or expand Bikeshare programs. Grants from these two programs in FY2012 totaled over $7.8 million, providing funding for over 50 Bikeways and Bikeshare grant recipients.
MDOT is supporting planning and engineering on high-priority transit projects including the Red Line in Baltimore, and the Purple Line in Montgomery and Prince George’s Counties, and implementation of the MARC Growth and Investment Plan. MDOT continues to work with State, local, and private partners to support TOD planning and joint-development projects across 15 designated TOD sites in the Baltimore and Washington D.C. regions.

Introduction & overview
2003 2004 2005 2006 2007 2008 2009 2010 2011
Drive Alone
75.2% 74.3% 73.6% 72.8% 74.3% 73.2% 73.4% 73.0% 73.3%
Carpool 10.5% 10.3% 10.9% 10.7% 10.2% 10.8% 10.0% 10.7% 10.1%
Transit 8.1% 8.3% 8.5% 8.8% 8.4% 8.5% 8.8% 8.6% 9.2%
Work at Home
3.1% 3.6% 3.7% 3.6% 3.6% 3.8% 4.1% 4.3% 4.1%
Walk 2.0% 2.1% 2.1% 2.6% 2.6% 2.3% 2.6% 2.3% 2.3%
Other 0.9% 1.2% 1.1% 1.1% 0.7% 1.0% 0.7% 0.7% 0.9%
Bicycle 0.2% 0.1% 0.2% 0.3% 0.2% 0.3% 0.4% 0.2% 0.3%
Mode Split for Maryland Commuters
Key Activities & Accomplishments
2001 Frederick MARC Extension, to Commuter Choice Maryland, 2005 Bicycle & Pedestrian Access Master Plan
2006 MTA Light Rail Doubletrack
2007 MARC Growth & Investment Plan, SHA Bike & Pedestrian Design Guidelines
2008 Southern Maryland Commuter Bus Initiative, BRAC Action Plan
2009 ARRA - LOTS, MTA, & WMATA Projects, Ongoing Park-and-Ride Lot Expansion
2010 Guaranteed Ride Home Expansion, Maryland TOD Designation, MTA Charm Card
2011 ICC Commuter Bus, MARC Penn Line Service, MARC Rail Car and Locomotive Replacement
2012 Maryland Bikeways and Bikeshare programs
Co
mm
ut
e m
od
e s
ha
re
(A
me
rican
Co
mm
un
itie
s S
urv
ey,
U.S
. C
en
sus)
80.0%
78.0%
76.0%
74.0%
72.0%
70.0%
68.0%
66.0%
18.0%
16.0%
14.0%
12.0%
10.0%
8.0%
6.0%
4.0%
2.0%
0.0%
1 0
CarpoolDrive Alone
Work at HomeTransit
OtherWalk
Bicycle

1 1
Intr
oduc
tion
& o
verv
iew
Air Travel in maryland
Since its opening in 1950, BWI Marshall has provided Marylanders access to locations throughout the U.S. as well as the rest of the world. The MAA, the operator of BWI Marshall, works hard to create and maintain its “easy-come, easy-go” reputation. On an average day, airlines serving BWI Marshall provide Marylanders with access to 67 domestic non-stop destinations and nine international non-stop destinations. In 2012, several new airlines started or announced new air service for BWI Marshall, including Condor Airlines to Frankfurt, Germany, and Spirit Airlines to Dallas/Fort Worth and Fort Lauderdale.
BWI Marshall served more than 22 million passengers in 2011, a growth rate of more than 2% from 2010, ranking it the 22nd busiest airport in the United States. In 2012, BWI Marshall is on track to break its annual passenger record, after setting an all-time monthly record for passengers in July. July 2012 was the busiest month in the history of BWI Marshall, and 2011 was the busiest year.
BWI Marshall supports the Maryland economy through passenger and freight services – moving more than 22 million people and 118,788 tons in 2011. Based on 2010 data, BWI Marshall’s economic impacts for Maryland include nearly 94,000 jobs, $3.6 billion in personal income, $5.6 billion in business revenue, and over $2.0 billion in local purchases.
Across Maryland, the MAA fosters the vitality of aviation and promotes safe and efficient operations, opportunities for economic growth and environmental stewardship. MAA owns and operates Martin State Airport, a general aviation reliever facility and a support facility for the Maryland Air National Guard and Maryland State Police. The MAA also develops and regulates aviation activities at the 36 public airports throughout the state, which are supported by State funds totaling approximately $34.8 million since 2002 (excluding federal funds and local airport funds).
Waterborne Travel in maryland
For more than 300 years, the Port of Baltimore has been a vital economic activity center in Maryland. The Port continues to generate revenue through traditional streams including passenger cruises and cargo movement, and through recent innovations, such as the Seagirt Marine Terminal Public – Private Partnership (P3) with Ports America. This P3 will save the State of Maryland hundreds of millions of dollars it otherwise would have had to invest in capital improvements and other necessary infrastructure at Seagirt.
The Port of Baltimore’s contributions to the economy of Maryland, the Mid-Atlantic, and nation, are significant. A 2011 study found that approximately 40,040 jobs in Maryland are generated by Port activity; of those, 14,630 are direct jobs. There are another 25,410 induced and indirect jobs generated by Port activity. There are over 68,000 jobs related, but not completely dependent on Port activity; they are with companies that chose to import or export cargo through the Port, but have other options if the Port was not available to them. In total, there are over 108,000 jobs linked to the Port. The Port is responsible for $3.0 billion in annual personal wages and salary, and $304.0 million in state and local tax revenues.
The Port of Baltimore has competitive advantage over other east coast ports – it is the closest port to Chicago and other Midwest markets; has direct access to both CSX and Norfolk Southern rail corridors and the I-95, I-81, and I-70 interstate corridors; and now includes one of only two 50-foot deep berths on the east coast at the Seagirt Marine Terminal, allowing it to accommodate Post-Panamax container ships once the Panama Canal expansion is complete in 2015.
In 2011, the Port of Baltimore saw a 15% increase in cargo from 2010, which marked the greatest increase of growth by any major U.S. port. The Port’s public and private marine terminals saw 37.8 million tons of foreign cargo cross their docks in 2011, up from 32.8 million tons in 2010. The total dollar value amount of that cargo was more than $51.4 billion, the Port’s highest dollar value ever and a 24% increase from 2010. Other records the Port established in 2011 include exporting 24 million tons of cargo, including 19.2 million tons of coal. The Port also shipped 551,000 auto units (highest in the U.S.).
More record-breaking performance continued in 2011, as 251,889 people sailed on 105 cruises from Baltimore, both of which are all-time records for the Port. Baltimore is ranked fifth among East Coast ports and 11th in the U.S. for most cruise passengers. Cruising from the Port of Baltimore contributes an estimated $90.0 million to Maryland’s economy, and approximately 220 direct jobs in Maryland are generated by cruise activity.
to
ta
l p
as
se
ng
er
s (
Mil
lio
ns)
C a l e n d a r Y e a r
16.0
18.0
20.0
22.0
24.0
21.9
2010
19.7
2003
20.3
2004
19.7
2005
20.7
2006
21.0
2007
20.5
2008
21.0
2009
22.4
2011
Total Annual Commercial Passengers at BWI Marshall Airport
22.8
2012*
* 2012 data is estimated

Introduction & overview
1 2
Improving the Movement of Goods—Maryland Freight ActivityMDOT is aggressively working to implement multimodal freight solutions, improve freight logistics and expand multimodal transportation options throughout the state. Chokepoints and aging transportation infrastructure impede goods movement within Maryland and along the entire eastern seaboard. With freight activity projected to double by 2030, the multimodal transportation system will come under increasing pressure. The 2009 Maryland Statewide Freight Plan outlines policies and investments critical to addressing current and projected goods movement challenges. MDOT and its modes/authority are committed to implementing key elements of this plan. Within the Attainment Report, there are seven measures that are related directly to the State’s freight goals established in the Plan that address the quality and efficiency of freight movement in Maryland.
collaboration with Freight Public and Private Partners
MDOT is leading efforts to improve the efficiency and effectiveness of freight movement throughout the state. For example, MPA’s private partner’s installed four supersized cranes at Seagirt Marine Terminal, ensuring that the Port of Baltimore can service the Post Panamax container ships of the future. Due to Maryland’s prominent location at the crossroads of several major freight corridors, eliminating freight transportation bottlenecks in Maryland can provide significant transportation and economic benefits to the Mid-Atlantic region. Through partnerships with neighboring states, freight stakeholders, and nonprofits, and through leadership in groups such as the I-95 Corridor Coalition, MDOT is participating in the development of multistate solutions to these issues. Additionally, MDOT recognizes the shared infrastructure nature of passenger and freight operations. MDOT remains diligent in its coordination of passenger and freight efforts for all modes.
Key Freight Initiatives Improving maryland’s economic competitiveness
MDOT is actively working with CSX to plan and develop a new freight rail-to-truck transfer facility, the Baltimore Rail Intermodal Facility. MDOT is also a partner in CSX’s National Gateway initiative, a partnership between the Federal government, six states, the District of Columbia and the railroad to create a double-stack rail network. These projects will improve freight rail connectivity and capacity through the Mid-Atlantic region.
• MDOTandMTAareundertakingalarge-scaleshortlinerailprojecttosustain rail movement along the Eastern Shore agricultural corridor. The stabilization effort will support soybean and grain exports.
• MDOT chairs the Freight Subcommittee on the Amtrak NortheastCorridor Commission, helping to ensure both Norfolk Southern and CSX have access to the corridor to accommodate the growth in freight rail.
• Maryland will continue to implement the truck safety programs andenforcement initiatives that have produced improved truck safety. Maryland consistently ranks in the top 10 states for commercial vehicle inspections. State officials will continue to reach out to the trucking community and the traveling public to educate about truck safety.
• Maryland will continue to advance truck parking capacity expansionthroughout the state. Maryland recently received a $2.6 million federal grant to construct 40 new truck parking spaces at the southbound welcome center on I-95 in Howard County to address a severe shortage of commercial vehicle parking along this portion of the I-95 corridor.
• TheMDTAPoliceCommercialVehicleSafetyUnit(CVSU)willcontinueits aggressive commercial vehicle inspection and enforcement program. During FY2012, 25,904 commercial vehicle inspections were performed resulting in 3,839 commercial vehicle operators and 4,684 overweight vehicles being placed out of service. This enforcement helps to safeguard the general public, as well as prevent damage to roadways from excessive vehicle weights or unsecured cargo.
• MDTA Police CVSU continued to partner with Federal, State and local agencies to perform joint inspection and enforcement operations. The unit’s efforts continued to address concerns regarding commercial vehicles using local roadways to avoid inspection and weight enforcement.
• Virtualweighstationswillbeinstalledatkeylocationsstatewide,suchas one recently completed on I-83. Virtual weigh stations are real-time automated tools capable of capturing the speed, identity and weight of a commercial vehicle moving at highway speeds. This increases the State’s ability to monitor for safety and ensure properly weighted vehicles on Maryland’s road network.
MTP GOAL 2012 AR FReIGHT ReLATeD MeASuReS PAGe
Quality of Service
(MPA)–Average truck turn-around time at Seagirt Marine Terminal 17
(SHA)–Percentage of the Maryland SHA network in overall preferred maintenance condition
14
Safety & Security
(MVA/SHA/MDTA)–Annual number of traffic fatalities and personal injuries on all roads in Maryland
20
System Preservation & Performance
(SHA & MDTA)–Number of bridges and percent that are structurally deficient 26
(SHA & MDTA)–Percent of roadway miles with acceptable ride quality 26
Connectivity for Daily Life
(MPA)–Port of Baltimore foreign cargo and MPA general cargo tonnage 49
(SHA & MDTA)–Percent of freeway lane-miles and arterial lane-miles with average annual volumes at or above congested levels
44
Performance Measures
MeTHOD FOR MOVING FReIGHT
TOTAL VALue (Millions)
TOTAL TONNAGe (thousands)
Air** $3,206 118,788
Other*** $47,933 12,826
Rail $6,923 24,139
Truck $259,822 305,148
Water$51,391**** foreign: 37,844*****
domestic: 13,500******
All Freight $369,275 512,245
Originating and Terminating Freight in Maryland*
* Source: U.S. Department of Transportation Freight Analysis Framework (FAF3) Version 3. Other, Rail, and Truck value and tonnage data is estimated based on FAF3 data. The data is adjusted yearly to account for previous year actual data and a 2% annual growth rate consistent with the Federal Highway Administration’s Freight Summary 2008. The 2% growth rate reflects a conservative estimate of domestic and international freight growth given current economic conditions.
** Source: BWI Marshall report to Airports Council International (2011).
*** Freight consists largely of postal and courier shipments weighing less than 100 pounds and other intermodal combinations.
**** Value of international cargo only.
***** Source is MPA-compiled data for 2011.
****** Source: MPA and U.S. Army Corps of Engineers (2010).

Objectives• Enhancecustomerexperienceandservice
• Providereliableandpredictabletraveltimeacrossmodal options for people and goods
• Facilitatecoordinationandcollaborationwithagencypartners and stakeholders
mDoT: Continue coordination with other State agencies through the Governor’s FastTrack Program to expedite mixed-use, Transit-Oriented Development (TOD) projects, such as the Pike and Rose TOD at White Flint Metrorail Station in Montgomery County.
mAA: Deliver a major terminal enhancement project at Baltimore/Washington International Thurgood Marshall Airport (BWI Marshall) to improve and modernize the BWI Marshall passenger terminal facility.
mPA: Expand cruise offerings at the Port of Baltimore, such as the newly renovated Royal Caribbean Grandeur of the Seas which will return back to the Port of Baltimore in 2013. The ship is currently undergoing a $48 million revitalization that will include many of the company’s most innovative features that are available on its two largest class ships.
mTA: Continue expanding the use of Automatic Vehicle Locator (AVL) technology to provide MTA’s customers with real time arrival information and assist MTA in better monitoring on time performance.
mDTA: Through an innovative Public Private Partnership (P3) agreement, reconstruction and improvements have begun to the two aging travel plazas (the Maryland and Chesapeake Houses) along I-95 in northeast Maryland. Project estimated completion, summer 2014.
mVA: Continue to improve online services, such as MVA’s FastTrack Licensing, that allows Marylanders to quickly and easily conduct a number of motor vehicle services for all vehicles that are associated with a driver’s license number.
SHA: Continue to enhance the accuracy and timeliness of traveler information through “My 511 Direct” traveler services and the Coordinated Highways Action Response Team (CHART) website.
Key Initiatives
Performance Measures
For people living in, traveling through, and doing business in Maryland, quality of service means access to transportation infrastructure and services that help them reach their travel destinations conveniently, comfortably and on time. Quality of service is important to Marylanders, as a reliable, well-maintained and efficiently-operated transportation system contributes to a strong economy and a high quality of life by reducing delay, offering diverse transportation options, and providing up-to-date information about the Maryland transportation system.
To deliver the quality of service that Marylanders expect, MDOT and its modal agencies keep pace with the age of instant information and information technologies by offering many real-time information services to assist travelers in planning where and when to travel and by what mode. These essential information services include initiatives such as the Maryland 511 traveler information system that encourages travelers to “Know Before You Go.” The system provides travel information via the web or phone on State-maintained roadways, including travel time, incident or work zone lane closures weather reports, and connections to transit, airport, and tourism information. SHA also provides motorist information signs along highways to alert drivers to real-time travel conditions. The MTA works to improve the timeliness of transit service as well as transit information – several of MTA’s transit rider services and tools have been adapted to work seamlessly with mobile devices, including the MTA Trip Planner, Service Status, Service Alerts and Elevator/Escalator Outages. This year, MTA will test and implement its real time passenger information system. The MVA offers an ever-increasing number of online MVA services, including online State Identification (ID) card renewal.
Quality of service also means providing the best value for each transportation investment. To achieve this end, MDOT applies a strategic decision making process and carefully selects transportation projects and invests in programs to ensure that public dollars are invested in an efficient and cost effective manner.
MONITORING AGeNCY
PeRFORMANCe MeASuRe
PAGe
MAA Percent of BWI Marshall customers rating the airport “good” or “excellent” on key services
17
MPA Average truck turn-around time at Seagirt Marine Terminal 17
MTA Percent of service provided on time 15
MTA Customer satisfaction rating 16
MDTA Overall customer satisfaction of E-ZPass® customers 18
MDTA Percent of toll transactions collected electronically 18
MVA Branch office customer visit time versus customer satisfaction rating 16
SHA Maryland driver satisfaction rating 14
SHA Percentage of the Maryland SHA network in overall preferred maintenance condition
14
1 3
g o a l :
Quality of service

SHA: Maryland Driver Satisfaction RatingCustomer Satisfaction Surveys help determine if SHA services are better than average in the eyes of its customers. SHA strives to achieve a “B” grade, which is equivalent to a four out of five rating.
Why Did Performance Change?• Launched“My511Direct”511travelerserviceswhichsendspersonalized
information via text and email regarding both travel time estimates and incident report alerts
• Focusedcustomercommunicationonextensiveroadclosuresandtrafficimpactsusing the CHART webpage, highway message signs and press releases
• AddedlivetrafficfeedsfrompartneragenciesforpublicviewingontheCHARTwebsite
• PartneredwithStateFarmInsurancetoincreasepatrolsonhighwaysandenhance roadside assistance
• StreamlinedCustomerCareManagementSystemonlineformandweblinkstosupport customer feedback
• CreatedaDesignCounciltoenhancecommunicationsamongengineeringandconstruction areas, resulting in better internal SHA communications
What Are Future Performance Strategies?• Implement the Customer “Bill of Rights” as an internal customer
service standard
• DeveloptoolsandmechanismstofollowupwithSHAcustomers,includingan online customer care management system survey
• Enhancewebsiteanduseofsocialmediatocommunicatewithcustomers
SHA: Percentage of the Maryland SHA Network in Overall Preferred Maintenance ConditionThe overall condition of the network reflects how well asset management strategies, improved operations and technology have sustained the quality and safety of existing highways.
Why Did Performance Change?• Totalmaintenanceexpendituresareclosertotheaveragehistorical
amounts after two consecutive years of expenditures approximately $9 million below average
• AdditionalmoneybecameavailableinFY2012,providinganopportunity to address previously deferred maintenance activities using a combination of contract forces and SHA personnel
• Emphasiswasplacedonmaintenanceactivitiesthathelpimprovewater quality, such as ditching, cleaning drainage facilities and shoulder edge repair
• SHAreceivedapprovalforfederalfundingforFederalFY2013forthe line striping asset management program
CALeNDAR YeAR* 2006 2008 2010 2012
Rating 3.93 3.90 3.94 3.92 TARGET: 4 out of 5
goal: Q
uality of service1 4
* Survey administered biennially.
What Are Future Performance Strategies?•Continuetomaintainthestatewideoveralllevelofservicewhileworking
on individual assets that fall below the desired maintenance condition in specific areas
• Performmaintenanceonsafety-relatedactivitiessuchassigns,linestriping,pavement markings and guardrail repair as a top priority
• Seekfederalfundingforadditionalmaintenanceactivities
• ContinueeffortswithFederalHighwayAdministration(FHWA)fundingofthe line striping asset management program by advertising and awarding contracts
• Continuetofocusattentiononmaintenanceactivitiesthatimprovewaterquality as part of the Clean Water Act
pe
rC
en
t o
f n
et
Wo
rk
60.0%
40.0%
20.0%
80.0%
C a l e n d a r Y e a r
82.2%
. 2011
85.3%
2005
87.1%
2006
85.1%
2007
81.7%
2008
86.9%
2009
85.8%
2010
100.0%target: Achieve 84% annually
85.1%
2012
1 5
Qua
lity
of s
ervi
ce
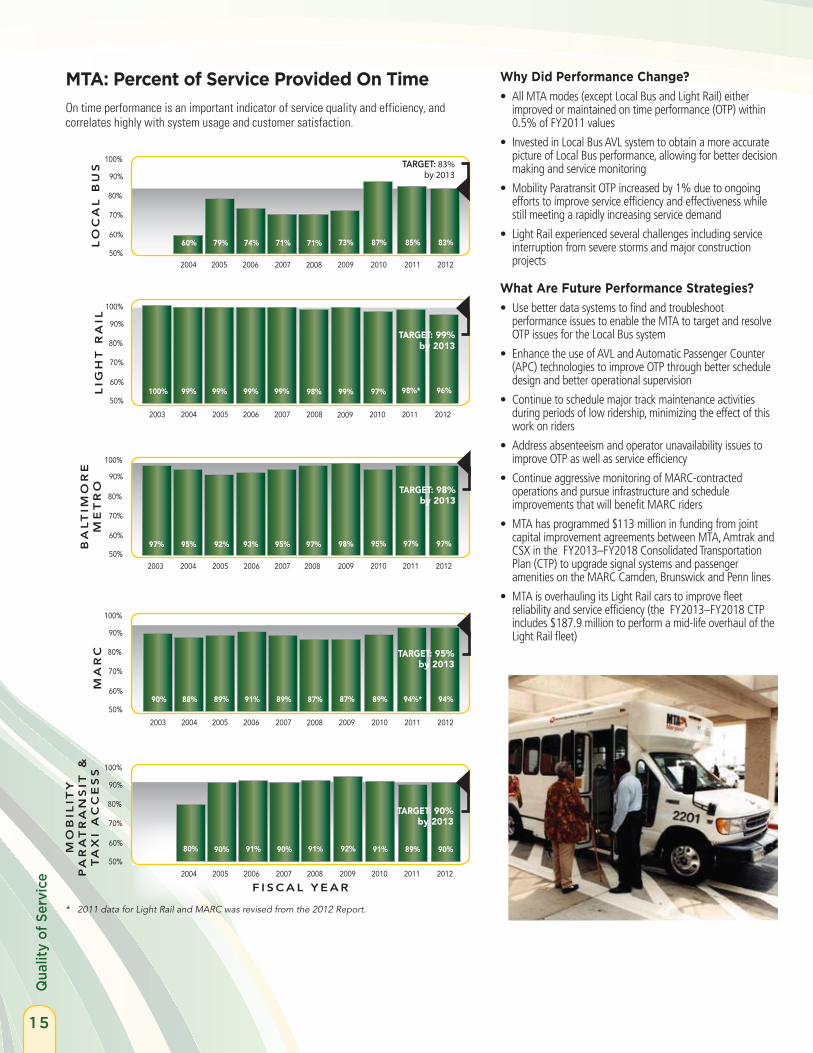
Why Did Performance Change?• AllMTAmodes(exceptLocalBusandLightRail)either
improved or maintained on time performance (OTP) within 0.5% of FY2011 values
• InvestedinLocalBusAVLsystemtoobtainamoreaccuratepicture of Local Bus performance, allowing for better decision making and service monitoring
• MobilityParatransitOTPincreasedby1%duetoongoingefforts to improve service efficiency and effectiveness while still meeting a rapidly increasing service demand
• LightRailexperiencedseveralchallengesincludingserviceinterruption from severe storms and major construction projects
What Are Future Performance Strategies?• Usebetterdatasystemstofindandtroubleshoot
performance issues to enable the MTA to target and resolve OTP issues for the Local Bus system
• EnhancetheuseofAVLandAutomaticPassengerCounter(APC) technologies to improve OTP through better schedule design and better operational supervision
• Continuetoschedulemajortrackmaintenanceactivitiesduring periods of low ridership, minimizing the effect of this work on riders
• Addressabsenteeismandoperatorunavailabilityissuestoimprove OTP as well as service efficiency
• ContinueaggressivemonitoringofMARC-contractedoperations and pursue infrastructure and schedule improvements that will benefit MARC riders
• MTAhasprogrammed$113millioninfundingfromjointcapital improvement agreements between MTA, Amtrak and CSX in the FY2013–FY2018 Consolidated Transportation Plan (CTP) to upgrade signal systems and passenger amenities on the MARC Camden, Brunswick and Penn lines
• MTAisoverhaulingitsLightRailcarstoimprovefleetreliability and service efficiency (the FY2013–FY2018 CTP includes $187.9 million to perform a mid-life overhaul of the Light Rail fleet)
MTA: Percent of Service Provided On TimeOn time performance is an important indicator of service quality and efficiency, and correlates highly with system usage and customer satisfaction.
lig
ht
ra
il
2003
100%
2004
99%
2005
99%
2006
99%
2007
99%
2008
98%
2009
50%
70%
90%
60%
80%
100%
99%
2010
97%
2011
98%*
2012
96%
TARGET: 99% by 2013
ba
lt
imo
re
m
et
ro
97%
2003
95%
2004
92%
2005
93%
2006
95%
2007
97%
2008
50%
70%
90%
60%
80%
100%
98%
2009
95%
2010
97%
2011
97%
2012
TARGET: 98% by 2013
ma
rC
88% 89% 91% 89%90% 87%
2003 2004 2005 2006 2007 2008
50%
70%
90%
60%
80%
100%
87%
2009
89%
2010
94%*
2011
94%
2012
TARGET: 95% by 2013
mo
bil
itY
p
ar
at
ra
ns
it &
t
ax
i a
CC
es
s
90% 91% 90% 91%
2005 2006 2007 2008
50%
70%
90%
60%
80%
100%
92%
2009
f i s C a l Y e a r
91%
2010
89%
2011
80%
2004
90%
2012
* 2011 data for Light Rail and MARC was revised from the 2012 Report.
TARGET: 90% by 2013
lo
Ca
l b
us
60% 79% 74% 71% 71%
2004 2005 2006 2007 200850%
70%
90%
60%
80%
100%
73%
2009
87%
2010
85%
2011
target: 83% by 2013
83%
2012

Quality of service
1 6
Y e a r(1=Poor and 5=Excellent)
*Survey not administered in 2009.
lo
Ca
l b
us
3.6
2003
2.7
2004
3.1
2008
1.0
3.0
2.0
4.0
5.0target: 3.5
by 2012
ba
lt
imo
re
m
et
ro
3.7
2003
3.1
2004
3.3
2008
1.0
3.0
2.0
4.0
5.0 target: 3.8 by 2012
target: 3.7 by 2012
lig
ht
ra
il
3.7
2003
2.9
2004
3.2
2008
1.0
3.0
2.0
4.0
5.0
ma
rC
4.0
2003
3.3
2004
2.9
2006
3.3
2006
3.4
2006
3.9
2006
3.0
2005
2.8
2007
3.2
2005
3.2
2007
3.4
2005
3.3
2007
3.8
2005
4.1
2007
4.1
20081.0
3.0
2.0
4.0
5.0 target: 3.9 by 2013
3.3
2010
3.5
2010
3.3
2010
3.6
2010
60
40
20
10
0
30
50
100%
90%
80%
75%
70%
85%
95%
46
85%
56
83%
45
87%88%
44
88%
42
90%
33
90%
f i s C a l Y e a r
min
ut
es
2005 2006 20072003 2008 20092004
pe
rC
en
t o
f r
es
po
nd
en
ts
Average branch office customer visit time in minutes
Percent of branch office customers rating service as “good” or “very good”
31
2010
44
88%
target: 93% satisfaction rating as “good” or “very good” by 2012
target: 35 Minutes
28
2011
90%*
MTA: Customer Satisfaction Rating*Reliable, safe and convenient service are key factors in attracting ridership. Customer satisfaction reflects whether MTA is meeting its customer service standards and signals which modes require improvement.
3.3
2011
3.1
2011
3.3
2011
3.8
2011
3.3
2012
3.1
2012
3.3
2012
3.8
2012
Why Did Performance Change?• 2012surveyresultsareestimates,andwillbepublishedin2013
• Usedbusridershipdatatobetterbalancecapacityanddemand
• MadeimprovementstoLocalBusservice
• DeployedAVLtechnologyonbusesandreal-timearrivalinformation
• Conductedfieldobservationsofservice(covertandovert)toidentifyperformance issues
• Improvedcommunicationswithcustomersintheeventofservicedisruptions through the use of electronic media
What Are Future Performance Strategies?• Explorevenuestoobtainreal-timecustomersatisfactionfromcustomers’
mobile devices to help increase MTA’s ability to track customers’ perceptions throughout the year
• Utilizebusridershipdatatobetterbalancecapacityanddemand
• ContinueLocalBusserviceimprovements(e.g.,scheduling),deploymentof AVL technology on buses and real-time arrival information, and fleet replacements
• Provideadditionalpark-and-ridefacilitiesattransitstations
• Continuefieldobservationsofservice(covertandovert)toidentifyperformance issues
• Improvecommunicationswithcustomersintheeventofservicedisruptions through the use of electronic media (e.g., emails, Twitter, website updates) as well as on-site and on-board announcements, including system-wide enhancements to the Public Announcement – Light-Emitting Diode (PA-LED) audio/visual systems on MARC, Baltimore Metro and Light Rail
MVA: Branch Office Customer Visit Time Versus Customer Satisfaction RatingAverage customer visit time is a key indicator of the quality and efficiency of service delivery to customers and is directly related to customer satisfaction (i.e., as MVA branch customer visit time decreases, customer satisfaction increases).
27
2012
91%
* 2011 data revised from the 2012 Report.
Why Did Performance Change?• Reducedcustomerwaittimesbyimplementinginitiativesand
technological enhancements aimed at lowering the number of walk-in branch transactions including alternative service delivery (ASD) methods, online ID card renewal and online driver’s license renewal (every other renewal cycle)
• Providedreal-timebranchwaittimesonlinesocustomershadclearexpectations of service times prior to arrival or could choose a different branch location and/or date and time
What Are Future Performance Strategies?• Utilizeinter-andintra-agencypartnershipsandcollaborationtoenhance
external service and product delivery to associated government agencies
• Plan,designandimplementanenhancedtechnicalplatformthatwillintegrate core business services and processes, providing customers with more efficient access to driver and vehicle services and products
• Continuetoactivelyenhancepoliciesandpracticestoeffectivelycoordinate dealer investigations and exchange of information between Business Licensing and Investigations Division
• MaintainastandardforCustomerServiceRepresentativesandDriverLicense Examiners, using enhanced training programs to increase service efficiency
• Continuetoimplementpolicies,technologiesandstrategiesintheASDPlan ($6.7 million programmed in the FY2013–FY2018 CTP for this purpose) to reduce customer wait time at branch offices and inspection stations

1 7
Qua
lity
of s
ervi
ce
Why Did Performance Change?• BWIMarshallcontinuestofarexceeditscustomersatisfactiongoals
• Continuedtoensurethattheairport’scleanlinessismaintainedinacost effective manner
• ContinuedtoprovidedirectionalsignagetomakenavigatingtheBWIMarshall easy
• MaintainedBWIMarshall’sexcellentparkingproduct
What Are Future Performance Strategies?• ContinuetomanagetheBWIMarshallcleaningcontractstoensure
that the cleanliness of the terminal building, restrooms and other facilities meet the expectations of passengers at BWI Marshall
• Supplementcurrentretailwithrecognizedlocalandnationalchainsin the terminal
pe
rC
en
t
f i s C a l Y e a r
tr
uC
k t
ur
n-a
ro
un
d t
ime
(M
inu
tes)
30.0
20.0
10.0
0.0
2005 20062004 2007 2008
40.0
50.0
60.0
35.4
52.3
37.9
58.0
39.8
57.2
39.5
58.9
39.0
57.0
double moVes target: 60 min.
Single moves (either a drop or pickup) Double moves (drop and pickup)
2003
36.9
56.9
30.5
54.4
2009
single moVes target: 30 min.
30.9
2010
56.2
39.5
2011
54.8
MAA: Percent of BWI Marshall Customers Rating the Airport “Good” or “excellent” on Key Services*Customer surveys provide valuable feedback to agencies regarding service delivery, enabling them to continuously respond to customer needs.
* Surveys not administered in 2007 and 2010.
** The 2009 rating only reflects first quarter 2009 data, not the full fiscal year.
f i s C a l Y e a r *
100%
80%
60%
50%
81%
2006
89%
2008
85%90%
70%
Percent of “good” or “excellent” passenger rating
Percent of passengers likely to fly from BWI Marshall on their next trip
target: 80%
88%
81%
2009**
86%
92%
83%
2011
91%
2012
79%
2005
74%
2004
82%
88%
83%
MPA: Average Truck Turn-Around Time at Seagirt Marine TerminalTruck turn-around time is a gross measure of the efficiency and operations of the Seagirt Marine Terminal. Reductions in turn-around times improve throughput capacity and result in incremental environmental benefits.
Why Did Performance Change?• Equipmentandtechnologyenhancementswereimplemented,
thereby improving gate velocity and processing efficiencies
• Changeinchassispoolusageallowsdriverstousetheirchassismultiple times in lieu of dropping and picking a chassis every time they enter the terminal
• Moredriversaremakingdualmovesversussinglemoves,whichprovides better overall efficiencies
• FullyimplementedtheTransportationWorkerIdentificationCredential (TWIC) program to balance security and commerce
What Are Future Performance Strategies?• Continuecost/benefitbasedevaluationandpossible
implementation of additional process enhancing technologies to further improve gate and terminal performance
• Evaluatebusinessprocessestoensuregateandterminalprocesses are not adversely impacted by existing and proposed commercial improvements
30.2
2012
56.0

Quality of service
1 8
* Toll collections are paid as cash, ticket, or electronic transaction.
** The methodology for toll transactions collected electronically was modified; data beginning in 2009 has been revised to reflect the new methodology.
114.8 117.1 117.5 118.6 120.1 120.0
2003 2004 2005 2006 2007 2008
to
ll
tr
an
sa
Ct
ion
s
(Mil
lio
ns
) 120.0
110.0
105.0
100.0
115.0
125.0
80%
40%
20%
0%
60%
100%
pe
rC
en
t o
f e
le
Ct
ro
niC
t
ol
l t
ra
ns
aC
tio
ns
41%44%
51%55%
59%
f i s C a l Y e a rTotal toll transactions Percent of electronic toll
transactions
117.1
2009**
117.1
2010
60%
60%
62%
long-term target: 78%
120.9
2011
63%
FISCAL YeAR* 2007 2010 2012
Percent Satisfied 87% 86% 83% TARGET: 87% (Baseline year = 2007)
* Survey not implemented in 2008, 2009 and 2011.
MDTA: Overall Customer Satisfaction of e-ZPass® CustomersThis measure tracks the satisfaction of E-ZPass® private account holders.
Why Did Performance Change?• Implementedcomprehensivecustomersurveyprogramtoallowfor
continual customer feedback and enhance MDTA’s ability to respond to identified issues
• Implementedaprogramtocloseaccountsthatremainedinactivefor18months or greater – closing approximately 65,000 inactive accounts
• TheMDTAapprovedandimplementedthelargesttollincreaseinitshistoryin 2011, with additional increases approved for July 1, 2013
What Are Future Performance Strategies?• ExpandretailsalesofE-ZPass® and “On-The-Go” opening new retail outlets
• Maintainavacancyrateof7.0%orbelowtoensureemployeesarepresentto meet the needs of customers
• Begintousein-houseresourcesin2013foronlinecustomersatisfactionsurveys
• Expandsurveystoallagencycustomers–notjust E-ZPass® private account holders – using web and social media
• Continuetouseemail,statementmessages,webandsocialmediatocommunicate with E-ZPass® account holders on E-ZPass® matters, construction projects, traffic management, etc
• Continuelargeemployerandcommunityvisits/eventswithE-ZPass® Outreach Team for the Intercounty Connector (ICC)/MD 200 and I-95 Express Toll Lanes (ETLs)
• Considercustomers’suggestionsforimprovementsasfiscalconstraintsallow
MDTA: Percent of Toll Transactions Collected electronically*Electronic toll collection systems expedite the toll collection process, reduce delays at toll plazas, decrease emissions, and are available at all eight toll facilities across the state.
128.0
2012
71%
short-term target: 76%
130.0
Why Did Performance Change?• OpenedtheICC/MD200SectionB&C
(MD 97 to I-95)
• Conductedapublicoutreachcampaignsto encourage use of E-ZPass®
• Electronictolltransactions,includingE-ZPass® transactions, continued to increase in volume and in the percentage of total transactions
• InitiatedconversionoftheHatemBridgeAutomatic Vehicle Identification (AVI) decal program to E-ZPass® programs
What Are Future Performance Strategies?• ExpandretailsalesofE-ZPass® “On-The-
Go” through new retail outlets
• CompleteconversionoftheHatemBridgeAVI decal program to E-ZPass®

Objectives• Reducethenumberandrateoftransportation-related
fatalities and injuries
• Securetransportationassetsforthemovementofpeople and goods
• Coordinateandrefineemergencyresponseplans and activities
mDoT: Increase attention on bicycle safety by partnering with Bike Maryland to update, publish, and distribute “Bike Baltimore” maps, host workshops on bicycle safety, and organize outreach events by law enforcement.
mAA: Continue replacement of all integrated life-safety and security systems at BWI Marshall ensuring the use of new technologies meeting federal regulations that integrate all emergency, monitoring and security systems.
mPA: Continue to provide excellent security services on all MPA terminals, enhance security awareness through information analysis and dissemination with public and private institutions, and deploy new cost-effective risk management methodologies for the protection of facility assets.
mTA: Annually participate in and host emergency preparedness exercises with Federal, State and local officials to improve intelligence sharing, prevention, response and/or recovery from emergency situations.
mDTA: MDTA Police will continue to develop new safety programs and actively lead and participate in organized safety events including Child Safety Seat Checks, Smooth Operator, Click It or Ticket and the Maryland SafeZones Automated Speed Enforcement program.
mVA: The Maryland Highway Safety Office (MHSO) migrated to the MVA and has been joined with Driver Safety Services to more effectively collaborate in on-going highway safety programs for high risk users such as older and younger drivers and motorcycle operators. Continued collaboration with the SHA will include combined pedestrian and bicycle safety initiatives as well as the coordination of local highway safety programs through the MHSO’s Regional Traffic Safety Programs housed in local SHA District Offices.
SHA: Continue to enhance driver, cyclist, and pedestrian safety through projects that improve roadways, enhance lighting, increase pedestrian comfort and safety, and provide better access to transit through ongoing implementation of the Community Safety and Enhancement Program, Sidewalk Program and Pedestrian Access to Transit Program.
Key Initiatives
Performance Measures
The safe travel of Maryland residents and visitors, by all modes of transportation, is a top priority for MDOT. To lower fatalities on the roadways, law enforcement, highway safety officials, emergency medical responders and champions in the community joined together to support the Towards Zero Deaths campaign. This effort is intended to change drivers’ perception of safety, spreading the message that even one death on Maryland roadways is too many. Maryland has also been recognized by the League of American Bicyclists for their bicycle safety efforts, ranking number eight in the nation and number three in the Northeast as a Bicycle Friendly State. The passage and enforcement of bicycle-friendly laws, making it safe and comfortable for people of all ages to ride in Maryland, has helped the State earn this distinction. Pedestrian safety is also a key priority. For example, MDOT will use results from a three-year pilot program using newly designed sidewalk markings to safely guide pedestrians along the Coastal Highway in Ocean City to further enhance safety. This city becomes the second most populated in the state during the summer months. A number of Transit-Oriented Development (TOD) projects are also underway in the state, creating communities that have the potential to ensure personal security and safety with amenities such as lighting, wider sidewalks and bicycle lanes.
Maryland’s transportation facilities, such as the Port of Baltimore, State highways, public transportation systems and BWI Marshall are critical to the secure movement of people and goods in the state. For the fourth consecutive year, the Port of Baltimore has received an excellent security assessment from the Coast Guard review, mainly due to more effective security risk mitigation strategies and the dedication of the operations and port security departments. BWI Marshall has taken steps to accommodate passenger growth without compromising safety and security, initiating a major terminal enhancement project, which includes a new, expanded security checkpoint, with the latest screening equipment, and a secure connector between Concourses B and C. The MDTA Police were honored with the Commission on Accreditation for Law Enforcement Agencies (CALEA) TRI-ARC Excellence Award, recognizing, amongst other accomplishments, their ability to strengthen crime prevention and control capabilities on Maryland’s highways.
MONITORING AGeNCY
PeRFORMANCe MeASuRe
PAGe
MAA BWI Marshall crime rate 23
MAA Number of repeat discrepancies in the annual Federal Aviation Administration’s Federal Aviation Regulation inspection
24
MAA Rate of airfield ramp incidents and accidents per 1,000 operations 23
MPA MPA compliance with the Maritime Transportation Security Act of 2002 24
MTA Customer perceptions of safety on the MTA system 22
MTA Preventable accidents per 100,000 vehicle miles 22
MVA Percent of Homeland Security REAL ID Act benchmarks achieved 24
MVA/SHA Number of bicycle and pedestrian fatalities and injuries on all Maryland roads 21
MVA/SHA & MDTA
Annual number of traffic fatalities and personal injuries on all roads in Maryland
20
1 9
g o a l :
safety & security
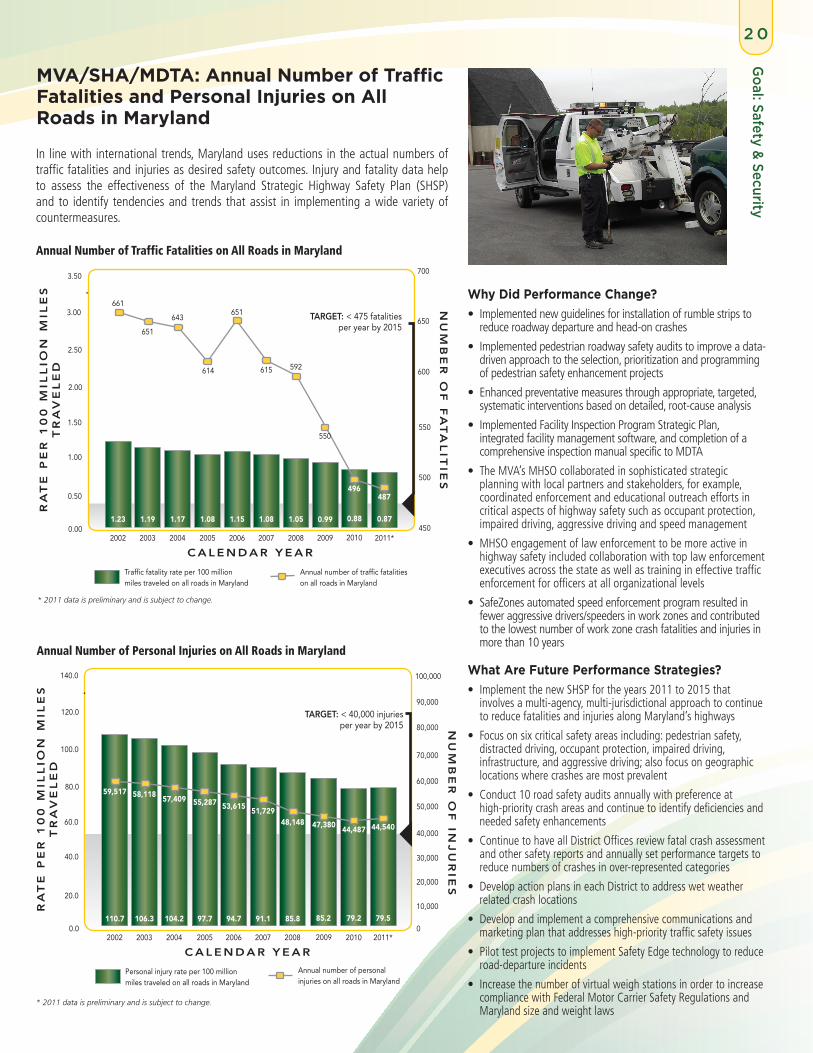
MVA/SHA/MDTA: Annual Number of Traffic Fatalities and Personal Injuries on All Roads in Maryland
In line with international trends, Maryland uses reductions in the actual numbers of traffic fatalities and injuries as desired safety outcomes. Injury and fatality data help to assess the effectiveness of the Maryland Strategic Highway Safety Plan (SHSP) and to identify tendencies and trends that assist in implementing a wide variety of countermeasures.
Why Did Performance Change?• Implementednewguidelinesforinstallationofrumblestripsto
reduce roadway departure and head-on crashes
• Implementedpedestrianroadwaysafetyauditstoimproveadata-driven approach to the selection, prioritization and programming of pedestrian safety enhancement projects
• Enhancedpreventativemeasuresthroughappropriate,targeted,systematic interventions based on detailed, root-cause analysis
• ImplementedFacilityInspectionProgramStrategicPlan,integrated facility management software, and completion of a comprehensive inspection manual specific to MDTA
• TheMVA’sMHSOcollaboratedinsophisticatedstrategicplanning with local partners and stakeholders, for example, coordinated enforcement and educational outreach efforts in critical aspects of highway safety such as occupant protection, impaired driving, aggressive driving and speed management
• MHSOengagementoflawenforcementtobemoreactiveinhighway safety included collaboration with top law enforcement executives across the state as well as training in effective traffic enforcement for officers at all organizational levels
• SafeZones automated speed enforcement program resulted in fewer aggressive drivers/speeders in work zones and contributed to the lowest number of work zone crash fatalities and injuries in more than 10 years
What Are Future Performance Strategies?•ImplementthenewSHSPfortheyears2011to2015that
involves a multi-agency, multi-jurisdictional approach to continue to reduce fatalities and injuries along Maryland’s highways
• Focusonsixcriticalsafetyareasincluding:pedestriansafety,distracted driving, occupant protection, impaired driving, infrastructure, and aggressive driving; also focus on geographic locations where crashes are most prevalent
• Conduct10roadsafetyauditsannuallywithpreferenceat high-priority crash areas and continue to identify deficiencies and needed safety enhancements
• ContinuetohaveallDistrictOfficesreviewfatalcrashassessmentand other safety reports and annually set performance targets to reduce numbers of crashes in over-represented categories
• DevelopactionplansineachDistricttoaddresswetweatherrelated crash locations
• Developandimplementacomprehensivecommunicationsandmarketing plan that addresses high-priority traffic safety issues
• PilottestprojectstoimplementSafetyEdgetechnologytoreduceroad-departure incidents
• Increasethenumberofvirtualweighstationsinordertoincreasecompliance with Federal Motor Carrier Safety Regulations and Maryland size and weight laws
Annual number of Traffic Fatalities on All roads in maryland
goal: safety & security
2 0
Annual number of Personal Injuries on All roads in maryland
C a l e n d a r Y e a r
Personal injury rate per 100 million miles traveled on all roads in Maryland
Annual number of personal injuries on all roads in Maryland
40,000
20,000
10,000
0
30,000
50,000
nu
mb
er
of
inj
ur
ies
60,000
ra
te
pe
r 1
00
mil
lio
n m
ile
s
tr
aV
el
ed
80.0
40.0
20.0
0.0
60.0
100.0
120.0
140.0
70,000
80,000
90,000
100,000
2005
55,287
97.7
2006
53,615
94.7
2002
59,517
110.7
2007
51,729
91.1
2003
58,118
106.3
2008
48,148
85.8
2004
57,409
104.2
target: < 40,000 injuries per year by 2015
2009
47,380
85.2
* 2011 data is preliminary and is subject to change.
2010
44,487
79.2
C a l e n d a r Y e a r
Traffic fatality rate per 100 million miles traveled on all roads in Maryland
Annual number of traffic fatalities on all roads in Maryland
ra
te
pe
r 1
00
mil
lio
n m
ile
s
tr
aV
el
ed
2.00
1.00
0.50
0.00
1.50
2.50
3.50
2005
614
1.08
20062002
661
1.23
2007
615
1.08
2003
651
1.19
592
2008
1.05
2004
643
1.17
target: < 475 fatalities per year by 2015
651
1.15
nu
mb
er
of
fa
ta
lit
ies500
550
600
650
4502009
0.99
550
3.00
2010
0.88
496
700
* 2011 data is preliminary and is subject to change.
2011*
0.87
487
2011*
44,540
79.5

2 1
goa
l: sa
fety
& s
ecur
ity
Why Did Performance Change?• Establishedanofficialpedestriansafetycommittee/
task force within SHA to develop a strategic approach to improve pedestrian safety around the state
• ImplementedtwoStreetSmartpedestriansafetycampaigns, which use marketing techniques to raise awareness of pedestrian safety
• Identified24high-crashlocationsacrossthestateto focus additional engineering, enforcement and education efforts to improve pedestrian safety
• Implementedinnovativeengineeringtechniquestoimprove pedestrian safety in Ocean City and in various locations in Montgomery County
• AdoptedanofficialCompleteStreetspolicyforallSHAprojects and issued a new bicycle policy that mandates resurfacing projects to construct bicycle lanes, whenever possible, and for all projects to mark bicycle lanes if the space is available
• EstablishedanofficialSHAbicyclecommitteetoimprove bicycle guidance and policies that pertain to SHA roadways
What Are Future Performance Strategies?• Workwiththelocalcountypublicworksdepartments
to determine high pedestrian risk areas around the state to proactively address potential pedestrian safety issues
• Conductapedestrianroadwaysafetyauditonthetopeight high pedestrian crash locations and work to fund the resulting audit recommendations
• Utilizesocialmediatoestablishamoreprogressiveform of communication between the bicycling community and SHA
• Coordinateeducationandenforcementeffortswithengineering efforts to more effectively improve pedestrian and vehicular behaviors in high crash locations
• Investigateinnovativefundingstrategiesfortheimplementation of pedestrian safety and implement strategies from the SHSP to enhance pedestrian safety
MVA/SHA: Number of Bicycle and Pedestrian Fatalities and Injuries on All Maryland RoadsMaryland uses reductions in the actual numbers of bicycle and pedestrian fatalities and injuries as desired safety outcomes. Injury and fatality data help to assess the effectiveness of the Maryland SHSP and to identify tendencies and trends that assist in implementing a wide variety of countermeasures.
number of Pedestrian Fatalities and Injuries on All maryland roads
C a l e n d a r Y e a r
nu
mb
er
of
pe
de
st
ria
n i
nj
ur
ies n
um
be
r o
f p
ed
es
tr
ian
fa
ta
lit
ies
number of Bicycle Fatalities and Injuries on All maryland roads
C a l e n d a r Y e a r
nu
mb
er
of
biC
YC
le
in
ju
rie
s
nu
mb
er
of
biC
YC
le
fa
ta
lit
ies
2004 2005 2006 2007
400
200
100
0
300
500
600
700
800
4
0
8
12
16target: < 542 injuries per year by 2015
Number of pedestrian injuries on all roads in Maryland
Number of pedestrian fatalities on all roads in Maryland
Number of bicycle injuries on all roads in Maryland
Number of bicycle fatalities on all roads in Maryland
2008
target: < 3 fatalities per year by 2015
2009*2002
722
7
2003
641
6
652
11
629
7
648
7
636 619 559
10
7
601
8
7
2010
* 2009 injuries data revised from 2012 Report.
** 2011 data are preliminary.
574
5
2011**
2002
2,566
101
2003
2,724
118
2004
2,481
95
target: < 2,050 injuries per year by 2015
2005
2,625
101
2006
2,594
93
2007
2,526
2,000
1,000
500
0
1,500
2,500
3,000
100
50
25
0
75
125
150
2008
2,469
110
2009*
2,348
115 111
2010*
2,339
101
2011**
2,172
104
target: < 92 fatalities per year by 2015
* 2009 and 2010 injuries data revised from 2012 Report.
** 2011 data are preliminary.

goal: safety & security
2 2
MTA: Customer Perceptions of Safety on the MTA System A positive perception of personal safety is correlated with higher ridership and stronger commitment to transit as a mode of travel.
Why Did Performance Change?• AsMTA’scrimeratecontinuestofall,customerscontinueto
feel safe
• UtilizedthePoliceCadetprogramtoimprovethevisibilityofMTA’s Police Forces
• UsedClosedCircuitTV(CCTV)andothersecuritymeasurestoensure the safety of customers at Baltimore Metro stations and on the bus fleet
• Continuedsafetyandsecurityprograms,suchastheZoneEnforced Uniform Sweeps (ZEUS) and CompStat
What Are Future Performance Strategies?• ContinuetoutilizethePoliceCadetprogramtoimprovethe
visibility of MTA’s Police Forces, make traveling safer and give Maryland youth a point of entry into transit law enforcement
• UtilizeCCTVandothersecuritymeasurestoensurethesafety of customers
• Targetandpreventcriminalactivitythroughbothcovertandovert police operations, efficiently and effectively launched through the CompStat process
• IntheFY2013–FY2018ConsolidatedTransportationPlan(CTP), MTA has programmed over $41 million in Department of Homeland Security grants to enhance law enforcement resources on the MTA systemY e a r
(1=Poor and 5=Excellent)2009 survey not administered.
*2011 data was revised from the 2012 Report. **All 2012 data are estimated. Final 2012 data will be available in the spring of 2013.
lo
Ca
l
bu
s
1.0
3.0
2.0
4.0
5.0
ma
rC
1.0
3.0
2.0
4.0
5.0
Co
nt
ra
Ct
ed
C
om
mu
te
r
bu
s
lig
ht
ra
il
1.0
3.0
2.0
4.0
5.0
ba
lt
imo
re
m
et
ro
1.0
3.0
2.0
4.0
5.0
3.4
CALeNDAR YeAR 2007 2008 2009 2010 2011 2012* TARGeT
Accident Rate
Local Bus 2.50 2.50 2.93 2.86 3.10 2.12 2.0 by CY2013
Light Rail n/a n/a 0.06 0.31 0.16 0.19 0.15 by CY2013
Baltimore Metro n/a n/a 0.20 0.17 0.05 0.03 0.03 by CY2013
Paratransit/Taxi Access n/a n/a 1.14 0.00 2.31 2.07 2.0 by
CY2013
(Baseline year = 2008)
* 2012 data are estimated and will be finalized in next year’s Report.
MTA: Preventable Accidents Per 100,000 Vehicle MilesMTA has developed a baseline from which to reduce preventable accidents, increase efficiency and provide a safer ride to customers.
Why Did Performance Change?• AllMTAmodesexceptLightRailhaveexperienced
a decrease in preventable accident rates (based on estimated 2012 data)
• SignificantdecreasesintheLocalBusaccidentratearedue to ongoing efforts to increase operator accountability through re-training and corrective action
• Paratransitaccidentsareslightlyhigheroverthepastfouryears due to a change in how accidents are captured (including accidents from contracted service providers)
What Are Future Performance Strategies?• Continueaccountabilityeffortstoensurethatoperators
with multiple preventable accidents receive appropriate re-training and corrective action
• Utilizeefficientandeffectivetrainingmethodologies,including the bus simulator, operator re-certification programs, and safe operation awards, to give operators the skills they need to perform their duties safely
• Reviewaccidentswiththeaidofgeographicinformationsystems (GIS) to determine patterns (i.e. operators, times of day, locations) and develop corrective action to further reduce accident risks
target: 4.0
3.4
2008 2010
3.9
2011*
3.83.3
2007
3.8
2012**
target: 4.2
4.1
2008 2010
4.1
2011
4.13.7
2007
4.1
2012**1.0
3.0
2.0
4.0
5.0
target: 3.5
2.8
2008 2010
3.4
2011
3.32.7
2007
3.3
2012**
target: 3.5
3.0
2008 2010
3.4
2011*
3.12.7
2007
3.0
2012**
3.2
2008 2010
3.4
2011*
target: 3.5
3.32.8
2007
3.3
2012**
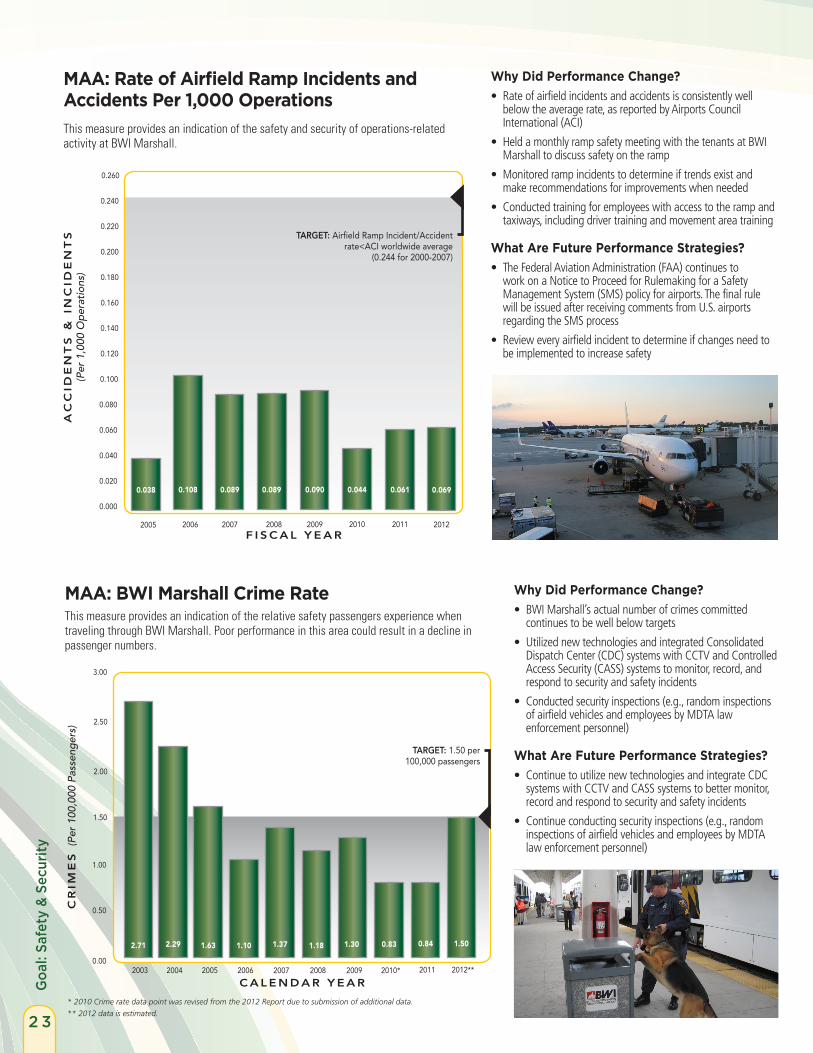
2 3
goa
l: sa
fety
& s
ecur
ity
Why Did Performance Change?• Rateofairfieldincidentsandaccidentsisconsistentlywell
below the average rate, as reported by Airports Council International (ACI)
• HeldamonthlyrampsafetymeetingwiththetenantsatBWIMarshall to discuss safety on the ramp
• Monitoredrampincidentstodetermineiftrendsexistandmake recommendations for improvements when needed
• Conductedtrainingforemployeeswithaccesstotherampandtaxiways, including driver training and movement area training
What Are Future Performance Strategies?• TheFederalAviationAdministration(FAA)continuesto
work on a Notice to Proceed for Rulemaking for a Safety Management System (SMS) policy for airports. The final rule will be issued after receiving comments from U.S. airports regarding the SMS process
• Revieweveryairfieldincidenttodetermineifchangesneedtobe implemented to increase safety
MAA: Rate of Airfield Ramp Incidents and Accidents Per 1,000 OperationsThis measure provides an indication of the safety and security of operations-related activity at BWI Marshall.
MAA: BWI Marshall Crime RateThis measure provides an indication of the relative safety passengers experience when traveling through BWI Marshall. Poor performance in this area could result in a decline in passenger numbers.
Why Did Performance Change?• BWIMarshall’sactualnumberofcrimescommitted
continues to be well below targets
• UtilizednewtechnologiesandintegratedConsolidatedDispatch Center (CDC) systems with CCTV and Controlled Access Security (CASS) systems to monitor, record, and respond to security and safety incidents
• Conductedsecurityinspections(e.g.,randominspectionsof airfield vehicles and employees by MDTA law enforcement personnel)
What Are Future Performance Strategies?• ContinuetoutilizenewtechnologiesandintegrateCDC
systems with CCTV and CASS systems to better monitor, record and respond to security and safety incidents
• Continueconductingsecurityinspections(e.g.,randominspections of airfield vehicles and employees by MDTA law enforcement personnel)
f i s C a l Y e a r
aC
Cid
en
ts
& i
nC
ide
nt
s
(P
er 1
,000
Op
erat
ions
)
0.060
0.040
0.020
0.000
0.080
0.100
0.120
2006
0.108
0.140
2007
0.089
2008
0.089
2009
0.090
0.220
0.200
0.180
0.160
0.240
0.260
target: Airfield Ramp Incident/Accident rate<ACI worldwide average
(0.244 for 2000-2007)
2010
0.044
C a l e n d a r Y e a r
Cr
ime
s (
Per
100,
000
Pass
eng
ers)
0.50
0.00
1.00
1.50
2.00
2006
1.10
2.50
2007
1.37
* 2010 Crime rate data point was revised from the 2012 Report due to submission of additional data.
** 2012 data is estimated.
2008
1.18
target: 1.50 per 100,000 passengers
2009
1.30
2011
0.061
2010*
0.83
2005
0.038
2012
0.069
2003
2.71
2004
2.29
2005
1.63
2011
0.84
2012**
1.50
3.00
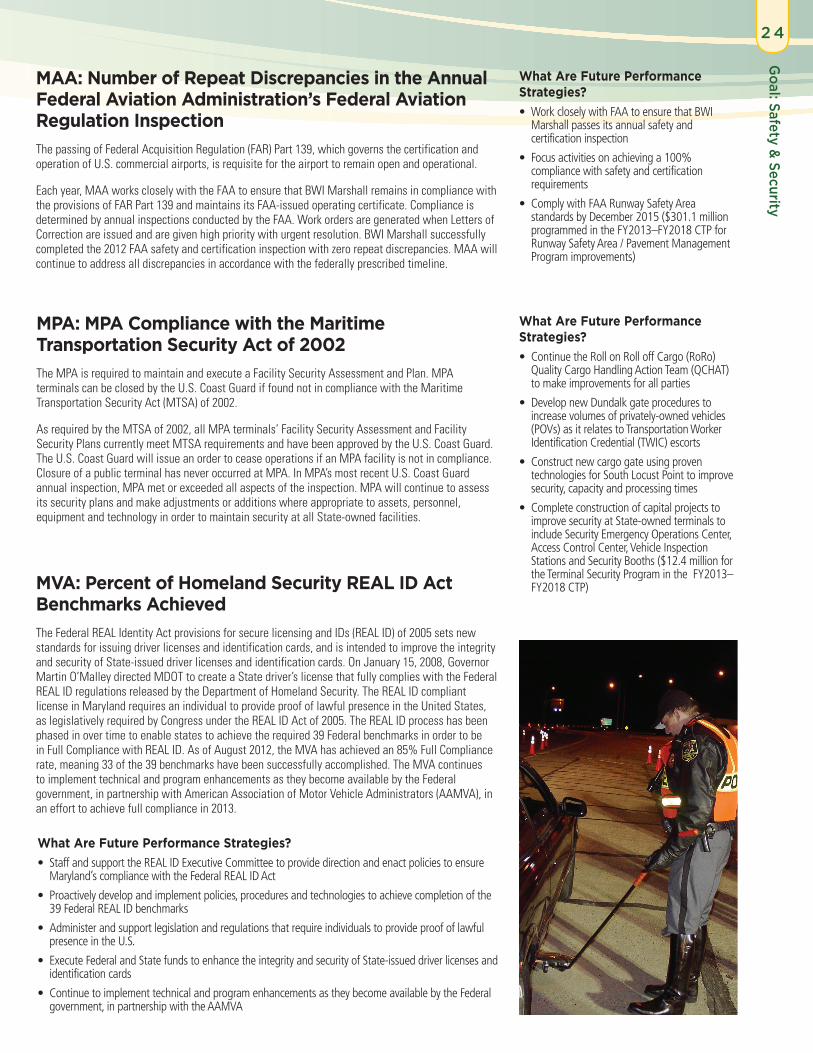
goal: safety & security
2 4
MAA: Number of Repeat Discrepancies in the Annual Federal Aviation Administration’s Federal Aviation Regulation InspectionThe passing of Federal Acquisition Regulation (FAR) Part 139, which governs the certification and operation of U.S. commercial airports, is requisite for the airport to remain open and operational.
Each year, MAA works closely with the FAA to ensure that BWI Marshall remains in compliance with the provisions of FAR Part 139 and maintains its FAA-issued operating certificate. Compliance is determined by annual inspections conducted by the FAA. Work orders are generated when Letters of Correction are issued and are given high priority with urgent resolution. BWI Marshall successfully completed the 2012 FAA safety and certification inspection with zero repeat discrepancies. MAA will continue to address all discrepancies in accordance with the federally prescribed timeline.
What Are Future Performance Strategies?• WorkcloselywithFAAtoensurethatBWI
Marshall passes its annual safety and certification inspection
• Focusactivitiesonachievinga100%compliance with safety and certification requirements
• ComplywithFAARunwaySafetyAreastandards by December 2015 ($301.1 million programmed in the FY2013–FY2018 CTP for Runway Safety Area / Pavement Management Program improvements)
MPA: MPA Compliance with the Maritime Transportation Security Act of 2002The MPA is required to maintain and execute a Facility Security Assessment and Plan. MPA terminals can be closed by the U.S. Coast Guard if found not in compliance with the Maritime Transportation Security Act (MTSA) of 2002.
As required by the MTSA of 2002, all MPA terminals’ Facility Security Assessment and Facility Security Plans currently meet MTSA requirements and have been approved by the U.S. Coast Guard. The U.S. Coast Guard will issue an order to cease operations if an MPA facility is not in compliance. Closure of a public terminal has never occurred at MPA. In MPA’s most recent U.S. Coast Guard annual inspection, MPA met or exceeded all aspects of the inspection. MPA will continue to assess its security plans and make adjustments or additions where appropriate to assets, personnel, equipment and technology in order to maintain security at all State-owned facilities.
What Are Future Performance Strategies?• ContinuetheRollonRolloffCargo(RoRo)
Quality Cargo Handling Action Team (QCHAT) to make improvements for all parties
• DevelopnewDundalkgateprocedurestoincrease volumes of privately-owned vehicles (POVs) as it relates to Transportation Worker Identification Credential (TWIC) escorts
• Constructnewcargogateusingproventechnologies for South Locust Point to improve security, capacity and processing times
• Completeconstructionofcapitalprojectstoimprove security at State-owned terminals to include Security Emergency Operations Center, Access Control Center, Vehicle Inspection Stations and Security Booths ($12.4 million for the Terminal Security Program in the FY2013–FY2018 CTP)
What Are Future Performance Strategies?• StaffandsupporttheREALIDExecutiveCommitteetoprovidedirectionandenactpoliciestoensure
Maryland’s compliance with the Federal REAL ID Act
• Proactivelydevelopandimplementpolicies,proceduresandtechnologiestoachievecompletionofthe39 Federal REAL ID benchmarks
• Administerandsupportlegislationandregulationsthatrequireindividualstoprovideproofoflawfulpresence in the U.S.
• ExecuteFederalandStatefundstoenhancetheintegrityandsecurityofState-issueddriverlicensesandidentification cards
• ContinuetoimplementtechnicalandprogramenhancementsastheybecomeavailablebytheFederalgovernment, in partnership with the AAMVA
MVA: Percent of Homeland Security ReAL ID Act Benchmarks AchievedThe Federal REAL Identity Act provisions for secure licensing and IDs (REAL ID) of 2005 sets new standards for issuing driver licenses and identification cards, and is intended to improve the integrity and security of State-issued driver licenses and identification cards. On January 15, 2008, Governor Martin O’Malley directed MDOT to create a State driver’s license that fully complies with the Federal REAL ID regulations released by the Department of Homeland Security. The REAL ID compliant license in Maryland requires an individual to provide proof of lawful presence in the United States, as legislatively required by Congress under the REAL ID Act of 2005. The REAL ID process has been phased in over time to enable states to achieve the required 39 Federal benchmarks in order to be in Full Compliance with REAL ID. As of August 2012, the MVA has achieved an 85% Full Compliance rate, meaning 33 of the 39 benchmarks have been successfully accomplished. The MVA continues to implement technical and program enhancements as they become available by the Federal government, in partnership with American Association of Motor Vehicle Administrators (AAMVA), in an effort to achieve full compliance in 2013.

Objectives• Preserveandmaintaintheexistingtransportationnetwork
• Maximizeoperationalperformanceandefficiencyofexistingsystems
MDOT: Continue to facilitate the award and implementation tracking of federal and state grant funding allocations to improve and maintain various multimodal transportation assets throughout the state.
MAA: Continue to undertake a major airfield improvement program to preserve existing airfield capacity at BWI Marshall by addressing pavement rehabilitation needs and new Federal Aviation Administration (FAA) runway safety area standards.
MPA: Continue to position the Port of Baltimore as the preferred destination on the Mid-Atlantic Coast for the largest container ships in this market, including the recent completion of the 50-foot deep berth at Seagirt Marine Terminal and addition of four Super-Post Panamax cranes.
MDTA: Continue to fund and schedule completion of high-priority system preservation projects and expand the current system preservation program to include preventative maintenance activities which will prolong the life of the existing infrastructure.
MTA: Continue system maintenance of Light Rail grade crossings and Baltimore Metro track infrastructure repairs to maintain safe, reliable operation.
MVA: Continue to invest in information technology, including the Project Core enterprise system which will modernize, standardize and integrate core MVA business systems, and the Alternative Service Delivery (ASD) systems, to maintain cost-efficiencies.
SHA: Continue programs to reduce the number of SHA-owned bridges that are structurally deficient through intensive maintenance, repair and rehabilitation efforts, and maintain the percent of bridges on the SHA portion of the National Highway System (NHS) that will allow all legally loaded vehicles to safely traverse. By April 2012, SHA had reduced the total number of SHA-owned structurally deficient bridges to 97 total, 42 of those on the NHS, out of 2,578 statewide (1,182 along the NHS).
Key Initiatives
Performance Measures
Maryland’s existing transportation infrastructure was developed through the cumulative investments of generations of taxpayers. The transportation network provides for the mobility of people and goods and is indispensable to the state’s economy. Maryland prioritizes investments that extend the useful life of existing transportation system facilities. Preserving and maintaining the multimodal transportation network is one of the State’s highest priorities as evidenced by the $928 million MDOT will provide for system preservation projects and programs in FY2013.
The SHA and the MDTA continue to place special emphasis on improving the condition of bridges, a special area of focus for the State. Both agencies manage aggressive programs to keep bridges safe and are rehabilitating and/or replacing structurally deficient bridges throughout Maryland. Major bridges as well as many other smaller, yet critically important bridges across the state are planned to undergo preservation and maintenance activities in the FY2013–FY2018 Consolidated Transportation Program (CTP).
With growth in traffic volumes outpacing the ability to expand capacity through construction of new highway lanes, Maryland is continuing to find ways to get more out of the existing transportation system. MDOT’s transportation agencies continue to implement operations strategies and deploy Intelligent Transportation System (ITS) technologies to improve system efficiency. For example, SHA’s Coordinated Highways Action Response Team (CHART) is investing $98.5 million in the FY2013–FY2018 CTP to improve the provision of real-time traffic and incident information to travelers and to reduce incident response times. MTA is aggressively rehabilitating both Baltimore Metro and Light Rail vehicles to improve performance reliability and enhance customer comfort.
MOnItOrIng Agency
PerfOrMAnce MeAsure
PAge
MAA Airline cost per enplaned passenger (CPE) 32
MAA Non-airline revenue per enplaned passenger (RPE) 32
MPA Adequate dredge material placement capacity remaining for Harbor and Bay maintenance and new work dredging
33
MPA Revenue versus operating expense 34
MTA Operating cost per passenger trip 29
MTA Operating cost per revenue vehicle mile 30
MTA Passengers per revenue vehicle mile 28
MVA Cost per transaction 31
MVA Alternative service delivery transactions as percent of total transactions 31
SHA User cost savings for the traveling public due to incident management 27
SHA & MDTA Percent of roadway miles with acceptable ride quality 26
SHA & MDTA Number of bridges and percent that are structurally deficient 26
2 5
G o a l :
SystemPreservation&Performance

sHA & MDtA: Percent of roadway Miles with Acceptable ride Quality
Why Did Performance change?�•� �Overhauled and enhanced the MDTA inspection
program to better identify, report and address inspection findings and continued implementation of the comprehensive Facility Inspection Program Strategic Plan
•� �Implemented�integrated�facility�management�software�and a comprehensive inspection manual specific to MDTA
•� �Significantly�increased�the�use�of�pavement�preservation�treatments compared to previous years
•� �Continued�identification�of�cost-effective�projects�on�high-demand highways
What Are future Performance strategies?�•���Expand�the�current�system�preservation�program�to�
include preventative maintenance activities which will prolong the life of the existing infrastructure
•� �Continue�to�fund�and�schedule�completion�of�high-priority system preservation projects
•� Target�low-friction�locations
•� �Continue�to�expand�use�of�recycled�materials�such�as concrete and asphalt in roadway projects in a responsible manner and increase the use of more durable materials in high demand highways
•� �Continue�to�implement�FHWA�and�SHA�pavement�preservation programs that will strategically utilize system preservation activities
Goal:System
Preservation&Performance
2 6
The traveling public has identified acceptable ride quality (i.e., the smoothness or roughness of the pavement) as a priority. Ride quality facilitates mobility, efficiency and safe movement of people and goods within Maryland.
C a l e n d a r Y e a r
Pe
rC
en
t o
f r
oa
dw
aY
Mil
ea
ge
80%
70%
60%
86%
2010
83%
2002
82%
2003
82%
2004
83%
2005
84%
2006
86%
2007
86%
200850%
90%
100%
87%
2009
86%
2011
target: 84% Long Term (2015) target: 86% Short Term (2013)
sHA & MDtA: number of Bridges and Percent that Are structurally DeficientThe structurally deficient rating is an early warning sign for engineers to initiate the rehabilitation or replacement process and to use when prioritizing and recommending system preservation funding. The rating applies to three main elements of a bridge: 1) deck (riding surface); 2) superstructure (main supporting element of the deck); and 3) substructure (supports to hold up the superstructure and deck). These elements are rated on a scale from zero (closed to traffic) to nine (relatively new). If any of the three elements is rated as a four or less, the bridge is categorized as structurally deficient by Federal standards. This does not mean that the bridge is unsafe; if a bridge becomes unsafe, it is closed.
Why Did Performance change?�•� �SHA�continued�an�aggressive�bridge�maintenance�and�
rehabilitation program which keeps up to 12 construction crews working full time, year-round
•� �Addressed�bridges�that�were�deficient�and�minimized�the�number of bridges that may become deficient
•� �Created�plans�to�replace�deficient�structures�that�cannot�be corrected by remedial work
•� �Efficiently�utilized�all�bridge�funding�received�in�a�timely�manner
•� �MDTA�implemented�an�aggressive�system�preservation�and maintenance inspection program
What Are future Performance strategies?�•�� Commence engineering activities on structurally deficient
bridges or potential structurally deficient candidates, to build an inventory of contract documents for shovel-ready projects, which can take advantage of additional funding
•� �Perform�immediate�inspections�and�structural�evaluations�on water crossings after significant storm events
•� �Program�over�$228�million�in�funding�( FY2013–FY2018 CTP) to maintain and repair bridges on MDTA- operated facilities throughout Maryland
•� �Expand�the�current�system�preservation�program�to�include�preventative maintenance activities
•� �Continue�to�fund�and�schedule�completion�of�high-priority�system preservation projects, such as underwater repairs at Hatem and Tydings Bridges, multi-facility structural steel painting projects and cable rewrapping and dehumidification on the Bay Bridge
•� �Continue�to�fund,�design�and�perform�high-priority�structural repairs based on annual inspection report findings
cAlenDAr yeAr 2006 2007 2008 2009 2010 2011 2012
Number deficient 145 132 133 117 111 110 101
Percent deficient 5.2% 4.7% 4.7% 4.1% 3.9% 3.9% 3.5% TARGET: 105 total bridges by 2013

2 7
Goal:System
Preservation&Performance
Why Did Performance change?�•� �Helped�reduce�delay�by�an�estimated�33.56�million�
vehicle-hours
•� �Deployed�12�new�Closed�Circuit�TV�(CCTV)�cameras,�bringing the statewide total to 155
•� �Responded�to�and�cleared�more�than�17,000�incidents�and assisted more than 27,000 stranded motorists
•� �Increased�camera�video�feed�interoperability�with�other regional agencies to allow for access to more than�600�camera�sites�in�Maryland
•� �Completed�several�enhancements�to�the�Maryland�511 traveler information system, including drive time calculations, email/text alerts and arterial traffic flow reports�for�the�Eastern�Shore
•� �Added�four�new�patrols�on�highways�as�a�result�of CHART’s partnership with State Farm Insurance Company
What Are future Performance strategies?�•� �Expand�the�CHART�patrol�coverage�to�reduce�roadway�
delays and achieve additional user cost savings
•� �Explore�cost-effective�uses�of�limited�resources�through�local, regional and State incident management coordination and collaboration
•� �Continue�to�explore�agency�partnerships�for�the�sharing of camera information
•� �Provide�dynamic�message�boards�to�aid�in�the�reduction of travel time, reduce congestion and provide critical information for the traveling public ($8.0 million programmed through FY2013 in the FY2013–FY2018 CTP)
sHA: user cost savings for the traveling Public Due to Incident Management The total user cost savings to motorists and commercial traffic (from reduced delay) reflects the tangible benefits of the CHART incident management program.
C a l e n d a r Y e a r
do
ll
ar
s (
Mill
ions
)
$600
$400
$200
$0
$800
$1,000
$1,200
2005
$864
2006
$1,092
2007
$1,400
$1,120
2008
$980
target: Annual savings of $1,000 million
2009
$1,006
2010*
$1,375
$1,600
2011
$1,097
2012**
$1,000
2003
$527
2004
$518
TARGET: $1,000 million for 2013.
* 2010 data point was revised from the 2012 Report.
** 2012 data is estimated.
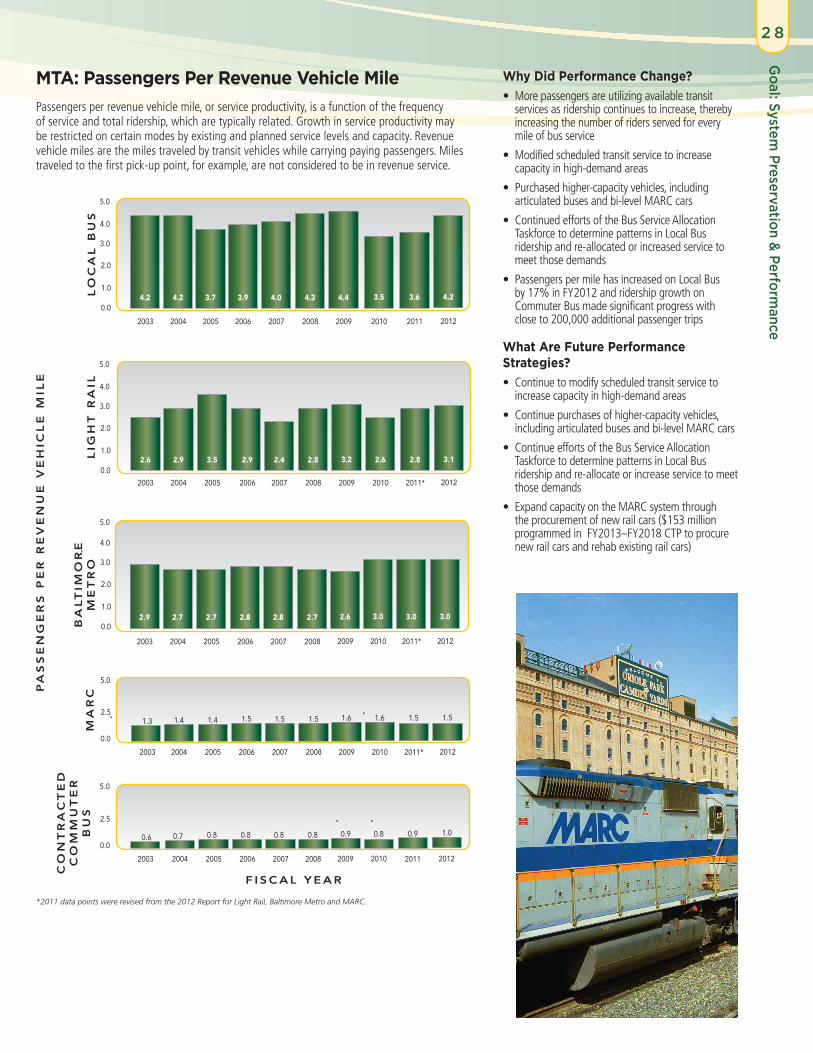
Goal:System
Preservation&Performance
2 8
MtA: Passengers Per revenue Vehicle MilePassengers per revenue vehicle mile, or service productivity, is a function of the frequency of service and total ridership, which are typically related. Growth in service productivity may be restricted on certain modes by existing and planned service levels and capacity. Revenue vehicle miles are the miles traveled by transit vehicles while carrying paying passengers. Miles traveled to the first pick-up point, for example, are not considered to be in revenue service.
Why Did Performance change?�•� �More�passengers�are�utilizing�available�transit�
services as ridership continues to increase, thereby increasing the number of riders served for every mile of bus service
•� �Modified�scheduled�transit�service�to�increase�capacity in high-demand areas
•� �Purchased�higher-capacity�vehicles,�including�articulated buses and bi-level MARC cars
•� �Continued�efforts�of�the�Bus�Service�Allocation�Taskforce to determine patterns in Local Bus ridership and re-allocated or increased service to meet those demands
•� �Passengers�per�mile�has�increased�on�Local�Bus�by 17% in FY2012 and ridership growth on Commuter Bus made significant progress with close to 200,000 additional passenger trips
What Are future Performance strategies?•� �Continue�to�modify�scheduled�transit�service�to�
increase capacity in high-demand areas
•� �Continue�purchases�of�higher-capacity�vehicles,�including articulated buses and bi-level MARC cars
•� �Continue�efforts�of�the�Bus�Service�Allocation�Taskforce to determine patterns in Local Bus ridership and re-allocate or increase service to meet those demands
•� �Expand�capacity�on�the�MARC�system�through�the procurement of new rail cars ($153 million programmed in FY2013–FY2018 CTP to procure new rail cars and rehab existing rail cars)
4.2
2003
4.2
2004
3.7
2005
3.9
2006
4.0
2007
4.3
2008
4.4
2009
lo
Ca
l B
us
3.0
0.0
2.0
1.0
5.0
4.0
3.0
0.0
2.0
1.0
4.0
2.9
2003
2.7
2004
2.7
2005
2.8
2006
2.8
2007
2.7
2008
2.6
2009
Ba
lt
iMo
re
M
et
ro
2.6
2003
2.9
2004
3.5
2005
2.9
2006
2.4
2007
2.8
2008
3.2
2009
lig
ht
ra
il
3.0
0.0
2.0
1.0
5.0
4.0
1.3
2003
1.4
2004
1.4
2005
1.5
2006
1.5
2007
1.5
2008
1.6
2009
5.0
0.0
2.5
Ma
rC
2003 2004 2005 2006 2007 2008 2009
5.0
0.0
2.5
Co
nt
ra
Ct
ed
C
oM
Mu
te
r
Bu
s
f i s C a l Y e a r
5.0
3.5
2010
2.6
2010
3.0
2010
1.6
2010
2010
0.6 0.7 0.8 0.8 0.8 0.8 0.9 0.8
Pa
ss
en
ge
rs
Pe
r r
ev
en
ue
ve
hiC
le
Mil
e
3.6
2011
2.8
2011*
3.0
2011*
1.5
2011*
2011
0.9
*2011 data points were revised from the 2012 Report for Light Rail, Baltimore Metro and MARC.
4.2
2012
3.1
2012
3.0
2012
1.5
2012
2012
1.0

2 9
Goal:System
Preservation&Performance
Why Did Performance change?�•� �Cost�per�trip�increased�by�1.8%�(or�$0.10�per�trip)�
due to rising fuel costs, contract increases, general inflation and labor agreements
•� �Local�Bus�continues�to�be�MTA’s�most�efficient�way�to move passengers, with cost growth well in line or below historical trends
•� �Light�Rail’s�cost�per�trip�this�year�was�higher�than�last, the costs are still well within or below historical trends
•� �Controlled�system�costs�while�maintaining�high�levels of service quality
•� �Aggressively�managed�and�audited�of�contracted�service providers to ensure 100% accuracy in invoices and claims
•� �MARC�and�Commuter�Bus�cost�per�trip�increased�this year, but increasing ridership and better contractual management have minimized cost growth, which stayed below historical levels
What Are future Performance strategies?�•� �Continue�efforts�to�control�system�costs�while�
maintaining high levels of service quality
•� �Continue�aggressive�management�and�auditing�of contracted service providers to ensure 100% accuracy in invoices and claims
•� �Provide�maximum�transit�capacity�possible�in�areas�with the highest demand potential to provide increased passenger trips without major system expansions
MtA: Operating cost Per Passenger tripTogether, the operating cost per passenger trip and operating cost per revenue vehicle mile are key industry performance measures and show MTA’s ability to effectively and efficiently provide service to passengers on various modes of travel.
lo
Ca
l B
us
$0.00
$30.00
$15.00
$45.00
$3.15
2009
$2.88
2003
$2.57
2004
$3.13
2005
$3.02
2006
$3.07
2007
$3.20
2008
Ba
lt
iMo
re
M
et
ro
$0.00
$30.00
$15.00
$45.00
$4.21
2009
$3.88
2003
$4.01
2004
$3.70
2005
$3.77
2006
$4.27
2007
$4.22
2008
$0.00
$30.00
$15.00
$45.00
$4.66
2009
$5.97
2003
$6.77
2004
$8.25
2005
$6.94
2006
$6.56
2007
$5.03
2008
lig
ht
ra
il
$4.09
2010
$5.05
2010
$4.20
2010
oP
er
at
ing
Co
st
Pe
r P
as
se
ng
er
tr
iP (
2012
Dol
lars
)
$4.08
2011
$4.56
2011
$4.09
2011
Ma
rC
$0.00
$30.00
$15.00
$45.00
$13.70
2009
$11.59
2003
$12.03
2004
$11.69
2005
$11.43
2006
$11.39
2007
$12.68
2008
$13.92
2010
$11.48
2011
Co
nt
ra
Ct
ed
C
oM
Mu
te
r
Bu
s
$0.00
$30.00
$15.00
$45.00
$10.66
2009
$10.89
2003
$11.44
2004
$12.02
2005
$11.54
2006
$11.48
2007
$11.77
2008
$10.85
2010
$6.47
2011
f i s C a l Y e a r
$0.00
$30.00
$15.00
$45.00
$43.30
2009
$31.49
2003
$39.31
2004
$45.89
2005
$46.06
2006
$43.66
2007
$42.06
2008
Pa
ra
tr
an
sit
&t
ax
i
aC
Ce
ss
$37.77
2010
$39.38
2011
$4.15
2012
$4.64
2012
$4.17
2012
$11.69
2012
$6.58
2012
$40.00
2012
TARGET: Cost per passenger for Local Bus, Baltimore Metro and Light Rail to increase at a rate no higher than the Consumer Price Index (CPI)*
* The CPI provides information about price changes in the national economy.
$50.00

Goal:System
Preservation&Performance
3 0
MtA: Operating cost Per revenue Vehicle Mile Why Did Performance change?�•� �Cost�per�mile�increased�by�1.8%�(about�$0.21)�
compared to FY2011
•� �Operating�cost�increases�were�mainly�driven�by�fuel, contract increases, general inflation and labor agreements
•� This�rate�of�growth�matches�historical�trends
What Are future Performance strategies?•� �Continue�efforts�to�control�system�costs�while�
maintaining high levels of service quality
•� �Continue�aggressive�management�and�auditing�of contracted service providers to ensure 100% accuracy in invoices and claims
•� �Provide�maximum�transit�capacity�possible�in�areas�of highest demand potential in order to provide increased passenger trips without major system expansions
$30.00
$0.00
$20.00
$10.00
lo
Ca
l B
us
2003 2004 2005 2006 2007 2008
$12.20 $10.89 $10.51 $11.78 $12.27 $13.65
2009
$13.70
$30.00
$0.00
$20.00
$10.00
$15.31 $16.60 $16.30 $16.64 $17.10 $19.54
Ma
rC
2003 2004 2005 2006 2007 2008
$21.21
2009
$30.00
$0.00
$20.00
$10.00
$11.29 $11.24 $10.12 $10.39 $11.87 $11.33
Ba
lt
iMo
re
M
et
ro
2003 2004 2005 2006 2007 2008
$10.88
2009
$30.00
$0.00
$20.00
$10.00
$15.54 $19.94 $28.66 $20.00 $15.79 $14.21
2003 2004 2005 2006 2007 2008
lig
ht
ra
il
$14.58
2009
2010
$14.12
$22.48
2010
$12.50
2010
$12.96
2010
Co
st
Pe
r r
ev
en
ue
ve
hiC
le
Mil
e (
2012
Dol
lars
)
2011
$14.49
$12.59
2011
$12.17
2011
$17.52
2011
$30.00
$0.00
$20.00
$10.00
$6.67 $8.05 $9.30 $8.66 $9.17 $9.80
Co
nt
ra
Ct
ed
C
oM
Mu
te
r
Bu
s
2003 2004 2005 2006 2007 2008
$9.49
2009
$9.34
2010
$5.94
2011
f i s C a l Y e a r
$30.00
$0.00
$20.00
$10.00
Pa
ra
tr
an
sit
&t
ax
i
aC
Ce
ss
2003 2004 2005 2006 2007 2008
$4.48 $5.83 $6.20 $5.36 $5.10 $5.15 $5.38
2009
$5.39
2010
$5.98
2011
TARGET: Cost per passenger for Local Bus, Baltimore Metro and Light Rail to increase at a rate no higher than the Consumer Price Index (CPI)*
* The CPI provides information about price changes in the national economy.
2012
$14.74
$12.82
2012
$12.38
2012
$17.83
2012
$6.06
2012
$6.08
2012

3 1
Goal:System
Preservation&Performance
Why Did Performance change?�•� �MVA�provides�services�for�other�agencies�(e.g.,�central�
collection unit, E-ZPass® sales, organ donor program, child support enforcement, insurance enforcement, voter registration, warrants and flags)
•� �Increase�in�information�technology�investments�and�facility infrastructure
•� �Vehicle�Emissions�Inspection�Program�(VEIP)�is�now�fully operational with the cost per transaction reduced to just over $13
•� �Number�of�transactions�is�growing�slowly�while�budgets remain relatively unchanged, leading to a small decrease in cost per transaction
What Are future Performance strategies?�•� �Continue�to�implement�a�new�Strategic�Business�
Plan, which highlights measures for attaining process efficiencies and managing costs
•� �Revise�the�Long�Range�Plan�that�highlights�visions�and�goals for a future MVA that is more customer-oriented, efficient and technically advanced to meet the needs of MVA customers
MVA: MVA cost Per transaction*Cost per transaction is an indication of whether MVA business practices and programs are increasingly cost-effective through the employment of better technology and operational practices.
f i s C a l Y e a r
20
12
do
ll
ar
s*
*
$6.00
$4.00
$2.00
$0.00
$8.00
$10.00
$12.00
$13.47
2009
$15.99
2003
$15.11
2004
$14.44
2005
$13.72
2006
$14.08
2007
$13.41
2008
$14.00
$16.00
$18.00
$20.00
*Includes all transactions (e.g. licensing, registration, titling).
** The historical cost per transaction data are adjusted for inflation.
$14.15
2010
target: $14.00 by 2012
target: 40% by 2012
f i s C a l Y e a r
Pe
rC
en
t o
f t
ra
ns
aC
tio
ns
*
15.0%
10.0%
5.0%
0.0%
20.0%
25.0%
30.0%
24.2%
2003
25.4%
2004
27.4%
2005
27.4%
2006
28.9%
2007
29.2%
2008
35.0%
40.0%
45.0%
50.0%
29.8%
2009
31.8%
2010
* The number of transactions includes the number of vehicles tested at VEIP stations, and excludes driver and vehicle Direct Access Records (DARS).
$13.58
2011
33.7%
2011
$13.27
2012
MVA: Alternative service Delivery (AsD) transactions as Percent of total transactionsAlternative services offer the ability to provide fast and convenient service delivery to the MVA customer. These transactions do not involve a walk-in interaction and require development of new information technology systems and changes in customer behavior, which may be offset by new legislation and programs that require a walk-in transaction.
Why Did Performance change?�•� �Continued�to�identify�and�offer�new�ASD�options,�
including self-service kiosks, central scheduling, email collection, website re-design, and creative marketing, increasing customer usage from 33.7% in FY2011 to 38.7% in FY2012
What Are future Performance strategies?�•� �Send�vehicle�registration�renewal�notices�to�customers�
by email to reduce mailing costs, improve efficiency and enhance customer convenience
•� �Continue�to�promote�and�implement�ASD�services,�encouraging Identification (ID) card and driver’s license renewals (for individuals less than 40 years of age) by mail, kiosks and web
•� �Continue�redesigning�the�MVA�website�to�improve� customer service
38.7%
2012

Goal:System
Preservation&Performance
3 2
MAA: Airline cost Per enplaned Passenger (cPe)Airline cost and non-airline revenue measures allow BWI Marshall to remain competitive in a region that is unique because it has four proximate airports.
Why Did Performance change?�•� �The�CPE�at�BWI�Marshall�continues�to�be�the�
lowest in the mid-Atlantic region and be well below the mean of comparable airports
•� �BWI�Marshall�continues�to�compare�favorably�with its peer airports on non-airline revenue per enplaned�passenger�(RPE)
What Are future Performance strategies?•� Continue�strategies�to�increase�parking�revenues
•� �Continue�to�closely�monitor�all�airport�costs�to�keep�BWI Marshall rates competitive with other regional airports
•� �Continue�to�review�the�cost�effectiveness�of�capital�projects before moving forward with design and construction
•� �Enhance�the�existing�retail,�food�and�beverage�concession in terminals by adding recognized local and new national concepts
20
12
do
ll
ar
s*
**
f i s C a l Y e a r
$12.00
$8.00
$4.00
$2.00
$0.00
$6.00
$10.00
$14.00
2009
$10.77
2006
$9.91
2007
$10.21
2008
$10.89
TARGET: BWI Marshall non-airline RPE to be at or above the mean of comparable airports**
BWI Marshall non-airline RPE
Comparable airports non-airline RPE mean amount
2010
$10.56
$10.65
$11.47$12.14
$10.30
* RPE is based on non-airline revenue (e.g., parking, concessions and ground transportation).
** Comparable airports are defined as Washington Reagan National, Washington Dulles
International and Philadelphia International. 2012 data is not available for Comparable airports.
*** The cost per passenger data are adjusted for inflation.
MAA: non-Airline revenue Per enplaned Passenger (rPe)*
2011
$10.50
$11.36
f i s C a l Y e a r
20
12
do
ll
ar
s*
**
$12.00
$6.00
$2.00
$0.00
$4.00
$10.00
$7.03
2006 2007
$7.40
2008
$8.29
2009
$9.97
2010
$9.82
TARGET: BWI Marshall CPE below the mean CPE of comparable airports**
BWI Marshall CPEComparable airports CPE mean amount
$8.00
2011
$9.35
$9.83 $10.16$10.75
$12.38
$13.93
$15.42
*2012 comparable airports CPE mean amount is preliminary.
** Comparable airports are defined as Washington Reagan National, Washington Dulles International and Philadelphia International.
*** The cost per passenger data are adjusted for inflation.
$14.00
$16.00
$18.00
$7.27
2005
$10.06
2012
$9.29
$15.49*
2005
$9.39
$10.20
2012
$10.13
$11.00

3 3
Goal:System
Preservation&Performance
Why Did Performance change?�•� �Capacity�at�placement�sites�is�being�
consumed faster than new capacity can be brought online. In 2012, only maintenance dredging of Harbor channels can be accommodated without overloading existing placement sites. New dredging work for channel improvement in the Harbor is not being considered at this time
•� �On�average,�there�is�1.0�million�cubic�yards�(mcy)/year of Harbor maintenance dredging and 0.5 mcy/year of new work dredging in the Harbor to make improvements to the channel system
•� �Supported�Maryland’s�Dredged�Material�Management Program and the U.S. Army Corps�of�Engineers’�Mid-Chesapeake�Bay�Island feasibility studies
•� �Maintained�efforts�to�ensure�deep�channel�access to the Port
What Are future Performance strategies?�•� �Continue�to�develop�and�package�appropriate�
communications materials (e.g. hand-outs, fact sheets, talking points) for public dissemination to help illustrate the prioritization process and ultimate recommendations for placement sites and options
•� �Work�with�the�U.S.�Army�Corps�of�Engineers�and elected officials to ensure the Chesapeake & Delaware (C&D) Canal is properly maintained to the authorized depth
•� �Continue�with�a�strategic�communication�plan�for the dredge material placement process
•� �Assist,�where�possible,�to�reactivate�placement�sites at Courthouse Point and Peace Creek to provide additional capacity
•� �Continue�to�evaluate�innovative�reuse�of�dredge material
•� �The� FY2013-2018 CTP includes $427 million to implement the Governor’s Strategic Plan for Dredge Material Management, which will help maintain shipping channels
•� �Continue�process�to�resolve�scheduling,�legal�and community enhancement issues for potential Harbor placement option, i.e. Coke Point Dredged Material Containment Facility (DMCF)
MPA: Adequate Dredge Material Placement capacity remaining for Harbor and Bay Maintenance and new Work DredgingMPA is responsible for obtaining dredged material placement sites.
f i s C a l Y e a r
ad
eq
ua
te
an
nu
al
Ca
Pa
Cit
Y
r
eM
ain
ing
fo
r M
ain
te
na
nC
e a
nd
ne
w
wo
rk
dr
ed
gin
g (
Year
s)
3.0
2.0
1.0
0.0
2005 2006 2007 2008
4.0
5.0
6.0
5.04.0 4.03.5 3.02.5 2.01.5
2009
1.00.5
target: Bay and Harbor Material Capacity: 20 years
Bay MaterialHarbor Material
*Adequate capacity did not exist for both maintenance and new projects without overloading placement in FY2010.
2010* 2011
2.0
2004
6.05.0
2012
1.0
7.0
Dredging took place in the Inner Harbor to prepare for the War of 1812 Bicentennial celebration

Goal:System
Preservation&Performance
3 4
MPA: revenue Versus Operating expenseRevenues are an important measure of business activity at the MPA terminals. MPA’s operating expenses are recovered by revenues generated.
Why Did Performance change?�•� �The�MPA�nearly�doubled�its�net�operating�income�of�$18.5�million�for�
FY2012 which included a one-time payment of $5.7 million from a customer whose lease ended without fulfilling their minimum guarantee
•� �MPA’s�billable�cargo�tonnage�exceeded�prior�fiscal�year�volumes�by�10%,�as�well as FY2012’s budgeted expectations
•� �Cruise�ship�passenger�volumes�exceeded�projected�expectations�for�FY2012�with�484,750�passengers�sailing�on�106�cruises
•� �The�MPA�won�an�advertising�award�in�the�American�Association�of�Port�Authorities (AAPA) Communications Awards Program for an ad that highlighted the construction of a new 50-foot deep container berth and the installation of four super post panama cranes
•� �MPA�successfully�controlled�operating�expenditures�and�maximized�revenues throughout FY2012
What Are future Performance strategies?•� Attract�and�retain�sufficient�cargo�volumes�to�provide�future�revenue�growth
•� Continue�to�improve�MPA�financial�systems�and�reporting�techniques�
•� �Maintain�efficient�and�effective�contract�management�and�internal� project delivery
•� Continue�efforts�to�increase�World�Trade�Center�occupancy
•� �Continue�to�develop�business�synergies�with�public-private�partner,�Ports�America Chesapeake, to maximize container volumes through Seagirt Marine Terminal
•� �Continue�promoting�the�Port�as�a�convenient�location�for�year-round�cruising
•� �Continue�the�partnership�with�existing�cruise�lines�and�develop�new�opportunities for additional cruise lines to come to Baltimore
f i s C a l Y e a r
20
12
do
ll
ar
s (M
illio
ns)*
*
$60.0
$40.0
$20.0
$0.0
$80.0
$100.0
$120.0
2004
$115.4$112.1
2005
$113.9$110.4
2006
$106.3$103.8
2007
$104.8$105.1
2008
$107.0$103.6
2009
$100.4$98.3
target: Revenue > Operating Budget
2010***
$67.1$72.5
* Exclusions include: MDTA lease payments for Masonville terminal, Certificate of Participation (COPs) for M-real facility and MPA operating costs for new/replacement equipment.
** The revenue and operating data is adjusted for inflation.
***Revenues and Expenses dropped in FY2010 and later due to the public-private partnership agreement with Ports America Chesapeake, in which the MPA no longer operates Seagirt Marine Terminal.
$5.2
$3.3$2.9
$2.7$4.9
$5.8
ExpensesRevenue Exclusions*
$4.3
2011***
$40.4$50.0
$4.9
2003
$114.2$111.4
$2.9
2012***
$37.4$55.9
$4.2
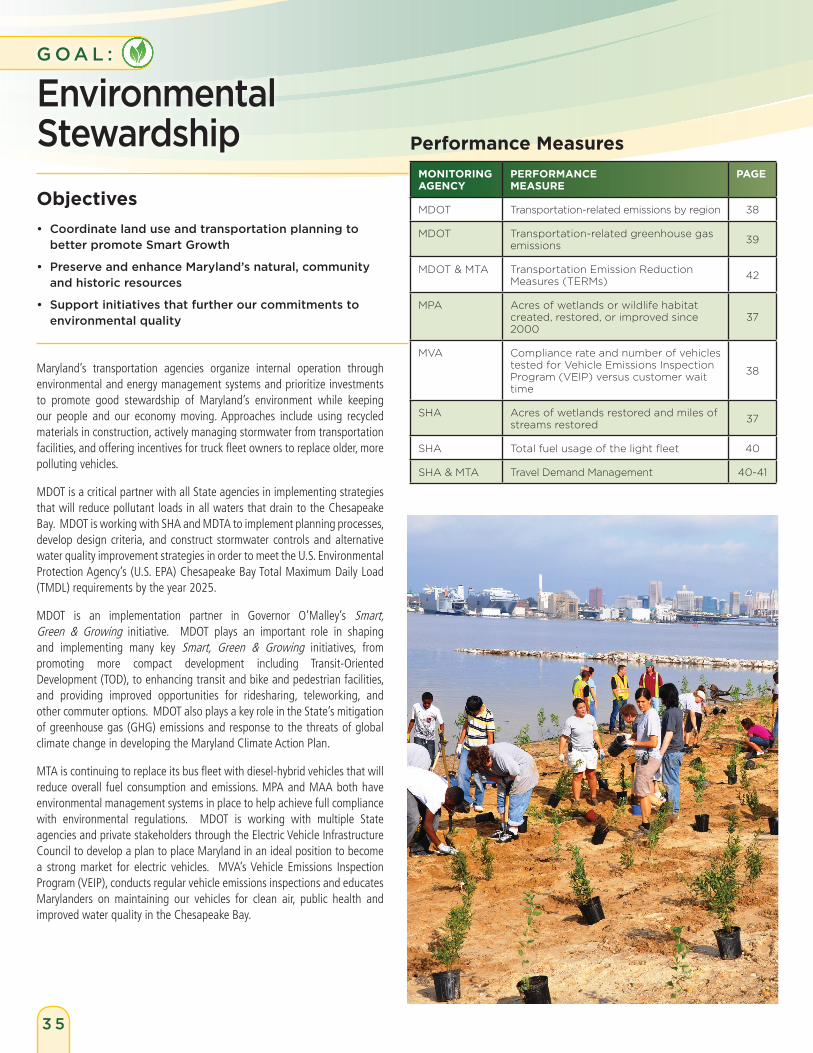
Objectives• CoordinatelanduseandtransportationplanningtobetterpromoteSmartGrowth
• PreserveandenhanceMaryland’snatural,communityandhistoricresources
• Supportinitiativesthatfurtherourcommitmentstoenvironmentalquality
Performance Measures
Maryland’s transportation agencies organize internal operation through environmental and energy management systems and prioritize investments to promote good stewardship of Maryland’s environment while keeping our people and our economy moving. Approaches include using recycled materials in construction, actively managing stormwater from transportation facilities, and offering incentives for truck fleet owners to replace older, more polluting vehicles.
MDOT is a critical partner with all State agencies in implementing strategies that will reduce pollutant loads in all waters that drain to the Chesapeake Bay. MDOT is working with SHA and MDTA to implement planning processes, develop design criteria, and construct stormwater controls and alternative water�quality�improvement�strategies�in�order�to�meet�the�U.S.�Environmental�Protection�Agency’s�(U.S.�EPA)�Chesapeake�Bay�Total�Maximum�Daily�Load�(TMDL) requirements by the year 2025.
MDOT is an implementation partner in Governor O’Malley’s Smart, Green & Growing initiative. MDOT plays an important role in shaping and implementing many key Smart, Green & Growing initiatives, from promoting more compact development including Transit-Oriented Development (TOD), to enhancing transit and bike and pedestrian facilities, and providing improved opportunities for ridesharing, teleworking, and other commuter options. MDOT also plays a key role in the State’s mitigation of greenhouse gas (GHG) emissions and response to the threats of global climate change in developing the Maryland Climate Action Plan.
MTA is continuing to replace its bus fleet with diesel-hybrid vehicles that will reduce overall fuel consumption and emissions. MPA and MAA both have environmental management systems in place to help achieve full compliance with environmental regulations. MDOT is working with multiple State agencies�and�private�stakeholders�through�the�Electric�Vehicle�Infrastructure�Council to develop a plan to place Maryland in an ideal position to become a� strong� market� for� electric� vehicles.� � MVA’s�Vehicle� Emissions� Inspection�Program�(VEIP),�conducts�regular�vehicle�emissions�inspections�and�educates�Marylanders on maintaining our vehicles for clean air, public health and improved water quality in the Chesapeake Bay.
MOnItOrIng Agency
PerfOrMAnce MeAsure
PAge
MDOT Transportation-related emissions by region 38
MDOT Transportation-related greenhouse gas emissions 39
MDOT & MTA Transportation Emission Reduction Measures (TERMs) 42
MPA Acres of wetlands or wildlife habitat created, restored, or improved since 2000
37
MVA Compliance rate and number of vehicles tested for Vehicle Emissions Inspection Program (VEIP) versus customer wait time
38
SHA Acres of wetlands restored and miles of streams restored 37
SHA Total fuel usage of the light fleet 40
SHA & MTA Travel Demand Management 40-41
3 5
G o a l :
EnvironmentalStewardship

MDOT: � •� �Smart, Green & Growing: Implement the Bikeways Program and Bikeshare Program to facilitate bicycling as a transportation option in support of Cycle Maryland and the Smart, Green & Growing initiative.
� •� �Chesapeake�Bay�Restoration:�Facilitate�MDOT�Modal�Administration and Authority information sharing on processes and strategies for managing stormwater runoff from all MDOT infrastructure to help meet the Chesapeake Bay pollution budget.
� •� �Improve�Air�Quality:�Participate�in�multi-state�discussions�on�developing a regional network of electric vehicle charging stations and�continue�to�work�with�the�Maryland�Energy�Administration�and�the�Electric�Vehicle�Infrastructure�Council�to�plan�for�and�fund�the deployment of charging stations.
MAA:� •� �The�Maryland�Environmental�Noise�Act:�Provides�for�the�protection�of citizens from the impact of transportation-related noise. The aviation portion of the Act requires the MAA to adopt an Airport Noise�Zone�(ANZ)�and�Noise�Abatement�Plan�to�identify�and�try�to reduce impacted land use areas around the airport. This is achieved by MAA controlling the development of property inside the�ANZ�and�prohibiting�incompatible�land�uses�such�as�homes,�schools nursing homes, etc. The Noise Abatement Plan establishes arrival and departure procedures aimed to reduce impacted land use areas around the airport.
� •� �The�Voluntary�Residential�Property�Acquisition�Program�which�facilitates the purchase of noise impacted residential properties, and the Homeowner Assistance Programs, which funds noise mitigation projects for residents, are both part of the Federal Aviation Regulation Part 150 Program and are 80% federally-funded.
� •� �Stormwater�Best�Management�Practices�(BMPs):�MAA�continues�to focus on stormwater management through the implementation of�the�Maryland�Department�of�the�Environment’s�Stormwater�Regulations of 2009 (Maryland Stormwater Act of 2007) for both airport and tenant projects at BWI Marshall.
MPA:�� •� �Air�Quality:�Enhanced�the�Mid-Atlantic�Dray�Truck�Replacement�Program, providing $20,000 each toward the cost of a newer dray truck�that�meets�or�exceeds�the�2007�U.S.�EPA�certified�engine�emission standard.
� •� �Air�Quality:�Installed�four�container�cranes,�which�can�lift�187,300�pounds of cargo and are fully electric, emitting no diesel emissions.
MTA:� •� �Air�Quality:�Increased�the�number�of�hybrid�diesel�electric�buses�in the MTA fleet with the purchase of 57 new buses. Once purchased, 40% of the bus fleet will be hybrid diesel electric buses. In the FY2013-FY2018 Consolidated Transportation Plan (CTP),�63�new�hybrid�buses�are�planned�for�purchase�in�FY2013.
� •� �Air�Quality:�Created�three�new�commuter�bus�routes�to�offer�a�total of five routes along the Intercounty Connector (ICC) corridor, providing Maryland residents with an alternative to driving. The commuter buses provide access to jobs while reducing gasoline consumption and negative impacts on the environment.
� •� �Energy�Consumption:�In�2011�a�massive�project�to�replace�electric�fixtures and bulbs with greener, more energy-efficient components was undertaken in 54 different MTA locations. MTA continues to upgrade lighting throughout the system, resulting in anticipated energy savings of over $434,000 per year.
Key Initiatives
Goal:Environm
entalStewardship
3 6
MDTA:� •� �Manage�Stormwater�BMPs�by�inventorying�all�practices,�such�as�early coordination on inventory of BMPs from mega projects like the�ICC�and�I-95�Section�100�Express�Toll�Lanes�(ETLs)�as�well�as�upcoming Chesapeake Bay restoration retrofits.
� •� �Maintain�Recycling�Programs:�The�combined�efforts�of�MDTA�office staff and maintenance/automotive personnel have resulted in the recycling of 1,212.03 tons of materials in CY2011.
� •� �Chesapeake�Bay�Restoration:�To�address�EPA’s�Bay�Restoration�goals, MDTA is completing and refining an inventory of impervious areas, investigating innovative approaches to implement stormwater retrofits, and designing and constructing stormwater retrofits along MDTA highways.
� •� �Environmental�Management:�MDTA�continues�the�development�of�environmental Standard Operating Procedures for the Division of Operations to ensure that environmental issues are managed in a consistent and cost effective manner throughout the MDTA.
MVA:� •� �Energy�Management:��MVA�participated�in�an�independent�energy audit that established a baseline of energy consumption at MVA facilities and identified new innovative ideas for energy management.
� •� �Environmental�Management:�MVA�is�implementing�a�Compliance�Focused�Environmental�Management�System�(CFEMS)�to�better�incorporate environmental considerations into business practices (by�2016).
� •� �Improve�Air�Quality:�MVA�is�continuing�to�enhance�the�provision�of Internet-based services to avoid unnecessary vehicle trips. MVA is also developing new technologies and services to facilitate vehicle emissions testing as well as new regulations to ensure compliance with State emissions testing mandates.
� •� �MVA�Facilities�Maintenance�and�Engineering�(FME)�has�taken�an aggressive approach of reducing its energy, fuel and water consumption while simultaneously reducing MVA’s carbon footprint by utilizing various devices such as T5 light fixtures, low water flush toilets, solar light pole, installation of sensor flush values, sensor / motion wall and ceiling mounted occupancy sensors, Variable Frequency Drives (VFD’S), high efficiency motors, fans, and pumps, installation of compact florescent lights (CFL’s), and�installation�of�LED�exit�signs,�light�and�bulbs�fixtures.��
SHA:� •� �Chesapeake�Bay�Restoration:�SHA�made�significant�progress�towards the 2013 milestone established in the Watershed Implementation Plan by meeting all interim pollutant reduction goals established for FY2012. SHA continues to develop effective strategies and seek implementation project opportunities that extend the resources required to meet the 2013 milestone goals.
� •� �Recycled�Materials:��SHA�continues�to�partner�with�industry�and�environmental agencies to maintain quality and safety while increasing the use of recycled materials in highway construction. In CY2011, 30,109 tons of reclaimed concrete aggregate were used to replace virgin aggregate, and 13% of all hot mix pavement placed on State roadways was recycled asphalt pavement.
� •� �Tree�Planting:��SHA�continues�to�be�a�key�partner�in�Maryland’s�tree planting initiative and is involved in the American Chestnut Tree Restoration project, located in Carroll County, and the Partnership Planting Program where SHA helps volunteers find safe�locations�along�roadways�to�plant�trees.�Each�year,�SHA�undertakes tree planting programs along highway medians, grassy areas, or interchanges throughout the state.

3 7
Goal:Environm
entalStewardship
sHA: Acres of Wetlands restored and Miles of streams restored
Why Did Performance change?�•� �Completed�the�final�34.6�acres�of�stewardship�wetlands�creation�by�the�close�
of FY2012, thereby meeting SHA’s 200 acres goal
•� �A�total�of�5.7�miles�of�stream�restoration�was�completed�by�the�close�of�FY2011 to exceed SHA’s environmental stewardship goal of five miles
•� �New�regulations�for�the�restoration�of�Chesapeake�Bay�ensure�all�resources�are being devoted to compliance goals for TMDL standards
What Are future Performance strategies?�•���Support restoration of the Chesapeake Bay and compliance with TMDL
standards ($138.2 million in the FY2013–FY2018 CTP for planning, design, and construction of stormwater controls and alternative water quality improvement strategies)
•� �As�resources�allow,�SHA�will�continue�to�look�for�opportunities�to�enhance�the environment through cost-effective solutions
•� �Continue�to�provide�environmental�stewardship�by�supporting�community-based landscape enhancement projects and tree planting through its Partnership Planting Program
SHA’s wetland and stream restoration activities have exceeded regulatory requirements. These wetland and stream restoration activities help compensate for prior damage to these sensitive ecosystems, caused in part by roadway construction. Wetland and stream restoration is also a key stormwater runoff management strategy, helping to improve the water quality of our rivers, lakes and bays without the installation of costly treatment infrastructure. SHA’s ongoing wetland and stream restoration efforts will now focus on Chesapeake Bay water quality needs.
2006
f i s C a l Y e a r
aC
re
s o
f w
et
la
nd
s
120
80
40
20
0
60
100
160
140 Mil
es
of
st
re
aM
s
6.00
4.00
2.00
1.00
0.00
3.00
5.00
8.00
7.00
180
2007
50
0.6
2008
68
3.9
2009
4.7
50
9.00
target: 5 miles of streams by 2011
target: 200 acres of wetlands by 2012
Miles of streams restored beyond project mitigation requirements
Acres of wetlands restored beyond project mitigation requirements
200
2010
4.7
157 157
10.00
2012*2011
5.7
165
220
200
* Streams goal achieved in 2011.
MPA: Acres of Wetlands or Wildlife Habitat created, restored, or Improved since 2000*
Why Did Performance change?�•� �Mitigation�activities�in�FY2012�were�directed�toward�schoolyard�greening�
instead of undertaking new wildlife habitat improvements
What Are future Performance strategies?•� �Create�and�improve�wildlife�habitat�to�conform�to�permit�requirements�
for construction projects requiring mitigation
•� �Continue�Masonville�eastern�and�peninsula�uplands�environmental�improvement projects, which are noteworthy examples of coordinating with neighboring communities’ needs which allows MPA to maintain its social license to operate
•� �Continue�efforts�to�restore�the�Hart-Miller�Island�North�Cell�and�develop�Poplar�Island�Expansion
MPA is in compliance with the various permits that are granted to construct projects needed for MPA customers (e.g., landside tenants or steamship lines).
* Represents cumulative mitigation efforts by MPA. New data not available for this chart in FY2011 or FY2012 per the performance bullet.
** Data were revised from 2012 Report.
target: Mitigate projects as required by Federal, State and local statutes
aC
re
s
C a l e n d a r Y e a r
2001
2002
2004
2006
2009**
1,000
800
600
0
1,200
1,400
1,600
640
1,800
2,000
1,374
1,685
1,7041,785
400
200
1,7912010**

Goal:Environm
entalStewardship
3 8
* Streams goal achieved in 2011.
MVA: compliance rate and number of Vehicles tested for Vehicle emissions Inspection Program (VeIP) Versus customer Wait time*
Why Did Performance change?�•� �In�FY2012,�customers�waited�an�average�of�
only 4.5 minutes, well below MVA’s target threshold of 15 minutes
•� �Vehicle�inspections�increased�by�41,550�in�FY2012 (2.4% above FY2011)
•� �The�VEIP�compliance�rate�for�FY2012�increased slightly to 91% compared to the FY2011 rate of 90%
What Are future Performance strategies?•� �Actively�research�new�technologies�and�
services to facilitate vehicle emissions testing
•� �In�partnership�with�the�MD�Department�of�the�Environment�(MDE),�continue�to�develop�strategies, policies, and regulations to ensure compliance with State emissions testing mandates and Federal clean air standards
•� �Progressively�monitor�registered�vehicles�in�eligible (non-attainment) counties to ensure testing compliance
•� �Continue�to�monitor�wait�times�and�implement process/procedure changes where necessary to maintain current wait time levels
•� �Plan,�design�and�implement�an�enhanced�technical platform that will allow for the full integration of Local Business services and processes thus providing the customer with more efficient access to MVA driver and vehicle services and products
Monitoring�the�VEIP�testing�compliance�rate�ensures�system�effectiveness�and�identifies�vehicles�exceeding�allowable�standards.�Tracking�the�average�wait�time�at�VEIP�stations�ensures�that�the�15-minute�average�wait time requirement is met. Timely and efficient customer service helps the State meet Federal clean air standards by identifying polluting vehicles and encouraging regular vehicle maintenance.
* 14 counties offer VEIP tests: Anne Arundel, Baltimore, Baltimore City, Carroll, Harford, Howard, Queen Anne’s, Cecil, Washington, Calvert, Charles, Frederick, Montgomery and Prince George’s.
f i s C a l Y e a r
8.0/80%
4.0/40%
2.0/20%
0.0/0%
6.0/60%
10.0/100%
Min
ut
es
/Co
MP
lia
nC
e r
at
e (
%)
2,000
1,000
500
0
1,500
2,500
nu
MB
er
of
ve
hiC
le
s t
es
te
d
(Thousands)
Number of vehicles tested at VEIP
Average customer wait time at VEIP station in minutes
VEIP compliance rate
target: 98% compliance rate
target: Maintain wait time <15 minutes
92% 94%97%
88%89% 90% 90%
1,5134.41,4704.2 1,6395.01,5304.5 1,6075.0 1,1634.9 4.3
20072005 20082006 2009 2010 2011
1,697
91%
4.5
2012
1,738
MDOt: transportation-related emissions by region*Reducing vehicle emissions improves air quality in compliance with Federal regulations and provides health benefits for Maryland residents.
PerfOrMAnce MeAsure
regIOncAlenDAr yeAr*** % cHAnge
2002-20112002 2008 2011***
Volatile Organic Compound (VOC) Tons per Day
Baltimore 78.2 50.1 45.3 -42%
Washington** 73.4 42.8 40.0 -46%
Nitrogen Oxide (NOx) Tons per Day
Baltimore 209.4 125.7 116.7 -44%
Washington** 175.1 102.2 103.0 -41%
Carbon Monoxide (CO) Tons per Day
Baltimore 1,243.5 844.3 699.9 -44%
Washington** 1,085.4 666.0 575.1 -47%
Particulate Matter (PM) Tons per Day
Baltimore 8.1 5.8 5.6 -31%
Washington** 6.3 4.4 4.7 -25%
* Emissions calculated using EPAs MOVES2010a model.
** All Washington data represents Maryland’s share of emissions in the Washington region non-attainment area, including Charles, Frederick, Montgomery and Prince Georges counties.
*** CY2011 emissions data is preliminary. Final data will be published by EPA in mid-2013.
What Are future Performance strategies?•� �Promote�mobile�source�emission�reduction�efforts�
including�support�of�Transportation�Emission�Reduction�Measures (MDOT supports the reduction of emissions through congestion mitigation, ridesharing and commuter incentive programs in the FY2013–FY2018 CTP�with�$26�million�in�dedicated�funding)
•� �Implement�the�Baltimore�Regional�Transportation�Board�(BRTB) and the Metropolitan Washington Council of Governments (MWCOG) Transportation Planning Board (TPB) 25-year long-range transportation plans, which meet Clean Air Act requirements confirming that the plan does not worsen the region’s air quality or delay the attainment of Federal air quality standards
•� �Continue�to�replace�older�diesel�buses�in�the�MTA�bus�fleet, with the goal of ensuring that 100% of the MTA fleet are hybrid buses
•� �Continue�overhauls�and�replacements�of�MARC�locomotives�ensuring�that�all�locomotives�meet�EPA�air�quality emissions standards

3 9
Goal:Environm
entalStewardship
MDOt: transportation-related greenhouse gas emissions
What Are future Performance strategies?•� �Continue�to�develop�processes�to�include�climate�
change mitigation and adaptation considerations into project selection, design, maintenance, operations, construction and emergency response
•� �The�SHA�Climate�Adaptation�Team�plans�to�complete�a detailed sea level rise vulnerability assessment of Maryland’s highway system and supporting infrastructure followed by initiating pilot studies
•� �Encourage�continued�growth�in�transit�ridership�through ongoing system enhancements, expansion, and outreach combined with continued support and implementation of TOD projects
•� �Continue�to�work�with�the�Transportation�and�Climate Initiative (TCI) to work with neighboring states to install a regional network of electric vehicle charging stations across the Mid-Atlantic as well as other GHG mitigation strategies
•� �Continue�to�reduce�GHG�emissions�from�SHA’s�vehicle fleet by increasing usage of alternative fuels
•� �Continue�MTA’s�green�bus�fleet�expansion�with�the�recent addition of 57 new hybrid buses in FY2012 and�the�planned�purchase�of�63�more�hybrid�buses�in FY2013 (the FY2013–FY2018 CTP identifies $224.8 million in diesel/hybrid bus replacements over the next six years)
•� �MDOT�is�the�Chair�of�the�Maryland�Electric�Vehicle�Infrastructure�Council�(EVIC)�formed�in�2011�to�formulate an action plan to successfully integrate electric vehicles into the State’s transportation network.�The�EVIC’s�recommended�goal�is�to�have�60�thousand�plug�in�electric�vehicles�registered�in�Maryland�by�2020.�The�EVIC�submitted�its�final report to the Governor in December 2012 that outlined the challenges and key steps to developing an electric vehicle market and supporting infrastructure in Maryland. MDOT will continue to work with multiple State agencies and private partners�to�implement�recommendations�of�EVIC
•� �As�part�of�the�Annual�Attainment�Report,�MDOT�will conduct an annual analysis of on-road GHG emissions in Maryland in order to inform the public on progress
A reduction in the growth of overall Vehicle Miles of Travel (VMT) is one of several strategies that MDOT is pursuing to address climate change through mitigation of GHG emissions. Reducing VMT through providing transportation alternatives has other potential benefits to Marylanders, such as reduced congestion, reduced travel costs and improved travel time reliability. Other strategies include providing alternatives to SOV travel and transitioning to a less carbon intensive vehicle fleet and lower carbon fuels.
MDOt climate change Planning
MDOT and its modal agencies are continuing to refine GHG reduction strategies through development of the Maryland Climate Action Plan, as required by the Greenhouse Gas Reduction Act (GGRA) of 2009. These strategies are documented in the MDOT 2012 Implementation Plan, released in April 2011, and the 2011 GGRA Plan, released in June 2012.
MDOT’s planning activities for the transportation sector have resulted in the following findings:
•� �In�2006,�the�transportation�sector,�including�emissions�from�all�on-road�and�off-road sources represents 33% of GHG emissions in Maryland (equaling 35.5 million metric tons (mmt))*
•� �MDOT�programs�included�in�the�CTP�and�in�MPO�long-range�transportation�plans�will achieve a 7% reduction in GHG emissions in 2020. Approximately 50% of the expenditures planned in the CTP provide GHG emission benefits
•� �The�combination�of�GHG-reduction�strategies�focusing�on�clean�fuels�and�Federal�fuel�economy�standards,�including�the�2017-2025�Fuel�Efficiency�standard�finalized�by the Obama Administration in August 2012, will result in a 21% reduction in GHG emissions in 2020
•� �MDOT�programs�plus�the�GHG�reduction�from�clean�fuels�and�Federal�fuel�economy�standards�in�total�reduce�emissions�by�11.7�mmt,�a�reduction�of�8%�from�2006�emissions by 2020
•� �The�most�effective�GHG�reduction�strategies�are�those�implemented�at�a�regional�or�national level such as Federal fuel economy standards and clean fuel standards
* All GHG emissions are calculated using EPA’s MOVES2010a emissions model.
MDOT has also identified other feasible but unfunded GHG-reductions strategies that could help the transportation sector account for up to 33% of the state’s GHG reductions by 2020. These total reductions would significantly assist Maryland in achieving�the�2020�target�of�25%�below�2006�emissions.
In addition, SHA has established goals to identify vulnerable infrastructure and develop risk assessments for short- and long-term investments to protect coastal communities, environmental assets, and infrastructure from the potential impacts of climate change-induced storm surges and sea-level rise.

f i s C a l Y e a r
800,000
700,000
600,000
500,000
900,000
1,000,000
2005
931,177
ga
ll
on
s
2006
889,445
2007
857,174
2008
838,175
2009
816,163
target: 730,000 gallons or fewer by 2015
2010
751,204
2011
709,514
sHA: total fuel usage of the light fleet
Why Did Performance change?�•� �Continued�to�enforce�automobile�engine-idling�policy�for�all�
employees and consultants, and encouraged employees to save fuel through carpooling and videoconferencing for State business trips
•� �Constructed�an�E-85�distribution�facility�at�the�SHA�Hanover�Complex and employee outreach is being conducted to encourage use�of�other�existing�and�planned�E-85�fueling�stations�at�Maryland�State Police (MSP) facilities
•� �Purchased�three�new�hybrid�SUVs�to�replace�conventional� gasoline SUVs
•� �Replaced�15�three-quarter�ton�pickup�trucks�utilizing�diesel�fuel�with�flex-fuel vehicles with the same hauling and towing capacity
•� �SHA�fuel�usage�has�continued�to�decrease�over�the�last�seven�years;�SHA has evolved its fleet to maximize efficiencies as allowable and has reached a plateau in use reduction and fuel efficiency
What Are future Performance strategies?•� �Investigate�opportunities�to�expand�fueling�locations�for�E-85�
fuel and encourage drivers of flex-fueled SHA vehicles to fuel up with�E-85�gas�when�practical
•� �Continue�to�look�for�opportunities�to�institute�fleet�reductions�to�cut overall fuel consumption
•� �Continue�to�replace�older�diesel�pickup�trucks�with�flex-fueled�pickup trucks of similar hauling and towing capacity, and reduce the SUV fleet by replacing some with smaller mid-size pickups in future budgets
This measure is tracked statewide to monitor success in reducing consumption of gasoline through conservation strategies, including use of higher fuel efficiency vehicles for scheduled fleet replacements.
2012
734,216
Goal:Environm
entalStewardship
4 0
f i s C a l Y e a r
80.0
70.0
60.0
50.0
90.0
100.0
110.0
Mil
es
(M
illio
ns)
120.0
2006
104.0
2007
102.0
2008
110.9
2009
102.0
2010
100.0
2011
106.0
target: 109 million by 2013
sHA: reduction in Vehicle Miles traveled through Park-and-ride usage
Why Did Performance change?•� �Statewide,�park-and-ride�lots�are�at�an�estimated�57%�
capacity, which is slightly below the historical average (park-and-ride usage fluctuates in response to changes in gas prices)
•� An�additional�490�spaces�were�funded�for�construction
What Are future Performance strategies?•� �By�2013,�SHA�will�complete�490�additional�spaces,�and�
will complete design of 500 additional park-and-ride spaces for FY2013-FY2014
•� �Investigate�how�to�bolster�capacity�at�single�deck�parking structures at over-capacity park-and-ride facilities, without increasing stormwater runoff
•� �Continue�to�deploy�Electric�Vehicle�(EV)�charging�posts�at�park-and-ride lots
•� �Continue�to�look�for�opportunities�to�construct�park-and-ride lots while planning major highway projects along interstates and principal arterials
•� �Continue�to�explore�the�adaptation�of�park-and-ride�lots�along freight corridors to allow long-haul trucks to park overnight
By offering park-and-ride facilities, SHA provides commuters with an alternative to driving to their destinations and helps increase public transit ridership.
2012*
108.0
2005
95.2
*2012 data is preliminary.

4 1
Goal:Environm
entalStewardship
* Facility usage fluctuates due to the economy; weather conditions; special events; emergencies; delays or shutdowns of parallel lines or modes; maintenance and repair; storage of plowed snow; increases in frequency, service, and capacity; and other factors.
** Includes facilities operated by MTA, Amtrak, WMATA, Penn Station in Baltimore and Union Station in Washington, D.C.
Statewide Park-and-Ride Facilities
travel Demand Management Maryland’s transportation agencies promote Travel Demand Management (TDM) strategies as a way to combat congestion by offering incentives for Marylanders to choose to use public transit, carpool, ride a bike or walk instead of driving alone. Other strategies to reduce demand for roadways include promotion of telecommuting and flexible work hours as a way to reduce or shift trips to times when roadway capacity is less constrained. Maryland supports a wide variety of programs and projects to promote TDM, including Commuter Choice Maryland, Commuter Connections, the Telework Partnership, TOD and statewide park-and-ride facilities. Park-and-ride facilities provide connections to transit, carpooling and other shared modes, helping to lower single-occupancy driving. By cutting down on single-occupant vehicle trips and reducing peak period congestion, TDM contributes to reduced emissions and improved air quality.
Agency tOtAl sPAcesAVerAge WeeKDAy utIlIzAtIOn*
SHA (2012)* (Estimated) 12,524 7,185
MTA Operated (2012) 29,542 18,507
Transit Multipurpose**(2012) (Estimated)
19,959 9,616

Goal:Environm
entalStewardship
4 2
2009-2010 MDOT & MTA TRANSPORTATION EMISSION REDUCTION MEASURES (TERMS)
PrOgrAM PrOgrAM DescrIPtIOnDAIly reDuctIOn In VeHIcle trIPs
DAIly reDuctIOn In VeHIcle MIles Of trAVel*
Guaranteed Ride HomeProvides transit users or carpoolers up to four rides home per year in a taxi or rental car in the event of an unexpected personal or family emergency
7,983 208,346
Employer Outreach (Including Employer Outreach for Bicycles)
Supports marketing efforts to increase employee awareness and use of alternatives to driving alone to work every day
90,350 1,657,809
Integrated Rideshare
Promotes other alternative transportation services to employers and to the general public. Commuter information system documentation is provided with comprehensive commute information, to include regional TDM software updates, transit, telework, park-and-ride and interactive mapping
1,717 51,569
Commuter Operations and Ridesharing Center
Updates and maintains the Commuter Connections database for ride-matching services and provides information on carpooling, transit, Guaranteed Ride Home services and alternative mode choices for the Washington-Baltimore metropolitan region
6,190 180,409
Telework Resource CenterProvides information to employers on the benefits of telecommuting and assists in setting up new or expanded telework programs for employers
12,499 241,834
Mass MarketingPromotes and communicates the benefits of alternative commute methods to single-occupant vehicle commuters through the media and other wide-reach communications
6,922 78,297
MTA College PassOffers a subsidized monthly transit pass to full- or part-time students enrolled in greater Baltimore metropolitan area colleges or universities
4,494 35,000
MTA Commuter Choice Maryland Pass
Baltimore region program that allows employers to purchase transit passes and vouchers for their employees. Employers can subsidize these for their employees or allow employees to purchase passes or vouchers with pre-tax income
9,220 155,541
Transit Store in BaltimoreProvides customer access to transit information and for purchases of transit passes. Some 15-20% of total transit pass sales occur through this outlet
3,308 55,808
* The impacts shown reflect the current definitions and most recent data available for each of the measures.

Objectives• Providebalanced,seamlessandaccessiblemultimodaltransportationoptionsforpeopleandgoods
• FacilitatelinkageswithinandbeyondMarylandtosupportahealthyeconomy
• Strategicallyexpandnetworkcapacitytomanagegrowth
MDOT: Continue to administer the Bikeways Program Grants, which provide local jurisdictions funds to initiate planning activities and/or the design and construction of projects that create and improve bicycle connections in Maryland to key destinations.
MAA: Support passenger traffic growth and new nonstop flights at BWI Marshall with the ongoing major terminal enhancement program, continued excellent customer service, and continued marketing of BWI Marshall as a convenient gateway for travelers to and from the Washington-Baltimore region.
MPA:� �Execute�$12�million�in�capital�funds�(state�and�federal)�to�improve�security�infrastructure on MPA terminals.
MTA: Construct neighborhood-friendly improvements in West Baltimore, including the reconnection of Payson Street, which will enhance pedestrian and vehicle access between surrounding communities.
MDTA:� �Construction�of�the�I-95�Express�Toll�Lanes�(ETLs)�project�is�continuing�with�completion�of�the� I-95/I-695�interchange,�and�the�MD�43�interchange�project� anticipated� in� 2013,� with� the� ETLs� planned� to� open� to� traffic� in 2014.
MVA: Increase the availability and convenience of services with a new online and self-serve kiosk application, which allows Marylanders to renew their State Identification (ID) card via the internet or at an MVA self-serve kiosk.
SHA: Continue to relieve congestion and improve safety for motorists with construction improvements on the most heavily traveled routes in Maryland, including the MD 140 intersection with Painters Mill Road in Owings Mills.
Key Initiatives
Performance Measures
Maryland’s integrated, multimodal transportation system provides efficient and seamless connectivity for people and goods between local, regional, national and international economies. Much effort has been put into planning and/or constructing infrastructure that allows visitors and residents to travel by bicycle, on foot, or by transit. A number of the Bikeways Program Grants awarded this year fund projects that help riders connect to activity centers. For example, the City of Brunswick’s bike route will connect the Chesapeake & Ohio (C&O) Canal Trail, the MARC train station and Main Street. Funding has also been secured to construct a�new� trail� segment,� linking� a�60�mile-network� of� bicycle� and�pedestrian� trails�between the District of Columbia and Maryland. Progress is being made across the 15 designated Transit-Oriented Development (TOD) sites in Maryland including completion of Phase I at the Twinbrook Metrorail Station, and ongoing construction at Owings Mills, Westport, Reisterstown Plaza, and White Flint.
Efficiently� connecting� visitors� and� residents� to� different� parts� of� the� state� by�automobile is also a top priority. Construction projects on heavily traveled routes, to ease congestion and delay, are underway. For example, to alleviate the congestion from the Branch Avenue Metro Station, which increased traffic volumes on MD 5 and the Capital Beltway in the vicinity of the station during peak periods, the State is constructing improvements to the access road, pedestrian bridge and the county roads. Pedestrian/bicycle facilities will be included where appropriate.
At the national and international level, the Port of Baltimore continues to support and provide transportation linkages and encourage economic growth. During the first six months of 2012, the MPA terminals handled a record 4.83 million tons of general cargo. For the Port public and private terminals, 2012 is expected to be a near-record year for foreign waterborne cargo, at about 38 million tons, supporting over 40,000 jobs. BWI Marshall also continues to provide national and international access to Maryland, flying approximately 22.8 million commercial passengers through the airport in 2012.
MOnItOrIng Agency
PerfOrMAnce MeAsure
PAge
MAA Number of nonstop airline markets served 48
MPA International cruises using the Port of Baltimore 50
MPA Port of Baltimore foreign cargo and MPA general cargo tonnage 49
MTA Annual revenue vehicle miles of service provided 46
MTA Average weekday transit ridership 45
MVA Percent of information system availability compared to total number of records maintained
48
SHA Percentage of State-owned roadway directional miles within urban areas that have sidewalks and percent of sidewalks that meet Americans with Disabilities Act (ADA) compliance
47
SHA Percentage of State-owned roadway centerline miles with a bicycle level of comfort (BLOC) grade “D” or better and directional mileage of SHA-owned highways with marked bike lanes
47
SHA & MDTA Percent of freeway lane-miles and arterial lane-miles with average annual volumes at or above congested levels
44
4 3
G o a l :
ConnectivityforDailyLife

sHA & MDtA: Percent of freeway lane-Miles and Arterial lane-Miles with Average Annual Volumes at or Above congested levels
Why Did Performance change?�•� �SHA,�in�partnership�with�the�University�of�Maryland,�implemented�a�state-of-the-art�method�for�
measuring congestion that accounts for actual traffic speeds and volumes as experienced by drivers during the most congested time of day
•� �Retimed�298�signals�that�resulted�in�approximately�$21�million�in�annual�user�cost�savings
•� �Added�capacity�to�Maryland�roads�by�widening�MD�237�from�MD�235�to�Pegg�Road�in�St.�Mary’s�County, reconstructing the I-95/MD 24 interchange; and constructing a new interchange at MD 24/MD 924
•� �Began�construction�of�projects�to�add�capacity�include�widening�of�I-70�from�MD�85�to�MD�144�in�Frederick�County,�widening�of�MD�404�and�US�113�on�the�Eastern�Shore,�reconstructing�I-695/MD�26�and�I-695/MD�139�interchanges,�and�construction�of�the�I-95�ETL�project
What Are future Performance strategies?�•���Continue�the�Coordinated�Highways�Action�Response�Team�(CHART)�program�for�incident�
management, traffic management and traveler information systems
•� Continue�to�focus�resources�on�optimizing�traffic�signals�and�signal�systems
•� �Continue�to�focus�on�improving�reliability�on�highway�systems,�enhancing�accessibility�and�connectivity of the system
•� Identify�and�implement�short-term�geometric�improvements�for�congestion�hot�spots
•� �Enhance�transit�and�non-motorized�travel�options,�as�well�as�Travel�Demand�Management�(TDM) programs
•� �Complete�and�open�for�travel�ETLs�along�I-95�from�north�of�MD�43�to�the�I-95�and�I-895�split,�complete�construction�of�I-95�ETL�access�ramps�at�the�I-95/695�interchange,�and�complete the MD 43/I-95 interchange
Goal:C
onnectivityforDailyLife
4 4
Vehicles per lane per day volumes provide insight into whether congestion is improving or worsening across the state. Given Maryland’s growing economic vitality, the anticipated increase in vehicle miles traveled and the growing size of the driving population, MDOT is focusing its efforts where it can be most effective, which is to slow the pace of congestion growth and set targets accordingly.
17%
2002
29%
17%
2003
29%
17%
2004
30%
17%
2005
31%
15%
2006
30%
15%
2007
30%
14%
2008
29%
14%
2009
25%
14%
2010
29%
C a l e n d a r Y e a r
Pe
rC
en
t o
f C
on
ge
st
ed
la
ne
-Mil
es
15.0%
10.0%
5.0%
0.0%
20.0%
25.0%
30.0%
35.0%
40.0%
45.0%
Percentage of arterial lane-miles with average annual volumes at or above congested levels
Percentage of freeway lane-miles with average annual volumes at or above congested levels
TARGET: < 30% arterial lane-milesTARGET: < 40% freeway lane-miles
14%
2011
31%

4 5
Goal:ConnectivityforDailyLife
Why Did Performance change?�•� �Average�weekday�ridership�in�FY2012�was�2%�higher�than�FY2011�and�has�
increased�by�18%�since�2006
•� �Investigated�and�implemented�more�parking�options�for�commuters�to�alleviate over-crowded lots
•� �Increased�capacity�on�the�Local�Bus�network�by�investing�in�articulated�coaches�–�currently�42�are�in�service�(6%�of�the�fleet)
•� �FY2012�is�the�eighth�consecutive�year�the�MTA�has�seen�an�increase�in�ridership and is the highest ridership recorded since tracking this measure started in the Attainment Report
•� �Compared�to�ridership�in�2003,�MTA�is�providing�over�41,000�more�transit�trips�every�weekday.�Compared�to�2006,�MTA�is�providing�an�additional�57,000 transit trips every day
What Are future Performance strategies?�•� �Aggressively�seek�solutions�to�maximize�Local�Bus�system�capacity�while�
controlling costs through efficient scheduling and system design
•� �Increase�system�reliability�through�reductions�in�mechanical�failures�and�improving on time performance
•� �Continue�to�investigate�and�implement�more�parking�options�for�commuters�to alleviate over-crowded lots
•� �Continue�to�increase�capacity�on�the�Local�Bus�network�by�investing�in�articulated�coaches�–�currently�42�are�in�service�(6%�of�the�fleet)
•� �Implement�real-time�passenger�information�on�MTA’s�transit�services
•� �Continue�to�implement�additional�park�and�ride�options�for�Commuter�Bus�operations (in the FY2013–FY2018 Consolidated Transportation Plan (CTP), $24.4 million in funding is programmed to expand parking in Charlotte Hall, Dunkirk, New Market and Waldorf as part of the Southern Maryland Commuter Bus Initiative)
MtA: Average Weekday transit ridershipWeekday transit usage demonstrates progress toward better mobility for our customers and contributes to statewide goals.
av
er
ag
e w
ee
kd
aY
r
ide
rs
345,317
2008
300,000
200,000
100,000
0
400,000
500,000
2007
333,283
2006
320,419
2005
313,827
2004
316,204 359,711
2009
f i s C a l Y e a r
356,885
2010
372,118
20112003
336,567
2012
377,877
target: Increase of 56,000 riders by FY2012 (baseline year = 2006)

Goal:C
onnectivityforDailyLife
4 6
MtA: Annual revenue Vehicle Miles of service Provided* Revenue vehicle miles, or each mile for which a transit vehicle is in service and accepting customers, indicates the level of transit service available to, and in use by, the general public.
Why Did Performance change?�•� �Increased�availability�of�transit�service�on�
MARC by adding trains on the Penn Line and extending termini on some train lines
•� �Provided�an�efficient�alternative�to�driving�with Commuter Bus service enhancements, including adding Intercounty Connector (ICC) routes 201, 202, 203, 204 and 205
•� �Paratransit�&�Taxi�Access�mileage�experienced a large increase due to the increase in the number of trips provided
What Are future Performance strategies?•� �Increase�or�reallocate�service�miles,�where�
needed, to maximize transit availability
re
ve
nu
e M
ile
s (
Mill
ions
)
lo
Ca
l B
us
15.0
0.0
10.0
5.0
20.0
19.2
2003
19.8
2004
19.7
2005
19.6
2006
19.2
2007
19.4
2008
20.2
2009
25.0
20.1
2010
20.4
2011
2003 2004 2005 2006 2007 2008 2009
Ba
lt
iMo
re
M
et
ro
0.0
20.0
10.0 4.5 4.5 4.7 4.7 4.7 5.2 5.3
2010
4.5
2011
4.7
lig
ht
ra
il
0.0
20.0
10.0
2.8
2003
2.1
2004
1.5
2005
2.1
2006
2.8
2007
2.8
2008
2.8
2009
3.2
2010
3.2
2011
* Excludes Locally Operated Transit Systems (LOTS) and Washington Metropolitan Area Transit Administration (WMATA).
Pa
ra
tr
an
sit
& t
ax
i
aC
Ce
ss
f i s C a l Y e a r
4.5 4.27.5 9.1
10.6 10.9 11.7
0.0
20.0
10.0
2003 2004 2005 2006 2007 2008 2009
10.4
2010
9.6
2011
Ma
rC
4.8 4.9 4.9 5.0 5.0 5.1 5.2
0.0
20.0
10.0
2003 2004 2005 2006 2007 2008 2009
6.0
2010
6.6
2011
3.8 3.8 3.8 4.3 4.3 4.5 4.5
Co
nt
ra
Ct
ed
C
oM
Mu
te
r
Bu
s
0.0
20.0
10.0
2003 2004 2005 2006 2007 2008 2009
4.5
2010
4.5
2011
2012
2012
2012
13.7
2012
7.1
2012
2012
21.7
3.1
4.6
5.2

4 7
Goal:ConnectivityforDailyLife
Why Did Performance change?�•� �Invested�$19.8�million�in�FY2012�to�improve�sidewalks�and�to�
address�ADA�issues,�including�$6.5�million�to�support�the�new�Pedestrian Access to Transit Program
•� �Installed�more�than�731�accessible�pedestrian�signals�since�the�program�began�in�FY2006
•� �Continued�to�fund�and�manage�for�the�Maryland�Safe�Routes�to School (SRTS) program to provide a safer environment for walking or biking to over 290 schools
•� �Takoma�Park�SRTS�was�awarded�a�2012�James�L.�Oberstar�Safe Routes to School Honorable Mention Award
•� �SHA�provided�funding�for�a�partnership�between�Baltimore�City and Johns Hopkins School of Public Health to develop a pilot walking school bus program as part of a SRTS program
What Are future Performance strategies?�•� �Support�safe�pedestrian�access�along�State�highways�($10.0�
million�for�the�Sidewalk�Retrofit�Program�and�$61.6�million�for�the ADA Compliance Program in the FY2013–FY2018 CTP)
•� �Target�funds�towards�areas�in�which�there�is�a�history�of�high pedestrian injuries and fatalities, as well as a significant impediment to pedestrian access
•� �Construct�numerous�sidewalk�improvement�projects�in�FY2013,�including�MD�150�in�Essex,�MD�528�in�Ocean�City,�MD 373 in Berlin and MD 414 in Oxon Hill
•� �Continue�to�upgrade�intersections�with�pedestrian�countdown�signals and ADA features such as pedestrian curb ramps and median cut-throughs
sHA: Percentage of state-Owned roadway Directional Miles Within urban Areas that Have sidewalks and Percent of sidewalks that Meet Americans with Disabilities Act (ADA) complianceAvailable sidewalk facilities provide mobility for pedestrians. Tracking the percent that are ADA compliant helps ascertain whether Maryland’s sidewalk program meets federal benchmarks.
f i s C a l Y e a r
Pe
rC
en
t
30.0%
20.0%
10.0%
0.0%
40.0%
50.0%
60.0%
Percentage of sidewalks that meet ADA compliance
Percentage of State-owned roadway directional miles within urban areas that have sidewalks
52%
2007
54%
2008
target: Increase sidewalks and ADA compliance by 2% per year
32.0% 32.0%
56%
2009
28.0%
58%
2010*
20.0%
60%
2011*
20.5%
70.0%
* 2010-2012 data are based on a new data collection method that cannot be accurately compared to previous years’ data .
62%
2012*
21.0%
sHA: Percentage of state-Owned roadway centerline Miles with a Bicycle level of comfort (BlOc) grade “D” or Better and Directional Mileage of sHA-Owned Highways with Marked Bike lanes*BLOC (scale “A” to “F”) is a measure for assessing the quality of the statewide roadway system for its comfort and compatibility with bicycle users. It accounts for multiple characteristics of the roadway through a formula which produces a single BLOC grade for any section of roadway. Shoulder width is the most influential roadway characteristic for improving BLOC. Marked bike lanes are space on the roadway designated by pavement markings for the preferential or exclusive use of bicyclists. The amount of bike lanes in a jurisdiction is typically a good measure of the level of bike friendliness of that jurisdiction; however, their presence is not captured in the BLOC formula; thus, both must be taken into account when evaluating the quality of the bicycling environment.
Why Did Performance change?•� �Increased�the�directional�miles�of�bicycle�
facilities along existing SHA roadways by 9%
•� �Established�a�SHA�Bicycle�Design�Team�responsible for the development of bicycle-related projects at SHA
•� �Issued�a�new�policy�on�marked�bicycle�lanes that provides guidance on the marking and signing of bicycle facilities
•� �Improved�19�miles�of�roadway�from�a�BLOC grade “D” or worse to a BLOC grade “C” or better in FY2012; to gain a one percentage point increase in this measure,�about�46�miles�of�roadway�need to be improved from a BLOC grade “D” or worse to a BLOC grade “C” or better
What Are future Performance strategies?�•� �Revise�the�SHA�bicycle�guidelines�to�
reflect changes made under the new bicycle policy and provide better design guidance in developing bikeway facilities
•� �Support�bikeway�projects�along�State�highways�($9.6�million�for�the�Bicycle�Retrofit Program in the FY2013–FY2018 CTP)
•� �Adopt�new�bicycle�guidelines�that�provide improved guidance for the design of bicycle facilities, consistent with the newly issued 2012 bicycle guidelines from the American Association of State Highway and Transportation Officials (AASHTO)
•� �Implement�statewide,�multi-jurisdictional�bicycling routes to serve regionally significant points of interest, beginning with the Fort Meade to Columbia route
50
f i s C a l Y e a r
Pe
rC
en
t o
f C
en
te
rl
ine
Mil
es
aB
ov
e B
lo
C g
ra
de
“d
”
80.0%
70.0%
60.0%
50.0%
90.0%
100.0%
47.0
2007
47.0
2008
target: 2.0% increase in bike lanes per year
2009
n/a
2010
52.8
2011*
n/a
* FY2011 marked bike lane mileage is the revised baseline data. The BLOC measure has consistently shown 79-80% of facilities meeting a grade of “D” of better in previous years.
57.9
2012
Mil
es
of
Bik
e l
an
es
30
20
10
0
40
60
79.0% 79.0% 79.0% 79.0% 79.0%
BloC target: 80%.
Miles of bike lanesPercent of centerline miles above BLOC grade ‘D”
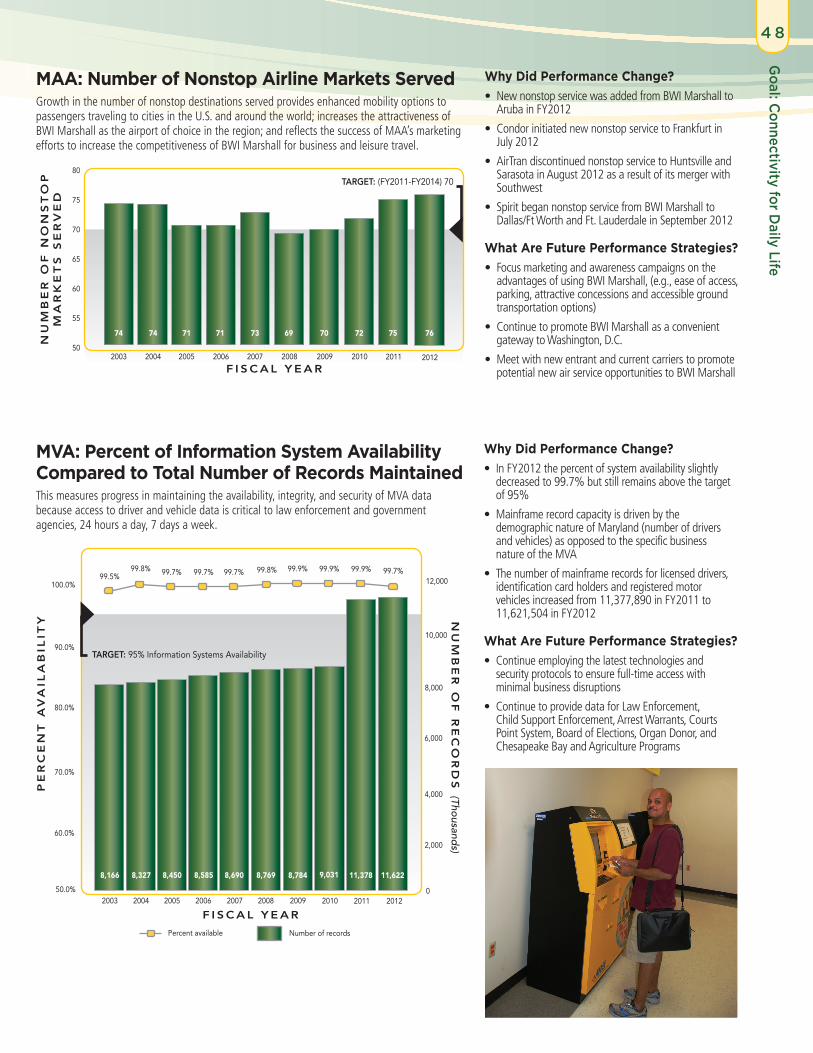
Goal:C
onnectivityforDailyLife
4 8
MAA: number of nonstop Airline Markets servedGrowth in the number of nonstop destinations served provides enhanced mobility options to passengers traveling to cities in the U.S. and around the world; increases the attractiveness of BWI Marshall as the airport of choice in the region; and reflects the success of MAA’s marketing efforts to increase the competitiveness of BWI Marshall for business and leisure travel.
Why Did Performance change?�•� �New�nonstop�service�was�added�from�BWI�Marshall�to�
Aruba in FY2012
•� �Condor�initiated�new�nonstop�service�to�Frankfurt�in�July 2012
•� �AirTran�discontinued�nonstop�service�to�Huntsville�and�Sarasota in August 2012 as a result of its merger with Southwest
•� �Spirit�began�nonstop�service�from�BWI�Marshall�to�Dallas/Ft Worth and Ft. Lauderdale in September 2012
What Are future Performance strategies?•� �Focus�marketing�and�awareness�campaigns�on�the�
advantages of using BWI Marshall, (e.g., ease of access, parking, attractive concessions and accessible ground transportation options)
•� �Continue�to�promote�BWI�Marshall�as�a�convenient�gateway to Washington, D.C.
•� �Meet�with�new�entrant�and�current�carriers�to�promote�potential new air service opportunities to BWI Marshall
f i s C a l Y e a r
nu
MB
er
of
re
Co
rd
s (Thousand
s)2,000
0
4,000
6,000
8,000
10,000
Pe
rC
en
t a
va
ila
Bil
itY
80.0%
70.0%
60.0%
50.0%
90.0%
100.0%
Number of recordsPercent available
8,166
2003
99.5%
8,327
2004
99.8%
8,450
2005
99.7%
8,585
2006
99.7%
8,690
2007
99.7%
8,769
2008
8,784
2009
99.8% 99.9%
9,031
2010
99.9%
target: 95% Information Systems Availability
11,378
2011
99.9%
12,000
f i s C a l Y e a r
nu
MB
er
of
no
ns
to
P
M
ar
ke
ts
se
rv
ed 75
65
55
50
80
74
2003
74
2004
71
2005
71
2006
73
2007
69
2008
70
2009
target: (FY2011-FY2014) 70
70
60
72
2010
75
2011
MVA: Percent of Information system Availability compared to total number of records MaintainedThis measures progress in maintaining the availability, integrity, and security of MVA data because access to driver and vehicle data is critical to law enforcement and government agencies, 24 hours a day, 7 days a week.
Why Did Performance change?�•� �In�FY2012�the�percent�of�system�availability�slightly�
decreased to 99.7% but still remains above the target of 95%
•� �Mainframe�record�capacity�is�driven�by�the�demographic nature of Maryland (number of drivers and vehicles) as opposed to the specific business nature of the MVA
•� �The�number�of�mainframe�records�for�licensed�drivers,�identification card holders and registered motor vehicles increased from 11,377,890 in FY2011 to 11,621,504�in�FY2012
What Are future Performance strategies?•� �Continue�employing�the�latest�technologies�and�
security protocols to ensure full-time access with minimal business disruptions
•� Continue�to�provide�data�for�Law�Enforcement,�Child�Support�Enforcement,�Arrest�Warrants,�Courts�Point�System,�Board�of�Elections,�Organ�Donor,�and�Chesapeake Bay and Agriculture Programs
76
2012
11,622
2012
99.7%

4 9
Goal:ConnectivityforDailyLife
Why Did Performance change?�•� �General�cargo�tonnage�at�MPA�terminals�has�recovered�from�the�global�
recession of 2009 and increased 7.4% in fiscal year 2012, to a total of 9.3 million tons – a new record high
•� �The�Port�of�Baltimore’s�public�marine�terminals�topped�previous�records�by handling a record 4.83 million tons of general cargo during the first six months of 2012
•� �The�MPA�terminals�experienced�the�greatest�gains�in�import�roll-on/roll-off�(RoRo) equipment and exported autos
•� Chrysler�exported�101,000�vehicles�through�the�Port�of�Baltimore����
•� �The�largest�RoRo�ship�in�the�world,�the�Wallenius-Wilhelmsen�Logistics�ship�Tonsberg, with 4.87 million cubic feet of available space cargo visited the Port of Baltimore
•� �RoRo�agricultural�equipment�is�in�demand�for�both�food�and�bio-fuel�production and RoRo mining equipment is in demand due to the increase in commodity prices
What Are future Performance strategies?•� �Continue�the�Quality�Cargo�Handling�Action�Team�(QCHAT)�to�make�
improvements for all parties
•� �Continue�with�rail�and�terminal�improvements�to�facilitate�Wallenius-Wilhelmsen Logistics expanding cargo at their Mid-Atlantic Terminal
•� �Continue�to�coordinate�roadway�permit�issues�with�the�City�of�Baltimore�to�facilitate cargo movement and positive community relations
•� �Meet�potential�Forest�Products’�future�covered�storage�requirements�by�conducting site stabilization at Dundalk Lot 500 for possible future private investment in shed construction
•� Construct�new�cargo�gate�for�South�Locust�Point
•� �Target�auto�and�machinery�manufacturers�to�provide�long-term�commitments�and encourage existing auto processors to increase cargo volumes, efficiency and throughputs (The FY2013–FY2018 CTP identifies $21.7 million to construct a new Masonville Vessel Berth to accommodate continued growth in automobile imports and exports)
MPA: Port of Baltimore foreign cargo & MPA general cargo tonnage*There are many factors outside MPA’s influence that impact the movement of freight, such as national and world economic trends, labor costs (in Maryland and at competing ports), value of the U.S. dollar, rail and highway service and rates, prolonged weather conditions and changes in vessel sizes. Tracking cargo trends supports MPA’s management decisions and helps to assess the economic impact of freight activity occurring at the Port of Baltimore and MPA terminals.
Y e a r
to
ns
(M
illi
on
s)
15.0
10.0
5.0
0.0
20.0
25.0
30.0
35.0
Port of Baltimore foreign cargo tonnage (CY)
MPA total general cargo tonnage (FY)
*MPA general cargo includes both foreign and domestic waterborne cargo.
** 2011 data point was revised from last the 2012 Report.
***2012 data for POB is an estimate.
target: Grow MPA general cargo by 3% per year since 2000
33.0
2008
9.124.7
2003
7.1 31.8
2004
7.4 32.4
2005
8.1 30.6
2006
8.2 30.8
2007
8.6
2009
7.822.4
2010
7.6
2011**
8.737.832.8
40.0
2012***
9.340.0
45.0

Goal:C
onnectivityforDailyLife
5 0
MPA: International cruises using the Port of BaltimoreMeasures cruise business activity departing from the Port of Baltimore to foreign destinations.
Why Did Performance change?�•� �Carnival�Cruise�Lines�and�Royal�Caribbean�International�reports�that�their�
ships are sailing at over 100% capacity (more than two people per cabin)
•� �505,000�cruise�passengers�embarked�and�debarked�from�the�Port�of�Baltimore’s Cruise Maryland Terminal on 105 cruises, breaking an all time record, and there were seven port-calls in CY2011
•� �Installed�a�new�flexible�temperature�controlled�boarding�bridge�that�will�accommodate a variety of vessel sizes
•� �Carnival�Cruise�Lines�and�Royal�Caribbean�International�continued�to�offer�year-round service from the Port of Baltimore
•� �In�addition�to�2012’s�100�home-port�cruises,�there�were�six�port-calls�by�other cruise ships
What Are future Performance strategies?•� �Continue�promoting�the�Port�as�a�convenient�location�for�year-round�
cruising
•� �Improve�the�year-round�comfort�and�convenience�of�cruise�line�passengers,�for example expand Wi-Fi capabilities, terminal system preservation projects and VIP customer facilities
•� Enhance�parking�options�by�providing�online�prepayment�options�
•� �Continue�the�partnership�with�existing�cruise�lines�and�develop�new�opportunities for additional cruise lines to come to Baltimore
•� �Make�water�and�landside�adjustments�as�necessary,�such�as�expanding�facilities to handle two cruise ships per day, to continue increasing the number of cruise ships and passengers using the Port
cAlenDAr yeAr 2003 2004 2005 2006 2007 2008 2009 2010 2011 2012*
Number of international cruises using MPA’s terminal
35 59 28 28 29 27 81 90 105 100
TARGET: 100 cruises in 2012, 98 cruises in 2013*Data is estimated for CY2012.
MDOT would like to offer special thanks and recognition for provision of photos:
Page 10, Jay Baker - Governor’s Office; Pages 11 and 50, Jeff Sauers; Page 14, Jessica Puchala - Maryland State Highway Administration; Pages�34�and�49,��Bill�McAllen;��Page�35�and�37,�Maryland�Environmental�Service.�

glOssAry terM DefInItIOn
Annual Attainment Report on Transportation System Performance
Pursuant to Transportation Article Section 2-103.1 of the Annotated Code of Maryland, the State is required to develop or update an annual performance report on the attainment of transportation goals and benchmarks in the Maryland Transportation Plan (MTP) & Consolidated Transportation Program (CTP). The Attainment Report must be presented annually to the Governor and General Assembly before they may consider the MTP and CTP.
Base Realignment and Closure (BRAC)
BRAC is a Congressionally authorized process the Department of Defense has previously used to reorganize its base structure to more efficiently and effectively support U.S. forces, increase operational readiness and facilitate new ways of doing business.
Calendar Year (CY) The period of 12 months beginning January 1 and ending December 31 of each reporting year.
Coordinated Highways Action Response Team (CHART)
CHART is an incident management system aimed at improving real-time travel conditions on Maryland’s highway system. CHART is a joint effort of the State Highway Administration, Maryland Transportation Authority, and the Maryland State Police, in cooperation with other Federal, State and local agencies.
Consolidated Transportation Program (CTP)
A six-year program of capital projects, which is updated annually to add new projects and reflect changes in financial commitments.
E-ZPass®An electronic toll collection system utilized to provide a more efficient flow of traffic through MDTA toll facilities. E-ZPass® toll collection is available at all eight MDTA toll facilities. The benefits of E-ZPass® membership allow travel from Virginia to Maine and as far west as Illinois, with tolls paid from a Maryland E-ZPass® account.
Fiscal Year (FY) A yearly accounting period covering the time frame between July 1 and June 30 of each reporting year.
Intercounty Connector (ICC)/MD 200 New all electronic toll-road between I-270 in Montgomery County to I-95 in Prince George’s County.
Locally Operated Transit Systems (LOTS)
Transit systems that provide primarily bus service and demand response within the local areas in which they operate. They are funded through a combination of Federal, State and local money. MDOT provides financial, technical and operating support for these services.
Maryland Transportation Plan (MTP)The MTP is MDOT’s long-range transportation policy plan and includes the vision, goals and objectives that provide the policy framework and context for Maryland’s transportation programs and investments. The MTP sets Department policy for the 20-year period and is updated every five years.
MPA General Cargo Foreign and domestic waterborne general cargo handled at the public (MPA) terminals.
Port of Baltimore Foreign CargoInternational (Foreign) cargo handled at public and private terminals within the Baltimore Port District. This includes bulk cargo (e.g., coal, sugar, petroleum, ore, etc. shipped in bulk) and all general cargo (e.g., miscellaneous goods shipped in various packaging).
MAP-21
On June 6, 2012, the President signed into law the Moving Ahead for Progress in the 21st Century (MAP-21) P.L. 112-141 - new legislation that will stabilize funding for highway and transit programs for two years and will set national, statewide and metropolitan transportation planning and policy direction. The Federal bill did not increase funding levels and also did not address the long-term solvency of the Federal Highway Trust Fund.
Mode Form of transportation used to move people or cargo (e.g., truck, rail, air).
REAL ID
The Federal REAL ID Act of 2005 sets new standards designed to improve the integrity and security of State-issued driver’s licenses and identification cards. The legislation contains 39 benchmarks for states to meet the requirements of the REAL ID Act. The full text of the REAL ID Act (including benchmarks) is available on the Department of Homeland Security’s website at www.dhs.gov. General information about Maryland’s involvement with the REAL ID Act is available on MVA’s website at www.marylandmva.com.
Smart Green & GrowingSmart Green & Growing is a long-range, statewide multi-agency initiative to help Maryland achieve a more sustainable future by linking community revitalization, transportation improvements, Smart Growth and environmental restoration efforts.
State Report on Transportation (SRT)The SRT is prepared annually and distributed to the General Assembly, local elected officials and interested citizens. It consists of two documents, the Maryland Transportation Plan (MTP) and the Consolidated Transportation Program (CTP).
Transit-Oriented Development (TOD)
TOD creates places around high-quality transit service that permit lifestyles and employment options where walking, bicycling and transit travel is convenient and safe. Designed for pedestrian comfort, mixes of uses, and higher densities are combined to create comfortable walking environments. Close proximity to the transit (bus or train) station and the quality of the TOD helps to promote use of transit and less reliance on the automobile.
Travel Demand Management (TDM)TDM strategies support the use of alternatives to the traditional single-occupant vehicle through a variety of programs and incentives (e.g., carpooling, car sharing, transit, park-and-ride facilities, teleworking and flexible work hours).
Vehicle Miles of Travel (VMT) A measurement of the total miles traveled by all vehicles.
5 1
Glossary

5 2
MtP gOAl PerfOrMAnce MeAsure DefInItIOn
Maryland Department of Transportation (MDOT)
Environmental Stewardship
Transportation Emissions Reduction Measures (TERMs)• Commuter Operations and Ridesharing Center• Employer Outreach (including Employer Outreach
for Bicycles)• Guaranteed Ride Home
TERMs and Travel Demand Management (TDM) strategies support the use of alternatives to the traditional single-occupant vehicle
Environmental Stewardship Transportation-related emissions by region
Tons of Volatile Organic Compound (VOCs) and Nitrogen Oxide (NOx), precursors of Ozone, emitted per day for an average weekday from transportation sources in the Baltimore and Washington regions
Environmental Stewardship Transportation-related greenhouse gas (GHG) emissions
GHG emissions primarily include carbon dioxide, methane, nitrous oxide, carbon monoxide, oxides of nitrogen and non-methane volatile organic compounds
Maryland Aviation Administration (MAA)
Quality of Service Percent of BWI Marshall customers rating the airport “good” or “excellent” on key services
Percent of customers giving a score of 4 or 5 (on a 5 point scale) for “Overall Satisfaction” and “How likely to fly from BWI Marshall on their next trip”
Safety & Security BWI Marshall crime rate Crimes include all crimes against persons or property at BWI Marshall facilities
Safety & SecurityNumber of repeat discrepancies in the annual Federal Aviation Administration’s Federal Aviation Regulation inspection
Annual FAA Part 139 Federal Aviation Regulation (FAR) assessment conducted by the Federal Aviation Administration
Safety & Security Rate of airfield ramp incidents and accidents per 1,000 operations
Incident reports collected by MAA / 1,000 operations (take offs and landings)
System Preservation & Performance Airline cost per enplaned passenger (CPE) Total airline-related fees / Total enplaned
passengers at BWI Marshall
System Preservation & Performance Non-airline revenue per enplaned passenger (RPE)
Total non-airline revenue (ground transportation, parking, concessions, etc.) / Total enplaned passengers at BWI Marshall
Connectivity for Daily Life Number of nonstop airline markets served Nonstop flights are direct to destination without connections
Maryland Port Administration (MPA)
Quality of Service Average truck turn-around time at Seagirt Marine TerminalAmount of time for a truck to enter the Terminal gate, drop off and/or receive a container, and exit the gate
Safety & Security MPA compliance with the Maritime Transportation Security Act of 2002
MPA activities in support of a compliance (Pass / Fail) rating from the U.S. Coast Guard
System Preservation & Performance
Adequate dredge material placement capacity remaining for Harbor and Bay maintenance and new work dredging
Monitors existing capacity remaining at Harbor and Bay dredged material placement sites
System Preservation & Performance Revenue versus operating expense Total revenues compared to operating expense of MPA, but excluding some exclusions
Environmental Stewardship Acres of wetlands or wildlife habitat created, restored, or improved since 2000
Cumulative tally of acreage created, restored, or improved for wildlife habitat
Connectivity for Daily Life International cruises using the Port of Baltimore Number of international cruises using the Port of Baltimore as a home port
Connectivity for Daily Life Port of Baltimore foreign cargo and MPA general cargo tonnage
MPA general cargo includes foreign and domestic waterborne cargo; Port of Baltimore foreign cargo includes bulk and general cargoes within the Port District, but does not include domestic cargo
Appendix:ListofPerformanceMeasures

5 3
Appendix:Listo
fPerform
anceMeasures
MtP gOAl PerfOrMAnce MeAsure DefInItIOn
Maryland Transit Administration (MTA)
Quality of Service Customer satisfaction ratingAverage score for: Overall satisfaction of each MTA service (Local Bus, Light Rail, Baltimore Metro and MARC)
Quality of Service Percent of service provided on time
Baltimore Metro and Marc: Number of trips arriving on schedule. Local Bus: Calculated from data-transmitting buses tracking the number of time points arrived at on time divided by the total number of scheduled time points
Safety & Security Customer perceptions of safety on the MTA systemAverage score for: Feeling safe while riding, while waiting at stops and stations, and for my vehicle left in an MTA parking lot
Safety & Security Preventable accidents per 100,000 vehicle milesPreventable accidents are accidents in which drivers did not do everything they could to avoid an accident / 100,000 vehicle miles
System Preservation & Performance Operating cost per passenger trip Total operating expenses / Number of
unlinked passenger trips
System Preservation & Performance Operating cost per revenue vehicle mile
Operating cost for each mode / Total miles when vehicle is in service (not deadheading or down time)
System Preservation & Performance Passengers per revenue vehicle mile Passenger trips by mode / Total revenue
miles by mode
Environmental StewardshipTravel Demand Management• Number of park-and-ride spaces—MTA Operated• Transit Multipurpose
Transit lots are MTA owned; multipurpose lots are not MTA owned
Environmental Stewardship
Transportation Emissions Reduction Measures • MTA College Pass• MTA Commuter Choice Maryland Pass• Transit Store in Baltimore
TERMs and Travel Demand Management strategies support the use of alternatives to the traditional single-occupant vehicle
Connectivity for Daily Life Annual revenue vehicle miles of MTA service providedRevenue vehicle miles are defined as each mile for which a transit vehicle is in service and accepting customers
Connectivity for Daily Life Average weekday transit ridershipRidership for Local Bus, Light Rail, Baltimore Metro, MARC, Contracted Commuter Bus, and Paratransit & Taxi Access
Maryland Transportation Authority (MDTA)
Quality of Service Overall customer satisfaction of E-ZPass® customers Customer satisfaction based on customer satisfaction survey
Quality of Service Percentage of tolls collected electronically Toll collections by E-ZPass® and Automatic Vehicle Identification / Total number of toll collections
Motor Vehicle Administration (MVA)
Quality of Service Branch office customer visit time versus customer satisfaction rating
Average visit time plotted against percentage of customers rating their MVA experience as “good” or “very good” (based on quarterly survey of customers)
Safety & Security Percent of Homeland Security REAL ID Act benchmarks achieved
Federal legislation contains 39 benchmarks for states to meet requirements of the Federal REAL ID Act
System Preservation & Performance
Alternative service delivery transactions as percent of total transactions
Transactions by alternative services (using a means other than a visit to an MVA branch) / Total transactions
System Preservation & Performance Cost per transaction Operating costs and capitalized costs /
Number of transactions

Appendix:ListofPerform
anceMeasures
5 4
MtP gOAl PerfOrMAnce MeAsure DefInItIOn
Motor Vehicle Administration (MVA)
Environmental StewardshipCompliance rate and number of vehicles tested for Vehicle Emissions Inspection Program (VEIP) versus customer wait time
Registered vehicles in non-attainment counties are scheduled for VEIP testing every two years. Compliance rate is the number of vehicles registered in non-attainment counties scheduled for testing / Number of registered vehicles in non-attainment counties tested
Connectivity for Daily Life Percent of information system availability compared to total number of records maintained
Includes availability of data records by type and systems up time
State Highway Administration (SHA)
Quality of Service Maryland driver satisfaction rating Satisfaction rating based on weighted average score for 26 questions
Quality of Service Percentage of the Maryland SHA network in overall preferred maintenance condition
Internal peer review assessment of roadway features of the total SHA lane-miles
System Preservation & Performance
User cost savings for the traveling public due to incident management
Cost saving calculated using Coordinated Highways Action Response Team (CHART) incident response data
Environmental Stewardship Acres of wetlands restored and miles of streams restored
SHA mitigation efforts for past impacts to wetlands and streams due to highway construction projects
Environmental Stewardship Total fuel usage of the SHA light fleet
Fuel used by fleet of State-owned cars, dispensed at SHA facilities that contains ethanol (SHA light fleet consists of sedans, SUVs, half-ton pickup trucks and vans that use gasoline or gasoline/ethanol blends)
Environmental Stewardship
Travel Demand Management• Number of SHA park-and-ride spaces• Reduction in vehicle miles traveled through park- and-ride usage
SHA operates a number of park-and-ride facilities to support TDM
Connectivity for Daily Life
Percentage of State-owned roadway directional miles within urban areas that have sidewalks and percent of sidewalks that meet American’s with Disabilities Act (ADA) compliance
On SHA roads where pedestrian access is allowed and within urban areas as defined by the U.S. Census Bureau
Connectivity for Daily Life
Percentage of State-owned roadway centerline miles with a bicycle level of comfort (BLOC) grade “D” or better and directional mileage of SHA-owned highways with marked bike lanes
BLOC is an A to F scale, a formula based on many factors, including outside lane width, the presence of on-street parking, roadway speed and shoulder width and truck percentage, with the greatest driving factors being shoulder width, speed and truck percentage.
MeASureS SHAreD by ADMiniSTrATiOnS
State Highway Administration (SHA) and Maryland Transportation Authority (MDTA)
System Preservation & Performance Percent of roadway miles with acceptable ride quality Percent of road with acceptable International
Roughness Index (IRI) score
System Preservation & Performance
Number of bridges and percent that are structurally deficient
Number of bridges where at least one major structural element has a condition rating of 4 or less (out of 10)
Connectivity for Daily Life Percent of freeway lane-miles and arterial lane-miles with average annual volumes at or above congested levels
Annual average daily traffic / Number of through lanes
State Highway Administration (SHA) and Motor Vehicle Administration (MVA)
Safety & Security Number of bicycle and pedestrian fatalities and injuries on all Maryland roads
Number of bicyclists and pedestrians killed / injured in traffic-related crashes in a calendar year
State Highway Administration (SHA), Motor Vehicle Administration (MVA) and Maryland Transportation Authority (MDTA)
Safety & Security Annual number of traffic fatalities and personal injuries on all roads in Maryland
The annual number of traffic fatalities and personal injuries on all Maryland roads including MDTA and locally owned facilities (the fatality and personal injury rate is calculated as fatalities and personal injuries per 100 million vehicle miles of travel)

This document is prepared pursuant to Transportation Article Section 2–103.1 of the Annotated Code of Maryland. Additional copies are available by
calling (410) 865-1277; Toll Free (888) 713-1414; or from the Internet at www.marylandtransportation.com.
This document is available in alternative formats upon request.
7201 Corporate Center DriveHanover, Maryland 21076
Martin O’Malley, GovernorAnthony G. Brown, Lt. Governor
Darrell B. Mobley, Acting Secretary