2013 annual report print
TRANSCRIPT

8/10/2019 2013 Annual Report Print
http://slidepdf.com/reader/full/2013-annual-report-print 1/32
2013ANNUAL REPORT
Focused on the Futurein partnership with the
community
DENVER POLICE DEPARTMENT

8/10/2019 2013 Annual Report Print
http://slidepdf.com/reader/full/2013-annual-report-print 2/322
MISSION
In partnership with the community, weendeavor to operate a police agencywith a focus on preventing crime in arespectful manner, demonstrating thateveryone matters
VISION
The Department, in partnership with thecommunity, will endeavor to achieve ourmission by:
• Focusing on the prevention ofcrime and safety
• Adopting a departmentalculture that is consistent withcommunity values
• Combining both efciency andeffectiveness, while leveragingtechnologies that enhance
policing operations
STRATEGIES
The Department, in partnership with tcommunity, will endeavor to achieve omission by:
• Aligning resources towardscrime prevention and safety
• Training and empoweringall employees to be leadersthrough action, accountabilityand community partnerships
• Implementing cost savings another efciencies, including
technology, with a focus onmaintaining/improving thedepartment’s effectiveness
DENVER QUICK FACTS
Population: 649,495 (US Census Bureau, 2013 estimate) Area: 154.9 square miles
Largest city and second most populous county in thestate of Colorado
Elevation is one mile above sea-level
23rd most populous city and the 18th largest metro economin the country (Greyhill Advisors, 2011)
Ranked 6th: Forbes’ List of Best Places for Business andCareers (2013)
17th best park system among the 50 most populous cities the US (Parkscore, 2013)
TABLE OF CONTENTS
3 Mayor’s Message
Executive Director of Safety’s Message
4 Chief’s Message
5 Executive Command Staff
6 Budget and Demographics9 Decentralization
10 Civilianization
12 Leadership and Command Structure
16 Awards
18 Patrol Districts
26 Crime Statistics
29 Fallen Ofcers
30 Denver Police Foundation
31 Credits

8/10/2019 2013 Annual Report Print
http://slidepdf.com/reader/full/2013-annual-report-print 3/32
2013 ANNUAL REPORT
Whether it’s breaking a bad habit, starting a healthy oneor adjusting your perspective, change takes commitmenthard-work and perseverance. It is not for the faint of heart
Perhaps that is why I am so proud of the Denver PoliceDepartment and its ofcers for the way they have performeduring the past two years, in the face of tremendouchange.
I understand it has been difcult at times. I also understandthe changes are moving the police department in thdirection it needs to go; a direction Chief White has takeother departments, elevating them from good departmentto great departments.
And make no mistake; the Denver Police Department ione of the best police departments in the country.
Whether it’s Denver’s state-of-the-art Crime Laboratorythe department’s success with large scale events, or itunprecedented use of social media for police-communitrelations; those who want to be the best look to Denver.
Thank you to every member of the Police Department fodoing your part to make Denver a city where everyonmatters. Your service and commitment to being the best itruly inspiring.
MESSAGE FROM THE MAYOR MESSAGE FROM THE EXECUTIVEDIRECTOR OF SAFETY
There is no greater mission for a mayor than to keepneighborhoods safe and vibrant. When I took ofce in 2011,I recognized there were parts of our community that feltdisconnected from the Denver Police Department. I knewthat repairing those relations and building trust betweenour community and the men and women who serve andprotect were key to our success.
Together with Chief Robert White, whom I appointed for hisproven track record of transforming police departments tobetter connect with the community and run more efciently,relations with the community have strengthened and thedepartment is working to prevent crime before it occurs byreforming, retraining and recalibrating.
Now, as a department-wide mission, ofcers create positiveinteractions with citizens and work closely with them tohelp prevent crime. Additionally, the department’s crimeprevention strategies have increased ofcer productivity,reduced violent crime and positively impacted calls forservice.
Thanks to funds made available through the community’soverwhelming support of 2A, more than 100 new ofcerswere hired in 2013 for the rst time in ve years, meaningmore ofcers patrolling Denver’s streets. We expect to addanother 100 ofcers to the force by the end of 2014.
Today’s Denver Police Department is innovative, efcient,and properly focused on crime prevention and communityrelations. I am extremely proud of the department’stransformation over the past few years, and I cannotexpress enough the profound gratitude we owe our ofcersfor selessly putting their lives on the line to keep us allsafe.
On behalf of the City and County of Denver, we thank youfor your service and God bless you.
Stephanie Y. O’MalleyEXECUTIVE DIRECTOR OF SAFETY
Michael B. HancockMAYOR OF DENVER

8/10/2019 2013 Annual Report Print
http://slidepdf.com/reader/full/2013-annual-report-print 4/324
Violent crime is down in Denver, and so are calls for police service. Add to that the two-fold increase in ofcer productivity, ayou can understand why I am so proud of the members of this police department.
From my rst days in Denver, I repeatedly said that the single most important factor in preventing crime is a patrol ofcer. Ialso said that to be effective, those patrol ofcers needed good supervision by supervisors who understood the reason for
change and believed they were the impetus for change. There is no doubt in my mind that the successes we are seeing incrime reduction and increased productivity are a result of the great work being done by patrol ofcers and the leadership oftheir supervisors.
That is not the end of the incredible police work being done in Denver. Our detectives are clearing cases at signicantly highpercentages then they were in 2009, 2010, and 2011. These clearance rates are much higher than the data driven predictimodel would expect. Add to this a world-class crime lab, a fantastic cadre of civilian employees, and high-quality supportservices from all over the police department and you can understand why we are so excited for the future of the Denver PolicDepartment.
The Denver Police Department continues to evolve into an agency that will be a model for all law enforcement. This would nobe possible without the commitment and dedication of our employees.
My future commitment is that we will not rest on our laurels. We will continue to look for ways to improve, innovate and seekout and develop the best practices for crime reduction to enhance the lives of the people we serve.
MESSAGE FROM THE CHIEFROBERT C. WHITE

8/10/2019 2013 Annual Report Print
http://slidepdf.com/reader/full/2013-annual-report-print 5/32
2013 ANNUAL REPORT
David Quiñones has been with theDenver Police Department since1986. In the past twenty-sevenyears he has had numerousassignments to include; thePatrol and Investigation Divisionsand Internal Affairs. He has
served as the Deputy Chief ofOperations since April 2012,when he was promoted fromdivision chief of the PatrolDivision. Deputy Chief Quiñonesbelieves in the importance
of sustaining the partnership between the police andcommunity, and continually builds on the relationshipswith Denver’s community groups and organizations. ChiefQuiñones manages the department’s operations divisionswhich include; six Patrol Districts, Major Crimes, InvestigativeSupport, Special Operations and Forensics and Evidence.
Mary Beth Klee has been withthe Denver Police Departmentsince 1983. In the course ofher career she has worked inmany different assignmentsthroughout the department. Shehas served as the Deputy Chief
of Administration since June2013, when she was promotedfrom commander of the InternalAffairs Division. As the DeputyChief of Administration, ChiefKlee manages the departmentdivisions with the primary responsibility to suppdepartment operations. These areas of responsibiinclude the following divisions; Internal Affairs, FinancServices, Planning, Research & Support, AdministratManagement, Operations Support and Airport Polic
DEPUTY CHIEF OF OPERATIONS DEPUTY CHIEF OF ADMINISTRATIO
DIVISION COMMAND STAFF
Commander Michael Battista
CONDUCT REVIEW
Commander Magen Dodge
OPERATIONS SUPPORT
Commander Lisa Fair
ADMINISTRATIVE MANAGEMENT
Commander Mark Fleecs
INVESTIGATIVE SUPPORT
Commander Patrick PhelanSPECIAL OPERATIONS
Commander Ronald SaunierMAJOR CRIMES
Captain John W. LambAIRPORT POLICE
Captain Sylvia T. SichPLANNING, RESEARCH & SUPPO
Lieutenant Ron ThomasINTERNAL AFFAIRS
Director Gregg LaBergeFORENSICS & EVIDENCE
Director Jeannie SpringerFINANCIAL SERVICES
Deputy Chief
David QuiñonesDeputy Chief
Mary Beth Klee

8/10/2019 2013 Annual Report Print
http://slidepdf.com/reader/full/2013-annual-report-print 6/326
Thanks to Denver voters, Measure 2A, which was passed in 2012,has allowed the Denver Police Department to purchase 46 newpatrol cars. With 30% of the eet past its useful life, this resultedin an operational cost savings due to the high maintenance costsassociated with an aging eet.
In addition, 2A allowed the department to hire a total of 110 policerecruits in 2013.
The Denver Police Department maintains two distinct budgets, one for operations and the second for administration. PoliceOperations, the larger of the two budgets, provides stafng and police services to the City and County of Denver. The Police
Administration budget provides management, resource allocation and strategic direction for the department.2012 Actual 2013 Actual
AGENCY SUMMARY $ $
Police Administration 36,215,698 28,768,964
Police Operations 155,684,533 157,829,598
Photo Trafc Enforcement 2,525,293 2,623,140
Police Recruits -- 2,759,263
TOTAL 194,425,524 191,980,965
*2012 Actual *2013 Actual
POLICE ADMINISTRATION POLICE ADMINISTRATION
Chief’s Staff 2,245,510 Chief of Police 2,332,432
Administrative Support 7,890,134 Financial Services Division 4,751,300
Research, Training and Technology 11,679,366 Administrative Management Division 8,757,170
Fleet Services 7,054,136 Fleet Maintenance Bureau 6,946,088
Public Affairs 440,283 Operations Support Division 784,025
Deputy Chief Administration 558,855 Deputy Chief Administration 528,395
Crime Lab 4,035,445 Planning, Research and Support Division 653,443
Internal Affairs 1,309,429 Internal Affairs Division 2,215,817
Training and Recruitment 1,002,540 Training and Recruitment Bureau 1,800,294
TOTAL 36,215,698 TOTAL 28,768,964
POLICE OPERATIONS POLICE OPERATIONS
Patrol/Districts 97,660,473 Patrol/Districts 91,046,506
Special Operations 16,089,869 Special Operations Division 18,032,954
Investigations 20,093,223 Major Crimes Division 12,629,603
Airport 14,730,986 Airport Police Division 13,493,235
Photo Enforcement 2,525,293 Photo Enforcement Bureau 2,623,140
Investigative Services 7,109,982 Investigative Support Division 12,928,337
TOTAL 158,209,826 Forensic and Evidence Division 9,698,963
Police Recruits 2,759,263
TOTAL 163,212,001
*Organizational changes taking place between 2012 and 2013 do not allow for continuity in reporting.

8/10/2019 2013 Annual Report Print
http://slidepdf.com/reader/full/2013-annual-report-print 7/32
2013 ANNUAL REPORT
LENGTH OF SERVICE OF SWORN PERSONNEL
1
107
<1 1-3 4-6 7-9 10-12 13-15 16-18 19-21 22-24 25-27 28-30 31+
87
325
91
204
154
106
136
82
6079
AGE OF SWORN PERSONNEL
13
<25 25-29 30-34 35-39 40-44 45-49 50-54 55-59 60+
59
166
208
327
275
212
137
35
THE IMPORTANCE OF DIVERSITY
Denver is a diverse community, and so is the Denver PoliceDepartment, as shown in the accompanying charts.
By participating in community outreach initiatives andrecruitment events throughout the city, the DenverPolice Department actively seeks to recruit and hire thebest qualied ofcers that represent the diversity of thecommunity which we serve.
SWORN PERSONNEL BY RAC
WHITE(66.5%)
HISPANIC(20.3%)
AFRICAN-AMER(9.8%)
ASIAN/PACIFIC ISLANDER(2.4%)
AMERICAN INDIA(1%)
TOTAL CHIEF DEP-C CMDR CAPT LT SGT DET CORP TECH PO1 PO2 PO3 PO4 RECRUIT
MALEAfrican-American 117 1 0 1 0 5 15 17 4 7 55 0 1 6 5Asian/Pacic Islander 30 0 0 0 0 1 1 6 4 2 11 1 1 1 2Hispanic 248 0 1 3 2 9 25 49 12 7 120 3 0 5 12American-Indian 11 0 0 0 0 0 0 2 0 1 8 0 0 0 0White 866 0 0 6 7 34 135 133 57 57 394 6 8 9 20TOTAL 1,272 1 1 10 9 49 176 207 77 74 588 10 10 21 39
FEMALEAfrican-American 23 0 0 1 1 0 3 8 0 2 7 0 0 0 1Asian/Pacic Islander 5 0 0 0 0 0 0 0 0 0 5 0 0 0 0Hispanic 42 0 0 0 0 0 4 10 1 1 22 0 0 2 2American-Indian 3 0 0 0 0 0 0 0 0 1 1 0 0 0 1White 87 0 1 1 4 5 12 15 5 5 34 2 0 2 1TOTAL 160 0 1 2 5 5 19 33 6 9 69 2 0 4 5
GENDER AND RACE OF SWORN PERSONNEL

8/10/2019 2013 Annual Report Print
http://slidepdf.com/reader/full/2013-annual-report-print 8/328
JUSTICEUse of authority to uphold what is right, just and lawful
EQUITYFair, impartial and equitable treatment of all people
INTEGRITYFaithful performance of our duties and always doing the right thing
for the right reason
HONESTYIncorruptible character and truthfulness
ACCOUNTABILITYDemonstrating responsibility in all activities
RESPECTTreating others as we would like to be treated
DIVERSITYEncouraging the participation of all people and the inclusion o
diverse points of view
TEAMWORKAchieving more through partnerships
INNOVATIONEncouraging creativity in the performance of our duties
CUSTOMER SERVICEExceeding our customers’ expectations
DENVER POLICE DEPARTMENT VALU

8/10/2019 2013 Annual Report Print
http://slidepdf.com/reader/full/2013-annual-report-print 9/32
2013 ANNUAL REPORT
CHANGE
In 2012, Chief Robert C. White identied several critical components to the success of the Denver Police Department. Theseincluded; the attening of the command structure, the selection of the department’s six district commanders, civilianization,and a realignment process which required ofcers throughout the department to reapply for their appointed positions.The message was clear, the Denver Police Department was going to go through a major organizational change and wouldreemerge as a department that would put more ofcers on the street and create a force that was more responsive to thecommunity. Although, the initial changes began in 2012, it was in 2013 that the successes of the department’s endeavors
were realized.
DECENTRALIZATION
In 2012, a study was initiated to increase the number of resources to patrol districts with the ultimate purpose of crimeprevention and safety. Accident cars and detectives tasked with conducting investigative follow-up for narcotic investigationsstreet robberies and assaults were redeployed to the district level. Prior to implementing a decentralized approach to policinstafng at the patrol districts was at 48% of the Department’s total authorized strength. Today, stafng in the patrol districtsstands at 65%.
By shifting police resources from a centralized location and reallocating them to a patrol district, greater decision-makingauthority is afforded to the district commanders. Working in collaboration with crime analysts to identify crime patterns andresponding to citizen’s safety concerns; district commanders can more effectively direct preventative patrol measures in ordeto improve quality of life issues, increase community safety and respond to emerging crime trends.

8/10/2019 2013 Annual Report Print
http://slidepdf.com/reader/full/2013-annual-report-print 10/3210
CIVILIANIZATION
In 2013, the Denver Police Department implemented the rst phase of transitioning sworn ofcers out of non-enforcementpositions, replacing them with civilians. Following the path of many other municipalities, the department analyzed the needfor uniformed ofcers in desk jobs, and how non-uniformed expertise could be used to free up trained ofcers to return toassignments that require “a gun and a badge”.
Determining which positions could be lled by specially trained civilians was based on the following criteria: • whether or not the position required the exercise of law enforcement powers
• were the skills, training, or experience of a sworn ofcer required to fulll the duties of the position • was it important to keep sworn staff in the position for other reasons
Based on the criteria, positions throughout the department were identied for civilianization. The Civil Liability Unit replaceddetectives with paralegals and the Property Management Bureau civilianized the Property and Evidence Technician positionsThe organizational change had the greatest impact in the department’s Crime Laboratory; transitioning approximately 14civilians into the Crime Scene Investigator (CSI) and Latent Print Examiner positions.
By increasing civilianization, the department is expected to see an added benet of an annual cost savings of approximately$617,000. But most importantly, it allows the Denver Police Department to increase its uniformed ofcer presencethroughout the city and continue to ensure the safety of its residents.

8/10/2019 2013 Annual Report Print
http://slidepdf.com/reader/full/2013-annual-report-print 11/32
2013 ANNUAL REPORT 1
RIGHT-SIZED APPOINTED POSITIONS (REALIGNMENT)
Beginning in April of 2012, all appointed positions for the ranks of detective, corporal and technician were revaluated andthe ofcers previously assigned to those positions were required to reapply. As part of the initial assessment, the duties andresponsibilities of the positions were claried to more closely align with the specic rank and job function. In order to facilitasuch a huge undertaking, open interviews were conducted with the affected command staff for each particular position toidentify and match the most qualied ofcer with the appointment. This process effectively allowed many ofcers who hadbeen waiting in the wings to come forward and identify their individual talents and demonstrate their leadership skills.
After nearly 2,000 interviews, command staff selected their compliment of ofcers to ll the appointed positions under their
authority. In total, 47% of technicians, 52% of corporals and 79% of detectives were retained. Identifying the appropriateaptitude within the department not only increased the personal motivation of the employee, but also resulted in a higher leveof production in service.

8/10/2019 2013 Annual Report Print
http://slidepdf.com/reader/full/2013-annual-report-print 12/3212
LEADERSHIP IN POLICE ORGANIZATIONSSM PROGRAM (LPOSM)
Leadership in Police OrganizationsSM (LPOSM) is a series of Peace Ofcer Standards and Training (POST) certied courses,
modeled after a similar program by the U.S. Military Academy at West Point. Denver’s program is funded through the ColoraAssociation of Chiefs of Police (CACP), and with a grant from POST. The program is designed to reinforce the idea that “everyofcer is a leader” and, as such, leadership training should not be limited to those in leadership positions. Students arementored by senior instructors and engage in workshops and classroom instruction intended to teach people how to leadgroups and organizations. The classroom experience is punctuated by lecture, role-playing and discussion exercises, smallgroup interactions, journaling, and examination of case studies. Courses include such topics as leadership theory, practicalapplication of principles, process improvement, socialization, group interaction and cohesion, and conict management.
The Denver Police Department has been actively involved in LPOSM since 2009; however, signicantly more classes wereoffered, and taken, in 2013 than in any prior year. As a result, over 250 ofcers of different ranks have beneted from theinstruction. Moving forward, the Department hopes to continue integrating LPOSM into ofcer training, in a continued effort tomake leaders of every ofcer on the force.

8/10/2019 2013 Annual Report Print
http://slidepdf.com/reader/full/2013-annual-report-print 13/32
2013 ANNUAL REPORT 1
FLATTENING OF THE COMMAND STRUCTURE / SELECTION PROCESS
The attening of any command structure addresses several major objectives: it increases the autonomy, individual authorityand personal accountability of the remaining positions. The attening of the command structure within the Denver PoliceDepartment meant that the rank of division chief would be eliminated altogether and the rank of commander would beexpanded. Under this new command structure, commanders manage their resources, identify the problems in their area ofresponsibility and are held accountable in their effectiveness in addressing those issues.
In order to ensure the best candidates were identied, input was sought from the Denver community in order to identify thesix district commanders. Community input was deemed a necessary requirement due to the level of involvement the district
commanders must have with Denver’s neighborhoods, along with understanding the importance of making the connectionsbetween ofcers and the community.
NEW DIVISION: PLANNING, RESEARCH AND SUPPORT DIVISION
In January 2013, the Planning, Research and Support Division went into operation. The division is comprised of civilian andsworn staff, providing direct support to the Chief of Police and senior staff.
Among its numerous responsibilities the division is tasked with providing research and analytical services to supportinnovative policing operations and public safety practices, provide research assistance to operational and administrativecomponents of the department concerning a wide range of criminal justice and management issues, feasibility studies,
project/program evaluations, and the drafting and maintenance of agency-level policy and procedural manuals.One of the primary projects handled in 2013 was the development of a new Performance Evaluation System for sworn ofceThe development of the project included input from the department’s senior staff, as well as researching the evaluationsystems of other law enforcement agencies. The project resulted in an evaluation system customized to each individualofcer’s assignment and responsibilities, connecting the department’s overall strategic plan to the specic strategic plan ineach division. The Performance Evaluation System went into effect January 1, 2014.
Other signicant projects included the research supporting the civilianization of Crime Scene Investigators (CSI) andresearching Civilian Report Technician (CRT) programs across the nation. The rst CRTs were hired in 2014, and the programis fully operational. In 2013, the Denver Police Department hired its rst academy recruit class since 2008. The PlanningDivision ensured the accuracy of, and updated the Operations Manual for the academy curriculum. One of the major projectunderway is the rewrite/update of the department’s Operations Manual; an on-going project through mid 2015.
As the Denver Police Department moves toward the future, the Planning, Research & Support Division will continue tohave a signicant role in supporting the department’s efforts, mission and goals as a leading law enforcement agency, andpartnership with the communities of Denver.

8/10/2019 2013 Annual Report Print
http://slidepdf.com/reader/full/2013-annual-report-print 14/3214
UNIFIED SUMMONS AND COMPLAINT (US&C)
In 2009, the City of Denver invested in an infrastructure that streamlines the electronic ow of information between citycriminal justice systems, including the City Attorney’s Ofce, the District Attorney’s Ofce, the Denver Sheriff Department, thecourts, and the Denver Police Department. Over the course of the subsequent three years, these agencies worked togetherto create an electronic workow for the exchange of information related to criminal justice records and this infrastructure hasbecome to be known as the Unied Summons and Complaint (US&C) system.
The US&C system was designed to automate and streamline the submission and maintenance of arrestee criminal justicerecords initiated by Denver police ofcers. The US&C effectively consolidates nine different paper forms and has integrated
ve criminal justice systems throughout the city. The US&C consolidated nine different reports, integrating ve criminal justicsystems throughout the city. Establishing the electronic workow lessened the chance of error by eliminating repeated manuentry, potential for lost lings and the associated delays.
At the completion of a pilot program taking place in District 2 in late 2012, results showed that efciency was improved anddata integrity was maintained. To date, approximately 900 street ofcers have been trained in the US&C system which hasreduced the paper footprint generated by the department, increased the efciency of accurately reporting arrest and crimedata information, and allows the department to provide real time information to its criminal justice system partners throughothe city.

8/10/2019 2013 Annual Report Print
http://slidepdf.com/reader/full/2013-annual-report-print 15/32
2013 ANNUAL REPORT 1
LEADSONLINE: The Nation’s Largest Online Investigation System
LeadsOnline is an online technology service helping law enforcement catch criminals, while helping businesses reduce the
hassles of reporting. When property is purchased at pawnshops or at a second-hand retail location throughout Denver, lawrequires that the operator maintain an accurate record of every transaction. Information documented for every transactionincludes the property serial number, ownership of the property and can also include the owner’s ngerprint. Prior toLeadsOnline, the Denver Police Department’s Property Recovery Unit would conduct periodic checks to verify and ensurecompliance.
LeadsOnline streamlines the record keeping process by allowing the pawnshop/second-hand operator to send the transactioinformation to local law enforcement electronically where at that point the serial numbers are compared against criminal
justice records in order to solve crimes. Information contained within LeadsOnline is available to all law enforcementparticipants nationwide. The Denver Police Department’s Property Recovery Unit recovered $69,695 in property fromLeadsOnline hits alone in the rst quarter of 2013. Currently, ve of the eleven Denver pawnshops participate in LeadsOnlinand the goal is to get all pawnshops within Denver to register with and use LeadsOnline.

8/10/2019 2013 Annual Report Print
http://slidepdf.com/reader/full/2013-annual-report-print 16/3216
MEDAL OF HONORAwarded to an individual for an act of outstanding bravery or heroism by which the individual has demonstrated in
great degree the characteristics of selessness, personal courage, and devotion to duty at the risk of their own life. The individuals actions substantially contributed to the saving of, or attempted saving of a human life.
Ofcer Paul Lopez 77052
Ofcer Daniel Lucero 75021
MEDAL OF VALORAwarded to an individual for an act, in the face of great danger, wherein valor, courage, and bravery are
demonstrated over and above that normally demanded and expected.
Sergeant Virginia Quinones 89015
DISTINGUISHED SERVICE CROSSAwarded to an individual for an act of gallantry. The heroic act(s) performed must render the individual conspicuous
and well above the standard expected.
Lieutenant John MacDonald 86064
Sergeant Doug Brandl 80045
Sergeant Grady Carter 94011
Sergeant Steve Gonzales 95050
Sergeant Randy Penn 79061
Detective Daniel Diaz de Leon 04105
Detective Corey Fifer 04113
Detective Anthony Guzman 06124
Detective John Robledo 05122
Detective Rick Romero 89032
Corporal Kevin Dreyfuss 99033
Corporal Doug Grove 06013
Corporal Mark Moore 92037
Technician Jonas Apala 07027
Technician Joshua Bollwahn 00015
Technician Derick Dominguez 91001
Technician Jesse Rembert 05026
Technician Jeff Sanger 99021
Technician Jason Simmons 04038
Technician Jake Stevenson 01016
Ofcer Gerald Abraham 01030
Ofcer Jeremy Casias 99026
Ofcer Adam Golden 06157
Ofcer Denise Gomez 07021
Ofcer Richard Harvey 06069
Ofcer Paul Johnson 05128
Ofcer Tevonnon Jones 08061
Ofcer Randy Krouse 99059
Ofcer Rudy Manzanares 04077
Ofcer Jay Otey 00046
Ofcer Danny Perez 95032
Ofcer Michael Pineda 04096
Ofcer Jon Rajala 04097
Ofcer Ernest Sandoval 06154
Ofcer Robert Warren 04063
Ofcer Randy Yoder 91034
OFFICER AWARDS AND COMMENDATIONS

8/10/2019 2013 Annual Report Print
http://slidepdf.com/reader/full/2013-annual-report-print 17/32
2013 ANNUAL REPORT 1
The 2013 Annual Report is dedicated to the ofcers of the Denver Police Department for theirrelentless pursuit of justice, commitment to crime prevention and focus on safety. Below are theofcers that have received an award for their outstanding performance in 2013, however it is the
cohesiveness and dedicated service that each and every ofcer provides on a daily basis that trumakes a difference. Strength comes out of unity.
PURPLE HEART AWARDAwarded to an individual who is killed, seriously wounded, or seriously injured in the performance of an ofcial action.
Ofcer Patrick Bouhana 01048
Ofcer Steven Castro 01017
Ofcer Celena Hollis 05162
LIFE SAVING AWARDAwarded to an individual who, through exceptional knowledge and behavior, performs a physical act which saves the life of
another person and there is no danger to the individual’s life.
Lieutenant Dikran Kushdilian 95019
Detective Alfonso Cervera 96008
Corporal Del Creason 92013Technician Virgil Wheaton 88043
Ofcer Wade Davis 00069
Ofcer Heather Jossi 07059
Ofcer Jacek Polanowski 06026
CITIZENS APPRECIATE POLICEAwarded to an individual who distinguish themselves by performing a service which signicantly displays an interest in the
citizens we serve, in a manner which is beyond the call of duty and shows a real concern for the welfare and well-being of hisher fellow citizen. Recipients of this award are selected by community members.
Corporal Mark Hart 04032
Corporal Tim Scudder 98022
Ofcer Daniel McIntosh 01077
Ofcer Adriel Torres 00119
COMMUNITY SERVICE AWARDAwarded to an individual who, by virtue of sacrice and expense of his or her time, fosters or contributes to a valuable and
successful program in the area of community affairs, or who acts to substantially improve police/community relations througcontribution of time and effort when not involved in an ofcial capacity.
Sergeant Kimberley Lovato 98037
Sergeant Robert Wyckoff 94013
Corporal Joe Duncan 95092
Corporal Ryan Koenigsfeld 04107
Corporal Mary Prestel 99040
Corporal Glenn Riggs 05019
Corporal Ray Sheridan 01044
Ofcer Scott Brackett 05085
Ofcer Michelle Cooper 04115
Ofcer Jody Douglas 08019
Ofcer Susan Gann 90024
Ofcer Rick Harvey 06069
Ofcer Kevin Jackson 91072
Ofcer Chris Johnson 05154
Ofcer Aaron Kafer 05002
Ofcer Jason Lawrenson 07004
Ofcer Marika Putnam 00029
Ofcer Steve Rieck 06132
Ofcer Hanna Ruiz 03024
Ofcer Gordon Seib 05018
Ofcer Gerald Sloan 07078
Ofcer Kevin Ujcich 06012
OFFICIAL COMMENDATIONAwarded to an individual who, by exemplary conduct and demeanor, performs at a superior level of duty, exhibiting
perseverance with actions resulting in a signicant contribution to the department and/or improvement to the quality of life the community. Or, an individual who supervised or managed a tactical situation of an active, evolving incident as the
on-scene commander.
190 ofcers received an Ofcial Commendation in 2013

8/10/2019 2013 Annual Report Print
http://slidepdf.com/reader/full/2013-annual-report-print 18/3218
PATROL DISTRICTS
The Denver Police Department geographically divides the city into six decentralized district commands. Each district iscomprised of patrol and investigative personnel that report to a single stand-alone station within each district, and are taskedwith round-the-clock police coverage
In 2013, the Denver Police Department ofcially changed the boundaries for all six patrol districts in order to address
population changes, crime trends and to better serve the community by increasing department efciency. The redesigneddistricts were developed based on an analysis of calls for service while maintaining neighborhood integrity.
REDISTRICTIN
DISTRICT
1
DISTRICT
6
DISTRICT
2
DISTRICT
3
DISTRICT
4
DISTRICT
5
6th Ave
23rd Ave
P l a t t e
R i v e
r
S p
e
e r B l v d
P l a t t e
R i v e
r
Q u e b e c S t
6th Ave
56th Ave
52nd Ave
S h e r i d a n B l v d
Belleview
Ave
Yale Ave
Y o r k
S t

8/10/2019 2013 Annual Report Print
http://slidepdf.com/reader/full/2013-annual-report-print 19/32
2013 ANNUAL REPORT 1

8/10/2019 2013 Annual Report Print
http://slidepdf.com/reader/full/2013-annual-report-print 20/3220
DISTRICTONE
Commander Paul Pazen
DISTRICT 1 POLICE1311 WEST 46TH AVE
NORTHWEST DENVER
2013 Neighborhood Crime Rates (per 1,000 persons)
SUNNYSIDE
38th Ave
S h e r i d a n B l v d
F e d e r a l B l v d
I n c a S t
I-70
17th Ave
Colfax Ave
6th Ave
CHAFFEE PARKREGIS
GLOBEVILLE
BERKELEY
HIGHLAND
WEST COLFAX
WEST HIGHLAND
SLOAN LAKE
VILLA PARK
JEFFERSON
PARK
AURARIA
SUN
VALLEY
LINCOLN PARK
Dry Gulch
19th Ave
S p e e r B l v d
H
a r l a n
S t
52nd Ave
29th Ave
P l a
t t e R i v e
r
Neighborhood Population+ Total Crime Homicide Sexual Assault Robbery Aggr. Assault Burglary Larceny* TFMV** Auto Theft Arson
Auraria 705 390 0 1 4 8 10 200 44 7 0Berkeley 8,112 559 0 2 14 29 92 76 116 62 1Chaffee Park 3,874 297 0 0 4 10 54 38 28 28 0Globeville 3,687 447 3 4 5 24 51 57 63 39 3Highland 8,429 774 0 2 13 26 91 150 112 77 5Jefferson Park 2,552 418 2 2 5 20 41 87 48 32 0Lincoln Park 6,119 1,299 1 8 20 57 65 234 112 87 0Regis 3,934 280 0 0 4 13 34 29 57 30 0Sloan Lake 7,238 526 0 4 10 17 84 61 96 49 0Sun Valley 1,448 426 1 4 11 46 10 53 27 14 0Sunnyside 9,726 800 2 10 21 58 71 71 79 104 1Villa Park 8,758 648 0 6 14 46 95 47 84 68 5West Colfax 9,740 884 1 12 34 52 66 104 76 58 1West Highland 8,540 532 0 4 12 11 75 98 98 75 3
DISTRICT TOTALS 8,280 10 59 171 417 839 1,305 1,040 730 19
+ 2010 Census Data downloaded from the Piton Foundation
* Includes both petty and grand larceny, however excludes theft from motor vehicle
** Theft from Motor Vehicle
This data is based on the Uniform Crime Reporting standards. All les utilized in the creation of this report are dynamic. Dynamic les allow additions, deletions and/or modications at any time, resulting in more complete and
accurate records in the databases. Due to continuous data entry after reports are compiled, numbers may vary in previous or subsequent reports. Data downloaded 01/06/14.
PREPARED TO DEPARTMENT OF SAFETY PUBLIC INFORMATION STANDARDS

8/10/2019 2013 Annual Report Print
http://slidepdf.com/reader/full/2013-annual-report-print 21/32
2013 ANNUAL REPORT 2
DISTRICTTWO
Commander Michael Calo
DISTRICT 2 POLICE3921 HOLLY STREET
NORTHEAST DENVER
2013 Neighborhood Crime Rates (per 1,000 persons)
CONGRESS
PARK
NORTH
PARK HILL
NORTHEAST
PARK HILL
SOUTH
PARK HILL
HALE MONTCLAIR
EAST
COLFAX
ELYRIA
SWANSEA
CLAYTON
SKYLAND
CITY PARK
FIVE
POINTS
WHITTIER
COLE
6th Ave
Colfax Ave
23rd Ave
48th Ave
Martin Luther King Blvd
40th Ave
52nd Ave
54th Ave
12th Ave
Y o r k S t
C o l o r a d o B l v d
H o l l y S t
D o w n i n g S t
P l a t t e
R i v e
r
Q u e b e
c S t
Neighborhood Population+ Total Crime Homicide Sexual Assault Robbery Aggr. Assault Burglary Larceny* TFMV** Auto Theft Arson
City Park 2,907 256 0 5 2 4 9 61 33 14 0Clayton 4,337 365 0 3 8 19 23 33 41 19 2Cole 4,651 595 0 3 9 42 40 44 25 30 1Congress Park 10,235 620 0 2 7 14 86 112 127 47 2East Colfax 10,191 1,299 5 12 55 80 142 106 67 69 6Elyria Swansea 6,401 600 0 2 14 45 76 66 78 58 4Five Points 12,710 1,022 0 8 31 52 76 113 166 50 0Hale 6,936 367 1 3 18 5 48 55 72 18 1Montclair 5,456 363 0 1 19 12 70 98 38 16 0North Park Hill 9,382 417 0 2 11 28 79 43 56 28 2Northeast Park Hill 7,821 739 2 8 15 69 70 71 97 64 1Skyland 3,106 196 1 1 5 14 29 21 24 13 1South Park Hill 8,590 413 0 6 15 13 79 57 61 27 1Whittier 4,831 438 0 4 8 35 66 54 27 25 1
DISTRICT TOTALS 7,690 9 60 217 432 893 934 912 478 22
+ 2010 Census Data downloaded from the Piton Foundation
* Includes both petty and grand larceny, however excludes theft from motor vehicle
** Theft from Motor Vehicle
This data is based on the Uniform Crime Reporting standards. All les utilized in the creation of this report are dynamic. Dynamic les allow additions, deletions and/or modications at any time, resulting in more complete and
accurate records in the databases. Due to continuous data entry after reports are compiled, numbers may vary in previous or subsequent reports. Data downloaded 01/06/14.
PREPARED TO DEPARTMENT OF SAFETY PUBLIC INFORMATION STANDARDS

8/10/2019 2013 Annual Report Print
http://slidepdf.com/reader/full/2013-annual-report-print 22/3222
Neighborhood Population+ Total Crime Homicide Sexual Assault Robbery Aggr. Assault Burglary Larceny* TFMV** Auto Theft Arson
Baker 4,879 1,095 1 4 17 29 76 381 135 67 0Belcaro 4,172 197 0 0 6 8 32 63 35 8 0Cherry Creek 5,589 533 0 0 8 7 63 236 75 17 2Cory - Merrill 3,892 240 0 0 0 3 34 78 40 13 0Country Club 3,001 121 0 0 1 0 32 18 39 8 0Goldsmith 5,808 353 0 3 6 20 40 56 36 36 2Hampden 17,547 753 0 5 18 40 115 104 120 73 2Hampden South 14,370 485 0 2 5 10 62 93 102 43 0Hilltop 8,190 245 0 0 1 9 33 35 61 17 0Indian Creek 3,096 95 0 1 2 1 9 9 24 11 0Kennedy 4,464 182 0 3 3 17 35 27 18 16 1Lowry Field 8,000 438 0 1 4 6 78 100 75 22 2Overland 2,218 425 0 6 7 22 55 66 51 26 6Platt Park 5,393 462 0 2 7 8 96 54 118 20 3Rosedale 2,553 148 0 1 5 2 28 15 32 11 0Southmoor Park 3,826 176 0 1 5 3 28 42 21 11 0Speer 10,954 815 0 7 12 13 89 151 153 73 0
University 9,375 476 0 3 4 11 84 109 85 27 1University Hills 5,327 404 1 5 3 13 54 109 53 22 1University Park 7,491 305 0 4 8 5 47 57 73 17 0Virginia Village 12,453 566 0 2 11 19 60 102 92 53 3Wash. Park 6,905 308 0 1 1 4 56 41 98 13 1Wash. Park West 6,393 466 0 0 3 7 90 64 129 38 0Wash. Virginia Vale 13,421 631 0 7 20 26 74 133 105 41 1Wellshire 3,133 74 0 0 0 1 12 18 20 5 0Windsor 12,656 424 1 3 3 25 84 58 52 34 0
DISTRICT TOTALS 10,417 3 61 160 309 1,466 2,219 1,842 722 25
+ 2010 Census Data downloaded from the Piton Foundation * Includes both petty and grand larceny, however excludes theft from motor vehicle ** Theft from Motor Vehicle
This data is based on the Uniform Crime Reporting standards. All les utilized in the creation of this report are dynamic. Dynamic les allow additions, deletions and/or modications at any time, resulting in more complete and
accurate records in the databases. Due to continuous data entry after reports are compiled, numbers may vary in previous or subsequent reports. Data downloaded 01/06/14.
PREPARED TO DEPARTMENT OF SAFETY PUBLIC INFORMATION STANDARDS
DISTRICTTHREE
Commander Joseph Montoya
DISTRICT 3 POLICE1625 SOUTH UNIVERSITY BOULEVARD
SOUTHEAST DENVER
2013 Neighborhood Crime Rates (per 1,000 persons)
LOWRY FIELDHILLTOP
WINDSORWASH.
VIRGINIA
VALE
CHERRY
CREEK
BELCARO
CORY-
MERRILL VIRGINIA
VILLAGE
UNIV.
PARKGOLDSMITH
HAMPDEN KENNEDY
HAMPDEN
SOUTH
SOUTHMOOR
PARK
WELLSHIRE
UNIVERSITY
COUNTRY
CLUBSPEER
WASH.
PARK
WEST
ROSEDALE
BAKER
OVERLANDINDIAN
CREEK
WASH.
PARK
UNIV. HILLS
PLATT
PARK
Alameda Ave
6th Ave
11th Ave
8th Ave
C h e r
r y
Evans Ave
7th Ave
C r e e k
Mississippi Ave
Hampden Ave
Belleview Ave
H a v a n a S t
M o n a c o P k w y
U n i v e r s i t y B l v d
B r o a d w a y S
t
D o w n i n g S t
P l a t t e R
i v e r
Yale Ave
Q u e b e c S t
Y o s e m i t e S t
I - 2 5
C o l o r a d o B l v d

8/10/2019 2013 Annual Report Print
http://slidepdf.com/reader/full/2013-annual-report-print 23/32
2013 ANNUAL REPORT 2
Neighborhood Population+ Total Crime Homicide Sexual Assault Robbery Aggr. Assault Burglary Larceny* TFMV** Auto Theft Arson
Athmar Park 8,898 854 2 6 16 61 84 84 142 92 1Barnum 6,111 555 1 5 19 40 73 33 49 63 0Barnum West 5,376 305 0 2 8 15 37 15 34 43 1Bear Valley 8,889 383 0 2 3 16 41 41 60 38 1College View-S Platte 6,498 503 0 3 9 56 52 84 56 36 1Fort Logan 8,532 221 0 1 2 9 24 30 47 25 0Harvey Park 11,525 556 1 4 9 35 51 68 103 55 0Harvey Park South 8,393 497 0 3 8 15 32 125 82 51 0Mar Lee 12,452 767 1 8 19 54 113 86 79 78 3Marston 11,132 319 0 1 5 9 29 84 54 29 1Ruby Hill 9,820 627 3 7 6 50 78 48 68 61 1Valverde 3,941 406 0 3 15 28 49 46 41 50 1Westwood 15,486 1,295 0 11 31 126 153 83 126 155 4
DISTRICT TOTALS 7,288 8 56 150 514 816 827 941 776 14
+ 2010 Census Data downloaded from the Piton Foundation
* Includes both petty and grand larceny, however excludes theft from motor vehicle** Theft from Motor Vehicle
This data is based on the Uniform Crime Reporting standards. All les utilized in the creation of this report are dynamic. Dynamic les allow additions, deletions and/or modications at any time, resulting in more complete and
accurate records in the databases. Due to continuous data entry after reports are compiled, numbers may vary in previous or subsequent reports. Data downloaded 01/06/14.
PREPARED TO DEPARTMENT OF SAFETY PUBLIC INFORMATION STANDARDS
DISTRICTFOUR
Commander William Nagle
DISTRICT 4 POLICE2100 SOUTH CLAY STREET
SOUTHWEST DENVER
2013 Neighborhood Crime Rates (per 1,000 persons)
VALVERDE
WESTWOOD ATHMARPARK
MAR LEE
HARVEY
PARK
BEAR
VALLEY
HARVEY
PARK
SOUTH
FORTLOGAN
MARSTON
RUBY
HILL
BARNUM
BARNUM
WEST
COLLEGE VIEW
SOUTH
PLATTE
Alameda Ave
Jewell Ave
Mississippi Ave
Yale Ave
Hampden
Ave
Quincy Ave
6th Ave
Stanford Ave
Belleview Ave
Union Ave
P l a t t e R
i v e r
Z u n i S t
F e d e r a l B l v d
S h e r i d a n B l v d
K i p l i n g
S t

8/10/2019 2013 Annual Report Print
http://slidepdf.com/reader/full/2013-annual-report-print 24/3224
DISTRICTFIVE
Commander Les Perry
DISTRICT 5 POLICE4685 PEORIA STREET
NORTHEAST DENVER / DIA
2013 Neighborhood Crime Rates (per 1,000 persons)
Neighborhood Population+ Total Crime Homicide Sexual Assault Robbery Aggr. Assault Burglary Larceny* TFMV** Auto Theft Arson
DIA 1,165 127 0 0 0 3 9 17 51 13 0Gateway-G.V.R. 29,201 1,184 1 10 20 64 157 126 229 65 2Montbello 30,348 1,726 3 17 70 179 190 169 236 116 3Stapleton 13,948 1,605 0 3 39 33 138 739 201 80 1
DISTRICT TOTALS 4,642 4 30 129 279 494 1,051 717 274 6
+ 2010 Census Data downloaded from the Piton Foundation
* Includes both petty and grand larceny, however excludes theft from motor vehicle
** Theft from Motor Vehicle
This data is based on the Uniform Crime Reporting standards. All les utilized in the creation of this report are dynamic. Dynamic les allow additions, deletions and/or modications at any time, resulting in more complete and
accurate records in the databases. Due to continuous data entry after reports are compiled, numbers may vary in previous or subsequent reports. Data downloaded 01/06/14.
PREPARED TO DEPARTMENT OF SAFETY PUBLIC INFORMATION STANDARDS
DENVER
INTERNATIONAL AIRPORT
(DIA)
GATEWAY -
GREEN VALLEY RANCHMONTBELLO
STAPLETON
26th Ave
Smit h Rd
56th Ave
64th Ave
H a v a n a S t
Q u e b e c S t
Montview
Blvd
I-7 0
40th Ave 38th Ave
C h a m b e r s R d
P i c a d i l l y R d

8/10/2019 2013 Annual Report Print
http://slidepdf.com/reader/full/2013-annual-report-print 25/32
2013 ANNUAL REPORT 2
DISTRICTSIX
Commander Antonio Lopez
DISTRICT 6 POLICE1566 WASHINGTON STREET
CENTRAL DENVER
2013 Neighborhood Crime Rates (per 1,000 persons)
Neighborhood Population+ Total Crime Homicide Sexual Assault Robbery Aggr. Assault Burglary Larceny* TFMV** Auto Theft Arson
Capitol Hill 14,708 1,790 1 16 57 66 81 362 199 120 0Central Bus. District 3,648 2,354 0 18 61 51 47 709 157 49 1Cheesman Park 7,971 882 0 8 15 16 53 103 86 54 0City Park West 4,844 663 0 7 16 32 59 101 70 34 0Civic Center 1,577 1,313 0 6 25 55 20 103 40 25 0Five Points 12,710 1,570 2 6 63 57 63 262 204 73 1North Capitol Hill 5,823 1,026 1 9 30 39 63 186 105 53 2Union Station 4,350 1,081 2 5 32 90 21 267 152 52 0
DISTRICT TOTALS 10,679 6 75 299 406 407 2,093 1,013 460 4
+ 2010 Census Data downloaded from the Piton Foundation
* Includes both petty and grand larceny, however excludes theft from motor vehicle
** Theft from Motor Vehicle
This data is based on the Uniform Crime Reporting standards. All les utilized in the creation of this report are dynamic. Dynamic les allow additions, deletions and/or modications at any time, resulting in more complete and
accurate records in the databases. Due to continuous data entry after reports are compiled, numbers may vary in previous or subsequent reports. Data downloaded 01/06/14.
PREPARED TO DEPARTMENT OF SAFETY PUBLIC INFORMATION STANDARDS
CITY PARK
WEST
CAPITOL HILL
NORTH
CAPITOL HILL
FIVE
POINTS
CENTRAL
BUSINESS
DISTRICT
CIVIC
CENTER
UNION
STATION
CHEESMAN
PARK
Colfax Ave
8th Ave
7th Ave
20th Ave L a w r e n c
e S t
2 0 t h S t
P l a t t e
R i v
e r
23rd Ave
D o w n i n g S t
B r o a d w a y S t
S p
e e r B
l v d
2 5 t h S t
Y o r k S t

8/10/2019 2013 Annual Report Print
http://slidepdf.com/reader/full/2013-annual-report-print 26/3226
CRIME STATISTICS
The Federal Bureau of Investigation’s (FBI) Uniform Crime Report (UCR) is a summary reporting system that tracks statisticssubmitted by police agencies. Developed in the 1920s as a tool to compare national crime statistics, the UCR programdistinguishes crimes by Part I, including the eight more serious crimes: homicide, rape, robbery, aggravated assault, burglarylarceny, auto theft and arson and Part II, which encompasses all other crime. UCR works on a hierarchy based method ofcounting crime. Only the highest crime committed during an incident per the hierarchy, is counted. To compare crime trendsto other jurisdictions using UCR data, please visit the FBI website at www.fbi.gov/ucr/ucr.htm.
JAN-DEC 2011 JAN-DEC 2012* JAN-DEC 2013* CHANGE FROM2012 TO 2013 ACTUALJAN-DEC 201
TYPE OF OFFENSE # % # % # % # % #
PART I PERSONS
Homicide 43 0.1% 39 0.1% 40 0.1% 1 2.6% 40
Sexual Assault 379 1.0% 410 1.0% 346 0.8% -64 -15.6% 346
Robbery 1,196 3.1% 1,345 3.2% 1.130 2.6% -215 -16% 1,13
Aggravated Assault 2,199 5.7% 2,443 5.9% 2,363 5.5% -80 -3.3% 2,372
SUBTOTAL 3,817 9.9% 4,237 10.2% 3,879 9.0% -358 -8.4% 3,889
PART I PROPERTY
Burglary 4,861 12.6% 5,156 12.4% 4,919 11.4% -237 -4.6% 4,92
Larceny (except TFMV)** 6,061 15.7% 7,393 17.8% 7,734 18.0% 341 4.6% 8,620
Theft from Motor Vehicle 7,876 20.3% 7,332 17.7% 6,521 15.2% -811 -11.1% 6,525
Auto Theft 3,541 9.1% 3,714 9.0% 3,465 8.1% -249 -6.7% 3,472
Arson 90 0.2% 92 0.2% 90 0.2% -2 -2.2% 90
SUBTOTAL 22,429 57.9% 23,687 57.1% 22,729 52.9% -958 -4.0% 23,628
PART I TOTAL 26,246 67.8% 27,924 67.3% 26,608 61.9% -1,316 -4.7% 27,51
OTHER CRIMES AGAINST PERSONS
Other Assaults 2,178 5.6% 2,412 5.8% 3,264 7.6% 852 35.3% 3,589
Other Sex Offenses 527 1.4% 641 1.5% 505 1.2% -136 -21.2% 518
Offenses against Family/Children 259 0.7% 272 0.7% 233 0.5% -39 -14.3% 24
SUBTOTAL 2,964 7.7% 3,325 8.0% 4,002 9.3% 677 20.4% 4,354
PUBLIC DISORDER CRIMES
Criminal Mischief 5,432 14.0% 5,436 13.1% 5,174 12.0% -262 -4.8% 5,308
Prostitution/Commercialized Vice 25 0.1% 24 0.1% 57 0.1% 33 137.5% 69
Disorderly Conduct 874 2.3% 1,035 2.5% 1,706 4.0% 671 64.8% 2,228
Curfew and Loitering 2 0.0% 1 0.0% 1 0.0% 0 0.0% 56
SUBTOTAL 6,333 16.4% 6,496 15.7% 6,938 16.1% 442 6.8% 7,66
DRUG/ALCOHOL OFFENSES
Drug Abuse Violations 1,232 3.2% 1,575 3.8% 2,000 4.7% 425 27.0% 2,806
Liquor Law Violations 3 0.0% 5 0.0% 118 0.3% 113 2260.0% 1,735
SUBTOTAL 1,235 3.2% 1,580 3.8% 2,118 4.9% 538 34.1% 4,54
WHITE COLLAR CRIMES
Forgery/Counterfeiting 136 0.4% 157 0.4% 117 0.3% -40 -25.5% 118
Fraud 832 2.1% 827 2.0% 652 1.5% -175 -21.2% 682
Embezzlement 15 0.0% 17 0.0% 22 0.1% 5 29.4% 24
SUBTOTAL 983 2.5% 1,001 2.4% 791 1.8% -210 -21.0% 824
ALL OTHER CRIMES
Stolen Property 6 0.0% 10 0.0% 14 0.0% 4 40.0% 14
Weapons 260 0.7% 329 0.8% 370 0.9% 41 12.5% 437
All Other Offenses 682 1.8% 814 2.0% 2,123 4.9% 1,309 160.8% 4,132
SUBTOTAL 948 2.4% 1,153 2.8% 2,507 5.8% 1,354 117.4% 4,583
PART 2 TOTAL 12,463 32.2% 13,555 32.7% 16,356 38.1% 2,801 20.7% 21,963
GRAND TOTAL 38,709 100.0% 41,479 100.0% 42,964 100.0% 1,485 3.6% 49,480
* In May 2013, the Denver Police Department implemented the Unied Summons and Complaint (US&C) process. This process unies multiple types of paper citations, excluding trafc tickets, into an electronic process. Thatinformation is transmitted to the Denver Sheriff, County Court, City Attorney and District Attorney through a data exchange platform as needed. As a result of this process, a reported offense is generated which was previously not
captured. For comparison purposes, crimes which were captured due to the US&C process were excluded from the data when comparing 2012 to 2013. An additional column has been added to the table to reect the actual
number of crimes.
** Includes both petty and grand larceny, however excludes theft from motor vehicle
This data is based on the Uniform Crime Reporting standards. All les utilized in the creation of this report are dynamic. Dynamic les allow additions, deletions and/or modications at any time, resulting in more complete and
accurate records in the databases. Due to continuous data entry after reports are compiled, numbers may vary in previous or subsequent reports. Data downloaded 01/06/14.
Excludes trafc accidents, trafc moving violations and other trafc offenses.
PREPARED TO DEPARTMENT OF SAFETY PUBLIC INFORMATION STANDARDS

8/10/2019 2013 Annual Report Print
http://slidepdf.com/reader/full/2013-annual-report-print 27/32
2013 ANNUAL REPORT 2
ARREST STATISTICS2010 2011 2012 2013
TYPE OF CRIME Adult Juvenile TOTAL Adult Juvenile TOTAL Adult Juvenile TOTAL Adult Juvenile TOTAL
Murder 38 5 43 16 1 17 24 1 25 33 3 36
Manslaughter 8 1 9 5 0 5 4 0 4 0 0 0
Sexual Assault 227 27 254 150 29 179 109 36 145 127 29 156
Robbery 255 43 298 182 43 225 171 42 213 197 42 239
Aggravated Assault 824 87 911 745 76 821 685 89 774 1,129 71 1,200
Burglary 360 121 481 235 118 353 225 107 332 314 65 379
Larceny 3,688 709 4,397 3,085 577 3,662 2,865 601 3,466 2,709 507 3,216
Motor Vehicle Theft 308 56 364 259 51 310 290 54 344 259 66 325
Other Assaults 4,727 637 5,364 3,971 612 4,583 3,169 608 3,777 2,177 533 2,710Arson 15 5 20 6 10 16 11 9 20 7 4 11
Forgery 131 0 131 90 2 92 86 0 86 75 0 75
Fraud 123 4 127 101 2 103 69 2 71 26 3 29
Embezzlement 13 0 13 7 0 7 2 0 2 0 0 0
Stolen Property 68 4 72 52 7 59 46 5 51 14 0 14
Vandalism 1,070 321 1,391 830 263 1,093 917 181 1,098 777 145 922
Weapon Arrests 494 64 558 392 50 442 564 70 634 417 38 455
Prostitution 497 5 502 419 4 423 557 4 561 516 4 520
Sex Offenses 222 21 243 151 20 171 165 21 186 136 6 142
Drug Sales 8,514 428 8,942 4,008 494 4,502 4,268 466 4,734 3,522 479 4,001
All Other Gambling 13 0 13 4 0 4 8 0 8 41 3 44
Offenses Against Family 351 3 354 332 1 333 223 0 223 102 0 102
Alcohol Related Violations 1,501 1 1,502 1,864 0 1,864 1,917 0 1,917 2,323 9 2,332
Liquor Laws 4,512 51 4,563 3,149 47 3,196 3,594 57 3,651 3,906 56 3,962
Drunkenness 79 0 79 51 2 53 51 0 51 43 2 45
Disorderly Conduct 3,721 385 4,106 2,632 325 2,957 3,007 260 3,267 2,086 197 2,283
Vagrancy 468 5 473 369 1 370 344 0 344 363 0 363
All Other Arrests 7,123 681 7,804 5,167 671 5,838 5,603 689 6,292 5,531 448 5,979Curfew 48 902 950 31 838 869 68 851 919 13 280 293
Runaways 0 29 29 0 11 11 0 27 27 2 8 10
Trafc/Auto Laws 2,530 8 2,538 1,680 7 1,687 1,255 9 1,264 4,074 65 4,139
Warrants/Holds 9,630 336 9,966 16,787 358 17,145 17,213 326 17,539 16,564 332 16,896
TOTAL 51,558 4,939 56,497 46,770 4,620 51,390 47,510 4,515 52,025 47,483 3,395 50,878
Arrests include both custodial (physically detained in a holding facility) and order-in (issued a summons to appear in court). All les utilized in the creation of this report are dynamic. Dynamic les allow additions, deletions
and/or modications at any time, resulting in more complete and accurate records in the databases. Due to continuous data entry after reports are compiled, numbers may vary in previous or subsequent reports.
Data downloaded 01/06/14.
PREPARED TO DEPARTMENT OF SAFETY PUBLIC INFORMATION STANDARDS
TRAFFIC STATISTICS
2011 2012 2013 CHANGE FROM2012-2013
ACCIDENTS # # # %
Total Accidents 22,649 22,708 21,830 -3.9%
Total Fatal Accidents 38 38 44 15.8%
FATALITIES
Total Fatalities 40 40 47 17.5%
Fatal Accidents - DUI Involved 14 4 19 375%
Total Fatalities - DUI Involved 15 4 14 250%
Auto-Pedestrian Fatalities 18 23 15 -34.8%
DRIVING UNDER THE INFLUENCE
Total DUI Arrests 3,106 3,097 2,998 -3.2%
CITATIONS
Moving Citations 126,900 118,668 109,411 -7.8%
8/10/2019 2013 Annual Report Print
http://slidepdf.com/reader/full/2013-annual-report-print 28/3228
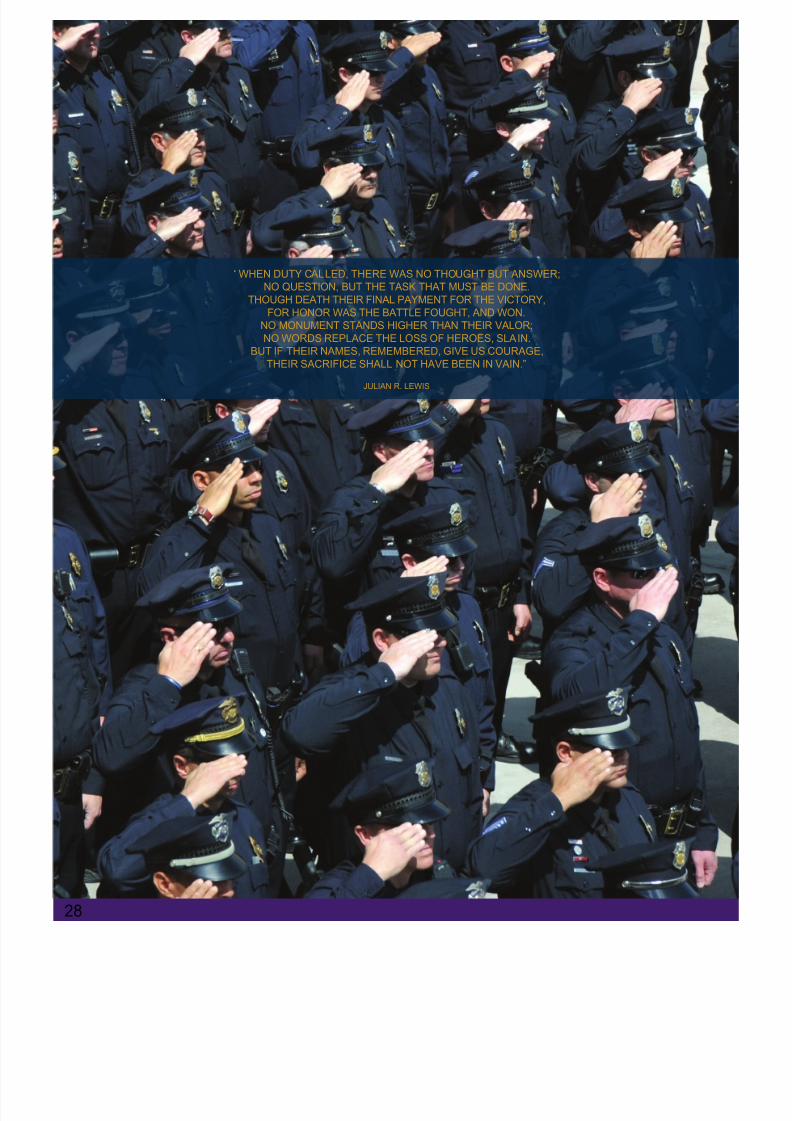
“ WHEN DUTY CALLED, THERE WAS NO THOUGHT BUT ANSWER;
NO QUESTION, BUT THE TASK THAT MUST BE DONE.
THOUGH DEATH THEIR FINAL PAYMENT FOR THE VICTORY,
FOR HONOR WAS THE BATTLE FOUGHT, AND WON.
NO MONUMENT STANDS HIGHER THAN THEIR VALOR;
NO WORDS REPLACE THE LOSS OF HEROES, SLAIN.
BUT IF THEIR NAMES, REMEMBERED, GIVE US COURAGE,
THEIR SACRIFICE SHALL NOT HAVE BEEN IN VAIN.”
JULIAN R. LEWIS

8/10/2019 2013 Annual Report Print
http://slidepdf.com/reader/full/2013-annual-report-print 29/32
2013 ANNUAL REPORT 2
FALLEN OFFICERS
JOHN C. PHILLIPSJuly 16, 1889
CHARLES F. WANLESSSeptember 18, 1890
CHARLES A. HAWLEYJanuary 16, 1891
GUSTAVE GISINJanuary 24, 1893
ALPHEUS J. MOOREMarch 20, 1895
WENDELL P. SMITHFebruary 5, 1896
THOMAS C. CLIFFORDWILLIAM E. GRIFFITHS
August 13, 1899
STUART K. HARVEYNovember 6, 1900
FRANK DULINMarch 14, 1905
WILLIAM BOHANNAMarch 15, 1905
JOHN SPELLMANJune 18, 1906
WILLIAM H. BECKMay 2, 1908
WILLIAM P. STEPHENSAugust 25, 1908
SAMUEL C. CARPENTERJanuary 17, 1910
WILLIAM MCPHERSONMarch 11, 1912
WILLIAM H. CABLERApril 22, 1916
LUTHER MCMAHILLSeptember 14, 1918
EMERSON L. MCKINNONMay 20, 1919
GEORGE C. KLEIN
August 29, 1919
JAMES E. BOGGIOJanuary 8, 1920
ROY O. DOWNINGDecember 1, 1920
WILLIAM O. STEAMFebruary 18, 1921
CLARENCE E. ZEITZApril 2, 1921
FORREST ROSSApril 4, 1921
ARTHUR J. PINKERTONMay 30, 1921
RICHIE ROSEOctober 31, 1922
JAMES SHANNONApril 4, 1925
ELMER I. RICHMarch 23, 1927
HARRY R. OHLENovember 22, 1928
ROBERT K. EVANSNovember 28, 1928
THOMAS J. DURKINJanuary 17, 1929
CLARENCE W. ALSTONMarch 24, 1929
WILLIAM C. KEATINGAugust 31, 1931
GEORGE P. SCHNEIDERJOHN F. DEA
February 11, 1933
THOMAS J. O’CONNORMarch 5, 1934
JOHN J. O’DONNELLMarch 22, 1934
CLARENCE E. FRAKERMarch 23, 1934
ALSON E. MCCASLANDMay 28, 1935
ROBERT M. CAMPBELLFebruary 11, 1936
PASQUALE C. MARINAROApril 17, 1936
FORREST E. SAWYERMarch 8, 1937
JACOB BENNER
February 14, 1938
FRED RENOVATOOctober 13, 1938
EARL F. BURNSFebruary 16, 1939
VIRGIL M. HALLJuly 5, 1945
WILLIAM A. CLAASSENFebruary 11, 1953
DONALD L. SEICKJanuary 12, 1958
EDWARD H. SMERDELJuly 16, 1961
DARRELL J. SUERMarch 11, 1962
CARL B. KNOBBESeptember 12, 1962
PAUL L. MAJORJanuary 20, 1965
PAUL D. WILSONSeptember 14, 1968
WILLIAM J. WIRTZFebruary 10, 1971
MERLE E. NADINGOctober 3, 1971
WILLIAM E. SMITHJanuary 23, 1975
DONALD L. DEBRUNODecember 10, 1975
RICHARD CLINEJuly 13, 1976
DAVID TAFOYAFebruary 10,1980
KATHLEEN GARCIAMarch 28, 1981
PATRICK J. POLLOCK
December 12, 1986
JAMES E. WIERJune 3, 1987
ROBERT W. WALLISFebruary 9, 1988
SHAWN LEINENFebruary 25, 1995
RONALD L. DEHERRERAApril 1, 1997
BRUCE VANDERJAGTNovember 12, 1997
DENNIS M. LICATASeptember 6, 2000
DONALD R. YOUNGMay 8, 2005
DAVID ROBERTSMay 27, 2011
CELENA C. HOLLISJune 24, 2012

8/10/2019 2013 Annual Report Print
http://slidepdf.com/reader/full/2013-annual-report-print 30/3230
The Denver Police Foundation is a nonprot, charitable organization whose goal is to generate community support to provide
equipment, training and technology to aid the Denver Police Department’s ofcers and enhance public safety.Created in 1999, the Denver Police Ofcers Foundation provided support to the families of Denver police ofcers who wereinjured or killed in the line of duty. In 2003, the foundation divided into two distinct groups. The Denver Police Foundation,with a mission focusing on promoting and enhancing public safety; and the Denver Police Ofcers Foundation, embracing theoriginal mission of providing ofcer and family support. Each unit, in its own way, has provided equipment and programmingthat promote ofcer safety, prevention of crime in the city, and community involvement advocacy.
Since its inception, the Foundation has provided a substantial amount of money and resources in support of ofcers andfamilies. In 2013, the Foundation provided support to the Denver Police Department in the following areas:
DPD Social Media ProgramChief’s Community Promotions
Police Explorers Program
Take it to the Track ProgramRecruitment
Victim’s Assistance RoomLeadership in Police OrganizationsSM Program
Webgear Duty Belt InitiativeInvestigative Efciency Program Denver Canine Ofcer Program
Denver Police Ofcer’s Ball Thomas O’Byrne Health Fair

8/10/2019 2013 Annual Report Print
http://slidepdf.com/reader/full/2013-annual-report-print 31/32
2013 ANNUAL REPORT 3
CREDITS
Chief Robert C. White
Captain Sylvia T. Sich - Planning, Research and Support Division
Sergeant Anthony Parisi - Planning, Research and Support Division
Dawn Miquel - Planning, Research and Support Division
Shawn Fettig - Planning, Research and Support Division
Technician Estevan C. Valdez - Planning, Research and Support Division, Editor/Graphic Design
Captain Eric Rubin - Photography
Michael Bush - Photography
Duane Pearson - Photography

8/10/2019 2013 Annual Report Print
http://slidepdf.com/reader/full/2013-annual-report-print 32/32
DENVER POLICE DEPARTMENT
1331 CHEROKEE STREET
DENVER, CO 80204
WWW.DENVERGOV.ORG/POLICE