2013 annual report - maryland state...
TRANSCRIPT

MARTIN O’MALLEY GOVERNOR OF MARYLAND
BOARD OF DIRECTORSBOARD OF DIRECTORS
James M. Harkins, DirectorJohn O’Neill, Deputy DirectorRichard P. Streett, Jr. V.M.D. SecretaryJanet Irvin, Treasurer and Chief Financial Offi cerLeslie Jackson Jenkins, Esq.William B. C. Addison, Jr. Joseph F. Snee, Jr., Esq. Talmadge E. SimonsEdward C. Adams
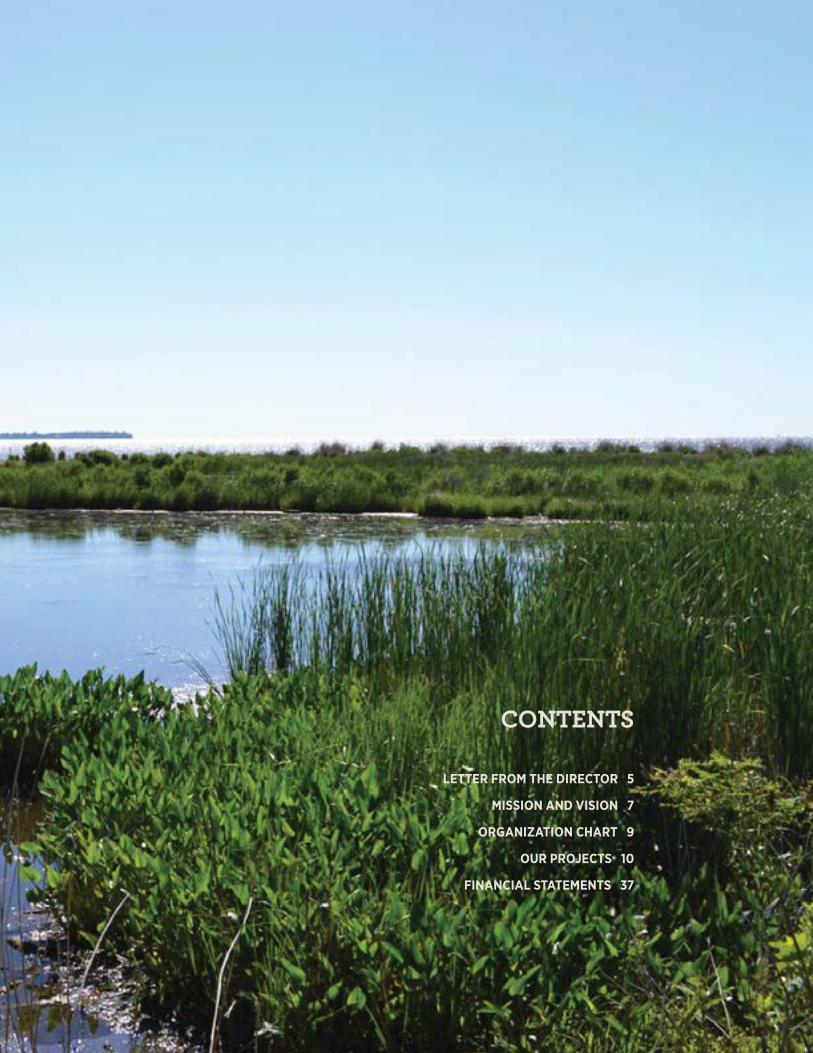
CONTENTSCONTENTS
LETTER FROM THE DIRECTOR 5
MISSION AND VISION 7
ORGANIZATION CHART 9
OUR PROJECTS 10
FINANCIAL STATEMENTS 37

Lt. Governor Anthony Brown and students plant grasses during grand opening of Masonville Cove Urban Wilderness Area
After caring for the terrapins in thier classrooms, students release the young diamondbacks on Poplar Island
MARYLAND ENVIRONMENTAL SERVICE 2013 ANNUAL REPORT 5
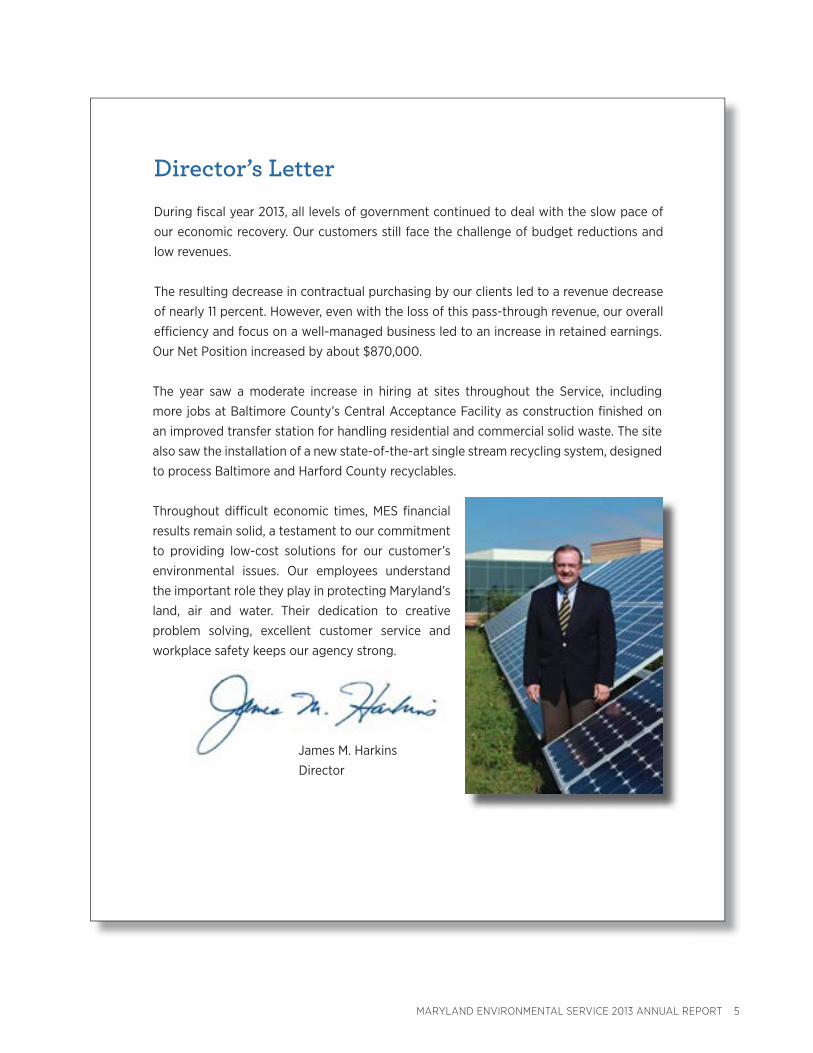
Director’s LetterDirector’s LetterDuring fi scal year 2013, all levels of government continued to deal with the slow pace of our economic recovery. Our customers still face the challenge of budget reductions and low revenues.
The resulting decrease in contractual purchasing by our clients led to a revenue decrease of nearly 11 percent. However, even with the loss of this pass-through revenue, our overall effi ciency and focus on a well-managed business led to an increase in retained earnings. Our Net Position increased by about $870,000.
The year saw a moderate increase in hiring at sites throughout the Service, including more jobs at Baltimore County’s Central Acceptance Facility as construction fi nished on an improved transfer station for handling residential and commercial solid waste. The site also saw the installation of a new state-of-the-art single stream recycling system, designed to process Baltimore and Harford County recyclables.
Throughout diffi cult economic times, MES fi nancial results remain solid, a testament to our commitment to providing low-cost solutions for our customer’s environmental issues. Our employees understand the important role they play in protecting Maryland’s land, air and water. Their dedication to creative problem solving, excellent customer service and workplace safety keeps our agency strong.
James M. Harkins Director
6 MARYLAND ENVIRONMENTAL SERVICE 2013 ANNUAL REPORT
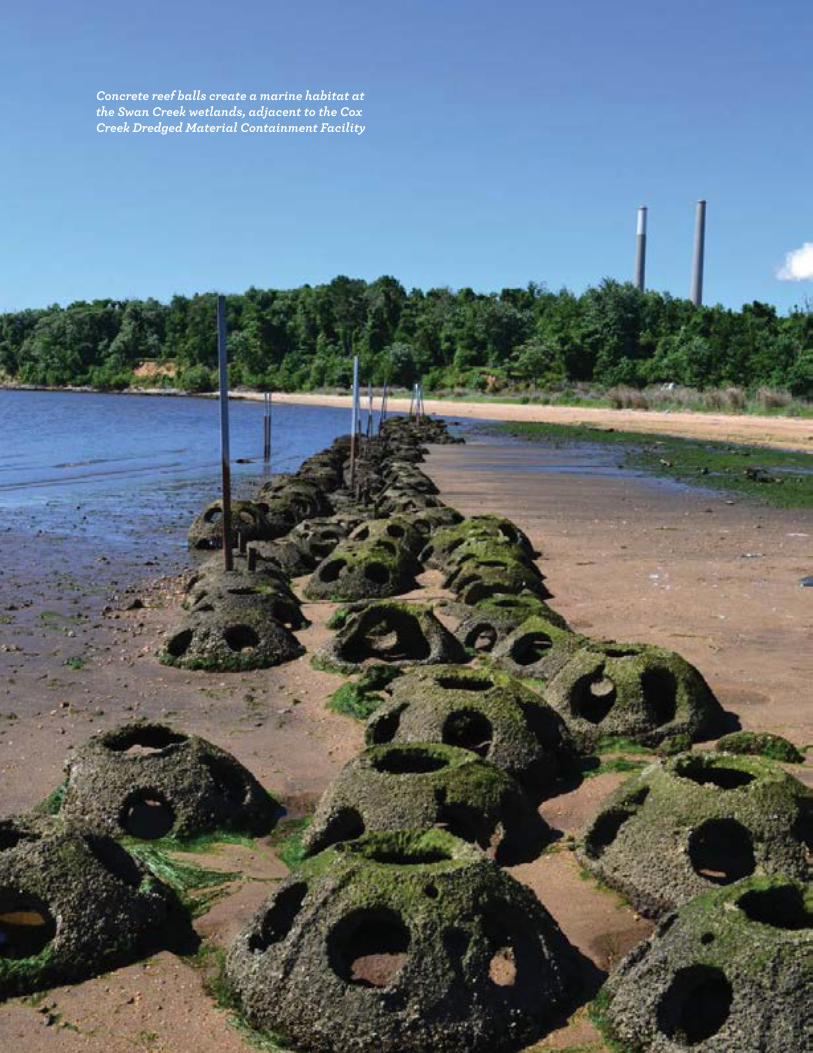
Concrete reef balls create a marine habitat at the Swan Creek wetlands, adjacent to the Cox Creek Dredged Material Containment Facility
MARYLAND ENVIRONMENTAL SERVICE 2013 ANNUAL REPORT 7
In 1970, Maryland’s Governor and legislators created Maryland Environmental Service to protect the state’s air, land and water resources. Today, our independent State agency continues to fulfi ll this vital directive.
We have no regulatory authority and we receive no direct appropriations. Our agency is a self-supporting, not-for-profi t public corporation, combining the public sector’s commitment to environmental protection with the private sector’s fl exibility and responsiveness.
MES provides services at competitive rates to government and private sector clients and works on projects including water and wastewater treatment, solid waste management, composting, recycling, dredged material management, hazardous materials cleanup, storm water services and renewable energy. We provide expert engineering, monitoring and inspection services.
With 853 diverse projects located in three states, ranging in cost from $720 to $6.2 million, we couple operational expertise with a commitment to strict environmental compliance and safe work practices.
Today, Maryland Environmental Service remains focused on fi nding innovative solutions to our region’s most complex environmental challenges and preserving our region’s natural resources for generations to come.
To provide operational and technical services to protect and enhance the environment for the people of Maryland.
Maryland Environmental Service: an innovative and leading edge solver of environmental problems; a responsible and successful manager of environmental operations; and a great place to work.
MISSION
VISION
WHO WE AREWHO WE ARE
8 MARYLAND ENVIRONMENTAL SERVICE 2013 ANNUAL REPORT
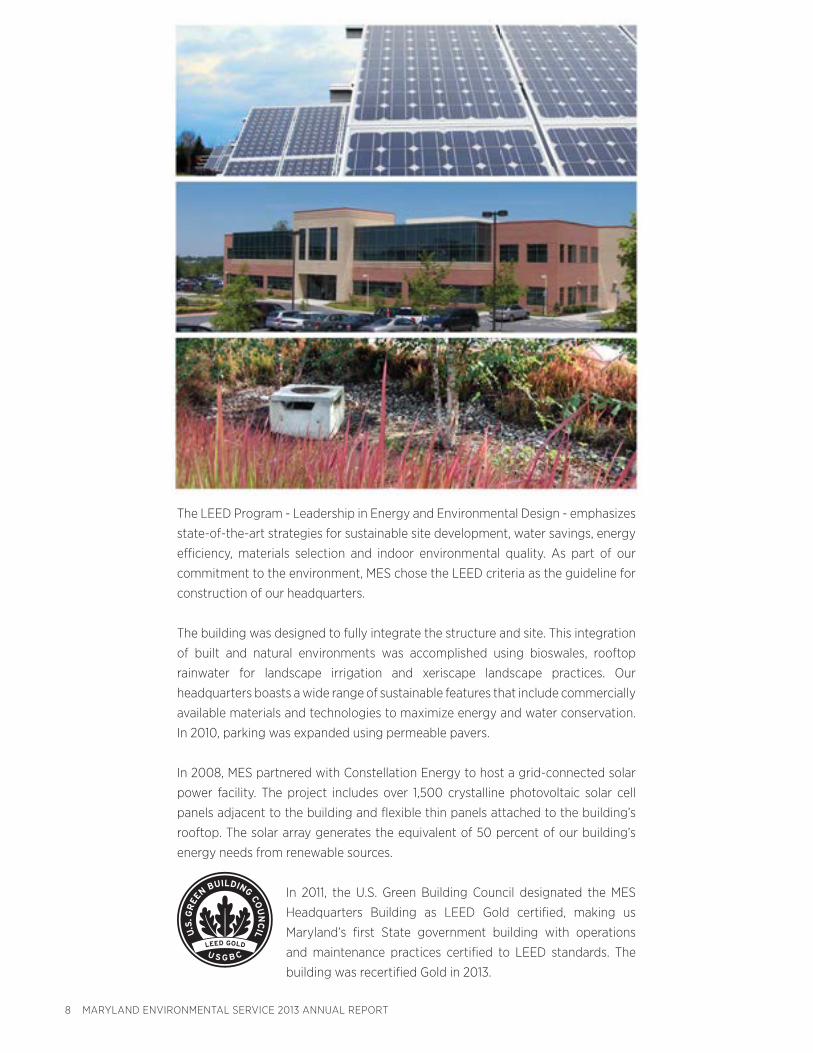
The LEED Program - Leadership in Energy and Environmental Design - emphasizes
state-of-the-art strategies for sustainable site development, water savings, energy
effi ciency, materials selection and indoor environmental quality. As part of our
commitment to the environment, MES chose the LEED criteria as the guideline for
construction of our headquarters.
The building was designed to fully integrate the structure and site. This integration
of built and natural environments was accomplished using bioswales, rooftop
rainwater for landscape irrigation and xeriscape landscape practices. Our
headquarters boasts a wide range of sustainable features that include commercially
available materials and technologies to maximize energy and water conservation.
In 2010, parking was expanded using permeable pavers.
In 2008, MES partnered with Constellation Energy to host a grid-connected solar
power facility. The project includes over 1,500 crystalline photovoltaic solar cell
panels adjacent to the building and fl exible thin panels attached to the building’s
rooftop. The solar array generates the equivalent of 50 percent of our building’s
energy needs from renewable sources.
In 2011, the U.S. Green Building Council designated the MES
Headquarters Building as LEED Gold certifi ed, making us
Maryland’s fi rst State government building with operations
and maintenance practices certifi ed to LEED standards. The
building was recertifi ed Gold in 2013.
MARYLAND ENVIRONMENTAL SERVICE 2013 ANNUAL REPORT 9
Deputy Chief, Operations
David Czawlytko
410-242-5039
ECI Co-Gen Plant
Manager
James Allen
410-651-1266
Charles Ingram
410-729-8648
Director
James M. Harkins
410-729-8200
Deputy Director
John O'Neill Jr.
410-729-8200
Executive Director
for Technical and
Environmental Services
Cece Donovan
410-729-8333
D t C
Chief,
Project Management
Timothy Ford
410-729-8303
Chief of
Environmental Dredging
Tammy Banta
410-729-8331
Chief of Environmental
Monitoring
Jason Gillespie
410-729-8363
Maintenance Manager
Bryan Winkelmeyer
410-729-8314
Executive Director of
Water/Wastewater
Jerry Wheeler
410-729-8382
ce Manager
Chief of Water/
Wastewater Operations
and Maintenance
Douglas Conaway
410-729-8385
Marketing Manager
Nancy Faulkner
410-729-8393
Executive Director for
Environmental
Operations
Steve Tomczewski
410-729-8371
O tiChi f O
MChief of Solid Waste
Operations
Maclane Gibson
410-729-8379
Chief Financial Officer
Janet Irvin
410-729-8272
Deputy Chief
Financial Officer
Hament Patel
410-729-8274
Chief of Water/
Wastewater Engineering
Ellen Frketic
410-729-8307
Principal Counsel
Sean Coleman
410-729-8240
Customer Service
Representative
James A. Stonesifer
410-913-2381
Chief of Administrative
Services
Frank Babusci
410-729-8217
Chi f f Ad i i t ti
Grants AdministratorGrants Administrator
Ted KlugaTed Kluga
410-729-8206410-729-8206
GG AAdd ii ii
Assistant Director
Beth Wojton
410-729-8203
C S i
Chief of SafetyChief of Safety
Sue McCauleySue McCauley
410-729-8226410-729-8226
Human Resources
Business Development
Internal Auditor
Diana Olson
410-729-8213
Director of
Communications
Christina Garrigan
410-729-8207
Chief of Procurement
Sally Long
410-729-8504
Chief of Environmental
Compliance
410-729-8205
Chief of IT
Nick Kuba
410-729-8651
John Kane
Fleet Manager
Harry Burman
Assistant Chief of W/WW
Operations & Maintenance
Tim Germana
410-729-8386
410-729-8269
Deputy Chief,
Material Handling
and Restoration
Treasurer
10 MARYLAND ENVIRONMENTAL SERVICE 2013 ANNUAL REPORT
ENVIRONMENTAL DREDGING AND RESTORATION
The Maryland Port Administration (MPA) is responsible
for ensuring placement capacity for the material dredged
from the shipping channels running through the Maryland
portion of the Bay, the Patapsco River and Baltimore
Harbor; regular dredging is required to provide safe and
clear passage for cargo vessels. The MES Environmental
Dredging & Restoration Division supports the Port’s
mission by providing services in the fi eld of dredged
material management with an emphasis on environmental
restoration, innovative re-use of dredged material, and
planning, permitting, monitoring, reporting, operating
and maintaining dredged material placement sites.
MES provides hazardous material and site management
support for the MPA and Honeywell at the Hawkins Point
Hazardous Waste Landfi ll and for MPA at the Dundalk
Marine Terminal. MES also provides environmental
management system services and environmental
compliance for the MPA at the Dundalk Marine Terminal.
In addition, MES provided environmental support in
2013 to the Maryland Department of Natural Resources
Fisheries Service, Boating Service and Watershed Service,
the Maryland Department of Agriculture and the USACE
Philadelphia District.
MES continued to perform wetland delineation, wetland
mitigation, wetland permitting and forest conservation
planning services throughout the year to the MPA,
Dorchester County, Charlotte Hall Veterans Home in
Charlotte Hall, MD and the Southern Pre-release Unit in
Hughesville, MD.
TECHNICAL AND ENVIRONMENTAL SERVICES
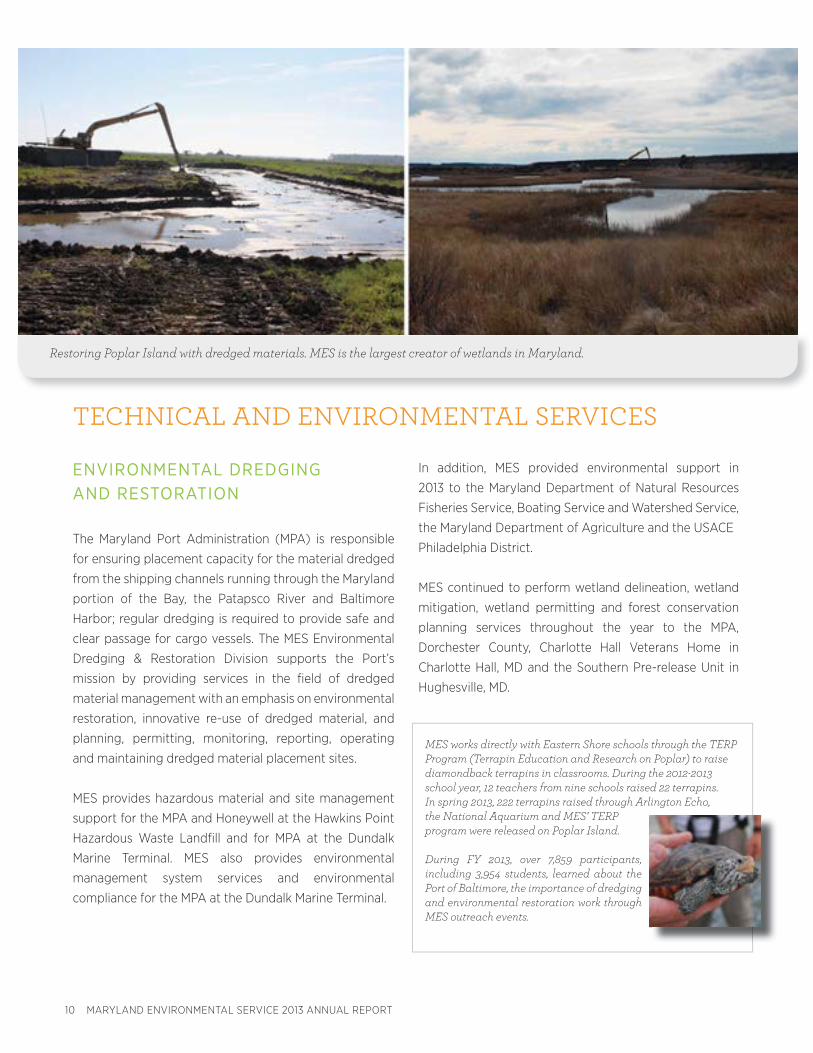
Restoring Poplar Island with dredged materials. MES is the largest creator of wetlands in Maryland.
MES works directly with Eastern Shore schools through the TERP Program (Terrapin Education and Research on Poplar) to raise diamondback terrapins in classrooms. During the 2012-2013 school year, 12 teachers from nine schools raised 22 terrapins. In spring 2013, 222 terrapins raised through Arlington Echo, the National Aquarium and MES’ TERP program were released on Poplar Island.
During FY 2013, over 7,859 participants, including 3,954 students, learned about the Port of Baltimore, the importance of dredging and environmental restoration work through MES outreach events.
MARYLAND ENVIRONMENTAL SERVICE 2013 ANNUAL REPORT 11
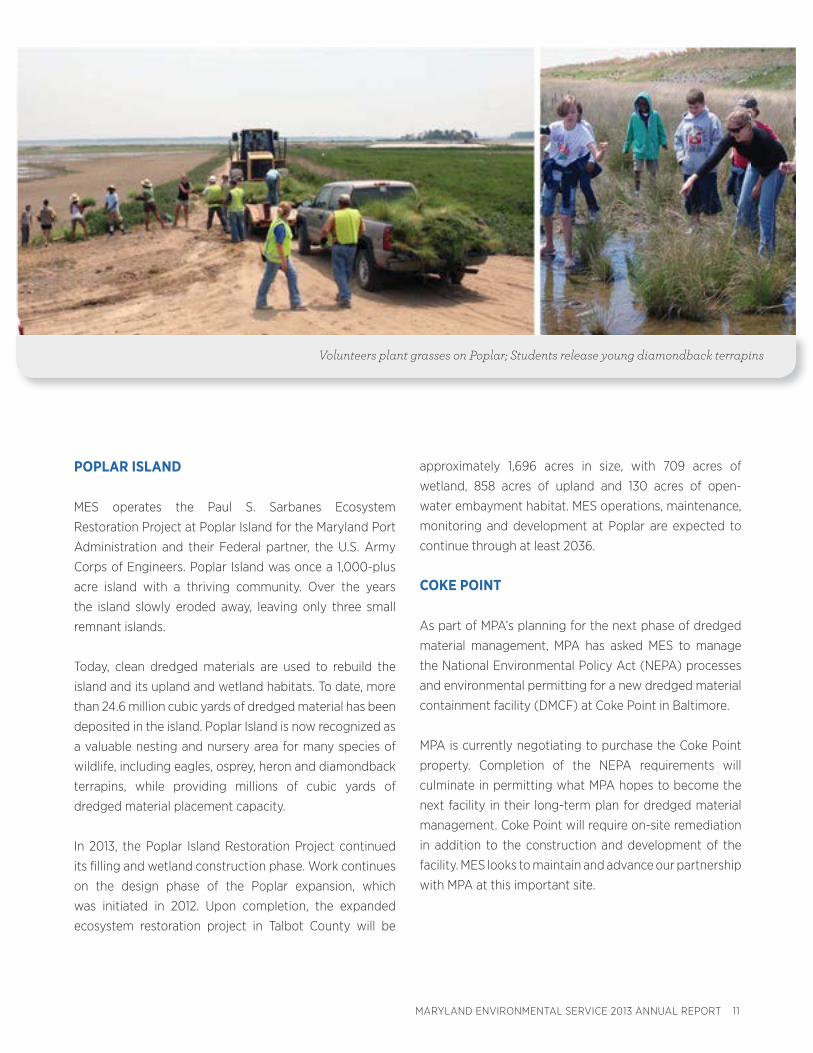
POPLAR ISLAND
MES operates the Paul S. Sarbanes Ecosystem
Restoration Project at Poplar Island for the Maryland Port
Administration and their Federal partner, the U.S. Army
Corps of Engineers. Poplar Island was once a 1,000-plus
acre island with a thriving community. Over the years
the island slowly eroded away, leaving only three small
remnant islands.
Today, clean dredged materials are used to rebuild the
island and its upland and wetland habitats. To date, more
than 24.6 million cubic yards of dredged material has been
deposited in the island. Poplar Island is now recognized as
a valuable nesting and nursery area for many species of
wildlife, including eagles, osprey, heron and diamondback
terrapins, while providing millions of cubic yards of
dredged material placement capacity.
In 2013, the Poplar Island Restoration Project continued
its fi lling and wetland construction phase. Work continues
on the design phase of the Poplar expansion, which
was initiated in 2012. Upon completion, the expanded
ecosystem restoration project in Talbot County will be
approximately 1,696 acres in size, with 709 acres of
wetland, 858 acres of upland and 130 acres of open-
water embayment habitat. MES operations, maintenance,
monitoring and development at Poplar are expected to
continue through at least 2036.
COKE POINT
As part of MPA’s planning for the next phase of dredged
material management, MPA has asked MES to manage
the National Environmental Policy Act (NEPA) processes
and environmental permitting for a new dredged material
containment facility (DMCF) at Coke Point in Baltimore.
MPA is currently negotiating to purchase the Coke Point
property. Completion of the NEPA requirements will
culminate in permitting what MPA hopes to become the
next facility in their long-term plan for dredged material
management. Coke Point will require on-site remediation
in addition to the construction and development of the
facility. MES looks to maintain and advance our partnership
with MPA at this important site.
Volunteers plant grasses on Poplar; Students release young diamondback terrapins
12 MARYLAND ENVIRONMENTAL SERVICE 2013 ANNUAL REPORT
HART-MILLER ISLAND
MES has operated and maintained Hart-Miller Island
(HMI) 1,140-acre dredged material containment facility
since 1984. HMI, a project that began in controversy, has
become a model of successful collaboration between
government and citizens. HMI now serves as a valuable
habitat for shore and water birds and an outstanding
recreational site for boaters.
Over 25 years, more than 100 million cubic yards of
dredged material was placed at HMI; the last placement
occurred in 2009. MES will continue to provide
operations, maintenance and environmental monitoring
support to the project. MES works with the Maryland
Port Administration, DNR and the design team to develop
cost eff ective approaches to transform the North Cell
into viable wildlife habitat. The current North Cell design
concept is based on upland habitat with a storm water
management pond and perched, non-tidal wetlands. The
goal is to complete the major construction of the North
Cell habitat within a fi ve-year time frame.
COX CREEK
After the closing of Hart-Miller Island on December 31,
2009, the Cox Creek and Masonville DMCFs became the
remaining two options for placement of Harbor dredged
material. MES operates the 133-acre Cox Creek site for the
MPA. Cox Creek received its fi rst large federal contract for
approximately 433,000 cubic yards of Harbor dredged
material in October 2012. To date, Cox Creek has received
1,419,574 cubic yards of material.
During 2013, MES continued to upgrade the existing
spillway systems with unloader recirculation access and
exterior dike vaults to house fl ow meters. The fl ow meters
will provide accurate discharge volumes used to calculate
the total maximum daily loads (TMDL) required in the new
permit.
As placement facilities reach capacity, innovative reuse
of dredged material gains importance. Cox Creek is a
potential future home for innovative reuse activities for
MPA.
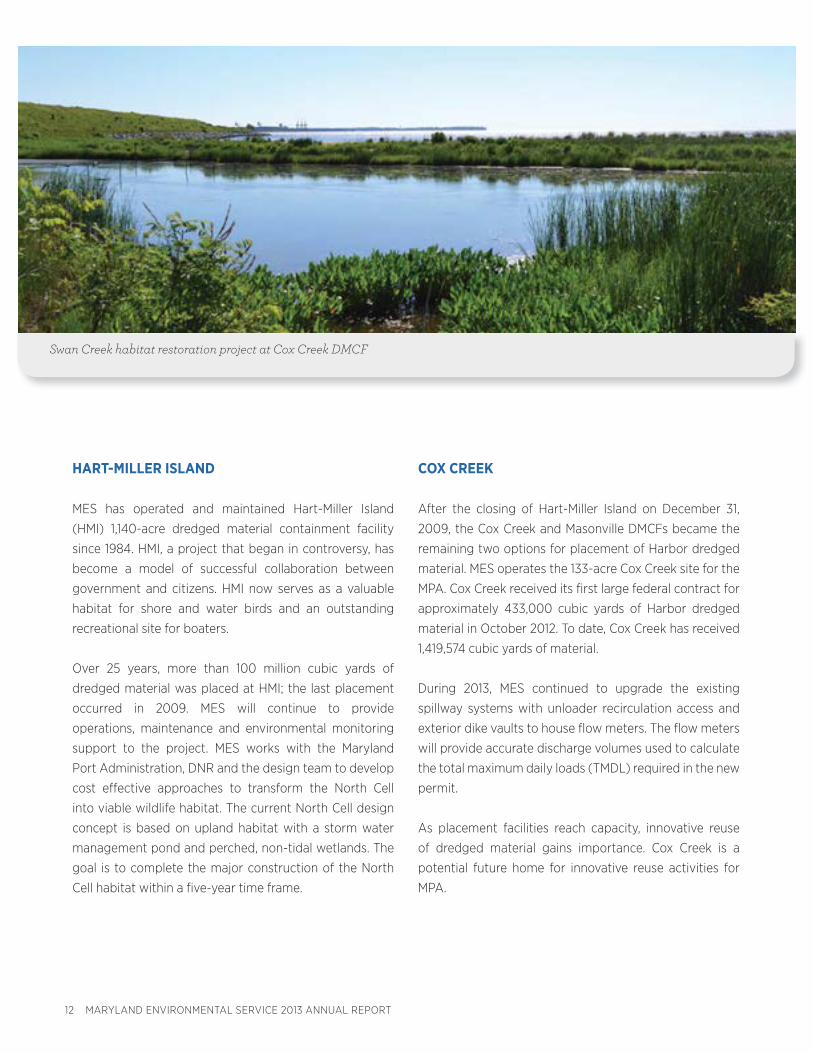
Swan Creek habitat restoration project at Cox Creek DMCF
MARYLAND ENVIRONMENTAL SERVICE 2013 ANNUAL REPORT 13
MES also manages the Swan Creek wetlands adjacent to
Cox Creek. This wetland is an 11.13-acre habitat restoration
project that includes vegetated wetlands, shallow water
and a special cobble riffl e for fi sh passage. This restored
area has become an urban habitat for wildlife, including
ibis, heron, eagles and waterfowl. Submerged aquatic
vegetation has colonized the area and increased fi sh
diversity has also been found in the area where MES
installed 143 reef balls, an artifi cial marine habitat built
from concrete.
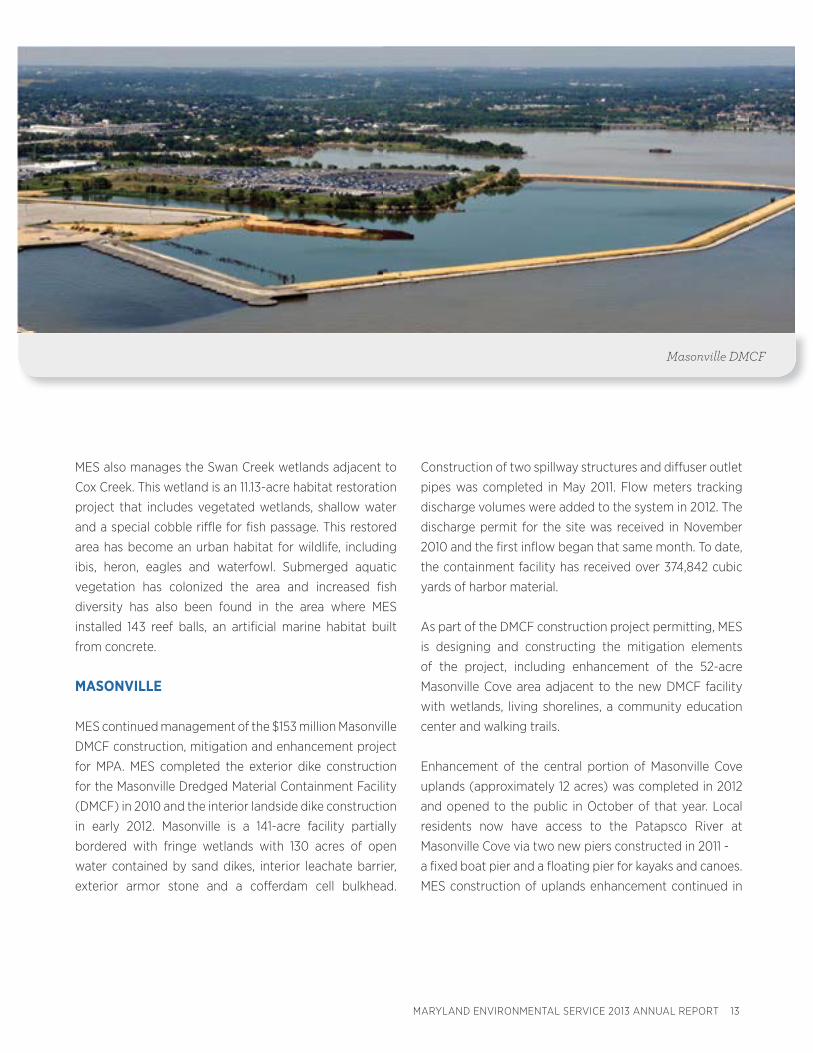
MASONVILLE
MES continued management of the $153 million Masonville
DMCF construction, mitigation and enhancement project
for MPA. MES completed the exterior dike construction
for the Masonville Dredged Material Containment Facility
(DMCF) in 2010 and the interior landside dike construction
in early 2012. Masonville is a 141-acre facility partially
bordered with fringe wetlands with 130 acres of open
water contained by sand dikes, interior leachate barrier,
exterior armor stone and a coff erdam cell bulkhead.
Construction of two spillway structures and diff user outlet
pipes was completed in May 2011. Flow meters tracking
discharge volumes were added to the system in 2012. The
discharge permit for the site was received in November
2010 and the fi rst infl ow began that same month. To date,
the containment facility has received over 374,842 cubic
yards of harbor material.
As part of the DMCF construction project permitting, MES
is designing and constructing the mitigation elements
of the project, including enhancement of the 52-acre
Masonville Cove area adjacent to the new DMCF facility
with wetlands, living shorelines, a community education
center and walking trails.
Enhancement of the central portion of Masonville Cove
uplands (approximately 12 acres) was completed in 2012
and opened to the public in October of that year. Local
residents now have access to the Patapsco River at
Masonville Cove via two new piers constructed in 2011 -
a fi xed boat pier and a fl oating pier for kayaks and canoes.
MES construction of uplands enhancement continued in
Masonville DMCF
14 MARYLAND ENVIRONMENTAL SERVICE 2013 ANNUAL REPORT
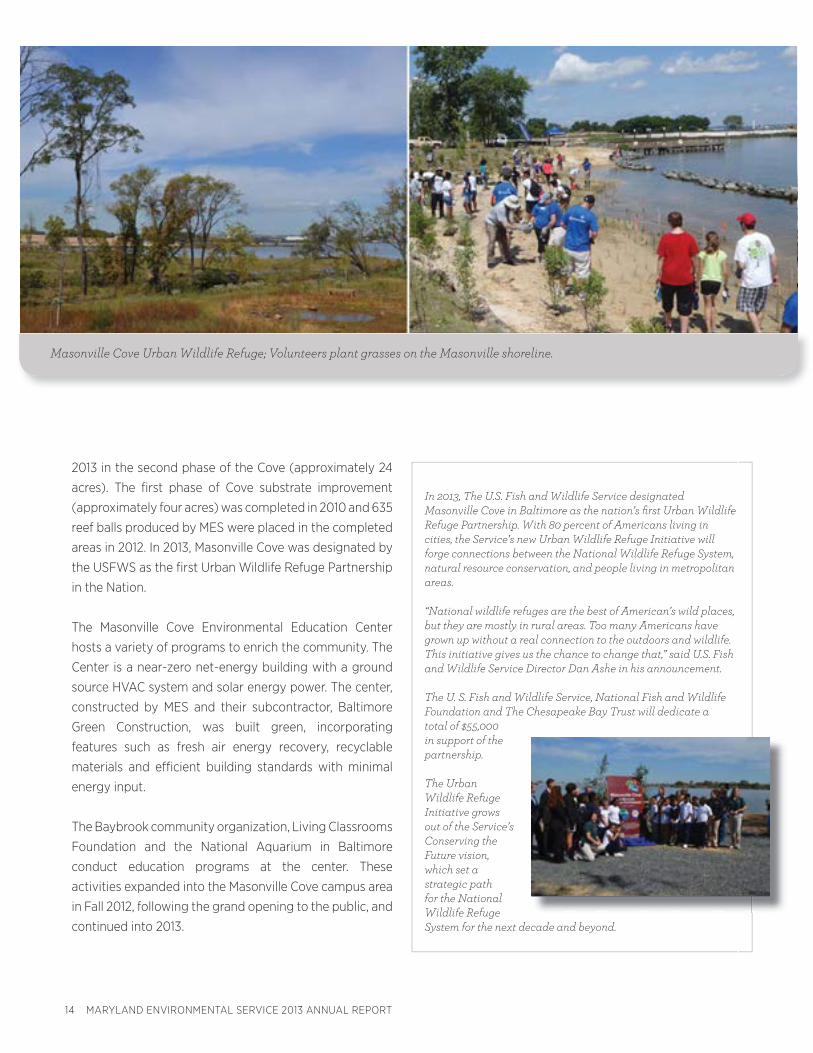
2013 in the second phase of the Cove (approximately 24
acres). The fi rst phase of Cove substrate improvement
(approximately four acres) was completed in 2010 and 635
reef balls produced by MES were placed in the completed
areas in 2012. In 2013, Masonville Cove was designated by
the USFWS as the fi rst Urban Wildlife Refuge Partnership
in the Nation.
The Masonville Cove Environmental Education Center
hosts a variety of programs to enrich the community. The
Center is a near-zero net-energy building with a ground
source HVAC system and solar energy power. The center,
constructed by MES and their subcontractor, Baltimore
Green Construction, was built green, incorporating
features such as fresh air energy recovery, recyclable
materials and effi cient building standards with minimal
energy input.
The Baybrook community organization, Living Classrooms
Foundation and the National Aquarium in Baltimore
conduct education programs at the center. These
activities expanded into the Masonville Cove campus area
in Fall 2012, following the grand opening to the public, and
continued into 2013.
Masonville Cove Urban Wildlife Refuge; Volunteers plant grasses on the Masonville shoreline.
In 2013, The U.S. Fish and Wildlife Service designated Masonville Cove in Baltimore as the nation’s fi rst Urban Wildlife Refuge Partnership. With 80 percent of Americans living in cities, the Service’s new Urban Wildlife Refuge Initiative will forge connections between the National Wildlife Refuge System, natural resource conservation, and people living in metropolitan areas.
“National wildlife refuges are the best of American’s wild places, but they are mostly in rural areas. Too many Americans have grown up without a real connection to the outdoors and wildlife. This initiative gives us the chance to change that,” said U.S. Fish and Wildlife Service Director Dan Ashe in his announcement.
The U. S. Fish and Wildlife Service, National Fish and Wildlife Foundation and The Chesapeake Bay Trust will dedicate a total of $55,000 in support of the partnership.
The Urban Wildlife Refuge Initiative grows out of the Service’s Conserving the Future vision, which set a strategic path for the National Wildlife Refuge System for the next decade and beyond.
MARYLAND ENVIRONMENTAL SERVICE 2013 ANNUAL REPORT 15
HARBOR TEAM
MPA has asked MES to continue working with
stakeholder groups on the future dredged material
placement options that were identifi ed in the 2011
Harbor Team Report. In accordance with the Harbor
Team Report, MES is assisting the MPA with the initial
feasibility level studies on an expanded dredged
material containment facility at the existing Cox Creek
DMCF.
DASHBOARD
MES works with MPA Harbor Development to improve
the ProjectWise fi le management system that
streamlines document sharing within MPA and allows
MES to send document updates directly to the Harbor
Development fi le sharing site. In addition, MES has
completed an Executive Dashboard that assists with
the communication of high level project status and
budget information within MPA. MES works to enhance
the Dashboard and will be updating the map viewer
application and creating virtual tours of the Dredged
Material Containment Facilities.
DNR FISHERIES MANAGEMENT
MES has provided technical and administrative support
to the Maryland Department of Natural Resources
(DNR) in several service areas over the last 40 years.
In 2013, MES assisted DNR Fisheries Service by
providing technical support for the expanded Maryland
Aquaculture Program. In addition, MES provides
employees to support DNR programs. MES has also
developed proposals to provide technical support to
the Oyster Restoration Program and the Commercial
Fisheries Electronic Reporting Program.
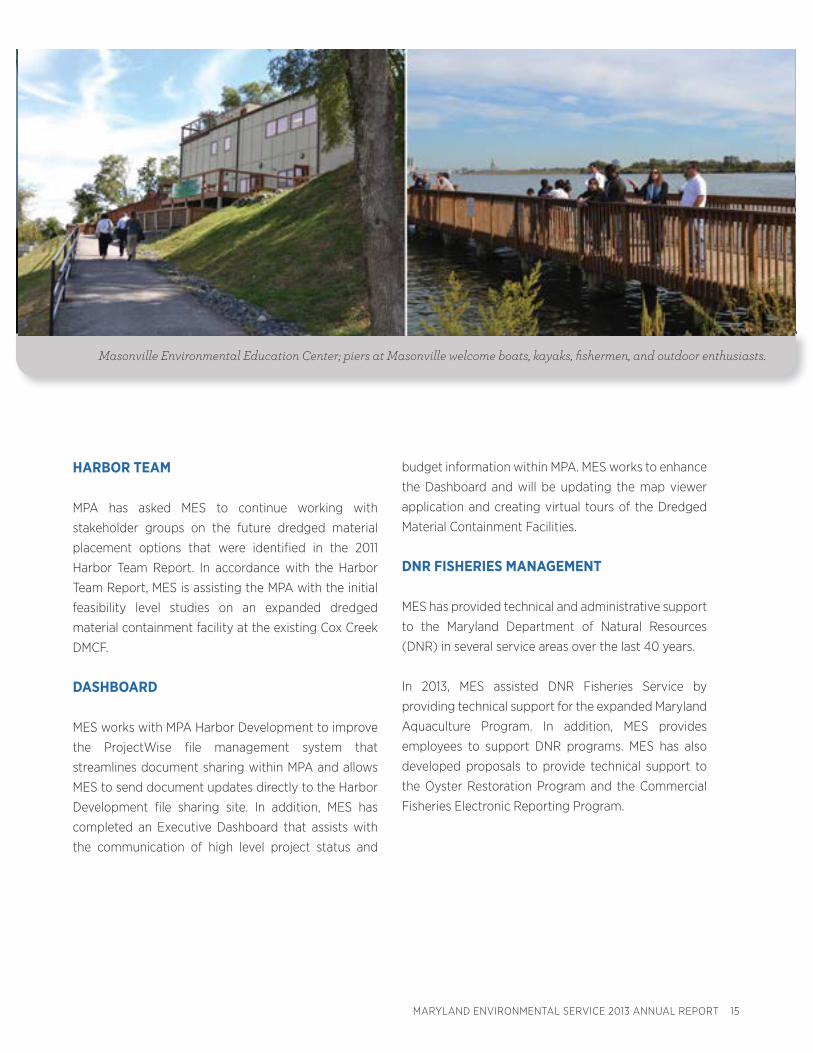
Masonville Environmental Education Center; piers at Masonville welcome boats, kayaks, fi shermen, and outdoor enthusiasts.
16 MARYLAND ENVIRONMENTAL SERVICE 2013 ANNUAL REPORT
HAWKINS POINT HAZARDOUS WASTE LANDFILL
MES operates and manages the Hawkins Point Hazardous
Waste Landfi ll, a long-standing project with the Maryland
Port Administration and Honeywell. Services include:
routine post-closure care, leachate management and
leachate disposal in accordance with the EPA RCRA
Corrective Action Permit and MDE Controlled Hazardous
Substance (CHS) permits. Both permits were successfully
obtained in 2013. MES also provides routine groundwater
monitoring as directed by our CHS permit, report writing
and regulatory coordination with EPA and MDE.
DUNDALK MARINE TERMINAL
MES operates and maintains the groundwater treatment
plant at Dundalk Marine Terminal (DMT) for the
Maryland Port Administration; manages all hazardous
and non-hazardous waste associated with the chromium
contamination at DMT; and provides sampling and report
writing services for the NPDES permit.
ENVIRONMENTAL MANAGEMENT SYSTEM
SERVICES
MES has assisted MPA with their Environmental
Management Plan (EMS), including ISO 14001 certifi cation,
since 2007 by providing on-site staff to implement
and maintain the MPA EMS and assist with regulatory
compliance. Our services include asbestos management,
industrial hygiene support, assistance with MPA air quality
initiatives, stormwater pollution prevention inspections
and reporting and TMDL planning and implementation
assistance.
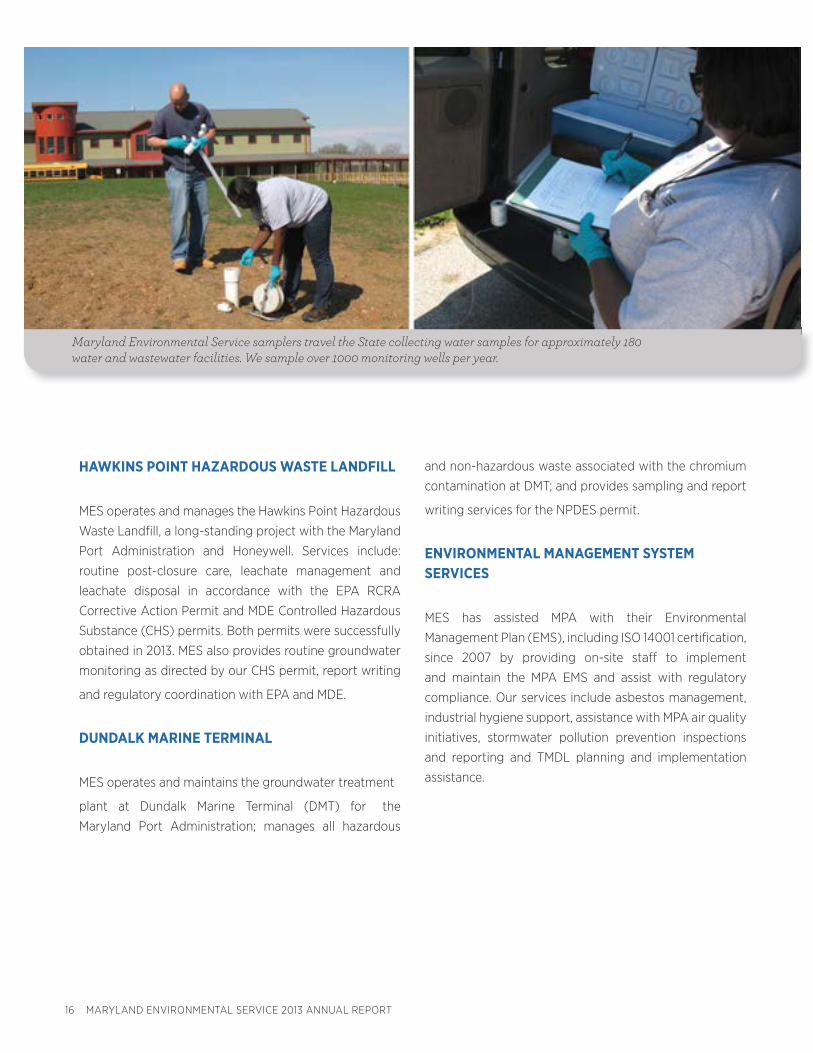
Maryland Environmental Service samplers travel the State collecting water samples for approximately 180 water and wastewater facilities. We sample over 1000 monitoring wells per year.
MARYLAND ENVIRONMENTAL SERVICE 2013 ANNUAL REPORT 17
ENVIRONMENTAL MONITORING
Expert environmental monitoring protects our air,
land and water. It also ensures our clients comply with
complicated regulations and avoid costly violations.
The TES Environmental Monitoring Division conducts
comprehensive program management of environmental
inspections; sampling and reporting; facility and system
operations and maintenance; strategic planning and
remediation services to preserve these resources for the
residents of Maryland. Division services include:
• Stormwater Inspections, Maintenance & Reporting
• Airport Operations & Maintenance Support
• Facility, Structure & Equipment Inspections &
Maintenance
• Lead and Asbestos Abatement
• Energy Audits
• Environmental Audits
• Laboratory Analysis
• Sample Collection
• NPDES Compliance Reporting
• Website & Application Development
• GIS Services
• Regulatory Liaison
• Monitoring Services
• Public Outreach and Environmental Training
• NEPA Compliance and Environmental Planning
• Geotechnical Investigation
BALTIMORE/WASHINGTON INTERNATIONAL
THURGOOD MARSHALL AIRPORT
MES provides the Maryland Aviation Administration with
around the clock coverage and emergency response at
BWI Thurgood Marshall Airport and Martin State Airport.
Our employees help keep both airports operational on a
daily basis, including weather and other emergencies.
MES collects glycol runoff and maintains the airport’s
deicing fl uid collection system. Through its collection and
processing of the de-icing fl uids during the winter months,
MES has signifi cantly reduced the amount of de-icing
material reaching streams near BWI. MES collects stream
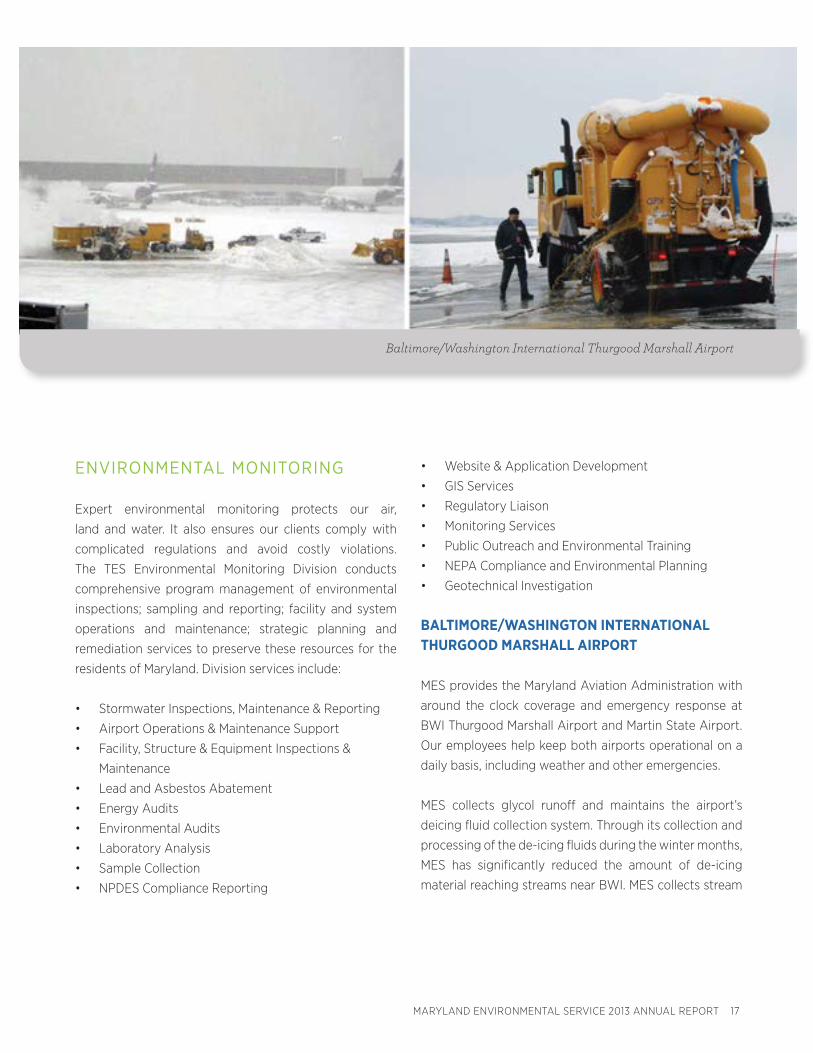
Baltimore/Washington International Thurgood Marshall Airport
18 MARYLAND ENVIRONMENTAL SERVICE 2013 ANNUAL REPORT
samples continuously during the de-icing season to
ensure Maryland Aviation Administration environmental
compliance.
MES employees also inspect and maintain water,
wastewater and stormwater systems at both BWI and
Martin State Airport.
DEPARTMENT OF TRANSPORTATION (MDOT)
MODALS
MES provides comprehensive program management,
technical and scientifi c consulting and fi eld-based
services to many MDOT Modals. Services include
environmental spill/leak investigations, sampling,
compliance assistance, remediation, NPDES and TMDL
assistance, maintenance, underground storage tank
removal and inspections, above-ground storage tank
installations, fueling facility upgrades, asbestos and lead
paint monitoring, large stormwater programs, invasive
species control, oil/water separator inspection and
maintenance and environmental management system
development.
As part of its services to the MDOT Modals, MES is
developing and administering an expanding environmental
program with SHA’s Offi ce of Environmental Design.
The Service has assisted multiple SHA Divisional Offi ces
with compliance, organization and expansion of its
environmental programs since 2003.
MES supports SHA with a variety of new services that
include Chesapeake Bay Total Maximum Daily Load
(TMDL) Implementation, Stormwater Management Pond
Sediment Sampling and Stormwater Management Pond
Boring Installation, IDDE Sampling & Investigations,
Geotechnical Assessments and Geophysical Assessments.
MES continues to perform stormwater inspection and
maintenance services at MDOT, MAA, MVA and MDTA
Facilities across the State. The required maintenance
ranges from vegetation control and grading to the
installation of required stormwater structures.
MES actively supports the extensive stormwater
programs for each agency, providing services ranging
from inspections and the creation of Best Management
Practices (BMPs) to rehabilitation, traffi c control and
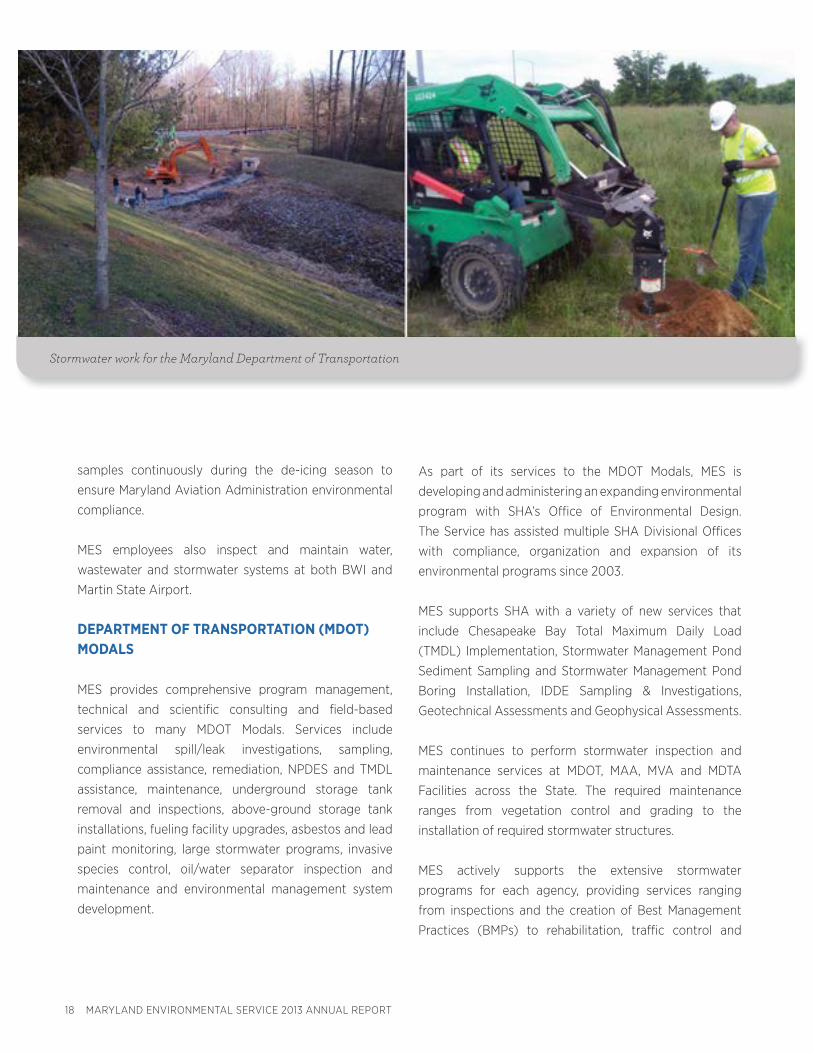
Stormwater work for the Maryland Department of Transportation
MARYLAND ENVIRONMENTAL SERVICE 2013 ANNUAL REPORT 19
corrective actions. MES has also created stormwater
inventory maps of several State Agency Facilities using
GIS technology.
By acquiring additional training and certifi cation,
Environmental Monitoring staff are expanding MES
services available to the Maryland Department of
Transportation. MES employees attended Sub-Surface
Investigation (SSI) Certifi cation training in 2013. Taught
by instructors approved by the National Highway
Institute (NHI), the course is intended for drillers, drilling
inspectors, engineers, geologists and technicians
involved in fi eld data collection and quality assurance of
subsurface investigations.
The course follows Federal Highway Administration
(FHWA) guidelines and practices for subsurface
investigations and many states now require this
qualifi cation to work on U.S. Department of
Transportation (DOT) projects. A partial list of topics
addressed in the course include exploration equipment
and methods; safety; borehole sealing; drilling and
sampling requirements and criteria; proper soil and
rock visual classifi cation and descriptions; common
drilling errors; and dealing with diffi cult subsurface site
conditions. A two-hour qualifi cation exam is administered
at the end of the course. All eight MES employees passed
the course and are now NHI Certifi ed.
In 2013, MES began providing afull time on-site
Sustainability Planner for the Maryland Transit
Administration (MTA) - responsible for coordinating
bicycle, pedestrian and electric vehicle charging planning
eff orts. MES also provides part-time GIS services and a
full time architectural historian at MTA headquarters. In
addition, we will be providing full time on-site National
Environmental Policy Act (NEPA) services and a Park-and-
Ride specialist to MTA.
WORK WITH MEMA
The Maryland Emergency Management Agency ensures
Maryland families, communities and key Agencies have the
tools they need to prepare for, mitigate against, respond
to and recover from the consequences of emergency and
disaster events. In 2013, MES began working with MEMA,
providing procurement assistance and on-site project
management for their State Emergency Operations
Center (SEOC) Renovation project. In addition, MES GIS
staff provide a variety of technical and consulting services
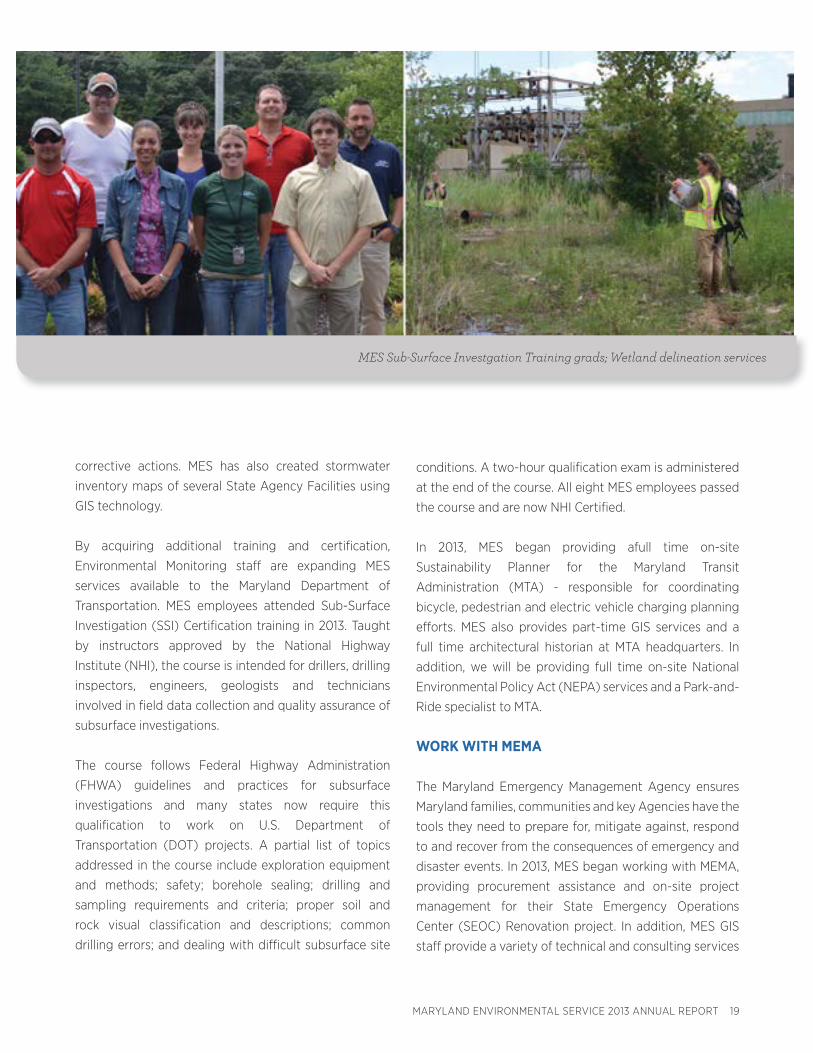
MES Sub-Surface Investgation Training grads; Wetland delineation services
20 MARYLAND ENVIRONMENTAL SERVICE 2013 ANNUAL REPORT
as directed by MEMA, including the facilitation of grant
application submissions, development of an online
grant management system, conducting preliminary
damage assessments, development of a Maryland fl ood
forecasting system and GPS mapping for repetitive fl ood
loss.
RENEWABLE ENERGY PROGRAM
MES helps with a full range of energy services including
energy audits, feasibility studies, energy use footprint
analyses, technology assessments and the design,
installation and operation of wind energy, solar,
geothermal and biomass processes.
MES is the lead State agency for the construction of an
anaerobic digester on Maryland’s Eastern Shore that will
provide much needed renewable power and remove
excess nutrients from the Chesapeake Bay watershed.
The digester will be located on property owned by the
Maryland Department of Public Safety and Correctional
Services.
We are helping State agencies explore options for
expanding renewable energy use, including conducting a
renewable energy assessment at Maryland Transportation
Authority locations statewide. Other energy projects
include a solar feasibility assessment for the City of Bowie
and managing the Residential Anemometer Program for
the Maryland Energy Administration. The anemometer
program requires installation of wind gauges and analysis
of data to determine feasibility for homeowners to install
wind turbines on their property. In Harford County, MES is
working with the Agricultural Co-op to install and monitor
anemometers on area farms
GEOGRAPHIC INFORMATION SYSTEM (GIS)
SERVICES
MES services help the State government effi ciently
organize, plan and implement multi-agency environmental
eff orts. State Stat, MD iMap and the Government
Environmental Footprint Initiative have used MES GIS to
help Agencies to interact with each other and the public.
With continually expanding capabilities and technological
improvements, including enhanced data collection and
data sharing services (particularly between agencies),
interactive mapping and customized reporting, MES is
a leading resource in Maryland for GIS and application
development.
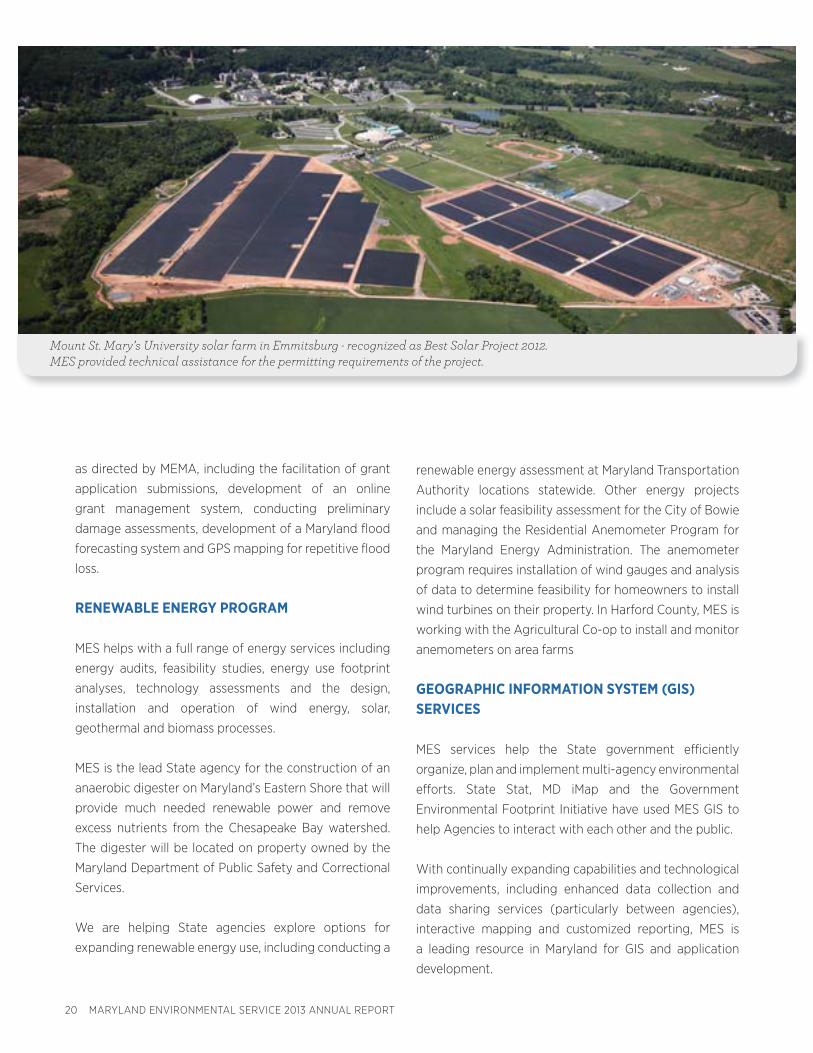
Mount St. Mary’s University solar farm in Emmitsburg - recognized as Best Solar Project 2012. MES provided technical assistance for the permitting requirements of the project.
MARYLAND ENVIRONMENTAL SERVICE 2013 ANNUAL REPORT 21
MES GIS provides important data support to: Maryland
Aviation Administration, Maryland Department of the
Environment, Maryland Port Administration, State
Highway Administration, Motor Vehicle Administration,
Maryland Energy Administration, Department of Natural
Resources, Department of Business and Economic
Development and the Governor’s Offi ce.
MES is currently working with the Maryland Department
of the Environment to improve National Pollutant
Discharge and Elimination System (NPDES) reporting
and data submission processes. This eff ort will help
MDE assess MS4 permit compliance, better model Total
Maximum Daily Loads (TMDLs) and monitor Chesapeake
Bay Program progress and stormwater Wasteload
Allocations (WLAs).
As a part of this project, MES is helping MDE develop
a new GIS-based submittal process that includes: new
geodatabase design, tools to assist permit holders with
data submission and review, as well as tools to assist
MDE with reporting and data management. This project
will enable MDE to seamlessly integrate the NPDES
Annual Report and associated information into a single,
comprehensive data format. This project is estimated to
be completed by March 2014.
The Watershed Resources Registry (WRR) was created
to streamline information collection and preparation for
permit processes, prioritize watershed needs and help
stakeholders use limited resources to achieve multiple
environmental goals. Currently, there are eight diff erent
types of Restoration and Preservation GIS-based data
layers that were created to target Stormwater, Wetland,
Upland and Riparian mitigation opportunities.
MES worked closely with members of the WRR Technical
Advisory Committee, which is comprised of various
federal, State and local partners, to provide a suite of
services, including: analytic analyses, modeling, data qa/
qc, website development, GIS-based web application
development, hosting, training and outreach support.
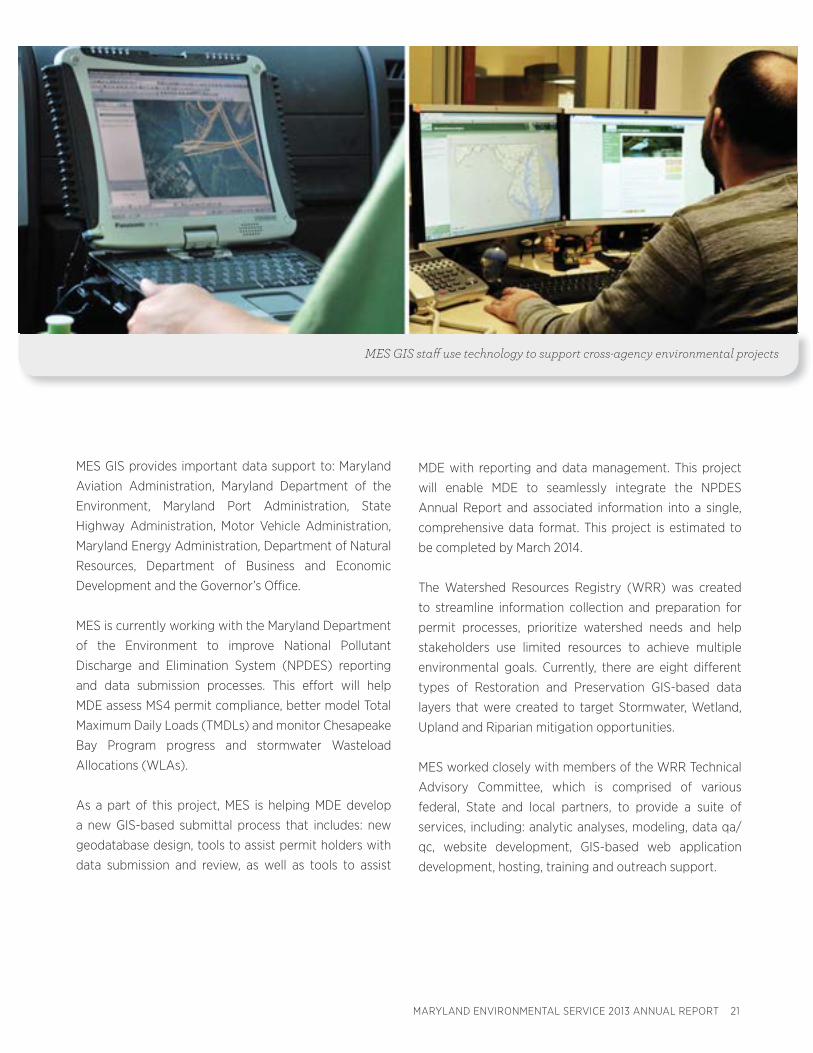
MES GIS staff use technology to support cross-agency environmental projects
22 MARYLAND ENVIRONMENTAL SERVICE 2013 ANNUAL REPORT
REGULATORY & PERMIT OVERSIGHT
MES helps clients meet all of their environmental
regulatory requirements. MES assists MDOT, MAA,
MVA, MDTA and SHA remain in compliance with their
respective NPDES or Municipal Separate Storm Sewer
System (MS4) General Permit through permit review and
program development/implementation. In addition, MES
performs fi eld inspections, monitoring, operations and
maintenance and provides regulatory reporting to MDE.
MES STORMWATER SERVICES
With over 150 stormwater specialists on staff , MES
routinely provides stormwater and TMDL technical
services across the State.
MES off ers life-cycle stormwater expertise including:
• BMP assessment and planning,
• stormwater BMP inspection,
• wet-weather compliance sampling,
• laboratory analysis and compliance reporting,
• BMP installation,
• sediment removal and erosion control preventative
maintenance and
• customized compliance and inspection tracking
applications.
MES also prepares Stormwater Pollution Prevention
Plans (SWPPP) , Spill Prevention, Control, and
Countermeasures Plans (SPCC) and performs quarterly
and annual stormwater inspections for numerous State
and privately-owned wastewater treatment plants. MES
personnel are certifi ed by both Maryland Department of
the Environment and the State Highway Administration in
Sediment and Erosion Control (Green and Yellow Cards).
MES maintains compliance and legal staff well versed in
TMDL and NPDES compliance and determining impacts
resulting from upcoming regulatory changes.
MES staff work on-site at MDE to assist in permit review
and provide support to the permit writers. MES staff are
currently developing the process and application for MDE
for submittal of the MS4 annual reports required by new
regulatory requirements.
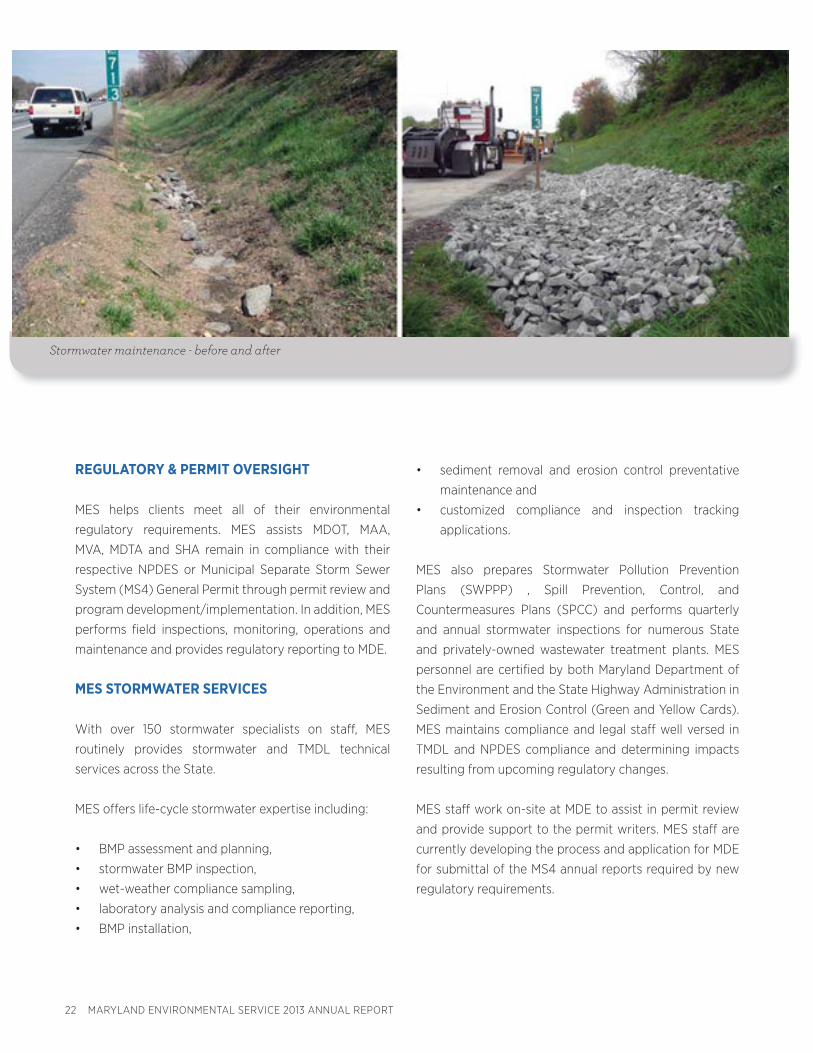
Stormwater maintenance - before and after

MARYLAND ENVIRONMENTAL SERVICE 2013 ANNUAL REPORT 23
Students visit archaeological digs in New Market. MES staff oversee archeological sites, often a critical element of environmental permitting, on behalf of the State Highway Administration.
24 MARYLAND ENVIRONMENTAL SERVICE 2013 ANNUAL REPORT
WATER AND WASTEWATER
At parks, hospitals, prisons and other institutions, MES
serves as the water and wastewater operator for the
State of Maryland. We operate and maintain 138 private,
municipal and county plants; several shared-use facilities,
as well as 88 state-owned plants at correctional facilities,
health facilities, rest areas and State parks. Throughout
the State, we provide service 24/7 to correct treatment
plant problems.
In parts of Maryland located outside of incorporated
areas served by public water and sewer, MES provides
high quality drinking water and wastewater treatment to
protect the public health and the environment. We use
our resources to work with local health departments,
school systems, developers and homeowner associations
to insure that small-scale treatment systems meet the
most current treatment and regulatory requirements and
that they are staff ed by qualifi ed licensed operators.
With years of experience in the operation of all types of
facilities, we understand the administrative and technical
requirements necessary to provide a safe water supply
and keep wastewater discharge meeting federal and
State requirements.
ENHANCED NUTRIENT REMOVAL UPGRADES
To reduce nitrogen and phosphorus loadings to the
Chesapeake Bay, MES is managing upgrades to several
wastewater treatment plants to attain an Enhanced
Nutrient Removal level of treatment.
At this time the following facilities are either in the design
or construction phase:
• Freedom District WWTP in Carroll County – under
design with construction to start in July 2014;
• Maryland Correctional Institution WWTP in
Hagerstown – under design with construction to start
in 2015;
• Eastern Correctional Institution WWTP in Somerset
County - Design is scheduled to start in November
2013. This project consists of an upgrade that will
meet an extremely stringent discharge permit
that goes beyond ENR levels of treatment and
provides additional treatment capacity and process
redundancy. The upgrade will also provide a system
to treat the water plant’s reverse osmosis reject water;
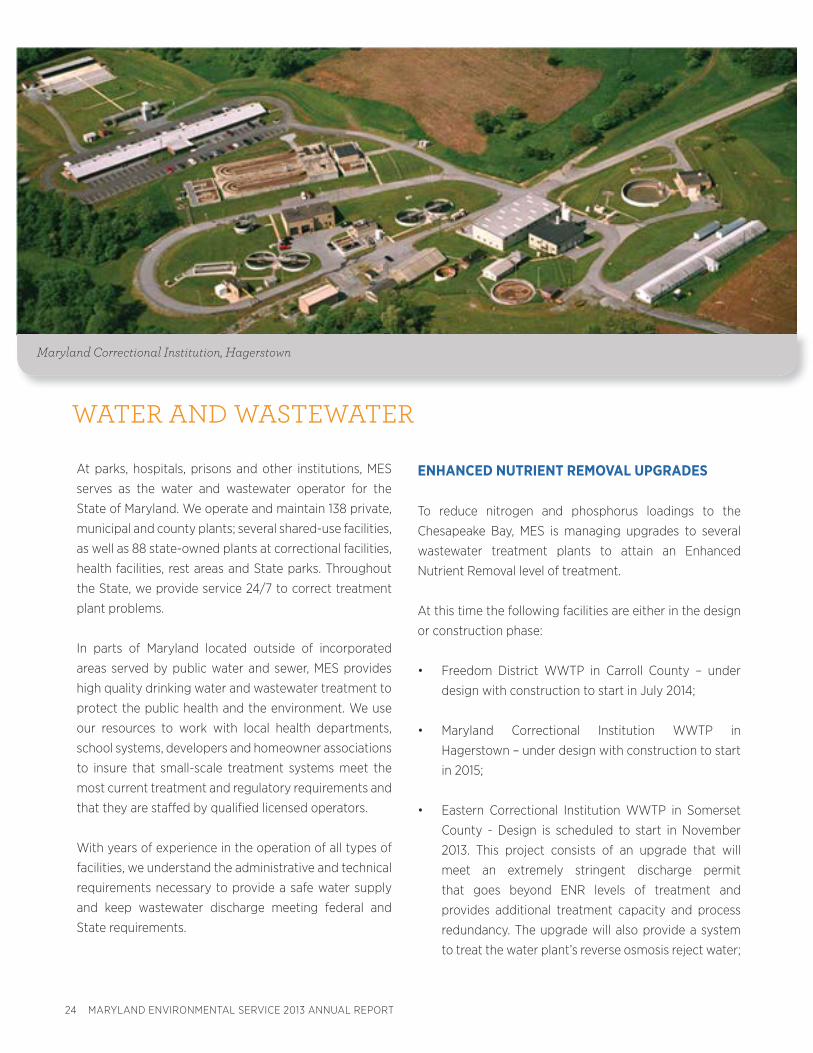
Maryland Correctional Institution, Hagerstown
MARYLAND ENVIRONMENTAL SERVICE 2013 ANNUAL REPORT 25
• Dorsey Run WWTP – This plant is over 25 years old
and was essentially designed to meet a BNR level of
treatment. However, due to its age, a project was just
completed that provided equipment replacement
and/or renovation and electrical and control system
upgrades. Since the completion of that project, and in
coordination with funding from MDE, an engineering
fi rm was hired to evaluate possible treatment system
enhancements that could be made to the plant to
make it even more effi cient and fully capable of
meeting or exceeding an ENR level of treatment.
The ENR upgrades will allow the plant to more
reliably discharge treated wastewater with nitrogen
concentrations of less than 3.0 mg/l and total
phosphorus concentrations of less than 0.3 mg/l.
INFLOW AND INFILTRATION EVALUATIONS
Several years ago, the Maryland Department of the
Environment recognized that Infl ow and Infi ltration (I/I)
in sewer systems were causing WWTP compliance and
performance problems. In many instances the I/I was
signifi cant enough to reduce plant treatment capacity and
prevent additional connections, thereby jeopardizing the
fulfi llment of smart growth initiatives and the utilization of
existing infrastructure. MDE asked MES to investigate and
determine the extent of I/I throughout the State.
The fi rst phase of the project consisted of analyzing fl ow
records and other data from 45 systems, which provided a
broad-brush determination of the extent of I/I in Maryland.
Upon completion of this work, MES performed in-depth
fi eld studies of small, medium and large municipal sewer
systems. The purpose of the in-depth evaluations was
to more accurately quantify the amount of I/I, identify
the sources of I/I and determine the costs to make
system improvements and repairs to reduce the amount
of I/I. A total of fi ve systems were evaluated - Cecilton,
Chestertown, Thurmont, Aberdeen, and Havre de Grace.
The in-depth evaluations consisted of the following
elements:
• Review Results from Any Prior I/I Studies
• Analyze Monthly Operating Records (MORs)
• Gather System As-Built or Construction Drawings
• Inventory, Inspect, and Map System
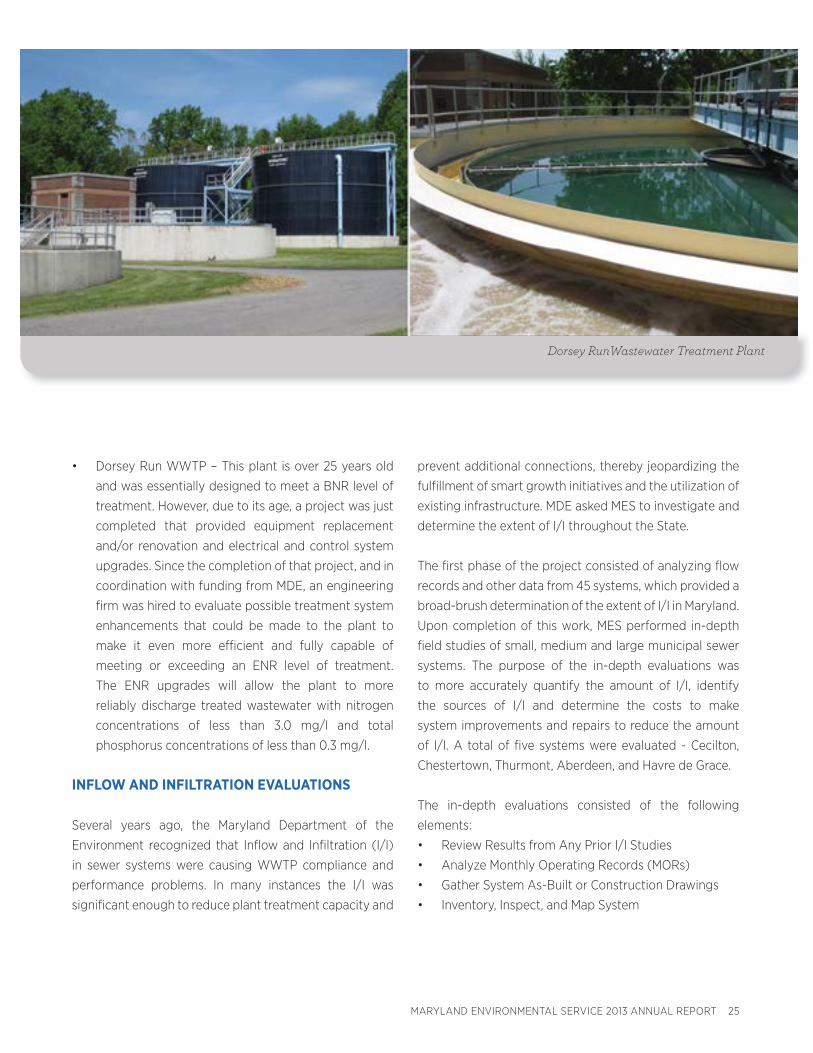
Dorsey RunWastewater Treatment Plant
26 MARYLAND ENVIRONMENTAL SERVICE 2013 ANNUAL REPORT
• Develop a GIS Map of System Components
• Perform Flow Monitoring
• Smoke Test the System
• Perform Closed Circuit Television (CCTV) Inspection
• Prepare Cost Estimates for Needed Corrective Actions
and System Improvements
• Develop Capital Improvement Plan
Individual reports were prepared for each of the fi ve
systems evaluated and submitted to MDE. The reports were
also given to the municipalities so they can implement the
Capital Improvement Plan and make the needed repairs
and improvements to reduce their I/I.
In 2012, after completing the fi ve system investigations, a
fi nal project report was prepared which contained each of
the individual system reports along with a summary of the
fi ndings and how the results are extrapolated statewide.
The following is a list of some of the notable fi ndings:
• The average daily amount of I/I ranged from 18
percent to 28 percent of the system’s average daily
fl ow with an average of 22 percent. Daily and hourly
peak amounts of I/I were much higher and as much as
four times the average daily fl ow.
• The average daily fl ow per equivalent dwelling unit
(EDU) was 310 gal/day/EDU. After adjusting this value
to remove the I/I portion, the value becomes 241 gal/
day. The adjusted number is similar to MDE’s planning
number of 250 gal/day/EDU.
• The estimated costs to correct defects and make other
improvements to reduce I/I fl ows for the systems
ranged from $400,000 to $24 million.
• Extrapolating these costs to the 45 systems that were
evaluated in Phase I gives a total cost of $800 million.
Although this cost is high, it does not include the other
100+ systems in Maryland that were not included in
Phase I, along with the large collection systems in the
City of Baltimore, suburban Washington, DC and the
other large county systems.
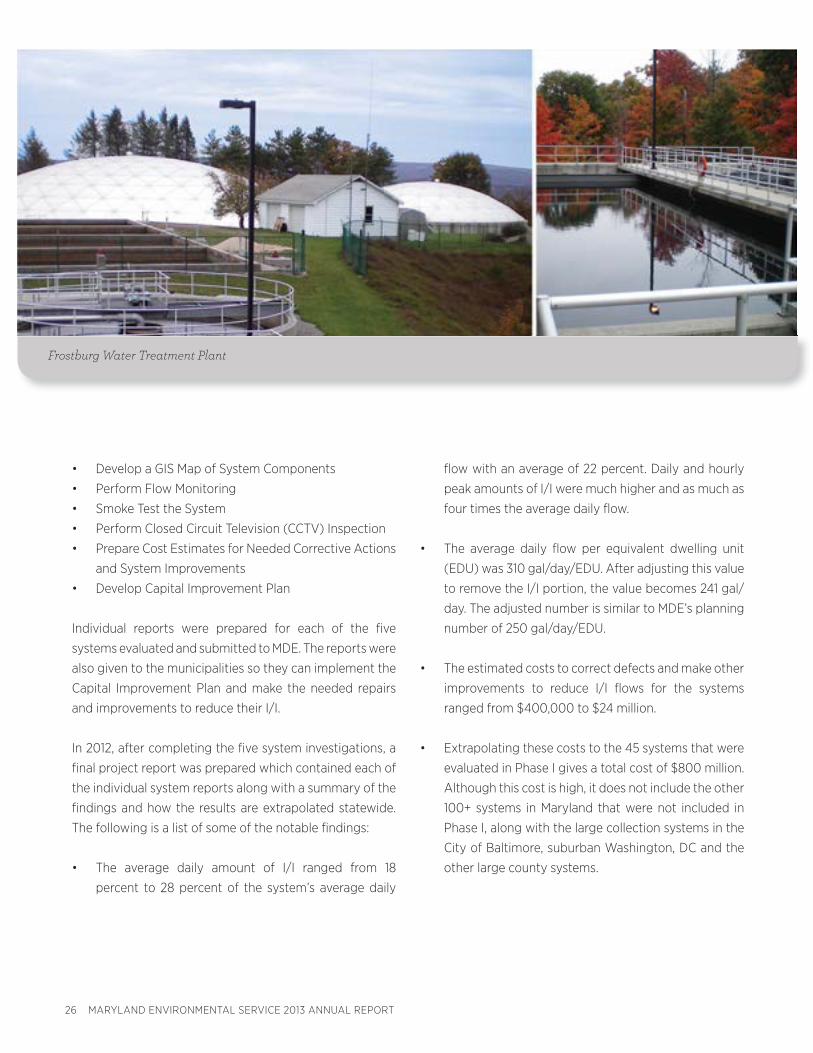
Frostburg Water Treatment Plant

MARYLAND ENVIRONMENTAL SERVICE 2013 ANNUAL REPORT 27
The results of the study show that I/I is a problem plaguing
all systems and will only get worse as the sewer lines age.
Additionally, the need to address I/I is becoming even
more critical as more sophisticated Enhanced Nutrient
Removal (ENR) WWTP treatment processes are used,
which are more susceptible to upsets from high I/I fl ows.
BIOSOLIDS MANAGEMENT
MES Water/Wastewater staff provides technical assistance
and expertise in the area of biosolids management for a
number of municipalities in the State and the DC Water
Blue Plains Wastewater Treatment Plant. These services
include planning, development of nutrient management
plans, inspections, regulatory permitting and reporting
functions on a customized basis for individual wastewater
facilities.
SAVING WASTEWATER ENERGY DOLLARS
EnerNOC provides energy management services, demand
response, energy effi ciency and energy procurement
to 4,000 commercial, industrial and institutional energy
users across North America.
As a program participant, plants earn capacity payments
for being on-call to respond when demand response
events occur and earn energy payments when they
actually respond to an event.
Payments are received quarterly, even if there are no
events and the generators are not used. MES makes our
wastewater clients aware of this program and its potential
cost-savings. Perryville, Cambridge, La Plata, Frostburg
and other local government entities are now participating.
Cambridge Wastewater Treatment Plant
28 MARYLAND ENVIRONMENTAL SERVICE 2013 ANNUAL REPORT
CAPITAL IMPROVEMENT PLANS
MES prepared a comprehensive Statewide Water and
Wastewater Master Plan which lays out the needed
capital improvements for all State owned water and
wastewater treatment plants. The steps taken to prepare
the plan included reviewing each facility’s operating and
performance records, performing a condition assessment
of each facility to determine what improvements may be
needed, developing a concept plan and scope for the
identifi ed improvements, cost estimates, ranking the
individual projects and developing a comprehensive CIP
funding schedule and projection for the next fi ve to 10
years.
The CIP assessment includes not only determining
what improvements are needed due to deteriorated
infrastructure, but also anticipates what improvements
or upgrades may be needed to meet known or more
stringent regulatory requirements.
To allow ranking and prioritizing the CIP projects, MES
developed a “Project Ranking Methodology” which
consisted of assigning points based on the following
criteria:
• Compliance & Permits (e.g., permit violations,
anticipated more stringent limits, etc.)
• Health and safety
• Structural issues
• Impact on operating and maintenance costs
• Operational defi ciencies
• Energy and environment (energy savings and
environmental benefi ts)
The completed Master Plan was submitted to the State
Legislature and funding agencies to provide the basis for
appropriation of funds for the needed CIPs. The plan is
updated every fi ve years.
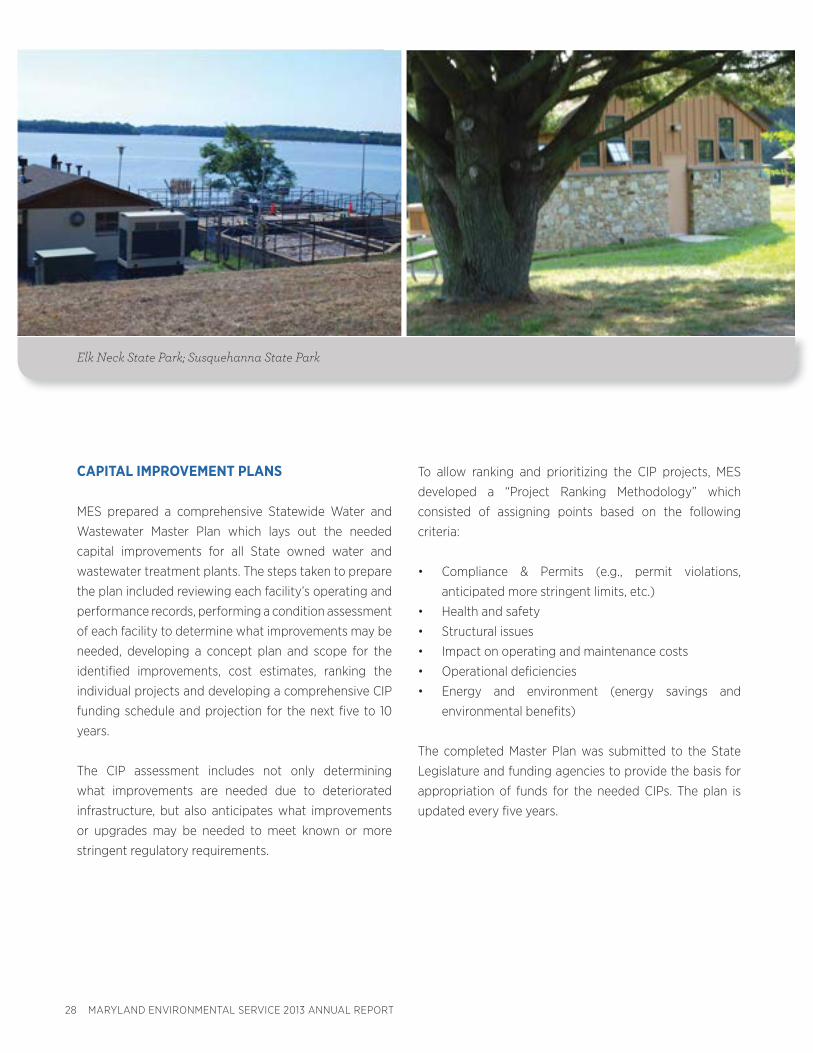
Elk Neck State Park; Susquehanna State Park
MARYLAND ENVIRONMENTAL SERVICE 2013 ANNUAL REPORT 29
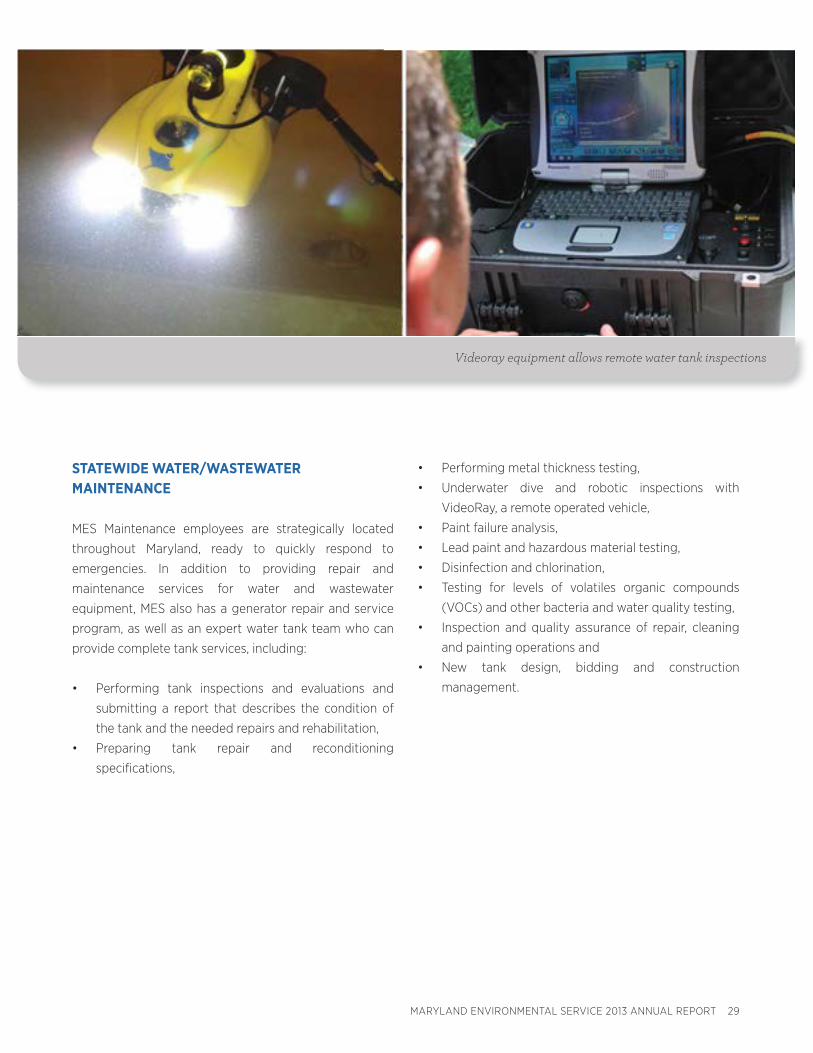
STATEWIDE WATER/WASTEWATER
MAINTENANCE
MES Maintenance employees are strategically located
throughout Maryland, ready to quickly respond to
emergencies. In addition to providing repair and
maintenance services for water and wastewater
equipment, MES also has a generator repair and service
program, as well as an expert water tank team who can
provide complete tank services, including:
• Performing tank inspections and evaluations and
submitting a report that describes the condition of
the tank and the needed repairs and rehabilitation,
• Preparing tank repair and reconditioning
specifi cations,
• Performing metal thickness testing,
• Underwater dive and robotic inspections with
VideoRay, a remote operated vehicle,
• Paint failure analysis,
• Lead paint and hazardous material testing,
• Disinfection and chlorination,
• Testing for levels of volatiles organic compounds
(VOCs) and other bacteria and water quality testing,
• Inspection and quality assurance of repair, cleaning
and painting operations and
• New tank design, bidding and construction
management.
Videoray equipment allows remote water tank inspections
30 MARYLAND ENVIRONMENTAL SERVICE 2013 ANNUAL REPORT
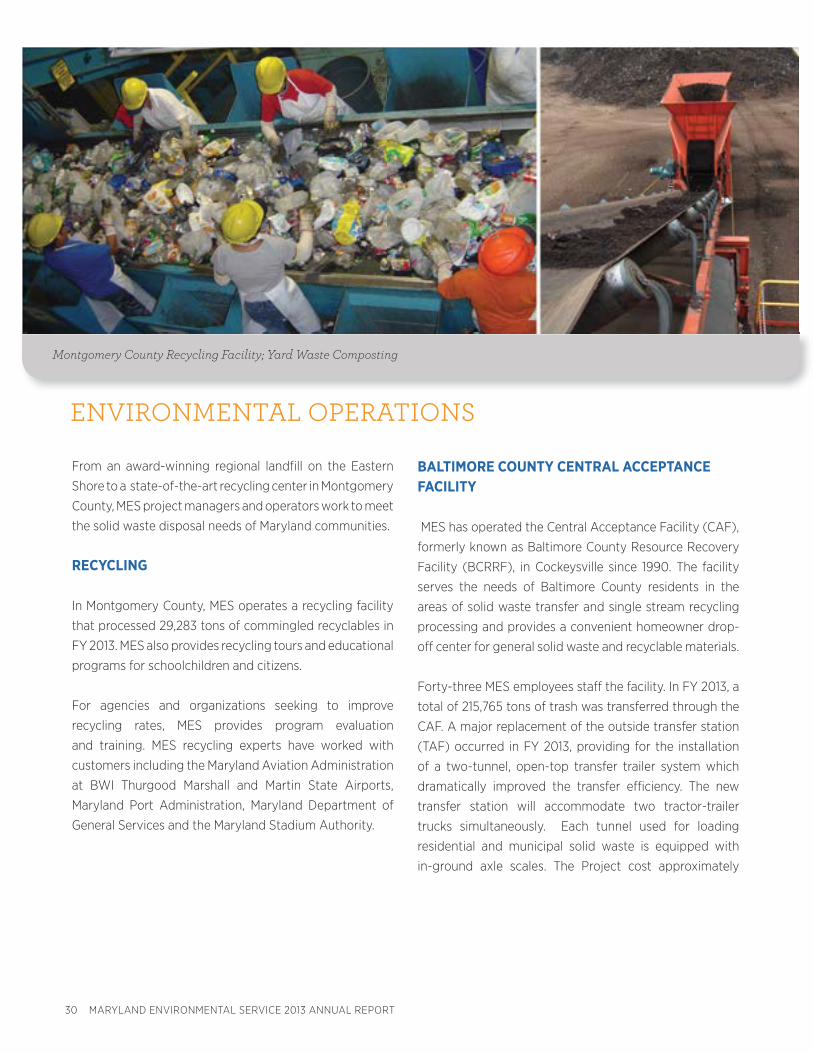
From an award-winning regional landfi ll on the Eastern
Shore to a state-of-the-art recycling center in Montgomery
County, MES project managers and operators work to meet
the solid waste disposal needs of Maryland communities.
RECYCLING
In Montgomery County, MES operates a recycling facility
that processed 29,283 tons of commingled recyclables in
FY 2013. MES also provides recycling tours and educational
programs for schoolchildren and citizens.
For agencies and organizations seeking to improve
recycling rates, MES provides program evaluation
and training. MES recycling experts have worked with
customers including the Maryland Aviation Administration
at BWI Thurgood Marshall and Martin State Airports,
Maryland Port Administration, Maryland Department of
General Services and the Maryland Stadium Authority.
BALTIMORE COUNTY CENTRAL ACCEPTANCE
FACILITY
MES has operated the Central Acceptance Facility (CAF),
formerly known as Baltimore County Resource Recovery
Facility (BCRRF), in Cockeysville since 1990. The facility
serves the needs of Baltimore County residents in the
areas of solid waste transfer and single stream recycling
processing and provides a convenient homeowner drop-
off center for general solid waste and recyclable materials.
Forty-three MES employees staff the facility. In FY 2013, a
total of 215,765 tons of trash was transferred through the
CAF. A major replacement of the outside transfer station
(TAF) occurred in FY 2013, providing for the installation
of a two-tunnel, open-top transfer trailer system which
dramatically improved the transfer effi ciency. The new
transfer station will accommodate two tractor-trailer
trucks simultaneously. Each tunnel used for loading
residential and municipal solid waste is equipped with
in-ground axle scales. The Project cost approximately
ENVIRONMENTAL OPERATIONS
Montgomery County Recycling Facility; Yard Waste Composting

MARYLAND ENVIRONMENTAL SERVICE 2013 ANNUAL REPORT 31
$8 million, with MES being responsible for the design,
construction and management of the work. The TAF
construction project was completed in June 2013.
The other major construction project at the CAF began in
the Spring of 2013 - installation of a new state-of-the-art,
single-stream recycling process designed by Bollegraaf
Technologies, within the existing CMRF building on the
site. MES provided the construction management for
this $15 million project, which was approximately 60
percent complete at the end of June 2013. The system
was completed and operational in November 2013. It
has the capacity to process 42 tons per hour of single
stream material and will handle all of Baltimore County
and Harford County’s single-stream generation, based on
a 10-hour per day, 5-day schedule.
MES will provide employees to operate the facility and
provide marketing for all recycled commodities generated
by the facility. Areas of the existing CMRF will be converted
into a warehouse/shipping facility to house the bales of
commodity material generated by the new single stream
facility awaiting shipment to various markets.
While the new facility was in construction, 40,886 tons
of single stream recyclables were transferred through the
CAF to a processing facility in Elkridge, MD.
MIDSHORE RECYCLING
MES manages the Midshore Recycling Program for
Caroline, Kent, Queen Anne’s and Talbot Counties. Since
beginning management of the program, MES has built
commodity consolidation bunkers at Midshore II Landfi ll,
optimized collection routes for maximum effi ciency,
instituted improved safety procedures, and competitively
bid the recyclable commodities. MES purchased 100
new eight-yard recycling containers to replace the aging
collection “igloos,” as well as two new front-end collection
vehicles to collect cardboard, paper, plastics and cans from
the 43 Midshore Recycling sites. This new equipment has
served to increase collection effi ciency as well as minimize
collection site issues, i.e. limited availability, with the old
igloo collection crane trucks. However, glass continues
to be collected utilizing the old igloo system and crane
trucks.
Construction of new transfer station and recycling operations at Baltimore County’s CAF
32 MARYLAND ENVIRONMENTAL SERVICE 2013 ANNUAL REPORT
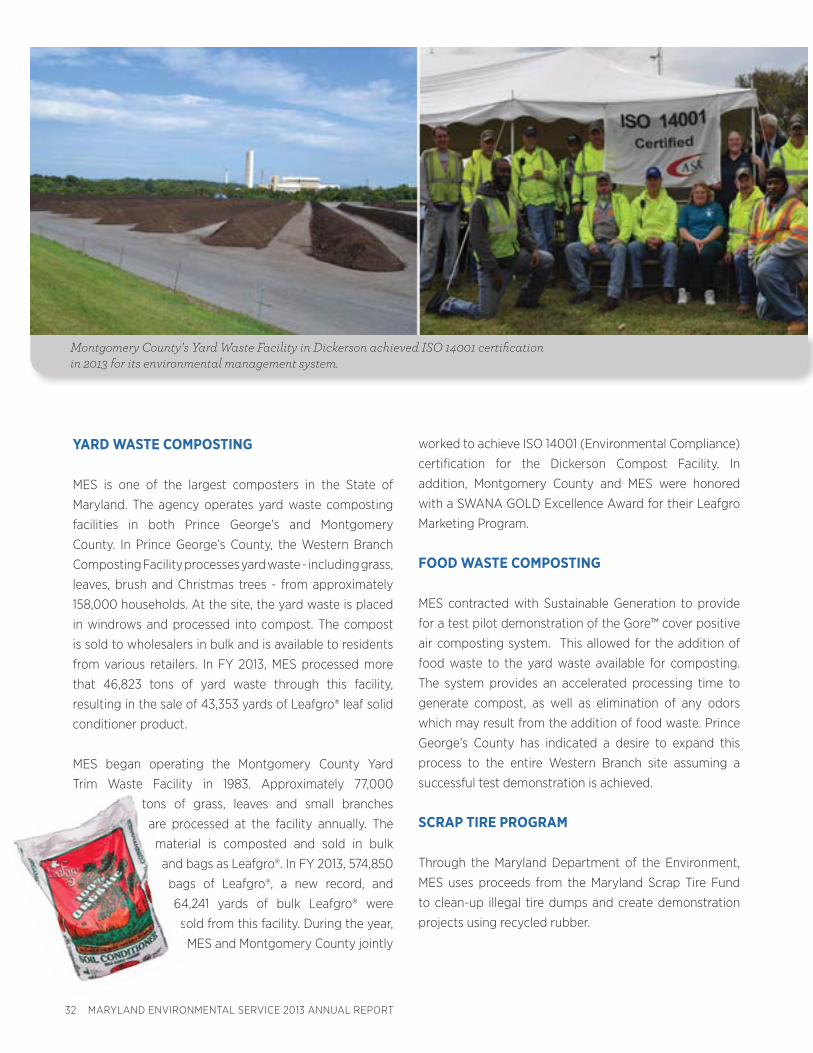
YARD WASTE COMPOSTING
MES is one of the largest composters in the State of
Maryland. The agency operates yard waste composting
facilities in both Prince George’s and Montgomery
County. In Prince George’s County, the Western Branch
Composting Facility processes yard waste - including grass,
leaves, brush and Christmas trees - from approximately
158,000 households. At the site, the yard waste is placed
in windrows and processed into compost. The compost
is sold to wholesalers in bulk and is available to residents
from various retailers. In FY 2013, MES processed more
that 46,823 tons of yard waste through this facility,
resulting in the sale of 43,353 yards of Leafgro® leaf solid
conditioner product.
MES began operating the Montgomery County Yard
Trim Waste Facility in 1983. Approximately 77,000
tons of grass, leaves and small branches
are processed at the facility annually. The
material is composted and sold in bulk
and bags as Leafgro®. In FY 2013, 574,850
bags of Leafgro®, a new record, and
64,241 yards of bulk Leafgro® were
sold from this facility. During the year,
MES and Montgomery County jointly
worked to achieve ISO 14001 (Environmental Compliance)
certifi cation for the Dickerson Compost Facility. In
addition, Montgomery County and MES were honored
with a SWANA GOLD Excellence Award for their Leafgro
Marketing Program.
FOOD WASTE COMPOSTING
MES contracted with Sustainable Generation to provide
for a test pilot demonstration of the Gore™ cover positive
air composting system. This allowed for the addition of
food waste to the yard waste available for composting.
The system provides an accelerated processing time to
generate compost, as well as elimination of any odors
which may result from the addition of food waste. Prince
George’s County has indicated a desire to expand this
process to the entire Western Branch site assuming a
successful test demonstration is achieved.
SCRAP TIRE PROGRAM
Through the Maryland Department of the Environment,
MES uses proceeds from the Maryland Scrap Tire Fund
to clean-up illegal tire dumps and create demonstration
projects using recycled rubber.
Montgomery County’s Yard Waste Facility in Dickerson achieved ISO 14001 certifi cation in 2013 for its environmental management system.
to
a
m
a
b
6
s
M
MARYLAND ENVIRONMENTAL SERVICE 2013 ANNUAL REPORT 33
In response to recent budgetary constraints, MES’
emphasis has been placed on the cleanup of illegal scrap
tire dumps which MDE has identifi ed. All demonstration
projects and school ground and athletic fi eld enhancement
projects were completed and the development of new
projects has been temporarily suspended.
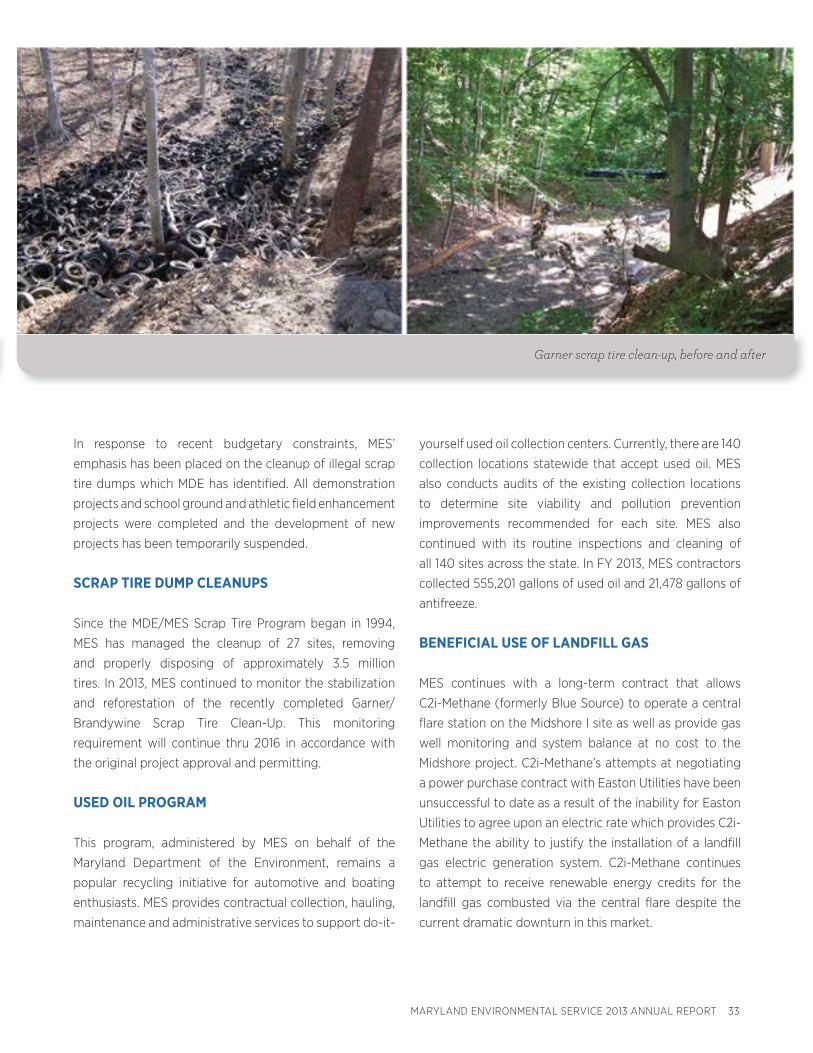
SCRAP TIRE DUMP CLEANUPS
Since the MDE/MES Scrap Tire Program began in 1994,
MES has managed the cleanup of 27 sites, removing
and properly disposing of approximately 3.5 million
tires. In 2013, MES continued to monitor the stabilization
and reforestation of the recently completed Garner/
Brandywine Scrap Tire Clean-Up. This monitoring
requirement will continue thru 2016 in accordance with
the original project approval and permitting.
USED OIL PROGRAM
This program, administered by MES on behalf of the
Maryland Department of the Environment, remains a
popular recycling initiative for automotive and boating
enthusiasts. MES provides contractual collection, hauling,
maintenance and administrative services to support do-it-
yourself used oil collection centers. Currently, there are 140
collection locations statewide that accept used oil. MES
also conducts audits of the existing collection locations
to determine site viability and pollution prevention
improvements recommended for each site. MES also
continued with its routine inspections and cleaning of
all 140 sites across the state. In FY 2013, MES contractors
collected 555,201 gallons of used oil and 21,478 gallons of
antifreeze.
BENEFICIAL USE OF LANDFILL GAS
MES continues with a long-term contract that allows
C2i-Methane (formerly Blue Source) to operate a central
fl are station on the Midshore I site as well as provide gas
well monitoring and system balance at no cost to the
Midshore project. C2i-Methane’s attempts at negotiating
a power purchase contract with Easton Utilities have been
unsuccessful to date as a result of the inability for Easton
Utilities to agree upon an electric rate which provides C2i-
Methane the ability to justify the installation of a landfi ll
gas electric generation system. C2i-Methane continues
to attempt to receive renewable energy credits for the
landfi ll gas combusted via the central fl are despite the
current dramatic downturn in this market.
Garner scrap tire clean-up, before and after

34 MARYLAND ENVIRONMENTAL SERVICE 2013 ANNUAL REPORT
EASTERN CORRECTIONAL INSTITUTION
MES operates and maintains a wood fi red co-generation
facility at the Eastern Correctional Institution in Westover,
MD generating steam, high temperature hot water
and electricity for use by the Institution which houses
approximately 3,400 inmates. MES provides approximately
85 percent of the electrical and 100 percent of the thermal
needs for this facility from the co-generation facility.
MIDSHORE REGIONAL II LANDFILL
As part of an 80-year solution to solid waste management,
the four Midshore Counties - Caroline, Kent, Queen Anne’s
and Talbot - have formed a unique partnership where
each county hosts a solid waste facility for 20 years.
Constructed in 1991, the Midshore I Regional Solid Waste
Facility located in Talbot was the fi rst waste acceptance
facility to operate under the agreement.
In addition to the disposal of solid waste, Midshore I
also provided disposal of household hazardous waste,
pesticides, motor oil, antifreeze, wood waste processing
and refrigerant recovery. After 20 years of operation,
Midshore I Landfi ll was closed on December 31, 2010,
ending Talbot County’s commitment to providing a
disposal site for the Midshore Counties.
Construction of the next regional landfi ll in Ridgely
(Midshore II) started in June 2009 and reached Substantial
Completion in September 2010. On October 11, 2010, the
Midshore II Regional Solid Waste Facility opened for the
acceptance of soft trash, highlighted by an impromptu
parade escorting the fi rst load of waste into the landfi ll.
MES continues to operate the regional homeowner drop-
off site, located adjacent to Midshore II at Holly Road in
Ridgely. In FY 2013, Midshore II accepted 101,000 tons of
trash for disposal.
A major design project was initiated in FY 2013 involving
the construction of the next landfi ll cell, Cell #2, at
Midshore II. This project design will be completed in mid-
FY 2014 and is planned to go to construction in late FY
2014. Anticipated cost of this project will be approximately
$4.5 million.
Midshore II Landfi ll received a GOLD Excellence Award
for Landfi ll Maintenance in 2013 from SWANA, North
America’s largest solid waste association
ECI Co-generation plant; fl are at Midshore I
MARYLAND ENVIRONMENTAL SERVICE 2013 ANNUAL REPORT 35
MIDSHORE I REGIONAL LANDFILL
Under a separate new agreement with Talbot County, MES
began operation of a transfer station and homeowner
drop-off at the Midshore I Landfi ll site in Easton. All solid
waste delivered to Midshore I is transferred to the new
Midshore II Facility for disposal, thus reducing truck traffi c
into Midshore II and saving fuel costs for Talbot County
haulers. In FY 2013, a total of 30,719 tons of solid waste
was transferred to Midshore II from Midshore I.
In addition, design work commenced in FY 2013 for the
fi nal capping of Midshore I Landfi ll utilizing an innovative
exposed geomembrane capping system. This design
will signifi cantly reduce the cost to cap the landfi ll as a
result of eliminating the need to place thousands of yards
of cover dirt onto the landfi ll. The total anticipated cost
of this capping system will be approximately $4 million
and is planned to begin in late FY 2014. Once completed,
this capping project will allow for the landfi ll to begin the
required 30-year monitoring period, as well as minimize
the ongoing expenses related to maintaining the current
Interim status of the landfi ll.
EXPANDED WORK ON THE EASTERN SHORE
MES work has expanded at other Eastern Shore landfi ll
sites. Work on the permanent closure of the existing
Hobbs Road Landfi ll near Denton in Caroline County was
initiated in July 2010. This closure activity is a requirement
of MES to perform as part of the revised service agreement
between MES and Caroline County associated with the
Midshore II project. The state-of-the-art design included
a geomembrane liner, geocomposite drainage layer, 18”
drainage cap and 6” vegetative cover.
In Dorchester County, MES completed the design of a
Landfi ll Capping System for the County’s Old Beulah
Landfi ll. MES also continues to provide a Landfi ll Manager
for the Dorchester County Beulah Landfi ll in Hurlock.
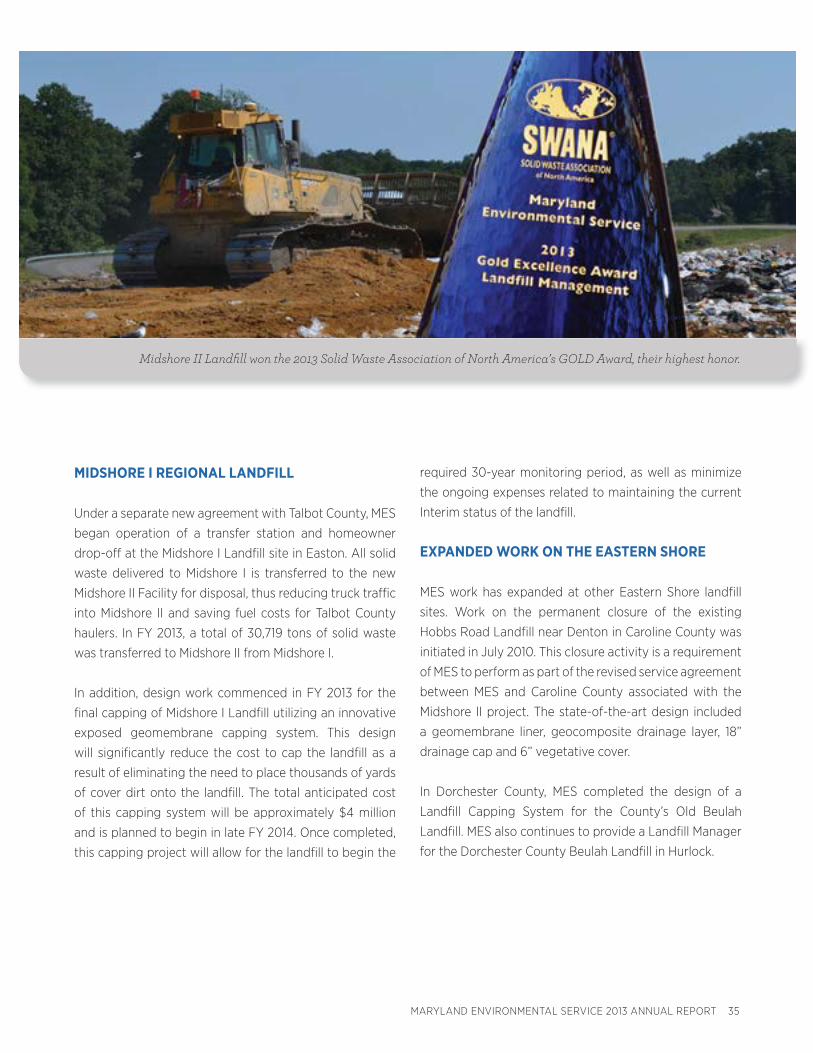
Midshore II Landfi ll won the 2013 Solid Waste Association of North America’s GOLD Award, their highest honor.
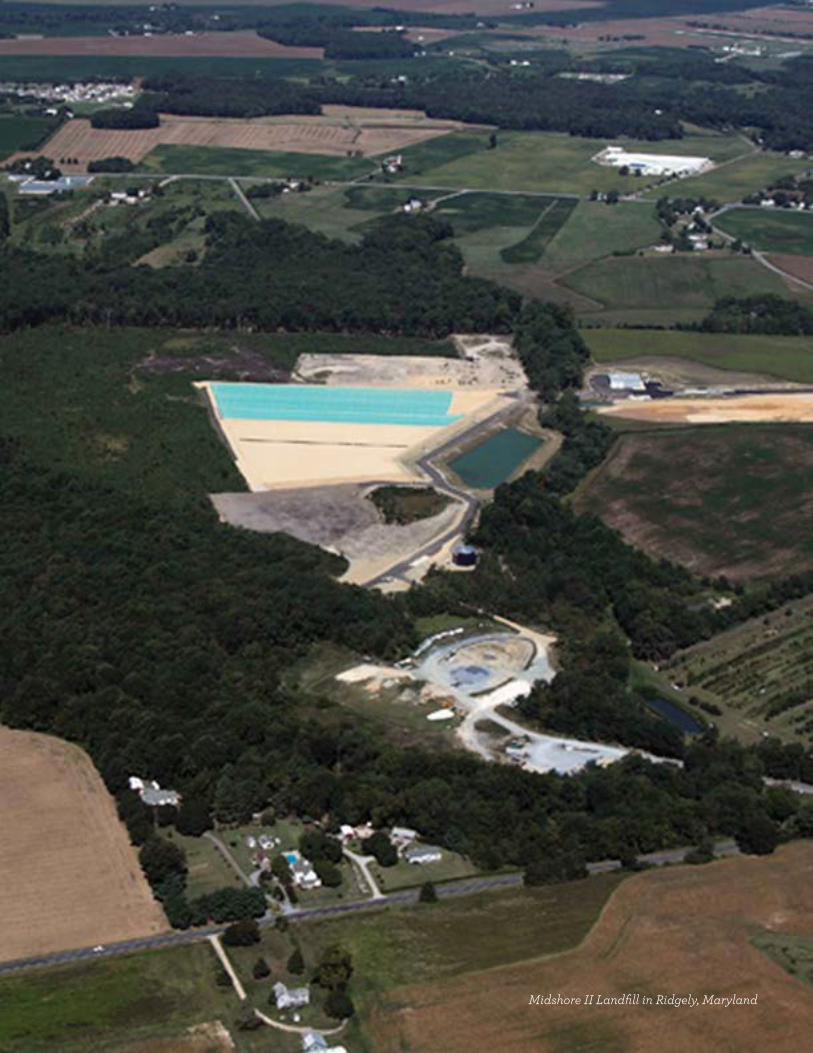
Midshore II Landfi ll in Ridgely, Maryland
MARYLAND ENVIRONMENTAL SERVICE 2013 ANNUAL REPORT 37
FINANCIAL SECTION
REPORT OF INDEPENDENT PUBLIC ACCOUNTANTS 38
MANAGEMENT’S DISCUSSION AND ANALYSIS 40
STATEMENTS OF NET POSITION 50
STATEMENTS OF REVENUE, EXPENSES AND CHANGES IN NET POSITION 51
MIDSHORE REGIONAL LANDFILL PRIVATE PURPOSE TRUST FUND STATEMENTS OF REVENUE,
EXPENSES AND CHANGES IN NET POSITION 54
OTHER POST EMPLOYMENT BENEFIT PLAN STATEMENT OF PLAN NET POSITION 55
OTHER POST EMPLOYMENT BENEFIT PLAN STATEMENT OF CHANGES IN PLAN NET POSITION 56
NOTES TO FINANCIAL STATEMENTS 57
REQUIRED SUPPLEMENTAL INFORMATION FOR OTHER POSTEMPLOYMENT BENEFIT PLAN 80
REPORT OF INDEPENDENT PUBLIC ACCOUNTANTS ON INTERNAL CONTROL OVER FINANCIAL
REPORTING AND ON COMPLIANCE AND OTHER MATTERS BASED ON AN AUDIT OF FINANCIAL
STATEMENTS PERFORMED IN ACCORDANCE WITH GOVERNMENT AUDITING STANDARDS 81
38 MARYLAND ENVIRONMENTAL SERVICE 2013 ANNUAL REPORT
To the Board of DirectorsMaryland Environmental Service
Report on the Financial Statements
We have audited the accompanying fi nancial statements of the business type activities and fi duciary funds of the Maryland Environmental Service (the Service), a component unit of the State of Maryland, as of and for the years ended June 30, 2013 and 2012, and the related notes to the fi nancial statements, which collectively comprise the Service’s basic fi nancial statements as listed in the table of contents.
Management’s Responsibility for the Financial Statements
The Service’s management is responsible for the preparation and fair presentation of these fi nancial statements in accordance with accounting principles generally accepted in the United States of America; this includes the design, implementation, and maintenance of internal control relevant to the preparation and fair presentation of fi nancial statements that are free from material misstatement, whether due to fraud or error.
Auditor’s Responsibility
Our responsibility is to express an opinion on these fi nancial statements based on our audit. We conducted our audit in accordance with auditing standards generally accepted in the United States of America and the standards applicable to fi nancial audits contained in Government Auditing Standards, issued by the Comptroller General of the United States. Those standards require that we plan and perform the audit to obtain reasonable assurance about whether the fi nancial statements are free from material misstatement.
An audit involves performing procedures to obtain audit evidence about the amounts and disclosures in the fi nancial statements. The procedures selected depend on the auditor’s judgment, including the assessment of the risks of material misstatement of the fi nancial statements, whether due to fraud or error. In making those risk assessments, the auditor considers internal control relevant to the entity’s preparation and fair presentation of the fi nancial statements in order to design audit procedures that are appropriate in the circumstances, but not for the purpose of expressing an opinion on the eff ectiveness of the entity’s internal control. Accordingly, we express no such opinion. An audit also includes evaluating the appropriateness of accounting policies used and the reasonableness of signifi cant accounting estimates made by management, as well as evaluating the overall presentation of the fi nancial statements.
We believe that the audit evidence we have obtained is suffi cient and appropriate to provide a basis for our audit opinion.
Report of Independent Public Accountants
200 International Circle • Suite 5500 • Hunt Valley • Maryland 21030 • P 410-584-0060 • F 410-584-0061
MARYLAND ENVIRONMENTAL SERVICE 2013 ANNUAL REPORT 39
200 International Circle • Suite 5500 • Hunt Valley • Maryland 21030 • P 410-584-0060 • F 410-584-0061
Opinion
In our opinion, the fi nancial statements referred to above present fairly, in all material respects, the fi nancial position of the Service as of June 30, 2013 and 2012, and the changes in its fi nancial position and its cash fl ows for the years then ended in accordance with accounting principles generally accepted in the United States of America.Other Matters
Required Supplementary Information
Accounting principles generally accepted in the United States of America require that the Management Discussion and Analysis and Required Supplemental Information for Other Postemployment Benefi t Plan on pages 3-12 and 44 be presented to supplement the basic fi nancial statements. Such information, although not a part of the basic fi nancial statements, is required by the Governmental Accounting Standards Board who considers it to be an essential part of fi nancial reporting for placing the basic fi nancial statements in an appropriate operational, economic, or historical context. We have applied certain limited procedures to the required supplementary information in accordance with auditing standards generally accepted in the United States of America, which consisted of inquiries of management about the methods of preparing the information and comparing the information for consistency with management’s responses to our inquiries, the basic fi nancial statements, and other knowledge we obtained during our audit of the basic fi nancial statements. We do not express an opinion or provide any assurance on the information because the limited procedures do not provide us with suffi cient evidence to express an opinion or provide any assurance.
Other Reporting Required by Government Auditing Standards
In accordance with Government Auditing Standards, we have also issued our report dated September 30, 2013, on our consideration of the Service’s internal control over fi nancial reporting and on our tests of its compliance with certain provisions of laws, regulations, contracts, and grant agreements and other matters. The purpose of that report is to describe the scope of our testing of internal control over fi nancial reporting and compliance and the results of that testing, and not to provide an opinion on internal control over fi nancial reporting or on compliance. That report is an integral part of an audit performed in accordance with Government Auditing Standards in considering the Service’s internal control over fi nancial reporting and compliance.
Hunt Valley, MarylandSeptember 30, 2013
40 MARYLAND ENVIRONMENTAL SERVICE 2013 ANNUAL REPORT
Maryland Environmental ServiceManagement’s Discussion and Analysis
June 30, 2013 and 2012(In thousands except where noted)
Overview of Financial Statements
Maryland Environmental Service (Service) is an independent agency of the State of Maryland that provides environmental services to both the public and private sectors on a fee for service basis. Substantially all the Service’s revenue is derived from the delivery of technical and operational environmental services. The Service is organized into four basic groups: Environmental Operations, Water/Wastewater Operations, Technical and Environmental Services and Administration. The financial statements presented report and use accounting methods similar to those employed by private sector companies.
The purpose of the discussion and analysis that follows is to provide an understanding of the financial performance and activities of the Service as of and for the fiscal years ended June 30, 2013 and 2012. As required supplementary information, the accompanying analysis of financial information should be used in conjunction with the financial statements and related notes thereto included elsewhere to assess the overall financial condition and reported operating results of the Service.
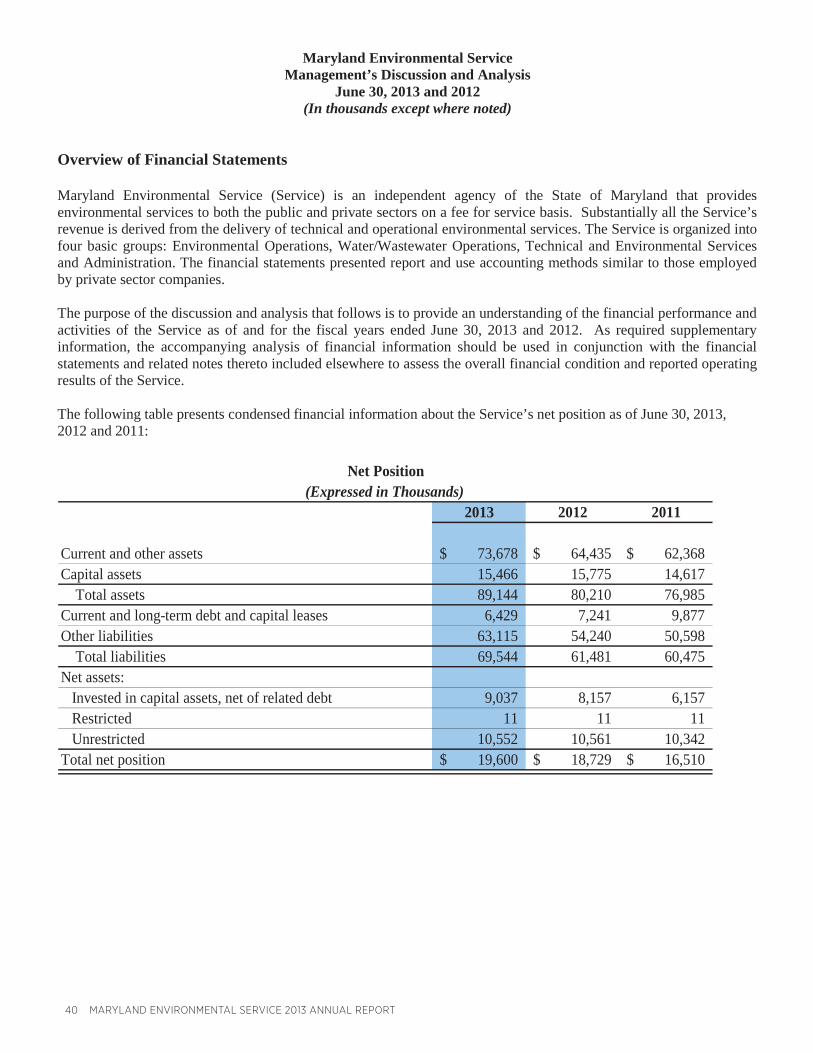
The following table presents condensed financial information about the Service’s net position as of June 30, 2013,2012 and 2011:
2013 2012 2011
Current and other assets 73,678$ 64,435$ 62,368$Capital assets 15,466 15,775 14,617 Total assets 89,144 80,210 76,985Current and long-term debt and capital leases 6,429 7,241 9,877Other liabilities 63,115 54,240 50,598 Total liabilities 69,544 61,481 60,475Net assets:
Invested in capital assets, net of related debt 9,037 8,157 6,157Restricted 11 11 11Unrestricted 10,552 10,561 10,342
Total net position 19,600$ 18,729$ 16,510$
Net Position(Expressed in Thousands)
MARYLAND ENVIRONMENTAL SERVICE 2013 ANNUAL REPORT 41
Maryland Environmental ServiceManagement’s Discussion and Analysis
June 30, 2013 and 2012(In thousands except where noted)
Fiscal Year 2013
Net position represent the difference between total assets and total liabilities.
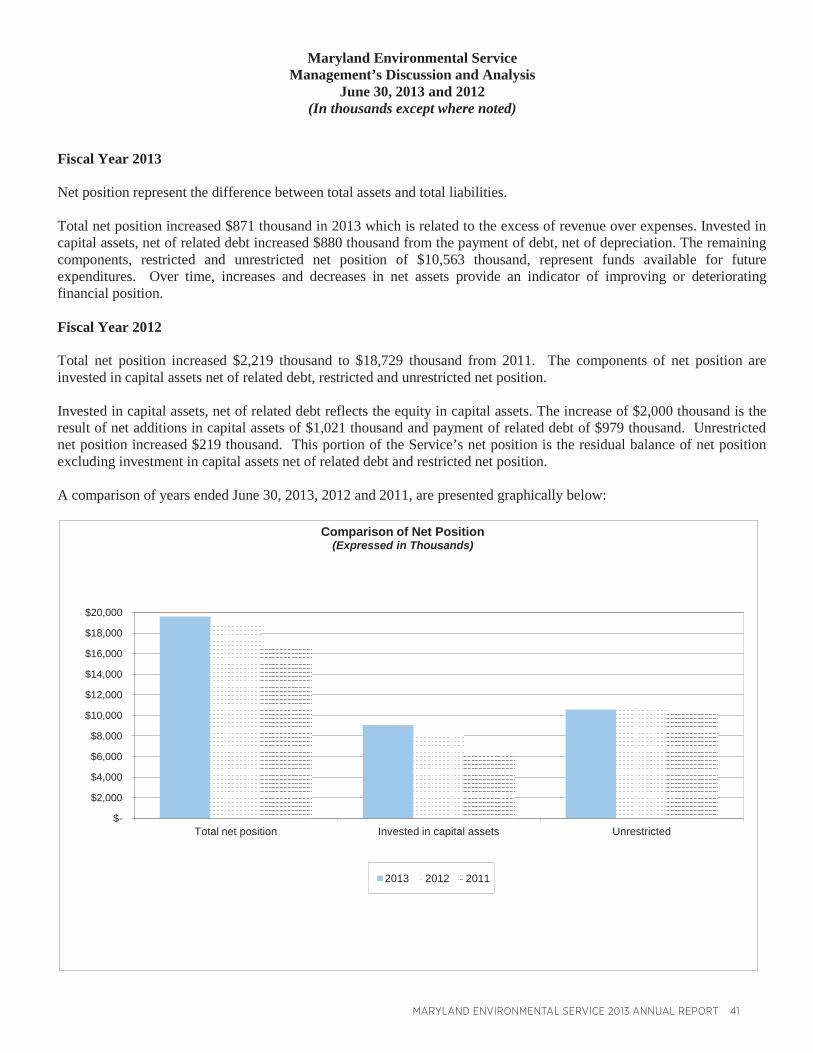
Total net position increased $871 thousand in 2013 which is related to the excess of revenue over expenses. Invested in capital assets, net of related debt increased $880 thousand from the payment of debt, net of depreciation. The remaining components, restricted and unrestricted net position of $10,563 thousand, represent funds available for future expenditures. Over time, increases and decreases in net assets provide an indicator of improving or deteriorating financial position.
Fiscal Year 2012
Total net position increased $2,219 thousand to $18,729 thousand from 2011. The components of net position are invested in capital assets net of related debt, restricted and unrestricted net position.
Invested in capital assets, net of related debt reflects the equity in capital assets. The increase of $2,000 thousand is the result of net additions in capital assets of $1,021 thousand and payment of related debt of $979 thousand. Unrestricted net position increased $219 thousand. This portion of the Service’s net position is the residual balance of net positionexcluding investment in capital assets net of related debt and restricted net position.
A comparison of years ended June 30, 2013, 2012 and 2011, are presented graphically below:
$-
$2,000
$4,000
$6,000
$8,000
$10,000
$12,000
$14,000
$16,000
$18,000
$20,000
Total net position Invested in capital assets Unrestricted
Comparison of Net Position(Expressed in Thousands)
2013 2012 2011
42 MARYLAND ENVIRONMENTAL SERVICE 2013 ANNUAL REPORT
Maryland Environmental ServiceManagement’s Discussion and Analysis
June 30, 2013 and 2012(In thousands except where noted)
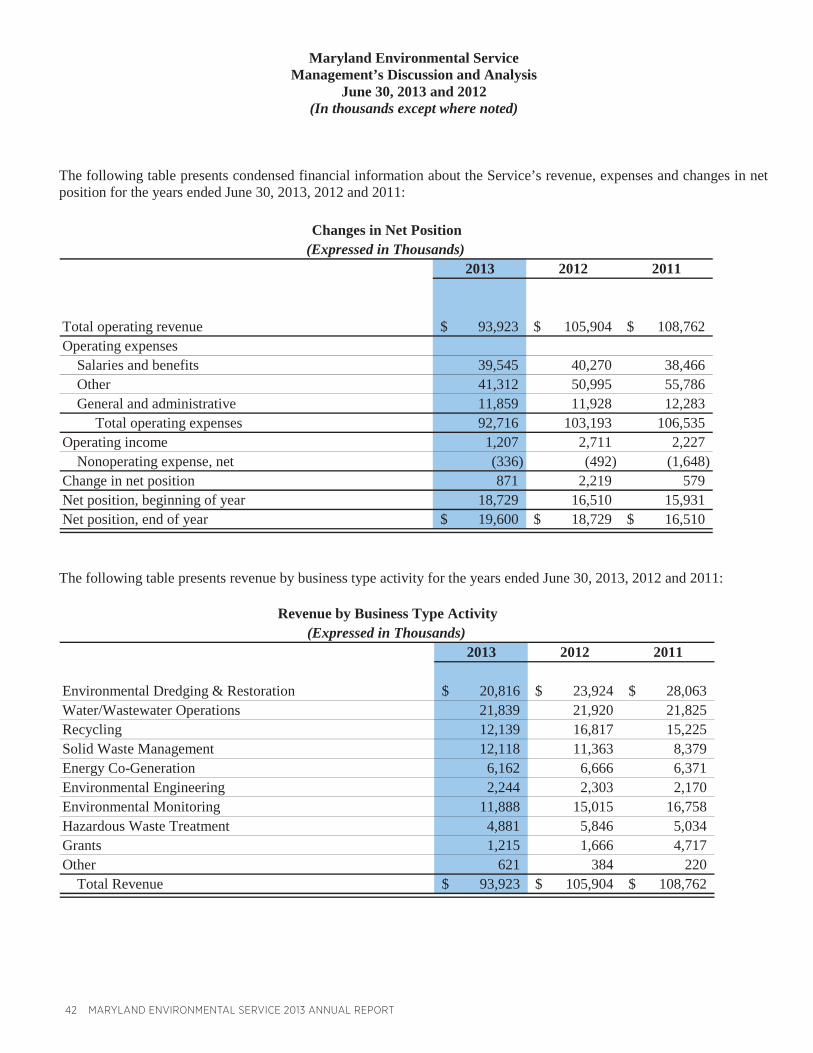
The following table presents condensed financial information about the Service’s revenue, expenses and changes in net position for the years ended June 30, 2013, 2012 and 2011:
2013 2012 2011
Total operating revenue 93,923$ 105,904$ 108,762$Operating expenses Salaries and benefits 39,545 40,270 38,466 Other 41,312 50,995 55,786 General and administrative 11,859 11,928 12,283 Total operating expenses 92,716 103,193 106,535Operating income 1,207 2,711 2,227 Nonoperating expense, net (336) (492) (1,648)Change in net position 871 2,219 579Net position, beginning of year 18,729 16,510 15,931Net position, end of year 19,600$ 18,729$ 16,510$
Changes in Net Position(Expressed in Thousands)
The following table presents revenue by business type activity for the years ended June 30, 2013, 2012 and 2011:
2013 2012 2011
Environmental Dredging & Restoration 20,816$ 23,924$ 28,063$Water/Wastewater Operations 21,839 21,920 21,825Recycling 12,139 16,817 15,225Solid Waste Management 12,118 11,363 8,379Energy Co-Generation 6,162 6,666 6,371Environmental Engineering 2,244 2,303 2,170Environmental Monitoring 11,888 15,015 16,758Hazardous Waste Treatment 4,881 5,846 5,034Grants 1,215 1,666 4,717Other 621 384 220 Total Revenue 93,923$ 105,904$ 108,762$
Revenue by Business Type Activity(Expressed in Thousands)
MARYLAND ENVIRONMENTAL SERVICE 2013 ANNUAL REPORT 43
Maryland Environmental ServiceManagement’s Discussion and Analysis
June 30, 2013 and 2012(In thousands except where noted)
Revenue by Business Type Activity
Fiscal Year 2013
Total operating revenue for the year ended June 30, 2013, decreased $11,981 thousand from 2012. The change represents a decrease of 11% in operating revenue. The most significant areas of change were decreases in Recycling of $4,678 thousand, Environmental Dredging and Restoration of $3,108 thousand, Environmental Monitoring of $3,127, and Grant revenue of $451 thousand. There was an increase in Solid Waste Management of $755 thousand.
Recycling was lower as a result of the completion of the Garner/Brandywine Scrap Tire Cleanup in 2012. Environmental Dredging and Restoration revenue was lower mainly due to the tapering off of the Masonville Dredged Material Containment Facility construction project. The decrease to Environmental Monitoring was due to the expiration of several Memorandums of Understanding (MOU) with Department of Transportation modals. Federal grants with the Environmental Protection Agency, and Department of Transportation Maritime Administration had reduced expenditures in 2013 as projects near completion. Solid Waste Management revenue increase was related to design work and a slight increase in demand at the Baltimore County Resource Recovery Facility.
Fiscal Year 2012
Overall total revenue of $105,904 thousand decreased $2,858 thousand or 3% compared to prior year. The major segments that contributed to the change were Environmental Dredging and Restoration revenue decreases of $4,139 thousand, and Grants revenue decreases of $3,051 thousand. This was offset by an increase in Recycling revenue of $1,592 thousand and Solid Waste Management of $2,984 thousand.
Environmental Dredging and Restoration revenue was lower due to several large projects ending in 2011. Federal grants with the Environmental Protection Agency, and Department of Transportation Maritime Administration had significantly reduced expenditures in 2012 as the projects are near completion. Recycling revenue increased 10% to $16,817 thousand due to two new scrap tire dump cleanup projects. Solid Waste Management revenue increase was related solely to the startup of a solid waste transfer station and home owner drop off undertaking.
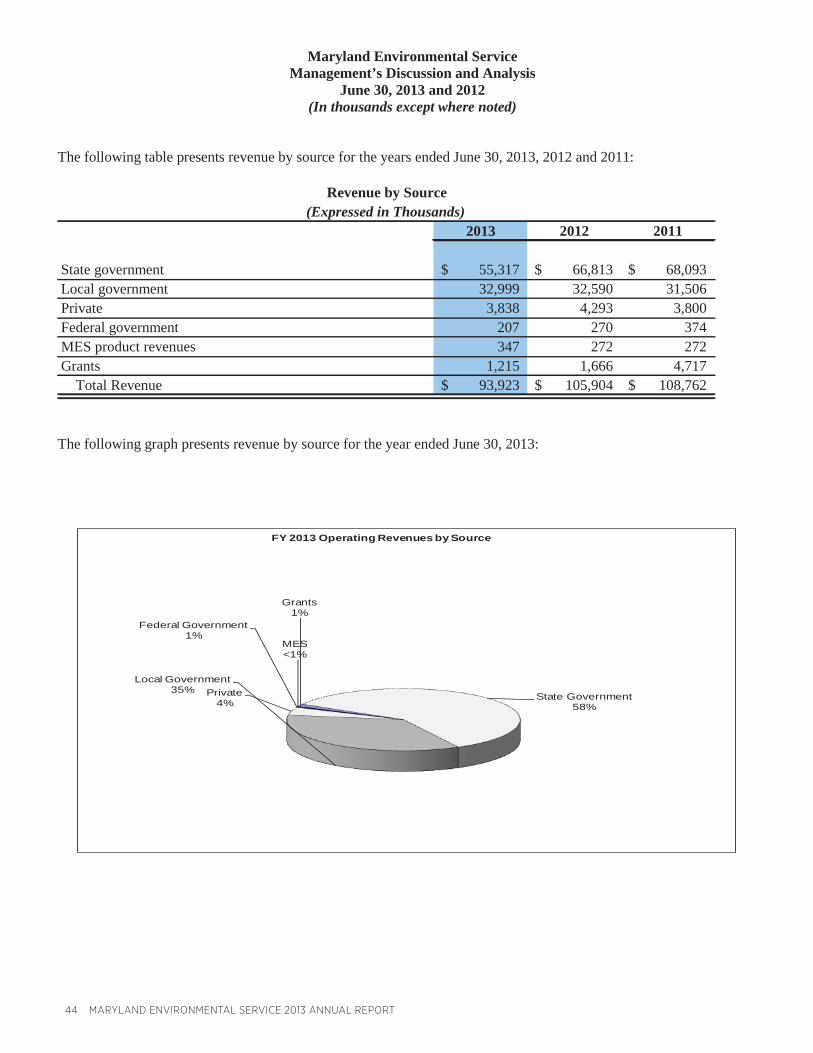
44 MARYLAND ENVIRONMENTAL SERVICE 2013 ANNUAL REPORT
Maryland Environmental ServiceManagement’s Discussion and Analysis
June 30, 2013 and 2012(In thousands except where noted)
The following table presents revenue by source for the years ended June 30, 2013, 2012 and 2011:
2013 2012 2011
State government 55,317$ 66,813$ 68,093$Local government 32,999 32,590 31,506Private 3,838 4,293 3,800Federal government 207 270 374MES product revenues 347 272 272Grants 1,215 1,666 4,717 Total Revenue 93,923$ 105,904$ 108,762$
Revenue by Source(Expressed in Thousands)
The following graph presents revenue by source for the year ended June 30, 2013:
State Government58%
Local Government35% Private
4%
Federal Government1%
MES<1%
Grants1%
FY 2013 Operating Revenues by Source
MARYLAND ENVIRONMENTAL SERVICE 2013 ANNUAL REPORT 45
Maryland Environmental ServiceManagement’s Discussion and Analysis
June 30, 2013 and 2012(In thousands except where noted)
Revenue by Source
Fiscal Year 2013
State government revenues decreased by $11,496 thousand in 2013, while local government revenue increased by $409 thousand. Grant revenue declined by $451 thousand.
State revenue reductions were attributable to the Masonville Dredged Material Containment Facility construction project wrap up, and the expiration of several MOUs with the Maryland Department of Transportation. Federal grants with the Environmental Protection Agency, and Department of Transportation Maritime Administration had reduced expenditures in 2013 as the Garner/Brandywine Scrap Tire Cleanup was completed, and environmental review services work ended.
Fiscal Year 2012
State and local government revenues account for 94% of total revenues. State government revenue decreased $1,280 thousand from last year and local government increased $1,084 thousand for a net decrease of $196 thousand. Grant revenue was the largest change in total revenue accounting for a decrease of $3,051 thousand.
The near completion of the Masonville Dredging and Construction Federal grants with the Environmental Protection Agency, and Department of Transportation Maritime Administration had significantly reduced expenditures in 2012 as the projects are near completion.
Operating Expenses
Operating expenses are predominantly related to those classified as cost of goods and services, general and administrative, and depreciation on capital assets. Operating expenses were 99%, 97%, and 98% of revenue in 2013,2012 and 2011, respectively.
Operating Income
Fiscal Year 2013
Operating income reported in 2013 was $1,207 thousand compared to $2,711 thousand in 2012, a decrease of $1,504thousand. The factors affecting the change are a combination of lower overhead recovery and project variances.
Fiscal Year 2012
In 2012, the Service reported operating income of $2,711 thousand compared to operating income of $2,227 thousand in 2011, an increase of $484 thousand. The principal reason for the increase is due to a change in the fringe benefit recovery rate and lower general and administrative expenses.
46 MARYLAND ENVIRONMENTAL SERVICE 2013 ANNUAL REPORT
Maryland Environmental ServiceManagement’s Discussion and Analysis
June 30, 2013 and 2012(In thousands except where noted)
Non-operating Revenue (Expense), Net
Fiscal Year 2013
Non-operating expenses, (net) decreased $156 thousand to $336 thousand in 2013. Non-operating items primarily include interest income and interest expense. For 2013, interest income increased by $12 thousand and interest expense decreased by $167 thousand.
Fiscal Year 2012
Non-operating expenses, (net) decreased $1,156 thousand to $492 thousand in 2012. The major reason for the decrease is a nonrecurring contribution to the State’s General Fund of $1,075 thousand made in 2011.
Grants
Fiscal Year 2013
Operating grants in 2013 totaled $1,215 thousand compared to $1,666 thousand in 2012. Federal grants with the Environmental Protection Agency, and Department of Transportation Maritime Administration had very little activity as projects were completed.
Fiscal Year 2012
Operating grants in 2012 totaled $1,666 thousand compared to $4,717 thousand in 2011, a decrease of $3,051 thousand. Federal grants with the Environmental Protection Agency, and Department of Transportation Maritime Administration had significantly reduced expenditures in 2012 as the projects are near completion.
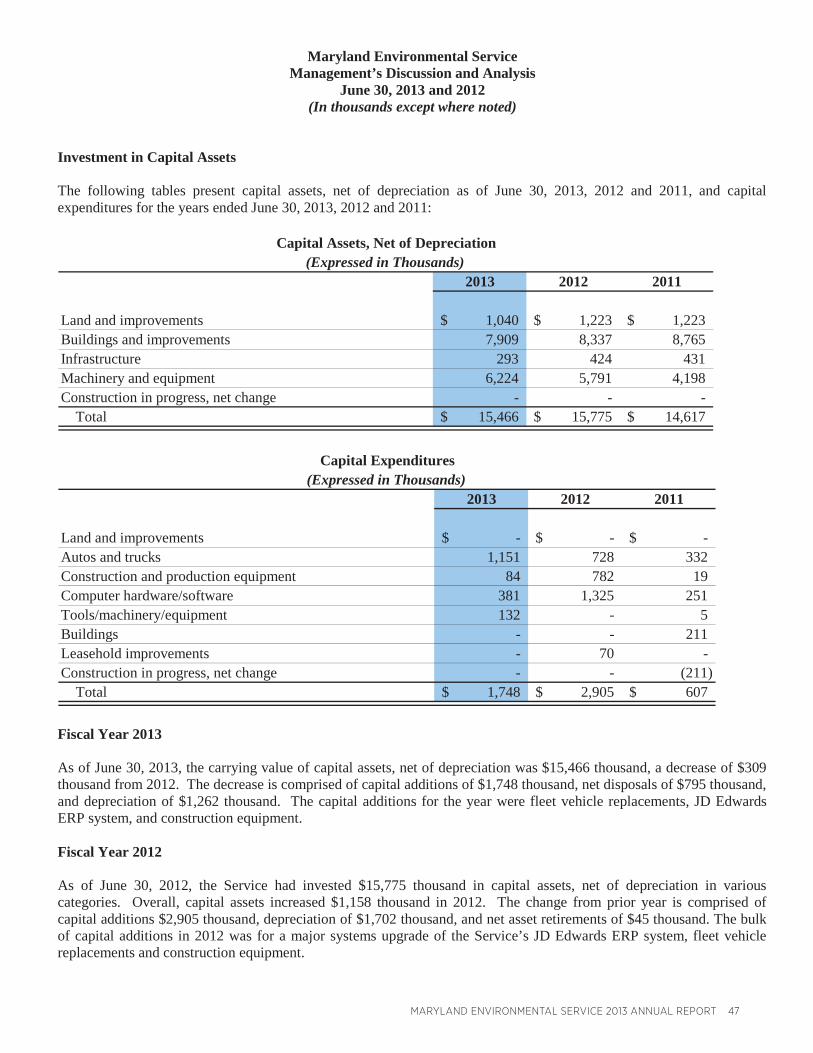
MARYLAND ENVIRONMENTAL SERVICE 2013 ANNUAL REPORT 47
Maryland Environmental ServiceManagement’s Discussion and Analysis
June 30, 2013 and 2012(In thousands except where noted)
Investment in Capital Assets
The following tables present capital assets, net of depreciation as of June 30, 2013, 2012 and 2011, and capital expenditures for the years ended June 30, 2013, 2012 and 2011:
2013 2012 2011
Land and improvements 1,040$ 1,223$ 1,223$Buildings and improvements 7,909 8,337 8,765Infrastructure 293 424 431Machinery and equipment 6,224 5,791 4,198Construction in progress, net change - - - Total 15,466$ 15,775$ 14,617$
Capital Assets, Net of Depreciation(Expressed in Thousands)
2013 2012 2011
Land and improvements -$ -$ -$Autos and trucks 1,151 728 332Construction and production equipment 84 782 19Computer hardware/software 381 1,325 251Tools/machinery/equipment 132 - 5Buildings - - 211Leasehold improvements - 70 -Construction in progress, net change - - (211) Total 1,748$ 2,905$ 607$
Capital Expenditures(Expressed in Thousands)
Fiscal Year 2013
As of June 30, 2013, the carrying value of capital assets, net of depreciation was $15,466 thousand, a decrease of $309thousand from 2012. The decrease is comprised of capital additions of $1,748 thousand, net disposals of $795 thousand,and depreciation of $1,262 thousand. The capital additions for the year were fleet vehicle replacements, JD Edwards ERP system, and construction equipment.
Fiscal Year 2012
As of June 30, 2012, the Service had invested $15,775 thousand in capital assets, net of depreciation in various categories. Overall, capital assets increased $1,158 thousand in 2012. The change from prior year is comprised of capital additions $2,905 thousand, depreciation of $1,702 thousand, and net asset retirements of $45 thousand. The bulk of capital additions in 2012 was for a major systems upgrade of the Service’s JD Edwards ERP system, fleet vehicle replacements and construction equipment.
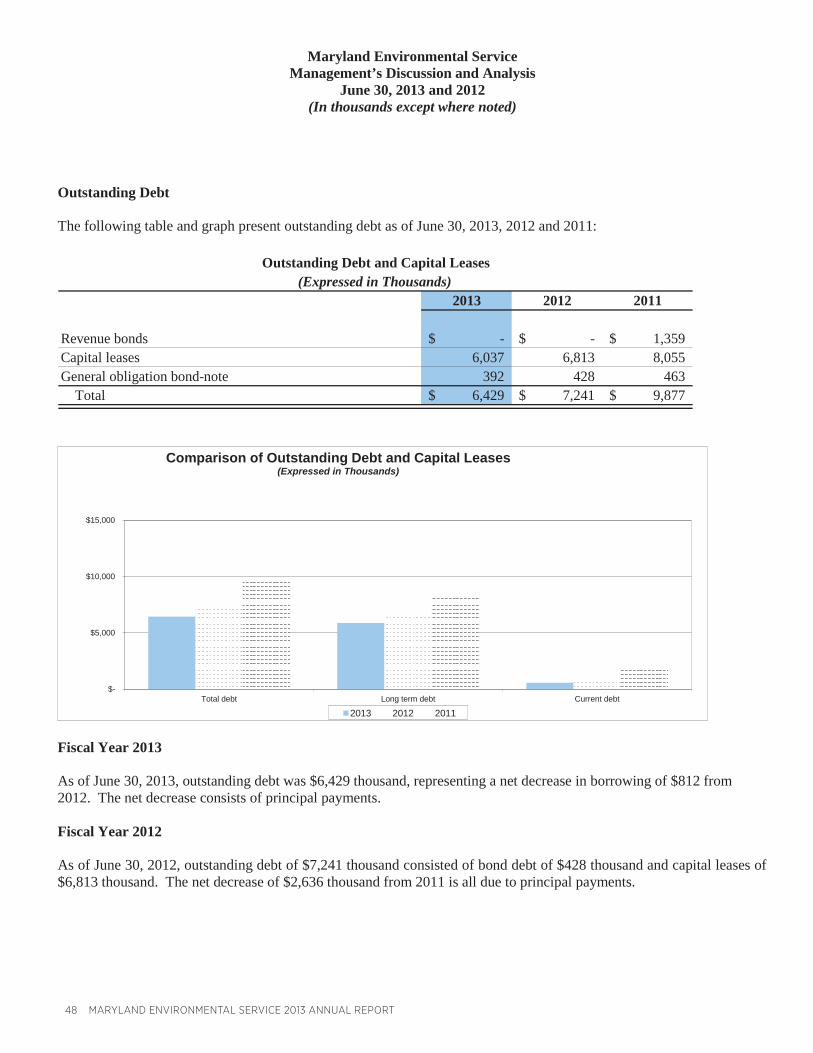
48 MARYLAND ENVIRONMENTAL SERVICE 2013 ANNUAL REPORT
Maryland Environmental ServiceManagement’s Discussion and Analysis
June 30, 2013 and 2012(In thousands except where noted)
Outstanding Debt
The following table and graph present outstanding debt as of June 30, 2013, 2012 and 2011:
2013 2012 2011
Revenue bonds -$ -$ 1,359$Capital leases 6,037 6,813 8,055General obligation bond-note 392 428 463 Total 6,429$ 7,241$ 9,877$
Outstanding Debt and Capital Leases(Expressed in Thousands)
Fiscal Year 2013
As of June 30, 2013, outstanding debt was $6,429 thousand, representing a net decrease in borrowing of $812 from 2012. The net decrease consists of principal payments.
Fiscal Year 2012
As of June 30, 2012, outstanding debt of $7,241 thousand consisted of bond debt of $428 thousand and capital leases of $6,813 thousand. The net decrease of $2,636 thousand from 2011 is all due to principal payments.
$-
$5,000
$10,000
$15,000
Total debt Long term debt Current debt
Comparison of Outstanding Debt and Capital Leases(Expressed in Thousands)
2013 2012 2011
MARYLAND ENVIRONMENTAL SERVICE 2013 ANNUAL REPORT 49
MARYLAND ENVIRONMENTAL SERVICEFINANCIAL STATEMENTS
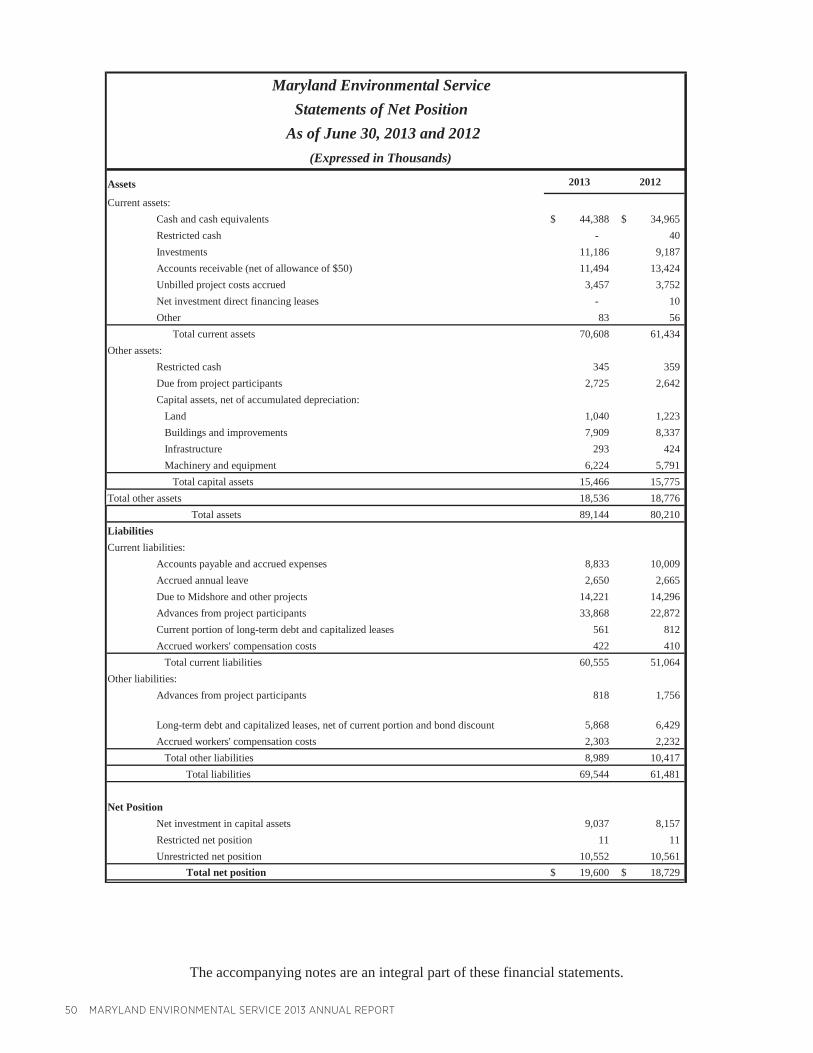
50 MARYLAND ENVIRONMENTAL SERVICE 2013 ANNUAL REPORT
Maryland Environmental Service Statements of Cash Flows
For the years ended June 30, 2010 and 2009 (Expressed in Thousands)
2010 2009Cash Flows From O perating Activities
Receipts from customers 135,057$ 94,863$ Payments to suppliers (79,304) (61,743) Payments to employees (38,654) (37,140) Payments to/from project participants (10,590) 18,755 Other receipts project Midshore 315 (682) Other payments (135) (24)
Net cash from operating activit ies 6,689 14,029 Cash Flows From Noncapital Financing Activities
Operating grants, subsidies and tranfers to other funds 81 1,821 Net cash from noncapital financing activit ies 81 1,821
Cash Flows From Capital and Related Financing ActivitiesProceeds from capital debt 4,840 Purchases of capital assets (914) (7,881) Direct financing lease principal payments received (136) Principal paid on capital debt (3,073) (4,563) Interest paid on capital debt (926) (1,020) Interest paid on capital debt related to discontinued operations 1,759 - Increase in lease 119 1,846 Other receipts 42
Net cash from capital and related financing activit ies (3,035) (6,872)
Cash Flows From Investing ActivitiesPurchases of investments (73,379) (86,004) Sales and maturit ies of investments 94,065 73,532 Interest and dividends 69 170
Net cash from investing activities 20,755 (12,302) Net increase (decrease) in cash and cash equivalents 24,490 (3,324)
Cash and cash equivalents - beginning of the year 360 3,684
Cash and cash equivalents - end of the year 24,850$ 360$
Reconciliation of operating income to net cash fromoperating activities:
Operating income 4,422$ 3,010$ Adjustments to reconcile operating income to net cash provided by operating activit ies:
Depreciation and amortization expense 1,769 1,659 Effect of changes in non-cash operating assets and liabilities:
Accounts receivable 12,779 (8,006) Other assets 2,913 (2,410) Accounts and other payables (5,394) 2,182 Due to project participants (10,352) 18,298 Due to Midshore and other projects 315 (682) Accrued workers compensation costs 237 (22)
Net cash from operating activit ies 6,689$ 14,029$
The accompanying notes are an integral part of these financial statements.
Maryland Environmental Service Statements of Net Position
As of June 30, 2013 and 2012 (Expressed in Thousands)
Assets 2013 2012
Current assets:Cash and cash equivalents 44,388$ 34,965$ Restricted cash - 40Investments 11,186 9,187Accounts receivable (net of allowance of $50) 11,494 13,424Unbilled project costs accrued 3,457 3,752Net investment direct financing leases - 10Other 83 56 Total current assets 70,608 61,434
Other assets:Restricted cash 345 359Due from project participants 2,725 2,642Capital assets, net of accumulated depreciation: Land 1,040 1,223 Buildings and improvements 7,909 8,337 Infrastructure 293 424 Machinery and equipment 6,224 5,791 Total capital assets 15,466 15,775
Total other assets 18,536 18,776 Total assets 89,144 80,210
LiabilitiesCurrent liabilities:
Accounts payable and accrued expenses 8,833 10,009Accrued annual leave 2,650 2,665Due to Midshore and other projects 14,221 14,296Advances from project participants 33,868 22,872Current portion of long-term debt and capitalized leases 561 812Accrued workers' compensation costs 422 410 Total current liabilities 60,555 51,064
Other liabilities:Advances from project participants 818 1,756
5,868 6,429Accrued workers' compensation costs 2,303 2,232 Total other liabilities 8,989 10,417 Total liabilities 69,544 61,481
Net PositionNet investment in capital assets 9,037 8,157Restricted net position 11 11Unrestricted net position 10,552 10,561 Total net position 19,600$ 18,729$
Long-term debt and capitalized leases, net of current portion and bond discount
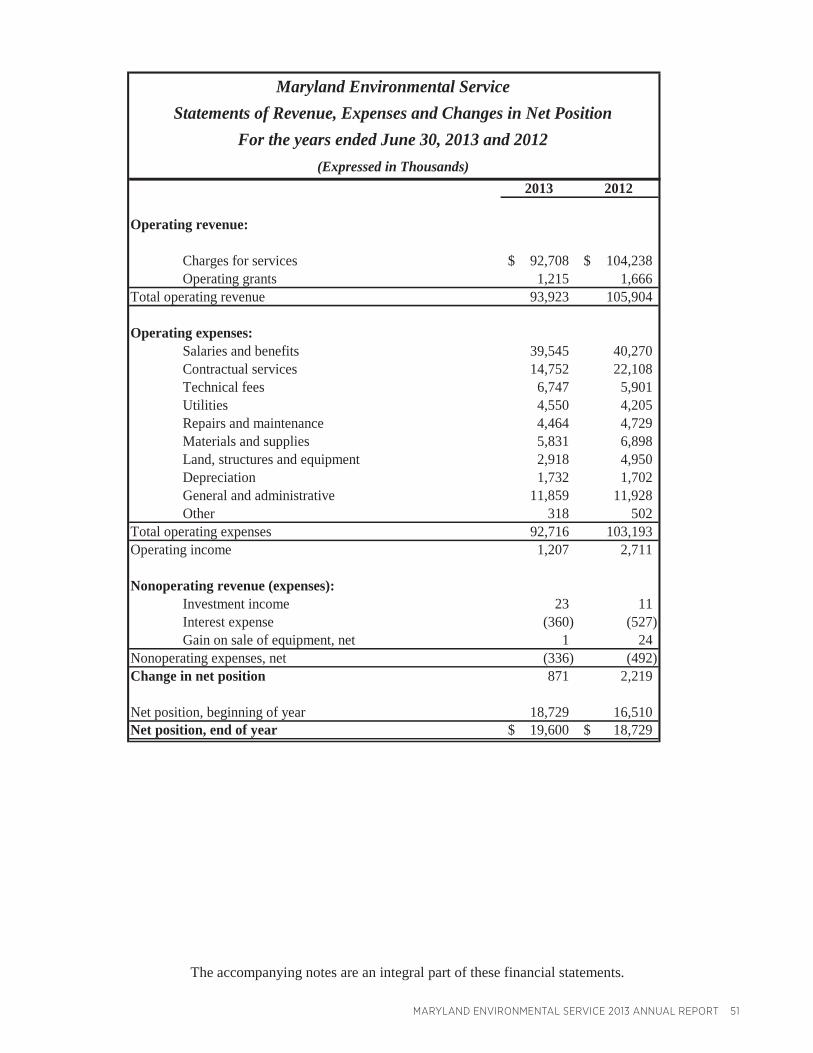
MARYLAND ENVIRONMENTAL SERVICE 2013 ANNUAL REPORT 51
The accompanying notes are an integral part of these financial statements.
Maryland Environmental ServiceStatements of Revenue, Expenses and Changes in Net Position
For the years ended June 30, 2013 and 2012(Expressed in Thousands)
2013 2012
Operating revenue:
Charges for services 92,708$ 104,238$Operating grants 1,215 1,666
Total operating revenue 93,923 105,904
Operating expenses:Salaries and benefits 39,545 40,270Contractual services 14,752 22,108Technical fees 6,747 5,901Utilities 4,550 4,205Repairs and maintenance 4,464 4,729Materials and supplies 5,831 6,898Land, structures and equipment 2,918 4,950Depreciation 1,732 1,702General and administrative 11,859 11,928Other 318 502
Total operating expenses 92,716 103,193Operating income 1,207 2,711
Nonoperating revenue (expenses):Investment income 23 11Interest expense (360) (527)Gain on sale of equipment, net 1 24
Nonoperating expenses, net (336) (492)Change in net position 871 2,219
Net position, beginning of year 18,729 16,510Net position, end of year 19,600$ 18,729$
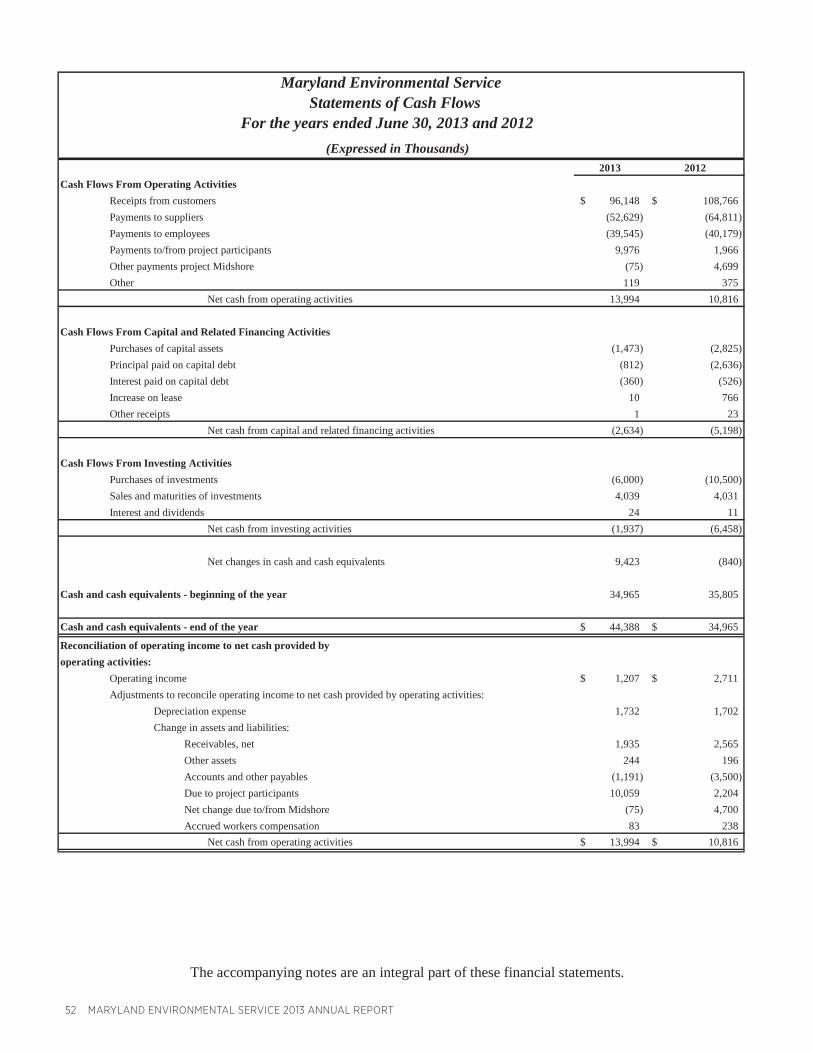
52 MARYLAND ENVIRONMENTAL SERVICE 2013 ANNUAL REPORT
The accompanying notes are an integral part of these financial statements.
Maryland Environmental Service Statements of Cash Flows
For the years ended June 30, 2013 and 2012 (Expressed in Thousands)
2013 2012Cash Flows From Operating Activities
Receipts from customers 96,148$ 108,766$ Payments to suppliers (52,629) (64,811)Payments to employees (39,545) (40,179)Payments to/from project participants 9,976 1,966Other payments project Midshore (75) 4,699Other 119 375
Net cash from operating activities 13,994 10,816
Cash Flows From Capital and Related Financing ActivitiesPurchases of capital assets (1,473) (2,825)Principal paid on capital debt (812) (2,636)Interest paid on capital debt (360) (526)Increase on lease 10 766Other receipts 1 23
Net cash from capital and related financing activities (2,634) (5,198)
Cash Flows From Investing ActivitiesPurchases of investments (6,000) (10,500)Sales and maturities of investments 4,039 4,031Interest and dividends 24 11
Net cash from investing activities (1,937) (6,458)
Net changes in cash and cash equivalents 9,423 (840)
Cash and cash equivalents - beginning of the year 34,965 35,805
Cash and cash equivalents - end of the year 44,388$ 34,965$
Reconciliation of operating income to net cash provided byoperating activities:
Operating income 1,207$ 2,711$ Adjustments to reconcile operating income to net cash provided by operating activities:
Depreciation expense 1,732 1,702Change in assets and liabilities:
Receivables, net 1,935 2,565Other assets 244 196Accounts and other payables (1,191) (3,500)Due to project participants 10,059 2,204Net change due to/from Midshore (75) 4,700Accrued workers compensation 83 238
Net cash from operating activities 13,994$ 10,816$
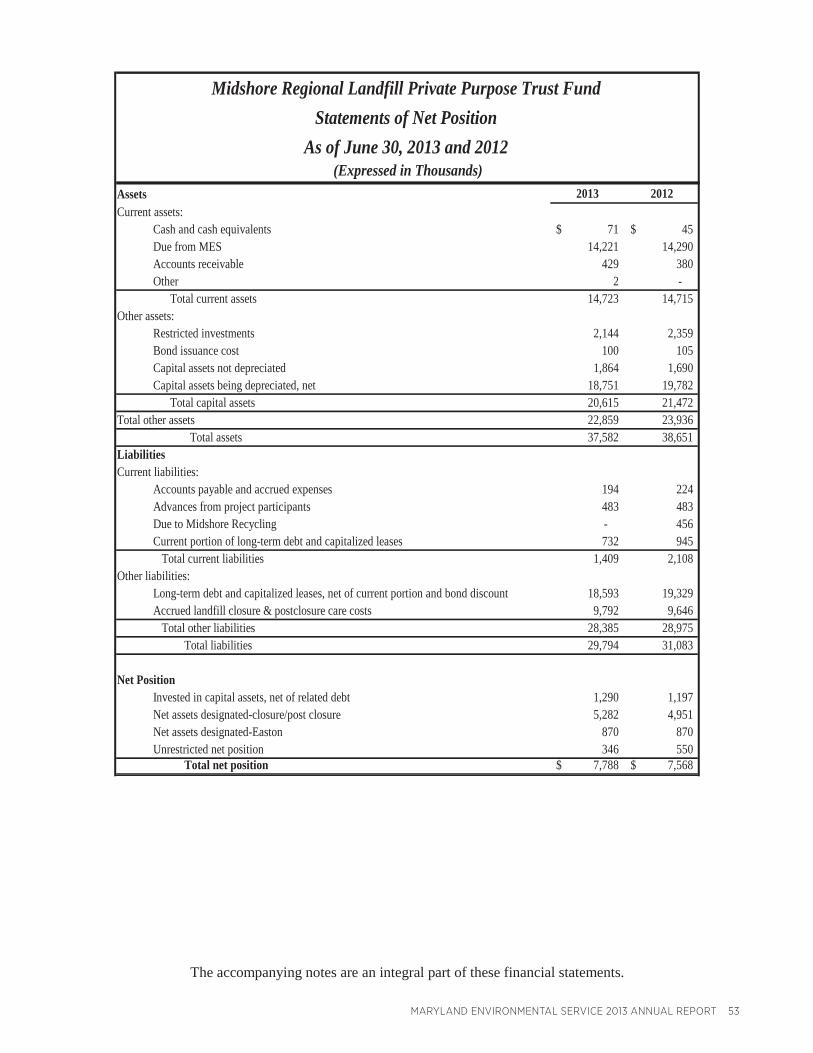
MARYLAND ENVIRONMENTAL SERVICE 2013 ANNUAL REPORT 53
The accompanying notes are an integral part of these financial statements.
Midshore Regional Landfill Private Purpose Trust FundStatements of Net Position
As of June 30, 2013 and 2012
Assets 2013 2012Current assets:
Cash and cash equivalents 71$ 45$ Due from MES 14,221 14,290Accounts receivable 429 380Other 2 - Total current assets 14,723 14,715
Other assets:Restricted investments 2,144 2,359Bond issuance cost 100 105Capital assets not depreciated 1,864 1,690Capital assets being depreciated, net 18,751 19,782 Total capital assets 20,615 21,472
Total other assets 22,859 23,936 Total assets 37,582 38,651
LiabilitiesCurrent liabilities:
Accounts payable and accrued expenses 194 224Advances from project participants 483 483Due to Midshore Recycling - 456Current portion of long-term debt and capitalized leases 732 945 Total current liabilities 1,409 2,108
Other liabilities:Long-term debt and capitalized leases, net of current portion and bond discount 18,593 19,329Accrued landfill closure & postclosure care costs 9,792 9,646 Total other liabilities 28,385 28,975 Total liabilities 29,794 31,083
Net PositionInvested in capital assets, net of related debt 1,290 1,197Net assets designated-closure/post closure 5,282 4,951Net assets designated-Easton 870 870Unrestricted net position 346 550 Total net position 7,788$ 7,568$
(Expressed in Thousands)

54 MARYLAND ENVIRONMENTAL SERVICE 2013 ANNUAL REPORT
The accompanying notes are an integral part of these financial statements.
Midshore Regional Landfill Private Purpose Trust FundStatements of Revenue, Expenses and Changes in Net Position
For the years ended June 30, 2013 and 2012
2013 2012
Operating revenue:
Charges for services 5,160$ 6,258$
Operating expenses:Salaries and benefits 1,093 1,161Contractual services 149 661Technical fees 57 81Utilities 36 143Operations and maintenance 505 439Materials and supplies 174 173Land, structures and equipment 78 172Depreciation 1,050 1,052Closure/post closure 598 989General and administrative 342 351Other, net 79 (99)
Total operating expenses 4,161 5,123Operating income (loss) 999 1,135
Nonoperating revenue (expenses):Interest income 49 13Interest expense (828) (862)
Nonoperating expenses, net (779) (849)
Change in net position 220 286
Net position, beginning of year 7,568 7,282Net position, end of year 7,788$ 7,568$
(Expressed in Thousands)
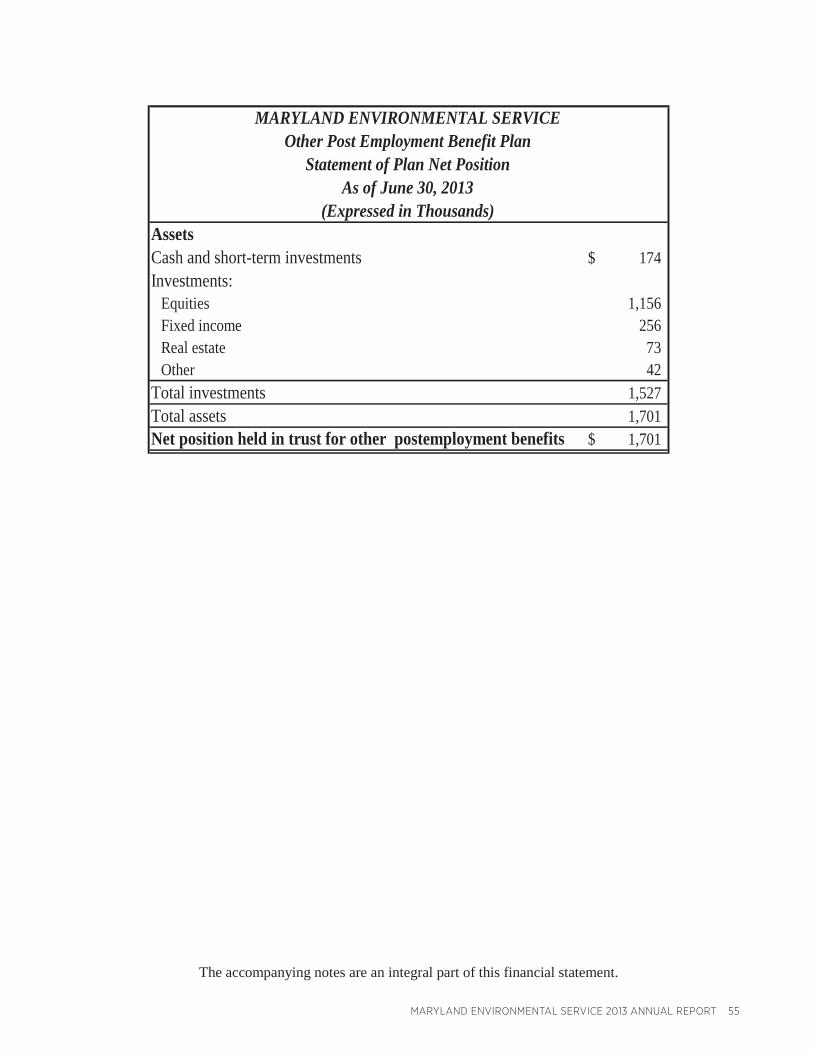
MARYLAND ENVIRONMENTAL SERVICE 2013 ANNUAL REPORT 55
The accompanying notes are an integral part of this financial statement.
MARYLAND ENVIRONMENTAL SERVICEOther Post Employment Benefit Plan
Statement of Plan Net PositionAs of June 30, 2013
AssetsCash and short-term investments 174$Investments:
Equities 1,156Fixed income 256Real estate 73Other 42
Total investments 1,527Total assets 1,701Net position held in trust for other postemployment benefits 1,701$
(Expressed in Thousands)
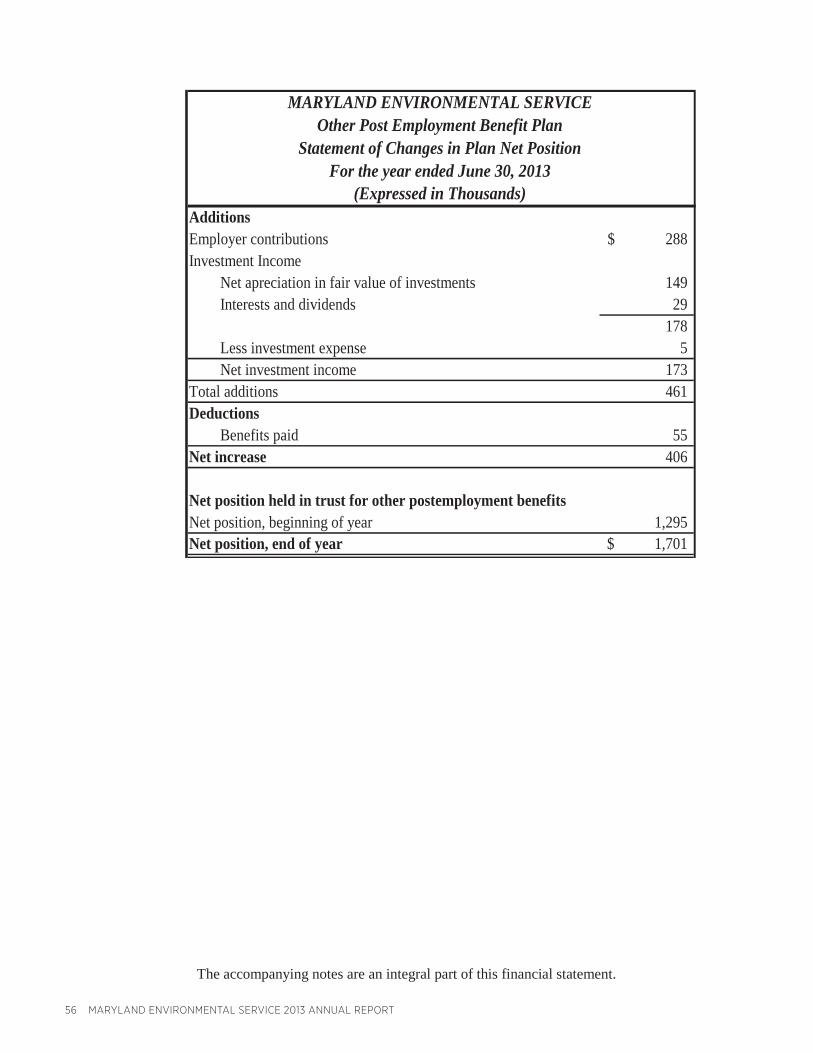
56 MARYLAND ENVIRONMENTAL SERVICE 2013 ANNUAL REPORT
The accompanying notes are an integral part of this financial statement.
MARYLAND ENVIRONMENTAL SERVICEOther Post Employment Benefit Plan
Statement of Changes in Plan Net PositionFor the year ended June 30, 2013
AdditionsEmployer contributions 288$Investment Income
Net apreciation in fair value of investments 149Interests and dividends 29
178Less investment expense 5Net investment income 173
Total additions 461Deductions
Benefits paid 55Net increase 406
Net position held in trust for other postemployment benefitsNet position, beginning of year 1,295Net position, end of year 1,701$
(Expressed in Thousands)
MARYLAND ENVIRONMENTAL SERVICE 2013 ANNUAL REPORT 57
Maryland Environmental ServiceNotes to Financial Statements
June 30, 2013 and 2012(In thousands except where noted)
(1) Organization and Summary of Significant Accounting Policies
(a) Reporting Entity
The General Assembly created Maryland Environmental Service (the Service) in 1970 as an agency of the Maryland State Department of Natural Resources. Major activities of the Service include the provision of water supply and wastewater treatment, sewage sludge management, recycling assistance, solid waste management, and resource recovery from waste and dredging services. Services are provided to State of Maryland owned facilities, local communities, political subdivisions, Federal facilities, and the private sector.
Pursuant to Chapter 196 of the 1993 Acts of the Maryland General Assembly, effective July 1, 1993, the Service was established as an instrumentality of the State and a public corporation independent of the Department of Natural Resources. Chapter 196 also expanded the Service’s Board of Directors from seven to nine members; provided for the appointment of the Deputy Director, Secretary and Treasurer by the Director, with the approval of the Governor; provided for the appointment of the remaining Board members by the Governor, with the advice and consent of the Senate; exempted the Service from most provisions of the State Procurement Law; established the retirement and health benefits available for certain employees of the Service; authorized the Service to create a new personnel system; exempted the Service from most provisions of the State Merit System Law effective January 1, 1995; authorized the Service to create private corporations; authorized the Service to exercise the corporate powers granted Maryland corporations under the Maryland General Corporation Law; and made other changes to the law governing the Service. For financial reporting purposes, the Service is considered a component unit of the State of Maryland.
The Service operates public and private water and wastewater treatment plants throughout the State of Maryland. Licensed and certified personnel operate and maintain the facilities. Projects range in size from basic pumping stations to advanced wastewater treatment facilities. Capabilities include laboratory testing, operations oversight, and management, operations, maintenance and plant supervision.
In the area of solid waste management, the Service operates state-of-the-art waste facilities including municipal solid waste and rubble landfills, incinerators, resource reclamation facilities in Baltimore and Montgomery Counties, and transfer stations in Baltimore County.
The Service has the capabilities to provide site analysis, planning, engineering, design and construction services, and the resources to finance and build water, wastewater and solid waste projects. The Service operates the Hart-Miller Island, Poplar Island, and Cox Creek Dredge Disposal Facilities as well as provides technical support for the Maryland Port Administration.
The Service produces and sells yard waste compost for Montgomery, Baltimore, Anne Arundel, Howard and Prince George’s Counties under the registered trademark Leafgro®.
Certain employees of the Service are eligible to participate in the Retiree Medical Reimbursement Plan (OPEB Plan), which is a single employer defined benefit plan administered by the Service. The plan is considered part of the Service’s financial reporting entity. A separate report for the OPEB Plan is prepared.
58 MARYLAND ENVIRONMENTAL SERVICE 2013 ANNUAL REPORT
Maryland Environmental Service Notes to Financial Statements
June 30, 2012 and 2011 (In thousands except where noted)
21
(1) Organization and Summary of Significant Accounting Policies (continued)
(b) Measurement focus, basis of accounting, and financial statement presentation The accompanying financial statements, which are all business type activities, present the financial position and results of operations of all of the Service’s activities. The Service utilizes the accrual basis of accounting and the economic measurement focus in preparing its financial statements wherein revenues are recognized when earned and expenses are recognized when incurred. Also, in preparing its financial statements, the Service has adopted paragraph 6 of GASB Statement No. 20 titled Accounting and Financial Reporting for Proprietary Funds and Other Governmental Entities that use Proprietary Fund Accounting under which the Service has applied only the applicable Financial Accounting Standards Board pronouncements issued on or before November 30, 1989, unless they conflict with GASB pronouncements. In December 2010, the Governmental Accounting Standards Board (GASB) issued Statement No. 62 (GASB 62) Codification of Accounting and Financial Reporting Guidance Contained in Pre-November 30, 1989 FASB and AICPA Pronouncements which intended to enhance the usefulness of the Codification of Governmental Accounting and Financial Reporting Standards by incorporating guidance that previously could only be found in certain FASB and AICPA pronouncements. The requirements of the GASB 62 are effective for financial statements for periods beginning after December 15, 2011. Earlier application is encouraged. The Service has evaluated the impact of the GASB 62 and does not expect a material impact on the financial statements. The Service also reports a private purpose trust fund. The purpose of this fund is to account for the operations of the Midshore Regional Landfills. The landfills, located in Talbot County, Maryland and Caroline County, Maryland, are operated for the benefit of the governments of Caroline, Kent, Queen Anne’s and Talbot Counties. The counties have the ultimate responsibility for payment of operating expenses and debt of the facility.
(c) Revenue Recognition The Service distinguishes operating revenue and expenses from nonoperating items. Operating revenue and expenses generally result from providing services and producing and delivering goods in connection with ongoing operations. The principal operating revenue of the Service are charges to customers for services. Operating expenses include the cost of services, administrative expenses, and depreciation on capital assets. All revenue and expenses not meeting this definition are reported as nonoperating revenue and expenses. Interest income is recognized as nonoperating revenue as earned of which $1 thousand and $4 thousand during the years ended June 30, 2012 and 2011 was restricted for bond related activities. Grants and similar items are recognized as soon as all eligibility requirements imposed by the provider have been met.
(d) Cash Equivalents The Service’s cash is considered to be cash on hand and demand deposits. Cash equivalents include overnight investment funds.
(e) Investments Investments are recorded at fair value, which are based on quoted market prices.
Maryland Environmental ServiceNotes to Financial Statements
June 30, 2013 and 2012(In thousands except where noted)
(1) Organization and Summary of Significant Accounting Policies (continued)
(b) Measurement focus, basis of accounting, and financial statement presentation
The accompanying financial statements, which are all business type activities, present the financial position and results of operations of all of the Service’s activities. The Service utilizes the accrual basis of accounting and the economic measurement focus in preparing its financial statements wherein revenues are recognized when earned and expenses are recognized when incurred.
The Service also reports a private purpose trust fund. The purpose of this fund is to account for the operations of the Midshore Regional Landfills. The landfills, located in Talbot County, Maryland and Caroline County, Maryland, are operated for the benefit of the governments of Caroline, Kent, Queen Anne’s and Talbot Counties. The counties have the ultimate responsibility for payment of operating expenses and debt of the facility.
(c) Revenue Recognition
The Service distinguishes operating revenue and expenses from nonoperating items. Operating revenueand expenses generally result from providing services and producing and delivering goods in connection with ongoing operations. The principal operating revenue of the Service are charges to customers for services. Operating expenses include the cost of services, administrative expenses, and depreciation oncapital assets. All revenue and expenses not meeting this definition are reported as nonoperating revenueand expenses. Interest income is recognized as nonoperating revenue as earned, of which less than$1thousand and $1 thousand during the years ended June 30, 2013 and 2012, respectively, was restricted for bond related activities. Grants and similar items are recognized as soon as all eligibility requirements imposed by the provider have been met.
(d) Cash Equivalents
The Service’s cash is considered to be cash on hand and demand deposits. Cash equivalents include overnight investment funds.
(e) Investments
Investments are recorded at fair value, which is based on quoted market prices.
(f) Direct Financing Leases
The Service acts as lessor in direct financing lease arrangements for certain customer’s projects and equipment. Such leases expired during fiscal year 2013 along with the related debt.

MARYLAND ENVIRONMENTAL SERVICE 2013 ANNUAL REPORT 59
Maryland Environmental ServiceNotes to Financial Statements
June 30, 2013 and 2012(In thousands except where noted)
(1) Organization and Summary of Significant Accounting Policies (continued)
(g) Capital Assets
Capital assets are stated at cost and consist primarily of Service-owned assets related to projects operated for participants. Certain contracts contain provisions whereby the participants have the option to purchase certain equipment during the terms of the contracts.
The Service defines capital assets as assets with an initial, individual cost of more than $5,000 (amount not rounded to thousands) and an estimated useful life in excess of one year. The costs of normal maintenance and repairs that do not add to the value of the assets or materially extend an assets’ life are not capitalized.
Major outlays for capital assets and improvements are capitalized as projects are constructed. Interest incurred net of interest earned during the construction phase of capital assets is included as part of the capitalized value of the assets constructed. No interest was capitalized in fiscal year 2013 and 2012.
Depreciation is computed using the straight-line method over the estimated useful lives of the capital assets, which range from 3 to 40 years. For purposes of the statements of revenue, expenses and changes in net position, the depreciation on assets, which are not directly related to projects, are included in general and administrative expenses and product costs.
Certain contracts contain provisions whereby the Service purchases equipment or constructs assets for clients. These expenses are recorded as land, structures and equipment in the statements of revenue,expenses and changes in net position and are not capitalized.
(h) Compensated absences
Employees of the Service based on time in service earn vacation benefits. The rights to such benefits are vested and recorded as earned. Sick leave is also earned and accumulated by employees based on time in service. However, such benefits do not vest and are not paid or recorded unless sickness causes employees to be absent.
(i) Other Post-Employment Benefits (OPEB)
Plan Description. The Service provides a self-funded medical reimbursement plan to eligible employeesnot covered under the State Retiree Medical Plan. To be eligible, employees must retire at age 60 or older and have 16 years of employment with the Service. Retired employees or their spouses ages 60 and over can be reimbursed up to $3,600 per calendar year for medical expenses. Retirees are not required to contribute to the plan.
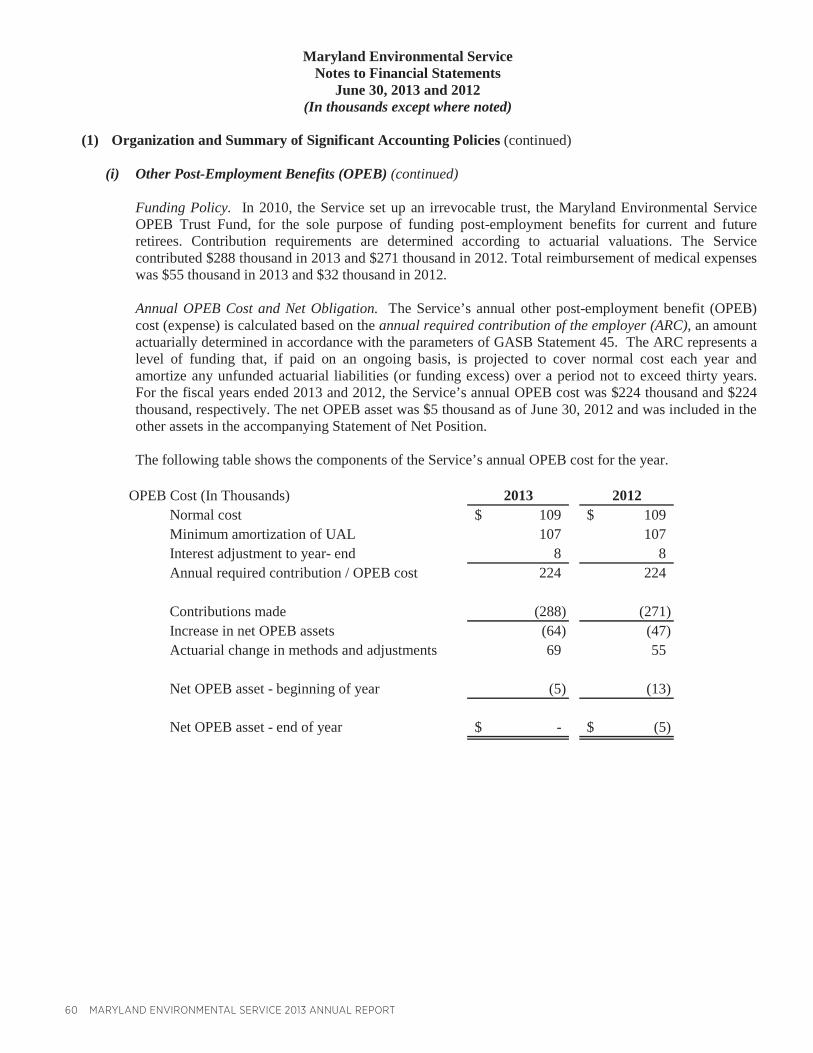
60 MARYLAND ENVIRONMENTAL SERVICE 2013 ANNUAL REPORT
Maryland Environmental ServiceNotes to Financial Statements
June 30, 2013 and 2012(In thousands except where noted)
(1) Organization and Summary of Significant Accounting Policies (continued)
(i) Other Post-Employment Benefits (OPEB) (continued)
Funding Policy. In 2010, the Service set up an irrevocable trust, the Maryland Environmental Service OPEB Trust Fund, for the sole purpose of funding post-employment benefits for current and future retirees. Contribution requirements are determined according to actuarial valuations. The Servicecontributed $288 thousand in 2013 and $271 thousand in 2012. Total reimbursement of medical expenses was $55 thousand in 2013 and $32 thousand in 2012.
Annual OPEB Cost and Net Obligation. The Service’s annual other post-employment benefit (OPEB) cost (expense) is calculated based on the annual required contribution of the employer (ARC), an amount actuarially determined in accordance with the parameters of GASB Statement 45. The ARC represents a level of funding that, if paid on an ongoing basis, is projected to cover normal cost each year and amortize any unfunded actuarial liabilities (or funding excess) over a period not to exceed thirty years. For the fiscal years ended 2013 and 2012, the Service’s annual OPEB cost was $224 thousand and $224 thousand, respectively. The net OPEB asset was $5 thousand as of June 30, 2012 and was included in the other assets in the accompanying Statement of Net Position.
The following table shows the components of the Service’s annual OPEB cost for the year.
OPEB Cost (In Thousands) 2013 2012Normal cost 109$ 109$Minimum amortization of UAL 107 107Interest adjustment to year- end 8 8Annual required contribution / OPEB cost 224 224
Contributions made (288) (271)Increase in net OPEB assets (64) (47)Actuarial change in methods and adjustments 69 55
Net OPEB asset - beginning of year (5) (13)
Net OPEB asset - end of year -$ (5)$
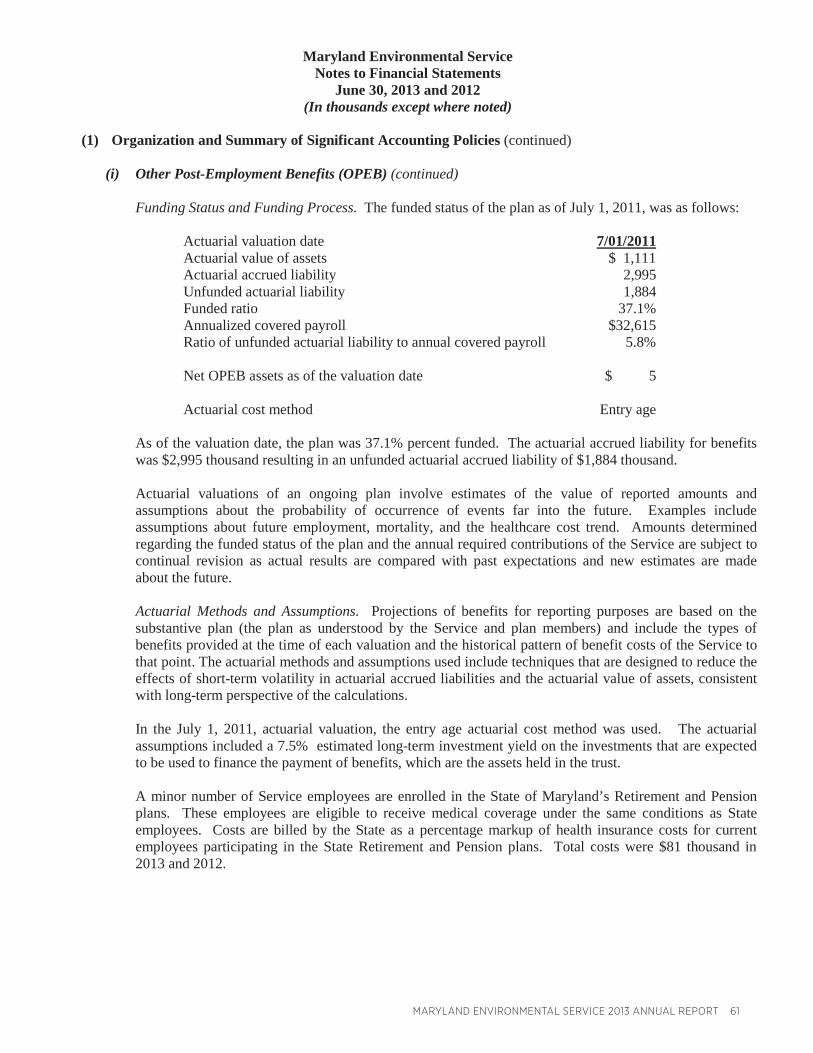
MARYLAND ENVIRONMENTAL SERVICE 2013 ANNUAL REPORT 61
Maryland Environmental ServiceNotes to Financial Statements
June 30, 2013 and 2012(In thousands except where noted)
(1) Organization and Summary of Significant Accounting Policies (continued)
(i) Other Post-Employment Benefits (OPEB) (continued)
Funding Status and Funding Process. The funded status of the plan as of July 1, 2011, was as follows:
Actuarial valuation date 7/01/2011Actuarial value of assets $ 1,111 Actuarial accrued liability 2,995Unfunded actuarial liability 1,884Funded ratio 37.1%Annualized covered payroll $32,615Ratio of unfunded actuarial liability to annual covered payroll 5.8%
Net OPEB assets as of the valuation date $ 5
Actuarial cost method Entry age
As of the valuation date, the plan was 37.1% percent funded. The actuarial accrued liability for benefits was $2,995 thousand resulting in an unfunded actuarial accrued liability of $1,884 thousand.
Actuarial valuations of an ongoing plan involve estimates of the value of reported amounts and assumptions about the probability of occurrence of events far into the future. Examples include assumptions about future employment, mortality, and the healthcare cost trend. Amounts determined regarding the funded status of the plan and the annual required contributions of the Service are subject to continual revision as actual results are compared with past expectations and new estimates are made about the future.
Actuarial Methods and Assumptions. Projections of benefits for reporting purposes are based on the substantive plan (the plan as understood by the Service and plan members) and include the types of benefits provided at the time of each valuation and the historical pattern of benefit costs of the Service tothat point. The actuarial methods and assumptions used include techniques that are designed to reduce the effects of short-term volatility in actuarial accrued liabilities and the actuarial value of assets, consistent with long-term perspective of the calculations.
In the July 1, 2011, actuarial valuation, the entry age actuarial cost method was used. The actuarial assumptions included a 7.5% estimated long-term investment yield on the investments that are expected to be used to finance the payment of benefits, which are the assets held in the trust.
A minor number of Service employees are enrolled in the State of Maryland’s Retirement and Pension plans. These employees are eligible to receive medical coverage under the same conditions as State employees. Costs are billed by the State as a percentage markup of health insurance costs for current employees participating in the State Retirement and Pension plans. Total costs were $81 thousand in 2013 and 2012.
62 MARYLAND ENVIRONMENTAL SERVICE 2013 ANNUAL REPORT
Maryland Environmental ServiceNotes to Financial Statements
June 30, 2013 and 2012(In thousands except where noted)
(1) Organization and Summary of Significant Accounting Policies (continued)
(j) Advances from Project Participants
Advances from project participants are received by the Service as provided for under contracts and are generally for working capital purposes. Such advances are recorded as a liability and are generally refunded to project participants at the end of the related contracts.
(k) Bond Discount
Bond discount is amortized to interest expense using the interest method over the contractual term of the bonds.
(l) Arbitrage
The U.S. Treasury has issued regulations on calculating the rebate due to the Federal government on arbitrage profits and determining compliance with the arbitrage rebate provisions of the Tax Reform Act of 1986. Arbitrage profits arise when the Service temporarily invests the proceeds of tax-exempt debt in securities with higher yields. The Service treats the estimated rebate payable as a reduction of any interest income earned. As of June 30, 2013 and 2012, there were no arbitrage rebate liabilities.
(m) Use of Estimates
The preparation of financial statements in accordance with accounting principles generally accepted in the United States of America requires management to make estimates and assumptions that affect the reported amounts of assets and liabilities and disclosures of contingencies at the date the financial statements and the reported amounts of revenues and expenses during the period. Actual results could differ from these estimates.
(n) Recent Pronouncements
The Governmental Accounting Standards Board (GASB) issued Statement No. 62, Codification of Accounting and Financial Reporting Guidance Contained in Pre-November 30, 1989 FASB and AICPA Pronouncements, in December 2010, effective for financial statement periods beginning after December 15, 2011. In November 2010, the GASB issued Statement No. 60, Accounting and Financial Reporting for Service Concession Arrangements, and Statement No. 61, The Financial Reporting Entity: Omnibus –an amendment of GASB Statements No. 14 and No. 34, effective for periods beginning after December 15, 2011 and June 15, 2012, respectively. In addition, in June 2011, the GASB issued Statement No. 63, Financial Reporting of Deferred Outflows of Resources, Deferred Inflows of Resources, and Net Position, effective for periods beginning after December 15, 2011. The Service has implemented the above GASB statements, and they have no material effect on the financial position of the Service.
MARYLAND ENVIRONMENTAL SERVICE 2013 ANNUAL REPORT 63
Maryland Environmental ServiceNotes to Financial Statements
June 30, 2013 and 2012(In thousands except where noted)
(1) Organization and Summary of Significant Accounting Policies (continued)
(n) Recent Pronouncements
In March 2012, the GASB issued Statement No. 65, Items Previously Reported as Assets and Liabilities, and Statement No. 66, Technical Corrections – 2012 – an amendment of GASB Statements No. 10 and No. 62, effective for periods beginning after December 15, 2012. In June 2012, the GASB issued Statement No. 67, Financial Reporting for Pension Plans – an amendment of GASB Statement No. 25, and Statement No. 68, Accounting and Financial Reporting for Pensions – an amendment of GASB Statement No. 27, effective for periods beginning after June 15, 2013, and 2014, respectively. In January 2013, GASB issued Statement No. 69, Government Combination and Disposals of Government Operations, effective for periods beginning after December 15, 2013. In April 2013, GASB issued Statement No. 70, Accounting and Financial Reporting for Non-exchange Guarantees, effective for periods beginning after June 15, 2013. The Service will implement these statements as of their effective dates. The Service is still in the process of determining the effect of implementing these GASB statements.
(2) Cash and Cash Equivalents and Investments
State statutes require that deposits and investments with financial institutions be fully collateralized. The investment policies for all of the Service’s funds are the same as those of the State of Maryland Treasurer (Financial Procurement Article 6-222). The Service’s cash is considered to be cash on hand and demand deposits. Cash and cash equivalents totaled $44,388 thousand and $34,965 thousand as of June 30, 2013 and 2012, respectively. Included, as cash equivalents for financial statement presentation, were certain overnightinvestments of $45,120 thousand and $36,653 thousand, respectively, as of June 30, 2013 and 2012, which are included in the investment discussion below. Investments are valued at fair value, which is based on quoted market prices.
The Finance and Procurement Article 6-222 defines the types of securities authorized as appropriate investments for the Service and the conditions for making investment transactions. Investment transactions may be conducted only through qualified depositories, certified dealers, or directly with issuers of the investment securities. The National Resource Article 3-126 authorizes the investment in obligation as described in the Finance and Procurement Article 6-222.
Interest rate risk is the risk that changes in interest rates will adversely affect the fair value of an investment. The Service policy for managing its exposure to fair value loss arising from increasing interest rates is to comply with the State. The Service intends to hold investments until maturity to reduce adverse affect of changes in interest rates.
Credit risk is the risk that an issuer or other counterparty to an investment will not fulfill its obligations. The Service’s policy for reducing its exposure to credit risk is to comply with the State, which states that investments with financial institutions must be fully collateralized.
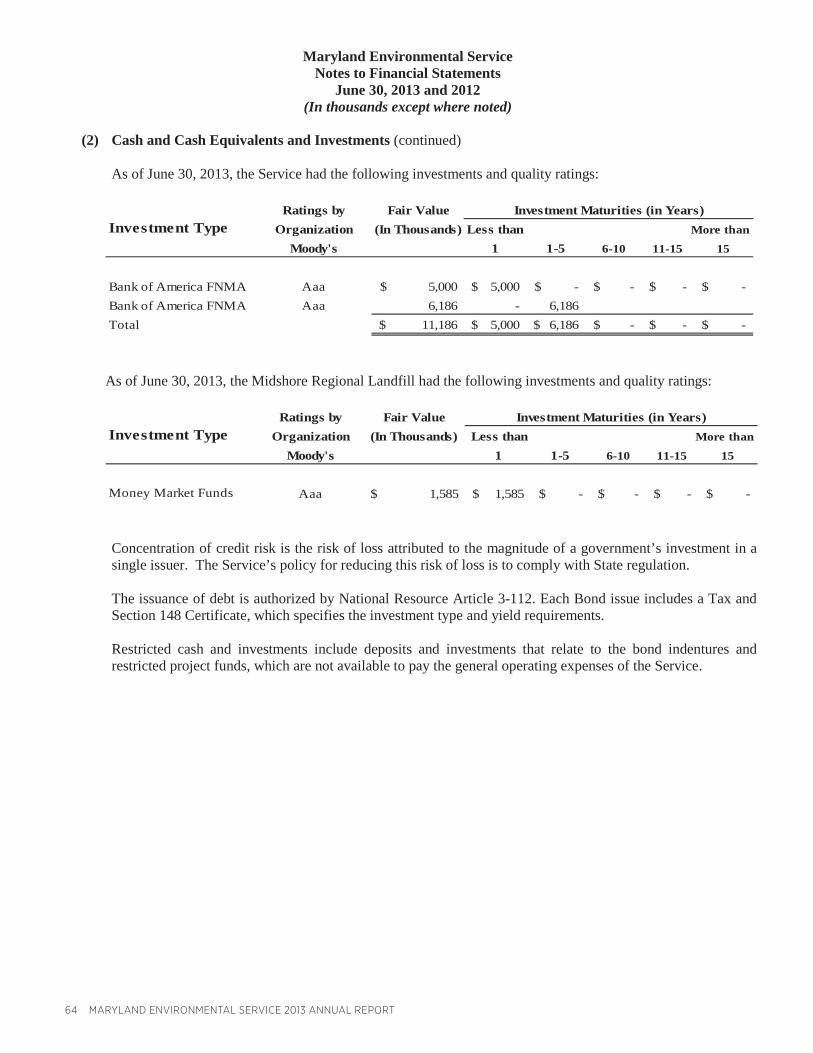
64 MARYLAND ENVIRONMENTAL SERVICE 2013 ANNUAL REPORT
Maryland Environmental ServiceNotes to Financial Statements
June 30, 2013 and 2012(In thousands except where noted)
(2) Cash and Cash Equivalents and Investments (continued)
As of June 30, 2013, the Service had the following investments and quality ratings:
Ratings by Fair ValueInvestment Type Organization (In Thousands) Less than More than
Moody's 1 1-5 6-10 11-15 15
Bank of America FNMA Aaa 5,000$ 5,000$ -$ -$ -$ -$ Bank of America FNMA Aaa 6,186 - 6,186Total 11,186$ 5,000$ 6,186$ -$ -$ -$
Investment Maturities (in Years)
As of June 30, 2013, the Midshore Regional Landfill had the following investments and quality ratings:
Ratings by Fair ValueInvestment Type Organization (In Thousands) Less than More than
Moody's 1 1-5 6-10 11-15 15
Money Market Funds Aaa 1,585$ 1,585$ -$ -$ -$ -$
Investment Maturities (in Years)
Concentration of credit risk is the risk of loss attributed to the magnitude of a government’s investment in a single issuer. The Service’s policy for reducing this risk of loss is to comply with State regulation.
The issuance of debt is authorized by National Resource Article 3-112. Each Bond issue includes a Tax and Section 148 Certificate, which specifies the investment type and yield requirements.
Restricted cash and investments include deposits and investments that relate to the bond indentures and restricted project funds, which are not available to pay the general operating expenses of the Service.
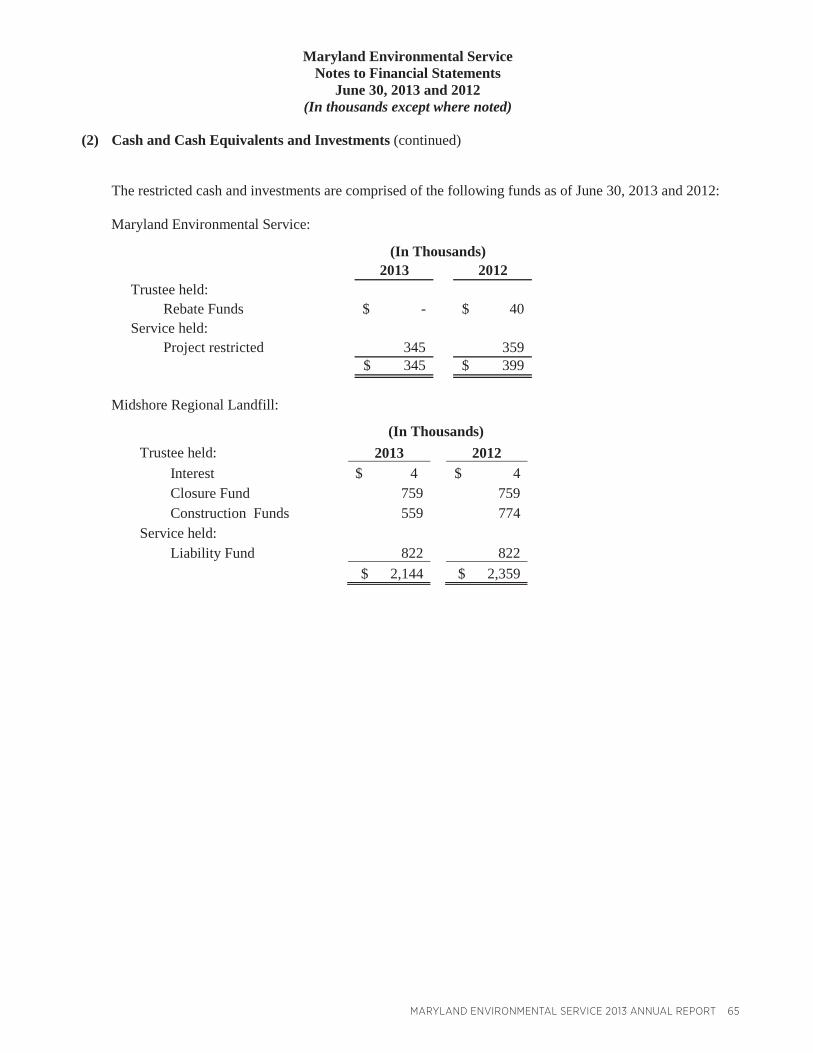
MARYLAND ENVIRONMENTAL SERVICE 2013 ANNUAL REPORT 65
Maryland Environmental ServiceNotes to Financial Statements
June 30, 2013 and 2012(In thousands except where noted)
(2) Cash and Cash Equivalents and Investments (continued)
The restricted cash and investments are comprised of the following funds as of June 30, 2013 and 2012:
Maryland Environmental Service:
(In Thousands)2013 2012
Trustee held:Rebate Funds -$ 40$
Service held:Project restricted 345 359
345$ 399$
Midshore Regional Landfill:
(In Thousands)Trustee held: 2013 2012
Interest $ 4 $ 4Closure Fund 759 759Construction Funds 559 774
Service held:Liability Fund 822 822
$ 2,144 $ 2,359
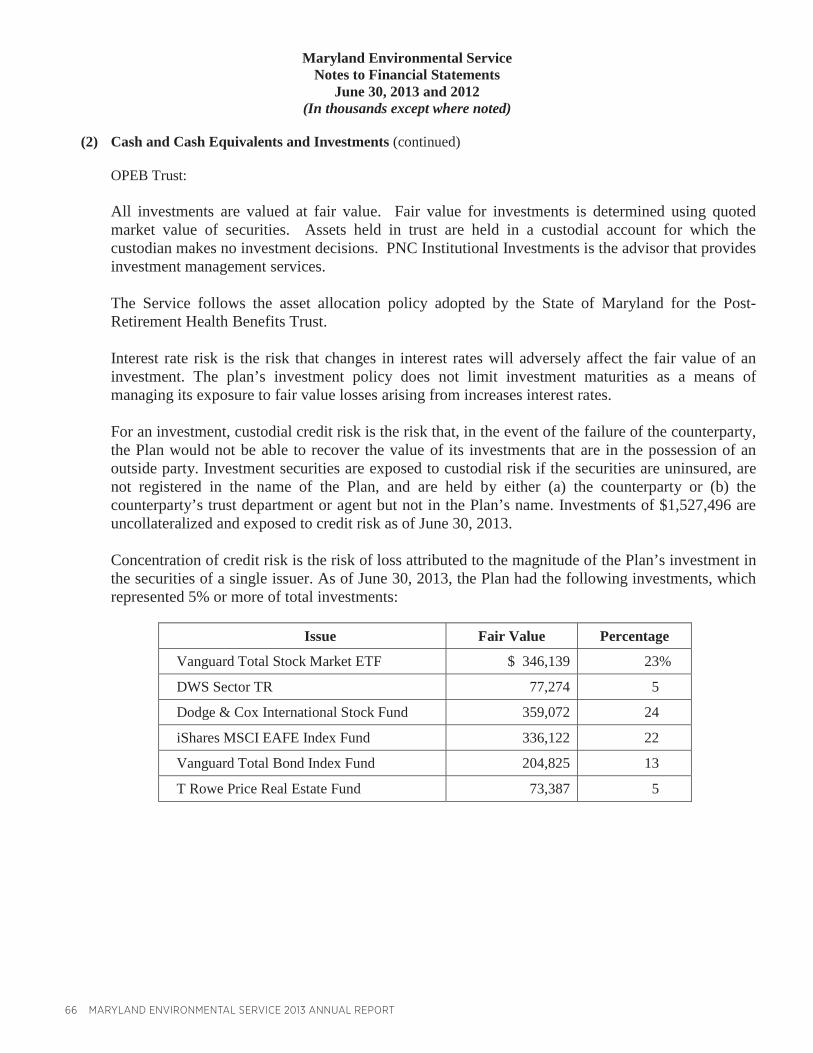
66 MARYLAND ENVIRONMENTAL SERVICE 2013 ANNUAL REPORT
Maryland Environmental ServiceNotes to Financial Statements
June 30, 2013 and 2012(In thousands except where noted)
(2) Cash and Cash Equivalents and Investments (continued)
OPEB Trust:
All investments are valued at fair value. Fair value for investments is determined using quoted market value of securities. Assets held in trust are held in a custodial account for which the custodian makes no investment decisions. PNC Institutional Investments is the advisor that provides investment management services.
The Service follows the asset allocation policy adopted by the State of Maryland for the Post-Retirement Health Benefits Trust.
Interest rate risk is the risk that changes in interest rates will adversely affect the fair value of an investment. The plan’s investment policy does not limit investment maturities as a means of managing its exposure to fair value losses arising from increases interest rates.
For an investment, custodial credit risk is the risk that, in the event of the failure of the counterparty, the Plan would not be able to recover the value of its investments that are in the possession of an outside party. Investment securities are exposed to custodial risk if the securities are uninsured, are not registered in the name of the Plan, and are held by either (a) the counterparty or (b) the counterparty’s trust department or agent but not in the Plan’s name. Investments of $1,527,496 are uncollateralized and exposed to credit risk as of June 30, 2013.
Concentration of credit risk is the risk of loss attributed to the magnitude of the Plan’s investment in the securities of a single issuer. As of June 30, 2013, the Plan had the following investments, which represented 5% or more of total investments:
Issue Fair Value Percentage
Vanguard Total Stock Market ETF $ 346,139 23%
DWS Sector TR 77,274 5
Dodge & Cox International Stock Fund 359,072 24
iShares MSCI EAFE Index Fund 336,122 22
Vanguard Total Bond Index Fund 204,825 13
T Rowe Price Real Estate Fund 73,387 5
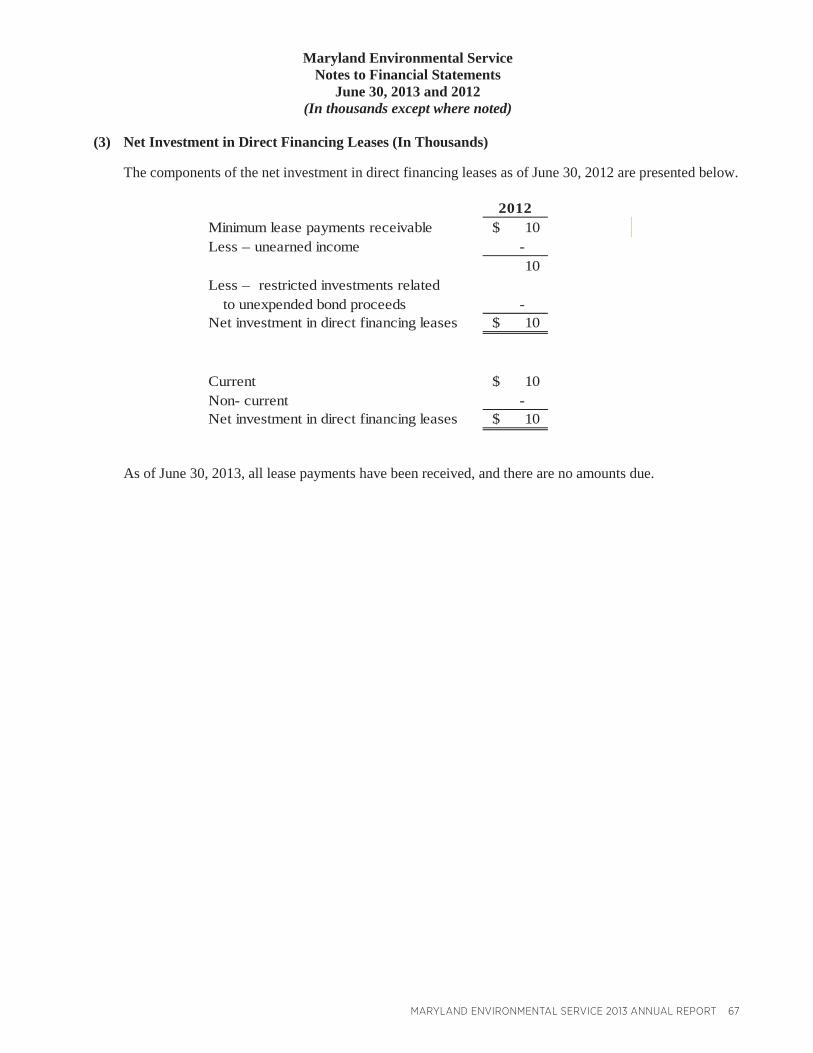
MARYLAND ENVIRONMENTAL SERVICE 2013 ANNUAL REPORT 67
Maryland Environmental ServiceNotes to Financial Statements
June 30, 2013 and 2012(In thousands except where noted)
(3) Net Investment in Direct Financing Leases (In Thousands)
The components of the net investment in direct financing leases as of June 30, 2012 are presented below.
2012Minimum lease payments receivable 10$Less – unearned income -
10Less – restricted investments related
to unexpended bond proceeds -Net investment in direct financing leases 10$
Current 10$Non- current -Net investment in direct financing leases 10$
As of June 30, 2013, all lease payments have been received, and there are no amounts due.
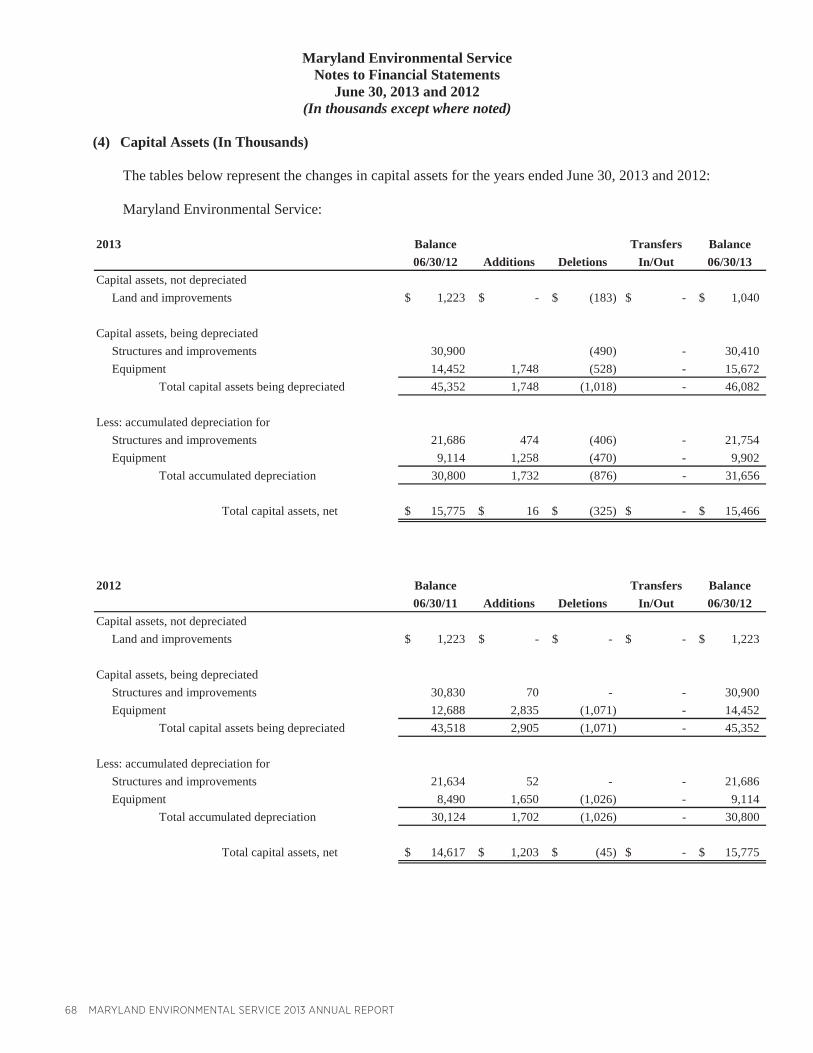
68 MARYLAND ENVIRONMENTAL SERVICE 2013 ANNUAL REPORT
Maryland Environmental ServiceNotes to Financial Statements
June 30, 2013 and 2012(In thousands except where noted)
(4) Capital Assets (In Thousands)
The tables below represent the changes in capital assets for the years ended June 30, 2013 and 2012:
Maryland Environmental Service:
2013 Balance Transfers Balance06/30/12 Additions Deletions In/Out 06/30/13
Capital assets, not depreciated Land and improvements 1,223$ -$ (183)$ -$ 1,040$
Capital assets, being depreciated Structures and improvements 30,900 (490) - 30,410 Equipment 14,452 1,748 (528) - 15,672
Total capital assets being depreciated 45,352 1,748 (1,018) - 46,082
Less: accumulated depreciation for Structures and improvements 21,686 474 (406) - 21,754 Equipment 9,114 1,258 (470) - 9,902
Total accumulated depreciation 30,800 1,732 (876) - 31,656
Total capital assets, net 15,775$ 16$ (325)$ -$ 15,466$
2012 Balance Transfers Balance06/30/11 Additions Deletions In/Out 06/30/12
Capital assets, not depreciated Land and improvements 1,223$ -$ -$ -$ 1,223$
Capital assets, being depreciated Structures and improvements 30,830 70 - - 30,900 Equipment 12,688 2,835 (1,071) - 14,452
Total capital assets being depreciated 43,518 2,905 (1,071) - 45,352
Less: accumulated depreciation for Structures and improvements 21,634 52 - - 21,686 Equipment 8,490 1,650 (1,026) - 9,114
Total accumulated depreciation 30,124 1,702 (1,026) - 30,800
Total capital assets, net 14,617$ 1,203$ (45)$ -$ 15,775$
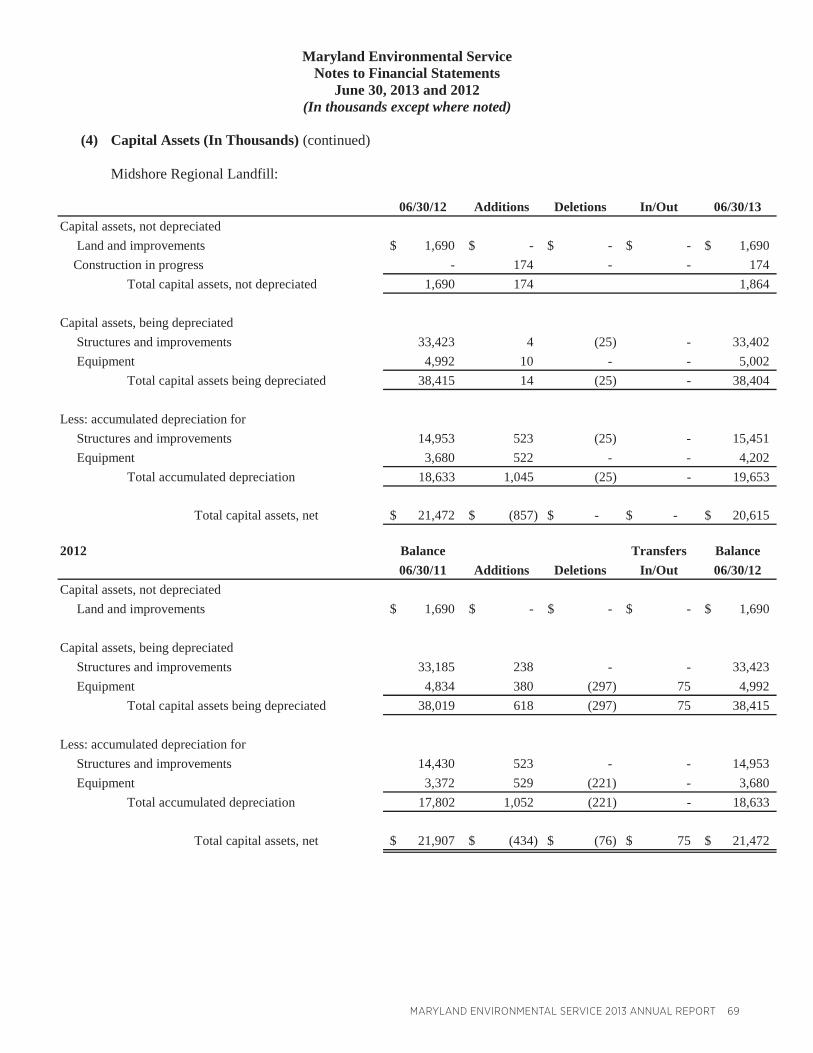
MARYLAND ENVIRONMENTAL SERVICE 2013 ANNUAL REPORT 69
Maryland Environmental ServiceNotes to Financial Statements
June 30, 2013 and 2012(In thousands except where noted)
(4) Capital Assets (In Thousands) (continued)
Midshore Regional Landfill:
06/30/12 In/Out 06/30/13Capital assets, not depreciated Land and improvements 1,690$ -$ -$ -$ 1,690$ Construction in progress - 174 - - 174
Total capital assets, not depreciated 1,690 174 1,864
Capital assets, being depreciated Structures and improvements 33,423 4 (25) - 33,402 Equipment 4,992 10 - - 5,002
Total capital assets being depreciated 38,415 14 (25) - 38,404
Less: accumulated depreciation for Structures and improvements 14,953 523 (25) - 15,451 Equipment 3,680 522 - - 4,202
Total accumulated depreciation 18,633 1,045 (25) - 19,653
Total capital assets, net 21,472$ (857)$ -$ -$ 20,615$
Additions Deletions
2012 Balance Transfers Balance06/30/11 In/Out 06/30/12
Capital assets, not depreciated Land and improvements 1,690$ -$ -$ -$ 1,690$
Capital assets, being depreciated Structures and improvements 33,185 238 - - 33,423 Equipment 4,834 380 (297) 75 4,992
Total capital assets being depreciated 38,019 618 (297) 75 38,415
Less: accumulated depreciation for Structures and improvements 14,430 523 - - 14,953 Equipment 3,372 529 (221) - 3,680
Total accumulated depreciation 17,802 1,052 (221) - 18,633
Total capital assets, net 21,907$ (434)$ (76)$ 75$ 21,472$
Additions Deletions
70 MARYLAND ENVIRONMENTAL SERVICE 2013 ANNUAL REPORT
Maryland Environmental ServiceNotes to Financial Statements
June 30, 2013 and 2012(In thousands except where noted)
(5) Construction Commitments
There were no new construction commitments outstanding as of June 30, 2013.
(6) Concentrations of Credit
The Service derived approximately 59% and 63% of its revenue and had approximately 34% and 53% of accounts receivable outstanding in 2013 and 2012, respectively, from providing services to the State of Maryland.
(7) Leases (In Thousands)
Operating Leases
The Service leases office, warehouse, and parking space under operating leases, which expire over the next twenty years.
Rent expense for operating leases was $35 and $34 thousand for the years ended June 30, 2013 and 2012respectively.
Capital Leases
The Service has entered into several leases for financing the building, furniture, fixtures and equipment used in administration and project operations. These lease agreements qualify as capital leases for accounting purposes, therefore, have been recorded at the present value of their future minimum lease payments as of the inception date.
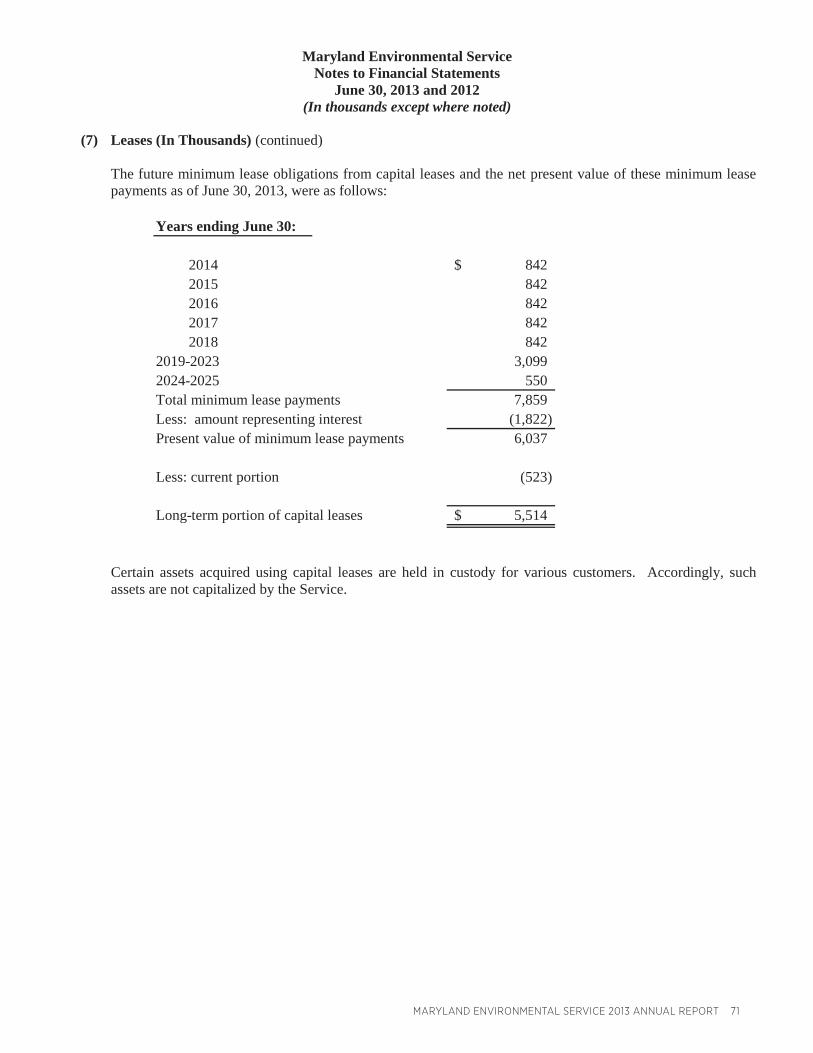
MARYLAND ENVIRONMENTAL SERVICE 2013 ANNUAL REPORT 71
Maryland Environmental ServiceNotes to Financial Statements
June 30, 2013 and 2012(In thousands except where noted)
(7) Leases (In Thousands) (continued)
The future minimum lease obligations from capital leases and the net present value of these minimum lease payments as of June 30, 2013, were as follows:
Years ending June 30:
2014 842$2015 8422016 8422017 8422018 842
2019-2023 3,0992024-2025 550Total minimum lease payments 7,859Less: amount representing interest (1,822)Present value of minimum lease payments 6,037
Less: current portion (523)
Long-term portion of capital leases 5,514$
Certain assets acquired using capital leases are held in custody for various customers. Accordingly, such assets are not capitalized by the Service.
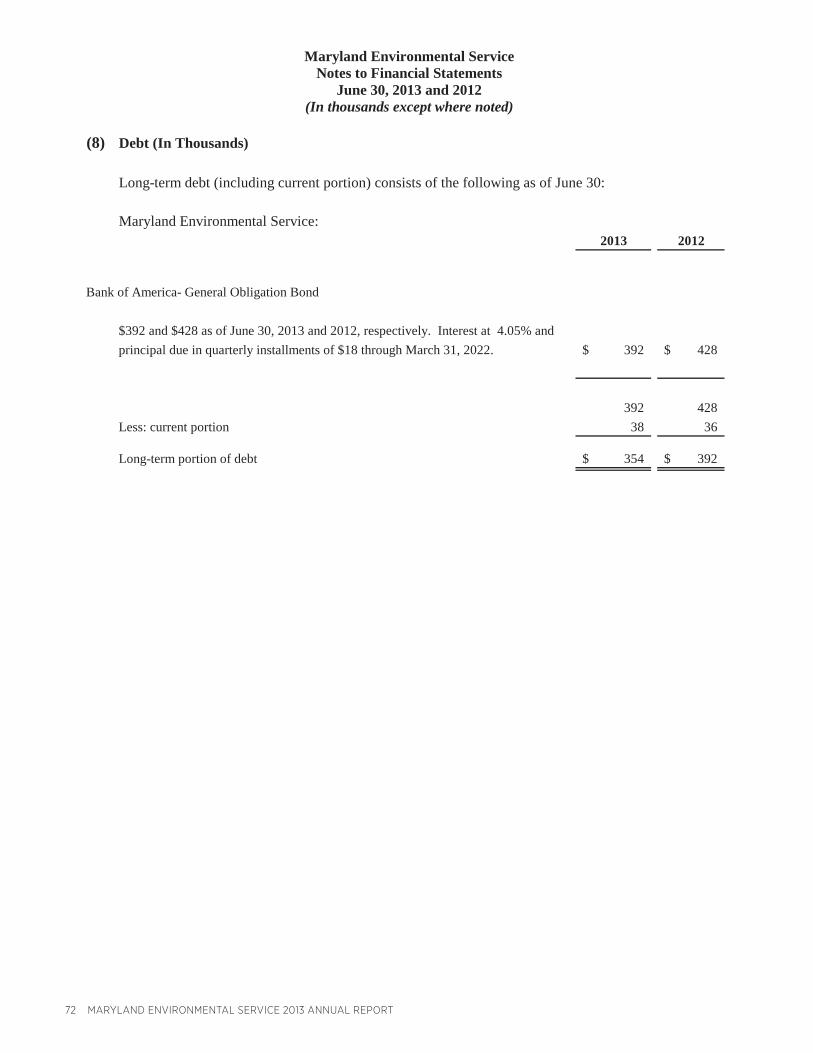
72 MARYLAND ENVIRONMENTAL SERVICE 2013 ANNUAL REPORT
Maryland Environmental ServiceNotes to Financial Statements
June 30, 2013 and 2012(In thousands except where noted)
(8) Debt (In Thousands)
Long-term debt (including current portion) consists of the following as of June 30:
Maryland Environmental Service: 2013 2012
Bank of America- General Obligation Bond
$392 and $428 as of June 30, 2013 and 2012, respectively. Interest at 4.05% andprincipal due in quarterly installments of $18 through March 31, 2022. 392$ 428$
392 428Less: current portion 38 36
Long-term portion of debt 354$ 392$
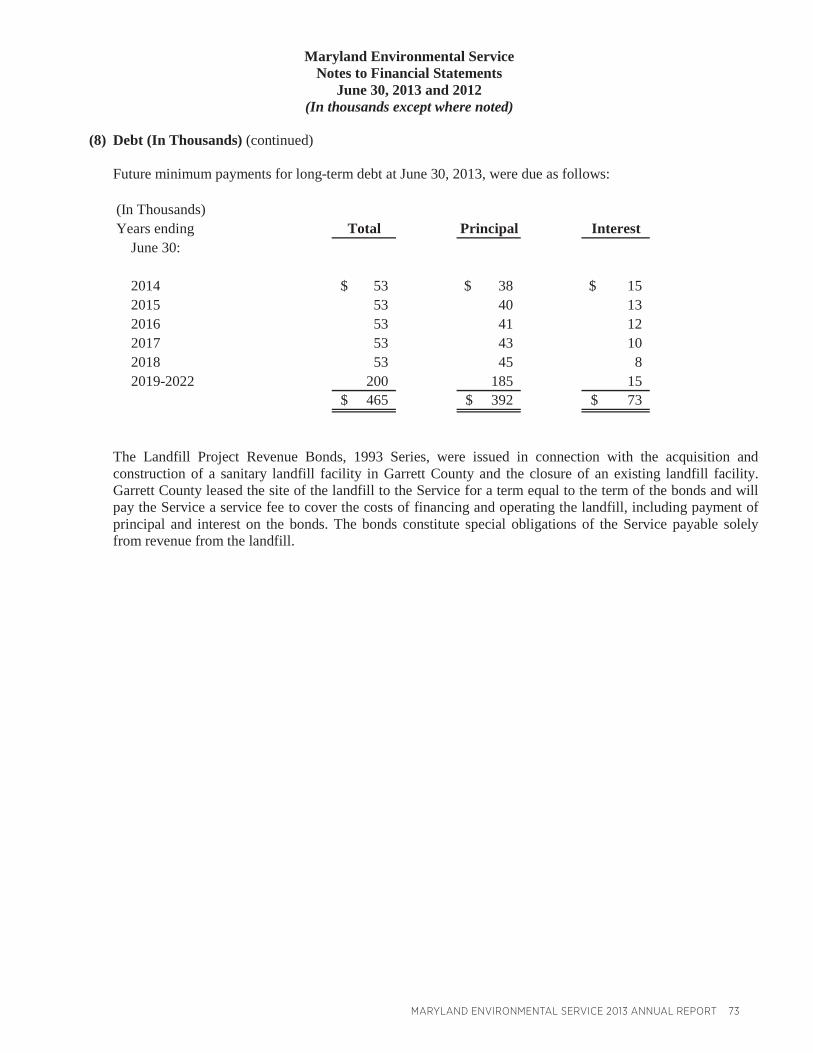
MARYLAND ENVIRONMENTAL SERVICE 2013 ANNUAL REPORT 73
Maryland Environmental ServiceNotes to Financial Statements
June 30, 2013 and 2012(In thousands except where noted)
(8) Debt (In Thousands) (continued)
Future minimum payments for long-term debt at June 30, 2013, were due as follows:
(In Thousands)Years ending Total Principal Interest
June 30:
2014 53$ 38$ 15$2015 53 40 132016 53 41 122017 53 43 102018 53 45 82019-2022 200 185 15
465$ 392$ 73$
The Landfill Project Revenue Bonds, 1993 Series, were issued in connection with the acquisition and construction of a sanitary landfill facility in Garrett County and the closure of an existing landfill facility. Garrett County leased the site of the landfill to the Service for a term equal to the term of the bonds and will pay the Service a service fee to cover the costs of financing and operating the landfill, including payment of principal and interest on the bonds. The bonds constitute special obligations of the Service payable solely from revenue from the landfill.
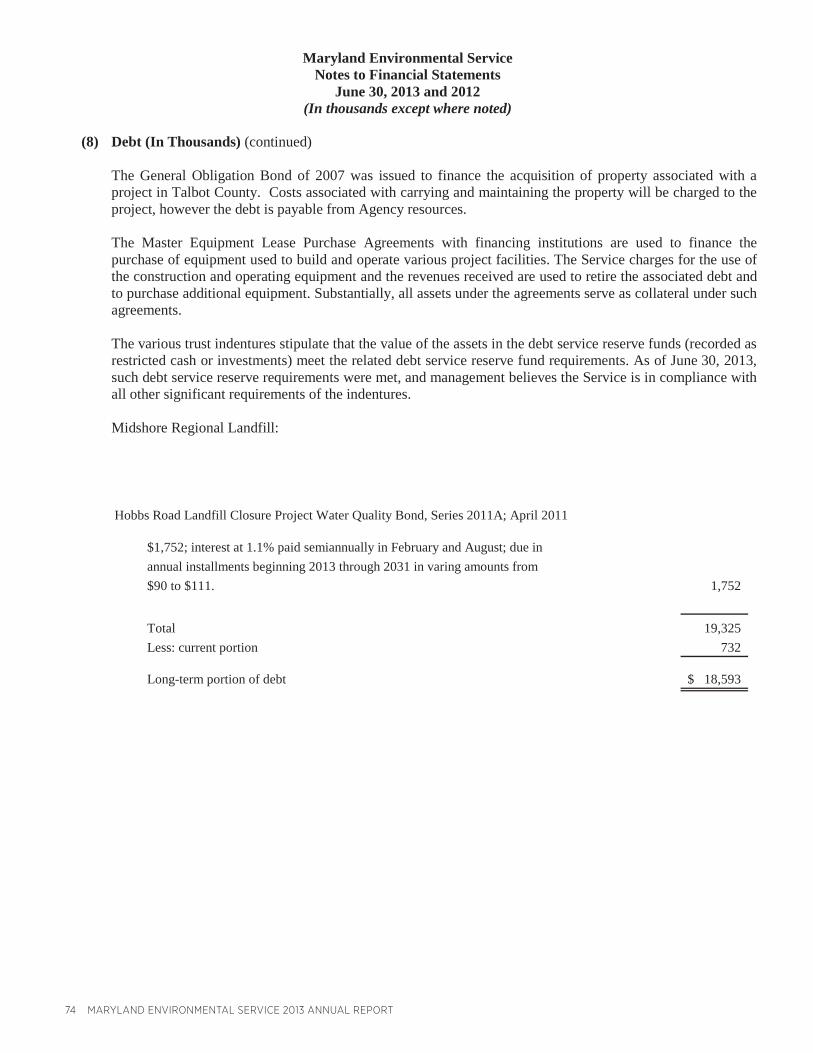
74 MARYLAND ENVIRONMENTAL SERVICE 2013 ANNUAL REPORT
Maryland Environmental ServiceNotes to Financial Statements
June 30, 2013 and 2012(In thousands except where noted)
(8) Debt (In Thousands) (continued)
The General Obligation Bond of 2007 was issued to finance the acquisition of property associated with a project in Talbot County. Costs associated with carrying and maintaining the property will be charged to the project, however the debt is payable from Agency resources.
The Master Equipment Lease Purchase Agreements with financing institutions are used to finance the purchase of equipment used to build and operate various project facilities. The Service charges for the use of the construction and operating equipment and the revenues received are used to retire the associated debt and to purchase additional equipment. Substantially, all assets under the agreements serve as collateral under such agreements.
The various trust indentures stipulate that the value of the assets in the debt service reserve funds (recorded as restricted cash or investments) meet the related debt service reserve fund requirements. As of June 30, 2013,such debt service reserve requirements were met, and management believes the Service is in compliance with all other significant requirements of the indentures.
Midshore Regional Landfill:
Hobbs Road Landfill Closure Project Water Quality Bond, Series 2011A; April 2011
$1,752; interest at 1.1% paid semiannually in February and August; due inannual installments beginning 2013 through 2031 in varing amounts from$90 to $111. 1,752
Total 19,325Less: current portion 732
Long-term portion of debt 18,593$
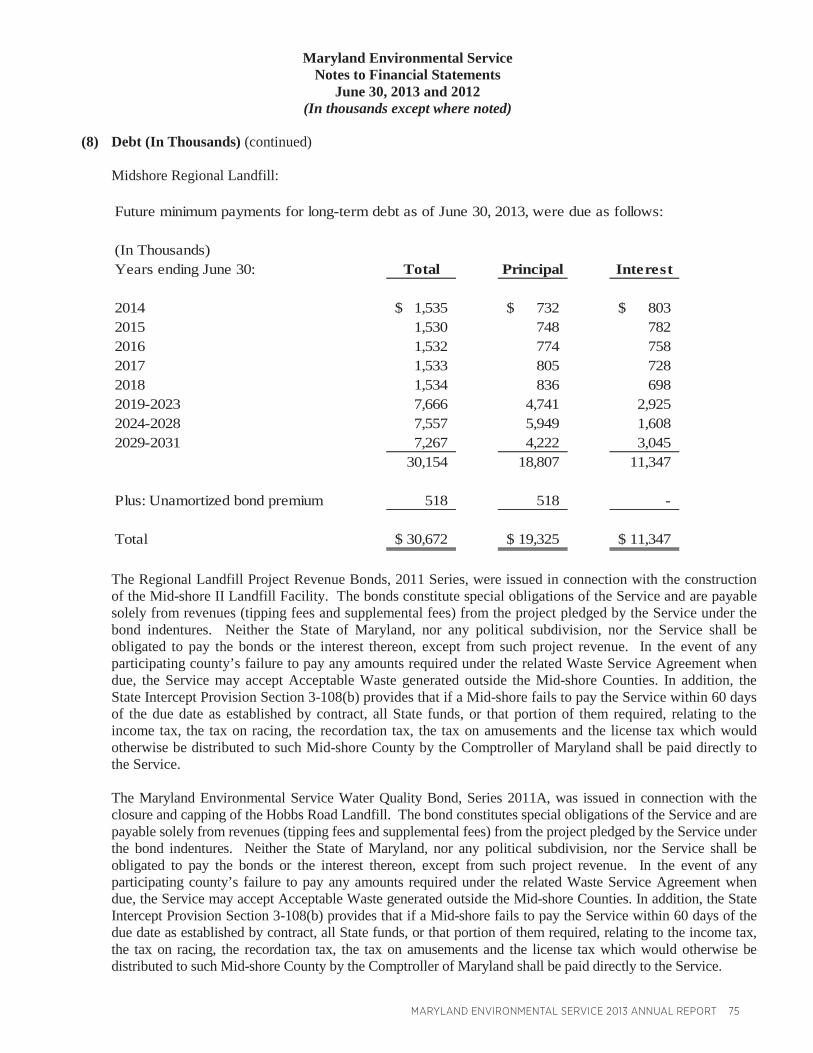
MARYLAND ENVIRONMENTAL SERVICE 2013 ANNUAL REPORT 75
Maryland Environmental ServiceNotes to Financial Statements
June 30, 2013 and 2012(In thousands except where noted)
(8) Debt (In Thousands) (continued)
Midshore Regional Landfill:
Future minimum payments for long-term debt as of June 30, 2013, were due as follows:
(In Thousands)Years ending June 30: Total Principal Interest
2014 1,535$ 732$ 803$2015 1,530 748 7822016 1,532 774 7582017 1,533 805 7282018 1,534 836 6982019-2023 7,666 4,741 2,9252024-2028 7,557 5,949 1,6082029-2031 7,267 4,222 3,045
30,154 18,807 11,347
Plus: Unamortized bond premium 518 518 -
Total 30,672$ 19,325$ 11,347$
The Regional Landfill Project Revenue Bonds, 2011 Series, were issued in connection with the construction of the Mid-shore II Landfill Facility. The bonds constitute special obligations of the Service and are payable solely from revenues (tipping fees and supplemental fees) from the project pledged by the Service under the bond indentures. Neither the State of Maryland, nor any political subdivision, nor the Service shall be obligated to pay the bonds or the interest thereon, except from such project revenue. In the event of any participating county’s failure to pay any amounts required under the related Waste Service Agreement when due, the Service may accept Acceptable Waste generated outside the Mid-shore Counties. In addition, the State Intercept Provision Section 3-108(b) provides that if a Mid-shore fails to pay the Service within 60 days of the due date as established by contract, all State funds, or that portion of them required, relating to the income tax, the tax on racing, the recordation tax, the tax on amusements and the license tax which would otherwise be distributed to such Mid-shore County by the Comptroller of Maryland shall be paid directly to the Service.
The Maryland Environmental Service Water Quality Bond, Series 2011A, was issued in connection with the closure and capping of the Hobbs Road Landfill. The bond constitutes special obligations of the Service and are payable solely from revenues (tipping fees and supplemental fees) from the project pledged by the Service under the bond indentures. Neither the State of Maryland, nor any political subdivision, nor the Service shall be obligated to pay the bonds or the interest thereon, except from such project revenue. In the event of any participating county’s failure to pay any amounts required under the related Waste Service Agreement when due, the Service may accept Acceptable Waste generated outside the Mid-shore Counties. In addition, the State Intercept Provision Section 3-108(b) provides that if a Mid-shore fails to pay the Service within 60 days of the due date as established by contract, all State funds, or that portion of them required, relating to the income tax, the tax on racing, the recordation tax, the tax on amusements and the license tax which would otherwise be distributed to such Mid-shore County by the Comptroller of Maryland shall be paid directly to the Service.

76 MARYLAND ENVIRONMENTAL SERVICE 2013 ANNUAL REPORT
Maryland Environmental ServiceNotes to Financial Statements
June 30, 2013 and 2012(In thousands except where noted)
(8) Debt (In Thousands) (continued)
The following table represents changes in long-term liabilities for the years ended June 30, 2013 and 2012 (in thousands):
Maryland Environmental Service:
2013Beginning Balance Additions Reductions
Ending Balance
Due Within One Year
Advances from project participants 24,628$ 42,077$ (32,019)$ 34,686$ 33,868$Capitalized leases 6,813 - (775) 6,038 523Long-term debt 428 - (36) 392 38Workers' compensation 2,642 83 - 2,725 422 Long-term liabilities 34,511$ 42,160$ (32,830)$ 43,841$ 34,851$
2012Beginning Balance Additions Reductions
Ending Balance
Due Within One Year
Advances from project participants 22,424$ 26,438$ (24,234)$ 24,628$ 22,872$Capitalized leases 8,055 - (1,242) 6,813 776Long-term debt 1,822 - (1,394) 428 36Workers' compensation 2,404 238 - 2,642 410 Long-term liabilities 34,705$ 26,676$ (26,870)$ 34,511$ 24,094$
Midshore Regional Landfill :
2013Beginning Balance Additions Reductions
Ending Balance
Due Within One Year
Capitalized leases 234$ -$ (234)$ -$ -$Long-term debt 20,040 - (715) 19,325 732Landfill closure & post closure care 9,646 327 (181) 9,792 - Long-term liabilities 29,920$ 327$ (1,130)$ 29,117$ 732$
2012Beginning Balance Additions Reductions
Ending Balance
Due Within One Year
Capitalized leases 484$ -$ (250)$ 234$ 234$Long-term debt 20,791 6 (757) 20,040 711Landfill closure & post closure care 9,187 1,037 (578) 9,646 - Long-term liabilities 30,462$ 1,043$ (1,585)$ 29,920$ 945$
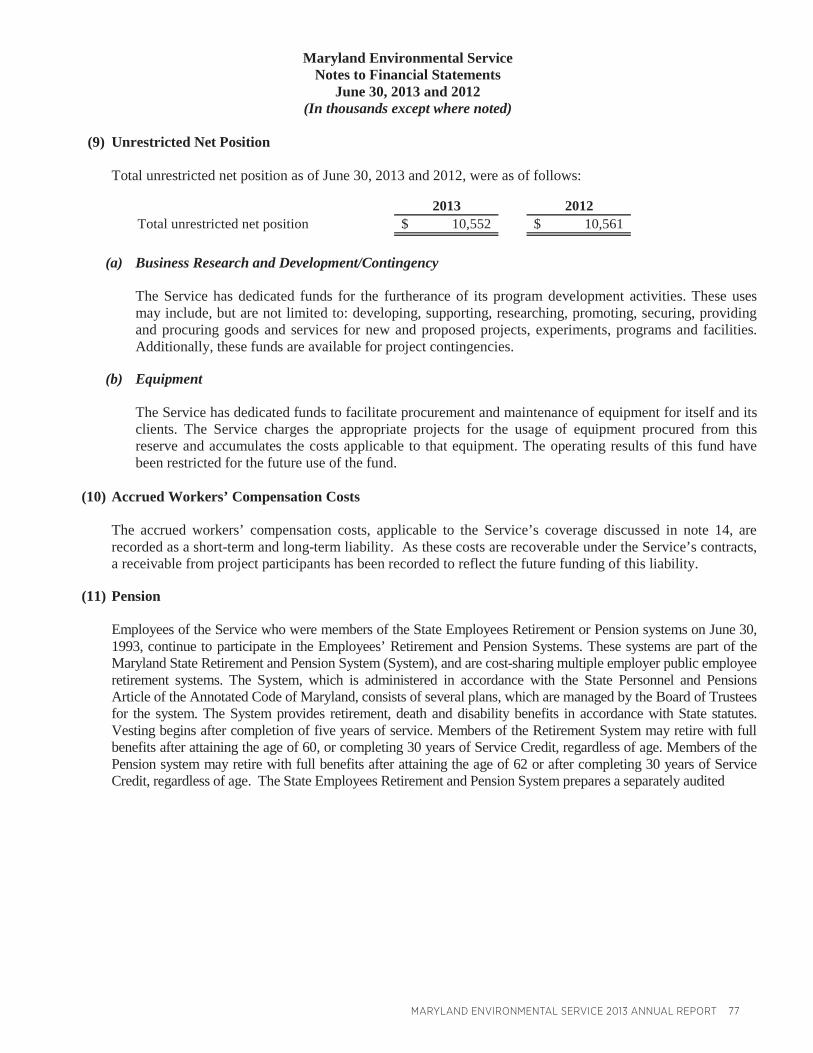
MARYLAND ENVIRONMENTAL SERVICE 2013 ANNUAL REPORT 77
Maryland Environmental ServiceNotes to Financial Statements
June 30, 2013 and 2012(In thousands except where noted)
(9) Unrestricted Net Position
Total unrestricted net position as of June 30, 2013 and 2012, were as of follows:
2013 2012Total unrestricted net position 10,552$ 10,561$
(a) Business Research and Development/Contingency
The Service has dedicated funds for the furtherance of its program development activities. These uses may include, but are not limited to: developing, supporting, researching, promoting, securing, providing and procuring goods and services for new and proposed projects, experiments, programs and facilities. Additionally, these funds are available for project contingencies.
(b) Equipment
The Service has dedicated funds to facilitate procurement and maintenance of equipment for itself and its clients. The Service charges the appropriate projects for the usage of equipment procured from this reserve and accumulates the costs applicable to that equipment. The operating results of this fund have been restricted for the future use of the fund.
(10) Accrued Workers’ Compensation Costs
The accrued workers’ compensation costs, applicable to the Service’s coverage discussed in note 14, are recorded as a short-term and long-term liability. As these costs are recoverable under the Service’s contracts, a receivable from project participants has been recorded to reflect the future funding of this liability.
(11) Pension
Employees of the Service who were members of the State Employees Retirement or Pension systems on June 30, 1993, continue to participate in the Employees’ Retirement and Pension Systems. These systems are part of the Maryland State Retirement and Pension System (System), and are cost-sharing multiple employer public employee retirement systems. The System, which is administered in accordance with the State Personnel and Pensions Article of the Annotated Code of Maryland, consists of several plans, which are managed by the Board of Trustees for the system. The System provides retirement, death and disability benefits in accordance with State statutes. Vesting begins after completion of five years of service. Members of the Retirement System may retire with full benefits after attaining the age of 60, or completing 30 years of Service Credit, regardless of age. Members of the Pension system may retire with full benefits after attaining the age of 62 or after completing 30 years of Service Credit, regardless of age. The State Employees Retirement and Pension System prepares a separately audited
78 MARYLAND ENVIRONMENTAL SERVICE 2013 ANNUAL REPORT
Maryland Environmental ServiceNotes to Financial Statements
June 30, 2013 and 2012(In thousands except where noted)
(11) Pension (continued)
Comprehensive Annual Financial Report, which can be obtained from the State Retirement and Pension System of Maryland, 120 E. Baltimore Street, Baltimore, Maryland 21202.
Members of the Retirement System are required to contribute to the System either 7% or 5% of their regular salaries and wages depending upon the retirement option selected. Members of the Contributory Pension System are required to contribute to the System 5% of their regular salaries and wages. Employer contribution rates are determined by the State annually. The Service’s share of the cost of participation was $237 thousand and $258 thousand, for the years ended June 30, 2013 and 2012, respectively.
All other employees of the Service participate in a Vanguard 401(k) Savings Plan. The plan requires the Service to contribute to the fund. The Service’s share of the cost of participation for the years ended June 30, 2013 and 2012 were $2,214 thousand and $2,249 thousand, respectively. Employees are fully vested when eligible for the plan.
(12) Contingent Liabilities
The Service is involved in litigation arising from the normal course of its operations. In the opinion of management, the amount of liability, if any, resulting from the final resolution of these matters will not be material to the financial position of the Service.
On April 15, 2011, the Maryland Environmental Service issued $1.5 million of Water Quality Bond, Series 2011B with the Maryland Water Quality Financing Administration (the Administration) in connection with the closure and capping of the Hobbs Road Landfill. Pursuant to the Clean Water Act, the Administration has forgiven the repayment of the principal amount and interest payment of the bond subject to MES continues to perform its other obligations under the agreement. Upon determination by the Administration that any of the other obligations under the agreement have been violated, payment of the principal and interest will be become due and payable on demand. As of June 30, 2012, management believes it is in compliance with its obligations and has not violated the agreement. The loan forgiveness has been recognized as capital grant income in the accompanying statement of changes in net position for the year ended June 30, 2012.
(13) Landfill Closure and Postclosure Care Costs
State and Federal laws require the Service to cover and to perform certain maintenance and monitoring functions at Midshore I, Easton Landfill, Midshore II and Hobbs Road Landfill sites for 30 years after closure. Although closure and postclosure care costs will be paid near or after the date the landfills stop accepting waste, the Service reports apportion of these closure and post closure costs as a liability based uponthe estimated useful life of the landfills.
Midshore I current cells are approximately 93% filled as of June 30, 2013. The landfill stopped accepting waste on December 31, 2010. Total closure and postclosure care costs for the landfill is currently estimated to be $10,831 thousand, as determined through engineering studies and $8,762 thousand and $8,943 thousand has been recognized as a liability by the Service as of June 30, 2013 and 2012, respectively.
Midshore II current cells are approximately 7% filled as of June 30, 2013, with a remaining life of 36 years. Total closure and postclosure care costs for the landfill is currently estimated to be $17,591 thousand, as determined through engineering studies, and $1,030 thousand and $703 thousand has been recognized as a liability by the Service as of June 30, 2013 and 2012, respectively. Costs may be subject to change due to inflation, deflation, technology, and changes in applicable laws and regulations.
MARYLAND ENVIRONMENTAL SERVICE 2013 ANNUAL REPORT 79
Maryland Environmental ServiceNotes to Financial Statements
June 30, 2013 and 2012(In thousands except where noted)
(13) Landfill Closure and Postclosure Care Costs (continued)
Under Federal regulations, the Service satisfied its financial assurance requirements based upon local government financial ratio tests of the project participants as of June 30, 2012. The Service expects to satisfy these requirements as of June 30, 2013 using the same criteria.
The Service as an operator for various landfills throughout the State of Maryland and no liability is recognized in regards to landfill closure and postclosure costs related to these landfills because of the Service’s limited role solely as an operator of these facilities.
(14) Risk Management
The Service is exposed to various risks of loss related to torts; theft of, damage to, and destruction of assets; errors and omissions; injuries to employees; and natural disasters. The Service participates in the State of Maryland’s self-insurance program (the program). The program covers general liability, property and casualty, workers’ compensation (see note 10), and environmental liabilities, and provides certain employee health benefits. The program allocates its cost of providing claims servicing and claims payments by charging a “premium” to the Service based on a percentage of estimated current payroll or based on average loss experience. The Service’s premium for the years ended June 30, 2013 and 2012 were $4,247 thousand and $5,174 thousand, respectively.

80 MARYLAND ENVIRONMENTAL SERVICE 2013 ANNUAL REPORT
Maryland Environmental ServiceRequired Supplemental Information for Other Postemployment Benefit Plan
June 30, 2013
Valuation DateValue of Assets
Accrued Liability (AAL)
Unfunded AAL (UAAL)
Funded Ratio
Covered Payroll
UAAL as a % of Covered
Payroll
July 1, 2011 1,111$ 2,995$ 1,884$ 37% 32,615$ 5.8%July 1, 2009 -$ 3,015 3,015 - 34,152 8.8%
(1) The Service has chosen to have actuarial valuations performed bi-annually for purposes of calculating the actuarial accrued liability as allowed by GASB Statement No. 45.
Schedule of Funding Progress (1)
(In Thousands) Other Post Employment Benefits
AnnualRequired
Contribution
2013 $2882012 $2252011 $313
120%128%
100%
Years EndedPercentage Contributed
MARYLAND ENVIRONMENTAL SERVICE 2013 ANNUAL REPORT 81
REPORT OF INDEPENDENT PUBLIC ACCOUNTANTS ON INTERNALCONTROL OVER FINANCIAL REPORTING AND ON COMPLIANCE ANDOTHER MATTERS BASED ON AN AUDIT OF FINANCIAL STATEMENTS
PERFORMED IN ACCORDANCE WITH GOVERNMENT AUDITING STANDARDS
To the Board of Directors Maryland Environmental Services
We have audited, in accordance with auditing standards generally accepted in the United States of America and the standards applicable to financial audits contained in Government Auditing Standards issued by the Comptroller General of the United States, the financial statements of the business type activities and fiduciary funds of the Maryland Environmental Service (the Service), a component unit of the State of Maryland, as of and for the years ended June 30, 2013 and 2012, and the related notes to the financial statements, which collectively comprise the Service’s basic financial statements, and have issued our report thereon dated September 30, 2013.
Internal Control over Financial Reporting
In planning and performing our audit of the financial statements, we considered the Service’s internal control over financial reporting (internal control) to determine the audit procedures that are appropriate in the circumstances for the purpose of expressing our opinions on the financial statements, but not for the purpose of expressing an opinion on the effectiveness of the Service’s internal control. Accordingly, we do not express an opinion on the effectiveness of the Service’s internal control.
A deficiency in internal control exists when the design or operation of a control does not allow management or employees in the normal course of performing their assigned functions, to prevent, or detect and correct misstatements on a timely basis. A material weakness is a deficiency, or a combination of deficiencies, in internal control, such that there is a reasonable possibility that a material misstatement of the entity’s financial statements will not be prevented, or detected and corrected on a timely basis. A significant deficiency is a deficiency, or a combination of deficiencies, in internal control that is less severe than a material weakness, yet important enough to merit attention by those charged with governance.
Our consideration of internal control over financial reporting was for the limited purpose described in the first paragraph of this section and was not designed to identify all deficiencies in internal control over financial reporting that might be material weaknesses or significant deficiencies. Given these limitations, during our audit we did not identify any deficiencies in internal control over financial reporting that we consider to be material weaknesses. However, material weaknesses may exist that have not been identified.
82 MARYLAND ENVIRONMENTAL SERVICE 2013 ANNUAL REPORT
Compliance and Other Matters
As part of obtaining reasonable assurance about whether the Service’s financial statements are free from material misstatement, we performed tests of its compliance with certain provisions of laws, regulations, contracts, and grant agreements, noncompliance with which could have a direct and material effect on the determination of financial statement amounts. However, providing an opinion on compliance with those provisions was not an objective of our audit and, accordingly, we do not express such an opinion. The results of our tests disclosed no instances of noncompliance or other matters that are required to be reported under Government Auditing Standards.
Purpose of this Report
The purpose of this report is solely to describe the scope of our testing of internal control and compliance and the results of that testing, and not to provide an opinion on the effectiveness of the entity’s internal control or on compliance. This report is an integral part of an audit performed in accordance with Government Auditing Standards in considering the entity’s internal control and compliance. Accordingly, this communication is not suitable for any other purpose.
Hunt Valley, MarylandSeptember 30, 2013

MARYLAND ENVIRONMENTAL SERVICE 2013 ANNUAL REPORT 83

259 NAJOLES ROADMILLERSVILLE, MARYLAND 21108410-729-8200 WWW.MENV.COM