2012ap automation study - banking, checking, savings
TRANSCRIPT

AP Automation Study2012

Published May 2012. Copyright © 2012 by The Institute of Financial Operations in conjunction with its affiliates: International Accounts Payable Professionals (IAPP), International Accounts Receivable Professionals (IARP), National Association of Purchasing & Payables (NAPP), and The Association for Work Process Improvement (TAWPI).
All rights reserved. Reproduction or transmission of this publication in any form without the express permission of the copyright holder is prohibited and is a violation of federal copyright law.
The information contained herein has been diligently obtained from sources believed to be reliable and has been prepared with care. The Institute, IAPP, IARP, NAPP, TAWPI, and the authors disclaim any and all warranties as to the accuracy and completeness of this information. The Institute, IAPP, IARP, NAPP, TAWPI, and the authors, their directors, employees, or assistants can accept no liability for any damages or loss occasioned to any person, company, or entity due to errors or omissions in the information contained herein or in the interpretation thereof. The opinions expressed herein were developed from a global survey of users, and the analyses may contain the opinions of the author and may change at any time without notice.
This publication is designed to provide authoritative information at the time of publication in regard to the subject matter covered. It is not intended to offer accounting, legal, or other professional advice. If accounting, legal, or other professional advice is required, or if expert assistance is needed, the services of a competent professional person should be sought.
This document or any part thereof may not be reproduced in any form without the express written permission of the publisher.
2

About The InstituteThe Institute of Financial Operations is the umbrella association comprising four membership affiliates for finance professionals: International Accounts Payable Professionals (IAPP), International Accounts Receivable Professionals (IARP), the National Association of Purchasing & Payables (NAPP), and The Association for Work Process Improvement (TAWPI). Based in Orlando, Fla., with offices in Boston and London, The Institute serves as a global voice, chief advocate, recognized authority, acknowledged leader, and principal educator for people in financial operations, with a particular focus on accounts payable, accounts receivable, procure-to-pay, information management and data capture. Combined, the affiliates have 5,000 members.
The Institute of Financial Operations
Project TeamJo E. LaBorde, Executive Director
Joe Stern, Creative/Design Leader
Laureen Crowley, Editor in Chief
Diane Sears, Senior Editor
The Study SponsorsAnyDoc Software Inc.Speed your AP and AR processes with an automated invoice, remittance, and check processing solution from AnyDoc Software. Eliminate time-consuming manual processes, including document sorting, routing, and manual data entry. Faster processing time and high data accuracy allow productivity to skyrocket, while slashing costs. AnyDoc’s award-winning AnyApp™ Technology automatically locates and captures essential data including line-item details without static templates. Unique “memory” technology increases processing speed and accurate, verified data is seamlessly transferred to your ERP or accounting system, including SAP. See how automated invoice, remittance, check capture, and deposit can catapult your company to the next level. With an AnyDoc solution, companies just like yours have saved hundreds of thousands of dollars in labor costs annually, and tripled productivity without adding any additional staff. Read client success stories at www.anydocsoftware.com/casestudies.
Ariba Inc.Ariba is the world’s business commerce network. Ariba combines industry-leading cloud-based applications with the world’s largest web-based trading community to help companies discover and collaborate with a global network of partners. Using the Ariba® Network, businesses of all sizes can connect to their trading partners anywhere, at any time, and from any application or device, to buy, sell, and manage their cash more efficiently and effectively than ever before. More than 730,000 companies around the world use the Ariba Network to simplify inter-enterprise commerce and enhance the results that they deliver. Join them at: www.ariba.com
3

Commerce BankCommerce Bank offers the next generation of payment automation. As businesses move from paper to electronic processing, Commerce Bank remains well positioned to help commercial clients automate their invoice receipt, approval, and payment processes. Commerce Bank continues to offer innovative technology to enhance efficiencies and maximize revenue share. Commerce Bank is a subsidiary of Commerce Bancshares, Inc., a publicly traded holding company (NASDAQ:CBSH), ranked No. 7 on the Forbes magazine list of America’s Best Banks in December 2011.
Image Integration Systems Inc.Founded in 1993 and headquartered in Perrysburg, Ohio, Image Integration Systems’ entire focus is on the development, enhancement, maintenance, implementation, and support of its own DocuSphere solution for accounts payable automation. Image Integration Systems delivers “The DocuSphere Difference: The preeminent connected, business-driven AP automation solution — delivered by experienced people for a fixed fee.” DocuSphere has standards-based integration with SAP, Oracle E-Business Suite, and JD Edwards ERP systems. For more information about Image Integration Systems and “The DocuSphere Difference,” please visit www.docusphere.com or contact Dave Litzenberg at (419)-872-1930, ext. 222.
Kofax Inc.Kofax plc (LSE: KFX) is a leading provider of capture-enabled business process management (BPM) solutions. For 25 years, Kofax has provided award-winning solutions that manage the capture and streamline the flow of business critical information throughout an organization in a more accurate, timely and cost effective manner. These solutions provide a rapid return on investment to thousands of customers in banking, insurance, government, business process outsourcing, and other markets. Kofax delivers these solutions through its own sales and service organizations and a global network of more than 800 authorized partners in more than 70 countries throughout the Americas, EMEA, and Asia Pacific. For more information, visit www.kofax.com.
ReadSoftMore than 6,000 companies worldwide trust ReadSoft to automate their accounts payable processes. These best-in-class organizations enhance their working capital with ReadSoft’s software that automatically extracts information from invoices and matches it against their respective ERP or accounts payable systems. End-to-end solutions include an “inside ERP” suite of workflow solutions for problem invoice resolution and approvals, along with image and data capture as a mechanism to feed the workflow. Certified with many ERP systems, including SAP, Oracle, and Microsoft, ReadSoft’s solutions are seamlessly integrated with your current environment. With operations in 16 countries and more than 300 partners in over 70 countries, ReadSoft has the proven expertise to streamline your business processes and boost your bottom line.
4

Executive Summary 6
About the Respondents and their Organizations 7
Processing Invoices 14
Processing B2B Payments 20
Technology Use and Satisfaction 23
Technology Spending 34
Conclusion 39
Table of Contents
5

Executive SummaryAccounts payable automation aims to help AP departments increase efficiency in processing invoices and payments, freeing up labor for other crucial tasks within the organization. The Institute of Financial Operations, in conjunction with its partners, designed this year’s survey to delve into AP automation trends, determine the state of accounts payable, and evaluate the progress of organizations in implementing automation.
The findings indicate that organizations are slow to invest in technology that can speed invoice processing. Few have embraced tools such as optical character recognition (OCR) and supplier portals. As a result, a great deal of clerical work remains. Three-quarters of respondents still do some prep work before processing invoices, while eight in 10 said at least half the invoices they handle are paper.
Still, the organizations that participated in the survey remain fairly efficient, with the majority processing invoices in five days or less. They are holding the line against expenses, with 85 percent saying the cost of processing invoices stayed the same or declined during the past 18 months. Error rates increased for just one-eighth of organizations.
Survey respondents included AP stakeholders in companies such as Pfizer, Whole Foods Market, Aflac, IHOP, Dish Network, and Liberty Mutual Insurance. Government entities such as the City of Sarasota, Fla., and the government of Chesterfield County, Va., were also among the 170 respondents.
Key findings from this year’s AP Automation Study include:
• Three-fourthsoforganizationshave10orfewerfull-timeemployeesdedicatedtoinvoiceentryand matching.
•Ninein10organizationsstilldeal,atleastinpart,withpaperinvoices.
• PO-basedinvoicingremainscommon.Amajority(69percent)seethisasakeyfeatureinanAPautomation solution. Considering the importance of PO-based invoicing, the reported high level of interest in tightly aligning procurement and AP make sense.
• Two-thirdsofrespondentsprocessedmoreB2Bpaymentselectronicallyversusthreeyearsago.Still, most predict that it will be two years or more before they are processing the majority of B2B payments that way.
• Front-endimagingremainsthemostpopularformofcapturetechnology,usedbynearlyhalfofthose who responded.
• Cloudservicesandsoftware-as-a-servicearenotyetthenorm,butthereappearstobeagrowinginterest in such options. Survey respondents liked that the technologies require minimal IT involvement, but one in five has concerns about data security.
• Amajority(57percent)saytheir2012budgetforAPautomationisunchangedfromayear ago. Cost savings and improved accuracy rank as top justifications for investing in AP automation solutions.
Based on the findings of the study, it is clear that organizations have room to improve when it comes to AP automation. Companies that market such solutions will want to consider the financial pressures facing organizations and present a strong business case for investing in the technology.
6

About the Respondents and their Organizations
About the RespondentsFigure 1: Which of the following best describes your job function?
0.8%
0.6%
48.2%
22.4%4.7%
17.6%
3.5%
2.4% CFOCTO 0%CEO 0%COO 0%ControllerTreasurer 0%Cash manager 0%Finance executiveAuditorAP managerAP supervisorOperations managerOther (please specify)
Nearly half the respondents are AP managers. Other titles represented include AP supervisor, controller, finance executive, and operations manager.
About the Organizations and their StrategiesFigure 2: How would you describe your AP environment?
59.8%
17.8%5.9%
16.6% Centralized Partially centralizedDecentralizedShared services center
Centralized AP environments remain the most popular option among survey respondents this year, with six in 10 describing their organization’s AP environment that way.
Organizations have largely moved away from decentralized AP processing, with just 6 percent of respondents saying they work in such an environment. The remaining respondents were about evenly split between partially centralized AP environments and shared services centers.
7

Organizations with a centralized AP environment benefit from “visibility, accountability, [and having] one location to call,” according to Deb Golden, accounts payable manager for Astellas US LLC. The Deerfield, Ill. pharmaceuticals company boasts an average processing cost of $2 to $5 per invoice. The challenges of implementing a centralized environment include resistance to change, insecurity, management support, and trust, Golden said.
Figure 3: Has there been an executive-driven effort to have your AP and AR departments work more closely together?
57.6%
33.5%8.8% Yes
NoWe are already tightly aligned.
There does not appear to be a widespread push among organizations to align accounts payable and accounts receivable processes. Just a third of respondents reported their organizations are already operating in a “tightly aligned” fashion.
Of the 113 organizations that are not already tightly aligned, just 13 percent said executives at the top of their organization want the two entities to work more closely together.
Figure 4: Has there been an executive-driven effort to have your AP and procurement organizations work more closely together?
35.3%
33.5%
31.2%
YesNoWe are already tightly aligned.
Accounts payable and procurement have a history of segregation in many organizations — even gaining the reputation of silos. Interestingly, the data shows that there does appear to be an effort to integrate those two corporate powerhouses.
About the Respondents and their Organizations
8

A third of respondents said there was an executive-driven push to more closely align AP and procurement, in addition to more than a third of respondents who reported that the two departments already were tightly aligned in their organization.
Fewer than a third of respondents reported no effort by executives to bring AP and procurement closer together.
Figure 5: How many FTEs are you using for invoice entry and matching?
42.8%
6.6%
3.6%12.7%
34.3%
Fewer than 55 to 1011 to 1516 to 25More than 25
Invoice entry and matching is a process that is still eating up the hours of full-time employees at many businesses, although among this year’s respondents, the number of organizations that use fewer than five FTEs for the task has grown slightly from a year ago. In a majority of cases, organizations can get by with fewer than 10 employees dedicated to the job.
Forty-three percent of those who responded reported they use fewer than five FTEs for invoice entry and matching, compared with 39 percent a year ago. Just over 34 percent said they use five to 10 FTEs for invoice entry and matching, compared with 38 percent a year ago.
Figure 6: What is your average cost to process invoices?
27.2%
11.8%
30.2%13.6%
6.5%0.6%
10.1
Less than $2 per invoice$2 to $5 per invoice$6 to $10 per invoice$11 to $15 per invoice$16 to $25 per invoiceMore than $25 per invoiceNot sure
The cost for processing invoices varied greatly among those who responded, ranging from less than $2 per invoice to more than $25. The greatest share of respondents — 30 percent — fell in the $2 to $5 range. That figure mirrors survey results from a year ago.
The second most common cost bracket was between $6 and $10 per invoice, which was cited by nearly 14 percent of respondents.
About the Respondents and their Organizations
9

Just one organization responded with costs higher than $25 per invoice, an indication that extremely high invoice costs are affecting only a small portion of the market. Still, with roughly one in six respondents reporting average invoice costs of $11 or more, there is clearly room for improvement.
Of those who responded to the question, more than a quarter said they were unsure of their average cost.
Figure 7: How have your costs to process an invoice changed in the past 18 months?
11.4%
41.9%
35.3%7.8% 3.6%
Increased significantlyIncreased slightlyHave not changedDecreased slightlyDecreased significantly
The cost of invoice processing has stayed the same or declined for most organizations during the past 18 months. Only 15 percent of respondents said costs had increased, while 43 percent indicated they had dropped. A total of 42 percent of respondents said costs have not changed during the past year and a half.
Those results were on par with a year ago, when 14 percent of respondents indicated higher costs, while 43 percent said costs were lower and another 43 percent said costs remained unchanged.
Considering that 41 percent of survey respondents revealed later that they are processing more than 10,000 invoices a month, any change in cost — up or down — can have a big impact on the bottom line.
About the Respondents and their Organizations
10

Figure 8: How have your invoice entry and payment error rates changed in the last 18 months?
30.2%
50.9%
10.7%
6.5%1.8%
Increased significantly
Increased slightly
Have not changed
Decreased slightly
Decreased significantly
A large majority of survey respondents reported success in keeping error rates steady — or even in decline. Half of respondents said error rates have not changed in the last 18 months, while three in 10 said errors have decreased slightly. Error rates, which take a heavy toll on costs, decreased “significantly” for 6.5 percent of respondents.
Despite that success rate, the percentage of respondents who reported a significant decline was not as great as a year ago, when 15.5 percent of respondents said they saw significantly lower entry and payment error rates during the previous 18 months.
Figure 9: Have you considered trade finance as a part of your AP strategy?
YesNo
13.8%86.2%
Trade finance as a tool in AP strategy appears to have not fully caught on among survey respondents. Just one out of seven said they have considered trade finance as a part of their AP strategy. The remainder (86 percent) said they had not.
However, it is obvious from the list of survey participants — which includes both domestic and global companies, as well as government entities — that not all would have a use for such international commerce funding. That factor should be taken into account as one that affects the data and would make the market penetration of trade finance seem limited, even if the concept was trending among organizations that have a use for it.
About the Respondents and their Organizations
11

Figure 10: Is your organization considering outsourcing its AP processing?
82.9%
8.2%
5.9%1.2%
1.8%
We already outsource our AP processing.Yes, within six months 0%Yes, within 12 monthsYes, within 24 months 0%Yes, timing is unclearNoNot sure
Despite broader trends toward outsourcing across corporate America, such a practice is not yet prevalent when it comes to AP processing. The vast majority of respondents, 83 percent, said they are not considering outsourcing. The remaining respondents included 8 percent who are already outsourcing AP processing and 3 percent who said they had considered outsourcing. Nearly 6 percent said they were unsure.
While the number of organizations that are outsourcing remains in the minority, it appears to have grown slightly during the past year. Fewer than 6 percent of respondents said last year that they were already outsourcing AP processing, compared with 8.2 percent in the current survey.
Figure 11: What AP processing functions is your organization outsourcing or considering outsourcing?
No plans to outsourceConsidering outsourcingAlready outsource
0 5 10 15 20 25 30
PO and/or goods receipt matching
Payment processing
Data capture/data entry
Document archiving
Document imaging
Document receipt/sorting
When respondents whose organizations are receptive to outsourcing were asked what they are most likely to send out-of-house, certain tasks bubbled to the surface.
About the Respondents and their Organizations
12

About the Respondents and their Organizations
Nineteen out of 27 organizations said they either already outsource or are thinking about outsourcing data capture and data entry. Seventeen of 27 said the same about document archiving. Last year, document imaging took the top spot as the function that most organizations considering outsourcing would like to offload, but this year, it was not top on the outsourcing wish list. However, it was one of the top tasks farmed out by organizations that already outsource.
On the other hand, payment processing was more likely to be kept in-house, as was matching for purchase orders and other receipts.
13

Processing Invoices
Figure 12: How many total invoices (paper and electronic) are you processing monthly?
37.6%
15.8%5.5%
19.4%
21.8%
Fewer than 5,000
5,000 to 10,000
10,001 to 25,000
25,001 to 40,000
More than 40,000
This year’s survey respondent pool represented a slightly smaller share of organizations that are processing high volumes of invoices and a simultaneous increase in the share of organizations that identify with the lowest level of invoice processing.
About 22 percent of respondents this year indicated they process more than 25,000 invoices, compared with 27 percent a year ago. Meanwhile, the percentage of organizations who said they process fewer than 5,000 invoices a month grew to 38 percent, from 32 percent in 2011.
The survey also gave a glimpse into extremely high-volume processing by allowing respondents this year to identify as processing “more than 40,000 invoices” per month. Of the total respondents, 16 percent fell into that category.
Figure 13: How has your volume of total invoices changed over the past year?
33.3%
21.8% 44.8%
Increased
Decreased
Remained unchanged
In general, most organizations reported that invoice processing had remained steady or had grown during the past year. A third said it had remained the same, while almost 45 percent of respondents said invoice volume had increased.
Invoice volume fell for one in five organizations.
14

Figure 14: What percentage of your total invoice volume is paper-based?
9.6%6%
5.4%12.7%
18.7%47.6%
More than 90 percent
75 percent
50 percent
25 percent
10 percent
Less than 10 percent
Survey results showed that despite pushes for digital billing, paper remains a staple in invoicing. A total of 79 percent of those who responded said at least half of the invoices they handle are paper.
Initially, the growth in the number of organizations dealing almost exclusively in paper invoices may seem surprising. Nearly half of all respondents said paper represents more than 90 percent of their invoices. Last year, that figure was just four in 10. Considering that the respondent pool this year included fewer handling 25,000-plus invoices and more in the smallest invoice volume category, however, the prevalence of paper may be simply a function of the size of an organization.
On the other hand, 5 percent of respondents have been able to kick the paper habit almost entirely, saying paper represents less than 10 percent of their invoices. That is about on par with a year ago.
Figure 15: How has the volume of your paper invoices changed over the past year?
Significantly higher
Slightly higher
Unchanged
Slightly lower
Significantly lower
36.2%
30.7%
21.5%
7.4%4.3%
Overall, the volume of paper invoices is trending downward. More survey participants (44 percent) said their volume of paper invoices is “slightly lower” or “significantly lower” than said it is higher. Nearly a third of respondents (31 percent) reported no change in their volume of paper invoices.
Still, the survey indicates that many organizations have a lot of work to do in eliminating inefficient paper invoicing: A quarter of respondents indicated that their paper stacks, so to speak, are growing, perhaps indicating a need for more widespread deployment of automation processes.
Processing Invoices
15

Figure 16: What percent of your total invoice volume is PO-based?
15.1%
14.5%
28.3%
24.7%
9.6%
7.8% More than 90 percent
75 percent
50 percent
25 percent
10 percent
Less than 10 percent
For organizations, purchase order-based invoices continue to be prevalent. A majority of respondents estimated that half to three-quarters of their invoicing involves purchase orders.
In a similar question last year, 53 percent of respondents said between 51 percent and 99 percent of their invoices required PO matching.
Figure 17: Is PO automation an important component of an AP automation initiative?
Yes
No
31.3%
68.7%
A successful AP automation initiative should incorporate purchase order automation, according to survey respondents. Roughly seven of 10 said that PO automation is an important component of an AP automation initiative, while just three in 10 said it was not.
Processing Invoices
16

Figure 18: What are the most important drivers to automating the management of POs and invoices?
0% 10% 20% 30% 40% 50% 60%
Other (please specify)
Simplify invoice submission process from suppliers
(through a PO-flip process)
Eliminate mismatches and exceptions that lead to
blocked invoices
Achieve better control over spend and ensuring purchases are
with preferred suppliers
In an era of attention to the bottom line, the top reason cited for automating POs and invoice management was, not surprisingly, related to finances. A total of 59 percent of organizations said a desire to achieve better control over spending and to ensure purchases are made with preferred suppliers was a key driver of automation.
Accuracy also ranked high. A significant number (46 percent) said eliminating mismatches and exceptions that lead to blocked invoices was the most important driver of automation.
Making the supplier invoice submission process easier didn’t rank high on the list, with just over 30 percent saying it was a key motivator.
Figure 19: How long on average does it take your department to process an invoice?
Less than 3 days
3 to 5 days
6 to 10 days
11 to 15 days
16 to 25 days
More than 25 days
35.0%
17.8%5.5%
3.1%0.6%
38.0%
Processing Invoices
17

Respondents to this year’s survey said their organizations are focused on quick turnarounds. Nearly three out of four said they process invoices within five days or less, on average. Only a handful had invoices languishing for 16 days or more.
In a good sign for the efficiency of invoicing, the percentage of organizations that are turning around invoices in less than three days is rising. This year, 38 percent reported such speedy turnarounds, compared with 30 percent a year ago.
Figure 20: How has the average time it takes you to process an invoice changed over the past year?
Significantly more days
Slightly more days
Unchanged
Slightly fewer days
Significantly fewer days
11.7%
49.1%
30.7%6.7% 1.8%
More than 37 percent of those who responded reported improvement in processing times, saying it took them fewer days to process invoices.
Half of respondents reported no change in the time it takes them to process an invoice during the past year. While this may seem to indicate that organizations are stalled in terms of improving processing times, a closer look at the data reveals otherwise. Of the 80 organizations who reported no change, half were actually already among the quickest processors, getting invoices done in less than three days on average.
A minority of respondents — less than 14 percent — said their organizations were getting slower when it came to invoice processing.
Processing Invoices
18

Figure 21: What percentage of early payment discounts do you typically capture?
Less than 10 percent
10 percent to 24 percent
25 percent to 49 percent
50 percent to 74 percent
75 percent to 99 percent
100 percent
30.9%8.6%
43.2%
5.6%
7.4%
4.3%
The survey indicated that many organizations are missing out on early payment discounts that could be helping the bottom line. A total of 43 percent of respondents said they typically get less than 10 percent of early payment discounts.
On the other end of the spectrum, 31 percent of those who responded were getting between 75 percent and 99 percent of early payment discounts, while a standout 9 percent said they captured 100 percent.
Processing Invoices
19

Processing B2B Payments
Figure 22: For B2B payments, what methods do you use, and what portion of payments is made via each method?
0 10% 20% 30% 40% 50% 60%
Debit card
EDI
Accounts payable card
Wire
Purchasing card
ACH
Check
Checks are still the most popular method of payment for business-to-business transactions, outpacing Automated Clearing House payments by more than 2 to 1. When respondents’ answers were added and averaged, checks accounted for 57.1 percent of payments, compared with ACH at 25.5 percent. The next-closest was the P-card, with only 8.7 percent. This shows AP operations are shifting toward electronic means of payment but still firmly entrenched in paper-based processes.
The use of debit cards, which have proved popular with consumers, was largely absent in respondents’ business-to-business payments.
Figure 23: Are you processing more B2B payments electronically today than you were three years ago?
Yes
No
32.5%
67.5%
20

Electronic payments to other businesses are on the rise among survey respondents. A majority (67.5 percent) reported processing more business-to-business payments electronically compared with three years ago.
Figure 24: What is the increase in B2B payments today compared to three years ago?
100 percent
75 percent to 99 percent
50 percent to 74 percent
25 percent to 49 percent
10 percent to 24 percent
Less than 10 percent
35.9%
17.5%3.9%
9.7%
16.5%
16.5%
Of those who are processing more B2B payments electronically, more than half reported a moderate increase, saying electronic B2B payments were up by 24 percent or less.
A third said payments were up between 25 percent and 75 percent. It was rare for businesses to see the volume of electronic payments double during the past three years: Only 4 percent of those who responded said they had seen an increase of 100 percent.
Figure 25: With regard to electronic payments, which of the following applies to your organization?
Most of our B2B payments already are electronic.
We have a strategy and are in the process of migrating to electronic payments.
We have defined a strategy to migrate to electronic payments but have not begun the process.
We have not migrated to electronic payments but plan to do so.
We have no plans at this time to migrate to electronic payments.
11.6%
38.7%
20.6%
14.2%14.8%
When it comes to electronic payments, a majority of respondents — 60 percent — are well on their way or already there.
Processing B2B Payments
21

Four in 10 respondents said they have a strategy and are moving toward electronic payments, while two in 10 reported that most of their B2B payments are already electronic.
Electronic payment companies may be more interested in the remaining respondents, who represent potential future clients for electronic payment services. Roughly a quarter of respondents indicated their organizations are receptive to the idea of electronic processing, but still in the planning stages. An additional 14 percent have not been won over to the idea.
Figure 26: How long do you expect it will be until the majority of your B2B payments will be completed electronically?
Less than 1 year
2 – 3 years
3 – 4 years
More than 4 years45.5%
20.8%
15.8%17.8%
The timeframe within which organizations expect that the majority of their B2B payments will be electronic varies. Still, it seems clear that more respondents are planning their move to majority electronic processing sooner, rather than later.
The most common timeline for organizations was between two and three years, cited by 46 percent of those who responded to the question. A year ago, survey respondents expressed the same feeling, with a similar percentage of respondents citing the two- to three-year timeline as the one that best fit their organization.
Processing B2B Payments
22

Technology Use and Satisfaction
Figure 27: Which of the following do you use?
0% 10% 20% 30% 40% 50% 60% 70% 80%
E-invoice submission process
Procurement catalogs
AP card rebates (e.g., AP card, ghost card)
P-card rebates
Supply chainfinancing
Variable (dynamic)discounting tools
This question sought to measure the market saturation of various tools and technologies available to AP departments.
Clearly, the use of purchasing card rebates as a source of revenue generation is being embraced by survey respondents. A whopping 66 percent said they use P-card rebates, while 37 percent reported taking advantage of AP-card rebates.
One-third of respondents reported using an e-invoice submission process, while one-fifth of those who responded said they use procurement catalogs.
Variable discounting tools and supply chain financing came in as the least favored options.
The results of the survey are perhaps more telling when compared with what survey respondents said they used a year ago. While the use of P-card rebates and AP card rebates has grown slightly compared with a year ago, some other tools have lost favor.
For instance, a year ago, 35 percent of those who responded said they used variable discounting tools; this year, just 15 percent indicated they did. In 2011, nearly a quarter of respondents used supply chain finance. This year, that figure fell to 14 percent. And while 30 percent of those surveyed a year ago said they used procurement catalogs, just 21 percent indicated doing so this year.
Interestingly, nearly a quarter of those surveyed skipped the question, perhaps indicating unfamiliarity with or an underutilization of such tools.
23

Figure 28: What types of capture technology are you using?
0% 10% 20% 30% 40% 50%
None of the above
Post-workflow archiving
Front-end extraction of document data
Front-end classification
Front-end imaging
Front-end imaging continues to be the most commonly used capture technology in AP departments, although post-workflow archiving is gaining in popularity.
About 47 percent of respondents said their organization uses front-end imaging, which is roughly on par with a year ago. A total of 36 percent of those who responded reported using post-workflow archiving, up from 2011, when 29 percent of organizations reported using the technique.
There is a large contingent of respondents who don’t identify themselves as users of the most common capture technologies. About a third of respondents reported using none of the technologies listed, and 9 percent skipped the question.
Figure 29: Does your organization use OCR technology to capture invoice data?
Yes
No19.4%
80.6%
Optical character recognition technology, or OCR, replaces manual invoice entry by automatically capturing invoice data and validating that data to ensure accuracy in downstream systems. With eight out of 10 respondents reporting they do not currently use the technology to capture invoice data, this is an area ripe for expansion in the AP automation segment.
Technology Use and Satisfaction
24

Figure 30: What are the primary reasons your organization does not use OCR technology?
0% 10% 20% 30% 40% 50%
Other (please specify)
Poor past experiences with OCR technology
Concerns about managing the change
Unimpressed with the solutions on the market
Lack of a compelling business case
Lack of internal resources to support project
Lack of capital
When asked why they do not employ OCR technology, internal resources and money are the primary barriers cited. These numbers have increased since last year’s survey.
A lack of internal resources to support an OCR project was cited as a challenge by 41 percent of respondents, compared with 29 percent a year ago. A similar concern — lack of capital — was cited by 30 percent of respondents, compared with just 18.5 percent in last year’s survey.
Organizations may be beginning to see the value of OCR, with its potential benefits of reduced invoice turnaround time, lower processing cost per invoice, reduced labor, and higher accuracy of data entering the accounting or ERP system. This year, a smaller percentage of respondents — 29 percent — said they failed to see a compelling business case for the technology, compared with 35 percent a year ago.
Fewer than a quarter of respondents cited negative aspects of OCR as a reason for not using it. About 13 percent said they were unimpressed with solutions on the market, while roughly 11 percent said they had a poor past experience with the technology.
It is important to note that objections about quality and experience have trended upward from a year ago, perhaps indicating a need for better technology and investments to improve the user experience once companies deploy the technology.
This year’s survey also gave respondents the option of choosing “other”; 22 percent selected that answer, indicating their concerns go beyond what was presented in the survey.
With 47 percent of respondents reporting their use of front-end imaging, these figures may indicate a missed opportunity to leverage existing technology for increases in processing speed and overall efficiency by adding on front-end classification and OCR.
Technology Use and Satisfaction
25

Figure 31: What invoice types are you processing?
0% 20% 40% 60% 80% 100%
Web form invoice submission
Fax
Email attachment/submission
Paper, non-purchase order
Paper, with purchase order
EDI
Electronic
The survey backs up what most AP professionals already know: Organizations today are dealing with multiple types of invoices and there’s still no getting away from old-fashioned paper.
About 90 percent of respondents said they were dealing with paper invoices, both those with purchase orders and those without. Email submissions are trailing closely behind though, with 84 percent of respondents processing them.
Surprisingly, fax submissions are hanging on fairly well, with 62 percent of organizations processing invoices via facsimile.
Figure 32: Do you perform any invoice prep work before processing?
Yes
No
27.9%
72.1%
While the ultimate goal of accounts payable automation is to allow invoices to be processed with little to no human intervention, the reality for most organizations has not caught up with the ideal.
Nearly three-fourths of those who responded said they complete some type of prep work before processing an invoice, far outpacing those who said they do not do prep work before invoice processing.
Technology Use and Satisfaction
26

Some of these prep processes can be complex.
Amy Knoebel, accounts payable manager for Beazer Homes, described the invoice preparation process at the Indianapolis-based home builder, which processes more than 40,000 invoices a month.
“All of our invoices go to our division offices first, and then they are coded, approved and then sent to central AP for entry and processing for payment,” Knoebel said.
Figure 33: What ERP system are you currently using?
JD Edwards
Microsoft
Oracle
PeopleSoft
SAP
Other (please specify)
41.1%
15.1%17.1%
15.8%
5.5%
5.5%
PeopleSoft, Oracle, and SAP ranked highest when it came to enterprise resource planning systems, each with roughly about one-sixth of the market. JD Edwards and Microsoft each pulled in smaller shares of the market.
About 41 percent of respondents said they used some form of ERP other than those mentioned by name in the survey. Lawson emerged as the most popular choice in the “other” category, but it was among more than three dozen systems mentioned, indicating an extremely fragmented market for ERP systems.
Figure 34: Are you using a supplier portal?
Yes
No
76.6% 23.4%
Technology Use and Satisfaction
27

An effective supplier portal can reduce invoice capture and entry costs as well as expenses related to routine vendor inquiries. Yet despite those benefits, just a quarter of those who responded said their organizations are using a supplier portal of any kind.
The remaining three-quarters of those who responded said they do not use a supplier portal.
The Limited Brands is among the few companies surveyed that use a supplier portal. The Columbus, Ohio-based company behind Victoria’s Secret and Bath & Body Works said most of its B2B payments are done electronically.
Eric Flitcraft, a finance executive with the company, said a supplier portal allows Limited Brands to have a “single source of truth for invoices.” It also is a “communication funnel and repository” for invoicing information, helping the retailer process between 25,000 and 40,000 invoices a month.
Figure 35: Which of the following would be the most important drivers of your decision to implement a supplier portal?
Invoice status
PO-flip invoice submittal
Non-PO invoice submittal
PDF/document invoice submittal
Self-service web form invoice submittal
Payment submittal
27%
12.2%
32.2%
13%
10.4%
5.2%
Organizations want their supplier portal to enable them to easily communicate invoice status — a task that can otherwise eat up valuable staff hours — and to allow suppliers to submit their invoices online.
Invoice status was cited as the most important driver for a third of respondents, while “self-service web form invoice submittal” was the key driver for 27 percent of respondents.
Other considerations — ranging from submitting non-purchase order invoices to being able to submit invoices as PDF files — were not as great of a concern.
Technology Use and Satisfaction
28

Figure 36: Who owns the management of the supplier portal?
Procurement
Accounts payable
Other (please specify)
45%
15%
40%
Of those who use a supplier portal, organizations were split when it came to who owns the management of the portal. Forty percent said procurement managed the supplier portal, while 45 percent said the responsibility belonged to accounts payable. Fifteen percent of respondents said another entity was in charge, with examples including the finance manager, a third party, and “various departments.”
Figure 37: Where is it housed?
In the cloud
On premises
48.7%
51.3%
Respondents were also split in regard to where their supplier portal was housed, with roughly half saying it was on the premises and half saying it was “in the cloud.”
Technology Use and Satisfaction
29

Figure 38: Which of the following AP functions are supported through your supplier portal?
0 10% 20% 30% 40% 50% 60% 70% 80%
Self-service account maintenance/updates
Payment submittal
Self-service web form invoice submittal
PDF/document invoice submittal
Non-PO invoice submittal
PO-flip invoice submittal
Invoice status
Invoice status was far and away the most likely function to be supported through the supplier portal. Of the 33 respondents who have a supplier portal and provided details about its functionality, about 70 percent said it supported invoice status.
Other functions were not as well supported. Only a third of respondents said PO-flip invoice submittal was supported, and the numbers fell from there.
It was exceedingly rare for supplier portals to support functions such as payment submittal (6 percent) and non-PO invoice submittal (9 percent).
Figure 39: Is your T&E expense management system integrated with your AP solution?
Yes
No
48.3%
51.7%
There is a clear trend toward organizations integrating travel and entertainment expense management with accounts payable solutions.
This year, 52 percent said the systems were integrated, compared with 38.5 percent a year ago.
According to one respondent with a high volume of invoices per month, the decision to integrate T&E expense management with AP saves the company five full-time employees.
Technology Use and Satisfaction
30

Figure 40: Do you believe that integrating your T&E and AP systems would provide significant benefits?
Yes
No
Not sure
They are already integrated
23.3%
34.2%4.1%
38.4%
Of those who said their T&E expense management system is not integrated with their AP solution, opinions are mixed on whether doing so would help their operations. A full 38 percent said it would, compared with 23 percent who said it would not.
Perhaps more telling is how many people have not made up their minds on the integration issue: 34 percent said they were unsure whether such a move would offer significant benefits.
Figure 41: Is your organization considering using cloud services or software-as-a-service for AP processing?
We already do
Yes, within six months
Yes, within 12 months
Yes, within 24 months
Yes, timing is unclear
No
Not sure
2.6%2%
1.3%
6.6%32.5%
7.9%
47%
When respondents were asked if their organizations were considering cloud services or software-as-a-service, the most popular answer was simply: No. But in comparing this year’s survey to last year’s, it becomes evident that cloud services and software-as-a-service (SaaS) are catching on quickly.
The percentage of respondents who are not considering cloud services or SaaS (47 percent) has fallen significantly from a year ago (61 percent). And while it remains small, the percentage of organizations already using such services has grown exponentially, from just 0.6 percent a year ago to 6.6 percent this year.
Technology Use and Satisfaction
31

There was a certain degree of uncertainty when it came to the cloud and related software options, with 32.5 percent of respondents unsure whether it is something their organization is considering.
And of the 14 percent of respondents who were entertaining the idea, the majority said their timing for doing so was unclear.
Figure 42: What do you see as the biggest benefit of cloud services or software-as-a-service for AP processing?
Fast startup
No capital investment
Lower cost per invoice
Reduced operational risk
Rapid return on expense
No software or hardware
Minimal IT involvement
22%
34.1% 4.5%
12.9%
18.2%
6.1%
2.3%
When it comes to the cloud, respondents are particularly fond of the fact that it requires minimal IT involvement. Thirty-four percent of respondents said that was the top draw of the technology.
Cloud services are also earning points for the fact that they require no software or hardware — a benefit cited by 22 percent of respondents — and for having a lower cost per invoice. Speed of startup and rapid return on expense were not big motivators for most organizations.
Technology Use and Satisfaction
32

Technology Use and Satisfaction
Figure 43: What do you see as potential disadvantages of cloud services or software-as-a-service for AP processing?
Runs counter to IT mandate for on-premise solution
Limited ability to customize a solution
Lack of control over changes to software
Problems integrating with ERP solutions
Potential problems with bandwidth, connectivity, or “down” time
Risks to our data security
Concerns with service-level agreements
Cost
Other (please specify)
10.6%
18.9%
16.7%
14.4%
10.6%
14.4%
7.6%3.8% 3%
There is less of a consensus when it comes to potential downfalls of cloud services and software-as-a-service. Answers to the question were fragmented, but risk was atop the list.
Risk to data security was cited by 19 percent of respondents, followed by cost, limited ability to customize a solution, and problems integrating with ERP solutions.
33

Technology Spending
Figure 44: How does your 2012 capital budget for AP automation projects compare to your budget for 2011?
Significantly higher
Slightly higher
Unchanged
Slightly lower
Significantly lower
56.5%
12.2% 10.7%7.6%
13%
Despite a return to more favorable economic conditions, AP automation vendors shouldn’t count on an influx of available funds for 2012. The majority of respondents — 57 percent — said budgets remain unchanged compared with a year ago.
The remaining respondents were about split on whether they would have more or less money available, although lower budgets won out by a thin margin.
Figure 45: How much of your overall AP budget is spent on automation projects each year?
More than 25 percent
15 percent to 25 percent
10 percent to 14 percent
7.5 percent to 9.5 percent
2.5 percent to 7 percent
Less than 2.5 percent
56.5%
21.8%
6.5%
8.1%
4%
3.2%
For most organizations, just a fraction of the overall budget is dedicated to automation projects each year. Nearly 57 percent of respondents said less than 2.5 percent of their AP budget is spent on automation. The second most prevalent answer was between 2.5 percent and 7 percent of the budget, which was the case for about two in 10 respondents.
It is important to note that more than a quarter of survey participants skipped the question entirely, perhaps indicating unfamiliarity with their organization’s spending habits.
34
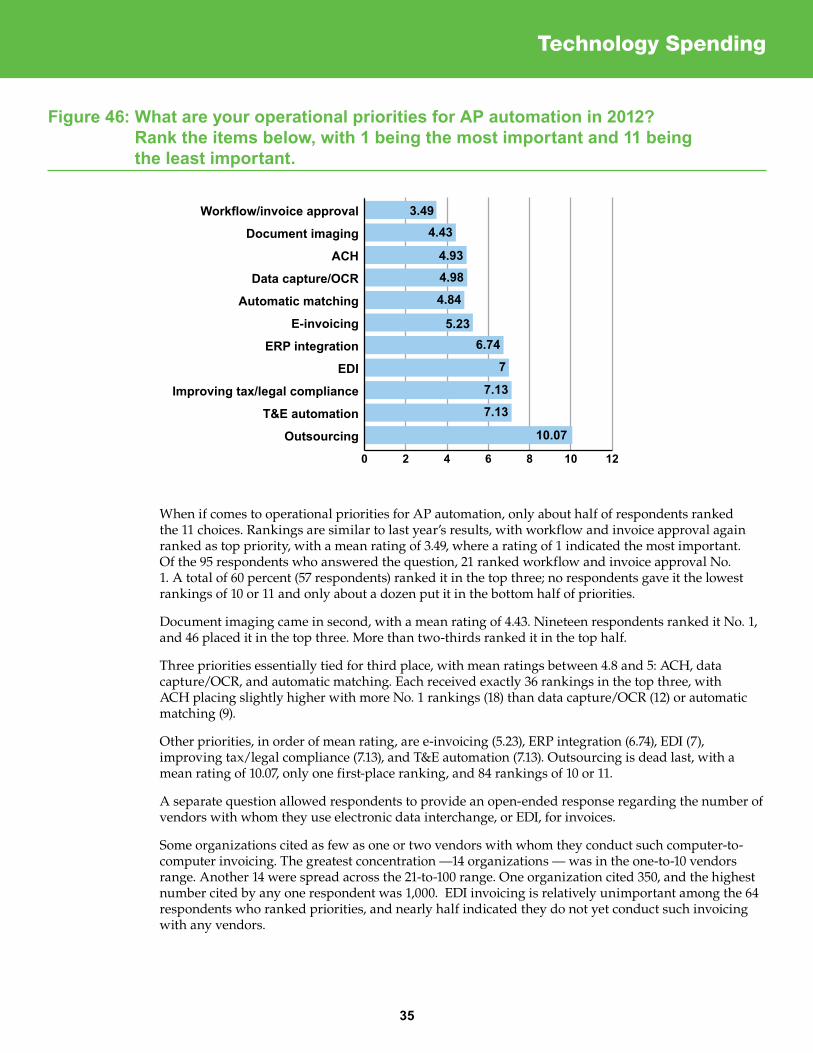
Figure 46: What are your operational priorities for AP automation in 2012? Rank the items below, with 1 being the most important and 11 being the least important.
Workflow/invoice approval
Document imaging
ACH
Data capture/OCR
Automatic matching
E-invoicing
ERP integration
EDI
Improving tax/legal compliance
T&E automation
Outsourcing
0 2 4 6 8 10 12
3.494.43
4.93
4.98
4.84
5.236.74
7
7.13
7.13
10.07
When if comes to operational priorities for AP automation, only about half of respondents ranked the 11 choices. Rankings are similar to last year’s results, with workflow and invoice approval again ranked as top priority, with a mean rating of 3.49, where a rating of 1 indicated the most important. Of the 95 respondents who answered the question, 21 ranked workflow and invoice approval No. 1. A total of 60 percent (57 respondents) ranked it in the top three; no respondents gave it the lowest rankings of 10 or 11 and only about a dozen put it in the bottom half of priorities.
Document imaging came in second, with a mean rating of 4.43. Nineteen respondents ranked it No. 1, and 46 placed it in the top three. More than two-thirds ranked it in the top half.
Three priorities essentially tied for third place, with mean ratings between 4.8 and 5: ACH, data capture/OCR, and automatic matching. Each received exactly 36 rankings in the top three, with ACH placing slightly higher with more No. 1 rankings (18) than data capture/OCR (12) or automatic matching (9).
Other priorities, in order of mean rating, are e-invoicing (5.23), ERP integration (6.74), EDI (7), improving tax/legal compliance (7.13), and T&E automation (7.13). Outsourcing is dead last, with a mean rating of 10.07, only one first-place ranking, and 84 rankings of 10 or 11.
A separate question allowed respondents to provide an open-ended response regarding the number of vendors with whom they use electronic data interchange, or EDI, for invoices.
Some organizations cited as few as one or two vendors with whom they conduct such computer-to-computer invoicing. The greatest concentration —14 organizations — was in the one-to-10 vendors range. Another 14 were spread across the 21-to-100 range. One organization cited 350, and the highest number cited by any one respondent was 1,000. EDI invoicing is relatively unimportant among the 64 respondents who ranked priorities, and nearly half indicated they do not yet conduct such invoicing with any vendors.
Technology Spending
35

Figure 47: Do you leverage a third party for EDI invoicing?
Yes
No
87.9%12.1%
Figure 48: Which of the following factors are important in justifying the cost of AP automation projects?
0% 20% 40% 60% 80% 100%
Other (Please specify.)
Improving master vendorfile management
Ensuring VAT or other tax compliance
Taking advantage of discounts
Improved data capture for bettercontrol over spend
Immediate recording of liabilities
Reduced cost of processingAP transactions
Quicker turnaround times
Optimizing working capital
Increased visibility
Improved metrics to understandand reduce exceptions
FTE redeployments
Fewer mistakes/higher accuracy
Cutting the cost of processing accounts payable transactions is the No. 1 factor in justifying the cost of AP automation. Nearly as important was a decrease in mistakes. Quicker turnaround times and increased visibility were also important to about two-thirds of the respondents.
Technology Spending
36
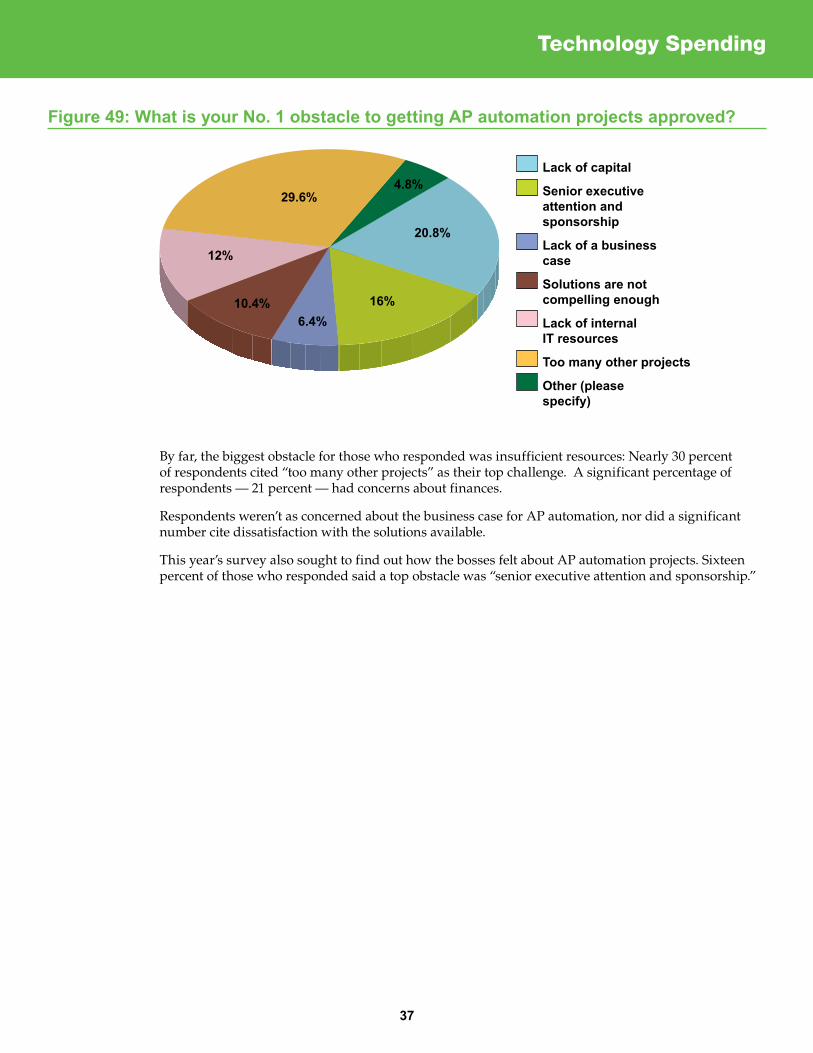
Figure 49: What is your No. 1 obstacle to getting AP automation projects approved?
Lack of capital
Senior executive attention and sponsorship
Lack of a business case
Solutions are not compelling enough
Lack of internal IT resources
Too many other projects
Other (please specify)
12%
29.6%
20.8%
4.8%
16%6.4%
10.4%
By far, the biggest obstacle for those who responded was insufficient resources: Nearly 30 percent of respondents cited “too many other projects” as their top challenge. A significant percentage of respondents — 21 percent — had concerns about finances.
Respondents weren’t as concerned about the business case for AP automation, nor did a significant number cite dissatisfaction with the solutions available.
This year’s survey also sought to find out how the bosses felt about AP automation projects. Sixteen percent of those who responded said a top obstacle was “senior executive attention and sponsorship.”
Technology Spending
37
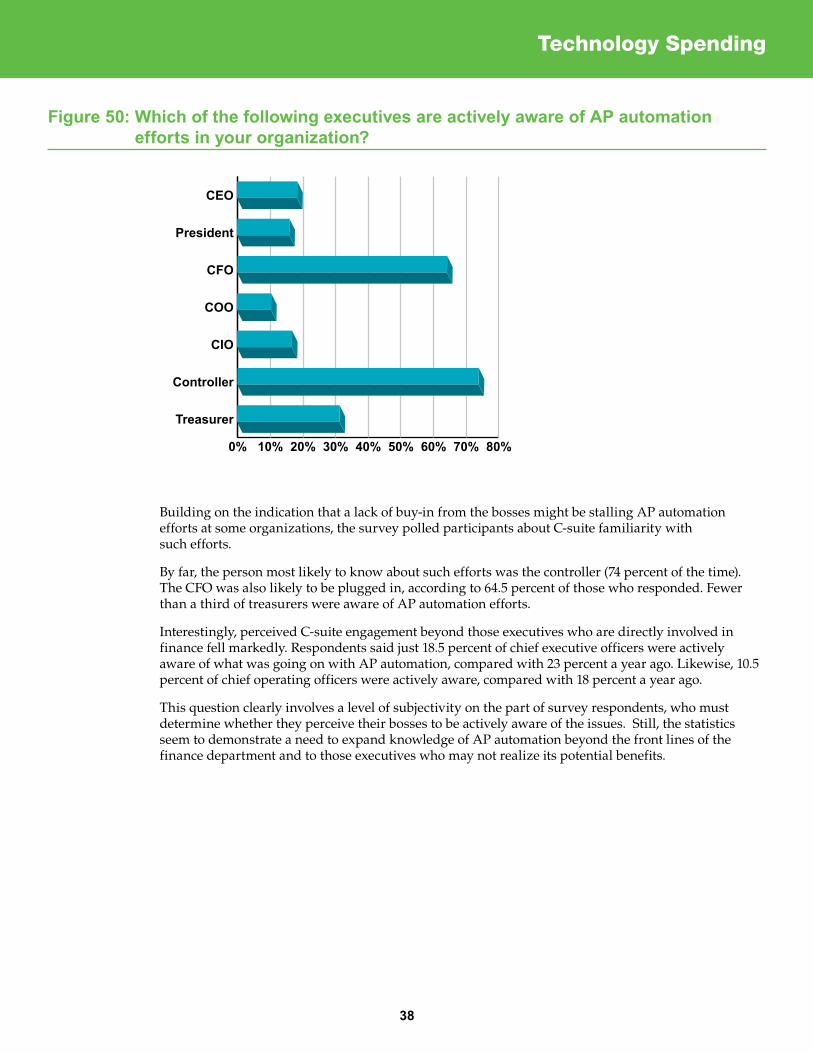
Figure 50: Which of the following executives are actively aware of AP automation efforts in your organization?
0% 10% 20% 30% 40% 50% 60% 70% 80%
Treasurer
Controller
CIO
COO
CFO
President
CEO
Building on the indication that a lack of buy-in from the bosses might be stalling AP automation efforts at some organizations, the survey polled participants about C-suite familiarity with such efforts.
By far, the person most likely to know about such efforts was the controller (74 percent of the time). The CFO was also likely to be plugged in, according to 64.5 percent of those who responded. Fewer than a third of treasurers were aware of AP automation efforts.
Interestingly, perceived C-suite engagement beyond those executives who are directly involved in finance fell markedly. Respondents said just 18.5 percent of chief executive officers were actively aware of what was going on with AP automation, compared with 23 percent a year ago. Likewise, 10.5 percent of chief operating officers were actively aware, compared with 18 percent a year ago.
This question clearly involves a level of subjectivity on the part of survey respondents, who must determine whether they perceive their bosses to be actively aware of the issues. Still, the statistics seem to demonstrate a need to expand knowledge of AP automation beyond the front lines of the finance department and to those executives who may not realize its potential benefits.
Technology Spending
38

Analyzing the state of AP automation allows companies to see areas of growth as well as missed opportunities in automation. For a majority of organizations, automation is a job that is partially complete and will likely remain that way for years to come. Organizations have a number of priorities when it comes to AP automation, but resources remain a key concern in implementing automation projects.
State of AP automation
• Invoiceprocessingvolumehasgrownfor44.8percentoforganizationsduringthepastyear.Nearly half of respondents said more than 90 percent of their invoices are paper-based.
• Two-thirdssaytheyaremakingmoreB2Bpaymentselectronicallycomparedwiththreeyearsago,and ACH payments are gaining ground, although the paper check remains the preferred method of payment by a margin of 2-1.
Priorities related to AP automation
• PrioritieswhenitcomestoAPautomationaresimilartothoseoflastyear,withworkflowandinvoice approval again ranked as top priority. Document imaging came in second, followed by ACH, data capture/OCR, and automating matching.
• VisibilityofAPautomationamongtopexecutivesappearstohavedroppedoff.Just18.5percentof respondents said their chief executive officer was aware of AP automation efforts within their organization, compared with 23 percent a year ago.
• About70percentofthosewhorespondedsaidPOautomationisanimportantcomponentofanAP automation initiative.
Resources for AP automation
•Fifty-sevenpercentsaybudgetsremainunchangedfromayearago.
• JustafractionoftheoverallAPbudgetisdedicatedtoAPautomation.
• Respondentscitedresources(“toomanyotherprojects”and“lackofcapital”)astop challenges in terms of AP automation. Internal resources were also cited as an impediment in implementing OCR.
Conclusion
39