2012 walkability survey report
TRANSCRIPT

Walk to School Day 2012 Walkability Survey Walk/Bike Nashville – October 2012

Walk to School Day 2012 Walkability Survey Walk/Bike Nashville
1
Executive Summary Cole Elementary, the 2012 Walk to School Day spotlight school, has a large population of students who walk to school on a regular basis, likely due to the fact that many students live within ½ mile of the school. Although the majority of survey respondents rate the walkability of their school as Good or Excellent, many parents expressed concern that their child’s route to school lacks adequate sidewalks, marked pedestrian crossings, and crossing signals. Additionally, survey respondents noted that unleashed dogs and the behavior and speed of drivers made their child’s route to school feel unsafe. To make our streets safer for walking for all road users, whether eight or eighty years old, Walk/Bike Nashville recommends the following:
• The city of Nashville should continue to aggressively work on building out the Strategic Plan for Sidewalks and Bikeways.
• Special attention should be placed on safe crossings around schools
• Leash and traffic laws should be enforced, with a particular emphasis on the times of day when children are walking to and from school.
About Walk/Bike Nashville Since 1998, Walk/Bike Nashville has sought to make active transportation an option for all Nashvillians, no matter where they live or where they're trying to go. Walk/Bike Nashville advocates for sidewalks and bikeways that support active living, commuting options, and recreational opportunities, with the ultimate goal of building a more walkable, bikeable, and livable Nashville. For more information, visit www.walkbikenashville.org.
Walk to School Day 2012 Walkability Survey Walk/Bike Nashville
2
About the Survey The 2012 Walkability Survey was designed with assistance from the Vanderbilt Institute for Clinical and Translational Research. The survey was administered to Cole Elementary parents in both Spanish and English. Parents received the survey as part of a take home packet and returned paper copies to school officials. In total, 74 responses were recorded. Walk/Bike Nashville staff members entered the survey into REDcap, an electronic data capture software system funded by Vanderbilt Institute for Clinical and Translational Research grant support (UL1 TR000445 from NCATS/NIH).
Walk to School Day On October 3, 2012, more than 10,000 walkers participated in Walk to School Day at more than 50 Metro Nashville Public Schools. Walk to School encourages students to engage in physical activity while highlighting the importance of sidewalks, crosswalks, and other pedestrian infrastructure. The 2012 Walk to School Day spotlight school was Cole Elementary. Mayor Karl Dean joined students, teachers, and parents from Cole to highlight the benefits of daily walking. Students walked with the MNPD mounted patrol, motor brigade, student performers, and other colorful community members before attending a special assembly with Mayor Dean, Dr. Jesse Register, Chief Steve Anderson, and Dr. Bill Paul. The annual event is organized by Walk/Bike Nashville in partnership with Metro Nashville Public Schools, Safe Kids Cumberland Valley, the Metro Department of Health, and the Metropolitan Planning Organization.
Cole Elementary – School Profile
• Number of Students 750 • Grades Served Pre-K to 4 • District 2 • School Zone Antioch Cluster • Principal Chad High • Address 5060 Colemont Drive, Antioch, TN
Walk to School Day 2012 Walkability Survey Walk/Bike Nashville
3
Survey Results
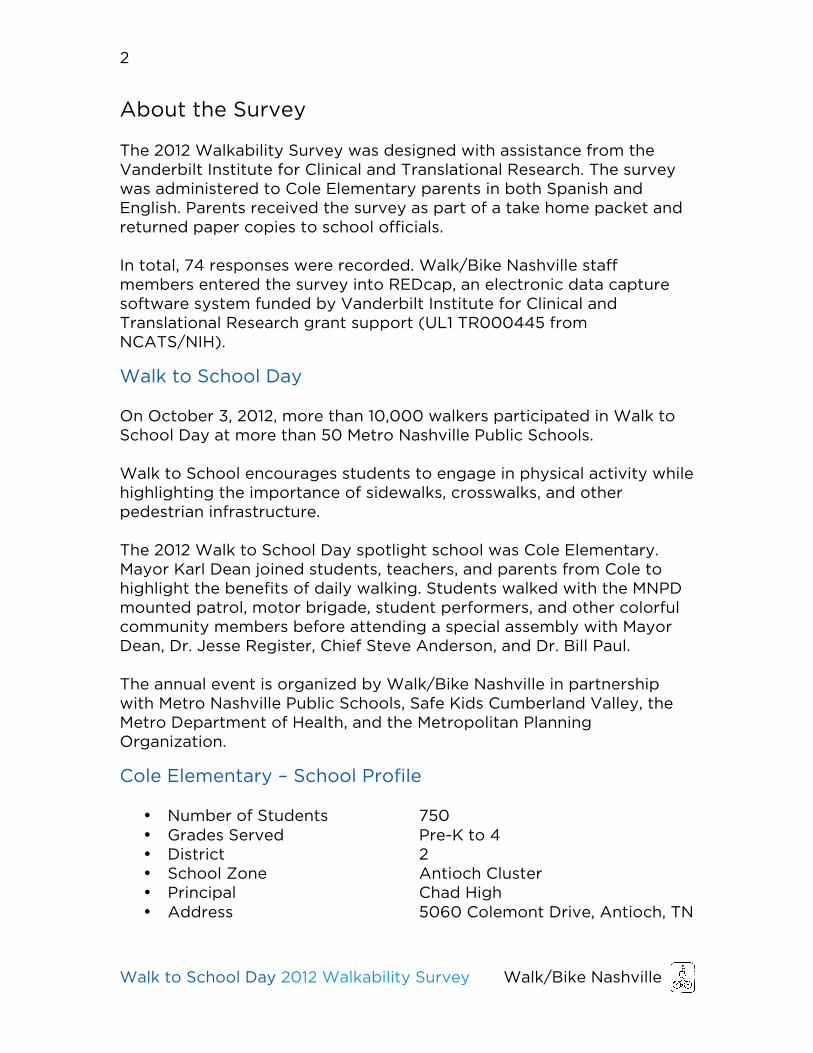
How far does your child live from school?
35.1% of respondents stated that their child lives no more than a ¼ mile from Cole Elementary, with an additional 13.5% residing between ¼ and ½ miles from the school. Nearly half (48.6%) of respondents’ children live within a ½ mile radius of the school.
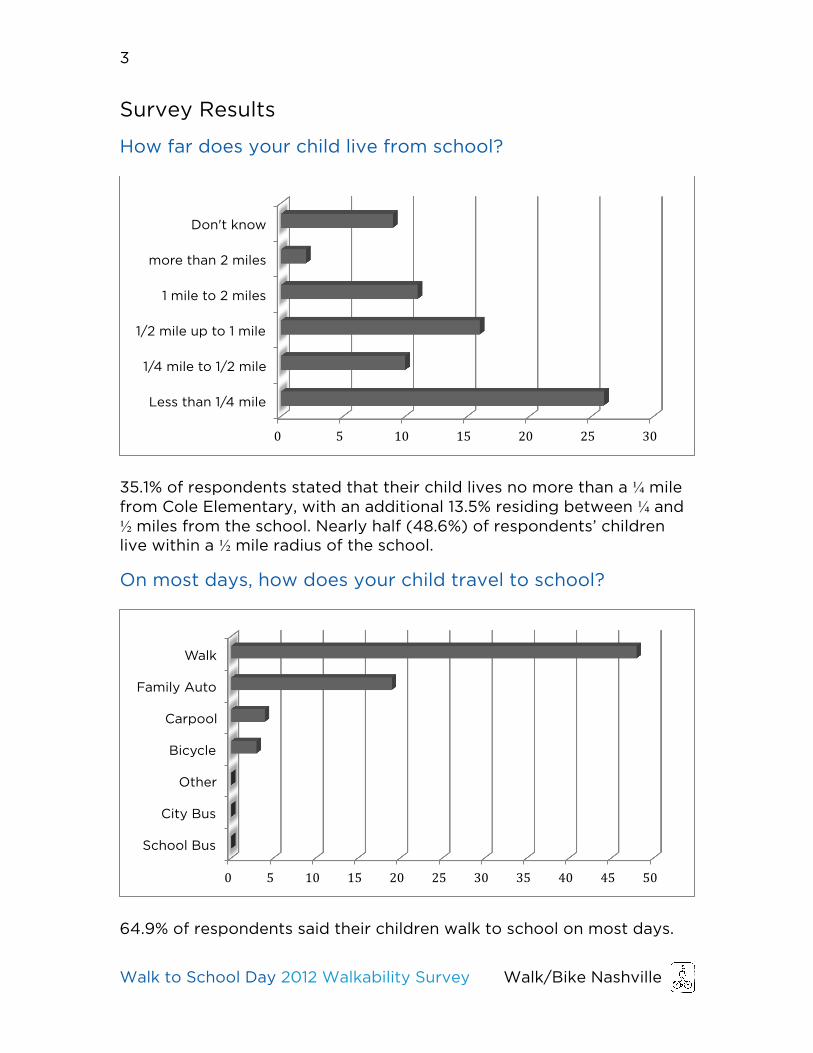
On most days, how does your child travel to school?
64.9% of respondents said their children walk to school on most days.
0 5 10 15 20 25 30
Less than 1/4 mile
1/4 mile to 1/2 mile
1/2 mile up to 1 mile
1 mile to 2 miles
more than 2 miles
Don't know
0 5 10 15 20 25 30 35 40 45 50
School Bus
City Bus
Other
Bicycle
Carpool
Family Auto
Walk

Walk to School Day 2012 Walkability Survey Walk/Bike Nashville
4
The next largest group of respondents, 25.7% of total, reported that their children were driven to school in a private automobile.
On most days. how does your child travel back home from school?
Respondents were more likely to report that their children walked home from school than to school. 82.4% of respondents reported that their student walks home from school, nearly 20% more than those who walk to school.
How long does it normally take your child to travel from home to school?
0 5 10 15 20 25 30 35
Less than 5 minutes
5-10 minutes
11-20 minutes
More than 20 minutes
Don't know
0 10 20 30 40 50 60 70
City Bus
Other
School Bus
Carpool
Bicycle
Family Auto
Walk

Walk to School Day 2012 Walkability Survey Walk/Bike Nashville
5
How long does it normally take your child to travel from school to home?
For both trips to and from school, more than 75% of respondents reported that their child’s trip could be completed in less than 10 minutes.
Sidewalks Respondents were given several opportunities to indicate problems with sidewalks and catalog the location of issues.
• 26 respondents (35%) reported that their child’s route does not have sidewalks
• 19 respondents (26%) reported that their child’s route had sidewalks, but that they were not continuous
• 9 respondents (12%) reported that the sidewalks along their child’s route were too close to fast moving traffic
• 8 respondents (11%) reported that sidewalks were blocked by cars or trucks.
Street Crossings Respondents were given several opportunities to indicate problems with street crossings and catalog the location of issues.
• 11 respondents (15%) reported a need for marked pedestrian crosswalks
• 8 respondents (11%) reported that their child’s road featured a road to wide to cross safely
0 5 10 15 20 25 30 35
Less than 5 minutes
5-10 minutes
11-20 minutes
More than 20 minutes
Don't know

Walk to School Day 2012 Walkability Survey Walk/Bike Nashville
6
Traffic and Drivers Respondents were given several opportunities to indicate problems with traffic and drivers and catalog the location of issues.
• 23 respondents (31%) reported that drivers seem to be going too fast along their child’s route to school
• 7 respondents (9%) reported that drivers along their child’s route do not yield to pedestrians
Safety Respondents were given several opportunities to indicate problems with safety and catalog the location of issues.
• 16 respondents (22%) reported that there were unleashed dogs along their child’s route to school
• 10 respondents (14%) reported that they did not feel safe walking along their child’s route to school because of the behavior of drivers.
Overall rating of the school route walkability
More than half of respondents rated Cole Elementary’s walkability as Good or Excellent, while 20% of respondents had concerns about the safety of their child’s route and 12% of respondents felt that it is not safe for their children to walk to school.
0 5 10 15 20 25
Excellent: Walking to school is easy, pleasant, and safe
Good: There are a few problems with walking to school, but children can do it
safely
Fair: Walking is difficult; safety is a concern
Poor: The route to school is unsafe for children to walk