2012 surface water quality summary
TRANSCRIPT

2012 Surface Water Quality Summary
Regional Watershed Monitoring Program
May 2013
Watershed Monitoring and Reporting Section Ecology Division

Acknowledgments
Funding and/or in-kind support for the projects and activities outlined in this report has been made available from the following partners:
Region of Peel Region of York City of Toronto
Region of Durham Toronto Remedial Action Plan
Ministry of the Environment
Report prepared by: Ray Biastoch, Biomonitoring Analyst, Watershed Monitoring and Reporting Section
Reviewed by: Scott Jarvie, Manager, Watershed Monitoring and Reporting Section, Angela Wallace, Biomonitoring Analyst, Watershed Monitoring and Reporting Section
This report may be referenced as:
Toronto and Region Conservation Authority (TRCA). 2013. 2012 Surface Water Quality Summary – Regional Watershed Monitoring Program. 28 pp + appendices.
22 00 11 22 SS uu rr ff aa cc ee WW aa tt ee rr QQ uu aa ll ii tt yy SS uu mm mm aa rr yy
May 2013
Table of Contents1. Introduction ................................................................................................................ 1
2. Methods ...................................................................................................................... 1
3. Results & Discussion ................................................................................................. 7 3.1 Precipitation ......................................................................................................................... 8 3.2 General Chemistry Parameters ......................................................................................... 10
3.2.1 Chloride .......................................................................................................................................... 10 3.2.2 Total Suspended Solids ................................................................................................................. 11 3.2.3 pH ................................................................................................................................................... 12 3.3 Metals ................................................................................................................................. 13
3.3.1 Aluminium ...................................................................................................................................... 13 3.3.2 Arsenic ........................................................................................................................................... 14 3.3.3 Copper ........................................................................................................................................... 15 3.3.4 Iron ................................................................................................................................................. 16 3.3.5 Lead................................................................................................................................................ 17 3.3.6 Nickel .............................................................................................................................................. 18 3.3.7 Zinc ................................................................................................................................................. 19 3.4 Bacteria .............................................................................................................................. 20 3.5 Nutrients ............................................................................................................................. 22
3.5.1 Ammonia ........................................................................................................................................ 22 3.5.2 Nitrate, Nitrite, and Total Kjeldahl Nitrogen.................................................................................... 23 3.5.3 Phosphorus .................................................................................................................................... 25
4. Summary .................................................................................................................. 26
5. References ............................................................................................................... 28
List of Figures Figure 1. 2012 TRCA surface water quality monitoring stations ......................................................... 2 Figure 2. Box plot graphic example ..................................................................................................... 8 Figure 3. Annual precipitation at Pearson International Airport from 2001 to 2012 ........................... 9 Figure 4. Monthly precipitation at Pearson International Airport for 2012 .......................................... 9 Figure 5. Chloride concentrations (mg/L) at 41 stations within TRCA jurisdiction (CWQG: long-term
120 mg/L (chronic) and short-term 640 mg/L (acute); CCME 2011) ................................ 11 Figure 6. Total suspended solids (TSS) concentrations (mg/L) at 41 stations within TRCA
jurisdiction (CWQG: 30 mg/L) ............................................................................................ 12 Figure 7. pH values at 41 stations within TRCA jurisdiction (PWQO: 6.5 - 8.5 pH) .......................... 13 Figure 8. Aluminum concentrations (μg/L) at 41 stations within TRCA jurisdiction ......................... 14 Figure 9. Arsenic concentrations (μg/L) at 28 stations within TRCA jurisdiction (PWQO: 5 μg/L) ... 15 Figure 10. Copper concentrations (μg/L) at 41 stations within TRCA jurisdiction (PWQO: 5 μg/L) .. 16

22 00 11 22 SS uu rr ff aa cc ee WW aa tt ee rr QQ uu aa ll ii tt yy SS uu mm mm aa rr yy
May 2013 Figure 11. Iron concentrations (μg/L) at 41 stations within TRCA jurisdiction (PWQO: 300 μg/L) .... 17 Figure 12. Lead concentrations (μg/L) at 28 stations within TRCA jurisdiction (PWQO: 5 μg/L) ....... 18 Figure 13. Nickel concentrations (μg/L) at 41 stations within TRCA jurisdiction. The PWQO of 25
μg/L is not displayed .......................................................................................................... 19 Figure 14. Zinc concentrations (μg/L) at 41 stations within TRCA jurisdiction (PWQO: 20 μg/L) ...... 20 Figure 15. Escherichia coli concentrations (CFU/100mL) at 41 stations within TRCA jurisdiction
(PWQO: 100 CFU/100 mL) ................................................................................................. 21 Figure 16. Ammonia concentrations (μg /L) at 41 stations within TRCA jurisdiction ......................... 23 Figure 17. Nitrate concentrations (mg/L) at 41 stations within TRCA jurisdiction (EC: 2.93 mg/L) ... 24 Figure 18. Nitrite concentrations (mg/L) at 41 stations within TRCA jurisdiction (CWQG: 0.06 mg/L)24 Figure 19. Total Kjeldahl nitrogen (TKN) concentrations (mg/L) at 41 stations within TRCA
jurisdiction ........................................................................................................................... 25 Figure 20. Total phosphorus concentrations (mg/L) at 41 stations within TRCA jurisdiction (PWQO:
0.03 mg/L) ........................................................................................................................... 26 List of Tables Table 1. 2012 TRCA surface water quality stations and associated laboratories ............................. 3 Table 2. Standard suite of water quality parameters analyzed1by York-Durham and OMOE
laboratories. The results of the 16 parameters in boldface are discussed in this report ... 5 Table 3. Road density (roads (km) per km2) and road density scores of the station catchment ..... 6 Table 4. Snow (cm) for 2011 and 2012 at Pearson International Airport from January to April ..... 10
22 00 11 22 SS uu rr ff aa cc ee WW aa tt ee rr QQ uu aa ll ii tt yy SS uu mm mm aa rr yy
May 2013
1
1. Introduction
Since 2002, the Toronto and Region Conservation Authority (TRCA) has monitored stream water quality at selected locations within the watersheds of the greater Toronto region on a monthly basis. These activities have been undertaken as part of TRCA’s Regional Watershed Monitoring Program (RWMP) in partnership with the Ontario Ministry of the Environment (OMOE). The data collected are shared with partner municipalities and other agencies, and are used for planning, implementation and reporting activities including the development of watershed plans and report cards as well as watershed characterization reports in support of source water protection planning. This report presents selected results of the 2012 surface water quality sampling conducted in support of the Provincial Water Quality Monitoring Network (PWQMN), RWMP and special projects. It provides a general overview and description of the range of water quality conditions across the TRCA jurisdiction during the 2012 sample year. This report and associated data can assist in identifying areas of concern, elevated levels of contaminants, and can be used to affirm both poor and good water quality in different land use areas. However, results should be interpreted with caution, since sampling events were not targeted to capture specific stream flow conditions (e.g. wet weather events) and this report presents only one year of data which may not represent normal conditions.
2. Methods
In 2012, surface water quality samples were collected at 44 stations (Figure 1) throughout the TRCA’s jurisdiction (the City of Toronto’s wet weather stations are displayed for informative purposes in Figure 1). Sample collection and laboratory analysis were carried out through several partnerships which are outlined below:
• 13 stations were sampled by TRCA under the OMOE’s PWQMN; • 25 stations were sampled by TRCA for the RWMP; • 3 RWMP stations (104028, 104026 and 104023) were sampled in support of the Seaton/Duffins
Heights Development Monitoring Project; • 3 stations (Glen Haffy 1, Heart Lake 1 and Bruce’s Mill 1), were sampled during the first half of 2012 in
support of TRCA's Parks and Culture Department’s initiative to assess the water quality within TRCA parks.
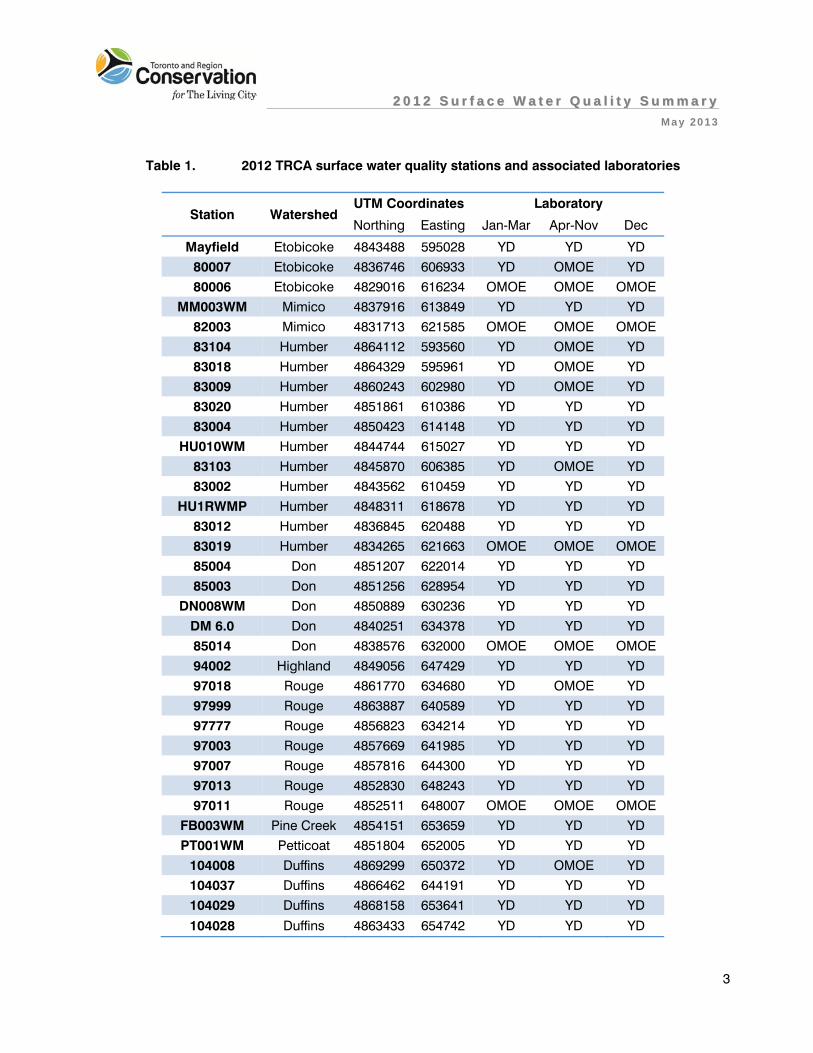
Monthly samples were collected using in-stream “grab” techniques following the OMOE PWQMN protocol (OMOE 2003) and also included in-situ measurements (e.g. water temperature, pH, and specific conductivity) collected using a hand-held YSI meter (Model 600QS). Water quality samples were collected throughout the year, typically in the third week of each month, irrespective of precipitation. Samples that were part of the PWQMN partnership (13 stations) were submitted to the OMOE Rexdale Laboratory. The remaining samples from stations or months (e.g. January to March, and December) not included in the PWQMN were submitted to the York-Durham Regional Environmental Laboratory in order to augment water quality data from these stations and to maintain a year-round dataset (Table 1).

22 00 11 22 SS uu rr ff aa cc ee WW aa tt ee rr QQ uu aa ll ii tt yy SS uu mm mm aa rr yy
May 2013
2
Figure 1. 2012 TRCA surface water quality monitoring stations
22 00 11 22 SS uu rr ff aa cc ee WW aa tt ee rr QQ uu aa ll ii tt yy SS uu mm mm aa rr yyMay 2013
3
Table 1. 2012 TRCA surface water quality stations and associated laboratories
Station WatershedUTM Coordinates Laboratory
Northing Easting Jan-Mar Apr-Nov Dec
Mayfield Etobicoke 4843488 595028 YD YD YD 80007 Etobicoke 4836746 606933 YD OMOE YD 80006 Etobicoke 4829016 616234 OMOE OMOE OMOE
MM003WM Mimico 4837916 613849 YD YD YD 82003 Mimico 4831713 621585 OMOE OMOE OMOE 83104 Humber 4864112 593560 YD OMOE YD 83018 Humber 4864329 595961 YD OMOE YD 83009 Humber 4860243 602980 YD OMOE YD 83020 Humber 4851861 610386 YD YD YD 83004 Humber 4850423 614148 YD YD YD
HU010WM Humber 4844744 615027 YD YD YD 83103 Humber 4845870 606385 YD OMOE YD 83002 Humber 4843562 610459 YD YD YD
HU1RWMP Humber 4848311 618678 YD YD YD 83012 Humber 4836845 620488 YD YD YD 83019 Humber 4834265 621663 OMOE OMOE OMOE 85004 Don 4851207 622014 YD YD YD 85003 Don 4851256 628954 YD YD YD
DN008WM Don 4850889 630236 YD YD YD DM 6.0 Don 4840251 634378 YD YD YD 85014 Don 4838576 632000 OMOE OMOE OMOE 94002 Highland 4849056 647429 YD YD YD 97018 Rouge 4861770 634680 YD OMOE YD 97999 Rouge 4863887 640589 YD YD YD 97777 Rouge 4856823 634214 YD YD YD 97003 Rouge 4857669 641985 YD YD YD 97007 Rouge 4857816 644300 YD YD YD 97013 Rouge 4852830 648243 YD YD YD 97011 Rouge 4852511 648007 OMOE OMOE OMOE
FB003WM Pine Creek 4854151 653659 YD YD YD PT001WM Petticoat 4851804 652005 YD YD YD
104008 Duffins 4869299 650372 YD OMOE YD 104037 Duffins 4866462 644191 YD YD YD 104029 Duffins 4868158 653641 YD YD YD
104028 Duffins 4863433 654742 YD YD YD

22 00 11 22 SS uu rr ff aa cc ee WW aa tt ee rr QQ uu aa ll ii tt yy SS uu mm mm aa rr yyMay 2013
4
Station Watershed UTM Coordinates Laboratory
Northing Easting Jan-Mar Apr-Nov Dec
104023 Duffins 4858867 653796 YD YD YD 104026 Duffins 4859199 654730 YD YD YD 104027 Duffins 4859419 655458 YD YD YD 104025 Duffins 4857115 654656 YD YD YD 104001 Duffins 4855880 657579 OMOE OMOE OMOE 107002 Carruthers 4856972 660850 YD YD YD
Heart Lake 1a Etobicoke 4843199 597954 YD - -
Glen Haffy 1b
Humber 4866262 584678 YD YD -
Bruce’s Mill 1b
Rouge 4866672 632670 YD YD -
OMOE: OMOE Rexdale Laboratory; YD: York-Durham Regional Environmental Laboratory a Sampled in January, too dry to sample in February, March, and April
b Sampled from January to June 2012 The two laboratories analyzed a standard suite of nutrients, metals, microbiological and conventional water quality parameters which are listed in Table 2. The 16 parameters in boldface are those that were selected for discussion in this report and include all the PWQMN recommended indicator parameters as well as additional forms of nitrogen (ammonia and total Kjeldahl nitrogen), Escherichia coli, and several metals. These parameters provide a quick but comprehensive indication of the water quality at each station. Elevated concentrations of these parameters may point to natural and/or anthropogenic sources within the watershed. The results of each parameter were compared to the Provincial Water Quality Objectives (PWQO) guidelines where applicable. The PWQOs are a set of numerical and narrative ambient surface water quality criteria that represent a desirable level of water quality that will protect all forms of aquatic life and all aspects of their aquatic life cycles during indefinite exposure to the water as well as protecting recreational water usage based on public health considerations and aesthetics (OMOEE 1994). When PWQO guidelines were not available, other objectives such as Canadian Water Quality Guidelines (CWQG) (CCME 2007) and Recommended Water Quality Guidelines for the Protection of Aquatic Life under the Canadian Environmental Sustainability Indicators (CESI) Initiative (EC 2012) were used. All laboratory results that were reported as less than the minimum detection limit (MDL) were set to the MDL value for the purposes of interpretation. Surface water quality data are stored in “Water”, a relational SQL database that is part of the TRCA’s corporate database “EnviroBase.”

22 00 11 22 SS uu rr ff aa cc ee WW aa tt ee rr QQ uu aa ll ii tt yy SS uu mm mm aa rr yyMay 2013
5
Table 2. Standard suite of water quality parameters analyzed1by York-Durham and OMOE laboratories. The results of the 16 parameters in boldface are discussed in this report
General Chemistry Nutrients Metals Microbiological
Alkalinity Ammonia Aluminium Escherichia coliBiochemical Oxygen Demand *Nitrate/Nitrite Arsenic Calcium Nitrogen, Total Kjeldahl Barium*Chloride Phosphate BerylliumConductivity *Total Phosphorus CadmiumDissolved Oxygen ChromiumHardness CobaltMagnesium *CopperpH IronPotassium *LeadSodium ManganeseTotal Dissolved Solids Molybdenum*Total Suspended Solids NickelTurbidity StrontiumWater Temperature Vanadium *Zinc
Note: 1Additional parameters may be analyzed on a site/project specific basis
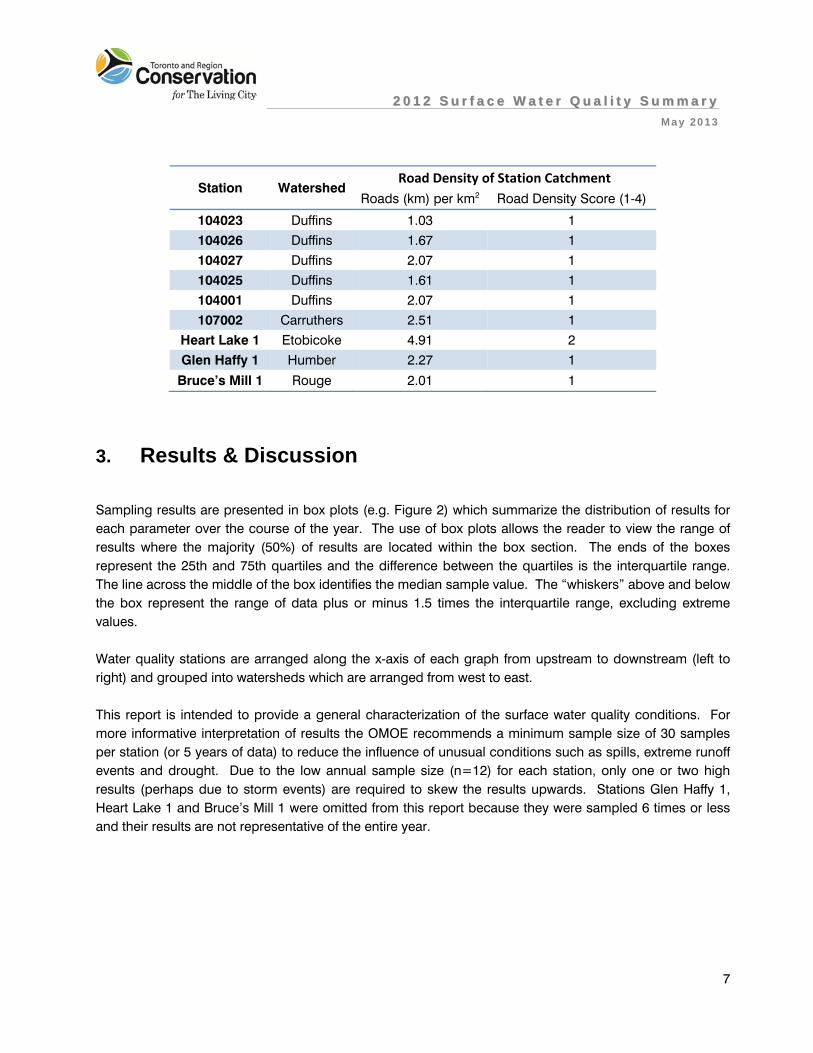
*PWQMN recommended indicator parameters Stream conditions were recorded at the time of sampling to help characterize the sample with respect to flow response to recent or occurring precipitation. These field notes (Appendix A) as well as 2012 precipitation records from Pearson International Airport were included in this report to provide context to assist with interpretation of results. As an area is urbanized the kilometres of roads in that area increases. Road density is the number of kilometres of roads per square kilometer in a watershed or catchment and is comparable between watersheds of different sizes. Road density data for the water quality stations are presented in Table 3. The actual road densities (roads (km) per km2 in catchment) range from 1 to 10. The road density scores group the road densities into 4 categories: 1 to 3, 3 to 5, 5 to 8, and 8 to 10. These data were obtained by determining in which subwatershed or catchment a station was located and applying the road density of that catchment to the station. Road density is considered a surrogate for urbanization, and higher road densities indicate more impervious surfaces, more storm runoff, and higher concentrations of water quality parameters associated with urban areas.

22 00 11 22 SS uu rr ff aa cc ee WW aa tt ee rr QQ uu aa ll ii tt yy SS uu mm mm aa rr yyMay 2013
6
Table 3. Road density (roads (km) per km2) and road density scores of the station catchment
Station WatershedRoad Density of Station Catchment
Roads (km) per km2 Road Density Score (1-4)
Mayfield Etobicoke 1.27 1 80007 Etobicoke 4.13 2 80006 Etobicoke 5.72 3
MM003WM Mimico 7.75 3 82003 Mimico 9.15 4 83104 Humber 1.66 1 83018 Humber 1.31 1 83009 Humber 1.43 1 83020 Humber 2.04 1 83004 Humber 2.04 1
HU010WM Humber 2.35 1 83103 Humber 2.49 1 83002 Humber 3.29 2
HU1RWMP Humber 8.28 4 83012 Humber 3.47 2 83019 Humber 3.47 2 85004 Don 6.79 3 85003 Don 8.58 4
DN008WM Don 9.63 4 DM 6.0 Don 8.92 4 85014 Don 8.92 4 94002 Highland 9.38 4 97018 Rouge 2.17 1 97999 Rouge 1.6 1 97777 Rouge 6.02 3 97003 Rouge 1.92 1 97007 Rouge 1.92 1 97013 Rouge 2.07 1 97011 Rouge 5.55 3
FB003WM Pine Creek NA NA PT001WM Petticoat 3.74 2
104008 Duffins 1.57 1 104037 Duffins 2.37 1 104029 Duffins 1.18 1
104028 Duffins 1.72 1
22 00 11 22 SS uu rr ff aa cc ee WW aa tt ee rr QQ uu aa ll ii tt yy SS uu mm mm aa rr yyMay 2013
7
Station WatershedRoad Density of Station Catchment
Roads (km) per km2 Road Density Score (1-4)
104023 Duffins 1.03 1 104026 Duffins 1.67 1 104027 Duffins 2.07 1 104025 Duffins 1.61 1 104001 Duffins 2.07 1 107002 Carruthers 2.51 1
Heart Lake 1 Etobicoke 4.91 2 Glen Haffy 1 Humber 2.27 1
Bruce’s Mill 1 Rouge 2.01 1
3. Results & Discussion
Sampling results are presented in box plots (e.g. Figure 2) which summarize the distribution of results for each parameter over the course of the year. The use of box plots allows the reader to view the range of results where the majority (50%) of results are located within the box section. The ends of the boxes represent the 25th and 75th quartiles and the difference between the quartiles is the interquartile range. The line across the middle of the box identifies the median sample value. The “whiskers” above and below the box represent the range of data plus or minus 1.5 times the interquartile range, excluding extreme values. Water quality stations are arranged along the x-axis of each graph from upstream to downstream (left to right) and grouped into watersheds which are arranged from west to east. This report is intended to provide a general characterization of the surface water quality conditions. For more informative interpretation of results the OMOE recommends a minimum sample size of 30 samples per station (or 5 years of data) to reduce the influence of unusual conditions such as spills, extreme runoff events and drought. Due to the low annual sample size (n=12) for each station, only one or two high results (perhaps due to storm events) are required to skew the results upwards. Stations Glen Haffy 1, Heart Lake 1 and Bruce’s Mill 1 were omitted from this report because they were sampled 6 times or less and their results are not representative of the entire year.

22 00 11 22 SS uu rr ff aa cc ee WW aa tt ee rr QQ uu aa ll ii tt yy SS uu mm mm aa rr yyMay 2013
8
guideline
Figure 2. Box plot graphic example 3.1 Precipitation
Monthly precipitation data for the Environment Canada meteorological station at Pearson International Airport were downloaded from the National Climate Data and Information Archive website (http://www.climate.weatheroffice.gc.ca/climateData). The total amount of precipitation recorded in 2012 at Pearson measured 731 mm, which was 69 mm below the 12-year average of 801 mm (Figure 3). Monthly precipitation values for 2012 are displayed in Figure 4. Precipitation was highest in September and October and may have contributed to the elevated concentrations of pollutants found at some stations. Samples were considered collected during precipitation events if field notes indicated precipitation at the time of sampling, and/or the Pearson meteorological station indicated precipitation the day before or the day of sampling. Approximately 50% of samples were collected during, the day of, or the day after precipitation events (Appendix B). From January to April 2012, 33 cm of snow fell as precipitation compared to 75 cm in the same period in 2011 (Table 4). Presumably, the amount of road salt applied within the TRCA jurisdiction is dependent upon snowfall, and the mild winter of 2012 may have contributed to lower chloride concentrations at some water quality stations.
75th percentile
25th percentile
median interquartile range
whisker (+ 1.5 x interquartile range)
whisker (- 1.5 x interquartile range)

22 00 11 22 SS uu rr ff aa cc ee WW aa tt ee rr QQ uu aa ll ii tt yy SS uu mm mm aa rr yyMay 2013
9
Figure 3. Annual precipitation at Pearson International Airport from 2001 to 2012
Figure 4. Monthly precipitation at Pearson International Airport for 2012

22 00 11 22 SS uu rr ff aa cc ee WW aa tt ee rr QQ uu aa ll ii tt yy SS uu mm mm aa rr yyMay 2013
10
Table 4. Snow (cm) for 2011 and 2012 at Pearson International Airport from January to April
Snow (cm)
2011 2012
January 46.0 16.2
February 24.4 12.6
March 0.6 2.4
April 3.8 1.8
Total: 74.8 33.0 3.2 General Chemistry Parameters
The general chemistry parameters analyzed in this report are chloride, total suspended solids (TSS) and pH. 3.2.1 Chloride
Urbanization and road density are correlated with chloride concentrations as a major source of chloride is road salting in winter months. Chloride does not readily absorb onto mineral surfaces, and thus concentrations can be high in surface water and shallow aquifers, the latter releasing chloride throughout the year (CCME, 2011). It can be toxic to aquatic organisms with acute toxic effects at high concentrations and chronic effects (on growth and reproduction) at lower concentrations (OMOE, 2003). Chloride displayed higher levels at stations situated in highly urbanized areas (Figure 5). In 2012, there were no stations that displayed a median value exceeding the short-term CWQG of 640 mg/L. The 75th percentile chloride values of 5 stations (MM003WM, 82003, HU1RWMP, 83012, and 85004) exceeded the short-term CWQG, whereas 9 and 10 stations exceeded it in 2011 and 2010 respectively. The lower number of stations in 2012 with excessive chloride levels may be due to decreased snow precipitation which may have reduced the amount of salt applied to roads. Over 50% of stations (23/41) had a median value which surpassed the long-term CWQG chloride guideline of 120 mg/L for chronic exposure compared to 20 stations in 2011. Elevated chloride values at these stations have been documented consistently since 2009 and are likely a result of the surrounding land-uses (i.e. urban, industrial, commercial, residential, etc.) which increase road density. Road salting is directly linked to urbanization and increased chloride levels. Stations in Etobicoke Creek, Humber River and the Rouge River displayed a distinct increase in median chloride values from upper (less urbanized) to

22 00 11 22 SS uu rr ff aa cc ee WW aa tt ee rr QQ uu aa ll ii tt yy SS uu mm mm aa rr yyMay 2013
11
lower (highly urbanized) watershed. Mimico Creek, Don River, Highland Creek, Frenchman’s Bay, Petticoat Creek and Carruthers Creek all display elevated median values which surpass the long-term CWQG of 120 mg/L. Station 83009 located in the upper Humber River watershed recorded the lowest median concentration of chloride in 2011, which is likely a result of low road density. Duffins Creek, which is the least urbanized watershed, exhibited the lowest chloride concentrations and the median values did not exceed the long-term CWQG.
Chl
orid
e (m
g/L)
May
field
8000
780
006
MM
003W
M82
003
8310
483
018
8300
983
020
8300
4H
U01
0WM
8310
383
002
HU
1RW
MP
8301
283
019
8500
485
003
DN
008W
MD
M 6
.085
014
9400
297
018
9799
997
777
9700
397
007
9701
397
011
FB00
3WM
PT0
01W
M10
4008
1040
3710
4029
1040
2810
4023
1040
2610
4027
1040
2510
4001
1070
02
Figure 5. Chloride concentrations (mg/L) at 41 stations within TRCA jurisdiction (CWQG: long-term 120 mg/L (chronic) and short-term 640 mg/L (acute); CCME 2011)
3.2.2 Total Suspended Solids
Total suspended solids (TSS) are a measure of suspended sediment, which can affect fish and benthos health and stream aesthetics. Suspended particles may cause abrasion on fish gills, and reduce as well as impair spawning habitat. Toxic organics and metals often adhere to suspended solids and may become available to benthic fauna when the solids settle (CCME, 2007). Precipitation can increase TSS, and samples collected during or after precipitation events may have higher TSS values.
Short-term CWQG
Long-term CWQG
Etobicoke Creek
Mimico Creek
Humber River
Don River Highland
Creek
Rouge River
Duffins Creek
Carruthers Creek
Pine Creek (Frenchman’s Bay)
Petticoat Creek
Surface Water Quality Stations and Watersheds

22 00 11 22 SS uu rr ff aa cc ee WW aa tt ee rr QQ uu aa ll ii tt yy SS uu mm mm aa rr yyMay 2013
12
Median TSS values for all 41 stations remained below the CWQG of 30 mg/L (Figure 6). The 75th percentile TSS values at 4 stations (82003, 83020, 83103, and HU1RWMP) exceeded the CWQG. In 2011 and 2010, 18 and 6 stations respectively displayed 75th percentile values that exceeded the CWQG. Decreased precipitation levels in 2012 may have contributed to a reduction in TSS values.
0
10
20
30
40
50
60
70
80
TSS
(mg/
L)
May
field
8000
780
006
MM
003W
M82
003
8310
483
018
8300
983
020
8300
4H
U01
0WM
8310
383
002
HU
1RW
MP
8301
283
019
8500
485
003
DN
008W
MD
M 6
.085
014
9400
297
018
9799
997
777
9700
397
007
9701
397
011
FB00
3WM
PT0
01W
M10
4008
1040
3710
4029
1040
2810
4023
1040
2610
4027
1040
2510
4001
1070
02
Figure 6. Total suspended solids (TSS) concentrations (mg/L) at 41 stations within TRCA jurisdiction (CWQG: 30 mg/L)
3.2.3 pH
pH measures the acidity, neutrality, or alkalinity of water. pH fluctuations can affect fish communities directly and indirectly by facilitating the release of organic and metal contaminants bonded to sediments. Nutrient cycling, the discharge of industrial effluent, and spills can result in pH fluctuations. The pH of water also affects the toxicity of ammonia. Median pH values were within PWQO range of 6.5 to 8.5 for all stations (Figure 7), although 2 stations (83019 and 97011) displayed 75th percentile values above 8.5.
CWQG
Etobicoke Creek
Mimico Creek
Humber River
Don River Highland
Creek
Rouge River
Duffins Creek
Carruthers Creek
Pine Creek (Frenchman’s Bay)
Petticoat Creek
Surface Water Quality Stations and Watersheds

22 00 11 22 SS uu rr ff aa cc ee WW aa tt ee rr QQ uu aa ll ii tt yy SS uu mm mm aa rr yyMay 2013
13
6
6.5
7
7.5
8
8.5
9
pH
May
field
8000
780
006
MM
003W
M82
003
8310
483
018
8300
983
020
8300
4H
U01
0WM
8310
383
002
HU
1RW
MP
8301
283
019
8500
485
003
DN
008W
MD
M 6
.085
014
9400
297
018
9799
997
777
9700
397
007
9701
397
011
FB00
3WM
PT0
01W
M10
4008
1040
3710
4029
1040
2810
4023
1040
2610
4027
1040
2510
4001
1070
02
Figure 7. pH values at 41 stations within TRCA jurisdiction (PWQO: 6.5 - 8.5 pH) 3.3 Metals
Metals occur naturally in the environment, but industrial processes and increased runoff in urban areas can dramatically alter their distributions and increase their concentrations. When metals are released into the environment in higher than natural concentrations, they can be toxic, cause disruptions to aquatic ecosystems, and decrease the suitability of a waterbody to support aquatic life and to supply water for domestic uses. 3.3.1 Aluminium
Currently, there are no PWQO, CWQG or CESI guidelines which define the amount of allowable total aluminum for the protection of aquatic life. Over 8% of the earth’s crust is comprised of aluminium, so the amount of aluminium in the environment from natural sources exceeds that from anthropogenic sources such as agriculture and industry. Acidic precipitation, poorly buffered soils, and rapid spring snowmelts can increase concentrations of aluminium in streams (Wetzel, 2001). Stations in urbanized areas within all watersheds demonstrated relatively higher levels of aluminium (Figure 8). Station 83103 displayed the highest median aluminium value, and stations 80006, MM003WM, 82003, 83103, and HU1RWMP had the greatest interquartile ranges. These 5 stations are situated in the low Etobicoke Creek, Mimico Creek, and mid Humber River and have elevated aluminium concentrations for some months which make their
PWQO
PWQO
Etobicoke Creek
Mimico Creek
Humber River
Don River Highland
Creek
Rouge River
Duffins Creek
Carruthers Creek
Pine Creek (Frenchman’s Bay)
Petticoat Creek
Surface Water Quality Stations and Watersheds

22 00 11 22 SS uu rr ff aa cc ee WW aa tt ee rr QQ uu aa ll ii tt yy SS uu mm mm aa rr yyMay 2013
14
boxplots stand out from other stations. For example, all of these 5 stations had high aluminium concentrations in January 2012 and the precipitation before and/or during the January sampling may have contributed to the elevated concentrations. In 2011, 4 stations displayed 75th percentiles above 500 μg/L, however in 2012 there were no stations with 75th percentiles above 500 μg/L.
Alu
min
ium
(ug/
L)
May
field
8000
780
006
MM
003W
M82
003
8310
483
018
8300
983
020
8300
4H
U01
0WM
8310
383
002
HU
1RW
MP
8301
283
019
8500
485
003
DN
008W
MD
M 6
.085
014
9400
297
018
9799
997
777
9700
397
007
9701
397
011
FB00
3WM
PT00
1WM
1040
0810
4037
1040
2910
4028
1040
2310
4026
1040
2710
4025
1040
0110
7002
Figure 8. Aluminum concentrations (μg/L) at 41 stations within TRCA jurisdiction 3.3.2 Arsenic
Arsenic is an odourless, tasteless, and toxic metal. The weathering of rocks and soils, and smelting and refining industries are sources of arsenic. Arsenic data presented in this report was based on a 28 station subset of 2012 data since not all stations were analyzed regularly for this parameter by OMOE. Arsenic levels at these stations in 2012 (Figure 9) were well below the PWQO of 5 μg/L. Stations Mayfield, MM003WM, and 83002 displayed the highest median and interquartile range of arsenic values.
Etobicoke Creek
Mimico Creek
Humber River
Don River Highland
Creek
Rouge River
Duffins Creek
Carruthers Creek
Pine Creek (Frenchman’s Bay)
Petticoat Creek
Surface Water Quality Stations and Watersheds

22 00 11 22 SS uu rr ff aa cc ee WW aa tt ee rr QQ uu aa ll ii tt yy SS uu mm mm aa rr yyMay 2013
15
0
1
2
3
4
5
Ars
enic
(ug/
L)
May
field
MM
003W
M
8302
0
8300
4
HU
010W
M
8300
2
HU
1RW
MP
8301
2
8500
4
8500
3
DN
008W
M
DM
6.0
9400
2
9799
9
9777
7
9700
3
9700
7
9701
3
FB00
3WM
PT0
01W
M
1040
37
1040
29
1040
28
1040
23
1040
26
1040
27
1040
25
1070
02
Figure 9. Arsenic concentrations (μg/L) at 28 stations within TRCA jurisdiction (PWQO: 5 μg/L) 3.3.3 Copper
Copper is a trace metal associated with urbanization. Typically, copper binds readily to soil particles (particularly organic matter) and is therefore relatively immobile. Anthropogenic sources of copper include textile manufacturing, paints, electrical conductors, plumbing fixtures and pipes, wood preservatives, pesticides, fungicides and sewage treatment plant effluent (OMOE, 2003). Copper levels appear to increase towards the urbanized lower watershed areas while stations in relatively less urbanized watersheds (Duffins Creek) or at upstream locations display lower copper values (Figure 10). Stations 80006, 82003, and 85014 displayed the highest median copper values (similar to 2011) and stations 82003 and HU1RWMP displayed the greatest interquartile range. In 2012 only one station, 82003, had a median value above the PWQO of 5 μg/L whereas a total of 5 stations had median values in excess of the PWQO in 2011. In 2012, 5 stations (80006, MM003WM, 82003, HU1RWMP, and 85014) had 75th percentiles above the PWQO whereas in 2011 there were 8 stations.
PWQO
Etobicoke Creek
Mimico Creek
Humber River
Don River Highland
Creek
Rouge River
Duffins Creek
Carruthers Creek
Pine Creek (Frenchman’s Bay)
Petticoat Creek
Surface Water Quality Stations and Watersheds

22 00 11 22 SS uu rr ff aa cc ee WW aa tt ee rr QQ uu aa ll ii tt yy SS uu mm mm aa rr yyMay 2013
16
Cop
per (
ug/L
)
May
field
8000
780
006
MM
003W
M82
003
8310
483
018
8300
983
020
8300
4H
U01
0WM
8310
383
002
HU
1RW
MP
8301
283
019
8500
485
003
DN
008W
MD
M 6
.085
014
9400
297
018
9799
997
777
9700
397
007
9701
397
011
FB00
3WM
PT0
01W
M10
4008
1040
3710
4029
1040
2810
4023
1040
2610
4027
1040
2510
4001
1070
02
Figure 10. Copper concentrations (μg/L) at 41 stations within TRCA jurisdiction (PWQO: 5 μg/L) 3.3.4 Iron
In 2012, the median iron values of 10 stations exceeded the PWQO of 300 μg/L (Figure 11), compared to 13 stations in 2011. These stations are predominantly located in urbanized areas in the mid-lower Humber River and the Don River, with single stations in Mimico Creek, Rouge River, and Carruthers Creek watersheds. Stations 82003, MM003WM, 83103, and 80006 had the greatest interquartile ranges of iron. Station 80006 is located within two kilometres of an industrial warehouse complex that may be a source of iron contamination in Etobicoke Creek. Stations 80006 and 82003 are situated downstream of the Pearson International Airport in a highly developed area. Urban surface runoff is likely the cause of elevated iron concentrations in the surface water of Etobicoke and Mimico Creek watersheds. Stations 83103, 83002, and HU1RWMP, all in the mid Humber River, also demonstrated wide interquartile ranges in iron values. Decreased median iron concentrations in 2012 compared to 2011 may have been a result of decreased precipitation in 2012. Precipitation tends to increase runoff which may increase iron concentrations given the fact that iron has an affinity to bind to sediment particles.
PWQO
Etobicoke Creek
Mimico Creek
Humber River
Don River Highland
Creek
Rouge River
Duffins Creek
Carruthers Creek
Pine Creek (Frenchman’s Bay)
Petticoat Creek
Surface Water Quality Stations and Watersheds

22 00 11 22 SS uu rr ff aa cc ee WW aa tt ee rr QQ uu aa ll ii tt yy SS uu mm mm aa rr yyMay 2013
17
0
500
1000
1500
2000
Figure 11. Iron concentrations (μg/L) at 41 stations within TRCA jurisdiction (PWQO: 300 μg/L) 3.3.5 Lead
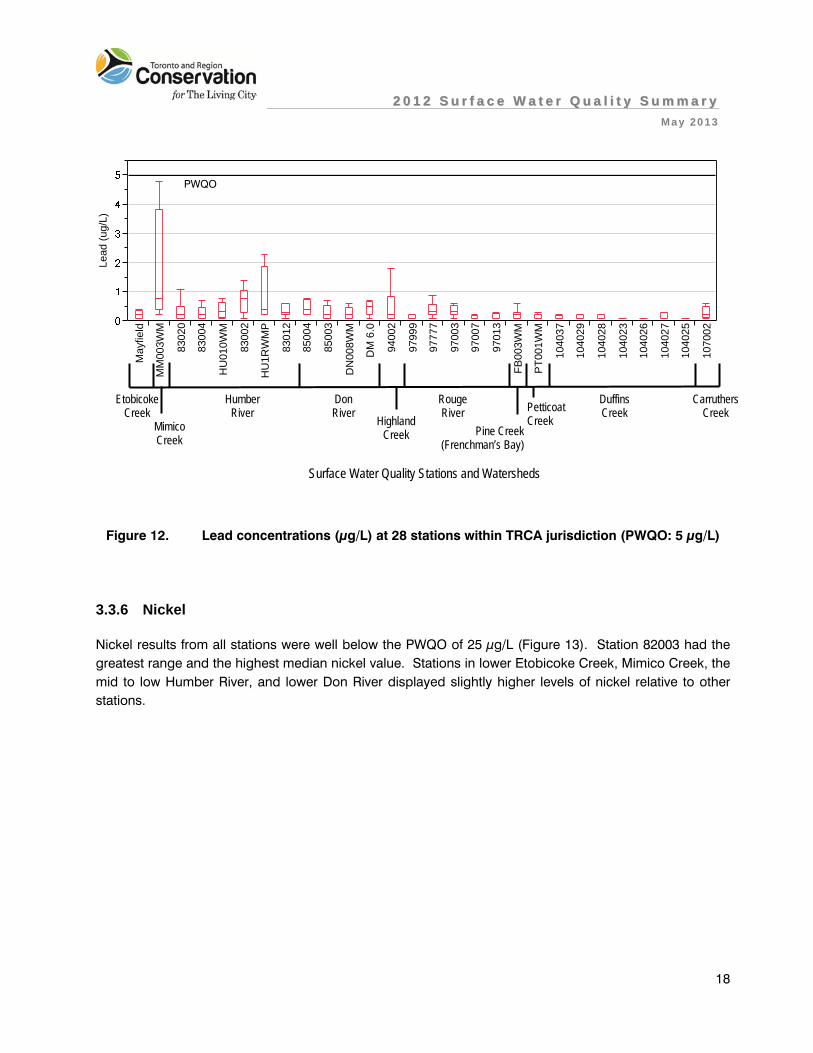
The lead results were based on a subset of 28 stations whose samples were analyzed by the York-Durham Regional Environmental laboratory. OMOE lead results were excluded as the OMOE reporting detection limit (RDL) of 11 μg/L is much higher than the RDL of York-Durham (5 μg/L) and the PWQO of 5 μg/L. Median lead values for all 28 stations were below the PWQO (Figure 12). Stations MM003WM and 83002 displayed the highest median values and MM003WM and HU1RWMP displayed the greatest interquartile range.
PWQO
Etobicoke Creek
Mimico Creek
Humber River
Don River Highland
Creek
Rouge River
Duffins Creek
Carruthers Creek
Pine Creek (Frenchman’s Bay)
Petticoat Creek
Surface Water Quality Stations and Watersheds
22 00 11 22 SS uu rr ff aa cc ee WW aa tt ee rr QQ uu aa ll ii tt yy SS uu mm mm aa rr yyMay 2013
18
Lead
(ug/
L)
May
field
MM
003W
M
8302
0
8300
4
HU
010W
M
8300
2
HU
1RW
MP
8301
2
8500
4
8500
3
DN
008W
M
DM
6.0
9400
2
9799
9
9777
7
9700
3
9700
7
9701
3
FB00
3WM
PT00
1WM
1040
37
1040
29
1040
28
1040
23
1040
26
1040
27
1040
25
1070
02
Figure 12. Lead concentrations (μg/L) at 28 stations within TRCA jurisdiction (PWQO: 5 μg/L) 3.3.6 Nickel
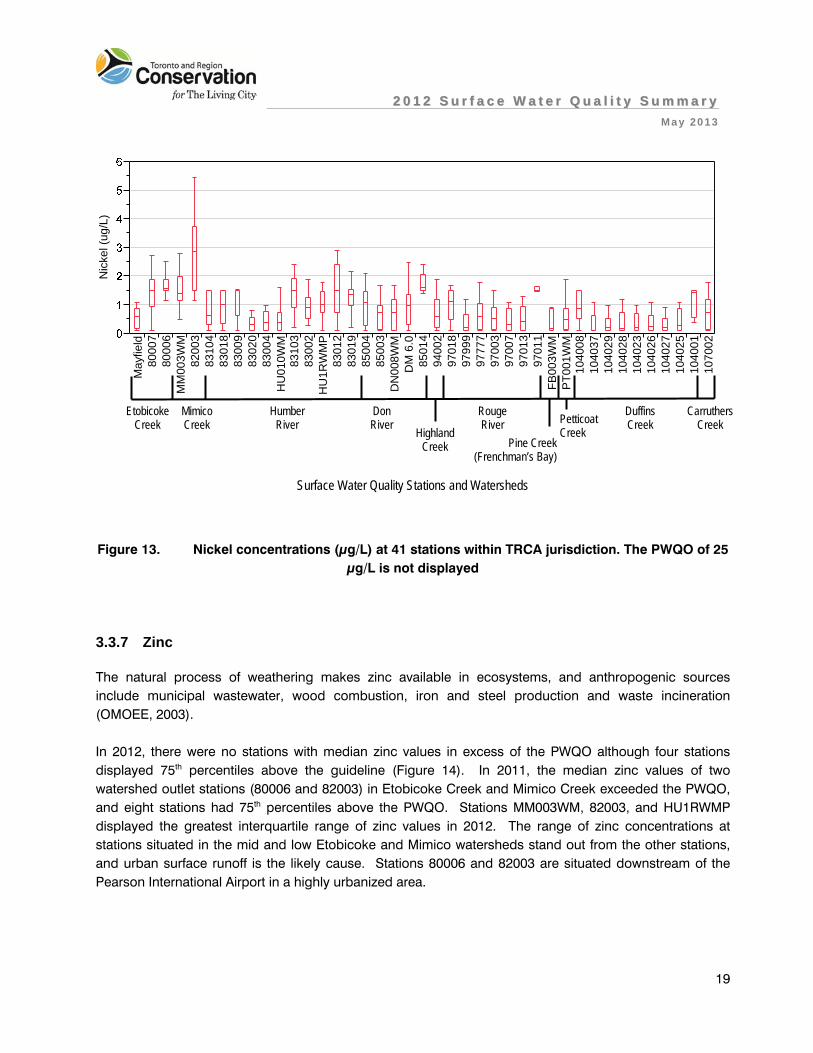
Nickel results from all stations were well below the PWQO of 25 μg/L (Figure 13). Station 82003 had the greatest range and the highest median nickel value. Stations in lower Etobicoke Creek, Mimico Creek, the mid to low Humber River, and lower Don River displayed slightly higher levels of nickel relative to other stations.
PWQO
Etobicoke Creek
Mimico Creek
Humber River
Don River Highland
Creek
Rouge River
Duffins Creek
CarruthersCreek
Pine Creek (Frenchman’s Bay)
Petticoat Creek
Surface Water Quality Stations and Watersheds
22 00 11 22 SS uu rr ff aa cc ee WW aa tt ee rr QQ uu aa ll ii tt yy SS uu mm mm aa rr yyMay 2013
19
Nic
kel (
ug/L
)
May
field
8000
780
006
MM
003W
M82
003
8310
483
018
8300
983
020
8300
4H
U01
0WM
8310
383
002
HU
1RW
MP
8301
283
019
8500
485
003
DN
008W
MD
M 6
.085
014
9400
297
018
9799
997
777
9700
397
007
9701
397
011
FB00
3WM
PT0
01W
M10
4008
1040
3710
4029
1040
2810
4023
1040
2610
4027
1040
2510
4001
1070
02
Figure 13. Nickel concentrations (μg/L) at 41 stations within TRCA jurisdiction. The PWQO of 25 μg/L is not displayed
3.3.7 Zinc
The natural process of weathering makes zinc available in ecosystems, and anthropogenic sources include municipal wastewater, wood combustion, iron and steel production and waste incineration (OMOEE, 2003). In 2012, there were no stations with median zinc values in excess of the PWQO although four stations displayed 75th percentiles above the guideline (Figure 14). In 2011, the median zinc values of two watershed outlet stations (80006 and 82003) in Etobicoke Creek and Mimico Creek exceeded the PWQO, and eight stations had 75th percentiles above the PWQO. Stations MM003WM, 82003, and HU1RWMP displayed the greatest interquartile range of zinc values in 2012. The range of zinc concentrations at stations situated in the mid and low Etobicoke and Mimico watersheds stand out from the other stations, and urban surface runoff is the likely cause. Stations 80006 and 82003 are situated downstream of the Pearson International Airport in a highly urbanized area.
Etobicoke Creek
Mimico Creek
Humber River
Don River Highland
Creek
Rouge River
Duffins Creek
Carruthers Creek
Pine Creek (Frenchman’s Bay)
Petticoat Creek
Surface Water Quality Stations and Watersheds

22 00 11 22 SS uu rr ff aa cc ee WW aa tt ee rr QQ uu aa ll ii tt yy SS uu mm mm aa rr yyMay 2013
20
Figure 14. Zinc concentrations (μg/L) at 41 stations within TRCA jurisdiction (PWQO: 20 μg/L) 3.4 Bacteria
Microorganisms such as bacteria are found throughout our environment but elevated levels can impact human health and limit the recreational uses of a waterbody. High Escherichia coli (E. coli) levels are indications of raw sewage (human and/or animal) loading. E. coli levels may increase in urbanized areas due to inadequately designed combined sewer systems, illegal connections between storm and sanitary sewers, and precipitation events that overflow those sewer systems (CCME, 2003). Median E. coli counts equalled or exceeded the PWQO of 100 colony forming units (CFU)/100 mL at 23 of 41 stations in 2012 (Figure 15), compared to 31 stations in 2011. In 2012, 31 stations had 75th percentiles that exceeded the PWQO whereas in 2011 there were 43 stations. There were two stations in 2012 with median values over 1000 CFU/100 mL compared to nine stations in 2011. In 2012 there were no stations with median values over 2000 CFU/100 mL unlike 2011 when there were four stations. Despite the reduced frequency of extreme E. coli values in 2012 compared to 2011, areas of concern still include Etobicoke Creek, Mimico Creek, mid to lower Humber River, the Don River, Highland Creek, station 97777 in the mid Rouge River, and station FB003WM in Pine Creek (Frenchman’s Bay). The highest median concentrations were recorded at station 80006 in the low Etobicoke Creek, station 82003
PWQO
Etobicoke Creek
Mimico Creek
Humber River
Don River Highland
Creek
Rouge River
Duffins Creek
Carruthers Creek
Pine Creek (Frenchman’s Bay)
Petticoat Creek
Surface Water Quality Stations and Watersheds

22 00 11 22 SS uu rr ff aa cc ee WW aa tt ee rr QQ uu aa ll ii tt yy SS uu mm mm aa rr yyMay 2013
21
in the low Mimico watershed, stations DM 6.0 and 85014 in the Don River watershed, station 83012 on a tributary of the lower Humber River, and station 94002 in Highland Creek. Those stations also displayed high median values in 2011. Station DM 6.0 is located on a heavily urbanized tributary (Taylor Massey Creek) of the Don River that is serviced by combined sewers. Also, illegal sewage cross connections to stormwater sewers may have contributed elevated levels. Station 85014 is located downstream of DM 6.0 as well as approximately 1.5 km downstream of the North Toronto Wastewater Treatment Plant which may contribute to elevated E. coli concentrations in the lower Don River. Station 83012 is located on a highly urbanized tributary in the Humber River watershed that is serviced by combined sewers with large portions of the channel hardened with concrete banks. These conditions appear to result in an influx of contaminants from upstream urban areas, which have little opportunity to be filtered or absorbed due to the lack of riparian zone vegetation as they travel downstream. The elevated E. coli median value documented at station 94002 is likely a result of the watershed being completely urbanized.
E. c
oli (
CFU
/100
mL)
May
field
8000
780
006
MM
003W
M82
003
8310
483
018
8300
983
020
8300
4H
U01
0WM
8310
383
002
HU
1RW
MP
8301
283
019
8500
485
003
DN
008W
MD
M 6
.085
014
9400
297
018
9799
997
777
9700
397
007
9701
397
011
FB00
3WM
PT0
01W
M10
4008
1040
3710
4029
1040
2810
4023
1040
2610
4027
1040
2510
4001
1070
02
Figure 15. Escherichia coli concentrations (CFU/100mL) at 41 stations within TRCA jurisdiction (PWQO: 100 CFU/100 mL)
PWQO
Etobicoke Creek
Mimico Creek
Humber River
Don River Highland
Creek
Rouge River
Duffins Creek
Carruthers Creek
Pine Creek (Frenchman’s
Bay)
Petticoat Creek
Surface Water Quality Stations and Watersheds

22 00 11 22 SS uu rr ff aa cc ee WW aa tt ee rr QQ uu aa ll ii tt yy SS uu mm mm aa rr yyMay 2013
22
3.5 Nutrients
Nitrogen and phosphorus are critical to plant and animal life and their concentrations determine the productivity of aquatic systems. If there is substantial phosphorus loading into aquatic systems, nitrogen becomes the growth limiting nutrient. Nitrogen occurs in various forms such as nitrate, nitrite, and ammonia. Nitrate is the most common form of nitrogen entering freshwater systems and is assimilated by plants. Upon the decomposition of plant matter, nitrate is converted to ammonia, an energy-efficient source of nitrogen for plants. Bacteria convert ammonia into nitrate, nitrite, and nitrogen. Nitrite is easily converted and rarely accumulates unless organic pollution is high (Wetzel, 2001). Total Kjeldahl nitrogen (TKN) is a quantitative determination of nitrogen and ammonia that is required in the analysis of sewage treatment plant effluent. Anthropogenic sources of nitrogen and phosphorous such as agricultural fertilizer, animal wastes and municipal sewage that leach into aquatic systems provide unusually high concentrations of these nutrients. This over-nutrition, or eutrophication, of aquatic environments can promote excessive plant and algae growth. Eutrophic lakes can be characterized by algal blooms which reduce recreational use and deplete oxygen levels to the detriment of other biota, especially fish. Excessive growth of aquatic plants in streams can cause dissolved oxygen concentrations to decrease during the night to levels that may not sustain certain aquatic species, as well as reduce the aesthetic appeal of the stream. 3.5.1 Ammonia
Currently, there are no PWQO, CWQG or CESI guidelines which define the amount of allowable total ammonia for the protection of aquatic life. The highest median ammonia value (1030 μg/L) was recorded at station 85014 in the Don River (Figure 16). Ammonia levels at this station can be attributed to combined sewer systems and the proximity of the North Toronto Wastewater Treatment Plant upstream which discharges effluent into the lower Don River. In addition, this portion of the Don River is subjected to illegal cross connections that discharge effluent directly into stormwater sewers and into the Don River.

22 00 11 22 SS uu rr ff aa cc ee WW aa tt ee rr QQ uu aa ll ii tt yy SS uu mm mm aa rr yyMay 2013
23
Figure 16. Ammonia concentrations (μg /L) at 41 stations within TRCA jurisdiction 3.5.2 Nitrate, Nitrite, and Total Kjeldahl Nitrogen
There were no stations with median nitrate values above the CESI of 2.93 mg/L (Figure 17). Station DM 6.0 had the highest median value and is situated in a highly urbanized watershed and receives input from combined sewers and illegal cross connections. Stations Mayfield and 80007 displayed the greatest interquartile range: both these stations have substantial agricultural lands in their catchments. In 2012, stations 83012 and 85014 displayed median nitrite values higher than the CWQG (Figure 18). Stations MM003WM, 83012, DM 6.0, and 85014 displayed the greatest interquartile ranges of nitrite, which was similar to 2011. Generally, nitrite concentrations appeared to increase with urbanization. TKN median value and interquartile range were highest at station 85014 (Figure 19). Generally, TKN levels increased at stations situated lower in the watershed and in urbanized areas.
Etobicoke Creek
Mimico Creek
Humber River
Don River Highland
Creek
Rouge River
Duffins Creek
Carruthers Creek
Pine Creek (Frenchman’s Bay)
Petticoat Creek
Surface Water Quality Stations and Watersheds

22 00 11 22 SS uu rr ff aa cc ee WW aa tt ee rr QQ uu aa ll ii tt yy SS uu mm mm aa rr yyMay 2013
24
Nitr
ate
(mg/
L)
May
field
8000
780
006
MM
003W
M82
003
8310
483
018
8300
983
020
8300
4H
U01
0WM
8310
383
002
HU
1RW
MP
8301
283
019
8500
485
003
DN
008W
MD
M 6
.085
014
9400
297
018
9799
997
777
9700
397
007
9701
397
011
FB00
3WM
PT0
01W
M10
4008
1040
3710
4029
1040
2810
4023
1040
2610
4027
1040
2510
4001
1070
02
Figure 17. Nitrate concentrations (mg/L) at 41 stations within TRCA jurisdiction (EC: 2.93 mg/L)
Nitr
ite (m
g/L)
May
field
8000
780
006
MM
003W
M82
003
8310
483
018
8300
983
020
8300
4H
U01
0WM
8310
383
002
HU
1RW
MP
8301
283
019
8500
485
003
DN
008W
MD
M 6
.085
014
9400
297
018
9799
997
777
9700
397
007
9701
397
011
FB00
3WM
PT00
1WM
1040
0810
4037
1040
2910
4028
1040
2310
4026
1040
2710
4025
1040
0110
7002
Figure 18. Nitrite concentrations (mg/L) at 41 stations within TRCA jurisdiction (CWQG: 0.06 mg/L)
CESI
CWQG
Etobicoke Creek
Mimico Creek
Humber River
Don River Highland
Creek
Rouge River
Duffins Creek
Carruthers Creek
Pine Creek (Frenchman’s Bay)
Petticoat Creek
Surface Water Quality Stations and Watersheds
Etobicoke Creek
Mimico Creek
Humber River
Don River Highland
Creek
Rouge River
Duffins Creek
Carruthers Creek
Pine Creek (Frenchman’s Bay)
Petticoat Creek
Surface Water Quality Stations and Watersheds

22 00 11 22 SS uu rr ff aa cc ee WW aa tt ee rr QQ uu aa ll ii tt yy SS uu mm mm aa rr yyMay 2013
25
Figure 19. Total Kjeldahl nitrogen (TKN) concentrations (mg/L) at 41 stations within TRCA jurisdiction
3.5.3 Phosphorus
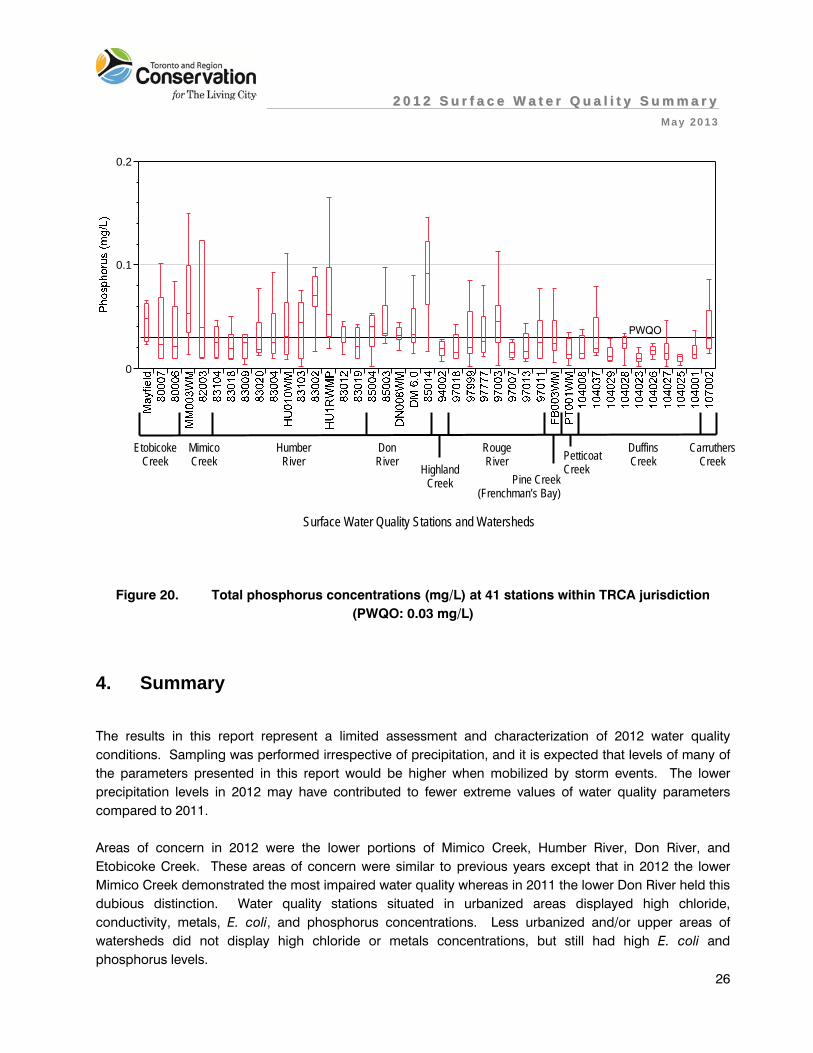
Phosphorus readily binds to sediment particles and increases in phosphorus concentrations are typically associated with storm events and elevated levels of turbidity. Median phosphorus levels exceeded the PWQO of 0.03 mg/L at 15 out of 41 stations in 2012 (Figure 20), compared to 28 stations in 2011. The majority of these stations were located in Mimico Creek, mid to low Humber River, Don River, mid Rouge River and Carruthers Creek. Stations 83002 and 85014 displayed the highest median levels of phosphorus and the stream water at both stations was often characterized as turbid. In 2012, 32 stations had phosphorus 75th percentiles over the PWQO compared to 42 stations in 2011. The lowest phosphorus median values and interquartile ranges were at stations 94002 in Highland Creek, 97007 in mid Rouge River, PT001WM in Petticoat Creek, and 104029, 104023, 104026, 104025 in Duffins Creek. The fewer phosphorus median and 75th percentile values above the PWQO in 2012 compared to 2011 may be a result of the reduced precipitation in 2012.
Etobicoke Creek
Mimico Creek
Humber River
Don River Highland
Creek
Rouge River
Duffins Creek
Carruthers Creek
Pine Creek (Frenchman’s Bay)
Petticoat Creek
Surface Water Quality Stations and Watersheds
22 00 11 22 SS uu rr ff aa cc ee WW aa tt ee rr QQ uu aa ll ii tt yy SS uu mm mm aa rr yyMay 2013
26
0
0.1
0.2
Figure 20. Total phosphorus concentrations (mg/L) at 41 stations within TRCA jurisdiction (PWQO: 0.03 mg/L)
4. Summary
The results in this report represent a limited assessment and characterization of 2012 water quality conditions. Sampling was performed irrespective of precipitation, and it is expected that levels of many of the parameters presented in this report would be higher when mobilized by storm events. The lower precipitation levels in 2012 may have contributed to fewer extreme values of water quality parameters compared to 2011. Areas of concern in 2012 were the lower portions of Mimico Creek, Humber River, Don River, and Etobicoke Creek. These areas of concern were similar to previous years except that in 2012 the lower Mimico Creek demonstrated the most impaired water quality whereas in 2011 the lower Don River held this dubious distinction. Water quality stations situated in urbanized areas displayed high chloride, conductivity, metals, E. coli, and phosphorus concentrations. Less urbanized and/or upper areas of watersheds did not display high chloride or metals concentrations, but still had high E. coli and phosphorus levels.
PWQO
Etobicoke Creek
Mimico Creek
Humber River
Don River Highland
Creek
Rouge River
Duffins Creek
Carruthers Creek
Pine Creek (Frenchman’s Bay)
Petticoat Creek
Surface Water Quality Stations and Watersheds

22 00 11 22 SS uu rr ff aa cc ee WW aa tt ee rr QQ uu aa ll ii tt yy SS uu mm mm aa rr yyMay 2013
27
Etobicoke Creek displayed median values of chloride, conductivity, metals and phosphorus that exceeded water quality guidelines or objectives. Mimico Creek had high chloride, conductivity, metals, nitrogen, and phosphorus values, and both Etobicoke and Mimico watersheds had high E. coli values. The mid and lower Humber River exhibited median values of chloride, conductivity, metals and TKN above guidelines, and high E. coli and phosphorus concentrations. The mid and lower Don River displayed high E. coli and phosphorus values, and chloride, conductivity, metals, and nitrogen median values were above guidelines. Frenchman’s Bay and Petticoat Creek watersheds, which are also urbanized but drain much smaller areas, displayed median chloride and conductivity values above guidelines, and high E. coli values. Less urbanized areas displayed less degraded water quality than highly urbanized areas such as the Etobicoke, Mimico, lower Humber, and lower Don watersheds. The upper Humber and Rouge did not display the high chloride or metal concentrations that their lower watershed areas did, however these upper areas had high E. coli and phosphorus levels. The upper Don displayed high chloride and conductivity values, presumably due to the higher degree of urbanization and road density compared to the upper Humber or Rouge. The lower Rouge and Carruthers watersheds displayed median chloride, E. coli, and phosphorus values above guidelines. Duffins Creek exhibited the least degraded water quality throughout the jurisdiction however at some stations the median E. coli and phosphorus values were above guidelines. The water quality parameters with the most numerous occurrences of high concentrations were E. coli, phosphorus, chloride, iron, and TKN. Nitrate, pH, lead, zinc, and TSS had the least frequencies of high concentrations. Factors that contribute to impaired water quality are urbanized areas, road density, agricultural areas, compromised sewage systems, and stormwater runoff. The cumulative influence of these factors degrades water quality at stations situated lower in the watershed.
22 00 11 22 SS uu rr ff aa cc ee WW aa tt ee rr QQ uu aa ll ii tt yy SS uu mm mm aa rr yyMay 2013
28
5. References
Canadian Council of Ministers of the Environment (CCME). 2007. Summary of Canadian water quality guidelines for the protection of aquatic life. In: Canadian Environmental Quality Guidelines, 2007, Canadian Council of Ministers of the Environment, Winnipeg.
Canadian Council of Ministers of the Environment (CCME). 2011. Canadian water quality guidelines for the
protection of aquatic life: Chloride. In: Canadian Environmental Quality Guidelines, 1999, Canadian Council of Ministers of the Environment, Winnipeg.
Environment Canada (EC). 2012. Data Sources and Methods: Freshwater Quality Indicator. Canadian
Environmental Sustainability Indicators, Sustainability Directorate, Environment Canada, Gatineau, Quebec. April 2012.
Ontario Ministry Environment and Energy (OMOEE). 1994. Policies Guidelines and Provincial Water Quality
Objectives of the Ministry of Environment and Energy. Queen’s Printer for Ontario, Toronto. June 1994.
Ontario Ministry Environment and Energy (OMOEE). 2003. Water Sampling and Data Analysis Manual for
Partners in the Ontario Provincial Water Quality Monitoring Network (DRAFT). February 2003. Wetzel, R. 2001. Limnology: Lake and River Ecosystems. Third edition. Academic Press. San Diego

22 00 11 22 SS uu rr ff aa cc ee WW aa tt ee rr QQ uu aa ll ii tt yy RR ee pp oo rr tt
May 2013
29
Appendix A
2012 Water Quality Stream Conditions from Field Notes
Station Jan Feb Mar April May June July Aug Sept Oct Nov Dec
80006 Turbid Normal Turbid Normal Normal Normal Turbid Normal Normal Normal Normal Normal
80007 Turbid slightly, frozen
Clear, frozen slightly
Turbid slightly, high slightly
Turbid slightly
Excessive amount of filamentous algae growth
Normal Turbid slightly
Normal Normal High slightly Normal Turbid, high
82003 Turbid Turbid Turbid Low water level
Normal Normal Turbid, high extremely
Normal Normal Normal Normal Normal
83002 Turbid slightly, sampled during rain event
Normal Turbid, high slightly
Turbid slightly
Normal Normal Normal Normal Turbid slightly
Turbid, high Normal Turbid, high
83004 Sampled during rain event
Normal Turbid slightly
Turbid slightly
Normal Normal Turbid slightly
Normal Normal Turbid slightly, high slightly
Normal Turbid slightly, high slightly
83009 Sampled during rain event
Normal Turbid, high slightly
Turbid slightly, high slightly
Normal New road storm sewer installed immediately upstream
Normal Normal Normal Turbid slightly
Normal Turbid slightly
83012 Turbid slightly Normal Normal Normal Excessive amount of algae growth present
Normal Turbid, high extremely
Normal Normal Normal Normal Normal
83018 Sampled during rain event, frozen slightly
Normal Normal Turbid, high Normal Normal Normal Normal Normal High slightly Normal Normal
83019 Turbid Turbid slightly
Turbid slightly
Normal Normal Normal Turbid, high extremely
Normal Normal High slightly Normal Normal

22 00 11 22 SS uu rr ff aa cc ee WW aa tt ee rr QQ uu aa ll ii tt yy RR ee pp oo rr tt
May 2013
30
Station Jan Feb Mar April May June July Aug Sept Oct Nov Dec
83020 Sampled during rain event
Normal Turbid, high
Turbid slightly, high slightly
Turbid slightly
Turbid unusual
Turbid Normal Normal Turbid, high Normal High
83103 Turbid, sampled during rain event
Clear, frozen slightly
Turbid slightly
Turbid Turbid slightly
Normal Turbid Normal Normal Turbid, high Normal Turbid, high slightly
83104 Sampled during rain event, frozen slightly
Clear, frozen slightly
Normal Turbid slightly, high slightly
Normal Normal Normal Normal Normal High Normal Normal
85003 Turbid slightly Turbid slightly
Normal Normal Turbid slightly
Normal Turbid, high extremely
Normal Normal Normal Normal Normal
85004 Turbid slightly Turbid slightly
Normal Normal Normal Normal Turbid, high extremely
Normal Normal Normal Normal Normal
85014 Turbid slightly Water lower than normal
Water level low
Low water level
Normal Normal Turbid, high extremely
Normal Low level Normal Low Normal
94002 Turbid, high slightly
Turbid slightly
Normal Normal Normal Normal Normal Normal Normal Normal Normal Normal
97003 Turbid, high Turbid slightly
Turbid Turbid Normal Normal Normal Religious offerings
Normal Turbid slightly, high slightly
Normal High slightly
97007 Turbid, high Normal Normal Normal Normal Normal Normal Normal Normal High slightly Normal High slightly
97011 Turbid, high Turbid slightly
Normal Turbid Normal Normal Normal Normal Normal Normal High slightly
97013 Turbid, high Turbid slightly
Normal Normal Normal Normal Normal Normal Normal High slightly Normal High slightly
97018 Turbid slightly, high slightly
Normal Normal Normal Normal Normal Normal Normal Normal Normal Normal Normal
97777 Turbid, high slightly
Normal Turbid slightly
Turbid slightly
Turbid slightly, low water level
Normal Normal Normal Normal Normal Normal Normal
97999 Turbid, frozen slightly
Clear, frozen slightly
Normal Normal Normal Normal Normal Normal Normal Normal Normal Turbid slightly
104001 Turbid, high Turbid slightly
Turbid slightly
Normal Water level low
Normal Normal Normal Normal Normal Normal Normal
104008 Turbid, high slightly, frozen slightly
Clear, frozen slightly
Normal Normal Normal Normal Normal Normal Normal Normal Normal Normal

22 00 11 22 SS uu rr ff aa cc ee WW aa tt ee rr QQ uu aa ll ii tt yy RR ee pp oo rr tt
May 2013
31
Station Jan Feb Mar April May June July Aug Sept Oct Nov Dec
104023 Turbid slightly, frozen slightly
Normal Normal Normal Normal Normal Normal Normal Normal Normal Normal Normal
104025 Turbid, high Turbid slightly
Turbid Normal Normal Normal Normal Normal Normal Normal Normal Normal
104026 Turbid, high Turbid slightly
Normal Normal Normal Normal Normal Normal Normal Normal Normal Normal
104027 Turbid, high Turbid slightly, water lower than normal
Turbid slightly
Normal Normal Normal Normal Normal Normal Normal Normal Normal
104028 Turbid slightly, high slightly
Normal Normal Normal Normal Normal Normal Normal Normal Normal Normal Normal
104029 Turbid, high slightly, frozen slightly
Clear, frozen slightly
Normal Normal Normal Normal Normal Normal Normal Normal Normal Normal
104037 Frozen Clear, frozen slightly
Normal Normal Normal Normal Normal Normal Normal Normal Normal Normal
107002 Turbid, high Turbid slightly
Normal Low water level
Normal Normal Low water Normal Turbid slightly, low
Normal Normal High slightly
Bruce's Mill 1
Turbid, high slightly
Normal Normal Normal Normal Normal Not sampled
Not sampled
Not sampled
Not sampled Not sampled
Not sampled
DM 6.0 Normal Normal Normal Normal Normal Normal Turbid, high extremely
Normal Normal Normal Normal Normal
DN008WM Turbid slightly Normal Normal Normal Normal Normal Turbid, high extremely
Normal Normal Normal Normal Normal
FB003WM Turbid, high slightly
Turbid slightly
Normal Normal Normal Normal Normal Normal Turbid slightly, high: beaver dam
Very high, flooded due to beaver interference
Extremely flooded due to beaver activity
Turbid, extremely high due to beaver activity
Glen Haffy 1
Sampled during rain event, frozen
Clear, frozen slightly
Normal Turbid, high Clear, high, more flow than normal
Normal Not sampled
Not sampled
Not sampled
Not sampled Not sampled
Not sampled

22 00 11 22 SS uu rr ff aa cc ee WW aa tt ee rr QQ uu aa ll ii tt yy RR ee pp oo rr tt
May 2013
32
Station Jan Feb Mar April May June July Aug Sept Oct Nov Dec
Heart Lake 1
Turbid, sampled during rain event
Dry Dry Dry Channel Not sampled Not sampled Not sampled
Not sampled
Not sampled
Not sampled Not sampled
Not sampled
HU010WM Turbid, high slightly, sampled during rain event
Normal Turbid slightly, high slightly
Turbid, high Normal Turbid slightly Turbid slightly
Normal Normal Turbid, high Normal Turbid slightly, high
HU1RWMP Turbid, high, sampled during rain event
Normal Turbid slightly
Turbid, high Normal Normal Normal Normal Normal High slightly Normal Turbid, high
Mayfield Sampled during rain event, frozen slightly
Clear, frozen slightly
Very turbid, high slightly
Turbid, high Normal Normal Normal Normal Normal Turbid slightly, high
Normal Turbid, high
MM003WM Turbid, high, sampled during rain event
Normal Normal Turbid, high Normal Normal Normal Normal Normal High slightly Normal Turbid, high
PT001WM Turbid, high Normal Normal Normal Normal Normal Normal Normal Normal High slightly Normal High slightly
22 00 11 22 SS uu rr ff aa cc ee WW aa tt ee rr QQ uu aa ll ii tt yy SS uu mm mm aa rr yyMay 2013
33
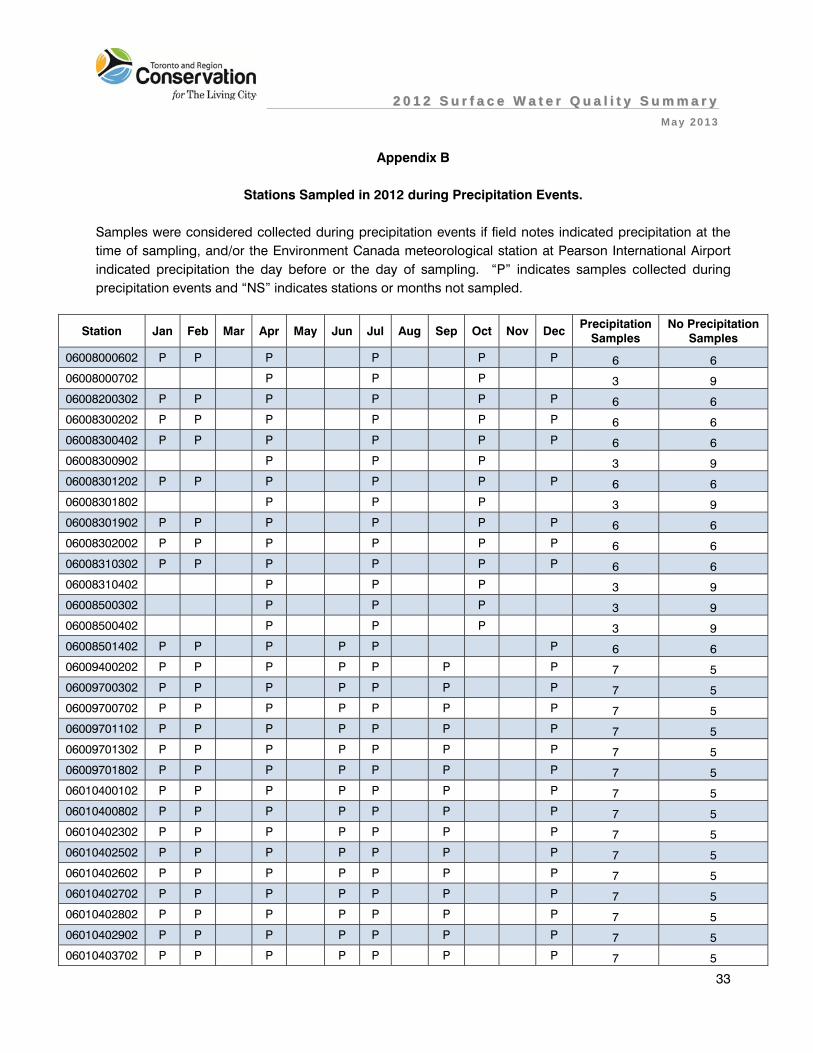
Appendix B
Stations Sampled in 2012 during Precipitation Events.
Samples were considered collected during precipitation events if field notes indicated precipitation at the time of sampling, and/or the Environment Canada meteorological station at Pearson International Airport indicated precipitation the day before or the day of sampling. “P” indicates samples collected during precipitation events and “NS” indicates stations or months not sampled.
Station Jan Feb Mar Apr May Jun Jul Aug Sep Oct Nov Dec Precipitation
Samples No Precipitation
Samples
06008000602 P P P P P P 6 6 06008000702 P P P 3 9 06008200302 P P P P P P 6 6 06008300202 P P P P P P 6 6 06008300402 P P P P P P 6 6 06008300902 P P P 3 9 06008301202 P P P P P P 6 6 06008301802 P P P 3 9 06008301902 P P P P P P 6 6 06008302002 P P P P P P 6 6 06008310302 P P P P P P 6 6 06008310402 P P P 3 9 06008500302 P P P 3 9 06008500402 P P P 3 9 06008501402 P P P P P P 6 6 06009400202 P P P P P P P 7 5 06009700302 P P P P P P P 7 5 06009700702 P P P P P P P 7 5 06009701102 P P P P P P P 7 5 06009701302 P P P P P P P 7 5 06009701802 P P P P P P P 7 5 06010400102 P P P P P P P 7 5 06010400802 P P P P P P P 7 5 06010402302 P P P P P P P 7 5 06010402502 P P P P P P P 7 5 06010402602 P P P P P P P 7 5 06010402702 P P P P P P P 7 5 06010402802 P P P P P P P 7 5 06010402902 P P P P P P P 7 5 06010403702 P P P P P P P 7 5

22 00 11 22 SS uu rr ff aa cc ee WW aa tt ee rr QQ uu aa ll ii tt yy SS uu mm mm aa rr yyMay 2013
34
Station Jan Feb Mar Apr May Jun Jul Aug Sep Oct Nov Dec Precipitation
Samples No Precipitation
Samples
06010700202 P P P P P P P 7 5 97777 P P P P P P P 7 5 97999 P P P P P P P 7 5 Bruce's Mill 1 P P P P NS NS NS NS NS NS 4 2 DM 6.0 P P P 3 3 DN008WM P P P 3 9 FB003WM P P P P P P P 7 5 Glen Haffy 1 P P P NS NS NS NS NS NS 3 3 Heart Lake 1 P NS NS NS NS NS NS NS NS NS NS NS 1 0 HU010WM P P P P P P 6 6 HU1RWMP P P P P P P 6 6 Mayfield P P P P P P 6 6 MM003WM P P P P P P 6 6 PT001WM P P P P P P P 7 5
Total: 252 249