2012 site environmental report - us department of energy · restoration project areas ... national...
TRANSCRIPT

F E R N A L D P R E S E R V E
2012 Site Environmental Report
Fernald Preserve
U.S. Department of EnergyOffice of Legacy ManagementIssued May 2013 (S09665)
LMS/FER/S09665

This page intentionally left blank

LMS/FER/S09665
Fernald Preserve
2012 Site Environmental Report
May 2013

This page intentionally left blank

U.S. Department of Energy Fernald Preserve 2012 Site Environmental Report May 2013 Doc. No. S09665 Page i
Contents Abbreviations ................................................................................................................................. iv Measurement Abbreviations ............................................................................................................v Units (Abbreviations) and Conversion Table ................................................................................ vi Executive Summary ...................................................................................................................... vii 1.0 Site Background .....................................................................................................................1
1.1 The Path to Site Closure ...............................................................................................3 1.2 Environmental Monitoring Program .............................................................................6 1.3 Characteristics of the Site and Surrounding Area .........................................................6
1.3.1 Land Use and Demography .................................................................................6 1.3.2 Geography ...........................................................................................................7 1.3.3 Geology ...............................................................................................................7 1.3.4 Surface Hydrology ..............................................................................................8 1.3.5 Natural Resources ...............................................................................................8
2.0 Remediation Status and Compliance Summary ...................................................................19 2.1 CERCLA Remediation Status ....................................................................................19 2.2 Summary of Compliance with Other Requirements ...................................................24
2.2.1 RCRA ................................................................................................................24 2.2.2 Clean Water Act ................................................................................................24 2.2.3 Clean Air Act ....................................................................................................25 2.2.4 Superfund Amendments and Reauthorization Act of 1986 ..............................25 2.2.5 Other Environmental Regulations .....................................................................25 2.2.6 Other Permits ....................................................................................................29 2.2.7 Pollution Prevention and Source Reduction .....................................................29 2.2.8 Federal Facilities Compliance Agreement ........................................................29 2.2.9 Environmental Management Systems Requirement .........................................30
2.3 Split Sampling Program ..............................................................................................30 3.0 Groundwater Pathway ..........................................................................................................33
3.1 Summary of the Nature and Extent of Groundwater Contamination .........................33 3.2 Selection and Design of the Groundwater Remedy ....................................................35 3.3 Groundwater Monitoring Highlights for 2012 ...........................................................39
3.3.1 Restoration Monitoring .....................................................................................44 3.3.2 Other Monitoring Commitments .......................................................................52
3.4 Groundwater Remediation Assessment ......................................................................54 3.5 OSDF Monitoring .......................................................................................................55
4.0 Surface Water and Treated Effluent Pathway ......................................................................59 4.1 Summary of Surface Water and Treated Effluent Pathway ........................................59 4.2 Remediation Activities Affecting the Surface Water Pathway ..................................61 4.3 Surface Water, Treated Effluent, and Sediment Monitoring Program .......................61
4.3.1 Surveillance Monitoring ...................................................................................62 4.3.2 Compliance Monitoring ....................................................................................66 4.3.3 Uranium Discharges in Surface Water and Treated Effluent ............................70
5.0 Direct Radiation Pathway and Radiation Dose ....................................................................73 5.1 Monitoring for Direct Radiation .................................................................................73 5.2 Direct Radiation Dose .................................................................................................75 5.3 Total of Doses to the Maximally Exposed Individual ................................................77 5.4 Significance of Estimated Radiation Doses for 2012 .................................................77 5.5 Estimated Dose to Biota .............................................................................................79
Fernald Preserve 2012 Site Environmental Report U.S. Department of Energy Doc. No. S09665 May 2013 Page ii
6.0 Natural Resources ................................................................................................................81 6.1 Ecological Restoration Activities ...............................................................................83
6.1.1 Ecological Restoration Projects ........................................................................83 6.1.2 Restored Area Maintenance and Repair ............................................................83 6.1.3 Ecological Restoration Monitoring ...................................................................85
6.2 Fernald Preserve Site and OSDF Inspections .............................................................95 6.3 Affected Habitat Findings ...........................................................................................96 6.4 Threatened and Endangered Species and Species Inventories ...................................96 6.5 Cultural Resources ......................................................................................................97
7.0 References ..........................................................................................................................101 8.0 Glossary ..............................................................................................................................105
Figures Figure 1. Fernald Preserve and Vicinity ..................................................................................... 9 Figure 2. Major Communities in Southwestern Ohio ............................................................... 10 Figure 3. Fernald Preserve Perspective ..................................................................................... 11 Figure 4. Cross Section of the New Haven Trough, Looking North ........................................ 13 Figure 5. Regional Groundwater Flow in the Great Miami Aquifer ........................................ 14 Figure 6. Great Miami River Drainage Basin ........................................................................... 15 Figure 7. Annual Precipitation, 1994–2012 .............................................................................. 16 Figure 8. Monthly Precipitation for 2012 Compared to Average Monthly Precipitation for
1951–2012 ................................................................................................................. 17 Figure 9. Uncertified Areas and Subgrade Utility Corridors .................................................... 21 Figure 10. DOE and Ohio EPA Groundwater Split Sample Locations ...................................... 31 Figure 11. Extraction Wells Active in 2012 ............................................................................... 34 Figure 12. Locations for Semiannual Total Uranium Monitoring .............................................. 37 Figure 13. Diagram of a Typical Groundwater Monitoring Well ............................................... 40 Figure 14. Monitoring Well Relative Depths and Screen Locations .......................................... 41 Figure 15. Locations for Semiannual Non-Uranium Monitoring ............................................... 42 Figure 16. Groundwater Elevation Monitoring Wells ................................................................ 43 Figure 17. Net Mass of Uranium Removed from the Great Miami Aquifer, 1993–2012 .......... 46 Figure 18. Total Uranium Plume in the Aquifer with Concentrations Greater Than 30 µg/L
at the End of 2012 ..................................................................................................... 48 Figure 19. Non-Uranium Constituents with 2012 Results Above FRLs .................................... 53 Figure 20. OSDF Footprint and Monitoring Well Locations ..................................................... 56 Figure 21. Controlled Surface Water Areas and Uncontrolled Runoff Flow Directions ........... 60 Figure 22. IEMP/NPDES Surface Water and Treated Effluent Sample Locations .................... 63 Figure 23. IEMP Background Surface Water Sample Locations ............................................... 65 Figure 24. Annual Average Total Uranium Concentrations in Paddys Run at Willey Road
(SWP-03) Sample Location, 1985−2012 .................................................................. 67 Figure 25. Mass of Uranium Discharged to the Great Miami River through the Parshall
Flume (PF 4001) in 2012 ........................................................................................... 68 Figure 26. 2012 Monthly Average Total Uranium Concentration in Water Discharged
Through the Parshall Flume (PF 4001) to the Great Miami River ............................ 69 Figure 27. Uranium Discharged via the Surface Water Pathway, 1993−2012 ........................... 71 Figure 28. Direct Radiation (OSL) Monitoring Locations ......................................................... 74 Figure 29. 2012 Quarterly Results for OSL Monitoring Locations ............................................ 76

U.S. Department of Energy Fernald Preserve 2012 Site Environmental Report May 2013 Doc. No. S09665 Page iii
Figure 30. Comparison of 2012 All-Pathway Doses and Allowable Limits .............................. 78 Figure 31. Restoration Project Areas .......................................................................................... 82 Figure 32. Ecological Monitoring Activities .............................................................................. 93 Figure 33. Threatened and Endangered Species Habitat Areas .................................................. 98 Figure 34. Cultural Resource Survey Areas ............................................................................... 99
Tables Table 1. Operable Unit Remedies ................................................................................................... 4 Table 2. Compliance with Other Environmental Regulations ...................................................... 26 Table 3. 2012 DOE/Ohio EPA Groundwater Split Sampling Comparison .................................. 30 Table 4. Groundwater Restoration Module Status for 2012 ......................................................... 45 Table 5. Non-Uranium Constituents with Results Above FRLs During 2012 ............................. 52 Table 6. OSDF Groundwater, Leachate, and LDS Monitoring Summary.................................... 57 Table 7. Direct Radiation (OSL) Measurement Summary ........................................................... 75 Table 8. Dose to MEI .................................................................................................................... 77 Table 9. Wetland Functional Monitoring Vegetation Summary .................................................. 87 Table 10. Wetland Functional Monitoring Comparison ............................................................... 88 Table 11. Wetland Mitigation Vegetation Index of Biotic Integrity ............................................ 89 Table 12. Amphibian Monitoring Summary ................................................................................. 90 Table 13. Wetland Mitigation Amphibian Index of Biotic Integrity ............................................ 91 Table 14. Implementation Monitoring Herbaceous Summary ..................................................... 91 Table 15. Implementation Monitoring Woody Vegetation Survival ............................................ 92
Appendixes Appendix A Supplemental Groundwater Information Appendix B Supplemental Surface Water, Treated Effluent, and Sediment Information Appendix C Supplemental Air Information Appendix D Ecological Restoration Monitoring

Fernald Preserve 2012 Site Environmental Report U.S. Department of Energy Doc. No. S09665 May 2013 Page iv
Abbreviations AIBI Amphibian Index of Biotic Integrity AR Administrative Record ARARs applicable or relevant and appropriate requirements BCG Biota Concentration Guide CAWWT Converted Advanced Wastewater Treatment facility CC coefficient of conservatism CERCLA Comprehensive Environmental Response, Compensation, and Liability Act CFR Code of Federal Regulations DOE U.S. Department of Energy EPA U.S. Environmental Protection Agency FFCA Federal Facility Compliance Agreement FQAI Floristic Quality Assessment Index FRL final remediation level IEMP Integrated Environmental Monitoring Plan LCS leachate collection system LDS leak detection system LM DOE Office of Legacy Management LMICP Comprehensive Legacy Management and Institutional Controls Plan MEI maximally exposed individual NPDES National Pollutant Discharge Elimination System NPL National Priorities List NRRP Natural Resource Restoration Plan Ohio EPA Ohio Environmental Protection Agency OSDF onsite disposal facility OSL optically stimulated luminescence OU5 ROD Operable Unit 5 Record of Decision PCB polychlorinated biphenyl PF Parshall Flume PPDD Pilot Plant Drainage Ditch RCRA Resource Conservation and Recovery Act SARA Superfund Amendments and Reauthorization Act of 1986 SSOD storm sewer outfall ditch VIBI Vegetation Index of Biotic Integrity WM1 Wetland Mitigation, Phase I WM2 Wetland Mitigation, Phase II

U.S. Department of Energy Fernald Preserve 2012 Site Environmental Report May 2013 Doc. No. S09665 Page v
Measurement Abbreviations cm centimeter ft feet gpm gallons per minute kg kilogram km kilometer lb pound Lpm liters per minute m meter M gal million gallons M liters million liters mg/L milligrams per liter mGy/day milligray per day mrem/yr millirem per year mSv/yr millisieverts per year pCi/L picocuries per liter rem roentgen equivalent man
µg/L micrograms per liter

Fernald Preserve 2012 Site Environmental Report U.S. Department of Energy Doc. No. S09665 May 2013 Page vi
Units (Abbreviations) and Conversion Table
Multiply By To Obtain Multiply By To Obtain inches 2.54 centimeters (cm) cm 0.3937 inches
feet (ft) 0.3048 meters (m) m 3.281 ft
miles (mi) 1.609 kilometers (km) km 0.6214 mi
pounds (lb) 0.454 kilograms (kg) kg 2.205 lb
gallons 3.785 liters (L) L 0.2642 gallons
square feet (ft2) 0.0929 square meters (m2) m2 10.76 ft2
acres 0.4047 hectares hectares 2.471 acre
cubic yards (yd3) 0.7646 cubic meters (m3) m3 1.308 yd3
cubic feet (ft3) 0.02832 cubic meters (m3) m3 35.31 ft3
picocuries (pCi) 10–12 curies (Ci) Ci 1012 pCi
pCi/L 10–6 microcuries per liter (µCi/L) µCi/L 106 pCi/L
millirem (mrem) 0.001 rem rem 1000 mrem
mrem 0.01 millisievert (mSv) mSv 100 mrem
rem 0.01 sievert (Sv) Sv 100 rem
mSv 0.001 Sv Sv 1000 mSv
person-rem 0.01 person-Sv person-Sv 100 person-rem
rad 0.01 gray (Gy) Gy 100 rad
milligray (mGy) 0.001 Gy Gy 1000 mGy
milligrams per liter (mg/L)
1000 micrograms per liter (µg/L) µg/L 0.001 mg/L
Fahrenheit (˚F) (˚F–32) 5/9 Celsius (˚C) ˚C (˚C 9/5) + 32 ˚F
For Natural Uranium in Water pCi/L 0.0015 mg/L mg/L 675.7 pCi/L
pCi/L 1.48 µg/L µg/L 0.6757 pCi/L
µg/L 0.6757 pCi/L pCi/L 1.48 µg/L
For Natural Uranium in Soil pCi/g 1.48 µg/g µg/g 0.6757 pCi/g
mg/kg 1 µg/g µg/g 1 mg/kg

U.S. Department of Energy Fernald Preserve 2012 Site Environmental Report May 2013 Doc. No. S09665 Page vii
Executive Summary The 2012 Fernald Preserve Site Environmental Report provides stakeholders with the results from the Fernald, Ohio, Site’s environmental monitoring programs for 2012; a summary of the U.S. Department of Energy’s (DOE’s) activities conducted onsite; and a summary of the Fernald Preserve’s compliance with the various environmental regulations, compliance agreements, and DOE policies that govern site activities. This report has been prepared in accordance with DOE Order 436.1, Departmental Sustainability, and the “Integrated Environmental Monitoring Plan,” which is Attachment D of the Comprehensive Legacy Management and Institutional Controls Plan (LMICP) (DOE 2012a). The Fernald Preserve has been successfully remediated with the exception of the groundwater and the care and maintenance of the onsite disposal facility (OSDF), which are the only ongoing components of remediation. During 2012, activities at the Fernald Preserve included:
Environmental monitoring activities related to direct radiation, groundwater, and surface water.
Prescribed burns.
Ecological restoration activities as well as inspections, care, and monitoring of the site and the OSDF to ensure that provisions of the LMICP are fully implemented.
Collection, monitoring, and treatment of leachate from the OSDF.
Extraction, monitoring, and treatment of contaminated groundwater from the Great Miami Aquifer (Operable Unit 5).
Ongoing operation of the Fernald Preserve Visitors Center, associated outreach, and educational activities.
National Pollution Discharge Elimination System (NPDES) permit monitoring. Environmental monitoring programs were developed to ensure the remedy remains protective of the environment. The requirements of these programs are described in detail in the LMICP and reported in this site environmental report as outlined below. Liquid Pathway Highlights Groundwater Pathway The groundwater pathway at the Fernald Preserve is routinely monitored to:
Verify that hydraulic capture is maintained, track the restoration of the total uranium plume, including non-uranium constituents, and evaluate water quality conditions in the aquifer that may indicate a need to modify the design or the operation of restoration modules.
Meet compliance-based groundwater monitoring obligations.

Fernald Preserve 2012 Site Environmental Report U.S. Department of Energy Doc. No. S09665 May 2013 Page viii
During 2012, active restoration of the Great Miami Aquifer continued. A total of 140 monitoring wells were sampled semiannually to determine water quality. Aquifer water elevations were measured quarterly in 178 monitoring wells. The following highlights describe the key findings from the 2012 groundwater data:
Two billion, three hundred and fifty-one million gallons (8,899 million liters) of groundwater were extracted from the Great Miami Aquifer, and 508.48 pounds (lb) (230.6 kilograms [kg]) of uranium were removed from the aquifer in 2012.
Since 1993, 34,534 million gallons (130,725 liters) of water have been pumped from the Great Miami Aquifer and 11,313 net pounds (5,131 kg) of uranium have been removed from the Great Miami Aquifer.
Data collected in 2012 indicates that uranium concentrations within the footprint of the maximum uranium plume continue to decrease in response to pumping. The footprint of the maximum uranium plume in 2012 was approximately 130 acres (a decrease of approximately 9.7 percent from what was mapped in 2011 [144 acres]).
The results of the groundwater capture analysis and monitoring for total uranium and non-uranium constituents indicate that the design of the groundwater remedy for the aquifer restoration system is appropriate for capture of the plume.
Pumping of the South Plume/South Plume Optimization Module continued to meet the objective of preventing further southward migration of the southern total uranium plume beyond the extraction wells.
Since 2005, the percentage of treatment needed to achieve discharge limits has decreased significantly. The aquifer remedy can now achieve uranium discharge limits without groundwater treatment.
Onsite Disposal Facility Monitoring Engineered features within the OSDF continue to perform as designed, indicating that a leak from the facility is not occurring. Leachate flow continues to diminish as expected, and leak detection system flow volumes indicate that the cell liners are performing well within design specifications. Surface Water and Treated Effluent Pathway Surface water and treated effluent are monitored to determine the effects of Fernald Preserve activities on Paddys Run (an intermittent stream), the Great Miami River, and the underlying Great Miami Aquifer and to meet compliance-based surface water and treated effluent monitoring obligations. In addition, the results from sediment sampling are discussed as a component of this primary exposure pathway. In 2012, 21 surface water and treated effluent locations were sampled at various frequencies. The following highlights describe the key findings from the 2012 surface water and treated effluent monitoring programs:
Five hundred and twenty four pounds (238 kg) of uranium were discharged in treated effluent to the Great Miami River, which was below the limit of 600 lb (272 kg) per year. Approximately 82.5 lb (37 kg) of uranium were released to the environment through uncontrolled storm water runoff. Therefore, the total amount of uranium released through

U.S. Department of Energy Fernald Preserve 2012 Site Environmental Report May 2013 Doc. No. S09665 Page ix
the treated effluent and uncontrolled surface water pathways during 2012 was estimated to be 606 lb (275kg).
Analytical results of 15 surface water samples exceeded the surface water final remediation level (FRL) for total uranium, the site’s primary contaminant. All exceedances were from SWD-09, which was established to monitor the maintenance action completed west of the former Waste Pit Area. The surface water at location SWD-09 does not flow off property. There were no surface water FRL exceedances for any other constituent.
Compliance sampling, consisting of sampling for nonradiological pollutants from uncontrolled runoff and treated effluent discharges from the Fernald Preserve, is regulated under the state-administrated NPDES program. Discharges were in compliance with effluent limits identified in the NPDES permit 100 percent of the time.
Direct Radiation Pathway Highlights The direct radiation pathway is routinely monitored to assess the impact of direct radiation on the surrounding public and environment. In addition, the data are used to demonstrate compliance with various regulations and DOE orders. Eleven dosimeters (four trail locations, five boundary locations, one location at the Visitors Center, and one background location) were used in 2012 to determine compliance with the applicable limits. The direct radiation levels measured in 2012 indicate that the individual measurements obtained in the northeast quadrant of the site are slightly higher than background, but annual averages for onsite and background locations are not significantly different. The highest value for an onsite dosimeter produced a dose of 11 millirem per year (mrem/yr) (0.11 millisievert per year [mSv/yr]) above background to an individual who spent the entire year (24 hours a day) at the location. Estimated Dose In 2012, the maximally exposed individual, standing at the northeastern boundary monitor with the highest above-background reading, could receive a dose of 11 mrem (0.11 mSv). This estimate represents the maximum incremental dose above background attributed to direct radiation. This dose is 11 percent of the adopted DOE limit, which is 100 mrem/yr (1 mSv/yr) above background as established by the International Commission on Radiological Protection. Natural Resources Natural resources include the diversity of plant and animal life and their supporting habitats in and around the Fernald Preserve. A number of ecological activities were conducted in 2012. Maintenance in ecologically restored areas included prescribed burning of prairies, erosion repair, mowing, spot herbicide application, repair of deer exclosure fence, and hazing for control of nuisance geese. With funding from the Natural Resource Trustees, three ecological restoration projects were completed in 2012. Ecological monitoring in 2012 consisted of wetland functional monitoring and implementation monitoring within several restoration projects. Results show continuing establishment of wetland

Fernald Preserve 2012 Site Environmental Report U.S. Department of Energy Doc. No. S09665 May 2013 Page x
communities. Vegetation establishment in restoration projects was mostly successful with total cover continuing to be a challenge in several areas within the former production area. Quarterly site and OSDF inspections continued in 2012. No major issues were identified. There were no unexpected discoveries of cultural resources. No archaeological surveys were conducted in 2012. The Programmatic Agreement with the Ohio Historic Preservation Office was updated to include the DOE Office of Legacy Management and to revise the reporting frequency for archaeological activities.

U.S. Department of Energy Fernald Preserve 2012 Site Environmental Report May 2013 Doc. No. S09665 Page 1
Abbreviated Timeline 1951 Construction of the Feed Materials Production Center began. 1952 Uranium production started. 1986 EPA and DOE signed the Federal Facilities Compliance Agreement, thus
initiating the remedial investigation/feasibility study process under the National Contingency Plan.
1989 Uranium production was suspended. The Fernald site was placed on the National Priorities List, which is the list of CERCLA sites most in need of cleanup.
1990 As part of the Amended Consent Agreement, the site was divided into operable units for characterization and remedy determination.
1991 Uranium production formally ended. The site mission changed from uranium production to environmental remediation and site restoration.
1994 Decontamination and dismantling of the first building was completed under the Operable Unit 3 Interim Record of Decision.
1996 The last operable unit's Record of Decision was signed, signifying the end of the 10-year remedial investigation/feasibility study process. (The Operable Unit 4 Record of Decision was later re-opened.) Construction began in support of the Operable Unit 1 selected remedy. Soil remedial excavation began as part of the Operable Unit 5 selected remedy.
1997 Construction of Cell 1 of the onsite disposal facility took place, and the first waste placement began in December. Environmental monitoring and reporting were consolidated under the Integrated Environmental Monitoring Plan (IEMP) to align with remediation efforts.
1998 Operable Unit 2 remedial excavations began. 1999 Excavation of the waste pits was initiated under the Operable Unit 1 Record
of Decision, and the first rail shipment of waste material was transported to Envirocare of Utah, Inc.
2000 The Record of Decision Amendment for Operable Unit 4 Silos 1 and 2 Remedial Actions was signed by EPA, thus establishing a new selected remedy for Operable Unit 4.
2001 Cell 1 of the onsite disposal facility was capped. Remediation of the Southern Waste Units was completed.
2002 The Silos 1 and 2 Radon Control System began operation and successfully reduced radon levels within the silos. The offsite transfer of nuclear product material was completed. Wastes were placed into Cells 2 through 5 of the onsite disposal facility.
2003 All major Operable Unit 2 remedial actions were completed. In addition, approximately 412,000 cubic yards (315,015 cubic meters) of waste were placed in Cells 3 through 6 of the onsite disposal facility.
2004 Removal of Silos 1 and 2 wastes from the silos to the holding tank facility began. Plans to reduce the size of the site's wastewater treatment infrastructure were approved and implemented. The last of Fernald's 10 uranium production complexes, plus an additional 35 structures and 73 trailers, were demolished. Also, all eight cells of the onsite disposal facility were capped or received waste, and approximately 513,000 cubic yards (392,240 cubic meters) were placed in Cells 4 through 8.
2005 Removal of Silo 3 waste began, and the first shipment of waste arrived at Envirocare of Utah. Remedial actions for Operable Unit 1 were completed in June. The first shipment of Silos 1 and 2 wastes arrived at Waste Control Specialists in Texas.
2006 Remediation of the Fernald site was completed on October 29, 2006, and the site was officially transferred into DOE’s Office of Legacy Management on November 17, 2006.
2008 The old Silos Warehouse was remodeled into the new Fernald Preserve Visitors Center and opened to the public in August 2008. In addition, the community was allowed unescorted access at the Fernald Preserve.
2012 The throughput capacity of the Converted Advanced Wastewater Treatment Facility (CAWWT) was reduced from 1,800 gallons per minute (gpm) to 500/600 gpm.
1.0 Site Background
In 1951, the U.S. Atomic Energy Commission, a predecessor agency of the U.S. Department of Energy (DOE), began building the Feed Materials Production Center on a 1,050-acre (425-hectare) tract of land outside the small farming community of Fernald, Ohio. The facility's mission was to produce “feed materials” in the form of purified uranium compounds and metal for use by other government facilities involved in the production of nuclear weapons for the nation's defense. Uranium metal was produced at the Feed Materials Production Center from 1952 through 1989. During that time, more than 500 million pounds (lb) (227 million kilograms [kg]) of uranium metal products were delivered to other sites. These production operations caused releases to the surrounding environment, which resulted in contamination of soil, surface water, sediment, and groundwater on and around the site. In 1991, the mission of the site officially changed from uranium production to environmental cleanup under
the Comprehensive Environmental Response, Compensation, and Liability Act (CERCLA, also known as Superfund), as amended. The site was renamed the Fernald Environmental Management Project in 1991. In 2003, the site name changed to the Fernald Closure Project to reflect the mission of the site as on a path to closure. In 2007, the site name changed to the Fernald Preserve to reflect the completion of the cleanup (with the exception of groundwater)

Fernald Preserve 2012 Site Environmental Report U.S. Department of Energy Doc. No. S09665 May 2013 Page 2
Exposure Pathways
An exposure pathway is a route that materials can travel between the point of release (a source) and the point of delivering a radiation or chemical dose (a receptor). At the Fernald Preserve, two primary exposure pathways (water and air) have been identified. A primary pathway is one that may allow pollutants to directly reach the public or the environment. Therefore, the water and air pathways provide a basis for environmental sampling and information useful for evaluating potential dose to the public or the environment.
Secondary exposure pathways have been thoroughly evaluated under previous environmental monitoring programs. Secondary exposure pathways represent indirect routes by which pollutants may reach receptors. An example of a secondary pathway is produce. Through the food chain, one organism may accumulate a contaminant and then be consumed by humans or other animals. The contaminant travels through the air to the soil, where it is absorbed into produce through the roots and is consumed by humans or animals. An evaluation of past monitoring data has shown that secondary exposure pathways at the Fernald Preserve are insignificant routes of exposure to offsite receptors. Therefore, the main focus of the site monitoring program (described in the IEMP) is on the primary exposure pathways.
Refer to Section 5 of this report for information pertaining to 2012 dose calculations from all pathways.
ushered by the successful transition to the DOE Office of Legacy Management (LM) in late 2006, and the new mission to be an asset to the community as an undeveloped park with an emphasis on wildlife. The Legacy Management Support contractor continues to be responsible for site activities, including the ongoing groundwater remedy. The U.S. Environmental Protection Agency (EPA) Region 5 and the Southwest District Office of the Ohio EPA provide regulatory oversight. In the 1980s, the goals of environmental monitoring were to assess the impact of production operations and monitor the environmental pathways through which residents of the local community might be exposed to contaminants from the site (exposure pathways). The environmental monitoring program provided comprehensive on- and off-property surveillance of contaminant levels in surface water, groundwater, air, and biota (produce). The goal was to measure the levels of contaminants associated with uranium production operations and report this information to the regulatory agencies and stakeholders.
After the conclusion of the site's uranium production and the completion of the CERCLA remedy selection process, the focus was on the safe and efficient implementation of environmental remediation activities and facility decontamination and dismantling operations. In recognition of this shift in emphasis toward remedy implementation, the environmental monitoring program was revised in 1997 to align with the remediation activities planned for the Fernald site. The site's environmental monitoring program is described in the Integrated Environmental Monitoring Plan (IEMP), which is Attachment D of the Comprehensive Legacy Management and Institutional Controls Plan (LMICP) (DOE 2012a). The environmental monitoring program is designed to ensure the continued protectiveness of the completed remedial actions as well as implementation of the ongoing groundwater remedy and performance of the onsite disposal facility (OSDF).
This Fernald Preserve 2012 Site Environmental Report summarizes the findings from the IEMP monitoring program and provides a status on the progress toward final site restoration. This report consists of the following: Summary Report. The summary report (Sections 1 through 6) documents the results of environmental monitoring activities at the Fernald Preserve in 2012. It includes a discussion of ongoing groundwater remediation activities and summaries of environmental data from groundwater, surface water and treated effluent, direct radiation, and natural resources monitoring programs. It also summarizes the information contained in the appendixes.

U.S. Department of Energy Fernald Preserve 2012 Site Environmental Report May 2013 Doc. No. S09665 Page 3
Appendixes. The detailed appendixes provide the 2012 environmental monitoring data for the various media, primarily in the form of graphs and tables. The appendixes are generally distributed only to the regulatory agencies. However, a complete copy of the appendixes is available on the LM website at http://www.lm.doe.gov/fernald/Sites.aspx and by contacting LM at (513) 648-7500 or S.M. Stoller Public Affairs at (513) 648-4026.
The rest of this introductory section provides:
An overview of the environmental remediation completed as well as ongoing remedy implementation.
A description of environmental monitoring activities at the Fernald Preserve.
A description of the physical and ecological characteristics of the area. 1.1 The Path to Site Closure In 1986, the Fernald site began working through the CERCLA process to characterize the nature and extent of contamination at the site, establish risk-based cleanup standards, and select the appropriate remediation technologies to achieve those standards. To facilitate this process, the site was organized into five operable units in 1991. The purpose of the operable unit concept under CERCLA was to organize site
components by geographical function and by the potential for similar technologies to be used for environmental remediation. The remedy selection process culminated in 1996 with the approval of the final Records of Decision for all five operable units. However, several of the Records of Decision (including those for Operable Units 1, 4, and 5) have subsequently been modified through issuance of Explanation of Significant Differences or Amendment documents. These documents were prepared, submitted for EPA and public review, and issued in accordance with CERCLA regulations. Following approval of the initial Records of Decision, work began on the design and implementation of the operable unit remedies. Table 1 describes each operable unit and an overview of its associated remedy.
CERCLA Remedial Process
The process of cleaning up sites under CERCLA consists of the following general phases:
Site Characterization—During this phase, contaminants are identified and quantified, and the potential impacts of those contaminants on human health are determined. This phase includes the remedial investigation and the baseline risk assessment.
Remedy Selection—During this phase, cleanup alternatives are developed and evaluated. Activities include the feasibility study and proposed remedial action plan. After public comments are received, a remedy is selected and documented in a Record of Decision.
Remedial Design and Remedial Action—This phase of the CERCLA process includes the detailed design and implementation of the remedy. The CERCLA process ends with certification and site closure.
A CERCLA 5-year review process is triggered by the onset of construction for the first operable unit remedial action that will result in hazardous substances, pollutants, or contaminants remaining at the site above levels that allow for unlimited use and unrestricted exposure. Of all the operable units, the site preparation construction to support the Waste Pits Project under the Operable Unit 1 Record of Decision (DOE 1995a) was the first such action. This construction began on April 1, 1996. Three CERCLA 5-year reviews have been conducted and approved by the regulatory agencies to date (April 2001 [DOE 2001a], April 2006 [DOE 2006a], and September 2011 [DOE 2011a]). These reviews ensure that the remedy remains effective and continues to be protective of human health and the environment. The next scheduled 5-year review is in early 2016.
Site closure, relative to the completion of remediation, was defined in the contract between Fluor Fernald, Inc. and DOE as the physical completion of the scope of work required by the five Records of Decision with the exception of the groundwater remedy.
LM assumed the long-term surveillance monitoring and maintenance of the Fernald site on November 17, 2006, to ensure continued protection of human health and the environment and continued operation of the groundwater remedy. The Comprehensive Legacy Management and Institutional Controls Plan (DOE 2012a) defines the activities to be conducted with respect to long-term stewardship at the Fernald Preserve. The CERCLA 5-year review process will continue to provide stakeholders with information on the remedy performance and with long-term stewardship information.

Fernald Preserve 2012 Site Environmental Report U.S. Department of Energy Doc. No. S09665 May 2013 Page 4
Table 1. Operable Unit Remedies
Operable Unit
Description Remedy Overview
1
Waste Pits 1-6
Clearwell
Burn pit
Berms, liners, caps, and soil within the boundary
Record of Decision approved: March 1995
Explanation of Significant Differences approved: September 2002
Record of Decision Amendment approved: November 2003
Excavation of materials with constituents of concern above final remediation levels (FRLs), waste processing and treatment by thermal drying (as necessary), offsite disposal at a permitted facility, and soil remediation/certification.
Remedial actions completed: June 2005
Final Remedial Action Report approved: August 2006
2
Solid waste landfill
Inactive fly ash pile
Active fly ash pile (now inactive)
North and South Lime Sludge Ponds
Other South Field areas
Berms, liners, and soil within the operable unit boundary
Record of Decision approved: May 1995
Post-Record of Decision Fact Sheet approved: April 1999
Excavation of all materials with constituents of concern above FRLs, treatment for size reduction and moisture control as required, onsite disposal in the OSDF, and offsite disposal of excavated material that exceeded the waste acceptance criteria for the OSDF.
Remedial actions completed: June 2006
Final Remedial Action Report approved: September 2006
3
Former Production Area, associated facilities, and equipment (includes all above- and below-grade improvements), including but not limited to:
All structures, equipment, utilities, effluent lines, and K-65 transfer line
Wastewater treatment facilities
Fire training facilities
Coal pile
Scrap metals piles
Drums, tanks, solid waste, waste product, feedstocks, and thorium
Record of Decision for Interim Remedial Action approved: June 1994
Record of Decision for Final Remedial Action approved: August 1996
Adoption of Operable Unit 3 Interim Record of Decision; alternatives to disposal through the unrestricted or restricted release of materials as economically feasible for recycling, reuse, or disposal; treatment of material for onsite or offsite disposal; required offsite disposal for process residues, product materials, process-related metals, acid brick, concrete from specific locations, and any other material exceeding the OSDF waste acceptance criteria; and onsite disposal for material that meets the OSDF waste acceptance criteria.
Remedial actions completed: October 2006
Final Remedial Action Report approved: February 2007

Table 1 (continued). Operable Unit Remedies
U.S. Department of Energy Fernald Preserve 2012 Site Environmental Report May 2013 Doc. No. S09665 Page 5
Operable Unit
Description Remedy Overview
4
Silos 1 and 2 (containing K-65 residues; demolished in 2005)
Silo 3 (containing cold metal oxides; demolished in 2006)
Silo 4 (empty and never used; demolished in 2003)
Decant tank system
Berms and soil within the operable unit boundary
Record of Decision approved: December 1994
Explanation of Significant Differences for Silo 3 approved: March 1998
Record of Decision Amendment for Silos 1 and 2 approved: July 2000
Record of Decision Amendment for Silo 3 approved: September 2003
Explanation of Significant Differences for Silos 1 and 2 approved: November 2003
Explanation of Significant Differences for Operable Unit 4 approved: January 2005.
Removal of Silo 3 materials for treatment and Silos 1 and 2 residues and decant sump tank sludges with onsite stabilization of materials, residues, and sludges followed by offsite disposal. Excavation of silos area soils contaminated above the FRLs with onsite disposal for contaminated soils and debris that meet the OSDF waste acceptance criteria; and site restoration. Concrete from Silos 1 and 2, and contaminated soil and debris that exceeded the OSDF waste acceptance criteria were disposed of offsite.
Remedial actions for Silo 3 completed: April 2006
Remedial actions involving the completion of the shipment of stabilized Silos 1 and 2 material to a temporary storage facility in Texas was completed in May 2006.
Final Remedial Action Report approved: September 2006
Permanent disposal of the 3,776 containers of Silos 1 and 2 material began on October 7, 2009, and the last container was placed November 2, 2009.
5
Groundwater
Surface water and sediments
Soil not included in the definitions of Operable Units 1 through 4
Flora and fauna
Record of Decision approved: January 1996
Explanation of Significant Differences was approved in November 2001, formally adopting EPA's Safe Drinking Water Act maximum contaminant level for uranium of 30 micrograms per liter (µg/L) as both the FRL for groundwater remediation and the monthly average uranium effluent discharge limit to the Great Miami River.
Extraction of contaminated groundwater from the Great Miami Aquifer to meet FRLs at all affected areas of the aquifer. Treatment of contaminated groundwater, storm water, and wastewater to attain concentration and mass-based discharge limits and FRLs in the Great Miami River. Excavation of contaminated soil and sediment to meet FRLs. Excavation of contaminated soil containing perched water that presents an unacceptable threat through contaminant migration to the underlying aquifer. Onsite disposal of contaminated soil and sediment that meet the OSDF waste acceptance criteria. Soil and sediment with contaminant concentrations that exceeded the waste acceptance criteria for the OSDF was treated, when possible, to meet the OSDF waste acceptance criteria or was disposed of at an offsite facility. Also includes site restoration, institutional controls, and post-remediation maintenance.
Interim Remedial Action Report approved: August 2008

Fernald Preserve 2012 Site Environmental Report U.S. Department of Energy Doc. No. S09665 May 2013 Page 6
1.2 Environmental Monitoring Program In the 1980s, an environmental monitoring program was initiated to assess the impact of past operations on the environment and monitor potential exposure pathways to the local community. Additionally, characterization activities were conducted at the Fernald site for nearly 10 years through the remedial investigation phase of the CERCLA process. The initial environmental evaluations performed during the remedial investigation/feasibility study process were used to select the final remedy for Operable Unit 5, which addressed contamination in soil, groundwater, surface water, sediment, air, and biota—in short, all environmental media and contaminant exposure pathways affected by past uranium production operations at the site. The selected remedy for Operable Unit 5 defined the site's final contaminant cleanup levels and established the extent of on- and off-property remedial actions necessary to provide permanent solutions to environmental concerns posed by the site. The Operable Unit 5 remedy included plans for removing the contamination that might be released through these exposure pathways and for monitoring these pathways to measure the site's continuing impact on the environment as remediation progresses. The characterization data used to develop the final remedy were also used to focus on and develop the environmental monitoring program documented in the IEMP. The following describes the IEMP’s key elements:
The IEMP defines monitoring activities for environmental media, such as groundwater, surface water and treated effluent, sediment, direct radiation, and natural resources. In general, the primary exposure pathway (water) is monitored, and the program focuses on assessing the effect on the surrounding environment.
The IEMP establishes a data evaluation and decision-making process for each environmental medium. Through this process, environmental conditions at the site are continually evaluated. These evaluations sometimes affect decisions made about the implementation of remediation activities. For example, environmental data are routinely evaluated to identify any significant trends that may indicate the potential for an unacceptable future impact to the environment if action is not taken.
The IEMP is reviewed annually and revised as necessary to ensure that the monitoring program adequately addresses changing activities.
The IEMP consolidates routine reporting of environmental data into this comprehensive annual report.
1.3 Characteristics of the Site and Surrounding Area The natural settings of the Fernald Preserve and nearby communities were important factors in selecting the final remedy and remain important in the continual evaluation of the environmental monitoring program. Land use and demography, local geography, geology, surface hydrology, meteorology, and natural resources all impact monitoring activities and the implementation of the site remedy. 1.3.1 Land Use and Demography Economic activities in the area rely heavily on the physical environment. Land in the area is used primarily for livestock, crop farming, and gravel pit excavation operations. There also is a

U.S. Department of Energy Fernald Preserve 2012 Site Environmental Report May 2013 Doc. No. S09665 Page 7
private water utility approximately 2 miles (3.2 kilometers [km]) east of the Fernald Preserve that pumps groundwater primarily for industrial use. Downtown Cincinnati is approximately 18 miles (29 km) southeast of the Fernald Preserve (Figure 1). The cities of Fairfield and Hamilton are 6 and 8 miles (10 and 13 km) to the east and northeast, respectively (Figure 2). Scattered residences and several villages, including Fernald, New Baltimore, New Haven, Ross, and Shandon, are located near the site. 1.3.2 Geography Figure 3 depicts the location of the major physical features of the site, such as the buildings and supporting infrastructure. The Former Production Area and the OSDF dominate this view. The Former Production Area occupies approximately 136 acres (55 hectares) in the center of the site, and the OSDF occupies approximately 120 acres (48.6 hectares). The Great Miami River cuts a terraced valley to the east of the site, and Paddys Run (an intermittent stream) flows from north to south along the site's western boundary. In general, the site lies on a terrace that slopes gently among vegetated bedrock outcrops to the north, southeast, and southwest. 1.3.3 Geology Bedrock in the area indicates that approximately 450 million years ago a shallow sea covered the Cincinnati area. Sediments that later became flat-lying shale with interbedded limestone were deposited in the shallow sea, as evidenced by the abundance of marine fossils in the bedrock. In the more recent geologic past, the advance and retreat of three separate glaciers shaped the southwestern Ohio landscape. A large river drainage system south of the glaciers created river valleys up to 200 feet (ft) (61 meters [m]) deep, which were then filled with sand and gravel when the glaciers melted. These filled river valleys are called buried valleys. The last glacier to reach the area left a glacial overburden—a low-permeability mixture of clay and silt with minor amounts of sand and gravel—deposited across the land surface. The site is situated on a layer of glacial overburden that overlies portions of a 2- to 3-mile-wide (3 to 5 km wide) buried valley. This valley, known as the New Haven Trough, makes up part of the Great Miami Aquifer. The impermeable shale and limestone bedrock that defines the edges and bottom of the New Haven Trough restricts the groundwater to the sand and gravel within the buried valley. Where present, the glacial overburden limits the downward movement of precipitation and surface water runoff into the underlying sand and gravel of the Great Miami Aquifer. The Great Miami River and its tributaries have eroded considerable portions of the glacial overburden and exposed the underlying sand and gravel of the Great Miami Aquifer. Thus, in some areas, precipitation and surface water runoff can easily migrate into the underlying Great Miami Aquifer and transport contaminants to the aquifer as well. Natural and man-made breaches of the glacial overburden were key pathways where contaminated water entered the aquifer, causing the groundwater plumes that are being addressed by aquifer restoration activities. Figure 4 provides a view of the structure of subsurface deposits in the region along an east-west cross section through the site, and Figure 5 presents the regional groundwater flow patterns in the Great Miami Aquifer.
Fernald Preserve 2012 Site Environmental Report U.S. Department of Energy Doc. No. S09665 May 2013 Page 8
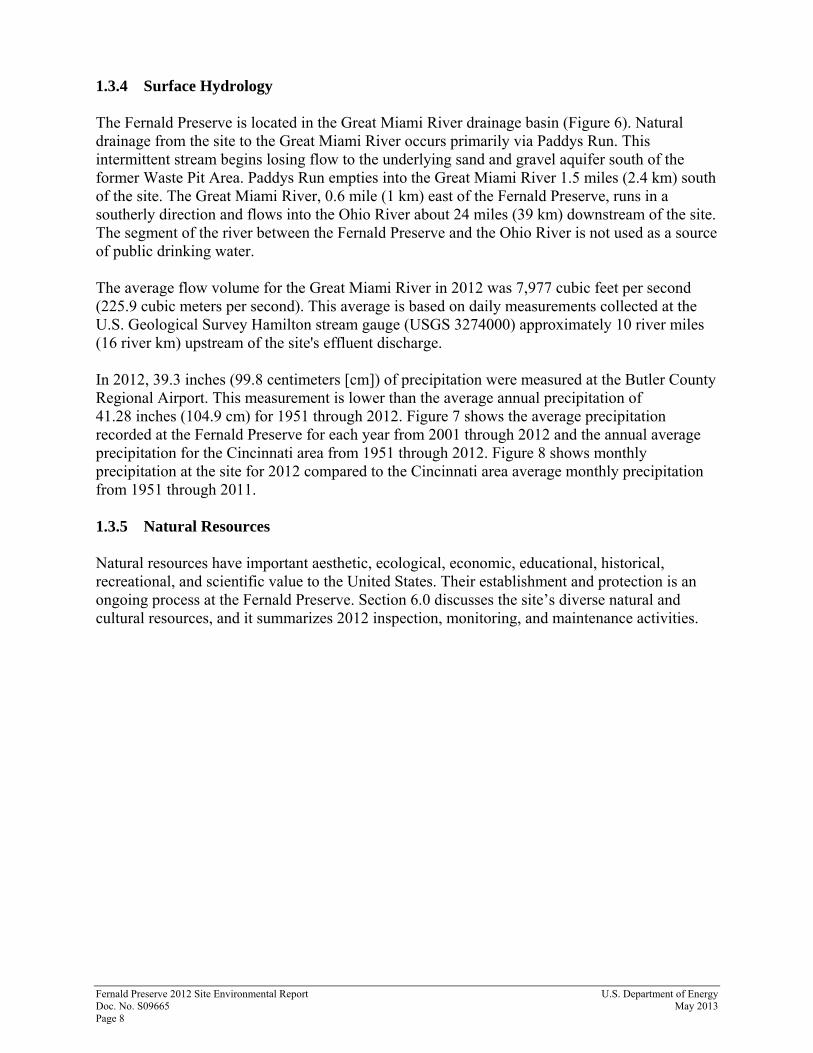
1.3.4 Surface Hydrology The Fernald Preserve is located in the Great Miami River drainage basin (Figure 6). Natural drainage from the site to the Great Miami River occurs primarily via Paddys Run. This intermittent stream begins losing flow to the underlying sand and gravel aquifer south of the former Waste Pit Area. Paddys Run empties into the Great Miami River 1.5 miles (2.4 km) south of the site. The Great Miami River, 0.6 mile (1 km) east of the Fernald Preserve, runs in a southerly direction and flows into the Ohio River about 24 miles (39 km) downstream of the site. The segment of the river between the Fernald Preserve and the Ohio River is not used as a source of public drinking water. The average flow volume for the Great Miami River in 2012 was 7,977 cubic feet per second (225.9 cubic meters per second). This average is based on daily measurements collected at the U.S. Geological Survey Hamilton stream gauge (USGS 3274000) approximately 10 river miles (16 river km) upstream of the site's effluent discharge. In 2012, 39.3 inches (99.8 centimeters [cm]) of precipitation were measured at the Butler County Regional Airport. This measurement is lower than the average annual precipitation of 41.28 inches (104.9 cm) for 1951 through 2012. Figure 7 shows the average precipitation recorded at the Fernald Preserve for each year from 2001 through 2012 and the annual average precipitation for the Cincinnati area from 1951 through 2012. Figure 8 shows monthly precipitation at the site for 2012 compared to the Cincinnati area average monthly precipitation from 1951 through 2011. 1.3.5 Natural Resources Natural resources have important aesthetic, ecological, economic, educational, historical, recreational, and scientific value to the United States. Their establishment and protection is an ongoing process at the Fernald Preserve. Section 6.0 discusses the site’s diverse natural and cultural resources, and it summarizes 2012 inspection, monitoring, and maintenance activities.

U.S. Department of Energy Fernald Preserve 2012 Site Environmental Report May 2013 Doc. No. S09665 Page 9
Figure 1. Fernald Preserve and Vicinity

Fernald Preserve 2012 Site Environmental Report U.S. Department of Energy Doc. No. S09665 May 2013 Page 10
Figure 2. Major Communities in Southwestern Ohio

U.S. Department of Energy Fernald Preserve 2012 Site Environmental Report May 2013 Doc. No. S09665 Page 11
Figure 3. Fernald Preserve Perspective

Fernald Preserve 2012 Site Environmental Report U.S. Department of Energy Doc. No. S09665 May 2013 Page 12
This page intentionally left blank

U.S. Department of Energy Fernald Preserve 2012 Site Environmental Report May 2013 Doc. No. S09665 Page 13
Figure 4. Cross Section of the New Haven Trough, Looking North

Fernald Preserve 2012 Site Environmental Report U.S. Department of Energy Doc. No. S09665 May 2013 Page 14
Figure 5. Regional Groundwater Flow in the Great Miami Aquifer

U.S. Department of Energy Fernald Preserve 2012 Site Environmental Report May 2013 Doc. No. S09665 Page 15
Figure 6. Great Miami River Drainage Basin

Fernald P
reserve 2012 Site E
nvironmental R
eport U
.S. D
epartment of E
nergy D
oc. No. S
09665 M
ay 2013 P
age 16
Figure 7. Annual Precipitation, 1994–2012
0
25
50
75
100
125
150
175
0
10
20
30
40
50
60
70
1991 1992 1993 1994 1995 1996 1997 1998 1999 2000 2001 2002 2003 2004 2005 2006 2007 2008 2009 2010 2011 2012
Pre
cipi
tatio
n (c
entim
eter
s)
Pre
cipi
tatio
n (in
ches
)
Year
Average annual precipitation for the Cincinnati area is 41.28 inches (104.9 cm) for 1951-2012.Average annual precipitation for the Cincinnati area is 41.28 inches (104.9 cm) for 1951-2012.Average annual precipitation for the Cincinnati area is 41.28 inches (104.9 cm) for 1951-2012.Average annual precipitation for the Cincinnati area is 41.28 inches (104.9 cm) for 1951-2012.Average annual precipitation for the Cincinnati area is 41.28 inches (104.9 cm) for 1951-2012.Average annual precipitation for the Cincinnati area is 41.28 inches (104.9 cm) for 1951-2012.

U.S
. Departm
ent of Energy
Fernald P
reserve 2012 Site E
nvironmental R
eport M
ay 2013 D
oc. No. S
09665
Page 17
Figure 8. Monthly Precipitation for 2012 Compared to Average Monthly Precipitation for 1951–2012
0
2
4
6
8
10
12
14
16
18
20
22
24
0
1
2
3
4
5
6
7
8
9
10
Jan Feb Mar Apr May Jun Jul Aug Sep Oct Nov Dec
Pre
cipi
tatio
n (c
entim
eter
s)
Pre
cipi
tatio
n (in
ches
)
Month
Fernald Preserve (Butler CountyRegional Airport) MonthlyPrecipitation 2012Cincinnati Area Average MonthlyPrecipitation 1951-2012

Fernald Preserve 2012 Site Environmental Report U.S. Department of Energy Doc. No. S09665 May 2013 Page 18
This page intentionally left blank

U.S. Department of Energy Fernald Preserve 2012 Site Environmental Report May 2013 Doc. No. S09665 Page 19
2.0 Remediation Status and Compliance Summary This section provides a summary of CERCLA remediation activities in 2012 and summarizes compliance activities with other applicable environmental laws, regulations, and legal agreements. Compliance under CERCLA dictates the environmental remediation of the Fernald Preserve. EPA and Ohio EPA enforce the environmental laws, regulations, and legal agreements governing work at the Fernald Preserve. EPA develops, promulgates, and enforces environmental protection regulations and technology-based standards. EPA regional offices and state agencies enforce these regulations and standards by review of data collected at the Fernald Preserve. EPA Region 5 has regulatory oversight of the CERCLA process at the Fernald Preserve, with active participation from Ohio EPA. For some programs, such as those under the Resource Conservation and Recovery Act (RCRA), as amended, the Clean Air Act, as amended (excluding National Emissions Standards for Hazardous Air Pollutants compliance), and the Clean Water Act, as amended, EPA has authorized or delegated the State of Ohio to act as the primary enforcement authority. For these programs, Ohio promulgates state regulations that must be at least as stringent as federal requirements. Several legal agreements among DOE, EPA Region 5, and Ohio EPA identify site-specific requirements for compliance with the regulations. To comply with these regulations, DOE-Headquarters issues directives to its field and area offices and conducts audits to ensure compliance with all regulations. 2.1 CERCLA Remediation Status In October 2006, remedial actions were completed for four of the five operable units. As of October 29, 2006, the only active remedy implementation efforts remaining involved the continuation of the groundwater remedy under Operable Unit 5. Other activities under CERCLA during 2012 involved monitoring the performance of the completed remedies and implementing the requirements of the LMICP. All cleanup-related CERCLA documentation, including a copy of the Administrative Record (AR), is available online at http://www.lm.doe.gov/CERCLA_Home.aspx. The original and a copy of the AR are located in the records warehouse at the LM Business Center in Morgantown, West Virginia. A copy of the AR is also located at EPA’s Region 5 office in Chicago, Illinois. The Fernald Preserve records staff can be contacted by phone at (513) 648-4449 for assistance in searching for a document in the CERCLA AR. The CERCLA AR will be updated as new documents are created. The completion and closure of a National Priorities List (NPL) site encompasses several milestones and specific documentation requirements for each milestone completed (EPA 2011). These milestones begin with remedial action completion and end with deletion from the NPL and include:
Remedial action completion (Final or Interim Remedial Action Reports).
Construction completions (Preliminary Closeout Report)—all construction activities are complete, immediate threats are addressed, and long-term threats are under control.

Fernald Preserve 2012 Site Environmental Report U.S. Department of Energy Doc. No. S09665 May 2013 Page 20
Site completion (Final Closeout Report)—all site cleanup goals are met, all Records of Decision are complete, institutional controls are in place, and site conditions are protective of human health and the environment.
Site deletion from the NPL (Notice of Intent to Delete). Final Remedial Action Reports have been prepared and approved by both EPA and Ohio EPA for Operable Units 1, 2, 3 and 4. The Interim Remedial Action Report for Operable Unit 5 (DOE 2008) was approved by EPA in August 2008. That report details the ongoing aquifer restoration activities and provides information indicating that all required groundwater infrastructure has been installed and is functioning as designed. Further, the report provides information that all soils have been remediated (except those associated with the groundwater infrastructure) and that the OSDF is functioning as designed. Operable Unit 5 will remain open until a future final Remedial Action Report for Operable Unit 5 has been prepared. This report will be developed once groundwater actions are complete, and all soils and infrastructure associated with the groundwater remedy have been adequately addressed (estimated completion date in 2026, based on modeling projections). EPA issued the Preliminary Closeout Report U.S. DOE Feed Materials Production Center, Fernald, Ohio (EPA 2006) in December 2006. CERCLA also requires a 5-year review process of remedial actions implemented under the signed Record of Decision for each operable unit. The purpose of a 5-year review is to determine, through evaluation of performance of the selected remedy, whether the remedy at a site remains protective of human health and the environment. The first 5-year review report for the Fernald Preserve (DOE 2001a) was approved by EPA in September 2001. The second 5-year review report was submitted in April 2006 (DOE 2006a) and approved by EPA in September 2006. The third 5-year review report was submitted to EPA in March 2011 (DOE 2011a) and approved by EPA in August 2011. CERCLA remediation highlights during 2012 included the following:
The performance of the OSDF was satisfactory during 2012. The cap underwent four formal inspections. Minor maintenance of the cap and associated drainages continues. Activities include removal of small trees and shrubs, spot herbicide application, and repairing animal burrows. Leachate generation has continued to decline, and liner performance is meeting design requirements. Leachate/leak detection performance is discussed in Section 3. Cap performance is discussed further in Section 6.
Figure 9 indicates soil areas that remain uncertified pending the end of the groundwater remedy and the decontamination and decommissioning of the related facilities and the associated utilities. Elevated uranium concentrations persist in surface water in an area adjacent to former Waste Pit 3. No specific actions other than continued monitoring were conducted in 2012. This issue is further discussed in Section 4.
Monitoring and maintenance of ecologically restored areas continued during 2012, and required site inspections were performed. Minor breaches in or violations of the institutional controls established in the LMICP included occasional instances of hikers straying off trail and two instances of vandalism to the OSDF fencing. The vandalism to the fencing did not result in compromise of the cap or structure of the OSDF. Several eroded areas were repaired within the Former Production Area. In addition, three ecological restoration projects were conducted through funding from the Natural Resource Trustees. Further discussion of the restored area activities and the site inspection process is included in Section 6.

U.S. Department of Energy Fernald Preserve 2012 Site Environmental Report May 2013 Doc. No. S09665 Page 21
Figure 9. Uncertified Areas and Subgrade Utility Corridors

Fernald Preserve 2012 Site Environmental Report U.S. Department of Energy Doc. No. S09665 May 2013 Page 22
This page intentionally left blank

U.S. Department of Energy Fernald Preserve 2012 Site Environmental Report May 2013 Doc. No. S09665 Page 23
Aerial Photograph of OSDF, June 2012
The Converted Advanced Wastewater Treatment Facility

Fernald Preserve 2012 Site Environmental Report U.S. Department of Energy Doc. No. S09665 May 2013 Page 24
For 2012, the ongoing groundwater remedy resulted in a total of 2,351 million gallons (M gal) (8,899 million liters [M liters]) of groundwater being extracted from the Great Miami Aquifer, and 508 lb (231kg) of uranium were removed from the aquifer. Section 3 discusses groundwater monitoring and remediation performance. 2.2 Summary of Compliance with Other Requirements CERCLA requires compliance with other laws and regulations as part of remediation of the Fernald Preserve. These requirements are referred to as applicable or relevant and appropriate requirements (ARARs). ARARs that are pertinent to remediation of the Fernald Preserve are specified in the Record of Decision for each operable unit. This section of the report highlights some of the major requirements related to environmental monitoring and waste management and describes how the Fernald Preserve complied with these requirements in 2012. The regulations discussed in this section have been identified as ARARs within the Records of Decision. The Fernald Preserve must comply with these regulations while site remediation under CERCLA is underway; compliance is enforced by EPA and Ohio EPA. Some of these requirements include permits for controlled releases, which are also discussed in this section. 2.2.1 RCRA RCRA regulates the treatment, storage, and disposal of hazardous waste and mixed waste that contains radioactive and hazardous waste components. These wastes are regulated under RCRA and Ohio hazardous waste management regulations; therefore, the Fernald Preserve must comply with legal requirements for managing hazardous and mixed wastes. Ohio EPA has been delegated or authorized by EPA to enforce its hazardous waste management regulations in lieu of the federal RCRA program. In addition, hazardous waste management is subject to the 1988 Consent Decree, the 1993 Stipulated Amendment between the State of Ohio and DOE, and a series of Director’s Final Findings and Orders issued by Ohio EPA. 2.2.1.1 RCRA Property Boundary Groundwater Monitoring The Director’s Findings and Orders for Groundwater, which were signed September 10, 1993, described an alternate monitoring system for RCRA groundwater monitoring. A revision of this document was approved on September 7, 2000, to align with the groundwater monitoring strategy identified in the IEMP. The Property Boundary Groundwater Monitoring program is discussed in Section 3. 2.2.1.2 Waste Management Although the RCRA regulations remain applicable, the Fernald Preserve had no hazardous waste treatment, storage, or disposal activities during 2012. Wastes managed during 2012 were limited to universal waste, uncontaminated solid wastes, and small quantities of low-level radioactive wastes. 2.2.2 Clean Water Act Under the Clean Water Act, as amended, the Fernald Preserve is governed by the National Pollutant Discharge Elimination System (NPDES) regulations that require the control of
U.S. Department of Energy Fernald Preserve 2012 Site Environmental Report May 2013 Doc. No. S09665 Page 25
discharges of nonradiological pollutants to waters of the state of Ohio. The NPDES permit, issued by the State of Ohio, specifies discharge and sample locations, sampling and reporting schedules, and discharge limitations. The Fernald Preserve submits monthly reports on NPDES activities to Ohio EPA demonstrating compliance with stipulated discharge limits. There were no instances of noncompliance during 2012. Section 4 discusses the surface water and treated effluent information in detail. 2.2.3 Clean Air Act Ohio EPA is authorized to enforce the state of Ohio’s air standards for particulate matter at the Fernald Preserve. Compliance is accomplished by implementing the Fugitive Dust Control Policy negotiated between DOE and Ohio EPA in 1997. The policy allows for visual observation of fugitive dust and implementation of dust control measures. 2.2.4 Superfund Amendments and Reauthorization Act of 1986 The Superfund Amendments and Reauthorization Act of 1986 (SARA) amended CERCLA and was enacted, in part, to clarify and expand CERCLA requirements. SARA Title III is also known as the Emergency Planning and Community Right to Know Act. A letter was submitted to Ohio EPA, to the local emergency planning committees of Hamilton and Butler Counties, and to the Crosby Township Fire Department on February 28, 2011, stating that the Fernald Preserve was not required to submit the SARA Title III, Section 312, Emergency and Hazardous Chemical Inventory Report for 2011. During 2012 there were no chemicals stored on the Fernald Preserve above threshold planning quantities. Another SARA Title III report, the Section 313 Toxic Chemical Release Inventory Report (Form R), is required if quantities of chemicals released at the Fernald Preserve exceed an applicable threshold for any SARA 313 chemical. If required, the Toxic Chemical Release Inventory Report lists routine and accidental releases and information about the activities, uses, and waste for each reported toxic chemical. No chemical releases have exceeded the threshold for several years. No chemical exceeded a reporting threshold during 2012. Also under SARA Title III, any offsite release meeting or exceeding a reportable quantity as defined by SARA Title III, Section 304, requires that immediate notifications be made to local emergency planning committees and the state emergency response commission. Notifications are also made to the National Response Center and other appropriate federal, state, and local regulatory entities. All releases that might occur at the Fernald Preserve are evaluated and documented to ensure that proper notifications are made in accordance with SARA, and under CERCLA Section 103, RCRA, the Toxic Substances Control Act, the Clean Air Act, the Clean Water Act, and Ohio environmental laws and regulations. There were no releases at the Fernald Preserve that met the reporting criteria under CERCLA during 2012. 2.2.5 Other Environmental Regulations The Fernald Preserve is also required to comply with other environmental laws and regulations in addition to those described above. Table 2 summarizes compliance with each of these requirements for 2012.

Fernald P
reserve 2012 Site E
nvironmental R
eport U
.S. D
epartment of E
nergy D
oc. No. S
09665 M
ay 2013 P
age 26
Table 2. Compliance with Other Environmental Regulations
Regulation and Purpose Background Compliance Issues 2012 Compliance Activities
Toxic Substances Control Act Regulates the manufacturing, use, storage, and disposal of toxic materials, including polychlorinated biphenyl (PCB) and PCB items.
The last routine Toxic Substances Control Act inspection of the Fernald Preserve's program was conducted by EPA Region 5 on September 21, 1994. No violations of PCB regulations were identified during the inspection.
No PCB liquids were used, stored or shipped in 2012.
Ohio Solid Waste Act Regulates infectious waste. The Fernald Preserve was registered with Ohio EPA as a generator of
infectious waste (generating more than 50 lb [23 kg] per month) until December 6, 1999, when Ohio EPA concurred with the Fernald Preserve’s qualification as a small quantity generator.
No infectious waste activities were required in 2012.
Federal Insecticide, Fungicide, and Rodenticide Act Regulates the registration, storage, labeling, and use of pesticides (such as insecticides, herbicides, and rodenticides).
The last inspection of the Federal Insecticide, Fungicide, and Rodenticide Act program conducted by EPA Region 5 on September 21, 1994, found the Fernald Preserve to be in full compliance with the requirements mandated by the Federal Insecticide, Fungicide, and Rodenticide Act.
Pesticide applications at the Fernald Preserve were conducted according to federal and state regulatory requirements.
National Environmental Policy Act Requires the evaluation of environmental, socioeconomic, and cultural impacts before any action, such as a construction or cleanup project, is initiated by a federal agency.
An Environmental Assessment for proposed final land use was issued for public review in 1998. It was prepared under DOE's guidelines for implementation of National Environmental Policy Act, 10 CFR 1021. The assessment requires consulting the public before any decisions on land use are made; it includes previous DOE commitments.
No National Environmental Policy Act activities were required in 2012.
Endangered Species Act Requires the protection of any threatened or endangered species found at the site as well as any critical habitat that is essential for the species' existence.
Ecological surveys conducted by Miami University and DOE, in consultation with the Ohio Department of Natural Resources and the U.S. Fish and Wildlife Service, have established the following list of threatened and endangered species and their habitats existing onsite: Cave salamander, state endangered, marginal habitat— small limestone outcrops and streams— none found; Sloan's crayfish, state-threatened—found on northern sections of Paddys Run; Indiana brown bat, federally-endangered—found in riparian areas along Paddys Run; Running buffalo clover, federally-endangered—potential habitat on disturbed areas along Paddys Run—none found; Spring coral root, state-threatened—potential habitat within northern wooded areas—none found; cobblestone tiger beetle, state-threatened—potential habitat in large gravel bars in Paddys Run—none found.
A survey for running buffalo clover was conducted in 2012, prior to the Paddys Run Tributary restoration project, with none found. DOE signed a Cooperative Agreement with the U.S. Fish and Wildlife Service and the Cincinnati Zoo to introduce the federally-endangered American burying beetle to the Fernald Preserve. Beetles are planned to be released in spring 2013 (DOE 2012b)

U.S
. Departm
ent of Energy
Fernald P
reserve 2012 Site E
nvironmental R
eport M
ay 2013 D
oc. No. S
09665
Page 27
Table 2 (continued). Compliance with Other Environmental Regulations
Regulation and Purpose Background Compliance Issues 2012 Compliance Activities
Floodplains/Wetlands Review Requirements DOE regulations require a floodplain/wetlands assessment for DOE construction and improvement projects.
A wetlands delineation of the Fernald Preserve, completed in 1992 and approved by the U.S. Army Corps of Engineers in August 1993, identified 36 acres (15 hectares) of freshwater wetlands on the Fernald Preserve property.
No assessments were performed in 2012.
National Historic Preservation Act Establishes a program for the protection, maintenance, and stewardship of federal prehistoric and historic properties.
The Fernald Preserve is located in an area of sensitive historic and prehistoric cultural resources that are eligible for or on the National Register of Historic Places. These cultural resources include historic structures, buildings, and bridges, plus Native American villages and campsites.
The Programmatic Agreement between DOE and the Ohio Historic Preservation Office was revised to change the reporting frequency to “as needed,” and to update site terminology. The updated agreement (DOE 2012c) reflects that LM is responsible for the site.
Native American Graves Protection and Repatriation Act Establishes a means for Native Americans to request the return or "repatriation" of human remains and other cultural items. Federal agencies must return human remains, associated funerary objects, sacred objects, and objects of cultural patrimony to the Native American nations or tribes with cultural affiliation to the remains or material.
Native American remains have been discovered during remediation activities at the Fernald Preserve. Native American remains and artifacts have been removed or left in place, with consultation from Native American nations, tribes, and groups.
No Native American remains were discovered or repatriated to Native American nations, tribes, or groups in 2012.

Fernald P
reserve 2012 Site E
nvironmental R
eport U
.S. D
epartment of E
nergy D
oc. No. S
09665 M
ay 2013 P
age 28
Table 2 (continued). Compliance with Other Environmental Regulations
Regulation and Purpose Background Compliance Issues 2012 Compliance Activities
Natural Resource Requirements Under CERCLA and Executive Order 12580 Requires DOE to act as a trustee (i.e., guardian) for natural resources at its federal facilities.
DOE and the other trustees, which include Ohio EPA and the U.S. Department of the Interior (administered by the U.S. Fish and Wildlife Service), meet regularly to discuss potential impact to natural resources and to coordinate trustee activities. The trustees also interact with the Fernald Community Alliance.
In November 2008, the State of Ohio and DOE reached a settlement of the 1986 Natural Resource injury claim at Fernald. While the components of restoration had been established through a 2001 Memorandum of Understanding (DOE 2001b) the State of Ohio and DOE settled outstanding issues such as the payment of monetary penalties, establishment of environmental covenants, and a mutually agreed upon Natural Resource Restoration Plan (NRRP), which is Appendix B of the Consent Decree Resolving Ohio’s Natural Resource Damage Claim against DOE (State of Ohio 2008). In 2009, activities commenced as required in the final NRRP. Activities in 2012 included construction of three onsite ecological restoration projects. Also, the Fernald Preserve Wetland Mitigation Monitoring Report (DOE 2012d) was finalized and approved by the Trustees. This report specified continuation of wetland monitoring through the site functional monitoring program. Additional monitoring activities included implementation monitoring of the ecological restoration projects, along with areas that were seeded in 2010. Section 6 provides a summary of Trustee activities and monitoring data.

U.S. Department of Energy Fernald Preserve 2012 Site Environmental Report May 2013 Doc. No. S09665 Page 29
2.2.6 Other Permits Certain environmental laws are implemented through permits. However, there are no other permits currently in effect other than the Fernald Preserve’s permit for discharging water under NPDES regulations discussed in Section 2.2.2. 2.2.7 Pollution Prevention and Source Reduction The Fernald Preserve is actively involved in an effort to reduce solid, hazardous, radioactive, and mixed waste generation and to eliminate or minimize pollutants released to all environmental media. Various waste streams were recycled during 2012, including:
5,776 lb (2,620 kg) of paper
106 lb (48.1 kg) of aluminum
147 lb (67 kg) of batteries
1,226 lb (556 kg) of electronic equipment (universal waste)
88 lb (40 kg) of toner cartridges
16,640 lb (7,548 kg) of iron/steel
9,392 lb (4,260 kg) of commingled cardboard, glass, plastic, and paper
4, 960 lb (2,245 kg) of baled hay (reused as soil amendment) The Fernald Preserve’s affirmative procurement program involves source reduction and the use of EPA-designated materials to increase the market for recovered materials. In accordance with Executive Order 13514, Federal Leadership in Environmental, Energy, and Economic Performance, and Executive Order 13423, Strengthening Federal Environmental, Energy and Transportation Management, the Fernald Preserve uses 30 percent post-recycled-content copier paper. The Fernald Preserve generated and submitted an annual report demonstrating compliance with these orders in December 2012. As part of the Annual Site Sustainability Plan required under DOE Order 436.1, the Fernald Preserve generated and submitted a summary report of waste generated and pollution prevention progress in December 2012 (DOE 2012e). 2.2.8 Federal Facilities Compliance Agreement In July 1986, DOE entered into a Federal Facility Compliance Agreement (FFCA) with EPA, which requires the Fernald Preserve to:
Maintain a sampling program for the South Plume extraction wells and report the results to EPA, Ohio EPA, and the Ohio Department of Health. The sampling program conducted to address this requirement has been modified over the years and is currently governed by an agreement reached with EPA and Ohio EPA on May 1, 1996. These data are reported in Appendix A.
Maintain a continuous sample collection program for radiological constituents at the treated effluent discharge point and report the results to EPA, Ohio EPA, and the Ohio Department of Health. The sampling program to address this requirement has been modified over the

Fernald Preserve 2012 Site Environmental Report U.S. Department of Energy Doc. No. S09665 May 2013 Page 30
years and is currently governed by an agreement reached with EPA and Ohio EPA that became effective May 1, 1996. These data are reported in Appendix B.
2.2.9 Environmental Management Systems Requirement DOE requires that sites develop and implement an Environmental Management System as a means of systematically planning, implementing, evaluating, and improving processes and actions undertaken to achieve environmental goals. This requirement is specified in DOE Order 436.1, Departmental Sustainability. The implementation of an Environmental Management System ensures that sound stewardship practices protective of the air, water, land, and other natural and cultural resources potentially affected by operations are employed throughout the project. An Environmental Management System is a systematic process for reducing the environmental impacts resulting from DOE and contractor work activities, products, and services and directs work to proceed in a manner that protects workers, the public, and the environment. The process adheres to “Plan-Do-Check-Act” principles, mandates environmental compliance, and integrates green initiatives into all phases of work, including scoping, planning, construction, subcontracts, and operations. Proposed site maintenance activities will be assessed for opportunities to improve environmental performance and sustainable environmental practices. Some areas for consideration include reusing and recycling products or wastes, using environmentally preferable products (i.e., products with recycled content, products with reduced toxicity; and energy efficient products), using alternative fuels and renewable energy, and making environmental habitat improvements. 2.3 Split Sampling Program Since 1987, DOE has participated in the split sampling program with Ohio EPA. Split samples are obtained when technicians alternately add portions of a sample to two individual sample containers. This collection method helps ensure that both samples are as close as possible to being identical. The split samples are then submitted to two analytical laboratories; this allows for an independent comparison of data to ascertain quality assurance for laboratory analysis and field sampling methods. Ohio EPA occasionally performs independent sampling in addition to split sampling. In 2012, DOE and Ohio EPA cooperated in the split sampling program. Table 3 provides the analytical results of split groundwater samples, and Figure 10 shows the split sample locations.
Table 3. 2012 DOE/Ohio EPA Groundwater Split Sampling Comparison
Sample Locationa
2012 Sample Date
Constituent DOE Result
(µg/L)b Ohio EPA
Result (µg/L) FRLc (µg/L)
2060 April Total Uranium 46.7 44.57 30
2060 November Total Uranium 36.9 37.2 30
13 April Total Uranium 12.10 11.24 30
13 November Total Uranium 8.14 8.38 30
14 April Total Uranium 3.84 3.70 30
14 November Total Uranium 3.47 4.08 30
a Refer to Figure 10 for groundwater split sample locations. b µg/L = micrograms per liter c The groundwater pathway and final remediation levels (FRL) are discussed in Section 3.

U.S. Department of Energy Fernald Preserve 2012 Site Environmental Report May 2013 Doc. No. S09665 Page 31
Figure 10. DOE and Ohio EPA Groundwater Split Sample Locations

Fernald Preserve 2012 Site Environmental Report U.S. Department of Energy Doc. No. S09665 May 2013 Page 32
This page intentionally left blank

U.S. Department of Energy Fernald Preserve 2012 Site Environmental Report May 2013 Doc. No. S09665 Page 33
Results in Brief: 2012 Groundwater Pathway
Groundwater Remedy
Since 1993 • 34,534 M gallons (130,711 M liters) of water have been pumped from
the Great Miami Aquifer. • 11,313 net lb (5,136 kg) of uranium have been removed from the
Great Miami Aquifer.
During 2012 • 2,351 M gallons (8,899 M liters) of water were pumped from the
Great Miami Aquifer. • 508 lb (231 kg) of uranium were removed from the Great Miami Aquifer.
Groundwater Monitoring Results—The data collected in 2012 indicate that uranium concentrations within the footprint of the maximum uranium plume continue to decrease in response to pumping. The footprint of the maximum uranium plume in 2012 was approximately 130 acres (a decrease of approximately 9.7 percent from what was mapped in 2011 [144 acres]). Groundwater elevation data continue to show that the uranium plume is being captured by the pumping wells. OSDF Monitoring—In 2012, the leachate collection system, leak detection system, and Great Miami Aquifer wells of each cell were sampled quarterly for up to 23 parameters. The horizontal till well of each cell was sampled for uranium, arsenic, sodium, and sulfate. The leachate collection system was sampled annually for Ohio Administrative Code 3745-27-10 Appendix I constituents and PCBs. Flow data from the engineered facility, coupled with the water quality monitoring results and the results of quarterly disposal facility physical inspections, indicate that the facility performed as designed in 2012.
Groundwater Modeling at the Fernald Preserve
The Fernald Preserve uses a computer model to make predictions about how the concentration/location of contaminants in the aquifer will change over time. Because the model contains simplifying assumptions about the aquifer and the contaminants, the predictions about future behavior must be verified with laboratory analyses of groundwater samples collected during monitoring activities.
If groundwater monitoring data indicate the need for operational changes to the groundwater remedy, the groundwater model is run to predict the effect those changes might have on the aquifer and the contaminants. If the predictions indicate the proposed changes would increase cleanup efficiency and reduce the cleanup time and cost, the operational changes are made, and monitoring data are collected after the changes to verify whether model predictions were correct. If model predictions prove to be incorrect, modifications are made to the model to improve its predictive capabilities.
3.0 Groundwater Pathway
This section provides background information on the nature and extent of groundwater contamination in the Great Miami Aquifer due to past operations at the Fernald Preserve and summarizes aquifer restoration progress and groundwater monitoring activities and results for 2012. Restoration of the affected portions of the Great Miami Aquifer and continued protection of the groundwater pathway are primary considerations in the groundwater remediation strategy for the Fernald Preserve. The groundwater
pathway will continue to be monitored following remediation to ensure the protection of this primary exposure pathway. 3.1 Summary of the Nature and Extent of Groundwater Contamination
The nature and extent of groundwater contamination from operations at the Fernald site were investigated, and the risk to human health and the environment from those contaminants was evaluated in the Operable Unit 5 Remedial Investigation Report (DOE 1995b). As documented in that report, the primary groundwater contaminant at the site is uranium. Groundwater contamination resulted
from infiltration of contaminated surface water through the bed of Paddys Run, the storm sewer outfall ditch (SSOD), the Pilot Plant drainage ditch, and the Old Drainage Ditch from the Plant 1 Pad. The footprint of the 30 µg/L uranium plume within the aquifer is shown on Figure 11. In these areas, the glacial overburden is absent (eroded), creating a direct pathway between surface water and the sand and gravel of the aquifer. To a lesser degree, groundwater contamination also resulted where past excavations (such as the waste pits) removed some of the protective clay contained in the glacial overburden and exposed the aquifer to contamination.

Fernald Preserve 2012 Site Environmental Report U.S. Department of Energy Doc. No. S09665 May 2013 Page 34
Figure 11. Extraction Wells Active in 2012

U.S. Department of Energy Fernald Preserve 2012 Site Environmental Report May 2013 Doc. No. S09665 Page 35
Re-injection at the Fernald Site From 1998 to 2004, re-injection was an enhancement to the groundwater remedy at the Fernald site, supplementing pump-and-treat operations. The term "well-based" refers to the injection of treated groundwater through specially designed re-injection wells. Groundwater pumped from the aquifer was treated via ion exchange to remove contaminants and then re-injected into the aquifer at strategic well locations. Because the treatment process was not 100 percent efficient, a small amount of uranium was re-injected into the aquifer with the treated water. The re-injected groundwater increased the speed at which dissolved contaminants moved through the aquifer and were pulled by extraction wells, thereby decreasing the overall remediation time. Based on updated groundwater modeling and the unfavorable results of a cost/benefit analysis, well-based re-injection was discontinued in 2004.
3.2 Selection and Design of the Groundwater Remedy While a remedial investigation and feasibility study was in progress and a groundwater remedy was being selected, off-property contaminated groundwater was being pumped from the South Plume area by the South Plume Removal Action System (referred to as the South Plume Module). In 1993, this system was installed south of Willey Road and east of Paddys Run Road to stop the uranium plume in this area from migrating any farther to the south. Figure 11 shows South Plume Module extraction wells 3924, 3925, 3926, and 3927. These extraction wells have successfully stopped further southern migration of the uranium plume beyond the wells and have contributed to significantly reducing total uranium concentrations in the off-property portion of the plume. After the nature and extent of groundwater contamination was defined in the Remedial Investigation Report for Operable Unit 5 (DOE 1995b), various remediation technologies were evaluated in the Feasibility Study Report for Operable Unit 5 (DOE 1995c). Remediation cost and various land-use scenarios were considered during the development of the preferred remedy for restoring the quality of groundwater in the aquifer. The Feasibility Study Report for Operable Unit 5 recommended a concentration-based, pump-and-treat remedy for the groundwater contaminated with uranium, consisting of 28 groundwater extraction wells located on and off property. Computer modeling suggested that the 28 extraction wells pumping at a combined rate of 4,000 gallons per minute (gpm) (15,140 liters per minute [Lpm]) would remediate the aquifer within 27 years. The recommended groundwater remedy, which included state and community acceptance, was presented in the Proposed Plan for Operable Unit 5 (DOE 1995d) as the preferred groundwater remedy. Once the proposed plan was approved, the Record of Decision for Remedial Actions at Operable Unit 5 (OU5 ROD) (DOE 1996) was issued. The OU5 ROD formally defines the selected groundwater remedy and establishes final remediation levels (FRLs) for all constituents of concern.
The OU5 ROD commits to an ongoing evaluation of innovative remediation technologies so that remedy performance can be improved as such technologies become available. As a result of this commitment, an enhanced groundwater remedy was presented in the Operable Unit 5 Baseline Remedial Strategy Report, Remedial Design for Aquifer Restoration (Task 1) (DOE 1997).
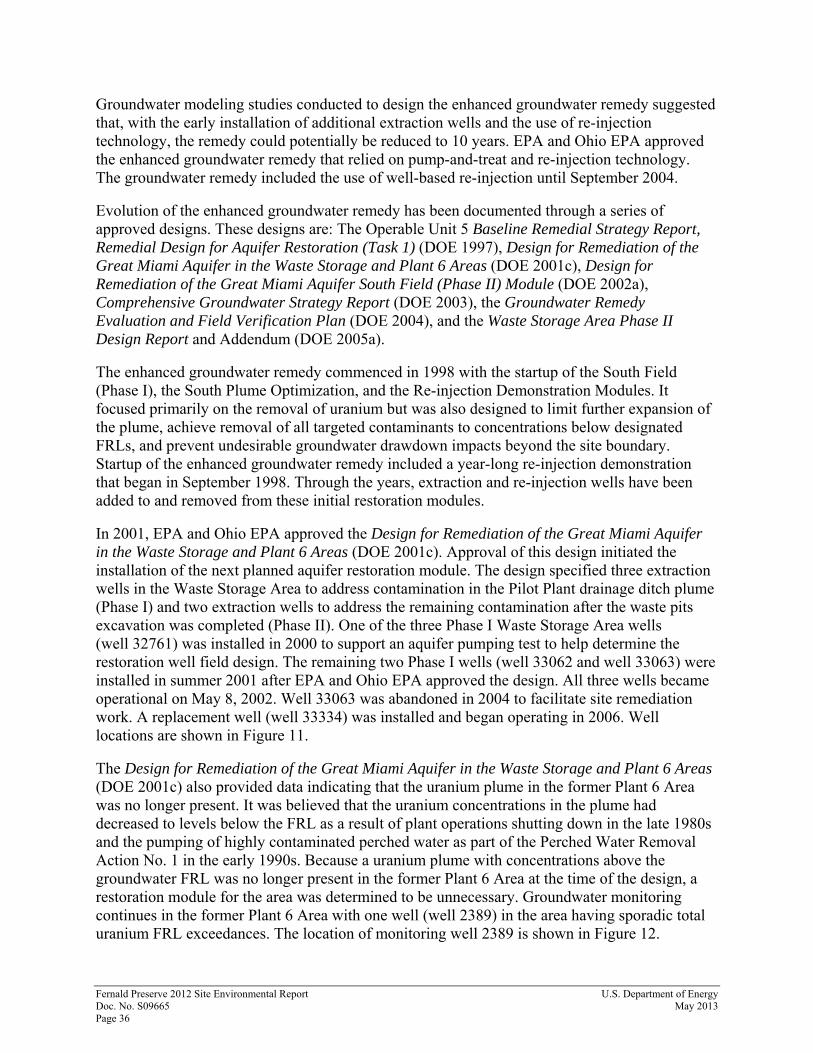
Fernald Preserve 2012 Site Environmental Report U.S. Department of Energy Doc. No. S09665 May 2013 Page 36
Groundwater modeling studies conducted to design the enhanced groundwater remedy suggested that, with the early installation of additional extraction wells and the use of re-injection technology, the remedy could potentially be reduced to 10 years. EPA and Ohio EPA approved the enhanced groundwater remedy that relied on pump-and-treat and re-injection technology. The groundwater remedy included the use of well-based re-injection until September 2004. Evolution of the enhanced groundwater remedy has been documented through a series of approved designs. These designs are: The Operable Unit 5 Baseline Remedial Strategy Report, Remedial Design for Aquifer Restoration (Task 1) (DOE 1997), Design for Remediation of the Great Miami Aquifer in the Waste Storage and Plant 6 Areas (DOE 2001c), Design for Remediation of the Great Miami Aquifer South Field (Phase II) Module (DOE 2002a), Comprehensive Groundwater Strategy Report (DOE 2003), the Groundwater Remedy Evaluation and Field Verification Plan (DOE 2004), and the Waste Storage Area Phase II Design Report and Addendum (DOE 2005a). The enhanced groundwater remedy commenced in 1998 with the startup of the South Field (Phase I), the South Plume Optimization, and the Re-injection Demonstration Modules. It focused primarily on the removal of uranium but was also designed to limit further expansion of the plume, achieve removal of all targeted contaminants to concentrations below designated FRLs, and prevent undesirable groundwater drawdown impacts beyond the site boundary. Startup of the enhanced groundwater remedy included a year-long re-injection demonstration that began in September 1998. Through the years, extraction and re-injection wells have been added to and removed from these initial restoration modules. In 2001, EPA and Ohio EPA approved the Design for Remediation of the Great Miami Aquifer in the Waste Storage and Plant 6 Areas (DOE 2001c). Approval of this design initiated the installation of the next planned aquifer restoration module. The design specified three extraction wells in the Waste Storage Area to address contamination in the Pilot Plant drainage ditch plume (Phase I) and two extraction wells to address the remaining contamination after the waste pits excavation was completed (Phase II). One of the three Phase I Waste Storage Area wells (well 32761) was installed in 2000 to support an aquifer pumping test to help determine the restoration well field design. The remaining two Phase I wells (well 33062 and well 33063) were installed in summer 2001 after EPA and Ohio EPA approved the design. All three wells became operational on May 8, 2002. Well 33063 was abandoned in 2004 to facilitate site remediation work. A replacement well (well 33334) was installed and began operating in 2006. Well locations are shown in Figure 11. The Design for Remediation of the Great Miami Aquifer in the Waste Storage and Plant 6 Areas (DOE 2001c) also provided data indicating that the uranium plume in the former Plant 6 Area was no longer present. It was believed that the uranium concentrations in the plume had decreased to levels below the FRL as a result of plant operations shutting down in the late 1980s and the pumping of highly contaminated perched water as part of the Perched Water Removal Action No. 1 in the early 1990s. Because a uranium plume with concentrations above the groundwater FRL was no longer present in the former Plant 6 Area at the time of the design, a restoration module for the area was determined to be unnecessary. Groundwater monitoring continues in the former Plant 6 Area with one well (well 2389) in the area having sporadic total uranium FRL exceedances. The location of monitoring well 2389 is shown in Figure 12.
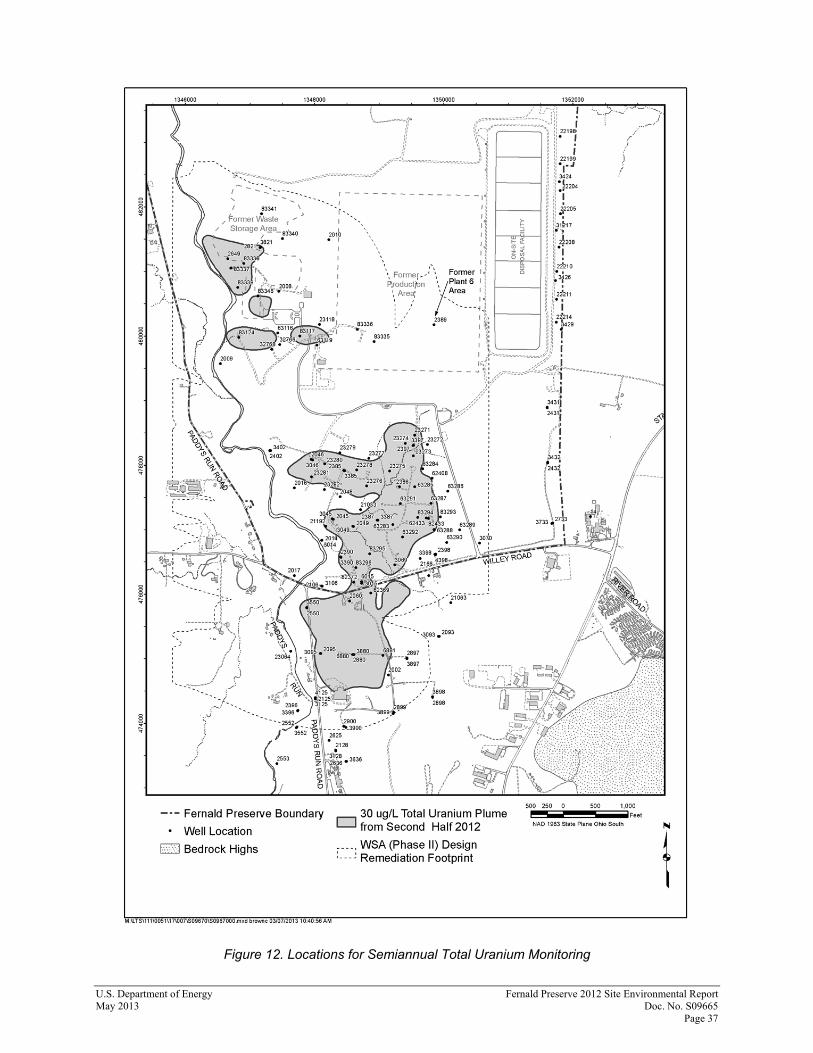
U.S. Department of Energy Fernald Preserve 2012 Site Environmental Report May 2013 Doc. No. S09665 Page 37
Figure 12. Locations for Semiannual Total Uranium Monitoring

Fernald Preserve 2012 Site Environmental Report U.S. Department of Energy Doc. No. S09665 May 2013 Page 38
In 2002, EPA and Ohio EPA approved the next planned groundwater restoration design document, the Design for Remediation of the Great Miami Aquifer South Field (Phase II) Module (DOE 2002a). The Phase II design presents an updated interpretation of the uranium plume in the South Field area along with recommendations on how to proceed with remediation in the area, based on the updated plume interpretation. Installation of Phase II components was initiated in 2002. The overall system (Phases I and II) is referred to as the South Field Module. In 2003, groundwater remediation approaches were evaluated to determine the most cost-effective groundwater remedy infrastructure, including the wastewater treatment facility, to remain after site closure. An evaluation of alternatives was presented in the Comprehensive Groundwater Strategy Report (DOE 2003). In October 2003, initial discussions were held with the regulators and the public concerning the various alternatives identified in the report. These discussions culminated in an identified path forward to work collaboratively with the Fernald Citizens Advisory Board, EPA, and Ohio EPA to determine the most appropriate course of action for the ongoing aquifer restoration and water treatment activities at the Fernald site. In 2004, a decision regarding the future aquifer restoration and wastewater treatment approach was made following regulatory and public input. In May, EPA and Ohio EPA approved the decision to reduce the size of the advanced wastewater treatment facility; in June, they approved the decision to discontinue the use of well-based re-injection. Reducing the size of the advanced wastewater treatment facility provided the opportunity to dismantle and dispose of approximately 90 percent of the existing facility in the OSDF in time to meet the 2006 closure schedule. This resulted in a protective, more cost-effective, long-term water treatment facility to complete aquifer restoration. Well-based re-injection was discontinued in 2004 on the basis of groundwater modeling cleanup predictions presented in the Comprehensive Groundwater Strategy Report (DOE 2003) and the Groundwater Remedy Evaluation and Field Verification Plan (DOE 2004). The updated modeling indicated that the aquifer restoration time frame would likely be extended beyond dates previously predicted as a result of refined modeling input. The updated modeling also indicated that continued use of the groundwater re-injection wells would shorten the aquifer remedy by approximately 3 years. Therefore, the benefit of continuing re-injection did not justify the cost. Well-based re-injection was discontinued in September 2004 to support construction of the Converted Advanced Wastewater Treatment facility (CAWWT). All re-injection wells remain in place as potential groundwater remedy performance monitoring locations. In 2005, the Waste Storage Area Phase II Design Report (DOE 2005a) was issued. Comments received from EPA and Ohio EPA resulted in the issuance of an addendum to the report in December 2005. The design consisted of the installation of one more extraction well (well 33347) in the former Waste Storage Area, near the former silos area. Well 33347 is shown in Figure 11. In 2005, an infiltration test was conducted in the SSOD. The test consisted of gauging the flow into and out of the SSOD with six Parshall flumes to obtain the overall infiltration rate along the SSOD. Findings from the test were included in the Storm Sewer Outfall Ditch Infiltration Test Report (DOE 2005b). The decision was made that natural storm water flow into the SSOD will be supplemented with pumped clean groundwater. This activity was conducted from 2006 through 2012. In 2012, DOE concluded that enough data had been collected to document infiltration rates through the base of the SSOD. Under normal flow conditions, potential infiltration to the aquifer

U.S. Department of Energy Fernald Preserve 2012 Site Environmental Report May 2013 Doc. No. S09665 Page 39
from within the monitored portion of the SSOD (while flowing at or near 500 gpm (1,893 Lpm) is approximately 109 to 129 gpm (413 to 488 Lpm). With OEPA and EPA concurrence, the flumes are scheduled to be removed in 2013 to allow water to flow down the SSOD unencumbered by the flumes. The rapid movement of water through the ditch during storm events will help to scour the ditch channel of fine-grained sediment and should increase the potential for infiltration. The Fernald Groundwater Certification Plan (DOE 2006a) was issued and approved by EPA in 2005. Ohio EPA approved Revision 2 of the plan in 2006. Revision 2 addressed comments that Ohio EPA had on the 2005 submittal. The certification plan defines a programmatic strategy for certifying completion of the aquifer remedy. It was developed through a series of four technical information exchange meetings held in 2005 among DOE, EPA, and Ohio EPA. The Fernald Groundwater Certification Plan (DOE 2006a) identifies that the IEMP will continue to be the plan that includes remedy performance monitoring requirements. In 2006, the Waste Storage Area Phase II Module components became operational, marking completion of the groundwater remediation system design. Completion of the Waste Storage Area Phase II Module brought the total number of extraction wells in the former Waste Storage Area to four (wells 32761, 33062, 33334, and 33347). These four well locations are shown in Figure 11. Figure 11 shows the extraction well locations that were active in 2012. The operational information associated with these modules is presented in the following subsections. 3.3 Groundwater Monitoring Highlights for 2012 For this annual site report, groundwater monitoring results are discussed in terms of restoration and compliance monitoring. The key elements of the Fernald Preserve groundwater monitoring program design are described below. Sampling—Sample locations, frequency, and constituents address operational assessment, restoration assessment, and compliance requirements. Monitoring is conducted to ascertain groundwater quality and groundwater flow direction. As part of the comprehensive groundwater monitoring program specified in the current IEMP, 140 wells were monitored for water quality in 2012. Figure 13 is a diagram of a typical groundwater monitoring well. Figure 14 illustrates monitoring well depths and screen locations. Figure 14 and Figure 15 identify the locations of the current water quality monitoring wells. In addition to water quality monitoring, 178 wells were monitored quarterly for groundwater elevations to verify groundwater flow direction. Figure 16 depicts the routine water level (groundwater elevation) monitoring wells. Additionally, 18 locations were sampled using a direct-push sampling tool in 2012. Results are provided in Appendix A, Attachment A.2.

Fernald Preserve 2012 Site Environmental Report U.S. Department of Energy Doc. No. S09665 May 2013 Page 40
Figure 13. Diagram of a Typical Groundwater Monitoring Well

U.S. Department of Energy Fernald Preserve 2012 Site Environmental Report May 2013 Doc. No. S09665 Page 41
Figure 14. Monitoring Well Relative Depths and Screen Locations

Fernald Preserve 2012 Site Environmental Report U.S. Department of Energy Doc. No. S09665 May 2013 Page 42
Figure 15. Locations for Semiannual Non-Uranium Monitoring

U.S. Department of Energy Fernald Preserve 2012 Site Environmental Report May 2013 Doc. No. S09665 Page 43
Figure 16. Groundwater Elevation Monitoring Wells

Fernald Preserve 2012 Site Environmental Report U.S. Department of Energy Doc. No. S09665 May 2013 Page 44
Data Evaluation—The integrated data evaluation process involves review and analysis of the data collected from wells and direct-push sampling locations to determine capture and restoration of the uranium plume, capture and restoration of non-uranium FRL constituents, water quality conditions in the aquifer that indicate a need to modify the design and installation of restoration modules, and the impact of ongoing groundwater restoration on the Paddys Run Road Site plume (a separate contaminant plume unrelated to the Fernald Preserve, resulting from industrial activities in the area located south of the Fernald Preserve along Paddys Run Road). Reporting—All data are reported in the annual Site Environmental Reports. 3.3.1 Restoration Monitoring In general, restoration monitoring tracks the progress of the pump-and-treat stage of the groundwater remedy and water quality conditions. All operational modules are evaluated during the year to determine the progress of aquifer remediation. Uranium concentration maps are developed from analytical data and compared with groundwater elevation maps to verify capture of the uranium plume. Appendix A provides more-detailed information. Sections that follow identify the specific attachment of Appendix A where the detailed information can be found. 3.3.1.1 Operational Summary The amount of groundwater that needs to be treated to maintain compliance with the monthly average uranium discharge concentration limit has decreased dramatically since the remediation began. The aquifer remedy can now achieve the uranium discharge limits (i.e., average monthly concentration of less than 30 micrograms per liter [µg/L] and 600 lb [272 kg] annually) established in the OU5 ROD without groundwater treatment. In 2011, DOE, EPA, and Ohio EPA agreed to proceed with reducing the treatment capacity of the CAWWT from approximately 1,800 gpm (6,814 Lpm) to 500 to 600 gpm (1,893 to 2,271 Lpm). In September 2012, with concurrence from EPA and Ohio EPA, a pulse pumping exercise was initiated at extraction wells 31550, 31560, 31561, and 33061. These four wells are equipped with pumps and motors that operate most efficiently at rates of approximately 300 gpm. The Waste Storage Area (Phase-II) Model Design calls for a target pumping rate of 100 gpm for each of these wells. The 100 gpm rate was being achieved by throttling back on the flow from each of the wells; however, this type of operation was not energy efficient. To become more energy efficient, the wells are being pumped at a higher rate for a shorter period of time each day in order to remove the daily volume of water prescribed by the Waste Storage Area (Phase II) Design (DOE 2005). Specifically, the wells are being pumped for 300 gpm for 8 hours a day (a total of 144,000 gallons per day) rather than 100 gpm for 24 hours a day (a total of 144,000 gallons per day). Flow and particle path monitoring predictions indicate that capture of the 30 µg/L uranium plume will be maintained by the new pumping schedule. Figure 11 shows the extraction well locations associated with the restoration modules operating in 2012. Table 4 summarizes the mass of uranium removed and the volume of groundwater pumped during 2012. Unplanned operational disruptions in 2012 were minimal. Additional

U.S. Department of Energy Fernald Preserve 2012 Site Environmental Report May 2013 Doc. No. S09665 Page 45
details are provided in the module operational summaries in Sections 3.3.1.2 through 3.3.1.4. Figure 17 identifies the yearly and cumulative mass of uranium removed from the Great Miami Aquifer from 1993 through 2012. Since 1993:
34.534 M gallons (130,711 M liters) of water have been pumped from the Great Miami Aquifer.
1,936 M gallons (7,328 M liters) of treated water have been re-injected into the Great Miami Aquifer.
11,313 net lb (5,136 kg) of total uranium have been removed from the Great Miami Aquifer. Appendix A, Attachment A.1, provides detailed operational information on each extraction well. The following sections provide an overview of the individual modules.
Table 4. Groundwater Restoration Module Status for 2012
Modules and Restoration Wells
Target Pumpinga Volume Pumped
(Millions) Uranium Removedb
gpm Lpm gallons liters lb kg
South Plume/ South Plume Optimization Module: 3924, 3925, 3926, 3927, 32308, 32309
1,200 4,542 601 2,275 95 43
South Field Module: 31550, 31560, 31561, 32276, 32446, 32447, 33061, 33262, 33264, 33265, 33266, 33298, 33326
2,575 9,746 1,244 4,709 316 143
Waste Storage Area Module: 32761, 33062, 33334, 33347
1,000 3,785 506 1,915 98 44
Aquifer Restoration System Total Pumped
4,775 18,073 2,351 8,899 509 230
a gpm = gallons per minute, Lpm = liters per minute. b lb = pounds, kg = kilograms

Fernald P
reserve 2012 Site E
nvironmental R
eport U
.S. D
epartment of E
nergy D
oc. No. S
09665 M
ay 2013 P
age 46
Figure 17. Net Mass of Uranium Removed from the Great Miami Aquifer, 1993–2012
58
67
99
77
88 42
5 698
845
867 1,
226
1,15
1
923
602
673
653
677
585
551
544
508
58
125
224
301
389 81
4
1,50
9 2,35
6 3,22
3
4,44
9
5,60
0
6,52
2 7,12
4 7,79
7 8,45
0 9,12
6 9,71
1 10,2
61
10,8
05
11,3
13
0
1,000
2,000
3,000
4,000
5,000
6,000
0
2,000
4,000
6,000
8,000
10,000
12,000
14,000
1993 1994 1995 1996 1997 1998 1999 2000 2001 2002 2003 2004 2005 2006 2007 2008 2009 2010 2011 2012
Mas
s (k
ilogr
ams)
Mas
s (p
ound
s)
Date (year)
Yearly Cumulative

U.S. Department of Energy Fernald Preserve 2012 Site Environmental Report May 2013 Doc. No. S09665 Page 47
3.3.1.2 South Plume/South Plume Optimization Module Operational Summary The four extraction wells (3924, 3925, 3926, and 3927) of the South Plume Module began operating in August 1993. The two extraction wells (32308 and 32309) of the South Plume Optimization Module began operating in August 1998. Figure 18 illustrates the southern extent of capture observed for the South Plume/South Plume Optimization Module in the fourth quarter of 2012. During 2012, 601 M gallons (2,275 M liters) of groundwater and 95 lb (43 kg) of uranium were removed from the Great Miami Aquifer by the South Plume/South Plume Optimization Module. Based on analysis of the data collected in 2012, the module continues to meet its primary objectives as demonstrated by the following:
Southward movement of the uranium plume beyond the southernmost extraction wells has not been detected.
Active remediation of the central portion of the off-property uranium plume continues to reduce plume concentration. Nearly the entire off-property uranium plume concentration is now below 100 µg/L. When pumping began in 1993, areas in the off-property uranium plume had concentrations over 300 µg/L.
Paddys Run Road Site plume, located south of the extraction wells, is not being pulled toward the South Plume Extraction Wells.
3.3.1.3 South Field Module Operational Summary The South Field Module was constructed in two phases. Phase I began operating in July 1998, and Phase II began operating in July 2003. During 2012, 13 extraction wells were operational. The 10 original extraction wells installed under Phase I were 31550, 31560, 31561, 31562, 31563, 31564, 31565, 31566, 31567, and 32276. Six of the original 10 wells have been shut down (31564, 31565, 31566, 31563, 31562, and 31567).
Extraction wells 31564 and 31565 were shut down in December 2001 and May 2001, respectively, because these wells were located near the upgradient edge of the plume, uranium concentrations in that region of the aquifer were low, and soil remediation was underway in the area around the wells.
Extraction well 31566 was shut down in August 1998 and was replaced by extraction well 33262, which was installed as part of South Field (Phase II) Module.
Extraction well 31563 was shut down in December 2002 and converted to a re-injection well that operated in 2003 and 2004.
Extraction well 31562 was shut down in March 2003 and replaced by extraction well 33298.
Extraction well 31567 was shut down in September 2005 and replaced by extraction well 33326.

Fernald Preserve 2012 Site Environmental Report U.S. Department of Energy Doc. No. S09665 May 2013 Page 48
Figure 18. Total Uranium Plume in the Aquifer with Concentrations Greater Than 30 µg/L at the End of 2012

U.S. Department of Energy Fernald Preserve 2012 Site Environmental Report May 2013 Doc. No. S09665 Page 49
Three new extraction wells (32446, 32447, and 33061) were added to the South Field Module between 1998 and 2002. These new wells were installed in the eastern, downgradient portion of the South Field plume, at locations where total uranium concentrations were considerably above the FRL. Two of these three wells (32446 and 32447) were installed in late 1999 and began pumping in February 2000. The third extraction well (33061) was installed in 2001 and became operational in 2002. Phase II components of the South Field Module are described in the Design for Remediation of the Great Miami Aquifer, South Field (Phase II) Module (DOE 2002b), which was issued in May 2002. The design provides an updated characterization of the uranium plume in the Great Miami Aquifer beneath the southern portion of the site and a modeled design for the South Field Module located in that area. All Phase II design components became operational in 2003. The components include:
Four additional extraction wells, one in the former Southern Waste Units area (extraction well 33262) and three along the eastern edge of the on-property portion of the southern uranium plume (extraction wells 33264, 33265, and 33266).
One additional re-injection well in the former Southern Waste Units area (re-injection well 33263).
An extraction well (31563) that was converted into a re-injection well.
An injection pond that was located in the western portion of the former Southern Waste Units excavations.
South Field Module re-injection components were shut down in September 2004. During 2012, the South Field Module removed 1,244 M gallons (4,709 M liters) of groundwater and 316 lb (143 kg) of uranium from the Great Miami Aquifer. 3.3.1.4 Waste Storage Area Module Operational Summary The Waste Storage Area Module was constructed in two phases. Phase I became operational on May 8, 2002, nearly 17 months ahead of the October 1, 2003, start date established in the Operable Unit 5 Remedial Action Work Plan. Phase I consisted of three extraction wells (32761, 33062, and 33063). These three wells were installed to remediate a uranium plume in the Pilot Plant drainage ditch area, according to the Design for Remediation of the Great Miami Aquifer in the Waste Storage and Plant 6 Areas (DOE 2001c). In July 2004, extraction well 33063 was plugged and abandoned to make way for surface excavation activities required for site remediation. A replacement well for extraction well 33063 was installed in 2005 (extraction well 33334) and became operational June 29, 2006. Phase II consisted of one additional extraction well (extraction well 33347), which became operational on October 5, 2006. During 2012, 506 M gallons (1,915 M liters) and 98 lb (44 kg) of uranium were removed from the Great Miami Aquifer through the Waste Storage Area Module.

Fernald Preserve 2012 Site Environmental Report U.S. Department of Energy Doc. No. S09665 May 2013 Page 50
Geoprobe (Direct-Push Sampling) The Geoprobe, a hydraulically powered, direct-push sampling tool, is used at the Fernald Preserve to obtain groundwater samples at specific intervals without installing a permanent monitoring well. Direct-push means that the tool employs the weight of the vehicle it is mounted on and percussive force (hammering) to push into the ground without drilling (or cutting) to displace soil in the tool’s path. The Fernald Preserve uses this technique to collect data on the progress of aquifer restoration and to determine the optimal location and depth of additional monitoring and extraction wells that may be installed in the future.
The Waste Storage Area (Phase II) Design remediation footprint illustrates how far a particle of water will travel in response to pumping over the 16-year time period modeled for the Waste Storage Area (Phase II) Design.
3.3.1.5 Monitoring Results for Total Uranium
Total uranium is the primary FRL constituent because it is the most prevalent site contaminant, and it has affected the largest area of the aquifer. Figure 18 shows general groundwater flow directions observed during the fourth quarter of 2012 and the interpretation of the uranium plume in the aquifer updated through the end of 2012. The shaded
areas represent the interpreted size of the maximum uranium plume that is above the 30 µg/L groundwater FRL for total uranium. Data collected in 2012 indicate that uranium concentrations within the footprint of the maximum uranium plume continue to decrease. At the end of 2012, the footprint of the maximum total uranium plume was approximately 130 acres (53 hectares), a decrease of approximately 9.7 percent from 2011 (144 acres [58 hectares]). Capture observed during the fourth quarter of 2012 for the active restoration modules is also identified in Figure 18. The map indicates that the existing extraction system is capturing the South Plume and preventing further movement of uranium to the south of the extraction wells. Figure 18 also depicts the time-of-travel remediation footprint that was predicted by modeling the Waste Storage Area (Phase II) Remediation Design. Appendix A, Attachment A.2, provides detailed uranium plume maps for 2012. Appendix A, Attachment A.3, provides quarterly groundwater elevation maps and capture interpretations, along with graphical displays of groundwater elevation data. Highlights for 2012 for the former Waste Storage Area, former Plant 6 Area, and South Field/South Plume area are provided below.
Former Waste Storage Area—This area includes the Pilot Plant Drainage Ditch (PPDD) plume. The mapped footprint of the maximum uranium plume in the Former Waste Storage Area at the end of 2012 was 21.08 acres (8.53 hectares). This is a decrease of 19.84 percent from the 2011 estimate of 26.3 acres (10.6 hectares). In 2012, direct-push samples were collected from six locations in the former Waste Storage Area to supplement routine sampling of monitoring wells. Data was used to separate the Waste
Storage Area plume into a north Waste Storage Area plume, a south Waste Storage Area plume, an east PPDD plume and a west PPDD plume. Data are presented in Appendix A, Attachment A.2. Figure 18 shows the outline of the maximum uranium plumes in the former Waste Storage Area, as measured during the second half of 2012. Former Plant 6 Area—Plans for a restoration module in the former Plant 6 Area were abandoned in 2001 based on the outcome of the Design for Remediation of the Great Miami Aquifer in the Waste Storage and Plant 6 Areas (DOE 2001c). The design data indicated that the total uranium plume in the former Plant 6 Area was no longer present. EPA and Ohio EPA concurred with this decision. Monitoring in the area continues.

U.S. Department of Energy Fernald Preserve 2012 Site Environmental Report May 2013 Doc. No. S09665 Page 51
Monitoring well 2389 is the only well remaining in the area. Sporadic uranium FRL exceedances were detected at this well again in 2012. As discussed in past reports, sporadic FRL exceedances occur in this area when the water table in the aquifer is above 515 ft [156.9 m] mean sea level. The two samples collected in 2012 at monitoring well 2389 had uranium concentrations of 49.3 μg/L and 52.1 μg/L. Both samples were collected at an elevation of approximately 515 ft (157 m) above mean sea level. The Former Plant 6 area will continue to be targeted for additional direct-push sampling when the water table is high to determine if the uranium groundwater FRL exceedance is dissipating over time. South Field and South Plume Areas—The mapped footprint of the South Field/South Plume Maximum Uranium Plume for 2012 was 109 acres (44.1 hectares), a reduction of approximately 7.6 percent from the 2011 interpretation (118 acres [47.8 hectares]). Direct-push samples were collected at 12 locations. Direct-push data for 2012 are presented in Appendix A, Attachment A.2. An off-property portion of the uranium plume (just south of Willey Road) was better delineated in 2011 by the collection of direct-push data. The plume area appears to be impacted by a stagnation zone within the aquifer. Stagnation zones are created by the competition of extraction wells for water within the aquifer. The water in a stagnation zone is essentially pulled from different directions, resulting in its being held in place rather than moving toward an extraction well. This has the potential to extend remediation completion times. Potential ways to improve the aquifer remedy in this area are being explored to see if remediation of the lobe can be improved. Results are scheduled for release in 2013. 3.3.1.6 Monitoring Results for Non-Uranium Constituents Although the groundwater remedy is primarily targeting remediation of the uranium plume, other FRL constituents within the uranium plume are also being monitored. Figure 19 identifies the locations of the wells that had non-uranium FRL exceedances. Table 5 shows the number of wells with constituents exceeding FRLs in 2012, the number of wells with constituents exceeding FRLs outside the Waste Storage Area (Phase II) remediation footprint, the groundwater FRLs, and the range of 2012 data inside and outside the Waste Storage Area (Phase II) remediation footprint. During 2012, seven non-uranium FRL constituents had FRL exceedances. Exceedance locations are shown in Figure 19. Several of the locations are outside the Waste Storage Area (Phase II) remediation footprint. No plumes for the non-uranium constituents above FRLs at the locations outside the Waste Storage Area (Phase II) remediation footprint were identified in the extensive groundwater characterization efforts evaluated as part of the Remedial Investigation Report for Operable Unit 5 (DOE 1995b).

Fernald Preserve 2012 Site Environmental Report U.S. Department of Energy Doc. No. S09665 May 2013 Page 52
Table 5. Non-Uranium Constituents with Results Above FRLs During 2012
Constituent
Number of Wells
Exceeding the FRL
Number of Wells Exceeding the
FRL Outside the Waste Storage Area (Phase II) Remediation
Footprint
Groundwater FRLa
Range of 2012 Data Inside the Waste Storage Area (Phase II) Remediation Footprinta,b
Range of 2012 Data Outside the
Waste Storage Area (Phase II) Remediation Footprinta,b
General Chemistry (mg/L) (mg/L) (mg/L) Nitrate/Nitrite as N 9 0 11c 13.4 to 64.7 NA
Inorganics (mg/L) Lead 1 1 0.015 NA 0.0168 Manganese 6 3 0.90 1.60 to 6.74 0.964 to 1.92 Molybdenum 1 0 0.10 0.903 to 1.09 NA Zinc 2 2 0.021 NA 0.0468 to 0.0635
Volatile Organics (g/L) (g/L) (g/L) Trichloroethene 2 0 5.0 5.35 to 23.7 NA
Radionuclides (pCi/L) (pCi/L) (pCi/L) Technetium-99 7 0 94 94.5 to 1030 NA
a mg/L = milligrams per liter, g/L = micrograms per liter, pCi/L = picocuries per liter b NA = not applicable c FRL based on nitrate, from OU5 ROD, Table 9−4; however, the sampling results are for nitrate/nitrite as nitrogen.
Non-uranium constituents with FRL exceedances at the well locations outside the Waste Storage Area (Phase II) remediation footprint were further evaluated to determine if they were random events or if they were persistent according to criteria discussed in Appendix A, Attachment A.4. Two of the exceedances in 2012 were classified as persistent (manganese at monitoring well 22204 and monitoring well 22217). In past years, many of the exceedances identified as persistent became nonpersistent in later years. A change in the design of the aquifer remedy to address the persistent exceedance at monitoring wells 22204 and 22217 is not planned. Additional sampling for manganese near the OSDF was conducted in 2008 (and reported in the 2008 Fernald Preserve Site Environmental Report [DOE 2009]) to determine if a localized manganese plume was present. Results did not support the presence of a localized manganese plume. The manganese FRL is 0.90 mg/L and is based on background values in the aquifer. Unconsolidated glaciofluvial aquifers in Ohio have relatively high manganese concentrations naturally. Manganese is an impurity in shale, which is a major component of bedrock in the area. The background value upon which the groundwater FRL is based may not be representative of the aquifer. 3.3.2 Other Monitoring Commitments Two other groundwater monitoring activities are included in the IEMP: private well monitoring and property boundary monitoring. As stated earlier, the groundwater data from these activities, along with the data from all other IEMP groundwater monitoring activities, are collectively evaluated for total uranium and, where necessary, non-uranium constituents of concern. The discussion that follows provides additional details on the two compliance monitoring activities.

U.S. Department of Energy Fernald Preserve 2012 Site Environmental Report May 2013 Doc. No. S09665 Page 53
Figure 19. Non-Uranium Constituents with 2012 Results Above FRLs

Fernald Preserve 2012 Site Environmental Report U.S. Department of Energy Doc. No. S09665 May 2013 Page 54
The three private wells (monitoring wells 2060, 13, and 14) located along Willey Road are monitored under the IEMP to assist in the evaluation of the uranium plume migration. Off-property groundwater contamination was initially detected at one of these wells (well 2060) in 1981. In 1997, a DOE-sponsored public water supply became available to Fernald site neighbors who were affected by off-property groundwater contamination. The availability of the public water supply resulted in the discontinuation of monitoring at many private wells in off-property areas. Data from the three private wells sampled under the IEMP were incorporated into the uranium plume map shown in Figure 18. During 2012, Property/Plume Boundary monitoring consisted of 36 monitoring wells located downgradient of the Fernald Preserve, along the eastern and southern portions of the property boundary. Twenty-five of these wells were monitored along the eastern Fernald Preserve boundary and slightly downgradient of the South Plume to determine if contaminants were migrating offsite. Eleven of these wells were sampled in the Paddys Run Road area to document the influence, or lack thereof, that pumping in the South Plume was having on the Paddys Run Road Site plume. Data from the Property/Plume Boundary wells were integrated with other groundwater data for 2012 and were incorporated into the uranium plume maps shown in Figure 18 and in Appendix A, Attachment A.2. Non-uranium data from these wells are included in Section 3.3.1.6. As indicated in Section 2, Ohio EPA issued the Director’s Findings and Orders on September 7, 2000. These orders specify that the site’s groundwater monitoring activities will be implemented in accordance with the IEMP. The revised language allows modification of the groundwater monitoring program as necessary, via the IEMP revision process (subject to Ohio EPA approval), without issuance of a new Director’s Order. As determined by Ohio EPA, the IEMP will remain in effect following remediation. 3.4 Groundwater Remediation Assessment Data collected in 2012 indicate that uranium concentrations within the footprint of the maximum uranium plume continue to decrease in response to pumping. The footprint of the maximum uranium plume in 2012 was approximately 130 acres (53 hectares) (a decrease of approximately 9.7 percent from what was mapped in 2011 [144 acres] [58 hectares]). Additional information concerning the dimensions of the maximum uranium plume is provided in Appendix A, Attachment A.2. Groundwater elevations collected in 2012 continue to show that the pumping wells are maintaining capture of the uranium plume by enhancing and modifying natural groundwater flow directions within the aquifer. Appendix A, Attachment A.3 provides additional information concerning capture of the uranium plume. Data collected in 2012 continue to show that the mass of uranium being removed from the aquifer is in close agreement with groundwater model predictions, indicating that the pumping system remains effective in removing uranium from the aquifer. Appendix A, Attachment A.1 provides additional information concerning the mass of uranium removed from the aquifer. Computer modeling was used in 2005 to support the final groundwater remediation design and to predict how uranium concentrations would decrease during the remedy. An assessment using

U.S. Department of Energy Fernald Preserve 2012 Site Environmental Report May 2013 Doc. No. S09665 Page 55
2010 uranium data indicates that the groundwater model predictions made in 2005 are remaining reasonable over time. The next assessment is scheduled for 2015. Data collected in the field indicate that some areas of the uranium plume do not appear to be responding to remediation as quickly as predicted. One of these areas has the potential to extend the off-property remediation completion time beyond that predicted by the groundwater model (DOE 2011a). The site groundwater model is being utilized to look at potential ways to improve the aquifer remedy design and determine if remediation time can be improved (e.g., change the pumping rates of existing extraction wells, convert an out-of-service injection well into an extraction well, install a new extraction well). DOE will discuss improvements options with EPA and Ohio EPA before taking any action to proceed. 3.5 OSDF Monitoring Monitoring of the OSDF is conducted in the leachate collection system (LCS), leak detection system (LDS), glacial till (perched water), and the Great Miami Aquifer. Figure 20 identifies the OSDF footprint and monitoring well locations for Cells 1 through 8. Flow is being monitored within the LCS and LDS to determine if the facility is operating as designed. Water quality is being monitored in the LCS, LDS, glacial till, and the Great Miami Aquifer to identify any potential leakage from the facility. LCS and LDS flow data collected in 2012 indicate that engineered features within the OSDF continue to perform as designed. Leachate flow continues to diminish as expected, and LDS flow volumes indicate that the cell liners are performing well within design specifications. A comparison of water quality data collected in 2012 from within the facility (LCS and LDS) to water quality data collected beneath the facility (perched groundwater in the glacial till and groundwater in the Great Miami Aquifer) indicates that a leak from the OSDF is not occurring. Table 6 summarizes the groundwater, LCS, and LDS monitoring information for Cells 1 through 8 of the OSDF by providing the range of total uranium concentrations measured in 2012. The majority of uranium concentrations measured in 2012 fell within the historical range of concentrations previously measured for that monitoring horizon. New low and high concentrations measured in 2012 are identified with bold font on Table 6. As shown in Table 6, new high uranium concentrations were detected in two Great Miami Aquifer monitoring wells. The high uranium concentration measured in monitoring well 22200 (Cell 2) increased from 1.11 µg/L to 1.93 µg/L. The high uranium concentration measured in monitoring well 22203 (Cell 3) increased from 7.92 µg/L to 9.51 µg/L. Both of these new highs are well below the drinking water standard for uranium (30 µg/L) and do not pose an unacceptable risk to human health and the environment. Concentrations of two non-uranium constituents (manganese and zinc) exceeded groundwater FRLs in OSDF aquifer monitoring wells in 2012. Appendix A, Attachments A.4 and A.5 provide additional information on non-uranium groundwater FRL exceedances and on the groundwater, LDS, and LCS sampling results for the OSDF.

Fernald Preserve 2012 Site Environmental Report U.S. Department of Energy Doc. No. S09665 May 2013 Page 56
Figure 20. OSDF Footprint and Monitoring Well Locations

U.S. Department of Energy Fernald Preserve 2012 Site Environmental Report May 2013 Doc. No. S09665 Page 57
Table 6. OSDF Groundwater, Leachate, and LDS Monitoring Summary
Cell (Waste Placement Start Date)
Monitoring Location
Monitoring Zone Date Sampling
Started Total #
Samples Range of Total Uranium Concentrationsa (µg/L)
Cell 1 (Dec. 1997)
12338C LCS Feb. 17, 1998 58 ND–206
12338D LDS Feb. 18, 1998 37 1.5–37.0
12338 Glacial Till Oct. 30, 1997 67 ND–19
22201 Great Miami Aquifer Mar. 31, 1997 74 ND–11.2
22198 Great Miami Aquifer Mar. 31, 1997 111 0.577–15.2
Cell 2 (Nov. 1998)
12339C LCS Nov. 23, 1998 55 4.51–404
12339D LDS Dec. 14, 1998 25 4.08–22.3b
12339 Glacial Till Jun. 29, 1998 78 ND–36.9
22200 Great Miami Aquifer Jun. 30, 1997 69 ND–1.93
22199 Great Miami Aquifer Jun. 25, 1997 88 ND–12.1
Cell 3 (Oct. 1999)
12340C LCS Oct. 13, 1999 52 9.27–113
12340D LDS Aug. 26, 2002 20 8.9–27.7b
12340 Glacial Till Jul. 28, 1998 71 ND–58.5
22203 Great Miami Aquifer Aug. 24, 1998 64 ND–9.51
22204 Great Miami Aquifer Aug. 24, 1998 83 ND–22.9
Cell 4 (Nov. 2002)
12341C LCS Nov. 04, 2002 38 4.41–171
12341D LDS Nov. 04, 2002 34 5.74–21.3
12341 Glacial Till Feb. 26, 2002 51 4.82–7.91
22206 Great Miami Aquifer Nov. 06, 2001 55 ND–5.78
22205 Great Miami Aquifer Nov. 05, 2001 70 0.446–19.7
Cell 5 (Nov. 2002)
12342C LCS Nov. 04, 2002 40 3.39–285
12342D LDS Nov. 04, 2002 36 2.93–27.1
12342 Glacial Till Feb. 26, 2002 52 7.45–21.1
22207 Great Miami Aquifer Nov. 06, 2001 55 ND–4.48
22208 Great Miami Aquifer Nov. 05, 2001 72 ND–2.1
Cell 6 (Nov. 2003)
12343C LCS Oct. 27, 2003 37 8.03–197
12343D LDS Oct. 27, 2003 36 3.1–43.7
12343 Glacial Till Mar. 14, 2003 44 ND–24.2
22209 Great Miami Aquifer Dec. 16, 2002 50 ND–2.43
22210 Great Miami Aquifer Dec. 16, 2002 64 ND–1.02
Cell 7 (Sep. 2004)
12344C LCS Sep. 02, 2004 33 4.72–355
12344D LDS Sep. 02, 2004 27 12.2–33.7
12344 Glacial Till Feb. 24, 2004 41 0.674–8.61
22212 Great Miami Aquifer Jan. 21, 2004 43 ND–5.53
22211 Great Miami Aquifer Jan. 21, 2004 54 ND–3.21
Cell 8 (Dec. 2004)
12345C LCS Oct. 18, 2004 32 1.51–335
12345D LDS Oct. 18, 2004 27 9.38–64.4
12345 Glacial Till May 19, 2004 20 3.48–7.3
22213 Great Miami Aquifer Mar. 31, 2004 42 ND–0.627
22214 Great Miami Aquifer Mar. 31, 2004 54 ND–2.95
22215 Great Miami Aquifer Aug. 22, 2005 33 ND–16.4
22217c Great Miami Aquifer Aug. 22, 2005 32 ND–18.3 a ND = not detected. Bold text indicates a new high or low detected in 2012. b Some data are not considered representative of true LDS uranium concentrations in Cell 2 (December 14, 1998, through May 23, 2000, data set) due to malfunction in the Cell 2 leachate pipeline and the resulting mixing of individual flows. Additionally, it is suspected that some November 2004 samples (i.e., 12339C with 12339D and 12340C with 12340D) were switched. If data from these events were included above, the maximum total uranium concentrations would be 71 µg/L for 12339D and 72.4 µg/L for 12340D. c Monitoring location 22216 was plugged and abandoned in April 2006. Monitoring location 22217 is its replacement. The results listed for location 22217 also include the results for location 22216.

Fernald Preserve 2012 Site Environmental Report U.S. Department of Energy Doc. No. S09665 May 2013 Page 58
This page intentionally left blank

U.S. Department of Energy Fernald Preserve 2012 Site Environmental Report May 2013 Doc. No. S09665 Page 59
To assist in the understanding of this section, the following key definitions are provided:
• Controlled runoff is contaminated storm water that is collected and, under normal circumstances, treated and discharged to the Great Miami River as treated effluent. However, currently the only storm water that is controlled is associated with the footprint of the outdoor processing activities at the wastewater treatment facility.
• Uncontrolled runoff is storm water that is not collected for treatment, but enters the site’s natural drainages.
• Treated effluent is water that is treated through the site's wastewater treatment facility and then discharged to the Great Miami River.
• Surface water is water that flows within natural drainage features.
4.0 Surface Water and Treated Effluent Pathway
This section presents the 2012 monitoring activities and results for surface water, treated effluent, and sediment to determine the effects of site activities on the surface water pathway. In general, low levels of contaminants enter the surface water pathway at the Fernald Preserve by two primary mechanisms: treated effluent that is monitored as it is discharged to the Great Miami River, and uncontrolled runoff entering the site’s drainages from remediated areas that are now certified and restored. Because these discharges have continued through remediation and legacy management, the surface water and sediment pathways will continue to be monitored. Effective use of the site’s wastewater treatment capabilities and implementation of runoff and sediment controls minimize the site’s impact on the surface water pathway.
4.1 Summary of Surface Water and Treated Effluent Pathway
The treated effluent pathway consists of flows discharged to the Great Miami River via the Parshall Flume (PF 4001). Discharges through this point are considered under the control of wastewater operations. Treated effluent is currently composed of treated and untreated groundwater, leachate from the OSDF, and storm water associated with the footprint of the outdoor processing activities at the wastewater treatment facility. The volume and flow rate of uncontrolled runoff depends on the amount of precipitation within a given period of time. Figure 8 in Section 1 shows monthly precipitation totals for 2012. Figure 21 shows the site’s natural drainage features. The site’s natural surface water drainages include several tributaries to
Paddys Run (e.g., SSOD) as well as the northeast drainage that flows to the Great Miami River. The arrows on Figure 21 indicate the general flow direction of uncontrolled runoff that is determined from the topography. Uncontrolled runoff from the Fernald Preserve leaves the property via two drainage pathways: Paddys Run and the northeast drainage ditch.
Results in Brief: 2012 Surface Water and Treated Effluent Pathway Surveillance Monitoring—No treated effluent analytical results from samples collected in 2012 exceeded the surface water FRL for total uranium, the primary site contaminant. Surface water analytical results exceeded the surface water FRL for total uranium at one location. Sample results from three surface water cross-media locations exceeded the groundwater FRL for total uranium; one cross-media location exceeded the groundwater FRL for thorium-232.
Uranium Discharges—In 2012, 524 lb (238 kg) of uranium were discharged in treated effluent to the Great Miami River. Approximately 82.5 lb (37 kg) of uranium were released to the environment through uncontrolled storm water runoff. The estimated total pounds of uranium released through the surface water and treated effluent pathway was approximately 606 lb (275 kg).

Fernald Preserve 2012 Site Environmental Report U.S. Department of Energy Doc. No. S09665 May 2013 Page 60
Figure 21. Controlled Surface Water Areas and Uncontrolled Runoff Flow Directions

U.S. Department of Energy Fernald Preserve 2012 Site Environmental Report May 2013 Doc. No. S09665 Page 61
4.2 Remediation Activities Affecting the Surface Water Pathway Activities that had the potential to affect the surface water pathway included routine operation and maintenance activities of the OSDF and the CAWWT, and ecological restoration activities conducted throughout the property, including repairing areas of erosion. Now that remediation has been completed and the infrastructure to continue the groundwater remedy has been installed, the restored areas of the Fernald Preserve are the primary focus relative to uncontrolled runoff. Controls to mitigate sediment leaving the site are primarily based on the vegetation and stabilization practices within the restored areas. Surface water monitoring conducted in a small area west of the former waste pits continued to show elevated uranium concentrations. The location in question is a series of small puddles and drainage ditches due west of the center of former waste pit 3, which drain generally south to a depression near the former cement pond. This area does not drain directly to Paddys Run. After a limited maintenance activity was completed in the fall of 2007, DOE committed to continued monitoring of the area. Two monitoring points (SWD-05 and SWD-09) were added to the surface water program to fulfill this monitoring commitment (Figure 22). These two locations are sampled weekly, when water is present. In 2012, there was a sufficient volume of surface water to collect 11 samples at SWD-05 and 25 samples at SWD-09. 4.3 Surface Water, Treated Effluent, and Sediment Monitoring Program Surface water, treated effluent, and sediment are sampled to determine the effect of the Fernald Preserve's activities on the environment. Surface water is sampled at several locations in the site’s drainages and analyzed for various radiological and nonradiological constituents. Treated effluent is sampled prior to discharge into the Great Miami River. Sediment is sampled for total uranium in the Great Miami River. The key elements of the surface water and treated effluent program design are:
SamplingSample locations, frequency, and constituents were selected to address requirements of the NPDES Permit, the FFCA, and the OU5 ROD and to provide a comprehensive assessment of surface water quality at key locations, including two background locations (refer to Figure 22 and Figure 23). Surface water is monitored for 16 FRL constituents.
Data EvaluationThe integrated data evaluation process focuses on tracking and evaluating data compared with background and historical ranges, FRLs, and NPDES limits. This information is used to assess impacts on surface water due to site remediation activities affecting uncontrolled runoff or treated effluent. The assessment also includes identifying the potential for impacts from surface water to groundwater in the Great Miami Aquifer. The ongoing data evaluation is designed to support remedial action decision making.
ReportingSurface water and treated effluent data are reported through the annual Site Environmental Report. Monthly discharge monitoring reports required by the NPDES permit are submitted to the Ohio EPA.

Fernald Preserve 2012 Site Environmental Report U.S. Department of Energy Doc. No. S09665 May 2013 Page 62
Treated effluent is discharged to the Great Miami River through the effluent line identified on Figure 22. Samples of the treated effluent are collected at the Parshall Flume (PF 4001). The resulting data are used to calculate the concentration of each FRL constituent after the effluent water mixes with the water in the Great Miami River.
In 2009, the IEMP sediment monitoring sampling frequency was changed from annual to once every 5 years at the suggestion of Ohio EPA according to DOE/EH-0173T (1991), Environmental Regulatory Guide for Radiological Effluent Monitoring and Environmental Surveillance. The data are reported through the annual Site Environmental Report. The next sediment sampling event will occur in 2014. Data from samples collected under the IEMP are used to fulfill surveillance and compliance monitoring functions. Surveillance monitoring results of the IEMP surface water and treated effluent program are used to assess the collective effectiveness of site storm water controls and wastewater treatment processes in preventing unacceptable impacts to the surface water and groundwater pathways. Compliance monitoring includes sampling at storm water and treated effluent discharge points and is conducted to comply with provisions in the NPDES permit, the FFCA, and the OU5 ROD. The data are routinely evaluated to identify any unacceptable trends and to trigger corrective actions when needed to ensure protection of these critical environmental pathways. Figure 22 depicts IEMP and NPDES surface water and treated effluent sample locations; Figure 23 shows IEMP background sample locations. 4.3.1 Surveillance Monitoring
Data resulting from 2012 sampling events were evaluated to provide surveillance monitoring of site activities. This evaluation indicated that during 2012, 15 surface water analytical results from sampling location SWD-09 exceeded the surface water FRL for total uranium. SWD-09 is a surface water monitoring point established to monitor the area west of the former Waste Pits Area where elevated surface water uranium concentrations have been detected in the past. There
were no exceedances of total uranium in any of the treated effluent samples, and there were no non-uranium surface water FRL exceedances. The following two key sample locations represent points where surface water or treated effluent leaves the site:
Paddys Run at the Willey Road property boundary (surface water sample location SWP-03).
PF 4001 is located at the entry point of the treated effluent line leading to the Great Miami River.
There were no exceedances of the surface water FRLs during 2012 at these two locations.

U.S. Department of Energy Fernald Preserve 2012 Site Environmental Report May 2013 Doc. No. S09665 Page 63
Figure 22. IEMP/NPDES Surface Water and Treated Effluent Sample Locations

Fernald Preserve 2012 Site Environmental Report U.S. Department of Energy Doc. No. S09665 May 2013 Page 64
This page intentionally left blank

U.S
. Departm
ent of Energy
Fernald P
reserve 2012 Site E
nvironmental R
eport M
ay 2013 D
oc. No. S
09665
Page 65
Figure 23. IEMP Background Surface Water Sample Locations

Fernald Preserve 2012 Site Environmental Report U.S. Department of Energy Doc. No. S09665 May 2013 Page 66
The maximum total uranium concentration at SWP-03 during 2012 was 2.94 µg/L, well below the surface water total uranium FRL of 530 µg/L. Figure 24 shows the annual average total uranium concentration in Paddys Run at Willey Road for the period 1985 through 2012. This figure illustrates the decrease of the total uranium concentration in Paddys Run from 1986. Samples collected at PF 4001 are used in the surveillance evaluation because this is the last point where treated effluent is sampled prior to discharge to the Great Miami River. The maximum daily total uranium concentration at PF 4001 in 2012 was 32.5 µg/L, well below the surface water total uranium FRL of 530 µg/L. Data collected from this location cannot directly be compared to the surface water FRL without considering the effect of the effluent waters mixing with the Great Miami River. This comparison is done through the use of a mixing equation when constituents exceed the FRL. The mixing equation is discussed further in Appendix B. After the actual flow rate in the Great Miami River and the discharge flow rate in which this maximum uranium concentration was observed were accounted for, the resulting concentration in the river was estimated to be 2.57 µg/L. Evaluation of surface water data is also performed to provide an ongoing assessment of the potential for cross-media impacts from surface water to the underlying Great Miami Aquifer. In areas where there is no glacial overburden, a direct pathway exists for contaminants to reach the aquifer. This contaminant pathway to the aquifer was considered in the design of the groundwater remedy. The groundwater remedy includes placing groundwater extraction wells downgradient of these areas where direct infiltration occurs in order to mitigate any potential cross-media impacts during surface remediation. To provide this assessment, sample locations were selected to evaluate contaminant concentrations in surface water just upstream of, or within, those areas where site drainages have eroded through the protective glacial overburden. The locations are SWP-02, SWD-02, SWD-03, SWD-04, SWD-05, SWD-07, SWD-08, and STRM 4005. In 2012, surface water cross-media impact locations SWD-04, SWD-05, and SWD-08 had sample results that exceeded the total uranium groundwater FRL of 30 µg/L. In addition, one sample collected from SWD-05 exceeded the thorium-232 groundwater FRL of 1.2 pCi/L for the first time. Sampling at these locations will continue to provide an assessment of the cross-media impacts. Additional details of the FRL exceedances are presented in Appendix B. 4.3.2 Compliance Monitoring 4.3.2.1 FFCA and OU5 ROD Compliance The Fernald Preserve is required to monitor treated effluent discharges at PF 4001 for total uranium mass discharges and total uranium concentrations. This requirement is identified in the July 1986 FFCA and the OU5 ROD (DOE 1996). The OU5 ROD requires treatment of effluent so that the mass of total uranium discharged to the Great Miami River through PF 4001 does not exceed 600 lb (272 kg) per year. The OU5 ROD (DOE 1996) and the subsequent Explanation of Significant Differences for Operable Unit 5 (DOE 2001d) also require that the monthly average total uranium concentration in the effluent must be at or below 30 µg/L. Figure 25 shows that the cumulative mass of total uranium discharged to the Great Miami River during 2012 was 524 lb (238 kg), which is below the annual discharge limit of 600 lb (272 kg). Figure 26 shows that the monthly average total uranium concentration was below the 30 µg/L limit every month during 2012.

U.S
. Departm
ent of Energy
Fernald P
reserve 2012 Site E
nvironmental R
eport M
ay 2013 D
oc. No. S
09665
Page 67
Figure 24. Annual Average Total Uranium Concentrations in Paddys Run at Willey Road (SWP-03) Sample Location, 1985−2012
64
73
8.010 9.0 9.0
7.49.5
5.8 6.18.6
3.0 3.7 3.72.1 2.5
3.8
11
2.8 2.8 1.83.5 3.3
1.9 3.01.7 2.3 2.9
0
10
20
30
40
50
60
70
80C
on
cen
tra
tio
n (g
/L)
Year
Note: The surface water FRL for total uranium is 530 g/L.

Fernald P
reserve 2012 Site E
nvironmental R
eport U
.S. D
epartment of E
nergy D
oc. No. S
09665 M
ay 2013 P
age 68
Figure 25. Mass of Uranium Discharged to the Great Miami River through the Parshall Flume (PF 4001) in 2012
54.0 50.5 54.729.8
52.2
15.736.8
47.8 45.7 47.6 43.8 45.854.0
104.5
159
189
241257
294
342
387
435
479
524
0
100
200
300
400
500
600
700
January February March April May June July August September October November December
Mas
s (p
ou
nd
s)
Month
Monthly [lbs] Cumulative [lbs]
The Operable Unit 5 Record of Decision established an annual discharge limit of 600 pounds for uranium.

U.S
. Departm
ent of Energy
Fernald P
reserve 2012 Site E
nvironmental R
eport M
ay 2013 D
oc. No. S
09665
Page 69
Figure 26. 2012 Monthly Average Total Uranium Concentration in Water Discharged Through the Parshall Flume (PF 4001) to the Great Miami River
27.526.8 26.7
25.9
27.1
25.9 26.2
24.723.9
23.322.7 22.9
0.0
5.0
10.0
15.0
20.0
25.0
30.0
35.0
January February March April May June July August September October November December
Co
nce
ntr
ati
on
(g
/L)
Month
On November 30, 2001, the monthly average discharge limit became 30 g/L.

Fernald Preserve 2012 Site Environmental Report U.S. Department of Energy Doc. No. S09665 May 2013 Page 70
4.3.2.2 NPDES Permit Compliance Compliance sampling, consisting of sampling for nonradiological pollutants from uncontrolled runoff and treated effluent discharges from the Fernald Preserve, is regulated under the state-administrated NPDES program. A new permit was received from Ohio EPA on April 1, 2009, and is effective until March 31, 2014. There were no incidents of NPDES noncompliance in 2012. 4.3.3 Uranium Discharges in Surface Water and Treated Effluent As identified in Figure 25, 524 lb (238 kg) of uranium in treated effluent were discharged to the Great Miami River through PF 4001 in 2012. In addition to the treated effluent, uncontrolled runoff is also contributing to the amount of uranium entering surface water. Figure 27 presents the mass of uranium from the uncontrolled runoff and controlled discharges from 1993 through 2012. A loading term is used to estimate the pounds of uranium discharged to Paddys Run via uncontrolled runoff. This loading term was revised and approved in August 2004 based on total uranium data, which reflect the decreasing total uranium concentrations measured at points discharging to Paddys Run. Total uranium concentrations measured in Paddys Run were decreasing through remediation as a result of significant improvements in the capture of contaminated storm water and should remain low now that soil remediation has been completed. The loading term is 2.1 lb (0.95 kg) of uranium per inch (2.54 cm) of rainfall. During 2012, 39.3 inches (99.8 cm) of precipitation fell at the Fernald Preserve; therefore, an estimated 82.5 lb (37 kg) of uranium entered the environment through uncontrolled runoff. The estimated total amount of uranium discharged to the surface water pathway for the year, including controlled treated effluent discharges and uncontrolled runoff, was approximately 606 lb (275 kg).

U.S
. Departm
ent of Energy
Fernald P
reserve 2012 Site E
nvironmental R
eport M
ay 2013 D
oc. No. S
09665
Page 71
Figure 27. Uranium Discharged via the Surface Water Pathway, 1993−2012
0.0
100.0
200.0
300.0
400.0
500.0
600.0
0
220
440
660
880
1100
1320
Mas
s (k
ilog
ram
s)
Mas
s (p
ou
nd
s)
Year
Uncontrolled runoff Controlled discharge through the Parshall Flume Total

Fernald Preserve 2012 Site Environmental Report U.S. Department of Energy Doc. No. S09665 May 2013 Page 72
This page intentionally left blank

U.S. Department of Energy Fernald Preserve 2012 Site Environmental Report May 2013 Doc. No. S09665 Page 73
Results in Brief: 2012 Estimated Doses
Direct Radiation—The estimated 2012 effective dose equivalent at the northeastern boundary of the site was 11 mrem/yr (0.11 mSv/yr). This is 11 percent of the 100-mrem/yr (1-mSv/yr) DOE limit.
Dose to the maximally exposed individual (MEI)—The dose to the MEI for 2012 was estimated to be 11 mrem/yr (0.11 mSv/yr) at the northeastern boundary of the site. This is 11 percent of the 100-mrem/yr (1-mSv/yr) DOE limit.
5.0 Direct Radiation Pathway and Radiation Dose
This section provides the 2012 results for direct radiation monitoring and the estimated dose to the public from the direct radiation pathway. It also addresses biotic dose to aquatic organisms from remedial actions associated with the groundwater restoration program. In the past, the Fernald Preserve demonstrated compliance with the DOE effective dose limit of 100 millirem per year (mrem/yr) (1 millisievert per
year [mSv/yr]) from exposure pathways (excluding radon) using direct radiation measurements and data collected from samples of airborne emissions to estimate the total dose to the maximally exposed individual (MEI). In consultation with EPA, DOE ended air monitoring for particulate emissions on January 4, 2010, because 3 years of post-remediation data indicated emissions are at or near background. Therefore, the 2012 dose estimate reflects the incremental dose above background that is attributed to direct radiation. This section also provides an assessment of dose to aquatic organisms that may be affected by the site's effluent to nearby streams and rivers. An assessment of dose to biota (i.e., aquatic and terrestrial organisms) is one of the requirements of DOE Order 5400.5. By limiting the dose to aquatic organisms, DOE Order 5400.5 seeks to limit the severity and likelihood of offsite environmental impacts attributable to the aquifer restoration effort at the Fernald Preserve. The dose assessment to biota is performed through the use of a computer model that estimates dose from measured radionuclide concentrations in Paddys Run and effluent discharged to the Great Miami River. 5.1 Monitoring for Direct Radiation Direct radiation originates from sources such as cosmic radiation, naturally occurring radionuclides in soil and food, and anthropogenic radioactive materials. Gamma rays and X-rays are the dominant types of radiation that create a public exposure concern because they penetrate into the deep tissues of the body. The largest historical source of direct radiation at the Fernald Preserve was waste material associated with the Silos Project. The last waste material associated with the Silos Project was removed from the site in 2006. Presently, there are no significant sources for direct radiation at the Fernald Preserve. During 2012, direct radiation levels at the Fernald Preserve were continuously measured at four trail locations, the Visitors Center, five boundary locations, and one background location with optically stimulated luminescence (OSL) dosimeters. The background location is 3.2 miles from the center of the Fernald Preserve (Figure 28).

Fernald Preserve 2012 Site Environmental Report U.S. Department of Energy Doc. No. S09665 May 2013 Page 74
Figure 28. Direct Radiation (OSL) Monitoring Locations

U.S. Department of Energy Fernald Preserve 2012 Site Environmental Report May 2013 Doc. No. S09665 Page 75
Table 7 provides the annual range of direct radiation measurements for 2011 and 2012, and Figure 29 illustrates the quarterly results for 2012. Each quarterly result is the average of three measurements obtained from three separate dosimeters placed at each location. In general, the first-quarter results are less than other quarters because the first quarter had fewer exposure days, and the winter months may hold more moisture in the ground, which can attenuate radiation emitted from soil particles. Compared to background results, many of the onsite results are slightly higher, and the Visitors Center results are lower due to the shielding provided by the building materials. Slightly higher results are not unexpected, as the Fernald site was remediated to reduce the radionuclide levels to values that were near or somewhat higher than background. However, as noted in Appendix C, Attachment C.1, the mean of the quarterly boundary measurements is similar to background when statistical variability is evaluated, which is in agreement with removal of the last direct radiation waste sources in 2006.
Table 7. Direct Radiation (OSL) Measurement Summary
Location Direct Radiation (mrem)
Sum of 2012 Quarterly Results Sum of 2011 Quarterly Results Onsite
Minimum 15 16
Maximum 32 33
Backgrounda
Minimum 21 21
Maximum 21 21 a The minimum and maximum results are identical because there is only one background dosimeter.
5.2 Direct Radiation Dose Direct radiation dose to deep tissue is primarily the result of gamma and X-ray emissions from radionuclides. The largest historical source of direct radiation at the site was the waste materials stored in the silos. This and all other significant surface radiation sources were removed from the site in 2006. Remaining surface sources for radiation are soil, which contains radium, thorium, and uranium isotopes at activities that are below the FRLs established in the OU5 ROD (DOE 1996), and small pieces of debris that are exposed by soil erosion. From the data in Table 7, the maximum measurement is 32 mrem/yr (0.32 mSv/yr) at OSL-2 (Figure 28), and the background dose is 21 mrem/yr (0.21 mSv/yr). The difference in the OSL dose between OSL-2 and the background dosimeters is 11 mrem/yr (0.11 mSv/yr), which is assumed to be the direct radiation dose for a hypothetical individual who stands at the OSL-2 location for 1 year. This is a very conservative estimate of the dose, as an individual would not spend an entire year at OSL-2. Additionally, Appendix C, Attachment C.1 shows that the present quarterly measurements at the boundary are indistinguishable from background results when statistical variability is considered.

Fernald P
reserve 2012 Site E
nvironmental R
eport U
.S. D
epartment of E
nergy D
oc. No. S
09665 M
ay 2013 P
age 76
Figure 29. 2012 Quarterly Results for OSL Monitoring Locations
0.0
1.0
2.0
3.0
4.0
5.0
6.0
7.0
8.0
9.0
10.0
1st Quarter 2nd Quarter 3rd Quarter 4th Quarter
mre
m/q
uart
er23683527 (Background)5051525354 (Visitors Center)
NOTE: DOE limit is 100 mrem per year above background.

U.S. Department of Energy Fernald Preserve 2012 Site Environmental Report May 2013 Doc. No. S09665 Page 77
5.3 Total of Doses to the Maximally Exposed Individual The MEI is the member of the public who receives the highest estimated effective dose based on the sum of the individual pathway doses (as noted above, direct radiation is the only pathway considered in 2012). It is the maximum dose because the MEI is assumed to spend 24 hours a day, 365 days a year at the location where the maximum direct radiation is measured. As shown in Table 8, the 2012 dose to the MEI is 11 mrem/yr (0.11 mSv/yr) and represents the sum of the estimated dose from direct radiation at OSL-2. The conservative exposure assumptions used to estimate the dose ensures that the dose to the MEI is the maximum possible dose any member of the public could receive.
Table 8. Dose to MEI
Pathway Dose Attributable
to the Fernald Preserve Applicable Limit
Direct radiationa 11 mrem/yr (0.11 mSv/yr) 100 mrem/yr (1 mSv/yr) (total for all pathways)
MEI 11 mrem/yr (0.11 mSv/yr) 100 mrem/yr (1 mSv/yr) (total for all pathways) a Represents the sum of the estimated dose from direct radiation at OSL-2.
The estimate represents the incremental dose above background attributable to the Fernald Preserve. Figure 30 provides a comparison between the average background radiation dose at the background location (21 mrem/yr [0.21 mSv/yr]) and the dose to the MEI (11 mrem/yr [0.11 mSv/yr]), relative to the annual DOE limit (100 mrem/yr [1 mSv/yr]). 5.4 Significance of Estimated Radiation Doses for 2012 One method of evaluating the significance of the estimated doses is to compare them with doses received from background radiation. Background radiation delivers an annual dose of approximately 100 mrem/yr (1 mSv/yr) from natural sources, excluding radon. For example, the dose received each year from cosmic and terrestrial background radiation contributes approximately 26 mrem/yr (0.26 mSv/yr) and 28 mrem/yr (0.28 mSv/yr), respectively. This sum (54 mrem/yr) is about 2.5 times greater than the direct radiation dose of 21 mrem/yr at the background location, and it is about four times greater than the dose of 11 mrem/yr above background estimated for the individual at OSL-2. The 100 mrem/yr per person background also includes dose from the ingestion of food and from medical X-rays (about 46 mrem/yr), which is not recorded by the direct radiation OSLs at the boundary and background locations. In addition, the background radiation dose will vary in different parts of the country. Living in the Cincinnati, Ohio, area contributes an annual dose of approximately 110 mrem/yr (1.1 mSv/yr), whereas living in Denver, Colorado, increases the background to approximately 125 mrem/yr (1.25 mSv/yr) (National Academy of Science 1980, National Council on Radiation Protection and Measurements 1984).

Fernald P
reserve 2012 Site E
nvironmental R
eport U
.S. D
epartment of E
nergy D
oc. No. S
09665 M
ay 2013 P
age 78
Figure 30. Comparison of 2012 All-Pathway Doses and Allowable Limits
-40
-30
-20
-10
0
10
20
30
40
50
60
70
80
90
100
110
120
Dos
e fr
om D
irect
Rad
iatio
n (m
rem
/yr)
DOE All-Pathway Limit = 100 mrem/yr above background
MEI = 11 mrem/yr above background
OSL background = 21 mrem/yr
Background is +21 mrem/yr, although it is plotted as -21 mrem/yr to illustrate other data as above background.

U.S. Department of Energy Fernald Preserve 2012 Site Environmental Report May 2013 Doc. No. S09665 Page 79
Another method of determining the significance of the estimated dose is to compare it with dose limits developed to protect the public. The International Commission on Radiological Protection has recommended that members of the public receive less than 100 mrem/yr (1 mSv/yr) above background. As a result of this recommendation, DOE has incorporated 100 mrem/yr (1 mSv/yr) above background as the limit in DOE Order 5400.5. The sum of all estimated doses from 2012 site operations (11 mrem/yr [0.11 mSv/yr]) is considerably below this limit (Figure 30). 5.5 Estimated Dose to Biota DOE Order 5400.5 requires that populations of aquatic biota be protected at a dose limit of 1 rad/day (10 milligray per day [mGy/day]). DOE has issued a technical standard entitled A Graded Approach for Evaluating Radiation Doses to Aquatic and Terrestrial Biota (DOE 2002b) and supporting software (RAD-BCG) for use in the evaluation and reporting of biota dose limits. In general, the dose and compliance assessment process involves comparing radionuclide concentrations measured in surface water or sediment samples to biota concentration guides (BCGs) established by researchers. The BCGs are set so that biota exposed at the BCG level would not be expected to exceed the biota dose limit of 1 rad/day (10 mGy/day) during a calendar year. The measured radionuclide concentration in water or sediment is divided by the appropriate BCG value, and if the resulting fraction is less than 1.0, compliance with the biota dose limit is demonstrated for that radionuclide. BCGs have been established for radionuclides that are relatively common constituents in past releases to the environment from DOE facilities. At facilities such as the Fernald Preserve, where multiple contaminants (e.g., radium, thorium, and uranium) can be released, a “sum-of-the-fractions” rule applies. The sum-of-the-fractions rule means each radionuclide fraction (i.e., the measured concentration divided by the BCG for that nuclide) must be summed, and the sum of all radionuclide fractions must be less than 1.0. For 2012, compliance with the dose limit to aquatic biota was determined by using the maximum concentration of each radionuclide found in Paddys Run at Willey Road (SWP-03) and effluent discharged from PF 4001 to the Great Miami River (refer to Section 4). The maximum concentration in water delivered from the Parshall Flume and Paddys Run is multiplied by the annual volume of water discharged from the Parshall Flume and Paddys Run to obtain a net mass for each nuclide delivered to the Great Miami River. The net mass is divided by the sum of the discharge volumes and low-flow volume from the Great Miami River to derive input concentrations to the RAD-BCG computer model. The results of this assessment indicate that the sum of the fractions for radium-226 (Parshall Flume only) and uranium isotopes is 0.002, which is well below the compliance threshold value of 1.0. Appendix C, Attachment C.2 provides additional information on the biota dose assessment.

Fernald Preserve 2012 Site Environmental Report U.S. Department of Energy Doc. No. S09665 May 2013 Page 80
This page intentionally left blank

U.S. Department of Energy Fernald Preserve 2012 Site Environmental Report May 2013 Doc. No. S09665 Page 81
Results in Brief: Ecological Monitoring Activities
Wetland Functional Monitoring
Vegetation results were mostly similar to 2009 and 2011 and show sustained establishment of native wetland vegetation.
Amphibian results showed continued expansion of salamander habitat across created wetlands that are near existing forests.
Hydrologic monitoring demonstrated a similar pattern to previous years.
Implementation Monitoring
While tree and shrub survival fell below site goals in the Paddys Run Tributary project, vegetation establishment was successful for the 2012 ecological restoration projects. The extent of grass cover continues to be a challenge within portions of the Former Production Area that were seeded in 2010.
Site and OSDF Inspections
No major issues were observed with respect to institutional controls or the integrity of the OSDF cap. Findings focused mainly on invasive plants and woody vegetation in the vicinity of the OSDF, and debris in portions of the Former Production and Former Waste Pits areas.
6.0 Natural Resources This section provides background information on the natural resources associated with the Fernald Preserve and summarizes the activities in 2012 relating to these resources. Included in this section is a discussion of the following:
Ecological restoration activities.
Fernald Preserve site and OSDF inspections.
Affected habitat areas.
Threatened and endangered species.
Cultural resources. Much of the 1,050 acres (425 hectares) of the Fernald Preserve property is undeveloped land that provides habitat for a variety of animals and plants. Wetlands, deciduous and riparian (streamside) woodlands, old fields, grasslands, and aquatic habitats are among the site's natural resources. Over 900 acres (364 hectares) of the site have undergone ecological restoration. Figure 31 shows the restoration project areas that have been completed. Some of these areas provide habitat for state and federal endangered species. These endangered species are identified in Section 6.4. Cultural resources, such as prehistoric archaeological sites have also been surveyed. Monitoring of these natural and cultural resources is
addressed in the Natural Resource Monitoring Plan, which is included in the LMICP (DOE 2012a). The Natural Resource Monitoring Plan presents an approach for monitoring and reporting the status of several priority natural resources to remain in compliance with pertinent regulations and agreements. The approach for monitoring and maintenance of ecologically restored areas was expanded in 2009. DOE and Ohio EPA signed a Consent Decree in November 2008 that settled a long-standing natural resource damage claim under Section 107 of CERCLA. As a result, the Fernald Natural Resource Trustees (DOE, Ohio EPA, and the U.S. Department of Interior) have finalized the Natural Resource Restoration Plan (NRRP), which is Appendix B of the Consent Decree Resolving Ohio’s Natural Resource Damage Claim against DOE (State of Ohio 2008). The NRRP specifies an enhanced monitoring program for ecologically restored areas at the site. This includes an enhanced wetland mitigation monitoring program and a functional monitoring program that evaluates restored communities. Ecological monitoring in 2012 focused on implementation monitoring of several recent restoration projects and functional monitoring of site wetlands. The site and OSDF inspection process was also continued in 2012 as required in the LMICP.

Fernald Preserve 2012 Site Environmental Report U.S. Department of Energy Doc. No. S09665 May 2013 Page 82
Figure 31. Restoration Project Areas

U.S. Department of Energy Fernald Preserve 2012 Site Environmental Report May 2013 Doc. No. S09665 Page 83
6.1 Ecological Restoration Activities The Fernald Preserve’s mission of long-term stewardship under LM includes the establishment, management, and monitoring of ecologically restored areas across the site. In 2012, repair and enhancement of ecologically restored areas included several ecological restoration projects on the western portion of the site. Maintenance in ecologically restored areas included repair of several eroded areas, continued control of noxious weeds and invasive plants, and limiting impacts due to nuisance animals (e.g., deer and geese). Repair and removal of old deer exclosure fencing took place as well. In addition, the use of prescribed burns continued at the Fernald Preserve. Figure 31 shows the location of restoration activities discussed below. 6.1.1 Ecological Restoration Projects Three ecological restoration projects were conducted in 2012. The Paddys Run Tributary and the Triangle Area projects were conducted in May. Both projects are located on the western edge of the site along Paddys Run Road. The Paddys Run Tributary project involves creation of wetland and forest communities to increase site amphibian habitat. The Triangle Area project seeks to expand existing grassland habitat by converting a former pasture into a tallgrass prairie. Each of these projects was initiated and funded by the Fernald Natural Resource Trustees. The plant and material costs were lower than expected, and favorable weather conditions during construction resulted in a cost underrun. Therefore, the Trustees agreed to conduct an additional restoration project in the footprint of the Former Silos Area. This project involved construction of a meandering wetland swale between two existing ponds, and installation of trees and shrubs. Fieldwork for this activity took place in August and September. 6.1.2 Restored Area Maintenance and Repair Erosion repair activities were required in several locations within the Former Production Area and Southern Waste Units. These areas were regraded, and riprap was installed to create stable drainage channels. Disturbed areas were reseeded with native vegetation once installation work was complete. Spot spraying with a broad-leaf herbicide, in conjunction with mowing and manual cutting, was continued in 2012 to control Canada thistle and other noxious weeds across the site. Manual cutting, followed by herbicide application to the stumps, was also used to remove bush honeysuckle and Callery pear from several areas along the eastern and northern portions of the site. Callery pear continues to be an emerging nuisance at the site. Callery pear is the common name for any of a variety of commercial landscape trees, such as Bradford pear. These trees have been observed in the northeastern portion of the site, as well as within the OSDF. These non-native plants crowd out more desirable native species. The use of prescribed burns continued at the Fernald Preserve in 2012. Prescribed burning has several benefits. The tallgrass prairie species that have been seeded at the Fernald Preserve are well adapted to periodic fires. Most prairie species are deep-rooted. They have an extensive root system that is developed before the stem and leaf clump form above the surface. The root system allows them to be burned, eliminating the above-surface plant clump, without killing the plant. After a burn, when prairie plants grow back from the roots, they are vibrant. The burns convert

Fernald Preserve 2012 Site Environmental Report U.S. Department of Energy Doc. No. S09665 May 2013 Page 84
the plant material to ash, reducing the accumulation of thatch. The ash is in contact with the soil and breaks down quickly, and the nutrients in the ash become available in the soil. Also, the blackened, ash-covered ground absorbs more heat from sunlight and warms the soil. As a result, the soil reaches a temperature conducive to germination and native plant growth earlier in the spring. The growing season for the grasses and wildflowers is increased, and the sunlight on the soil surface promotes the growth of new plants and increases the productivity of existing plants. Two areas were burned in 2012, totaling approximately 7 acres (2.8 hectares). The Northbend Prairie Burn was conducted in March and the Trent Lochs Wetland Burn was conducted in November. Each burn was conducted safely with no incidents. Several other areas were mowed, including the eastern border of the site and a portion of the Former Production Area. The mowed area in the Former Production Area was seeded with prairie grasses and wildflowers. The primary nuisance animals onsite are white-tailed deer and Canada geese, which are an ongoing concern. Existing deer exclosure fencing was maintained sitewide to prevent deer from browsing and rubbing the planted trees. In May 2012, a flash flood damaged a number of deer exclosure fences along Paddys Run and in the Northern Pine Plantation restoration area. Several other deer exclosure areas were determined to be no longer required, as the restored vegetation has grown. Therefore, field crews removed a number of deer exclosure fence areas. Fencing that was still needed was repaired. The goose-hazing program, which began in 2007, uses trained border collies to harass the geese. This program continued in 2012. The dogs, brought onto the Fernald Preserve by their handlers, try to herd the geese. The geese believe the dogs are predators and fly off. This hazing is effective at keeping geese from both land and water. The goal is to keep the geese from areas that have been seeded so that the vegetation has time to become established. Once the grasses become tall, the geese are no longer attracted to those areas. A second goal is to make the geese too uncomfortable to nest at the Fernald Preserve. Goose nests are counted across the site during the nesting season. For the last several years, the number of goose nests have been reduced, which may be due to an increase in established vegetation and increased predation by coyotes. For 2013, the extent of goose hazing will focus mostly on publicly accessible areas. This approach will be reevaluated at the end of the 2013 nesting season.

U.S. Department of Energy Fernald Preserve 2012 Site Environmental Report May 2013 Doc. No. S09665 Page 85
Vegetation Monitoring Parameters There are a number of ways to evaluate the type and quality of vegetation within an area. At the Fernald Preserve, vegetation monitoring focuses on determining the extent of native species composition and calculating a Floristic Quality Assessment Index (FQAI). The FQAI process is described in the Floristic Quality Assessment Index for Vascular Plants and Mosses for the State of Ohio (Andreas 2004). The specific parameters used at the Fernald Preserve include the following:
Total Species: The total number of species sampled within a given area.
Native Species: The total number of species native to Ohio. The Ohio Vascular Plant Database is used to determine whether a species is native (Andreas 2004).
Percent Native Species: The number of native species divided into the total number of species. Relative frequency of native species has also been used in the past. This is calculated by dividing the frequency (or number of times a species is observed) into the total number of observations for a given area.
Average Coefficient of Conservatism (CC): The CC is a number between 0 and 10 that has been assigned to virtually every species that may be found in Ohio. The CC value is related to how “tolerant” a species is and what its habitat requirements are. Non-native plants have a CC of 0. Common species that can grow in a wide variety of habitats are considered “tolerant,” and are scored a CC between 0 and 3. Native plants with very specific habitat requirements are scored high CC values, in the 7 to 10 range. The Ohio Vascular Plant Database lists the CC for each plant found in Ohio (Andreas 2004).
Floristic Quality Assessment Index (FQAI): The CC values described above are used to calculate the FQAI. The FQAI is the sum of CC values divided by the square root of the total number of species for a given area.
Vegetation Index of Biotic Integrity (VIBI): A scoring system using vascular plants as a means of assessing the quality of a given community.
Amphibian Index of Biotic Integrity (AIBI): A scoring system using amphibians as a means of assessing the quality of wetland communities.
6.1.3 Ecological Restoration Monitoring
Monitoring of restored areas has been divided into two phases: the implementation phase and the functional phase. Implementation phase monitoring is conducted to ensure that restoration projects are completed as intended in their designs. This effort involves the mortality counts and herbaceous cover estimates that are conducted after a project is completed. Vegetation surveys of the Paddys Run Tributary and Triangle Area Projects were conducted in 2012, along with a second year of evaluating the Natural Resource Trustee Resolution 3 projects. Functional phase monitoring is more general and considers projects in terms of their contribution to the ecological community as a whole. This is accomplished by comparing projects to pre-remediation baseline conditions and to ideal reference sites. The NRRP, which was finalized in November 2008 with settlement of the Natural Resource Damage Claim (State of Ohio 2008), reinstituted the use of functional-phase monitoring as a means of evaluating restored communities. Functional monitoring was further specified in the Wetland Mitigation Monitoring Report (DOE 2012d), which was finalized in May 2012. In 2012, functional monitoring centered on wetland communities.
Figure 32 shows the location of 2012 monitoring activities. 6.1.3.1 Wetland Functional Monitoring Pursuant to the Wetlands Mitigation Monitoring Report, wetland communities were evaluated in 2012. Monitoring included vegetation surveys to calculate Vegetation Index of Biotic Integrity (VIBI), amphibian surveys to calculate Amphibian Index of Biotic Integrity (AIBI) and hydrologic monitoring using shallow wells (piezometers). The method used to calculate VIBI allows for both a comparison to baseline conditions and reference sites, as well as an evaluation of specific wetland basins over time. Table 9 shows basin-specific results and VIBI scores. Table 10 presents a comparison of functional monitoring parameters to baseline and reference sites. The 2003 Wetland Mitigation Phase 1 (WM1) functional monitoring data are presented as well.

Fernald Preserve 2012 Site Environmental Report U.S. Department of Energy Doc. No. S09665 May 2013 Page 86
Results from 2012 compare favorably with earlier data, and show continued progress over baseline conditions. The 2009 results are revised from when they were originally presented in the 2010 Fernald Preserve Site Environmental Report (DOE 2011b). There are several reasons for this. First, new wetland indicator status lists were published by the U.S. Army Corp of Engineers (Lichvar 2012). These updated lists resulted in changes to Percent Hydrophytic calculations. Also, the ecological database can be used to better consolidate and analyze field data. FQAI values were re-calculated after consolidating all basins within each wetland area. In 2009, these values were averaged. This new methodology results in a higher FQAI score, since a greater number of native species are used in the calculation. While the vegetation surveys are useful in comparing to baseline and reference sites, there is potentially greater value in using the data to compare basins over time. VIBI scores have been calculated in 2009 and 2011 as part of wetland mitigation monitoring program. The 2012 comparison in Table 11 shows that there are no real trends that can be determined at this time. VIBI scores will be reevaluated in 2015. Amphibian monitoring was conducted in 2012 as well. Table 12 lists the amphibian species observed and Table 13 compares AIBI scores for each basin since 2010. These tables indicate that mitigated wetlands are improving in overall quality and function. Amphibians, especially mole (ambystomatid) salamanders, are considered key indicators of wetland health. Findings have been similar to those recorded in previous years with ambystomatid salamanders observed in wetlands that are located adjacent to established forest communities. The Former Production Area had a significantly higher score than in previous years, a result of a surge in cricket frog frequencies. Water elevations in piezometers were recorded daily in 2012 for hydrologic monitoring. The 2012 results were similar to those of past years, with saturated conditions observed through the spring and summer, followed by drier conditions in the fall. These findings are also similar to those at other emergent wetlands in Ohio.

U.S. Department of Energy Fernald Preserve 2012 Site Environmental Report May 2013 Doc. No. S09665 Page 87
Table 9. Wetland Functional Monitoring Vegetation Summary
BasinSize
(Acres)Total
SpeciesNative
Species
Non-Native
Species
Percent Native
Species
Average
CCa FQAIbVIBI
Scorec
WM1W1 1.00 42 32 9 76% 2.21 13.77 35
WM1W2 1.38 89 59 25 66% 1.78 16.12 71
WM1W3 0.93 53 39 12 74% 1.83 12.75 51
WM1W4 1.08 82 63 18 77% 1.78 15.86 67
WM1W5 0.27 43 27 16 63% 1.63 10.28 26
WM1W6 1.68 60 50 15 83% 1.95 15.24 61
WM1W7 0.77 33 25 7 76% 2.28 12.90 32
WM2W1 0.94 45 34 8 76% 2.14 13.89 46
WM2W2 0.94 62 46 16 74% 2.04 15.50 55
WM2W3 1.19 69 56 12 81% 2.17 17.49 53
NPPW4 2.24 46 38 7 83% 2.20 14.76 48
NPPW5 0.14 62 50 10 81% 2.22 16.94 51
BAPW2 3.35 55 46 9 84% 2.38 17.31 58
BAPW3 0.56 31 27 4 87% 1.86 9.83 30
BAPW4 1.30 50 36 12 72% 1.77 12.27 36
BAPW7 0.36 49 37 12 76% 1.96 13.71 43
BAPW9 0.83 45 35 7 78% 2.17 14.04 33
FPAW2 4.25 36 27 8 75% 1.76 10.29 26
FPAW4 1.20 29 25 4 86% 2.07 10.96 36
FPAW5 2.91 55 40 14 73% 2.09 15.38 41
FPAW7 2.47 16 12 4 75% 1.75 7.00 0
FPAW9 2.51 39 35 4 90% 2.38 14.89 55
PREW6 2.32 43 35 7 81% 2.23 14.07 47
cVIBI = Vegetation Index of Biotic Integrity
bFQAI = Floristic Quality Assessment Index
Wetland Mitigation Phase I
Wetland Mitigation Phase II
North Pines Plantation Enhancement
Borrow Area
Former Production Area
aCC = Coefficient of Conservatism

Fernald P
reserve 2012 Site E
nvironmental R
eport U
.S. D
epartment of E
nergy D
oc. No. S
09665 M
ay 2013 P
age 88 Table 10. Wetland Functional Monitoring Comparison
Baseline Reference WM1
Year 2009 2012 2009 2012 2009 2012 2009 2012 2009 2012 2002 2002 2003Total Species 141 155 67 95 101 102 103 114 79 87 33 61 62
Native Species 99 111 52 76 75 77 82 88 62 81 17 55 49
Percent Native 70% 72% 78% 80% 74% 75% 80% 77% 78% 82% 48% 90% 79%
Average CCa 2.34 2.05 2.07 2.40 1.98 2.07 2.30 2.16 2.15 2.37 1.12 3.49 2.21
FQAIb 27.80 25.54 16.98 23.39 19.90 20.89 23.35 23.05 19.13 22.09 6.44 27.27 17.40
Percent Hydrophytic 50% 50% 55% 49% 50% 57% 50% 51% 57% 52% 24% 51% 64%aCC = Coefficient of ConservatismbFQAI = Floristic Quality Assessment Index
ParameterWetland
WM1 WM2 BAP FPA NPP
Restoration Project Area

U.S. Department of Energy Fernald Preserve 2012 Site Environmental Report May 2013 Doc. No. S09665 Page 89
Table 11. Wetland Mitigation Vegetation Index of Biotic Integrity
2009 2011 2012
Wetland Mitigation Phase I WM1W1 1.00 40 39 35
WM1W2 1.38 71 61 71
WM1W3 0.93 61 46 51
WM1W4 1.08 61 54 67
WM1W5 0.27 26 32 26
WM1W6 1.68 67 48 61
WM1W7 0.77 54 42 32
Wetland VIBIa Average 54 46 49
Wetland Mitigation Phase II WM2W1 0.94 50 53 46
WM2W2 0.94 43 49 55
WM2W3 1.19 57 51 53
Wetland VIBIa Average 50 51 51
North Pines Plantation Enhancement NPPW4 2.24 51 58 48
NPPW5 0.14 51 61 51
Wetland VIBIa Average 51 60 50
Borrow Area BAPW2 3.35 50 46 58
BAPW3 0.56 32 42 30
BAPW4 1.30 36 23 36
BAPW7 0.36 50 50 43
BAPW9 0.83 59 29 33
Wetland VIBIa Average 45 38 40
Former Production Area FPAW2 4.25 25 40 26
FPAW4 1.20 50 18 36
FPAW5 2.91 51 54 41
FPAW7 2.47 34 13 0
FPAW9 2.51 50 56 55
PREW6 2.32 43 25 47
Wetland VIBIa Average 42 34 34
aVIBI = Vegetation Index of Biotic Integrity
YearSize (Acres)
BasinRestoration Project Area

Fernald P
reserve 2012 Site E
nvironmental R
eport U
.S. D
epartment of E
nergy D
oc. No. S
09665 M
ay 2013 P
age 90
Table 12. Amphibian Monitoring Summary
Restoration Project AreaWetland
Area Cri
cke
t F
rog
(Acr
is c
rep
itan
s)
Mar
ble
d S
alam
and
er(A
mb
yst
om
a o
pac
um
)
Sal
ama
nd
er S
pe
cies
(A
mb
yst
om
id s
p)
Tig
er S
alam
and
er
(Am
by
sto
ma
tig
rin
um
)
Am
eric
an
an
d F
ow
lers
To
ad(A
na
xyru
s s
pec
ies
)
To
ad
Sp
ecie
s
(An
axy
rus
sp
)
Am
eric
an
Bu
ll F
rog
(Lit
ho
bat
es
cate
sbei
ana
)
Gre
en F
rog
(Lit
ho
bat
es
clam
ita
ns
)
No
rth
ern
Le
op
ard
Fro
g(L
ith
ob
ate
s p
ipie
ns
)
Fro
g S
pec
ies
(L
ith
ob
ate
s sp
)
Sp
rin
g P
eep
er
(Pse
ud
acr
is c
ruci
fer
)
BAPW2 0 0 0 0 0 0 0 2 1 2 0
BAPW4 0 0 0 0 0 0 0 0 0 2 0
BAPW7 0 0 0 0 0 0 1 1 0 0 0
FPAW2 0 0 0 0 0 0 0 0 0 9 0
FPAW7 9 0 0 0 0 0 0 0 0 3 0
FPAW9 20 0 0 0 0 1 0 0 0 11 0
PREW6 8 0 0 0 0 0 0 2 2 82 1
NPPW4 2 0 1 0 0 0 0 0 0 51 0
NPPW5 53 0 0 0 0 0 5 0 0 55 0
WM1W1 0 0 0 0 0 0 3 0 0 7 0
WM1W4 1 0 0 0 0 0 1 2 0 141 0
WM1W7 0 0 1 0 0 0 0 0 0 8 0
WM2W1 13 0 0 0 0 0 3 1 0 22 1
WM2W2 3 2 0 0 0 3 3 1 0 25 3
WM2W3 0 0 1 1 0 0 1 3 1 9 0
Wetland Mitigation Phase II (WM2)
Species and Number of Individuals
Borrow Area (BAP)
Former Production Area (FPA)
Northern Pine Plantation Enhancement (NPP)
Wetland Mitigation Phase I (WM1)

U.S. Department of Energy Fernald Preserve 2012 Site Environmental Report May 2013 Doc. No. S09665 Page 91
Table 13. Wetland Mitigation Amphibian Index of Biotic Integrity
6.1.3.2 Implementation Monitoring Implementation monitoring in 2012 consisted of herbaceous surveys of the Paddys Run Tributary Project, the Triangle Area, the 2010 Natural Resource Trustees Resolution 3 Projects, and woody survival counts in the Paddys Run Tributary Project Area. Table 14 presents the results of herbaceous monitoring, while Table 15 shows tree and shrub survival counts from the Paddys Run Tributary project.
Table 14. Implementation Monitoring Herbaceous Summary
Wetland Area 2010 2011 2012
BAPW2 0 0 10
BAPW4 0 0 10
BAPW7 0 13 10
FPAW2 0 13 10
FPAW7 0 0 20
FPAW9 0 10 20
PREW6 13 13 13
NPPW4 16 33 13
NPPW5 24 0 16
WM1W1 0 3 10
WM1W4 13 3 13
WM1W7 0 0 10
WM2W1 3 13 20
WM2W2 3 6 16
WM2W3 16 19 16a AIBI = Amphibian Index of Biotic Integrity
AIBI Scorea
Restoration Project Area
Wetland Mitigation Phase II (WM2)
Borrow Area (BAP)
Former Production Area (FPA)
Northern Pine Plantation Enhancement (NPP)
Wetland Mitigation Phase I (WM1)
Restoration Project Area Sub‐Area
Total
Species
Native
Species
Percent
Native
Species
Percent Relative
Frequency of
Native Species
Percent
Cover
mesic prairie 30 19 63% 67% 97%
wetland 31 19 61% 55% 83%
wet mesic prairie 30 20 67% 68% 94%
mesic prairie 31 20 65% 56% 97%
Solid Waste Landfill 23 13 57% 51% 66%
Haul Road 22 14 64% 57% 75%
Prairie 21 11 52% 33% 57%
Paddys Run Tributary
Triangle Area
Former Production Area

Fernald Preserve 2012 Site Environmental Report U.S. Department of Energy Doc. No. S09665 May 2013 Page 92
Table 15. Implementation Monitoring Woody Vegetation Survival
For the Paddys Run Tributary project, disturbed areas were seeded with either a wetland mix or a mesic prairie mix according to landscape hydrology. Herbaceous surveys were conducted in each of these two planting zones. Both areas met the 50 percent native species goal. The mesic prairie area attained the 90 percent cover goal, and the wetland area nearly reached the total cover goal at 83 percent. Over 1,100 trees and shrubs were planted in the Paddys Run Tributary project area. Survival counts of these plantings were conducted in late summer 2012. Approximately 58 percent of the plants installed survived, based on the criteria established by the Natural Resource Trustees. The actual percent survival is likely higher than 58 percent. A number of plants were unable to be located due to tall grasses within the project area. If a tree or shrub was not located, it was conservatively counted as “dead or unaccounted.” The Triangle area was also reseeded with native prairie grasses and forbs. There were two seeding areas, mesic prairie, and wet mesic prairie. Both of these areas achieved the 50 percent native species and the 90 percent cover goals. Seeding of the 2010 Natural Resource Trustees Resolution 3 Projects occurred in 2010. Monitoring conducted in 2011 indicated that the Haul Road and the Solid Waste Landfill project areas both achieved the 50 percent native species mark, while the Prairie Area did not. Table 14 shows that all three areas attained the 50 percent goal in 2012, but not the 90 percent cover goal. These areas will continue to be evaluated in 2013 as part of the functional monitoring program.
Species Common Name Quantity ResproutVitality
(<50% alive)Dead or
UnaccountedPercent Survival
Acer rubrum RED MAPLE 5 0 0 0 100%
Acer saccharum SUGAR MAPLE 14 0 1 2 79%
Asimina triloba PAWPAW 150 3 2 100 30%
Carpinus caroliniana BLUE-BEECH 50 0 2 11 74%
Carya cordiformis BITTERNUT HICKORY 50 1 4 20 50%
Carya ovata SHAGBARK HICKORY 12 0 2 5 42%
Cephalanthus occidentalis BUTTONBUSH 150 0 0 0 100%
Cornus amomum SILKY DOGWOOD 150 0 0 16 89%
Fagus grandifolia AMERICAN BEECH 75 1 7 64 4%
Lindera benzoin SPICEBUSH 150 14 15 88 22%
Quercus bicolor SWAMP WHITE OAK 7 0 0 0 100%
Quercus imbricaria SHINGLE OAK 75 2 1 57 20%
Quercus macrocarpa BUR OAK 75 0 1 11 85%
Quercus palustris PIN OAK 15 0 0 3 80%
Quercus rubra RED OAK 20 0 0 2 90%
Rosa palustris SWAMP ROSE 150 1 0 27 81%
Ulmus americana AMERICAN ELM 7 0 0 0 100%

U.S. Department of Energy Fernald Preserve 2012 Site Environmental Report May 2013 Doc. No. S09665 Page 93
Figure 32. Ecological Monitoring Activities

Fernald Preserve 2012 Site Environmental Report U.S. Department of Energy Doc. No. S09665 May 2013 Page 94
This page intentionally left blank

U.S. Department of Energy Fernald Preserve 2012 Site Environmental Report May 2013 Doc. No. S09665 Page 95
A swallowtail butterfly sits on a purple coneflower 6.2 Fernald Preserve Site and OSDF Inspections The LMICP sets out a routine inspection process for both the site and the OSDF. Inspections are conducted quarterly with joint participation from DOE and the regulators. Inspections document evidence of unauthorized uses of the site, the effectiveness of institutional controls, and the need for repairs. Ecologically restored areas are evaluated for the presence of noxious weeds, erosion, the condition of vegetation, and signs of damage from nuisance animals. As with 2011, findings in 2012 consisted mostly of the presence of weeds and deer fencing that was damaged by falling trees and limbs. The erosion repair areas and invasive vegetation described in Section 6.1.2 were identified during the site inspection process. Construction debris also continues to be found, primarily in the Former Production Area and Former Waste Pits area. For the OSDF inspections, the vegetated cap is walked down and evaluated to ensure that its integrity is maintained. Erosion rills, holes from burrowing animals, noxious weeds, settlement cracks, and other indications that there may be an issue with the proper functioning of the cap are flagged and repaired. In 2012, there were no signs that the integrity of the cap had been compromised in any way. Findings consisted mainly of woody vegetation, noxious weeds, and animal burrows.

Fernald Preserve 2012 Site Environmental Report U.S. Department of Energy Doc. No. S09665 May 2013 Page 96
Sloan's Crayfish—The state threatened Sloan's crayfish (Orconectes sloanii) is found in southwest Ohio and southeast Indiana. It prefers streams with constant (though not necessarily fast) current flowing over rocky bottoms. A large, well-established population of Sloan's crayfish has been found at the Fernald Preserve in the northern reaches of Paddys Run. Indiana Brown Bat—The federally endangered Indiana brown bat (Myotis sodalis) forms colonies in hollow trees and under loose tree bark along riparian (streamside) areas during the summer. Excellent habitat for the Indiana brown bat has been identified at the Fernald Preserve along the wooded banks of the northern reaches of Paddys Run. The habitat provides an extensive mature canopy of older trees and water throughout the year. One Indiana brown bat was captured and released on the property in August 1999. Running Buffalo Clover—The federally endangered running buffalo clover (Trifolium stoloniferum) is a member of the clover family whose flower resembles that of the common white clover. Its leaves, however, differ from those of white clover in that they are heart-shaped and a lighter shade of green. Running buffalo clover has not been identified at the Fernald Preserve; however, because running buffalo clover is found nearby in the Miami Whitewater Forest, the potential exists for this species to become established at the site. The running buffalo clover prefers habitat with well-drained soil, filtered sunlight, limited competition from other plants, and periodic disturbances. Suitable habitat areas include partially shaded former grazed areas along Paddys Run and the storm sewer outfall ditch. Spring Coral Root—The state threatened spring coral root (Corallorhiza wisteriana) is a white and red orchid that blooms in April and May and grows in partially shaded areas of forested wetlands and wooded ravines. This plant has not been identified at the Fernald Preserve; however, suitable habitat exists in portions of the northern woodlot. Cave Salamander—The state endangered cave salamander (Eurycea lucifuga) is slender, red to orange with irregular black dots. It is found in caves, springs, small limestone streams, outcrops, and old springhouses where groundwater is present. It has only been documented in Ohio in Hamilton, Butler, and Adams counties. Suitable habitat within the Fernald Preserve is limited, but populations have been observed just north of the site. Cobblestone Tiger Beetle—The state threatened cobblestone tiger beetle (Cicindela marginipennis) is recognized by its olive-gray back, white sides, and red abdomen. It’s found on large gravel bars on medium-sized rivers. Populations have been recorded east of the Fernald Preserve along the Great Miami River.
Quarterly inspection reports are posted on the Legacy Management website at http://www.lm.doe.gov/fernald/Sites.aspx. The quarterly inspection reports can also be viewed online at the Fernald Preserve Visitors Center or by contacting S.M. Stoller Public Affairs at (513) 648-4026. 6.3 Affected Habitat Findings With large-scale remediation complete, the potential for unanticipated habitat impacts is limited. Nevertheless, impacts may occur during construction or maintenance activities. In 2012, no large areas of restored habitat were affected. Minor impacts associated with the erosion repair activities were addressed by reseeding. 6.4 Threatened and Endangered Species and Species Inventories
The Endangered Species Act requires the protection of any federally threatened or endangered species and any habitat critical for the species' existence. Several Ohio laws mandate the protection of state endangered species as well. Since 1993, a number of surveys have been conducted to determine the presence of any threatened or endangered species at the site. As a result of these surveys, the federally endangered Indiana brown bat and the state threatened Sloan's crayfish have been found at the Fernald Preserve. In addition, suitable habitat exists for the federally endangered running buffalo clover, the state threatened spring coral root, the state endangered cave salamander, and the state threatened cobblestone tiger beetle. None of these species have been found on the site, but their habitat ranges encompass the Fernald Preserve. Figure 33 shows the potential habitats for these species. According to provisions in the IEMP, threatened or endangered species habitat will be surveyed as needed prior to any construction activities. If threatened or endangered species are identified, appropriate avoidance or mitigation efforts will be taken.

U.S. Department of Energy Fernald Preserve 2012 Site Environmental Report May 2013 Doc. No. S09665 Page 97
A survey for running buffalo clover was conducted in 2012 prior to the Paddys Run Tributary restoration project, with none found. The Fernald Preserve was identified as a candidate for introduction of the American burying beetle. DOE signed a Cooperative Agreement with the U.S. Fish and Wildlife Service and the Cincinnati Zoo (DOE 2012c) to introduce the federally endangered beetle to the Fernald Preserve. This effort is part of the recovery plan for the beetle, which involves release and monitoring of beetles that were raised at the Cincinnati Zoo. The beetles are planned to be released in spring 2013. In addition to endangered species survey work, several other species inventories took place in 2012. Reptile and small-mammal surveys continued around a number of site wetlands using coverboards, which are 2 ft by 4 ft (61 cm by 122 cm) pieces of corrugated sheet metal. Animals are attracted to the cover and warmth the coverboards provide. Wood boards are being used in conjunction with the metal coverboards to evaluate new monitoring techniques. No new species of reptile or small mammal species were observed in 2012. However, several species of salamanders were unexpectedly observed under coverboards in the spring. Therefore, a number of coverboards were moved in summer 2012, in order to investigate amphibian migration to wetlands in the northern portion of the site. Results will be reported in 2013. 6.5 Cultural Resources The Fernald Preserve and surrounding area are located in a region of rich soil and many sources of water, such as the Great Miami River. Because of its advantageous location, the area was settled repeatedly throughout prehistoric and historical time, resulting in diverse cultural resources. In summary, 148 prehistoric and 40 historic sites have been identified within 1.24 miles (2 km) of the Fernald Preserve. Several laws have been established to protect cultural resources. The National Historic Preservation Act requires DOE to consider the effects of its actions on sites that are listed or eligible for listing on the National Register of Historic Places. The Native American Graves Protection and Repatriation Act (43 CFR 10) requires that prehistoric human remains and associated artifacts be identified and returned to the appropriate Native American tribe. To comply with these laws, DOE conducted archaeological surveys prior to remediation activities in undeveloped areas of the Fernald Preserve. Figure 34 shows the areas of the Fernald Preserve that have been surveyed. These surveys have resulted in the identification of five sites that may be eligible for listing on the National Register of Historic Places. None of these sites were affected by construction activities. No surveys were needed in 2012. DOE and the Ohio Historic Preservation Office (DOE 2012c) signed an updated Programmatic Agreement for Archaeological Activities at the Fernald Preserve. The report submission process was revised to be conducted “as needed” instead of annually. The Programmatic Agreement was also updated to reflect the management of the site by LM.

Fernald Preserve 2012 Site Environmental Report U.S. Department of Energy Doc. No. S09665 May 2013 Page 98
Figure 33. Threatened and Endangered Species Habitat Areas

U.S. Department of Energy Fernald Preserve 2012 Site Environmental Report May 2013 Doc. No. S09665 Page 99
Figure 34. Cultural Resource Survey Areas

Fernald Preserve 2012 Site Environmental Report U.S. Department of Energy Doc. No. S09665 May 2013 Page 100
This page intentionally left blank

U.S. Department of Energy Fernald Preserve 2012 Site Environmental Report May 2013 Doc. No. S09665 Page 101
7.0 References 40 CFR 61. U.S. Environmental Protection Agency, “National Emission Standards for Hazardous Air Pollutants,” Code of Federal Regulations, July 1, 2011. 43 CFR 10. U.S. Department of the Interior, “Native American Graves Protection and Repatriation Regulations,” Code of Federal Regulations, October 1, 2011. Andreas, Barbara K., John J. Mack, and James S. McCormac, 2004. Floristic Quality Assessment Index (FQAI) for Vascular Plants and Mosses for the State of Ohio, Ohio Environmental Protection Agency, Division of Surface Water, Wetland Ecology Group, Columbus, Ohio. CERCLA (Comprehensive Environmental Response, Compensation, and Liability Act of 1980), as amended, Title 42 United States Code Section 9601 et seq. Clean Air Act, as amended, Title 42 United States Code Section 7401 et seq. Clean Water Act (Federal Water Pollution Control Act), as amended, Title 33 United States Code Section 1251 et seq. DOE Order 436.1. Departmental Sustainability, May 2, 2011. DOE Order 5400.5. Change 2, Radiation Protection of the Public and the Environment, January 1993. DOE/EH-0173T, 1991. Environmental Regulatory Guide for Radiological Effluent Monitoring and Environmental Surveillance, U.S. Department of Energy, Washington, D.C., January. DOE (U.S. Department of Energy), 1995a. Final Record of Decision for Remedial Actions at Operable Unit 1, 513 U-003-501.3, Final, Fernald Environmental Management Project, Fernald Area Office, Cincinnati, Ohio, January. DOE (U.S. Department of Energy), 1995b. Remedial Investigation Report for Operable Unit 5, Final, Fernald Environmental Management Project, Fernald Area Office, Cincinnati, Ohio, March. DOE (U.S. Department of Energy), 1995c. Feasibility Study Report for Operable Unit 5, Final, Fernald Environmental Management Project, Fernald Area Office, Cincinnati, Ohio, June. DOE (U.S. Department of Energy), 1995d. Proposed Plan for Operable Unit 5, 6865 U-007-405.3, Final, Fernald Environmental Management Project, Fernald Area Office, Cincinnati, Ohio, May. DOE (U.S. Department of Energy), 1996. Record of Decision for Remedial Actions at Operable Unit 5, 7478 U 007 501.4, Final, Fluor Fernald, Cincinnati, Ohio, January.

Fernald Preserve 2012 Site Environmental Report U.S. Department of Energy Doc. No. S09665 May 2013 Page 102
DOE (U.S. Department of Energy), 1997. Baseline Remedial Strategy Report, Remedial Design for Aquifer Restoration (Task 1), Final, Fernald Environmental Management Project, Fernald Area Office, Cincinnati, Ohio. DOE (U.S. Department of Energy), 2001a. First Five-Year Review Report for the FEMP (Federal Environmental Management Project), Final, Fluor Fernald, Fernald Area Office, Cincinnati, Ohio. DOE (U.S. Department of Energy), 2001b. Memorandum of Understanding for Natural Resource Restoration Plan, signed by DOE, Ohio Environmental Protection Agency, and U.S. Department of Interior, Fluor Fernald, Fernald Area Office, Cincinnati, Ohio, July 12. DOE (U.S. Department of Energy), 2001c. Design for Remediation of the Great Miami Aquifer in the Waste Storage and Plant 6 Areas, 52462-RP-0003, Revision A, Draft Final, Fluor Fernald, Fernald Area Office, Cincinnati, Ohio, April. DOE (U.S. Department of Energy), 2001d. Explanation of Significant Differences for Operable Unit 5, Final, Fernald Environmental Management Project, DOE, Fernald Area Office, Cincinnati, Ohio, October. DOE (U.S. Department of Energy), 2002a. Design for Remediation of the Great Miami Aquifer South Field (Phase II) Module, 52462-RP-0001, Revision A, Draft Final, Fluor Fernald, Fernald Area Office, Cincinnati, Ohio, May. DOE (U.S. Department of Energy), 2002b. A Graded Approach for Evaluating Radiation Doses to Aquatic and Terrestrial Biota, DOE-STD-1153-2002, Washington, D.C., July. DOE (U.S. Department of Energy), 2003. Comprehensive Groundwater Strategy Report, Revision 0, Draft, Office of Legacy Management, Cincinnati, Ohio, June. DOE (U.S. Department of Energy), 2004. Groundwater Remedy Evaluation and Field Verification Plan, 52460-PL-0001, Revision 0, Final, Fluor Fernald, Office of Legacy Management, Cincinnati, Ohio, October. DOE (U.S. Department of Energy), 2005. Waste Storage Area Phase II Design Report, 52424-RP-0004, Revision A, Draft Final, Fluor Fernald, Office of Legacy Management, Cincinnati, Ohio, June. DOE (U.S. Department of Energy), 2006a. Fernald Groundwater Certification Plan, 51900-PL-0002, Revision 1, Final, Fluor Fernald, Office of Legacy Management Cincinnati, Ohio, April. DOE (U.S. Department of Energy), 2006b. Second Five-Year Review Report for the FCP, 2500-RP-0044, Revision A, Draft, Fluor Fernald, Office of Legacy Management, Cincinnati, Ohio, April. DOE (U.S. Department of Energy), 2008. Interim Remedial Action Report for Operable Unit 5, Office of Legacy Management, Cincinnati, Ohio, August.

U.S. Department of Energy Fernald Preserve 2012 Site Environmental Report May 2013 Doc. No. S09665 Page 103
DOE (U.S. Department of Energy), 2009. Fernald Preserve 2008 Site Environmental Report, LMS/FER/S05082, Office of Legacy Management, Cincinnati, Ohio, May. DOE (U.S. Department of Energy), 2011a. Fernald Preserve 2010 Site Environmental Report, Office of Legacy Management, Cincinnati, Ohio, June. DOE (U.S. Department of Energy), 2011b. Third Five-Year Review Report for the Fernald Preserve, LMS/FER/S07045, Office of Legacy Management, Cincinnati Ohio, March. DOE (U.S. Department of Energy), 2012a. Comprehensive Legacy Management and Institutional Controls Plan, LMS/FER/S03496-5.0, Revision 5, Office of Legacy Management, Cincinnati, Ohio, December. DOE (U. S Department of Energy), 2012b. Fernald Preserve Wetland Mitigation Monitoring Report, LMS/FER/SO8266, Final, Office of Legacy Management, Cincinnati, Ohio, April. DOE (U.S. Department of Energy), 2012c. Site Sustainability Plan, LMS/S07225, Final, Office of Legacy Management, Cincinnati, Ohio, December. DOE (U.S. Department of Energy), 2012d. Cooperative Agreement to facilitate recovery of the American burying beetle in Ohio, signed by M. Knapp, Field Supervisor, U.S. Fish and Wildlife Service; D. Geiser, Director, Office of Legacy Management; and T. Maynard, Executive Director, Cincinnati Zoo & Botanical Garden. DOE (U.S. Department of Energy), 2012e. Letter from Jane Powell, Fernald Preserve Site Manager, Office of Legacy Management, to Tom McCulloch, Advisory Council on Historic Preservation, Office of Federal Agency Programs, concerning 2012 Fernald Preserve Archaeological Investigations Programmatic Agreement, July 11. EPA (U.S. Environmental Protection Agency), 2011. Close Out Procedures for National Priorities List Sites, OSWER Directive 9320.2-22-P, Office of Superfund Remediation and Technology Innovation, May. EPA (U.S. Environmental Protection Agency), 2006. Preliminary Closeout Report U.S. DOE Feed Materials Production Center Fernald, Ohio, EPA Region 5, December. Executive Order 12580. Superfund Implementation, Office of the Federal Environmental Executive, January 23, 1987. Executive Order 13423. Strengthening Federal Environmental, Energy, and Transportation Management, Office of the Federal Environmental Executive, January 24, 2007. Executive Order 13514. Federal Leadership in Environmental, Energy, and Economic Performance, Office of the Federal Environmental Executive, October 5, 2009.

Fernald Preserve 2012 Site Environmental Report U.S. Department of Energy Doc. No. S09665 May 2013 Page 104
Lichvar, R.W., 2012. The National Wetland Plant List, ERDC/CRREL TR-12-11, U.S. Army Corps of Engineers Cold Regions Research and Engineering Laboratory, Hanover, New Hampshire. National Academy of Science, 1980. Biological Effects of Ionizing Radiation, BEIR III, National Academy Press. National Council on Radiation Protection and Measurements, 1984. Evaluation of Occupational and Environmental Exposures to Radon and Radon Daughters in the United States, NCRP Report No. 78. RCRA (Resource Conservation and Recovery Act), as amended. Title 42 United States Code Section 6901 et seq. State of Ohio, 2008. Consent Decree Resolving Ohio’s Natural Resource Damage Claim against DOE, State of Ohio v. United States Department of Energy et al., Civil Action No. C-1-86-0217, Judge Spiegel. Toxic Substances Control Act, as amended. Title 7 United States Code Section 136 et seq.

U.S. Department of Energy Fernald Preserve 2012 Site Environmental Report May 2013 Doc. No. S09665 Page 105
8.0 Glossary Amphibian Index of Biotic Integrity—A scoring system that uses amphibians as a means of assessing the quality of wetland communities. Aquifer—A geologic formation, group of formations, or part of a formation that contains sufficient saturated permeable material to yield economical quantities of water to wells and springs. ARARs—An acronym for “applicable or relevant and appropriate requirements.” Requirements set forth in regulations that implement environmental and public health laws and must be attained or exceeded by a selected remedy unless a waiver is invoked. ARARs are divided into three categories: chemical-specific, location-specific, and action-specific, according to whether the requirement is triggered by the presence or emission of a chemical, by a vulnerable or protected location, or by a particular action. Background Radiation—Particle or wave energy spontaneously released from atomic nuclei in the natural environment, including cosmic rays and such releases from naturally radioactive elements outside and inside the bodies of humans and animals, and fallout from nuclear weapons tests. Capture Zone—Estimated area that is being “captured” by the pumping of groundwater extraction wells. The definition of the capture zone is important in ensuring that the uranium plumes targeted for cleanup are being remediated. Certification—The process by which a soil remediation area is certified as clean. Samples from the area are collected and analyzed, and then the contaminant levels are compared to the final remedial levels established in the OU5 ROD. Not all soil remediation areas at the Fernald site require excavation before certification is done. Contaminant—A substance that when present in air, surface water, sediment, soil, or groundwater above naturally occurring (background) levels causes degradation of the media. Controlled Runoff—Contaminated storm water requiring treatment; it is collected, treated, and eventually discharged to the Great Miami River as treated effluent. Curie (Ci)—Unit of radioactivity that describes the rate of spontaneous, energy-emitting transformations in the nuclei of atoms; 1 curie is equal to 37 billion (3.7 1010) nuclear transformations per second. Dose—Amount of radiation absorbed in tissue. Ecological Receptor—A biological organism selected by ecological risk assessors to represent a target species most likely to be affected by site-related chemicals, especially through bioaccumulation. Such organisms may include terrestrial and aquatic species.

Fernald Preserve 2012 Site Environmental Report U.S. Department of Energy Doc. No. S09665 May 2013 Page 106
Effective Dose Equivalent—The sum of the products of the dose equivalent received by specified tissues of the body and tissue-specific weighting factor. This sum is a risk-equivalent value and can be used to estimate the risk of health effects to the exposed individual. The tissue-specific weighting factor represents the fraction of the total health risk resulting from uniform whole-body irradiation that would be contributed by that particular tissue. The effective dose equivalent includes the committed effective dose equivalent from internal deposition of radionuclides and the effective dose equivalent due to penetrating radiation from sources external to the body. Effective dose equivalent is expressed in units of rem or sievert. Exposure Pathway—A route materials can travel between the point of release and the point of delivery of a radiation or chemical dose to a receptor organism. Fly Ash—The ash remaining after burning coal in a boiler plant. Gamma Ray—Type of electromagnetic radiation of discrete energy emitted during radioactive decay of many radioactive elements. Glacial Overburden/Glacial Till—Silt, sand, gravel, and clay deposited by glacial action on top of the Great Miami Aquifer and surrounding bedrock highs. Great Miami Aquifer—Sand and gravel deposited by the meltwaters of Pleistocene glaciers within the entrenched ancestral Ohio and Miami rivers. This is also called a buried channel or a sand and gravel aquifer. Groundwater—Water in a saturated zone or stratum beneath the surface of land. Hydric—Wetland soil; soil that is saturated, ponded, or flooded long enough during the growing season that oxygen-deficient conditions form. Hydrophytic—Wetland vegetation; vegetation that is adapted to grow in soil that is periodically deficient in oxygen as a result of excessive water content. Mixed Waste—Hazardous waste that has been contaminated with low-level radioactive materials. Morphometry—Measurement of the shape or form of an area. Point Source—The single defined point (origin) of a release such as a stack, vent, or other discernible conveyance. Radiation—The energy released as particles or waves when an atom’s nucleus spontaneously loses or gains neutrons or protons. The three main types are alpha particles, beta particles, and gamma rays. Radioactive Material—Refers to any material or combination of materials that spontaneously emits ionizing radiation.

U.S. Department of Energy Fernald Preserve 2012 Site Environmental Report May 2013 Doc. No. S09665 Page 107
Radionuclide—Refers to a radioactive nuclide. There are several hundred known radionuclides that are artificially produced and naturally occurring. Radionuclides are characterized by the number of neutrons and protons in an atom’s nucleus and their characteristic decay processes. Receptors—Individuals or organisms that are or can be impacted by contamination. Remedial Action—The actual construction and implementation phase of a Superfund site cleanup that follows the remedy selection process and remedial design. Remedial Investigation/Feasibility Study—The first major event in the remedial action process that serves to assess site conditions and evaluate alternatives to the extent necessary to select a remedy. Removal Action—A short-term cleanup or removal of released hazardous substances from the environment. A removal action is performed in response to a release or the imminent threat of release of hazardous substances into the environment. Roentgen Equivalent Man (rem)—A special unit of dose equivalent that expresses the effective dose calculated for all radiation on a common scale; the absorbed dose in rads multiplied by certain modifying factors (e.g., quality factor); 100 rem = 1 sievert. Sediment—The unconsolidated inorganic and organic material that is suspended in surface water and is either transported by the water or has settled out and become deposited in beds. Source—A controlled source of radioactive material used to calibrate radiation detection equipment. Can also be used to refer to any source of contamination (e.g., a point source such as the stack on the waste pits stack, a source of radon such as the silo’s headspace). Surface Water—Water that is flowing within natural drainage features. Treated Effluent—Water from numerous areas at the site that is treated through one of the site’s wastewater treatment facilities and discharged to the Great Miami River. Uncontrolled Runoff—Storm water that is not collected by the site for treatment, but enters the site’s natural drainages. Vegetation Index of Biotic Integrity—A scoring system that uses vascular plants as a means of assessing the quality of a given plant community. Volatile Organic Compound—A hydrocarbon compound, except methane and ethane, with a vapor pressure equal to or greater than 0.1 millimeter of mercury. Waste Acceptance Criteria—Disposal facilities specify the types and sizes of materials, acceptable levels of constituents, and other criteria for all material that will be disposed of in that facility. These are known as waste acceptance criteria. Offsite disposal facilities such as the Nevada National Security Site (formerly called the Nevada Test Site) that dispose of Fernald waste have specific waste acceptance criteria. In addition, the OSDF had waste acceptance criteria that were approved by the regulatory agencies.

Fernald Preserve 2012 Site Environmental Report U.S. Department of Energy Doc. No. S09665 May 2013 Page 108
This page intentionally left blank