2012 san francisco state of cycling report
TRANSCRIPT

Page 1
2012 San FranciscoState of Cycling Report
SFMTA | Municipal Transportation Agency

Page 2
San Francisco Municipal Transportation Agency The San Francisco Municipal Transportation Agency (SFMTA) is responsible for the planning, implementation, regulation, maintenance and operation of the multimodal transportation system in the City and County of San Francisco. The city’s transportation system includes public transit, paratransit, streets, bicycle and pedestrian facilities, parking, signals, traffic controls, and taxi services.
Board of DirectorsTom Nolan | Chairman
Jerry Lee | Vice-Chairman
Leona Bridges
Cheryl Brinkman
Malcolm Heinicke
Joél Ramos
Cristina Rubke
Director of TransportationEdward Reiskin
SFMTA Sustainable Streets StaffPeter Brown, State of Cycling Project Manager
Matt Lasky, Co-Author
Bond Yee
Timothy Papandreou
Darton Ito
Anne Fritzler
Bridget Smith
Seleta Reynolds
Craig Raphael
Survey ConsultantCorey, Canapary & Galanis
Edwin M. Lee | Mayor
City and County of San Francisco Board of Supervisors
John Avalos | District 11
David Campos | District 9
David Chiu | District 3
Carmen Chu | District 4
Malia Cohen | District 10
Sean Elsbernd | District 7
Mark Farrell | District 2
Jane Kim | District 6
Eric Mar | District 1
Christina Olague | District 5
Scott Wiener | District 8
This report is made possible by the San Francisco County Transportation Authority through a grant of Proposition K Local Transportation Sales Tax Funds.
Page 3
Executive Summary
The City and County of San Francisco is a national leader in bicycle ridership, innovative cycling infrastructure, greenhouse gas reductions and active living. Cities around the world are investing in sustainable transportation systems and have realized the critical role that bicycling plays in promoting mobility, creating healthy lifestyles, reducing traffic congestion, saving money and generating economic activity. Bicycling gets people where they need to go efficiently and is arguably the most fun way to move about any city.
San Francisco has a high number of trips taken via public transit (20%) and walking (17%). However, bicycling (3.5%) has the potential to significantly grow the sustainable transport mode share. The San Francisco Municipal Transportation Agency (SFMTA) has adopted strong goals through its Strategic Plan to decrease automobile trips and envisions bicycling trips rising two to three fold in the near term. The state of cycling today shows significant progress in making San Francisco a better city. This report on bicycling demonstrates where the city is and where it’s headed.
Bicycle Volumes• The US Census Bureau’s American Community Survey
(ACS) shows a 66% increase in bicycle commuters from 2002 (2.1% of work trips) to 2010 (3.5% of work trips), putting San Francisco third in the nation behind Portland, Oregon (6%) and Seattle, Washington (3.5%) in ridership among major US cities.
• Annual bicycle counts have more than doubled between 2006 (4,862 riders) and 2011 (10,139) at sampled locations.
• Two statistically significant random surveys of San Francisco residents during 2011 show that about 3.5% of all trips in the city are taken by bicycle, demonstrating that the ACS, local surveys and bike counts all corroborate one another to show steady increases in cycling.
• Local surveys and traffic modeling estimates show about 75,000 bike trips each day out of over two million total trips by all modes.
• San Francisco has a relatively high share of residents who bicycle at least occasionally – 34% take at least one trip per year on their bike, and 17% take at least one trip per week by bicycle. However, two-thirds of San Franciscans (66%) never use a bicycle at all.
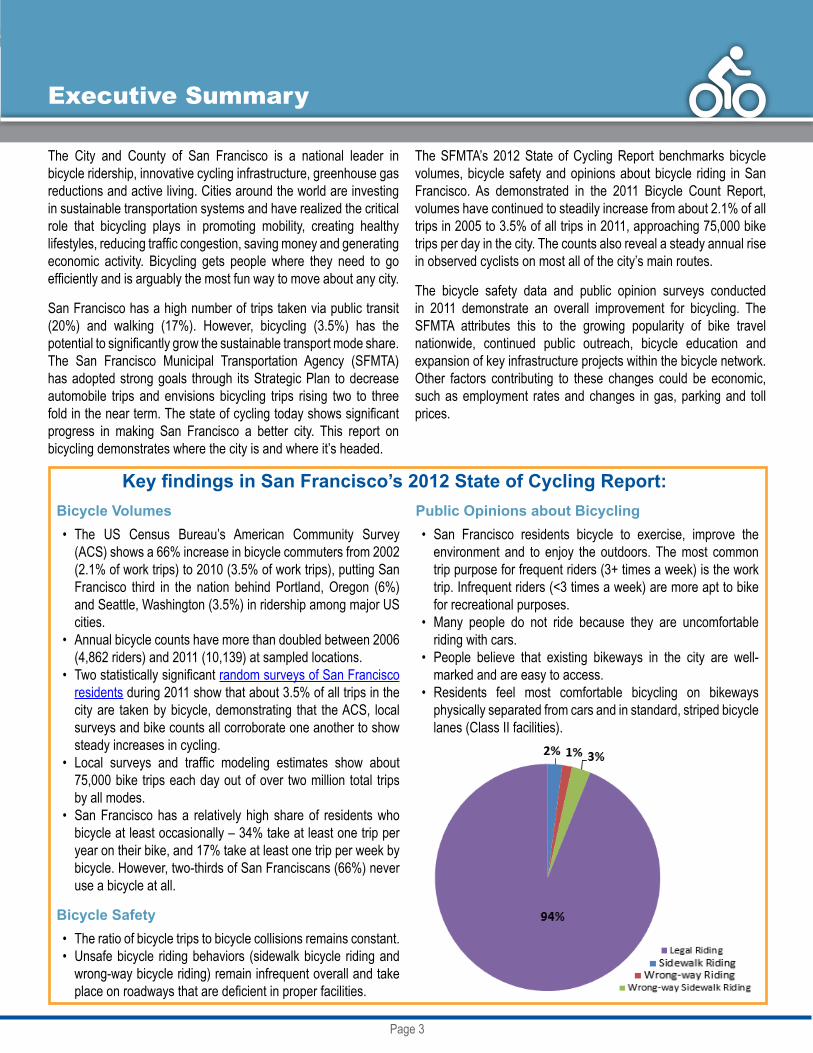
Bicycle Safety• The ratio of bicycle trips to bicycle collisions remains constant.• Unsafe bicycle riding behaviors (sidewalk bicycle riding and
wrong-way bicycle riding) remain infrequent overall and take place on roadways that are deficient in proper facilities.
Public Opinions about Bicycling• San Francisco residents bicycle to exercise, improve the
environment and to enjoy the outdoors. The most common trip purpose for frequent riders (3+ times a week) is the work trip. Infrequent riders (<3 times a week) are more apt to bike for recreational purposes.
• Many people do not ride because they are uncomfortable riding with cars.
• People believe that existing bikeways in the city are well-marked and are easy to access.
• Residents feel most comfortable bicycling on bikeways physically separated from cars and in standard, striped bicycle lanes (Class II facilities).
The SFMTA’s 2012 State of Cycling Report benchmarks bicycle volumes, bicycle safety and opinions about bicycle riding in San Francisco. As demonstrated in the 2011 Bicycle Count Report, volumes have continued to steadily increase from about 2.1% of all trips in 2005 to 3.5% of all trips in 2011, approaching 75,000 bike trips per day in the city. The counts also reveal a steady annual rise in observed cyclists on most all of the city’s main routes.
The bicycle safety data and public opinion surveys conducted in 2011 demonstrate an overall improvement for bicycling. The SFMTA attributes this to the growing popularity of bike travel nationwide, continued public outreach, bicycle education and expansion of key infrastructure projects within the bicycle network. Other factors contributing to these changes could be economic, such as employment rates and changes in gas, parking and toll prices.
Key findings in San Francisco’s 2012 State of Cycling Report:

Page 4
Like the 2008 State of Cycling report, the 2012 report provides guidance on bicycling improvement programs and infrastructure investments. The SFMTA is continuing to improve the bicycle network with limited resources, focusing on bicycle safety and continuing outreach to residents. However, there are areas for improvement to better accommodate people riding bicycles and
“The bicycle is the most civilized conveyance known to man. Other forms of transport grow daily more nightmarish. Only the bicycle remains pure in heart.”
~ Iris Murdoch, The Red and the Green
to increase bicycle trips, especially by infrequent users and non-cyclists. One such program is early education through school programs. Others involve creating new and innovative cycling facilities, traffic calming, cycle-track network development, secure bike parking and a set of public policies designed to make cycling faster, cheaper, and safer than alternatives.

Page 5
Table of Contents
“When I see an adult on a bicycle, I do not despair for the future of the human race.”
~ H.G. Wells
Executive Summary 3
Introduction 6 Purpose, National Leader, Growing Mode Share, Innovative Facilities, & Bike Score
Bicycle Volumes 11Manual Counts & American Community Survey
Bicycle Safety Trends 14Historical Collisions & Unsafe Behaviors
2011 Bicycle Surveys 16Phone Survey, Intercept Survey & Who is Riding in San Francisco?
Improvements for the Future 24Bicycle Programs & Infrastructure
Conclusion 27

Page 6
Introduction
Over the past decade, the number of people bicycling in San Francisco has increased substantially. The SFMTA 2011 Bicycle Count Report, released in December of 2011, contains a comprehensive look at volumes and ridership changes since 2006, including count methodology, locations, manual and automatic tallies. Annual bicycle counts have shown steady increases of people riding bikes since 2006, totalling 71% more ridership over the five year span. During 2010’s Bike to Work Day, over 600 bicycles were counted compared to 330 automobiles on Market Street between 8 and 9 a.m. The Bike to Work Day count taken at Van Ness Avenue and Market Street in 2012 showed a total of 1,031 bicycles, compared to 362 automobiles. This is an increase of 54 percent over a similar count by the SFMTA just one month prior. Bicycle use has increased on roadways where the city has installed bicycle lanes including Valencia Street, Polk Street and Fell Street.1 This data corresponds to that of the American Community Survey, which reported an overall increase in bicycle commuters in San Francisco from 2.1% 2005 to 3.5% in 2010.
The SFMTA recognizes and supports the increased popularity of bicycling and the associated economic, environmental, health and transportation benefits. At the same time, the agency is committed to growing the bicycling mode share while increasing safety and decreasing road user conflicts as more people begin to bicycle more frequently. This 2012 State of Cycling Report provides a snapshot of bicycling in San Francisco since the first State of Cycling Report in 2008. Some of the results are comparable across the two reports, providing an analysis of progress the SFMTA has made since 2008. This report also addresses ways that the SFMTA can increase safe bicycling in the future.
State of Cycling PurposeThis second State of Cycling Report gives a benchmark for bicycling in San Francisco. It provides an analysis of bicycling from information gathered via bicycle counts and surveys conducted between 2008 and 2011, as well as historical bicycle collision data. Comparing changes in data, it responds to the following questions:
• What trends in bicycle safety can be identified?• How often do people bicycle? • Who is bicycling and who is not?• What motivates people to bicycle? • What differences exist between people who bicycle and people
who do not?• What barriers prevent people from bicycling?
1 See evaluation reports for these three streets on the San Francisco Municipal Transportation Agency’s website: http://www.sfmta.com/cms/rbikes/3172.html
• How satisfied are riders with bicycle infrastructure?• How safe and comfortable do people feel when bicycling?• How well do people on bikes and drivers share the road?• How effective are the SFMTA’s bicycle outreach programs?
The 2008 State of Cycling Report was San Francisco’s first bicycle benchmarking report. It included results from the SFMTA’s annual bicycle counts and a citywide survey effort, providing recommendations and plans for future San Francisco bicycling reports. The 2012 State of Cycling Report establishes a new benchmark while providing an opportunity for comparison with results compiled from the 2008 report. It includes updated count information, bicycle collision trends and results from a new opinion survey. The 2012 State of Cycling Report also assembles information from the SFMTA’s 2011 bicycle count and collision reports as well as the results from the opinion survey. The survey was conducted in 2011 and includes the opinions of bicyclists and non-bicyclists regarding riding in San Francisco.

Page 7
National Leader in BicyclingSan Francisco supports bicycling through infrastructure development and maintenance, public safety, education, encouragement, and enforcement programs. San Francisco is one of ten “Gold Level Bicycle Friendly Communities” in the U.S., as designated by the League of American Bicyclists. The League of American Bicyclists defines a Bicycle Friendly Community as a place that welcomes bicyclists by providing safe accommodation for bicycling and encouraging people to use a bicycle for transportation and recreation.
Additionally, the Alliance for Biking & Walking gave high marks to San Francisco in the Bicycling and Walking in the United States 2010 Benchmarking Report.1 San Francisco ranks in the top third among 51 cities in bicycle and pedestrian safety, funding, staffing, policies and advocacy capacity. For the percent categories of bicycling to work and bicycling safety, San Francisco ranks third among the 51 cities.2 Finally, in comparison to the 51 other cities, San Francisco ranked second in combined miles of bicycle lanes, multi-use paths and signed bicycle routes per square mile.
Transit First PolicyThe City and County of San Francisco recognizes bicycling as a more affordable and sustainable travel choice than the automobile and establishes this in the City Charter Transit First policy (Section 8A.115). The Transit First policy includes a series of principles that relate to bicycling and promote it as a primary mode of transportation. The principles relevant to bicycling are:
• Public transit, including taxis and vanpools, is an economically and environmentally sound alternative to transportation by individual automobiles. Within San Francisco, travel by public transit, by bicycle and on foot must be an attractive alternative to travel by private automobile.
• Decisions regarding the use of limited street and sidewalk space shall encourage the use of public rights of way by pedestrians, bicyclists and public transit, and shall strive to reduce traffic and improve public health and safety.
• Bicycling shall be promoted by encouraging safe streets for riding, convenient access to transit, bicycle lanes and secure bicycle parking.
1 Available online, http://www.peoplepoweredmovement.org/site/. Viewed on 12/21/2010.2 Ranking based on 2007 American Community Survey and 2005-2007 Fatality Analysis Reporting System data.
The City Charter states that the Department of Parking and Traffic - DPT (in 1999 DPT was incorporated into SFMTA and is now named Sustainable Streets Division) manages the department so that it:
• Facilitates the design and operation of city streets to enhance alternative forms of transit, such as pedestrian, bicycle and pooled or group transit (including taxis);
• Proposes and implements street and traffic changes that give the highest priority to impacts on public transit, pedestrians, commercial delivery vehicles and bicycles; and
• Develops a safe, interconnected bicycle circulation network
Growing the Bicycle Mode Share In October 2010, the San Francisco Board of Supervisors unanimously adopted a resolution with the goal of achieving a 20% bicycle mode share by 2020. Concurrently, the SFMTA’s 2013 Strategic Plan identified a mode share goal of no more than 50% of all trips by automobile. One of the outcomes of the Strategic Plan, is a series of modal strategy documents which seek to improve conditions for people who walk and bicycle in San Francisco. The current trends in transportation require a rethinking of city priorities and investments if the city is to be successful in creating more active transportation options. Decreasing transportation funding, rising fuel and transportation costs, and concerns about quality of life provide a clear challenge for San Francisco. Recognizing these trends, investing in bicycling presents an opportunity to rethink the city’s transportation investments. Within the overall goal of growing bicycle mode share, there are two goals within the city that shape the recommendations of the 2012 Bike Strategy and help to contextualize the 2012 State of Cycling Report.
• The SFMTA’s fiscal year 2013-2018 Strategic Plan sets a goal of 50 percent of all trips for non-private auto (transit, walking, bicycling, taxi) by 2018 (an 11 percent shift away from the private auto-mode). Based on trends and funding available, up to half of this goal could be assigned to the bicycle mode resulting in a 9% mode share by 2018. This would put San Francisco’s bicycle ridership higher than any major U.S. city.
• In 2010, the San Francisco Board of Supervisors set a goal of growing bicycle mode share in San Francisco to 20% of all trips by 2020 (a 16.5 percent growth in bicycle trips and a commensurate shift away from private auto and transit trips today).
“For instance, the bicycle is the most efficient machine ever created: Converting calories into gas, a bicycle gets the equivalent of three thousand miles per gallon.”
~ Bill Strickland, The Quotable Cyclist

Page 8
Innovative Bike Facilities
Bicycle Parking and BikewaysSince the release of the 2008 State of Cycling Report, the SFMTA has implemented numerous bicycle projects from San Francisco’s 2009 Bicycle Plan including bikeways and bicycle parking citywide. Table 1 presents the increase in facilities since 2008. In total, the SFMTA has installed approximately 1,200 additional racks on sidewalks and in bicycle corrals (with more on the way). The citywide bicycle network has also expanded to include over 65 miles of lanes and 64 miles of sharrows, and it continues to grow. Planning continues for the Oak and Fell Street bikeways and the recent opening of the John F. Kennedy Drive bikeway is another example of a new innovative bike facility put in by SFMTA in cooperation with the Recreation and Parks Department.
A buffered bicycle lane is an exclusive bicycle facility within a roadway that provides a special or physical buffer from motor vehicle traffic. This buffered lane on John F. Kennedy Drive in Golden Gate Park opened in the spring of 2012.
Table 1: Increase in Facilities since the 2008 State of Cycling Report
Facility Type Facilities Before 2008 Since 2008 2012 Total(% change since 2008)
Bicycle Parking
Racks 1,400 1,191 2,591 (85%)Corrals 1 27 28 (n/a)Lockers 52 - (n/a)
Bikeways(Miles)
Lanes 45 20.4 65.4 (45%)Shared Use Path 31 - (n/a)
Sharrows 23 41 64 (178%)
* Number of bicycle parking racks. Each rack/locker creates at least two bicycle parking spaces. **There are 3-8 parking racks in each corral.***Total of 240 parking spaces available.
Page 9
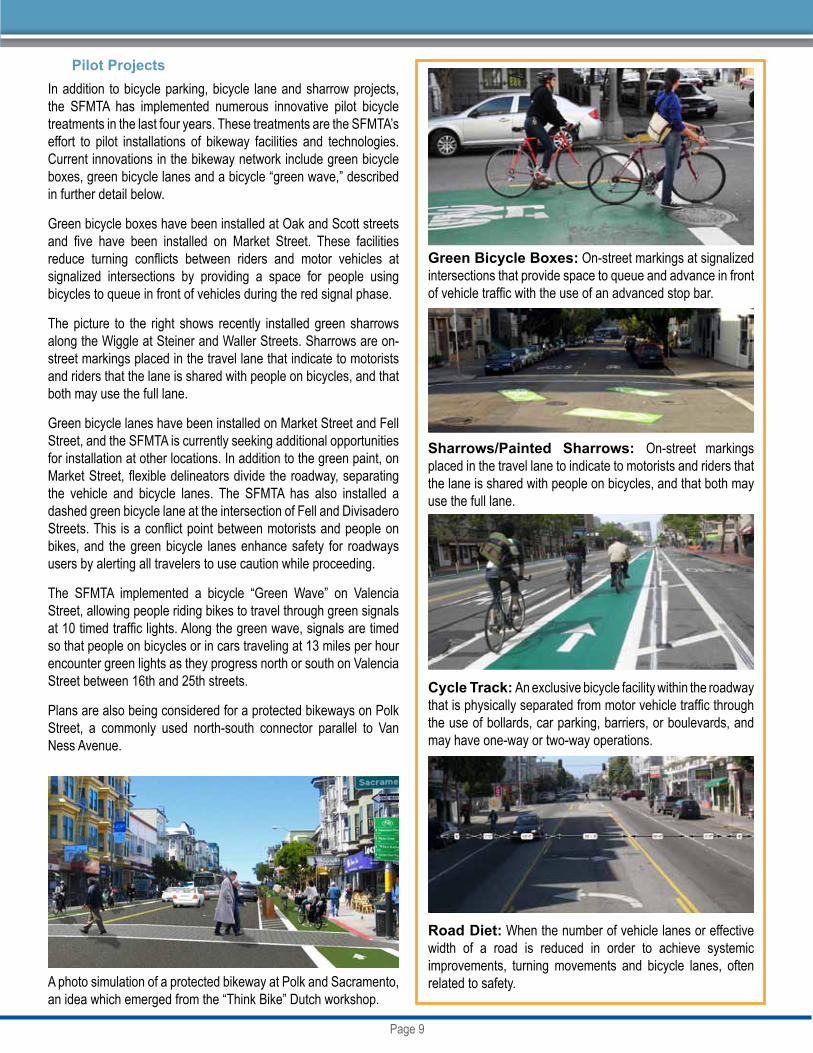
Pilot ProjectsIn addition to bicycle parking, bicycle lane and sharrow projects, the SFMTA has implemented numerous innovative pilot bicycle treatments in the last four years. These treatments are the SFMTA’s effort to pilot installations of bikeway facilities and technologies. Current innovations in the bikeway network include green bicycle boxes, green bicycle lanes and a bicycle “green wave,” described in further detail below.
Green bicycle boxes have been installed at Oak and Scott streets and five have been installed on Market Street. These facilities reduce turning conflicts between riders and motor vehicles at signalized intersections by providing a space for people using bicycles to queue in front of vehicles during the red signal phase.
The picture to the right shows recently installed green sharrows along the Wiggle at Steiner and Waller Streets. Sharrows are on-street markings placed in the travel lane that indicate to motorists and riders that the lane is shared with people on bicycles, and that both may use the full lane.
Green bicycle lanes have been installed on Market Street and Fell Street, and the SFMTA is currently seeking additional opportunities for installation at other locations. In addition to the green paint, on Market Street, flexible delineators divide the roadway, separating the vehicle and bicycle lanes. The SFMTA has also installed a dashed green bicycle lane at the intersection of Fell and Divisadero Streets. This is a conflict point between motorists and people on bikes, and the green bicycle lanes enhance safety for roadways users by alerting all travelers to use caution while proceeding.
The SFMTA implemented a bicycle “Green Wave” on Valencia Street, allowing people riding bikes to travel through green signals at 10 timed traffic lights. Along the green wave, signals are timed so that people on bicycles or in cars traveling at 13 miles per hour encounter green lights as they progress north or south on Valencia Street between 16th and 25th streets.
Plans are also being considered for a protected bikeways on Polk Street, a commonly used north-south connector parallel to Van Ness Avenue.
A photo simulation of a protected bikeway at Polk and Sacramento, an idea which emerged from the “Think Bike” Dutch workshop.
Road Diet: When the number of vehicle lanes or effective width of a road is reduced in order to achieve systemic improvements, turning movements and bicycle lanes, often related to safety.
Green Bicycle Boxes: On-street markings at signalized intersections that provide space to queue and advance in front of vehicle traffic with the use of an advanced stop bar.
Sharrows/Painted Sharrows: On-street markings placed in the travel lane to indicate to motorists and riders that the lane is shared with people on bicycles, and that both may use the full lane.
Cycle Track: An exclusive bicycle facility within the roadway that is physically separated from motor vehicle traffic through the use of bollards, car parking, barriers, or boulevards, and may have one-way or two-way operations.

Page 10
Bike Score (walkscore.com)Bike Score measures whether a location is good for biking on a scale from 0 - 100. San Francisco scored 70, tied for the second highest score in the nation with Portland, OR and only a few points behind Minneapolis, MN. Bike Score is based on bike infrastructure (lanes and trails), hills, destinations and road connectivity, and the number of bike commuters. A detailed methodology is available on their website. San Francisco scored best in the “destinations” category, as seen in the map to the left.
1. Minneapolis, MN: 792. Portland, OR: 703. San Francisco, CA: 704. Boston, MA: 685. Madison, WI: 67
In addition to the pilot projects now occurring in San Francisco, the SFMTA is planning future innovative projects. These include separated cycle tracks, contra-flow protected bicycle lanes and the implementation of a 50-station bicycle sharing pilot program in cooperation with several other Bay Area jurisdictions and transit operators.
“Melancholy is incompatible with bicycling.”
~ James E. Starrs
Bike sharing in Washington DC (pictured above) and Montreal, Canada (bottom right)
Page 11
Bicycle Volumes
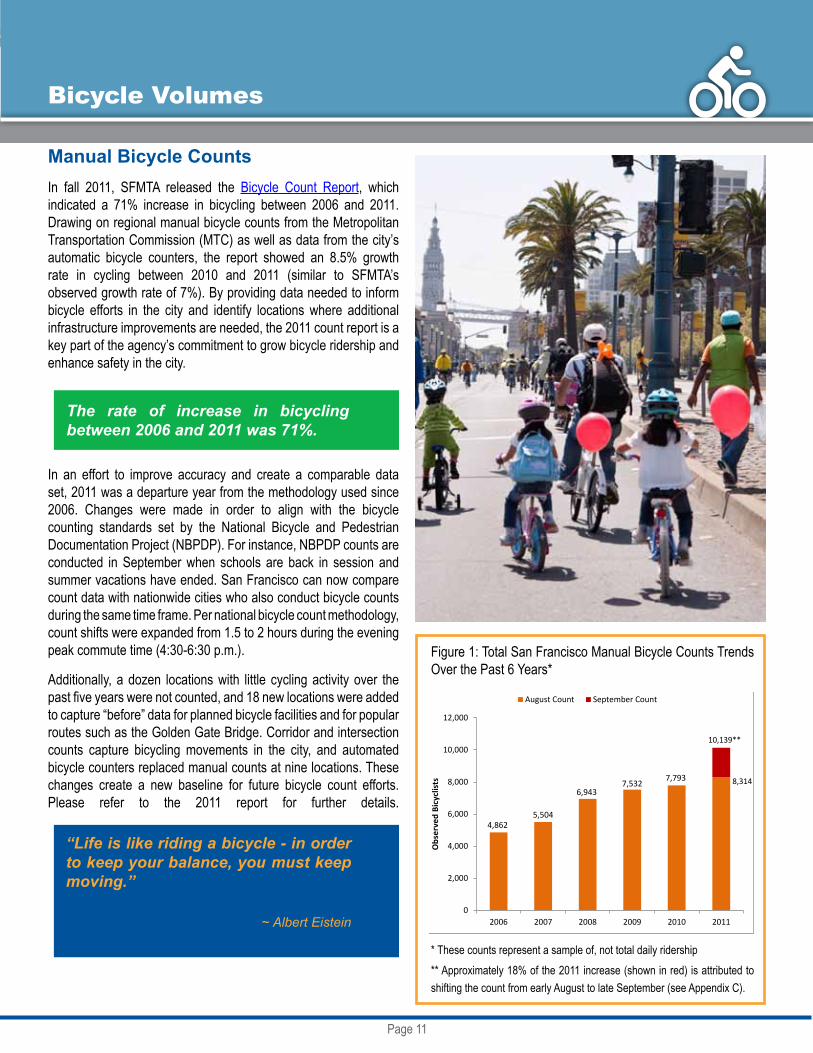
Manual Bicycle Counts In fall 2011, SFMTA released the Bicycle Count Report, which indicated a 71% increase in bicycling between 2006 and 2011. Drawing on regional manual bicycle counts from the Metropolitan Transportation Commission (MTC) as well as data from the city’s automatic bicycle counters, the report showed an 8.5% growth rate in cycling between 2010 and 2011 (similar to SFMTA’s observed growth rate of 7%). By providing data needed to inform bicycle efforts in the city and identify locations where additional infrastructure improvements are needed, the 2011 count report is a key part of the agency’s commitment to grow bicycle ridership and enhance safety in the city.
The rate of increase in bicycling between 2006 and 2011 was 71%.
In an effort to improve accuracy and create a comparable data set, 2011 was a departure year from the methodology used since 2006. Changes were made in order to align with the bicycle counting standards set by the National Bicycle and Pedestrian Documentation Project (NBPDP). For instance, NBPDP counts are conducted in September when schools are back in session and summer vacations have ended. San Francisco can now compare count data with nationwide cities who also conduct bicycle counts during the same time frame. Per national bicycle count methodology, count shifts were expanded from 1.5 to 2 hours during the evening peak commute time (4:30-6:30 p.m.).
Additionally, a dozen locations with little cycling activity over the past five years were not counted, and 18 new locations were added to capture “before” data for planned bicycle facilities and for popular routes such as the Golden Gate Bridge. Corridor and intersection counts capture bicycling movements in the city, and automated bicycle counters replaced manual counts at nine locations. These changes create a new baseline for future bicycle count efforts. Please refer to the 2011 report for further details.
“Life is like riding a bicycle - in order to keep your balance, you must keep moving.”
~ Albert Eistein
4,8625,504
6,9437,532
7,793 8314
0
2,000
4,000
6,000
8,000
10,000
12,000
2006 2007 2008 2009 2010 2011
Obs
erve
d Bi
cycl
ists
Manual Count TotalsAugust Count September Count
10,139**
8,314
* These counts represent a sample of, not total daily ridership** Approximately 18% of the 2011 increase (shown in red) is attributed to shifting the count from early August to late September (see Appendix C).
Figure 1: Total San Francisco Manual Bicycle Counts Trends Over the Past 6 Years*
Page 12
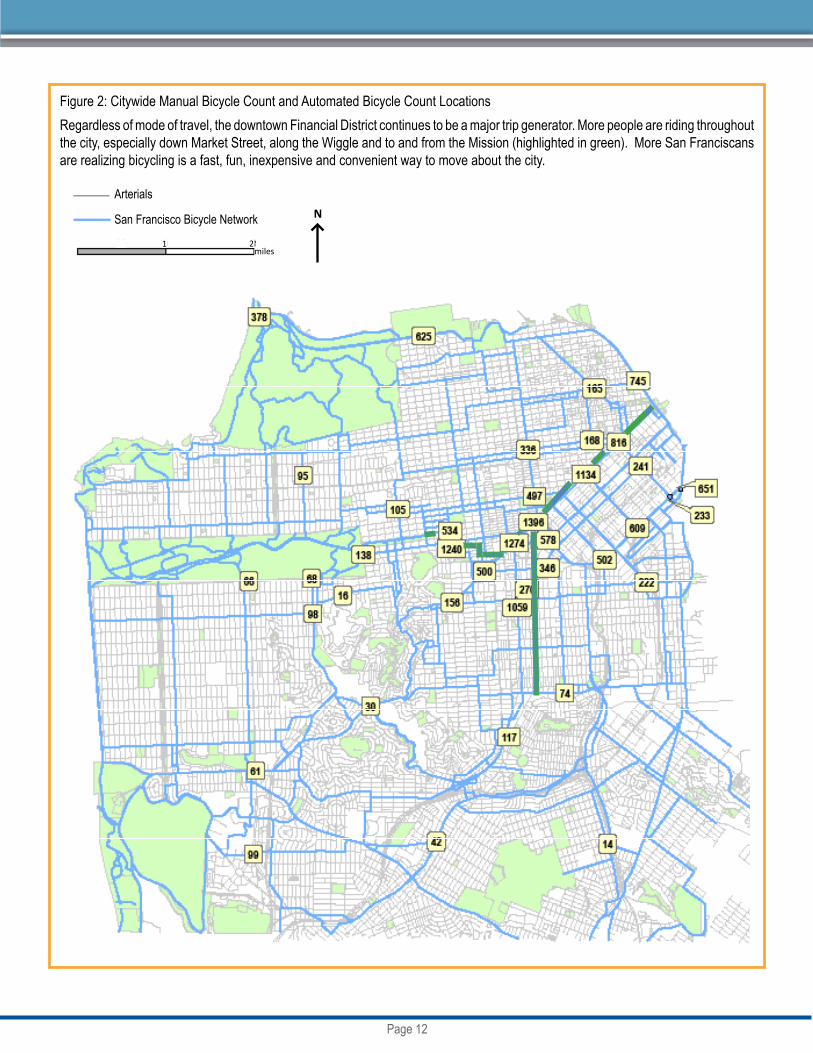
Figure 2: Citywide Manual Bicycle Count and Automated Bicycle Count LocationsRegardless of mode of travel, the downtown Financial District continues to be a major trip generator. More people are riding throughout the city, especially down Market Street, along the Wiggle and to and from the Mission (highlighted in green). More San Franciscans are realizing bicycling is a fast, fun, inexpensive and convenient way to move about the city.
Arterials
San Francisco Bicycle Network
miles21
N
Page 13
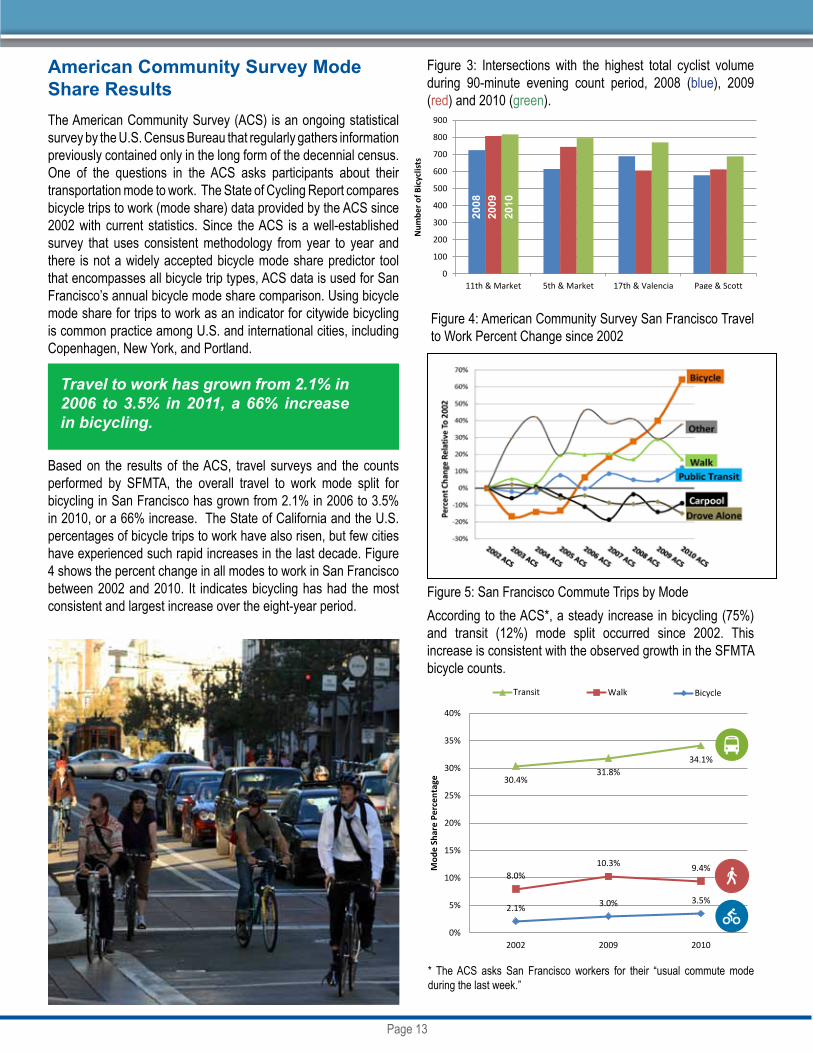
Figure 3: Intersections with the highest total cyclist volume during 90-minute evening count period, 2008 (blue), 2009 (red) and 2010 (green).
American Community Survey Mode Share ResultsThe American Community Survey (ACS) is an ongoing statistical survey by the U.S. Census Bureau that regularly gathers information previously contained only in the long form of the decennial census. One of the questions in the ACS asks participants about their transportation mode to work. The State of Cycling Report compares bicycle trips to work (mode share) data provided by the ACS since 2002 with current statistics. Since the ACS is a well-established survey that uses consistent methodology from year to year and there is not a widely accepted bicycle mode share predictor tool that encompasses all bicycle trip types, ACS data is used for San Francisco’s annual bicycle mode share comparison. Using bicycle mode share for trips to work as an indicator for citywide bicycling is common practice among U.S. and international cities, including Copenhagen, New York, and Portland.
Based on the results of the ACS, travel surveys and the counts performed by SFMTA, the overall travel to work mode split for bicycling in San Francisco has grown from 2.1% in 2006 to 3.5% in 2010, or a 66% increase. The State of California and the U.S. percentages of bicycle trips to work have also risen, but few cities have experienced such rapid increases in the last decade. Figure 4 shows the percent change in all modes to work in San Francisco between 2002 and 2010. It indicates bicycling has had the most consistent and largest increase over the eight-year period.
Figure 4: American Community Survey San Francisco Travel to Work Percent Change since 2002
0
100
200
300
400
500
600
700
800
900
11th & Market 5th & Market 17th & Valencia Page & Scott
2008 2009 2010
Figure 5: San Francisco Commute Trips by ModeAccording to the ACS*, a steady increase in bicycling (75%) and transit (12%) mode split occurred since 2002. This increase is consistent with the observed growth in the SFMTA bicycle counts.
30.4%31.8%
34.1%
8.0%10.3% 9.4%
2.1% 3.0% 3.5%
0%
5%
10%
15%
20%
25%
30%
35%
40%
2002 2009 2010
Mod
e Sh
are
Perc
enta
ge
Percent of Trips by Mode
Transit
Walk
Bicycle
30.4%31.8%
34.1%
8.0%10.3% 9.4%
2.1% 3.0% 3.5%
0%
5%
10%
15%
20%
25%
30%
35%
40%
2002 2009 2010
Mod
e Sh
are
Perc
enta
ge
Percent of Trips by Mode
Transit
Walk
Bicycle
30.4%31.8%
34.1%
8.0%10.3% 9.4%
2.1% 3.0% 3.5%
0%
5%
10%
15%
20%
25%
30%
35%
40%
2002 2009 2010
Mod
e Sh
are
Perc
enta
ge
Percent of Trips by Mode
Transit
Walk
Bicycle
30.4%31.8%
34.1%
8.0%10.3% 9.4%
2.1% 3.0% 3.5%
0%
5%
10%
15%
20%
25%
30%
35%
40%
2002 2009 2010
Mod
e Sh
are
Perc
enta
ge
Percent of Trips by Mode
Transit
Walk
Bicycle
* The ACS asks San Francisco workers for their “usual commute mode during the last week.”
Travel to work has grown from 2.1% in 2006 to 3.5% in 2011, a 66% increase in bicycling.
Num
ber o
f Bic
yclis
ts
2008
2009
2010

Page 14
Bicycle Safety Trends
Historical Bicycle CollisionsAn analysis of bicycle collisions provides a strong indication of roadway behaviors that negatively affect the safety of people riding bicycles.1 San Francisco uses this information to plan bicycle facility improvements and to identify violations that should be prioritized for increased education and enforcement. The SFMTA also works closely with the San Francisco Police Department to recommend traffic enforcement targeted at specific locations and for behaviors that are the leading causes of injury.
Figure 6 presents the recent annually reported bicycle injury collisions and bicycle count volumes. It shows that reported bicycle collisions and bicycle riding have increased concurrently in San Francisco between 2002 and 2011. Despite an increase in bicycle collision totals, Figure 6 reflects an increase in ridership as well, thus the overall collision rate is remaining relatively constant.
Figure 7 presents changes in bicycle injury collisions and bicycle commute mode share from the ACS between 2002 and 2009.
1 Collision data available to the SFMTA is from the Statewide Integrated Traffic Records System (SWITRS), maintained by the California Highway Patrol (CHP). Collision information in this report excludes those occurring on San Francisco freeways or private property, but includes collisions on city streets that are classified as state highways (such as 19th Avenue and Van Ness Avenue).
These two percentages grew similarly between 2006 and 2011, or as the bicycle mode share grew, so did the bicycle injury collisions.
Many international cities have experienced that an increase in the number of people riding bicycles on the road results in a decrease of bicycle collision rates.
The increases in bicycle ridership between 2007 and 2009 occurred with no infrastructure improvements (due to the injunction). Implementation of additional bicycle facilities, public outreach, focused safety improvements at high-crash locations and an increased presence of people riding bikes on the roads will likely assist in a desired trend of reduced bicycle collision rates. Many international cities have experienced that an increase in the number of people riding bicycles on the road results in a decrease of bicycle collision rates; this relationship is known as the “safety in numbers” effect.2 San Francisco may very well experience the same phenomenon as it gains greater ridership.
2 Jacobsen, PL. Safety in numbers: more walkers and bicyclists, safer walking and bicycling, Injury Prevention 2003;9:205–209
425 429364 360
307 311 316 343 343
451 468531
600 625
0
1000
2000
3000
4000
5000
6000
7000
8000
9000
0
100
200
300
400
500
600
700
1998 1999 2000 2001 2002 2003 2004 2005 2006 2007 2008 2009 2010 2011
Bicy
cle
Coun
ts
Num
ber o
f Inj
ury
Colli
sion
s
Year
Bicycle Injury Collisions Bicycle Counts
Figure 6: Bicycle Injury Collisions, 1998-2011 and Annual Bicycle Volumes, 2006-2011

Page 15
Figure 8: Bicycle Injury Collisions per 100,000 bicycling trips to work.
Of the total bicycle injury collisions between 1998 and 2009 where fault was assigned, 44 percent of the time fault was assigned to a driver, and 50 percent of the time fault was assigned to the bicycle rider.1 In collisions where motorists were assigned fault, the top three reasons were for turning without signaling, opening a car door when it was unsafe to do so, and failing to yield to oncoming traffic when making a left turn. In collisions where the person riding a bicycle was assigned fault, the top three reasons were for traveling at an unsafe speed, failure to stop at a red light, and riding on the wrong side of the roadway.
Unsafe BehaviorsMore detailed safety information is available from the SFMTA’s 2011 Bicycle Count Report. During these counts, the SFMTA records the number of people riding on sidewalks and in the wrong direction where on-street bicycle facilities exist and where they may be lacking. These behaviors are counted because they may lead to collisions between bicyclists and motorists or pedestrians. Additionally, it helps identify where infrastructure improvements may be needed or where additional education efforts could affect bicycling behaviors.
Between 2008 and 2011, the manual bicycle counts found a statistically significant decrease in sidewalk bicycle riding at nine locations. This indicates an overall improvement of safe bicycling behavior. This change could be related to education and outreach or an overall increase of on-street bikeway facilities on these or parallel streets.
Results from the manual bicycle counts found a statistically significant decrease in people riding on the wrong side of the street at three locations and an increase at two locations (out of 15 locations) between 2008 and 2011. Educating residents and visitors as to the proper side of the road on which to ride is a potential area of improvement.
1 The remaining 6 percent of fault was assigned to parked vehicles and pedestrians.
Figure 7: Percent Change in Bicycle Injury Collisions and Bicycle Mode Share Since 2002
“Get a bicycle. You will not regret it if you live.”
~ Mark Twain, “Taming the Bicycle”
-40%
-20%
0%
20%
40%
60%
80%
100%
2002 2003 2004 2005 2006 2007 2008 2009
Perc
ent
Year
Bicycle Injury Collisions ACS Bicycle Mode Share
0
2
4
6
8
10
12
14
16
18
20
2000 2002 2003 2004 2005 2006 2007 2008 2009
Bicy
cle
Inju
ry C
ollis
ions
per
100
,000
Bi
cycl
ing
Trip
s to
Wor
k
Figure 9: 2011 Bicycling Behavior

Page 16
2011 Bicycle Surveys
In 2011, the SFMTA undertook two surveys of San Francisco residents. Detailed summaries of the surveys can be found here at SFMTA’s Bicycle Reports and Studies website. The primary goals included:
• Providing a picture of bicycling in San Francisco, including what percentage of residents bicycle, how often they bicycle and who they are;
• Gaining more in-depth information on residents’ assessment of San Francisco’s biking infrastructure and resources;
• Assessing what motivates San Francisco residents who use a bicycle, as well as what inhibits San Francisco residents from bicycling more often; and
• Determining bicycle mode share through collection of trip diaries to assess how many and how often trips are taken by bicycle in San Francisco.
This section of the report provides a summary of the 2011 survey results. The study was carried out in two parts – a telephone and an intercept survey that totaled 1,063 interviews combined.
Phone SurveyThe telephone study was conducted among 424 San Francisco residents, randomized from a five-zone geographically representative sample, including landlines and cell phones. This portion of the study was primarily intended to:
• Provide overarching data, such as bicycling frequency among residents;
• Understand the proportion of non-cyclists, infrequent and frequent riders; and
• Gauge general public attitudes towards bicycling.
Results were balanced geographically based on a respondent’s home ZIP Code. The telephone survey was conducted in December 2010 and January 2011 in English, Spanish and Chinese.
Intercept surveyThe intercept study was conducted by surveying 639 people riding bicycles in San Francisco. By focusing solely on bicyclists, this aspect of the study allowed for analysis of opinions within the San Francisco bicycling community. Both frequent and occasional riders were included in the intercept study. Eighteen locations were chosen that represented different types of cycling areas. These included six high-volume bicycle locations; six locations described as “destination” locations (e.g., City College of San Francisco); and six as ”neighborhood” locations (primarily local shopping and dining areas). Surveying was conducted during January and February 2011 in English, Spanish and Chinese.
Figure 10: San Francisco Phone Survey Zones
“The bicycle is just as good company as most husbands and, when it gets old and shabby, a woman can dispose of it and get a new one without shocking the entire community.”
~ Ann Strong
Page 17
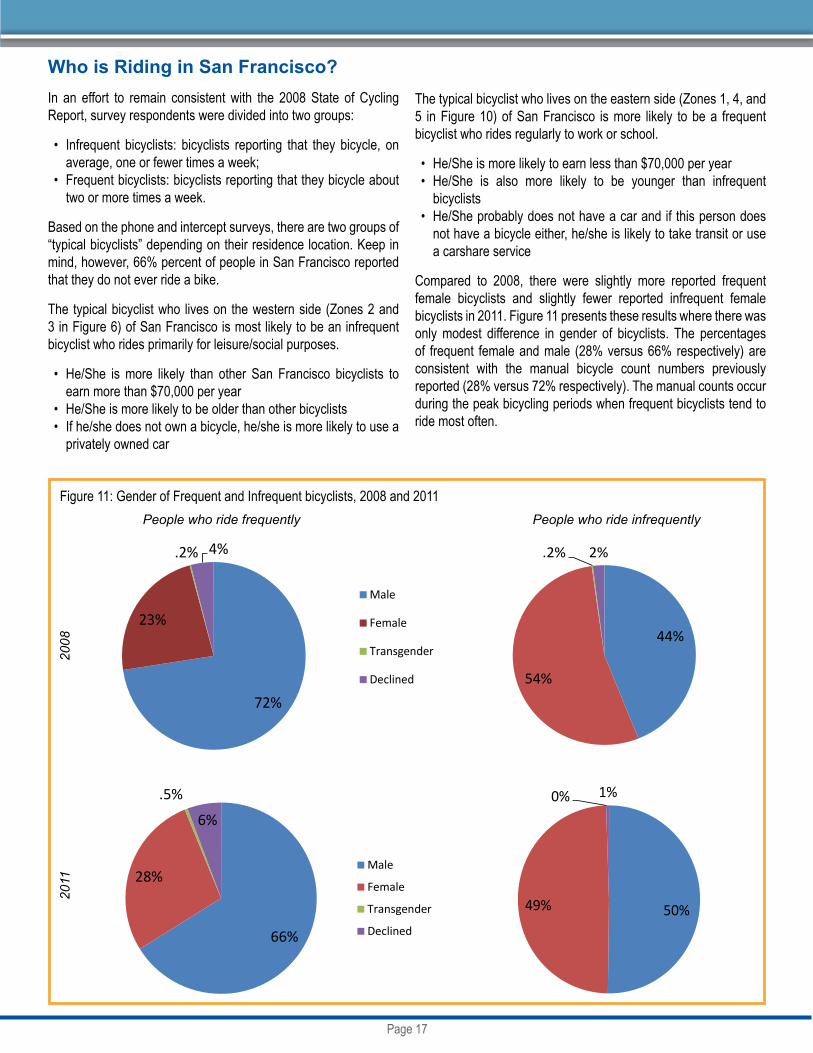
Who is Riding in San Francisco?In an effort to remain consistent with the 2008 State of Cycling Report, survey respondents were divided into two groups:
• Infrequent bicyclists: bicyclists reporting that they bicycle, on average, one or fewer times a week;
• Frequent bicyclists: bicyclists reporting that they bicycle about two or more times a week.
Based on the phone and intercept surveys, there are two groups of “typical bicyclists” depending on their residence location. Keep in mind, however, 66% percent of people in San Francisco reported that they do not ever ride a bike.
The typical bicyclist who lives on the western side (Zones 2 and 3 in Figure 6) of San Francisco is most likely to be an infrequent bicyclist who rides primarily for leisure/social purposes.
• He/She is more likely than other San Francisco bicyclists to earn more than $70,000 per year
• He/She is more likely to be older than other bicyclists• If he/she does not own a bicycle, he/she is more likely to use a
privately owned car
Figure 11: Gender of Frequent and Infrequent bicyclists, 2008 and 2011
The typical bicyclist who lives on the eastern side (Zones 1, 4, and 5 in Figure 10) of San Francisco is more likely to be a frequent bicyclist who rides regularly to work or school.
• He/She is more likely to earn less than $70,000 per year• He/She is also more likely to be younger than infrequent
bicyclists• He/She probably does not have a car and if this person does
not have a bicycle either, he/she is likely to take transit or use a carshare service
Compared to 2008, there were slightly more reported frequent female bicyclists and slightly fewer reported infrequent female bicyclists in 2011. Figure 11 presents these results where there was only modest difference in gender of bicyclists. The percentages of frequent female and male (28% versus 66% respectively) are consistent with the manual bicycle count numbers previously reported (28% versus 72% respectively). The manual counts occur during the peak bicycling periods when frequent bicyclists tend to ride most often.
People who ride frequently People who ride infrequently
2008
2011
72%
23%
.2% 4%
Male
Female
Transgender
Declined
44%
54%
.2% 2%
Male
Female
Transgender
Declined
66%
28%
.5%
6%
Male
Female
Transgender
Declined50%49%
0% 1%
Male
Female
Transgender
Declined
Page 18
Results: Survey Responses
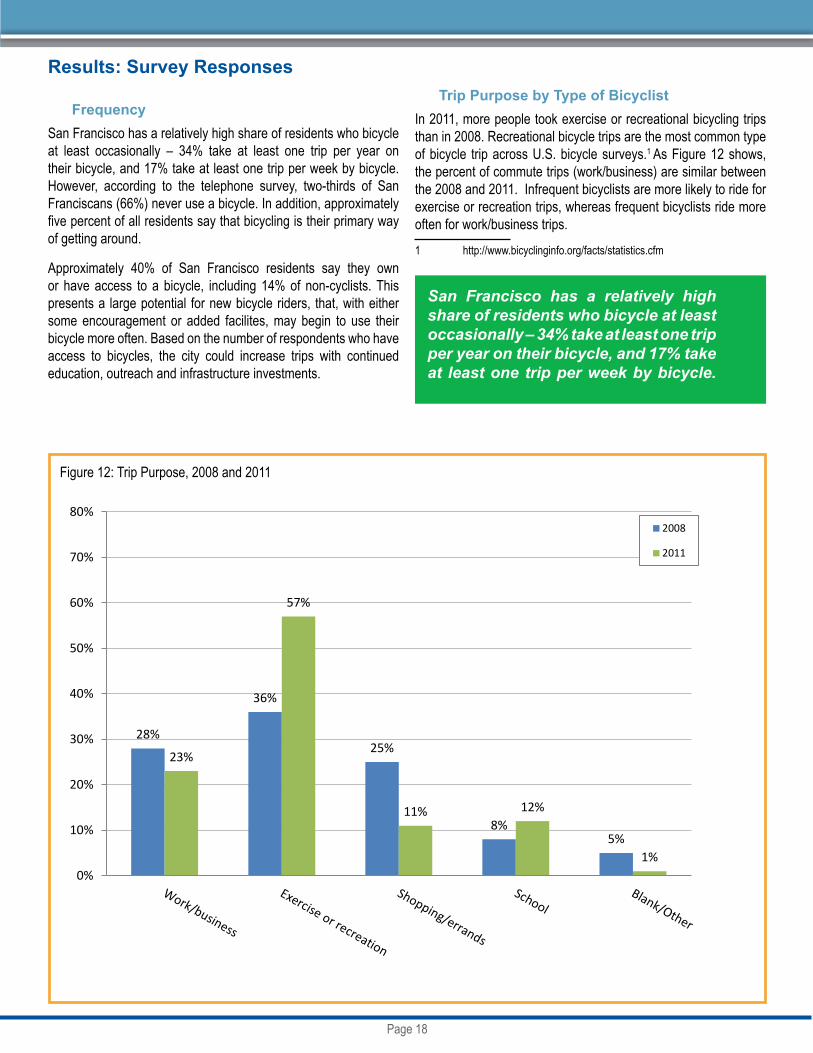
FrequencySan Francisco has a relatively high share of residents who bicycle at least occasionally – 34% take at least one trip per year on their bicycle, and 17% take at least one trip per week by bicycle. However, according to the telephone survey, two-thirds of San Franciscans (66%) never use a bicycle. In addition, approximately five percent of all residents say that bicycling is their primary way of getting around.
Approximately 40% of San Francisco residents say they own or have access to a bicycle, including 14% of non-cyclists. This presents a large potential for new bicycle riders, that, with either some encouragement or added facilites, may begin to use their bicycle more often. Based on the number of respondents who have access to bicycles, the city could increase trips with continued education, outreach and infrastructure investments.
Figure 12: Trip Purpose, 2008 and 2011
Trip Purpose by Type of BicyclistIn 2011, more people took exercise or recreational bicycling trips than in 2008. Recreational bicycle trips are the most common type of bicycle trip across U.S. bicycle surveys.1 As Figure 12 shows, the percent of commute trips (work/business) are similar between the 2008 and 2011. Infrequent bicyclists are more likely to ride for exercise or recreation trips, whereas frequent bicyclists ride more often for work/business trips. 1 http://www.bicyclinginfo.org/facts/statistics.cfm
San Francisco has a relatively high share of residents who bicycle at least occasionally – 34% take at least one trip per year on their bicycle, and 17% take at least one trip per week by bicycle.
28%
36%
25%
8%5%
23%
57%
11% 12%
1%0%
10%
20%
30%
40%
50%
60%
70%
80%2008
2011

Page 19
Trip Length by Type of BicyclistFrequent bicyclists take shorter trips than infrequent bicyclists. Trips by frequent riders average 37 minutes and people who ride one or fewer times per week average 51 minutes per trip. The 2011 survey asked participants the length of their most recent bicycle trip and as Figure 13 presents, infrequent and frequent bicyclists take different lengths of trips. This is likely related to the trip purpose since people who ride more regularly do so for commuting and errand running and their trips are shorter, whereas infrequent bicyclists are riding more for recreational purposes. Recreational trips are more commonly longer treks for exercise or leisure.
Figure 13: Trip Lengths by Type of rider
Origin and DestinationThe intercept survey indicates that a large number of bicycle trips start and end downtown, in the Mission District, Haight-Ashbury and areas south of Market Street. These areas also have a high number of frequent bicyclists, concentrating bicycle traffic in the eastern part of the city.
The following maps present the starting and ending points (by ZIP Code) of the surveyed trip for all bicyclists including those from the intercept and phone surveys. Darker colors on the map show the location of higher number of starting/ending points, while lighter colors show fewer starting/ending points. Note that every major residential ZIP Code in San Francisco (save for Treasure Island) had at least one starting/ending point.1
1 Approximately 5 percent of bicycle trips begin outside of San Francisco, while about 6 percent of bicycle trips end outside of San Francisco.
0
0.1
0.2
0.3
0.4
0.5
0.6
0.7
0.8
0.9
1
< 30 minutes 30 to 60minutes
61 to 90minutes
91 to 120minutes
> 120minutes
Infrequent
Frequent
San Francisco MTA Bicycle Program State of Cycling Report 2011
18
Starting Point of Most Recent Trip
Starting Point of Surveyed Trip (by ZIP Code)
Legend
Fewer than 10 trips10 25 trips25 40 trips40 65 trips65+ trips
N=762 responses(bike riders who completed starting point information)38 trips started outside San Francisco (not shown)
San Francisco MTA Bicycle Program State of Cycling Report 2011
19
End Point of Most Recent Trip
End Point of Surveyed Trip (by ZIP Code) Legend Fewer than 10 trips 10 ‐25 trips 26‐40 trips 41‐65 trips 66+ trips N=761 responses (bike riders who completed starting point information) 46 trips ended outside San Francisco (not shown)
Page 20
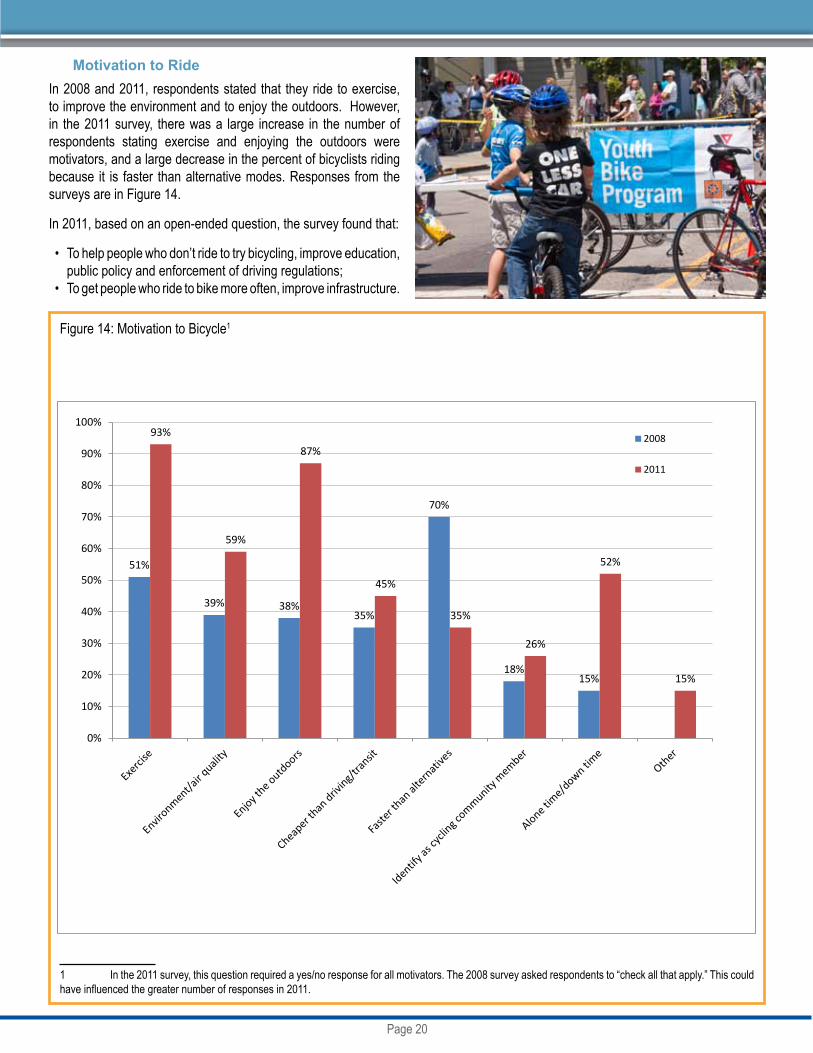
Motivation to RideIn 2008 and 2011, respondents stated that they ride to exercise, to improve the environment and to enjoy the outdoors. However, in the 2011 survey, there was a large increase in the number of respondents stating exercise and enjoying the outdoors were motivators, and a large decrease in the percent of bicyclists riding because it is faster than alternative modes. Responses from the surveys are in Figure 14.
In 2011, based on an open-ended question, the survey found that:
• To help people who don’t ride to try bicycling, improve education, public policy and enforcement of driving regulations;
• To get people who ride to bike more often, improve infrastructure.
Figure 14: Motivation to Bicycle1
1 In the 2011 survey, this question required a yes/no response for all motivators. The 2008 survey asked respondents to “check all that apply.” This could have influenced the greater number of responses in 2011.
51%
39% 38%35%
70%
18%15%
93%
59%
87%
45%
35%
26%
52%
15%
0%
10%
20%
30%
40%
50%
60%
70%
80%
90%
100%2008
2011

Page 21
Barriers to Bicycling Almost half of the people who don’t ride said that it was because they are uncomfortable biking with cars. Figure 15 shows that infrequent bicyclists cited other barriers: destinations are too far away; they are traveling with children or heavy items; and they find it difficult to cross major streets without designated bicycle lanes. Frequent riders rated traveling with children or heavy items, lack of secure bicycle parking and not enough bicycle lanes as their top barriers. Based on an open-ended question, 20 percent of non-cyclists indicated the barriers they have to bicycling may be overcome with social, educational and resource-based efforts
Figure 15: Barriers to Infrequent and Frequent bicyclists, 2008 and 20111
1 2008 and 2011 figures are separated into two charts because the question was asked differently between surveys.
(e.g., finding people to bicycle with, finding affordable/discounted bicycles, learning the rules of the road and safer routes to travel, etc.).
Barriers for both infrequent and frequent bicyclists decreased significantly between 2008 and 2011. This can likely be attributed to the lifting of the injunction and corresponding increase in bicycle facilities, which has improved both the real and perceived safety of the city’s bicycle network. The charts below show significant drops in percentages for all questions between 2008 and 2011.
2008
2011
79%75%
73%
64% 64%
71%
61%
68% 67%
80%
0%
10%
20%
30%
40%
50%
60%
70%
80%
90%
100%
I’m not comfortable biking with cars
There are not enough bikelanes
It’s too difficult to cross major streets
Places are too far away orthere are too many hills
I need to travel with smallchildren/heavy items
Infrequent Frequent
44%
24%27% 28% 27%
16%
23%
12%15%
30%
0%
10%
20%
30%
40%
50%
60%
70%
80%
90%
100%
I’m not comfortable biking with cars
Places are too far away orthere are too many hills
It’s too difficult to cross major streets
I need to travel with smallchildren/heavy items
There are not enough bikelanes
Infrequent Frequent
20% 17%11%
24%
0%
10%
20%
30%
40%
50%
60%
70%
80%
90%
100%
I don't want to get sweaty beforework
I don't have secure bicycleparking
Infrequent
Frequent

Page 22
Satisfaction with Bicycling InfrastructureSurvey respondents agreed that bikeways are well marked and are easy to access from home and scored their satisfaction of bicycling infrastructure higher in 2011 than in 2008. As described in this report, the SFMTA has been expanding and improving the citywide bicycle network since the lifting of the Bicycle Plan injunction. As Figure 16 presents, comparing responses from the 2008 to the 2011 State of Cycling survey shows that bicyclists are noticing these improvements.
Looking forward, respondents would like to see more room for bicycles on most streets, improvements in pavement conditions and ways to make them feel safer from traffic. This feedback plays well into SFMTA’s complete streets and better streets plans.
Figure 16: Bicyclists’ Assessment of Conditions (on a scale of 1-5, 2008 in red, 2011 in blue)Strongly Agree
Strongly Disagree
The SFMTA has been expanding and improving the citywide bicycle network since the lifting of the Bicycle Plan injunction.
3
3.4
3.9
3.4
2.7
2.22.3
3.71
3.54
3.35
3.18
2.852.7
2.37
1
2
3
4
5
Bikeways are well-marked with
stripes, signs, andstencils.
Bikeways are easyto get to from my
home.
If there were morestriped bike lanes,I would bike more.
Bikeways take mewhere I need to
go.
There is enoughroom on most
streets to bicycle.
The pavement is ingood condition for
bicycling.
I feel safe fromtraffic on a bicycle.
Strongly Agree
Strongly Disagree

Page 23
Figure 17: Bicyclists’ Comfort Riding on Different Bikeway Types1
1 Question not asked in the 2008 State of Cycling
Figure 18: Respondents’ Awareness of SFMTA Bicycling Materials and Outreach
“The bicycle is the perfect transducer to match man’s metabolic energy to the impedance of locomotion. Equipped with this tool, man outstrips the efficiency of not only all machines but all other animals as well.”
~Ivan Illich, Energy and Equity, 1974
Bikeway PreferencesRegardless of bicycling frequency, 94 percent of survey respondents stated that they feel comfortable riding on bikeways that are physically separated from cars and 89 percent stated they feel comfortable riding in standard bicycle lanes. Generally, people prefer a designated space that does not conflict with vehicle traffic. These results support industry research and follow recent SFMTA efforts to install bikeways separated from traffic, including buffered bicycle lanes and striped bicycle lanes where feasible.
Awareness of SFMTA Projects and Programs
Between 2008 and 2011, there was an increase in the awareness of SFMTA projects and programs. Responses were similar across the two surveys but with more awareness of the outreach campaigns in 2011. That survey found a greater awareness by frequent bicyclists of all materials and outreach other than public campaigns, such as the “walk your bike on the sidewalk” poster campaign. More importantly, in 2011, infrequent bicyclists were more aware of the SFMTA’s outreach, maps and website efforts than in the 2008 survey.
The SFMTA and our partners like the San Francisco Bicycle Coalition perform considerable outreach in an effort to encourage more people to bicycle and to raise awareness of safe bicycling techniques. These efforts occur through various means including public campaigns, the SFMTA website and other social media efforts.
2008 2011
Ninety four percent of survey respondents stated that they feel comfortable riding on bikeways that are physically separated from cars and 89 percent stated they feel comfortable riding in standard bicycle lanes.
26%20%
12% 9%
43%53%
28% 24%
0%10%20%30%40%50%60%70%80%90%
100%
Public outreachcampaigns
City bike maps City bicyclingwebsite
Cyclist safetytraining classes
Infrequent
Frequent
43%
25%
13% 9%
39%
57%
30%35%
0%10%20%30%40%50%60%70%80%90%
100%
Public outreachcampaigns
City bike maps City bicyclingwebsite
Cyclist safetytraining classes
Infrequent
Frequent
94%87%
35%
17%
94%89%
53%
29%
0%
10%
20%
30%
40%
50%
60%
70%
80%
90%
100%
Bikeways Separatefrom Cars
Bike Lanes Sharrows No Bikeway
Infrequent
Frequent
Page 24
Improvements for the Future
The 2012 State of Cycling Report provides valuable guidance to the City of San Francisco on bicycling improvements for both programs and infrastructure. The SFMTA is increasing the size of the bicycle network, working to improve safety and continuing outreach to residents. As a result, more bicyclists are on San Francisco streets. However, there are areas of improvement that the city can address to better accommodate existing bicyclists and continue to work to increase bicycle trips, especially by infrequent users and non-cyclists.
Bicycle ProgramsTo increase bicycle ridership and meet the Board of Supervisors’ bicycle mode share goal of 20% by 2020, the SFMTA needs to continue its effort to educate and encourage people about safe riding practices, encourage motorists to share San Francisco streets, retrofit streets where possible to better accommodate cycling facilities and enforce potentially harmful behavior on the roadways. Specific program enhancements are described below.
Continuing Bicycle EducationThe large percentages of non-cyclists reporting that they are not comfortable bicycling with cars (50 percent) and that it is difficult crossing major streets (31 percent), indicate that these barriers may be overcome with social, educational and resource-based efforts. This suggests a need for continued bicycle education programs. The SFMTA funds bicycle safety classes for youth and adults. However, based on the low awareness of these classes as found in the survey (11 percent of bicyclists), the SFMTA should seek additional methods of advertising these classes and hold them in locations so new populations of non-cyclists and infrequent bicyclists are present. Bicycle education classes could be part of language classes at community and neighborhood centers.
With funding from the SFMTA, the San Francisco Bicycle Coalition held a total of 123 classes between May 2009 through July 1, 2012. This was a significant community safety benefit for all users of the public right of way, educating over 3,000 people who ride bikes and drive cars on the streets of San Francisco.
Classes have been held at over 50 locations across the city, in a diverse number of neighborhoods and every Supervisorial district; and have been offered in Spanish. In the fall of 2012, a Cantonese curriculum will be launched to complement the other classes. The classes are attended by people of all ages, races, and a majority of attendees were female. Classes were split between people who ride frequently (~35%) and those who have never ridden a bicycle (~30%).
SFMTA Website
Of the survey respondents, 23 percent are aware of the website for bicycling resources. As previously stated, SFMTA Livable Streets started a Facebook page in 2010 that may draw more attention to the bicycle program and Livable Streets website and materials. The SFMTA should continue updating the website and provide links via the agency Facebook page.
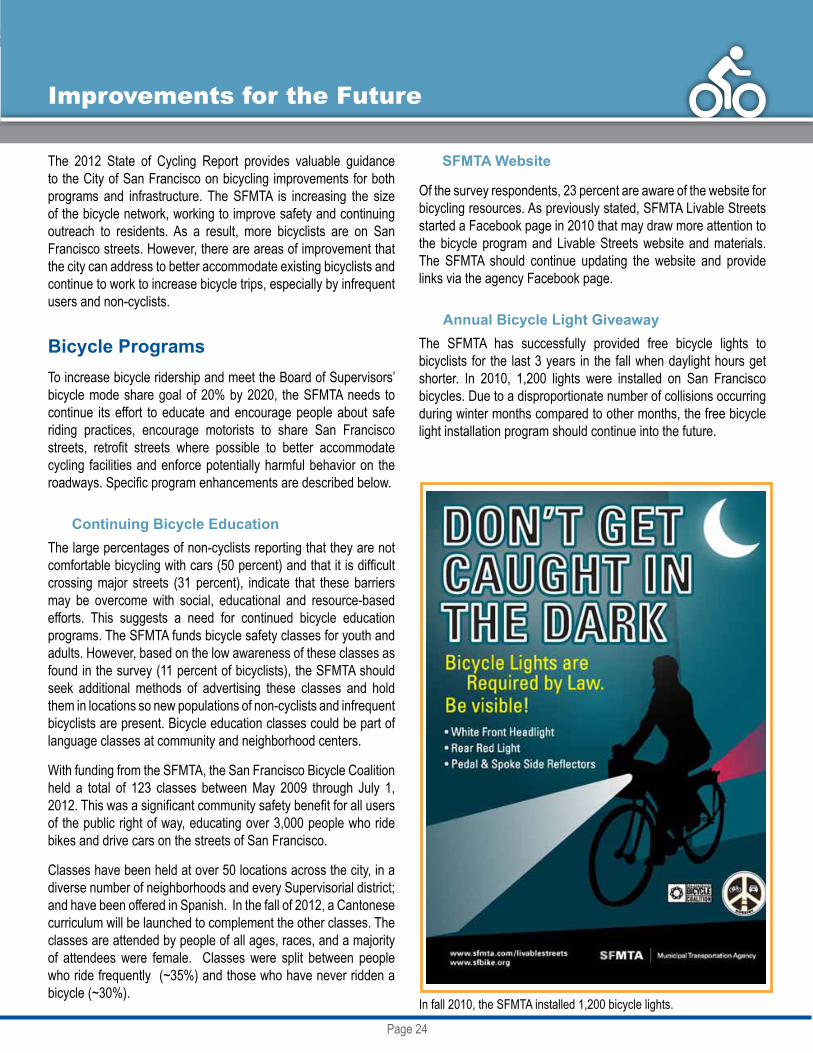
Annual Bicycle Light GiveawayThe SFMTA has successfully provided free bicycle lights to bicyclists for the last 3 years in the fall when daylight hours get shorter. In 2010, 1,200 lights were installed on San Francisco bicycles. Due to a disproportionate number of collisions occurring during winter months compared to other months, the free bicycle light installation program should continue into the future.
In fall 2010, the SFMTA installed 1,200 bicycle lights.

Page 25
Target PopulationsAs the 2011 State of Cycling Report points out, there are many San Francisco residents with bicycles that are not used, or are not used often. The City and County should provide programs and facilities aimed at making these residents comfortable using a bicycle. Based on the survey responses, these education and encouragement programs should be directed to specific groups in San Francisco. Generally, these are the populations underrepresented in the frequent and infrequent user groups compared to the general population. The survey found the following underrepresented populations:
• Women: 74 percent of women do not ride a bicycle compared to 60 percent of men.
• Ages 45 and older: 45 percent of those over 45 years of age say they never bicycle.
• Race/Ethnicity: 75 percent of Hispanic, 71 percent of Asian, and 83 percent of African-American populations do not bicycle compared to 61 percent of white respondents.
The city should continue identifying safety and outreach programs targeted at these populations.
Enforcement CoordinationThe SFMTA is working with the San Francisco Police Department (SFPD) on bicycle enforcement, since 17 percent of survey respondents stated that greater enforcement of vehicles violating traffic regulations could motivate them to bicycle more frequently. For example, the two agencies are working together on targeted enforcement of specific violations at specific locations to improve the behavior of bicyclists, pedestrians and motorists alike. These are determined based on historical collision trends. Additionally, the SFPD is actively enforcing motorists parking in bicycle lanes. Enforcement efforts should be publicized so both motorists and would-be bicyclists know they are occurring. These efforts could also help to decrease bicycle collisions.
Continue Bicycle Counts and SurveysIn comparison to other jurisdictions, the SFMTA is a leader in bicycle data collection. The annual bicycle counts, collision analysis, Bike to Work Day counts and the implementation of citywide automated bicycle counters demonstrate the Agency’s dedication to this effort. These data sources are useful for State of Cycling reports, citywide project development and targeted outreach and enforcement. The SFMTA should continue these efforts, especially as additional bikeway facilities are installed including before and after counts at specific project locations. These efforts demonstrate the benefits of bikeway projects including bicycle volumes, air quality and transportation mode shift.
Bicycle InfrastructureIn addition to programmatic improvements, the SFMTA needs to continue implementing bikeway projects in the Bicycle Plan and innovative strategies to improve the comfort of riding. All current and future cyclists can attest to the need to provide more bike lanes, paths, and protected ways to better connect the city and improve the overall quality of the bicycle experience. This is one of the primary ways public agencies can attract more people to ride more often. This could continue to increase bicycle ridership and in combination with programmatic efforts, improve bicycling safety.
Stripe Bicycle LanesHalf of all survey respondents stated that they would bicycle more if there were more bicycle lanes while 54 percent of infrequent bicyclists and 60 percent of frequent bicyclists stated that there are not enough bicycle lanes. Additionally, 81 percent of survey respondents said they feel comfortable riding in bicycle lanes. The SFMTA should continue installing bicycle lanes on the citywide bicycle network. Where feasible, the lanes should be buffered from motorized vehicle lanes, providing separation of uses.
The SFMTA has led enforcement outreach campaigns, including posters informing bicyclist to walk their bike on the sidewalk.

Page 26
Provide Separated BikewaysRegarding the striping of bicycle lanes, the SFMTA should install additional separated bikeways. Over 90 percent of survey respondents stated that they feel comfortable in bikeways separated from cars. The SFMTA should continue seeking opportunities to develop separated bikeways, buffered from moving motorized traffic by a curb, painted buffer, or in some cases, a parking lane.
Implementation of Bicycle ParkingThe SFMTA has installed approximately 700 bicycle racks since 2008. The Capital Plan for the agency contains programs for both long term secure bike storage (corrals, bike lockers, rooms, transit stations, etc.) as well as short term program for racks in front of businesses and on the street, in parklets and at high demand locations. Of survey respondents, about 20 percent bicyclists stated that not having secure bicycle parking was a barrier to bicycling more frequently. The Board of Supervisors also recently adopted an ordinance allowing bikes inside commercial and work-place buildings if secure bike parking is not provided. The SFMTA has a long list of requests for corrals and sidewalk bicycle parking. The agency should continue filling these requests citywide and provide additional opportunities for secure bicycle parking and bicycle stations.
“The bicycle had, and still has, a humane, almost classical moderation in the kind of pleasure it offers. It is the kind of machine that a Hellenistic Greek might have invented and ridden. It does no violence to our normal reactions: It does not pretend to free us from our normal environment.”
~J.B. Jackson
Bay Area Regional Bike Share ProgramSFMTA is a key partner in the regional bicycle share pilot program led by the Bay Area Air Quality Management District (BAAQMD). The bike share program will deploy 1,000 bicycles regionally at up to 100 stations along the Peninsula transportation corridor. Partner cities include Palo Alto, San José, Mountain View and Redwood City. San Francisco will have the largest presence, with 500 bicycles and approximately 50 stations in the city during the initial phase of the project.
The pilot service area will be centered in San Francisco’s employment and transit-rich Downtown area between the Financial District, Market Street and the Transbay and Caltrain terminals. This area is notably flat, has the densest bikeway network coverage in San Francisco and enjoys the highest levels of bicycling. The program will help those who commute by transit from cities to the east and south and encounter difficulties bringing a bicycle on BART or Caltrain during the peak commute hours. Bike sharing will provide many benefits to San Francisco residents, workers, and visitors, such as increasing accessibility to local and regional transit services, providing an alternative transportation option for short trips, and serving as an alternative to congested transit lines. Other potential benefits include user cost savings, travel time savings, and improved public health.
Page 27
Conclusion
The State of Cycling in San Francisco is strong. It can and should continue to get stronger. Most people who frequent the streets of San Francisco will note that the use of the bicycle for recreational and utilitarian trips is noticeably on the rise. Data collected by the SFMTA through manual and automated counts over the past six years undeniably confirms this fact. Regional and national surveys, such as the American Community Survey also arrive at the same conclusion. So now that San Francisco is experiencing the most significant growth in planning, ridership and infrastructure development for bicycling in its history, what comes next?
The next decade will look different from the previous ones in how the city focuses its resources. Diminishing government funding levels will require substantial changes in how San Francisco funds and prioritizes space for mobility within public rights of way. For transportation, this means focusing on cost-effective projects and programs with the most positive return to the economy, public health and personal mobility. There is no longer a car versus transit versus bicycle debate; future investments in safety and infrastructure are about how the city’s limited resources can move the most people with least cost (capital and operating) in the safest, most convenient way.
San Franciscans are looking for better transportation choices and most do not want to rely on a car to meet all of their travel needs. The bicycle should play a growing role in mobility in the city and the SFMTA will do all it can to make it as common as walking, driving, and taking transit.
Bicycling makes sense for a host of reasons, but many residents have reservations about making the switch to riding when it comes to traffic safety and convenience. Just as San Francisco’s decision makers made choices decades ago to accommodate the automobile, now is the same decision point to accommodate bicycles – albeit at a fraction of cost to the city, individuals and society.
Finally, accomplishing this change cannot come from infrastructure alone. Easy bicycle access, safe storage, strong public policies, clever marketing, targeted education and complementary transportation pricing measures are critical to continue the rapid rise in bicycle mode share and the growth of San Francisco’s active and sustainable transport modes.
Page 28
SFMTA | Municipal Transportation Agency1 South Van Ness Avenue, 7th FloorSan Francisco, CA 94103www.sfmta.com