2012 investors’ day - total.com · * including 2012 start-ups . production growth . mboe/d -...
TRANSCRIPT

Investor Relations – www.total.com 1
INVESTORS’ DAY 2012

Investor Relations – www.total.com 2
OUTLOOK & OBJECTIVES
Christophe de Margerie Chairman and Chief Executive Officer

Investor Relations – www.total.com 3
Key messages
New dynamic in action
Delivering near-term profitable growth
Creating value for shareholders

Investor Relations – www.total.com 4
Strong oil market fundamentals
Challenges to increase supply due to project complexity, access to financing and geopolitical constraints
Demand growth driven by non-OECD countries
Limited spare capacity
Influence of OPEC to manage market balance
Oil production capacity and demand Mb/d
Spare capacity
Demand
North / South America
Europe, CIS Asia
Middle East
Africa
2010 2020 2025
100
2015 2030
Capacity by region

Investor Relations – www.total.com 5
Increasing global gas demand
New LNG projects needed to satisfy European and Asian demand, even with potential additional supply from shale gas
Satisfaction of gas demand by region Bcf/d
Europe +1.3% CAGR
Asia +4.4% CAGR
North America +1.1% CAGR
2010
100
50
2030 2010 2030 2010 2030
Local gas demand
2010-30 global gas demand +2% per year Increasing faster than oil demand, driven by Asia
Asia: Bangladesh, China, India, Japan, Myanmar, Pakistan, Singapore, South Korea, Taiwan, Thailand, Vietnam

Investor Relations – www.total.com 6
Favorable oil and gas environment with year-to-date Brent above 110 $/b and ERMI above 30 $/t
Cash breakeven* at 105 $/b in 1H12 and gearing at 21% end June 2012
Acquired high-potential exploration acreage
4 new start-ups including Usan and 5 FIDs of major projects including Ichthys, Tempa Rossa and Martin Linge
Downstream restructuring in progress and new organization in place
Confidence in outlook confirmed by 3.5% dividend increase
Delivering results in 2012
* Breakeven = Brent price needed to cover net investments and dividend

Investor Relations – www.total.com 7
HSE top priority
On track for reducing flaring by 50% between 2005 and 2014
Safety culture embedded in our activities Reacting and learning from incidents
On track for targeted 15% reduction per year in TRIR
Minimizing environmental impact Safety first
Reducing greenhouse gas emissions Improving energy efficiency and water management
Volume of gas flared Msm3/d
TRIR (Total Recordable Injury Rate) Group per million man-hours worked
Total workforce committed to responsible development

Investor Relations – www.total.com 8
Upstream, building sustainable, profitable growth
Prioritizing safety
Emphasizing exploration • Appraising recent discoveries • Drilling high-potential new acreage
Focusing on execution to deliver profitable growth • ~3 Mboe/d production potential in 2017 • 30 B$ of value creation with projects under development
Optimizing portfolio with more active asset sales

Investor Relations – www.total.com 9
* Including 2012 start-ups
Production growth Mboe/d - Brent price 100 $/b
100% of 2015 target already in production or under development
Acceleration of growth post-2015
Potential for 3 Mboe/d in 2017 with 70% of new production already sanctioned
Main projects under study for 2017 growth: Egina, Kaombo, Moho
On track for 2015 target and confident in 2017 growth
Sanctioned projects fueling production growth

Investor Relations – www.total.com 10
High quality of Upstream projects
* Source: based on Wood Mackenzie data GEM Q2 Brent LT 85 $12/b, real terms; Major peers: Exxon, Shell, Chevron and BP ** Total’s estimates as of 31/12/12 for sanctioned projects (incl. 2012 start-ups), WACC = 8%
B$
Capital employed and NPV forward of Total’s sanctioned projects**
Expected return of 2012-17 project start-ups for Total and major peers*
Competitive returns Value creation
IRR (%)
Investing with discipline for profitable growth

Investor Relations – www.total.com 11
Priority to safety and environment
Adapt and optimize industrial system • Focus on major integrated platforms • Implement 650 M$ synergies and efficiency plans • Continue to reduce European exposure
Expand in Asia and Middle East • Redeploy capital to growth areas • Leverage access to advantaged feedstocks
Differentiate through process and product innovation
Pursue portfolio management focus on core business
* 2010 constant environment ERMI 27 $/t, mid-cycle for petrochemicals, $/€ 1.33
Refining & Chemicals, restructuring to improve performance
In line with target to increase overall downstream profitability from 9% to 14%
Refining & Chemicals ROACE*

Investor Relations – www.total.com 12
Capitalize on strong assets • Strengthen positions in targeted European markets • Consolidate leadership in Africa
More flexible and visible • Greater flexibility of sourcing supplies • Active portfolio optimization
Seize growth opportunities • Develop global positions in specialty
oil products business • Expand in high-potential growth markets • Leverage strong brands
Focus on customer needs
Provide efficient and innovative solutions
Adjusted net operating income B$
Targeting higher growth, maintaining profitability with ROACE > 16%
Supply & Marketing, reinforce leading positions

Investor Relations – www.total.com 13
Increasing free cash flow
* 2013-17 in a Brent 100 $/b scenario Net investments = Capex + acquisitions – asset sales. Breakeven = Brent price needed to cover net investments and dividend
Operating cash flow and net investments*
2012-14 cash flow to benefit from • accretive start-ups and
Downstream restructuring • 15-20 B$ asset sale program
reducing breakeven below 100 $/b
Investments based on economics and environment
• one-fourth of 2013-14 Capex not yet sanctioned
Accelerating free cash flow growth for 2015-17
B$
Strong cash flow to fund investments and dividend

Investor Relations – www.total.com 14
20-30% target range for gearing Favorable access to capital markets
Committed to sustaining a competitive shareholder return
Dividend increased in 2Q12
Quarterly dividend increased from 0.57 to 0.59 €/share in 2Q12
Financial strength and dividend increase
B€ Strong balance sheet
€/share

Investor Relations – www.total.com 15
EXPLORATION
Marc Blaizot Senior Vice President, Exploration

Investor Relations – www.total.com 16
Advancing the new dynamic in exploration
Exploration potential, focused on liquids
Risked Bboe Increased exploration potential*
Recent major discoveries already in appraisal phase
• Azerbaijan, Bolivia, French Guiana
More exposure to high-risk, high-reward prospects
2 Boe increase in exploration potential since 2010
New acreage since 2010 • 49% frontier • 51% average working interest • 76% operated • New domains, 12 new countries
2.5 B$ budget in 2012
* Excluding unconventional ressources

Investor Relations – www.total.com 17
* In progress and/or subject to governmental approval
Large deltas Grabens and rifts Foothills Abrupt margins Pre-salt carbonates Unconventional
Expanding opportunities for diversified growth
New acreage acquisitions
Kenya
Argentina
Brazil
Denmark
UK
Australia
Brunei
Egypt
Yemen
Angola
JDZ
Ivory Coast
Mauritania GoM
Gabon
Malaysia
Poland* Norway
Uganda
Tanzania*
DRC
Indonesia
Ohio
Uruguay*
Qatar
Bolivia
French Guiana
Bulgaria
Iraq
Philippines*
Myanmar*
Madagascar*
South Africa*

Investor Relations – www.total.com 18
French Guiana (Zaedyus)
Angola (Kwanza)
Ivory Coast (CI 100, 514, 515, 516)
Pre-salt carbonates Abrupt margins
3 blocks, 2 operated In progress: 3D seismic of 26,424 km² Next steps: 4+ exploration wells in 2013-14
4 blocks, 2 operated In progress: well preparation, 3D seismic Next steps: 1 exploration well 2013 and 3+ exploration and delineation wells in 2014
Total 25% In progress: 3D seismic and 1 exploration and delineation well Next steps: 1 exploration and delineation well in 2013 and 2 in 2014
Atlantic basins, extending the mirror concept
Uruguay (Block 14)
Total 100% In progress: 3D seismic acquisition preparation Next steps: 3D seismic in 2012-13, 1 exploration well in 2014
Brazil (Xerelete-Agulhas Negras)
Total 41.2%, operated In progress: preparation of exploration and delineation wells Next steps: 1 exploration well in 2013 and potential delineation wells in 2014-15

Investor Relations – www.total.com 19
3D extension
Block 25 (35% op.)
Block 39 (15%)
Block 40 (50% op.)
Angola, Blocks 25, 39, 40 - Kwanza
Angola
New emerging oil domain in Angola
In progress: 3D seismic acquisition of 26,424 km² ending in 2012
Next steps: major drilling program in 2013-14 with 4+ exploration wells
• 3 blocks: 2 operated, 1 non-operated
• Recently proven excellent pre-salt carbonates associated with a prolific source rock
• Analog to Santos Basin (Brazil) Cameia discovery

Investor Relations – www.total.com 20
Ivory Coast Ghana
CI 514 (54%, operated)
Ivory Coast
• 4 blocks: 2 operated, 2 non-operated
• Abrupt margin – neighboring Jubilee in Ghana, extending hunt to Ivory Coast
• Multi-billion barrel prospect
Promising acreage surrounded by giant discoveries
In progress: CI 100 operated, first well spud in December 2012
Next steps: CI 514 and CI 515-516, full seismic coverage plus 3 exploration wells in first phase
Independence discovery
CI 103 Paon discovery
Jubilee discovery (Ghana)
Tweneboa discovery (Ghana)
Oil Gas
Condensates
CI 515 and CI 516 (45%, op. in dev.)
CI 100 (60%, operated)
CI 100

Investor Relations – www.total.com 21
Uruguay, Block 14
• Total 100%
• High-potential abrupt margin frontier
• Very competitive bidding round
• Ultra-deepwater Pelotas basin
• Exploration to determine viability of extending this oil play throughout South Atlantic
Uruguay
Total is first to drill this play in South Atlantic
In progress: 3D seismic acquisition preparation Next steps: 3D seismic starting in 2012, first well in 2014
Uruguay

Investor Relations – www.total.com 22
Bulgaria
Bulgaria, Khan Asparuh
First abrupt margin play outside Atlantic basins
• Total 40%, operator for drilling and development phases
• Elephant-sized turbiditic prospects
• 14,220 km² block, 80 km offshore
• Water depth down to 2,000 m
In progress: 3D seismic acquisition preparation Next steps: 3D seismic in 2013-14, exploration well in early 2015

Investor Relations – www.total.com 23
Oil
Gas
Taza (20%)
Harir (35%)
Safen (35%, op. in dev.)
Iraq
Most promising onshore “yet to find” in the world
• 3 onshore blocks, 1 operated in development phase
• Foothills play, mountain foothills for Harir and Safen
• Large structures, surfaces and columns, excellent source rocks and reservoir-seal pairs
In progress: 2D seismic acquisition on Harir and Safen; first exploration wells on Harir and Taza spud mid-2012 Next steps: second exploration well on Harir and first exploration well on Safen
Iraq (Kurdistan)

Investor Relations – www.total.com 24
Argentina, shale gas and shale oil
Most promising unconventional play outside North America
Vaca Muerta Play Total Austral Acreage
2011-2015 E&A Drilling
drilled to be drilled
producing
Wells
shale oil test
producing shale gas
Aguada Pichana (27.3%, op.)
Pampas las Yeguas II (42.5%, op.)
Aguada de Castro (42.5%, op.)
• First shale play operated by Total
• Diverse acreage for targeting gas and oil, analog to North America
• Exploration well connected to existing pipeline, immediate production
In progress: shale gas production, first shale oil test in September 2012 Next steps: 3-4 rigs dedicated for exploration and delination in 2013
San Roque (24.7%, op.)
La Escalonada (85%, op.)
Argentina
non-operated block
Rincón La Ceniza (85%, op.)

Investor Relations – www.total.com 25
Worldwide exploration program adjacent to existing infrastructure
• Rapid development with high return rates • 39 wells in 2012-14 • Leveraging new technologies in proven zones • North Sea, Angola, Congo, Nigeria, Indonesia,
Brunei
An example of recent success at Alwyn complex in North Sea (SNC N54)
• Targeted an untested panel 5.5 km from production platform
• Long-offset deviated well, connected to platform • ~21 kboe/d gas and condensates production
in 2Q2012
5.5 km
SNW N50 (2006)
SWE N53 (2011)
Oil
Gas
Condensates
Unlocking value from existing assets
Not forgetting... nearby prospects, high and quick rewards
North Sea
SNE N52 (2009) SNC N54
(2012)

Investor Relations – www.total.com 26
Ambitious exploration program for 2013-14
Other Frontier
Number of wells targeting Elephants and Big Cat prospects
Increased potential for more giant discoveries
Argentina*
Brazil
Norway*
Colombia*
Australia*
Egypt
Qatar
Angola
Kenya*
Nigeria*
Ivory Coast*
Mauritania*
French Guiana*
Libya*
GoM*
Gabon*
Bolivia*
Indonesia*
Uruguay
Iraq*
Elephant and Big Cat prospects
*Spud or to be drilled in 1H13
Congo

Investor Relations – www.total.com 27
Michel Hourcard Senior Vice President, Development
UPSTREAM PROJECTS

Investor Relations – www.total.com 28
Schedule performance
Proven performance in project management
* For Total’s operated and non-operated projects with CAPEX (100%) > 1 B$
Focusing on safety, efficiency and sustainability
Planning control
% 2009-12 average* Schedule variation from sanction for Total operated projects % overrun
Actual start-up date vs target date at FID

Investor Relations – www.total.com 29
* Source IHS CERA ** Public data. Opex + exploration expenses + DD&A for entitlement production from consolidated subsidiaries based on ASC932
Tight project control for capital-intensive projects
• Cost inflation • Local content and workforce development
• Safety and environment • Technical complexity • Close monitoring of asset integrity
Create value through innovative and safe designs
Cost control Upstream Capital Cost Index* Base 100 in 2000
Technical cost** $/boe

Investor Relations – www.total.com 30
• Long-distance multiphase pumping
• Power supply from shore • Well-to-shore design
• Yemen LNG: Plant built in 49 months
• Moho North • Yamal LNG:
Plant built on permafrost Ice-class LNG tankers
• Floating LNG
Leveraging technology to create value
• Subsea pumping and processing
• 4D seismic • Electrical well-heads • Well trajectories
Maintaining technological edge through innovation
Reduce development costs
Unlock resources and improve recovery
Optimize designs

Investor Relations – www.total.com 31
70% of 2017 new production from sanctioned projects
* In a Brent 100 $ environment. For 18 sanctioned projects (incl. 2012 start-ups)
Current estimates of returns for sanctioned projects* IRR (%) % of EPC progress
Status of main sanctioned projects
Well-advanced, high-quality sanctioned projects

Investor Relations – www.total.com 32
• Average water depth 1,200 m • Capitalizing on successful track record • Total operates more than 10% of global deep-offshore production
Strong portfolio of projects
50% of Total’s exploration potential in deep offshore
Egina
Moho North
Kaombo (2 FPSOs)
A world leader in deep-offshore development
CLOV (sanctioned)
Girassol
Dalia Pazflor
Akpo
Usan
Moho Bilondo
Current projects

Investor Relations – www.total.com 33
Raising Block 17 production to 800 kb/d in 2014
CLOV on track for production mid-2014
• Proved and probable reserves: 500 Mb oil
• 20 year production, 160 kb/d at plateau • Capex: 14 $/b
• FPSO with 1.8 Mb storage capacity • Subsea Multiphase Pumping System • 36 km production lines, 57 km water
injection lines and 84 km umbilicals • Module lifting on FPSO ongoing • Project progress: 52%
Deep offshore development On track for first oil by mid-2014

Investor Relations – www.total.com 34
• Proved and probable reserves: 1.1 Tcf gas and 25 Mb condensate
• Plateau production: 500 Mmscf/d • Capex: 18 $/boe
• 2 subsea production templates, 9 subsea wells, water depth 600 m
• 140 km multiphase pipeline to shore and 235 km pipeline to FUKA
• Gas processing plant • Offshore installation of SPS* completed • Project progress: 55%
Opening a new pole in UK North Sea
* Subsea Production System
Development of a new production hub
On track for first gas in 2014
Laggan Tormore, an innovative well-to-shore design

Investor Relations – www.total.com 35
4 major developments in one project Target first gas end 2016
Ichthys LNG, giant offshore / onshore project
• Proved and probable reserves: 12.8 Tcf gas, 530 Mb condensate
• Long plateau project with 8.4 Mt/y LNG • 1.6 Mt/y LPG and 100 kb/d
condensate capacity • LNG sold to Asian buyers
with oil-linked price • Capex: 12 $/boe
• 50 subsea wells • Blaydin Point civil works ongoing • Offshore development engineering
ongoing • Project progress: 5%
FPSO, SPS & SURF 880 km pipeline CPF
Ichthys
Darwin
All contracts in place, good economics
2 LNG trains

Investor Relations – www.total.com 36
• Reserves (2P) 20 Mboe
• Start-up: April 2012 • Capex: 11 $/boe
• Reserves (2P) 15 Mboe
• Start-up: Oct 2012 • Capex: 19 $/boe
• Reserves (2P) 30 Mboe
• Start-up: Oct 2014 • Capex: 26 $/boe
• Reserves (2P) 90 Mboe
• Start-up: June 2012 • Capex: 15 $/boe
Fast-track subsea tie-backs with quick return
Islay (Alwyn) Atla (Heimdal) GirRI MPP (Girassol) GirRI (Girassol)
Combining exploration and development forces to maximize value of mature assets

Investor Relations – www.total.com 37
Preparing and optimizing next developments
* Statement Of Requirement
FID Discovery SOR*
Pre-FEED and FEED Conceptual
Start-up
Execution phase
Basic engineering
Project
Kaombo (Angola) Moho North (Congo) Egina (Nigeria)
Pre- project Appraisal and conceptual
IRR (%) Estimated returns for non-sanctioned projects
Improving returns in pre-project phase Securing them with efficient execution phase
EPC Contracts sanctioned projects

Investor Relations – www.total.com 38
Project execution expertise with leading experience in deep offshore and LNG
3,000 dedicated professionals committed to safer and faster project development
Pre-FID, key to optimize design and costs
Quality and profitability of Total’s portfolio
Delivering through 2017 and beyond

Investor Relations – www.total.com 39
LNG
Philippe Sauquet President, Gas & Power

Investor Relations – www.total.com 40
Gas prices evolution by region $/Mbtu % CAGR 2001-11
By region in 2011
Global gas demand: +3%/y 2001-11
Regional price differentials amid growing demand

Investor Relations – www.total.com 41
Surging LNG demand, tightening markets
* LNG supply based on existing facilities, approved and other identified projects for the 2020-30 period
Strong LNG demand in both traditional and emerging markets
Essential need for new LNG projects in 2030
230 Mt coming from unsanctioned identified projects (including North America, Russia, East Africa)
Challenge to increase supply due to project complexity
LNG supply* / demand Mt/y

Investor Relations – www.total.com 42
Bontang Yemen LNG Qatargas 2 Qatargas 1 Adgas Qalhat LNG Oman LNG
GLNG Ichthys
Snohvit
Angola LNG
NLNG T1-T6
Angola LNG (13.6%)
LNG projects (FEED or under study)
Existing LNG supply LNG projects under construction
Existing regasification terminals Under construction regasification terminals
South Hook
Dunkerque LNG
Fos Cavaou
Hazira Sabine Pass
Altamira
Total, global player along the LNG chain
20% of 2011 production 27% of Upstream results
* Group share of LNG production, by affiliates and equity interests (including production equivalent for Bontang LNG facility) ** LNG purchases by the Group, including those from subsidiaries and participations that are part of the Upstream LNG portfolio

Investor Relations – www.total.com 43
Angola LNG (13.6%)
LNG trading, a key competitive advantage
Optimizing value in the LNG chain and leveraging new upstream projects
Growing downstream LNG portfolio • from 2.2 Mt in 2009 to 8 Mt in 2011 • targeting ~16 Mt in 2020
Securing access to key markets • Existing long-term contracts with Europe
and Asia (Japan, China and Korea) • Developing Indian market through Hazira
regasification terminal
Enhancing flexibility to capture value • Existing agreements: progressive shift
from US destinations to Asian markets • New contracts: including redirection
terms to maximize margins
* Average of differentials between Asia LNG proxy and HH / NBP
Average spread* and % of redirected cargos $/Mbtu

Investor Relations – www.total.com 44
Angola LNG (13.6%)
Strengthening position as LNG leader
** LNG purchases by the Group, including those from subsidiaries and participations that are part of the Upstream LNG portfolio
Expanding upstream position with new LNG projects
• 0.7 Mt/y – Angola LNG • 4.5 Mt/y under construction – Ichthys, GLNG • under study – Russia, Nigeria
Scaling up the downstream portfolio • doubling 2011 sales volumes by 2020 • long-term contracts with new
Upstream projects • 0.7 Mt/y US exports secured from
Sabine Pass
Total’s global LNG position* Mt/y
* Estimates based on public data

Investor Relations – www.total.com 45
Creating value through access to resources and premium markets
Among the fastest growing businesses of the Group
Favorable LNG outlook
Solid and diversified positions in upstream LNG
Large pipeline of projects
Recognized expertise in downstream LNG

Investor Relations – www.total.com 46
REFINING & CHEMICALS
Patrick Pouyanné President, Refining & Chemicals

Investor Relations – www.total.com 47
Refined product demand Mb/d
Global polymer demand Mt/y
Demand growth driven by Asia and Middle East

Investor Relations – www.total.com 48
Asia/Middle East (+Africa for ethylene capacity)
Europe North America Rest of world
• ~6 Mb/d of new capacities in 2012-17 essentially in Asia and Middle East covering demand growth
• ~3 Mb/d closures in 2012-17 notably in Europe to restore utilization rates
• Margins supported by spread between demand growth and incremental increases in capacity
• New wave of crackers post-2015 in the US
Regional capacities adjusting to demand trend
2017 2011 2009 2013 2015
-1
0
1
2
Closures
New sites / extensions
2017 2011 2009 2013 2015
0
4
8
12
-4
Additional demand
2009-17 change in global refining capacity Mb/d
2009-17 change in global ethylene capacity Mt/y

Investor Relations – www.total.com 49
European rationalization underway
-18%
-22%
-11%
-10%
+15%
Realized or announced sales
Confirmed closures or capacity reductions Refineries for sale
Mb/d (as of 1st of January) Total’s European refining capacity
Announced closures or capacity reductions in 2012-13
+5%
OECD European refining capacity 2007-12(e): -6%

Investor Relations – www.total.com 50
Priority to safety and environment
Adapt capacities to demand evolution and optimize industrial system in Europe and the US by focusing on large platforms and maximizing synergies
Expand in Asia and Middle East to leverage growth in emerging markets and access large dedicated oil and gas feedstock
Differentiate through process and product innovation
Pursue portfolio management focusing on core business
Normandy upgrade
2012 2015 2013 2014
Jubail start-up Port Arthur upgrade to allow ethane cracking
Daesan expansion
New organization in place
Refining & Chemicals strategy
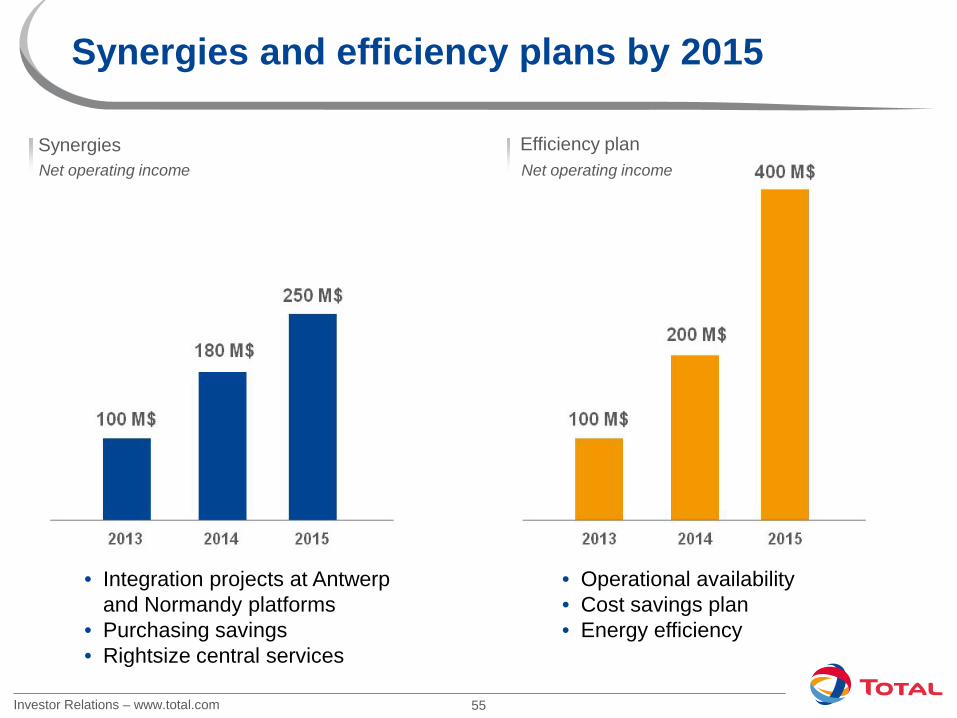
Synergies and efficiency plans to deliver return targets
2.1 Mb/d global refining capacity, out of which 1.8 Mb/d in Europe Among top-10 global producers of polyethylene, polypropylene and polystyrene Hutchinson, Bostik, Atotech, three valuable and innovative specialty chemicals activities
Qapco expansion Antwerp project

Investor Relations – www.total.com 51
On track to deliver return targets

Investor Relations – www.total.com 52
Antwerp Normandy Port Arthur Jubail Qatar Daesan
Focus on major integrated platforms
B$ (ERMI in $/t) % of refining and petrochemicals capital employed on major platforms
Cash flow from operations from major platforms

Investor Relations – www.total.com 53
Develop assets on advantaged feedstock in Middle East and position to grow in Asia
New 400 kb/d full-conversion refinery integrated with petrochemicals • Dedicated Arab Heavy crude supply • No heavy fuel production • Project on schedule, > 90% complete • Gradual start-up from Q1 2013 • EPC 9.6 B$ • Planned IPO
Five projects building on integrated position • Condensate refinery expansion • Debottlenecking of the 2 ethane-
based crackers • New 300 kt/y LDPE unit start-up
in 2012 • Debottlenecking of LLDPE unit
Jubail Saudi Arabia
Ras Laffan / Messaied Qatar
Daesan South Korea
Expanding and high-grading a world-class facility
• New condensate splitter and aromatic complex
• New EVA unit: 240 kt/y • Total cost 1.8 B$ • Integrated platform :
50% chemicals, 50% petroleum products (jet fuel, diesel)
Partner Saudi Aramco Partner Qatar Petroleum Partner Samsung

Investor Relations – www.total.com 54
Redeploy capital to Asia and Middle East
~ 7 $/t per year on average refining CAPEX* in 2013-17 in Europe/US down from 14 $/t per year in 2007-11
~ 35% of capital employed in Asia and Middle East by 2017
* Excluding turnarounds
Refining and petrochemicals capital employed
2012-17: reduce Total’s European refining and petrochemicals exposure by 20%
Investor Relations – www.total.com 55
Synergies and efficiency plans by 2015
• Integration projects at Antwerp and Normandy platforms
• Purchasing savings • Rightsize central services
• Operational availability • Cost savings plan • Energy efficiency
Efficiency plan Net operating income Synergies
Net operating income

Investor Relations – www.total.com 56
Availability, key to industrial performance
Capturing margin through 94% availability target by 2015
% Refining and steamcracker availability
Back to industrial fundamentals
• An ambitious but realistic target
• Refocus management and teams on availability priority
• Systematic vulnerability assessment and action plans
• Control turnaround duration
• Benefit from expertise pooling

Investor Relations – www.total.com 57
* Based on Solomon 2010 benchmark for Western Europe refining and 2009 for steamcrackers ** Toe/t, Refining & Chemicals operated sites
15% reduction of non-manpower fixed costs by 2015
Other variable costs
Other fixed costs
Wages
6.7 B$ Global steamcracker energy index*
Western Europe refining energy intensity index*
Energy efficiency target for 2015
10% savings on purchased energy by 2015
Energy efficiency indicator** -1% per year between 2011-17
Launched global cost saving plan
Energy purchases
2011 Refining and petrochemicals costs structure

Investor Relations – www.total.com 58
Meeting the profitability challenge
Collective focus on transformational change
Priority to safety and environment
Delivering value from main projects and major platforms
Increasing operational competitiveness
Implementing active portfolio optimization

Investor Relations – www.total.com 59
CONCLUSION
Christophe de Margerie Chairman and Chief Executive Officer
Patrick de La Chevardière Chief Financial Officer

Investor Relations – www.total.com 60
Competitive Upstream performance
European peers: average of Shell, BP and Eni; Major peers: average of European peers, Exxon and Chevron Estimates based on public data

Investor Relations – www.total.com 61
Underlying value versus share price
% Change in Upstream NPV 10%: 2015 & 2017 vs 2012*
$/boe Entreprise Value (EV) / boe
EV/boe = EV 2012 / 1P 2011 with share prices as of 31/08/12 EV = market cap + net debt
* Source: based on Wood Mackenzie Corporate Service 30/06/12 Brent LT 85 $12/b
European peers: average of Shell, BP and Eni; Major peers: average of European peers, Exxon and Chevron

Investor Relations – www.total.com 62
Key messages
• Potential for giant discoveries • Reshaped for delivering higher downstream profitability • Quantified asset sale program
New dynamic in action
Delivering near-term profitable growth
• Growth supported by projects already in production or development
• High-quality portfolio of projects • Among world leaders in deep-offshore and LNG
Creating value for shareholders
• Investing with discipline
• Increasing free cash flow
• Attractive and competitive dividend

Investor Relations – www.total.com 63
APPENDIX
Investor Relations – www.total.com 64
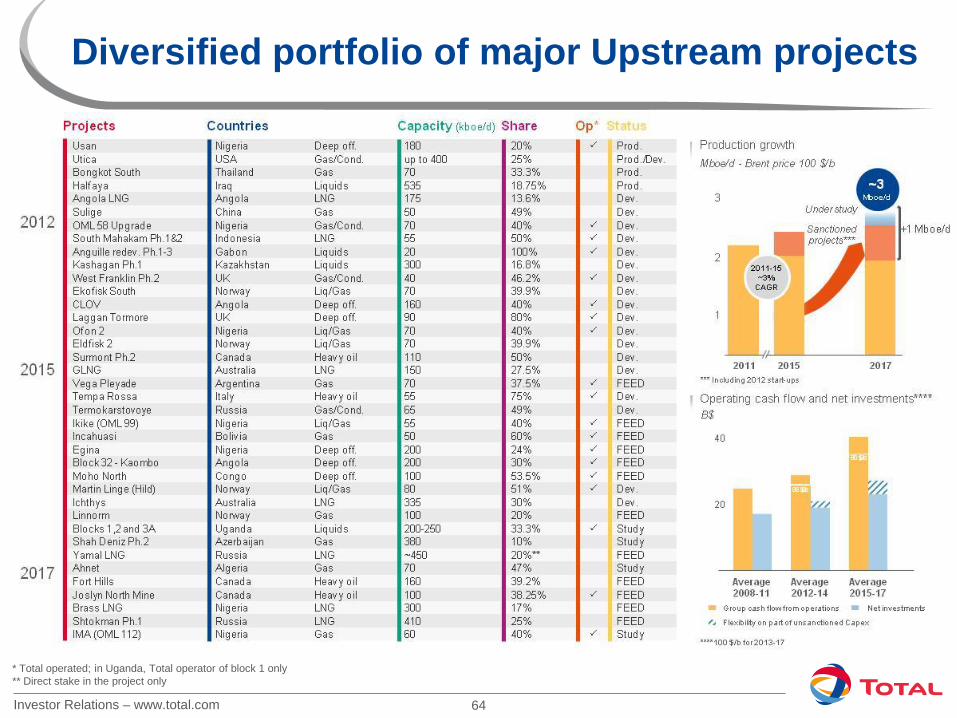
Diversified portfolio of major Upstream projects
* Total operated; in Uganda, Total operator of block 1 only ** Direct stake in the project only

Investor Relations – www.total.com 65
Disclaimer
This document may contain forward-looking statements, including within the meaning of the Private Securities Litigation Reform Act of 1995, notably with respect to the financial condition, results of operations, business, strategy and plans of TOTAL. Such statements are based on a number of assumptions that could ultimately prove inaccurate, and are subject to a number of risk factors, including currency fluctuations, the price of petroleum products, the ability to realize cost reductions and operating efficiencies without unduly disrupting business operations, environmental regulatory considerations and general economic and business conditions. Neither TOTAL nor any of its subsidiaries assumes any obligation to update publicly any forward-looking statement, whether as a result of new information, future events or otherwise. Further information on factors which could affect the company’s financial results is provided in documents filed by the Group with the French Autorité des Marchés Financiers and the U.S. Securities and Exchange Commission (“SEC”). Financial information by business segment is reported in accordance with the internal reporting system and shows internal segment information that is used to manage and measure the performance of TOTAL. Performance indicators excluding the adjustment items, such as adjusted operating income, adjusted net operating income, and adjusted net income are meant to facilitate the analysis of the financial performance and the comparison of income between periods. Adjustment items include: (I) Special items Due to their unusual nature or particular significance, certain transactions qualified as "special items" are excluded from the business segment figures. In general, special items relate to transactions that are significant, infrequent or unusual. However, in certain instances, transactions such as restructuring costs or asset disposals, which are not considered to be representative of the normal course of business, may be qualified as special items although they may have occurred within prior years or are likely to occur again within the coming years. (II) Inventory valuation effect The adjusted results of the Downstream and Chemicals segments are presented according to the replacement cost method. This method is used to assess the segments’ performance and facilitate the comparability of the segments’ performance with those of its competitors.
In the replacement cost method, which approximates the LIFO (Last-In, First-Out) method, the variation of inventory values in the statement of income is, depending on the nature of the inventory, determined using either the month-end prices differential between one period and another or the average prices of the period rather than the historical value. The inventory valuation effect is the difference between the results according to the FIFO (First-In, First-Out) and the replacement cost. (III) Effect of changes in fair value As from January 1, 2011, the effect of changes in fair value presented as an adjustment item reflects for some transactions differences between internal measures of performance used by TOTAL’s management and the accounting for these transactions under IFRS. IFRS requires that trading inventories be recorded at their fair value using period-end spot prices. In order to best reflect the management of economic exposure through derivative transactions, internal indicators used to measure performance include valuations of trading inventories based on forward prices. Furthermore, TOTAL, in its trading activities, enters into storage contracts, which future effects are recorded at fair value in Group’s internal economic performance. IFRS precludes recognition of this fair value effect. The adjusted results (adjusted operating income, adjusted net operating income, adjusted net income) are defined as replacement cost results, adjusted for special items, excluding the effect of changes in fair value. Dollar amounts presented herein represent euro amounts converted at the average euro-dollar exchange rate for the applicable period and are not the result of financial statements prepared in dollars. Cautionary Note to U.S. Investors – The SEC permits oil and gas companies, in their filings with the SEC, to separately disclose proved, probable and possible reserves that a company has determined in accordance with SEC rules. We may use certain terms in this presentation, such as resources, that the SEC’s guidelines strictly prohibit us from including in filings with the SEC. U.S. investors are urged to consider closely the disclosure in our Form 20-F, File N° 1-10888, available from us at TOTAL S.A. – Tour Coupole – 2, place Jean Millier – Arche Nord Coupole/Regnault – 92078 Paris La Défense Cedex, France, or at our website: www.total.com. You can also obtain this form from the SEC by calling 1-800-SEC-0330 or on the SEC’s website: www.sec.gov.