2012 first quarter results presentation
TRANSCRIPT

2012 First Quarter Results Presentation
Mil 8th M 2012Milan, 8th May 2012
| 1 |

Broadcasting & Advertising
| 2 |

ITALY | TV Consumption trend (2003-2012)A D il i t
290
Average Daily minutes
269 271 266273
256 256
270 270283 290
266
Individuals
15-64 years
251 251245
251
232 233
245 244257
266
232 233
2003 2004 2005 2006 2007 2008 2009 2010 2011 2012
Source: Auditel, January-March
| 3 |

MEDIASET 2012 1Q | Commercial target Audience Share(15 64 li t h l )
1Q 2011 1Q 2012
(15-64 yrs, generalist channels)
24 Hours32.2% 29.9%
35.0% 33.4%
35 4%
35,9%
34 1%
33.0%Prime Time
35.4% 34.1%
Source: Auditel
| 4 |

MEDIASET 2012 1Q | Commercial target audience share24 H
33 4%Generalist (C5+I1+R4)
15-64 yrs24 Hours
33.4%
7.1%
Generalist (C5+I1+R4)
Multichannel (FTA + Pay TV)
40.5%Total
29.9%Generalist (R1+R2+R3)
5.5%
35 4%
Multichannel FTA (11)
Total 35.4%Total
Source: Auditel ; Pay TV Channels Company elaborations on Auditel data
| 5 |
Source: Auditel ; Pay TV Channels, Company elaborations on Auditel data

MEDIASET 2012 1Q | Multichannel Audience Share24 H i l t t24 Hours – commercial target
2011 2012
MS DTT (Free+Pay) 6.3% 7.1%
2011 2012
RAI DTT
SKY Channels
4.7%
4 5%
5.5%
5 6%SKY Channels
FOX Channels
4.5%
2.1%
5.6%
2.3%
Discovery 1.4% 2.1%
Source: Company elaborations on Auditel data
| 6 |
p y

ITALY 2012 1Q | Advertising market trend
Jan-Feb 2012 vs. Jan-Feb 2011
Total Market
Mediaset (FTA + Pay)
-6.0%
-10.0%
Rai
Sky
-14.1%
+25.3%
Press
Radio
-7.9%
-6.3%
Internet * +24.3%
Source: Nielsen, excluding direct mail*Excluding Keyword, search
| 7 |

E lMEDIASET 2012 1Q | Total Advertising revenuesEuro ml
-10.2%
693.3 622.7
1Q 2011 1Q 20121Q 2011 1Q 2012
Note: all platforms
| 8 |
Note: all platforms

MEDIASET 2012 1Q | Advertising Breakdown by Sector
Impossibile v isualizzare l'immagine. La memoria del computer potrebbe essere insufficiente per aprire l'immagine oppure l'immagine potrebbe essere danneggiata. Riavviare il computer e aprire di nuovo il file. Se v iene visualizzata di nuovo la x rossa, potrebbe essere necessario eliminare l'immagine e inserirla di nuovo.
TELECOM +0 3%
1Q 11 vs. 1Q 10 1Q 12 vs. 1Q 11
-29 8%TELECOM +0.3% -29.8%
AUTOMOTIVE +3.7% -10.5%Impossibile v isualizzare l'immagine. La memoria del computer potrebbe essere insufficiente per aprire l'immagine oppure l'immagine potrebbe essere danneggiata. Riavviare il computer e aprire di nuovo il file. Se v iene visualizzata di nuovo la x rossa, potrebbe essere necessario eliminare l'immagine e inserirla di nuovo.
INDUSTRIAL/UTILITY 147.0% -32.8%
| 9 |

MEDIASET 2012 1Q | Advertising Breakdown by Sector
1Q 11 vs. 1Q 10 1Q 12 vs. 1Q 11
-7.4% -6.5%GROCERY
-9.3%
-1.5%
FOOD
BEVERAGES
-9.9%
+5.7%
FOOD 7 6% 8 0%
-1.7%PERSONAL CARE +2.3%
FOOD -7.6% -8.0%
-11.8%
+0.8%
HOUSEKEEPING
TOILETRIES
-13.2%
-7.8%
NON FOOD -3.9%-6.9%
| 10 |

MEDIASET 2012 1Q | Advertising Breakdown by Sector
RETAIL +8 3%
1Q 11 vs. 1Q 10 1Q 12 vs. 1Q 11
-4 4%RETAIL +8.3% -4.4%
LEISURE/BETTING +34.5% +1.5%
FINANCE -40.0% +28.6%
| 11 |

Financials
| 12 |

MEDIASET GROUP 2012 1Q | P&L Highlights
Net Consolidated RevenuesItaly
(Euro ml.) 1Q 2011
1,112.1846 3
1Q 2012
977.8760 2Italy
Spain
EBITDA
846.3266.1
459.7
760.2218.0
371.6ItalySpain
EBIT
358.0101.7
135 8
293.678.0
38 9EBITItalySpain
135.889.146.6
38.918.520.4
NET PROFIT
Group Net Financial PositionItaly
68.4
(1,423.1)(1 424 5)
10.3
(1,675.2)(1 675 6)Italy
Spain(1,424.5)
1.5(1,675.6)
0.4
| 13 |

MEDIASET ITALIAN BUSINESS 2012 1Q | P&L Results
Net Consolidated Revenues
(Euro ml.) 1Q 2012
760.2
1Q 2011
846.3Personnel Costs
Other Operating Costs
EBITDA
(119.2)
(347.5)
293.6
(114.9)
(373,3)
358 0EBITDARights Amortisation
Other Amortisation & Depreciation
Operating Profit
293.6(236.7)
(38.3)
18 5
358.0(234.8)
(34.1)
89 1Operating ProfitFinancial Income (Losses)
Associates
P T P fit
18.5(13.7)
1.5
6 3
89.1(6.9)
2.1
84 3Pre-Tax ProfitTaxes
Minorities
6.3(2.5)
(2.2)
84.3(32.7)
(0.1)NET PROFIT 1.551.4
| 14 |

MEDIASET ITALIAN BUSINESS | New Reporting format
Main reasons at the root of restatement:
• Evolution of the advertising market and of the commercial policy: advertisers willing to buy multichannel and multiplatform
• Consistency with the evolution of the TV business model based on the Free-Pay/linear y ynon-linear matrix
• Consolidation of an integrated model:
i d ti di t ib ti b d l t f ti l t th TV b i• movie production, distribution, web development functional to the TV business
• greater integration of the production process and contents acquisition
• corporate simplification and cost efficiencycorporate simplification and cost efficiency
• Centralised decision process: the Top Management makes the strategic decisions, allocates the resources and evaluates the performance on the basis of this new integrated model
• Symmetric model and disclosure between Italy and Spain
• Correspondence between business units and listed Entities
| 15 |

MEDIASET ITALIAN BUSINESS | Integrated Tv Activities(Euro ml.)
Total Net Revenues 845.0
1Q 2011 1Q 2012
746.8Total Gross advertising revenues
Commissions
Total Net Advertising Revenues
693.3
(102.8)
590.5
622.7
(91.7)
531.0g
Pay Tv Revenues
Other Revenues
Total Costs
135.0
119.5
(758 1)
131.1
84.7
(740 0)Total CostsPersonel costs
Other operating costs
(758.1)(105.7)
(354.0)
(740.0)(107.7)
(326.0)
Rights Amortisation
Other Amortisation & Depreciation
Intra-company items
(234.8)
(26.9)
(36.8)
(236.7)
(27.8)
(41.8)
Integrated Tv Activities Operating profit 86.8 6.8
| 16 |

MEDIASET ITALIAN BUSINESS | EI Towers
(Euro ml.) 1Q 2011 (*) 1Q 2012
Total Net Revenues3rd Party Revenues
Intra-company items
56.113.4
42.7
38.61.3
37.3Intra company items
Total CostsPersonnel
(44.4)(11.5)
(36.3)(9.2)
Other operating Costs
Other Amortisation & Depreciation
Intra-company items
(21.5)
(10.5)
(0.9)
(19.4)
(7.2)
(0.5)p y
EI Towers Operating Profit
( )
11.7
( )
2.3
(*) Carve-outPro-forma 1Q2011data (as reported by EI Towers): revenues 52.7 ml and EBIT 9.0 ml
| 17 |
f Q ( p y )

MEDIASET ITALIAN BUSINESS 2012 1Q | Investments
(Euro ml )
1Q 20121Q 2011
178.0 146.1
(Euro ml.)
TV rights and cinema
Technical & immaterial25.027.6
Total Investments205.7 171.0
| 18 |

MEDIASET ITALIAN BUSINESS 2012 1Q | Cash Flow Statement
(1,801.9)
281 4
Initial Net Financial Position
Cash Flow from Core Activities
(Euro ml.) 1Q 2011 1Q 2012
(1,562.1)
137 6 281.4280.0
(171.0)
0.1
Cash Flow from Core ActivitiesCash Flow from Operations
Investments
Disinvestments
137.6320.6
(205.7)
0.2
172.4
(39.9)
241.5
Change in Net Working Capital (CNWC)
Equity (investment)/ disinvestment
Free Cash Flow
22.5
-
137.6
-
-
(115.2)
Dividends
Cashed-in dividends
Change in consolidation area
-
-
- (115.2)
126.3
(1,675.6)
Change in consolidation area
Total Net Cash Flow
Final Net Financial Position (31/03)
137.6
(1,424.5)
| 19 |

Back up Slides
| 20 |

MEDIASET ITALIAN BUSINESS 2011 1Q | EI Towers restatement
(Euro ml.) FTA TV
Restatement
11.0
Restated1Q 2011
607.0
EI TowersCarve-out
-
1Q 2011
596.0
Revenues
Pay TV
Network Operator
EI Towers
-
(9.6)
-
177.8
-
38.6
-
(38.6)
38.6
177.8
48.3
-
Other Activities
Intra-company items
Total Revenues
-
(1.4)
-
96.6
(73.8)
846.3
-
-
-
96.6
(72.4)
846.3
(Euro ml.)
FTA TV
Restatement
(6.9)
Restated1Q 2011
93.0
EI TowersCarve-out
-
1Q 2011
99.9
Operating Profit
Pay TV
Network Operator
EI Towers
-
6.9
-
(18.4)
-
2.3
-
(2.3)
2.3
(18.4)
(4.6)
-
Other Activities
Intra-company items
Total Operating Profit
-
-
-
9.1
3.1
89.1
-
-
-
9.1
3.1
89.1
| 21 |

MEDIASET ITALIAN BUSINESS 2011 1Q | Integrated Tv Activities Restatement
(Euro ml.)
Total Net Revenues
1Q 2011Other Activities
96 6
Total
845 0
Pay Tv
177 8
FTA TV
607 0
Intra-company
(36 5)Total Net RevenuesAdvertising revenues
Commissions
T t l N t Ad ti i R
96.62.3
(0.3)
2 0
845.0693.3
(102.8)
590 5
177.822.6
(3.4)
19 2
607.0668.4
(99.2)
569 2
(36.5)-
-
Total Net Advertising Revenues
Pay Tv Revenues
Other Revenues
I t it
2.0
-
71.3
23 3
590.5
135.0
119.5
19.2
135.0
23.6
569.2
-
24.6
13 2
-
-
-
(36 5)Intra-company items
Total CostsPersonnel
23.3
(87.4)(4.7)
-
(758.1)(105.6)
-
(196.2)(4.8)
13.2
(514.0)(96.1)
(36.5)
39.5-
Operating Costs
Rights Amortisations
Other D&A
(31.4)
(36.0)
(0.7)
(354.0)
(234.8)
(26.9)
(80.2)
(85.6)
(5.8)
(242.4)
(139.5)
(20.4)
-
26.3
-
Intra-company items
Operating Profit
(14.6)
9.1
(36.8)
86.8
(19.8)
(18.4)
(15.6)
93.0
13.2
3.1
| 22 |
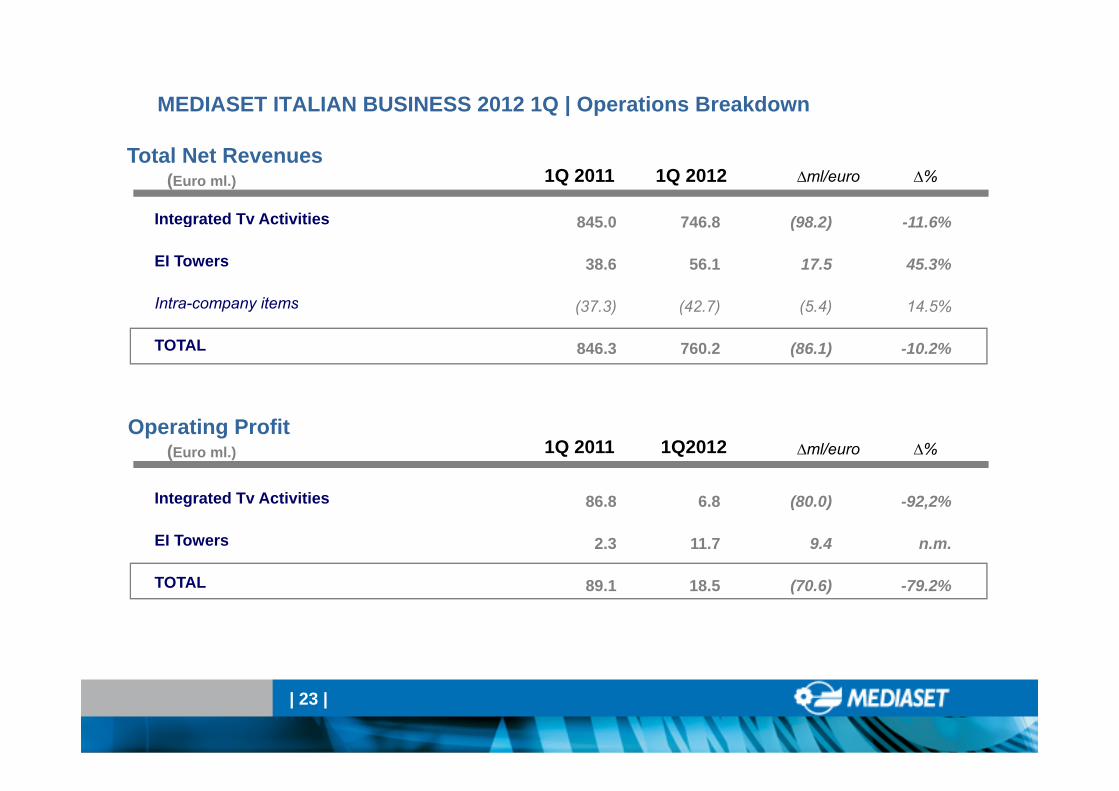
MEDIASET ITALIAN BUSINESS 2012 1Q | Operations Breakdown
Integrated Tv Activities
Total Net Revenues
84 0
(Euro ml.) 1Q 2011 1Q 2012
46 8
∆ml/euro ∆%
11 6%(98 2)Integrated Tv Activities
EI Towers
Intra-company items
845.0
38.6
(37 3)
746.8
56.1
(42 7)
-11.6%
45.3%
14 5%
(98.2)
17.5
(5 4)Intra company items
TOTAL
(37.3)
846.3
(42.7)
760.2
14.5%
-10.2%
(5.4)
(86.1)
Operating Profit(Euro ml.) 1Q 2011 1Q2012 ∆ml/euro ∆%
Integrated Tv Activities
EI Towers
86.8
2.3
6.8
11.7
-92,2%
n.m.
(80.0)
9.4
TOTAL 89.1 18.5 -79.2%(70.6)
| 23 |
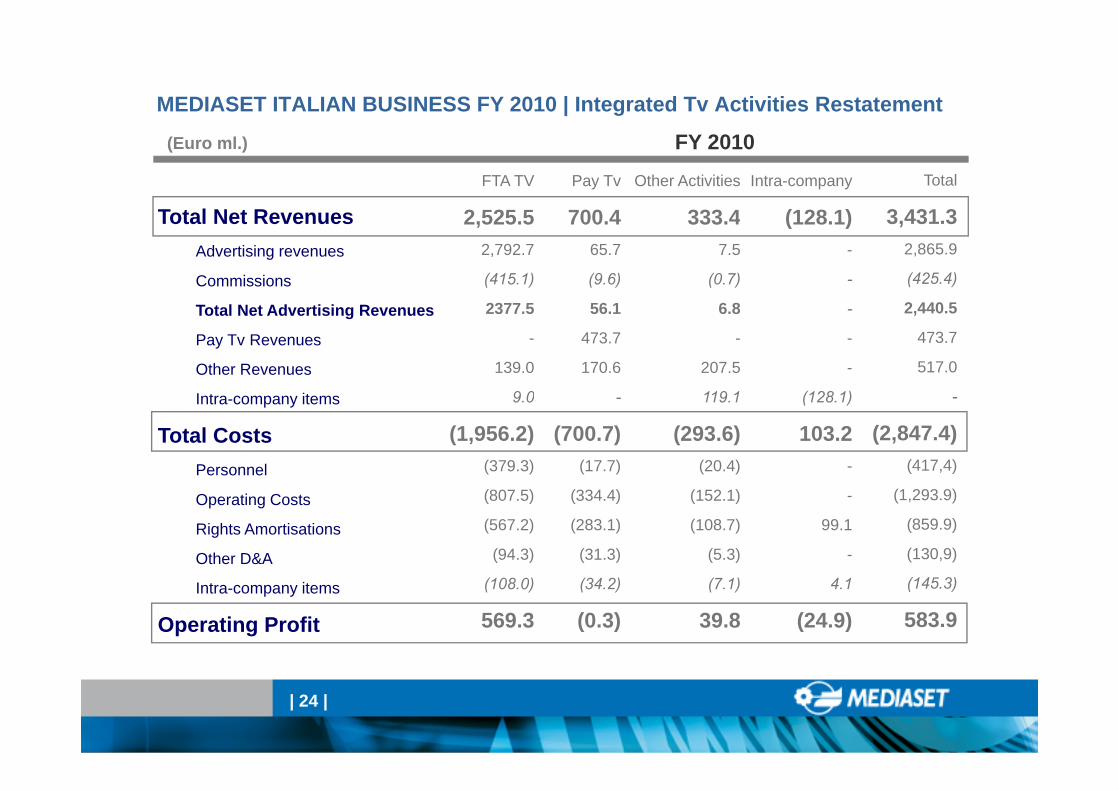
MEDIASET ITALIAN BUSINESS FY 2010 | Integrated Tv Activities Restatement
(Euro ml.)
Total Net Revenues
FY 2010Other Activities
333 4
Total
3 431 3
Pay Tv
700 4
FTA TV
2 525 5
Intra-company
(128 1)Total Net RevenuesAdvertising revenues
Commissions
T t l N t Ad ti i R
333.47.5
(0.7)
6 8
3,431.32,865.9
(425.4)
2 440 5
700.465.7
(9.6)
56 1
2,525.52,792.7
(415.1)
2377 5
(128.1)-
-
Total Net Advertising Revenues
Pay Tv Revenues
Other Revenues
I t it
6.8
-
207.5
119 1
2,440.5
473.7
517.0
56.1
473.7
170.6
2377.5
-
139.0
9 0
-
-
-
(128 1)Intra-company items
Total CostsPersonnel
119.1
(293.6)(20.4)
-
(2,847.4)(417,4)
-
(700.7)(17.7)
9.0
(1,956.2)(379.3)
(128.1)
103.2-
Operating Costs
Rights Amortisations
Other D&A
(152.1)
(108.7)
(5.3)
(1,293.9)
(859.9)
(130,9)
(334.4)
(283.1)
(31.3)
(807.5)
(567.2)
(94.3)
-
99.1
-
Intra-company items
Operating Profit
(7.1)
39.8
(145.3)
583.9
(34.2)
(0.3)
(108.0)
569.3
4.1
(24.9)
| 24 |

MEDIASET ITALIAN BUSINESS FY 2011 | Integrated Tv Activities Restatement
(Euro ml.)
Total Net Revenues
FY 2011Other Activities
285 0
Total
3 230 9
Pay Tv
657 7
FTA TV
2 396 0
Intra-company
(107 7)Total Net RevenuesAdvertising revenues
Commissions
T t l N t Ad ti i R
285.013.8
(1.0)
12 8
3,230.92,771.1
(410.9)
2 360 2
657.790.4
(13.4)
77 0
2,396.02,666.8
(396,5)
2270 3
(107.7)-
-
Total Net Advertising Revenues
Pay Tv Revenues
Other Revenues
I t it
12.8
-
192.4
79 8
2,360.2
525.2
345.5
77.0
525.2
55.4
2270.3
-
97.7
27 9
-
-
-
(107 7)Intra-company items
Total CostsPersonnel
79.8
(274.6)(19.3)
-
(2,871.9)(415,6)
-
(726.2)(25.7)
27.9
(1,995.9)(370.6)
(107.7)
124.9-
Operating Costs
Rights Amortisations
Other D&A
(112.8)
(106.6)
(8.4)
(1,295.5)
(857.6)
(154,1)
(344.1)
(267.6)
(29.9)
(838.6)
(582.8)
(115.8)
-
99.4
-
Intra-company items
Operating Profit
(27.5)
10.4
(149.1)
359.0
(58.9)
(68.5)
(88.1)
400.1
25.5
17.1
| 25 |

MEDIASET SPANISH BUSINESS | Back up Slides
| 26 |

MEDIASET ESPANA | P&L Results
266.1 218.0Net Consolidated Revenues
(Euro ml.) 1Q 2011 1Q 2012
(39.5)
(124.9)
101 7
(25.9)
(114.2)
78 0
Personnel Costs
Other Operating Costs
EBITDA 101.7
(55.0)
46.6
78.0
(57.6)
20.4
EBITDA
Amortisation & Depreciation
EBIT
2.5
1.7
0.4
0.2
Financial Income (Losses)
Associates
50.8
(10.7)
40 1
21.0
-
21 2
Pre-Tax Profit
Taxes
NET PROFIT Reported 40.1 21.2NET PROFIT Reported
| 27 |
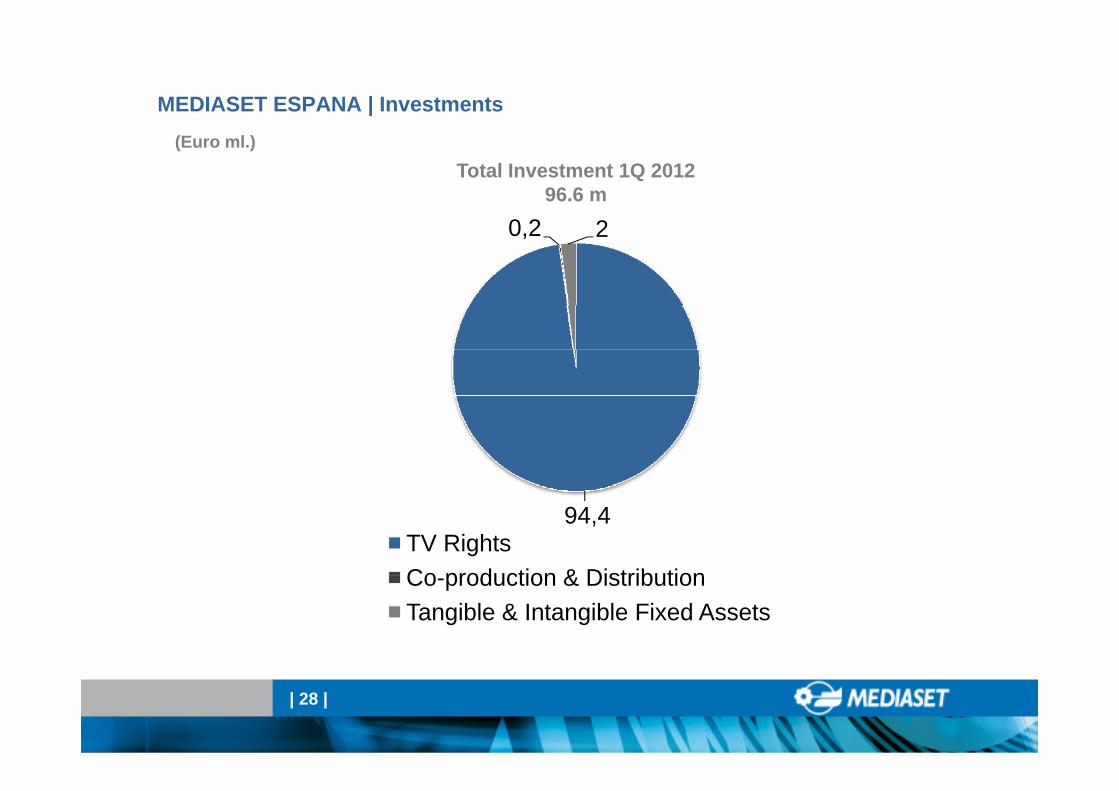
MEDIASET ESPANA | Investments
Total Investment 1Q 201296.6 m
(Euro ml.)
0,2 2
94,4TV RightsCo production & DistributionCo-production & DistributionTangible & Intangible Fixed Assets
| 28 |

MEDIASET ESPANA | Cash Flow Statement
(28.0)Initial Net Financial Position 26.5
(Euro ml.) 1Q 2011 1Q 2012
10.3
95.4
(96 3)
Free Cash Flow
- Cash Flow from Operations
I t t /Di i t t
(24.9)
80.3
(96 6)(96.3)
11.2
(0.3)
- Investments/Disinvestment
- Change in Net Working Capital (CNWC)
Change in Equity
(96.6)
(8.7)
-( )
19.5
-
g q y
Equity (Investments)/Disinvest.
Cashed in Dividends
(1.2)
-
-
-
29 5
Dividends
Change in consolidation area
Total Net Cash Flow
-
-
(26 1)29.5
1.5
Total Net Cash Flow
Final Net Financial Position (31/03)
(26.1)
0.4
| 29 |
Investor Relations Department:
Tel: +39 02 2514.7008Fax: +39 02 2514.6719Email: [email protected] bSit di t it/i t /
Forward-looking StatementsStatements contained in this document particularly the ones regarding any Mediaset Group
WebSite: www.mediaset.it/investor/
Statements contained in this document, particularly the ones regarding any Mediaset Grouppossible or assumed future performance, are or may be forward looking statements and inthis respect they involve some risks and uncertainties.
Mediaset Group actual results and developments may differ materially from the onesexpressed or implied by the above statements depending on a variety of factors.
Any reference to past performance of Mediaset Group shall not be taken as an indication offuture performance.
This announcement does not constitute an offer to sell or the solicitation of an offer to buythe securities discussed herein.
The executive responsible for the preparation of the Mediaset S.p.A. accounts, LucaMarconcini, declares that, as per para. 2 art. 154-bis, of the “Testo Unico della Finanza”, thatthe accounting information contained in this document corresponds to that contained in thecompany’s books.