2012 eastern north pacific hurricane season eastern north pacific hurricane season 2 overview in...
TRANSCRIPT

NATIONAL HURRICANE CENTER ANNUAL SUMMARY
2012 EASTERN NORTH PACIFIC HURRICANE SEASON
Richard J. Pasch
8 May 2014
IMAGE OF HURRICANE CARLOTTA AT 1556 UTC 15 JUNE 2012. IMAGE COURTESY OF NASA.
ABSTRACT
Tropical cyclone activity of the eastern North Pacific hurricane season was near average
during 2012. Of the seventeen tropical storms that formed, ten became hurricanes and five reached
major hurricane strength (category 3 or stronger on the Saffir-Simpson Hurricane Wind Scale). One
hurricane, Carlotta, made landfall in Mexico. On average, the National Hurricane Center track and
intensity forecasts in the eastern North Pacific for 2012 were very good in comparison to the long-
term means.

2012 Eastern North Pacific Hurricane Season 2
OVERVIEW
In terms of the overall levels of activity, the 2012 eastern North Pacific hurricane season
was similar to that of the previous year. There was a near-average amount of activity and, of
the 17 named storms that formed, 10 became hurricanes, and 5 reached major hurricane
strength [maximum 1-min 10-m winds greater than 96 kt (1 kt = 0.5144 m s-1) -- corresponding
to category 3 or greater on the Saffir-Simpson Hurricane Wind Scale (Saffir 1973, Simpson
1974, National Weather Service 2010)]. For comparison, the 1981-2010 averages are about 15
tropical storms, 8 hurricanes and 4 major hurricanes. In terms of the Accumulated Cyclone
Energy (ACE) index (Bell et al. 2000), which accounts for the frequency, intensity, and duration
of the season’s storms, the value for the 2012 season was 98.4 x 10⁴ kt2, or about 93% of the
long-term (1981-2010) median value of 106 x 104 kt2.
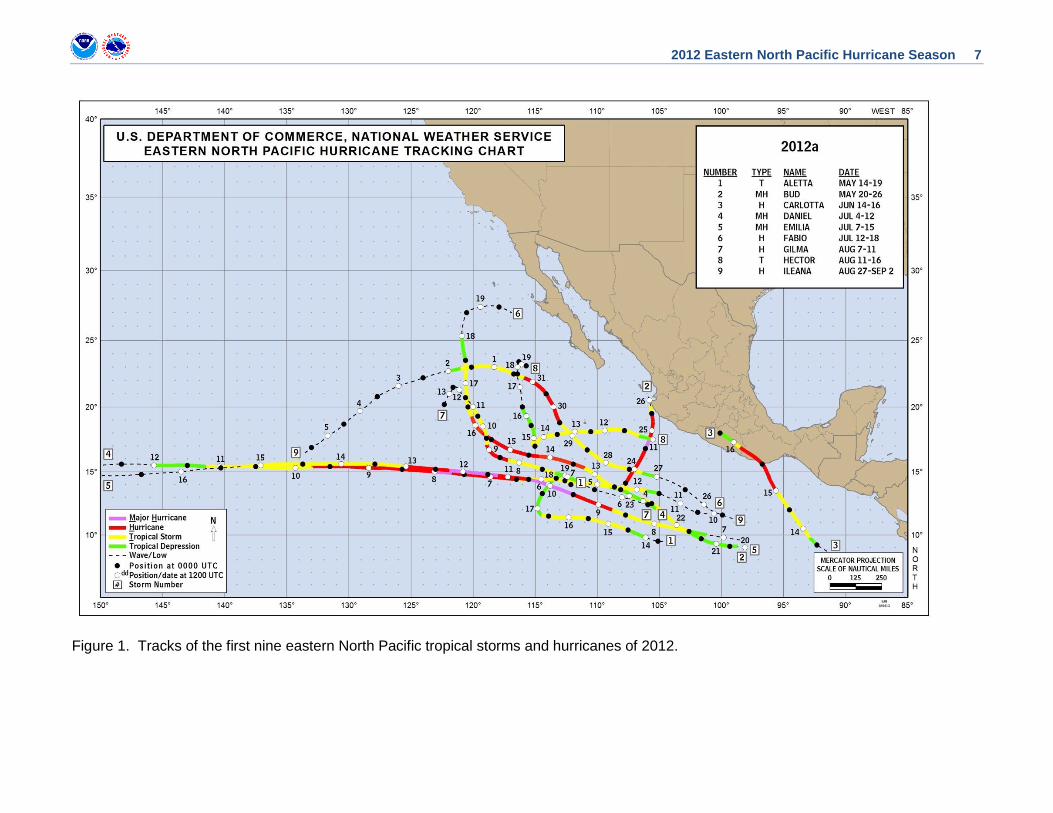
Figures 1 and 2 show the tracks of the 2012 eastern North Pacific tropical storms and
hurricanes, and Table 1 lists the basic statistics of the season. It is of interest to note that, aside
from Daniel and Emilia, the tropical cyclones of 2012 moved along predominantly meridional
tracks. This is consistent with the anomalous deep-layer (1000-200 mb) mean flow for July
through October of 2012, which was dominated by a large cyclonic gyre over the basin centered
near 20°N 125°W (Fig. 3). As is the case with most years in the east Pacific basin, most of the
2012 cyclone activity remained offshore of the coasts of Mexico and Central America. However,
Carlotta made landfall in eastern Mexico as a category 2 hurricane. A total of 3 deaths, all due
to Carlotta, are directly attributed to the tropical cyclone activity from this hurricane season.
The 2012 season began early with Aletta, which was only the third eastern North Pacific
tropical storm in the reliable record (since satellite imagery became available in 1966) to form
prior to the May 15 official starting date. Aletta did not affect land. Bud, an early-season major
hurricane, brought tropical storm conditions to portions of southwestern Mexico near and over
Manzanillo before dissipating just offshore. Norman made landfall as a tropical depression near
Topolobampo, Mexico. Paul was a category 3 hurricane that rapidly intensified near Clarion
Island and then rapidly weakened as it approached the Baja California peninsula. Paul made
landfall along the west coast of Baja California Sur as a post-tropical cyclone and then
dissipated northwest of Punta Eugenia. All of the other eastern North Pacific tropical storms
and hurricanes of 2012 remained at sea throughout their lifetimes.
The following section describes Hurricane Carlotta, the most significant tropical cyclone
of the season. More detailed information on the eastern North Pacific tropical cyclones of 2012
can be found at http://www.nhc.noaa.gov/2012epac.shtml.

2012 Eastern North Pacific Hurricane Season 3
SELECTED STORM SUMMARY
Hurricane Carlotta
The genesis of Carlotta can be traced back to an area of disturbed weather that moved
westward from Colombia to near and just south of Panama on 11 June. Extrapolation and
analyses from the National Centers for Environmental Prediction’s Global Forecast System
suggest that this system was associated with a tropical wave that departed Africa in early June,
although this is uncertain since the wave became ill defined over the central Atlantic. An
eastward-moving Kelvin wave that passed over Central America during the second week of
June was also a likely contributor to development. The disturbance continued westward, and by
1800 UTC 13 June it spawned a well-defined low-level circulation several hundred n mi south of
Guatemala. By 0000 UTC 14 June, the associated deep convection became better organized
and it is estimated that a tropical depression formed at this time, centered about 460 n mi south-
southeast of Huatulco, Mexico. The cyclone was situated on the southwestern periphery of a
mid-tropospheric ridge and shortly after genesis, it turned from a west-northwestward to a
northwestward heading. Vertical shear was quite weak over the area, which allowed the system
to strengthen into a tropical storm by 0600 UTC 14 June. Carlotta continued to gradually
intensify over the next day or so, and it became a hurricane at about 1200 UTC 15 June, while
centered about 170 n mi south-southeast of Puerto Escondido, Mexico. Not long after
becoming a hurricane, Carlotta underwent a period of rapid intensification, with its maximum
winds increasing to 95 kt by 2100 UTC 15 June. As it neared the coast, the hurricane turned
toward the north-northwest, and the forward speed increased from around 10 kt to 16 kt.
Carlotta made landfall in the Mexican state of Oaxaca, about 10 n mi east-southeast of Puerto
Escondido, around 0100 UTC 16 June (Fig.4). Satellite imagery showed that the eye became
less well-defined just before landfall, suggesting that the hurricane had weakened slightly to an
intensity of 90 kt, likely due to the partial interaction of the circulation with the rugged terrain of
Mexico. After the center crossed the coast, it turned toward the northwest and moved over the
southern portion of Oaxaca and, later on 16 June, over the state of Guerrero. Carlotta
weakened very rapidly while it traversed the mountainous terrain of southern Mexico, and by
1200 UTC 16 June the cyclone was reduced to a tropical depression, centered about 60 n mi
northeast of Acapulco, Mexico. The system turned to the west-northwest while decelerating and
degenerated into a remnant low around 0000 UTC 17 June. Later that day, the low dissipated
over the western part of Guerrero, Mexico.
There were three direct deaths associated with Carlotta. A mud-brick house collapsed in
the town of Pluma Hidalgo, Oaxaca, killing a 13-year-old girl and her 7-year-old sister. A 56-
year-old woman from the coastal city of San Jose Manialtepec, Oaxaca was killed when the
vehicle she was driving was flipped over by the wind. Some sources indicate that at least seven
people died in Mexico due to Carlotta. However, other than the three casualties listed above, it
cannot be confirmed whether these deaths were direct. At least 29,000 homes and 2,500
businesses in Mexico were affected by flooding and high winds, primarily in the state of Oaxaca,
although structural damage did not appear to be very severe. While monetary damage totals

2012 Eastern North Pacific Hurricane Season 4
are incomplete, it is worth noting that the state of Oaxaca requested 1.444 billion pesos ($113
million US) for repairs to public infrastructure.
FORECAST VERIFICATION
There were 310 official forecasts issued in the eastern North Pacific basin in 2012,
although only 39 of these verified at 120 h. This level of forecast activity was near normal.
NHC official track forecast errors set a new record for accuracy at the 12-, 24 -, 48-, 96-, and
120-h forecast times, and track forecast skill was at or near all-time highs. The official forecast
outperformed all of the guidance except for dynamical model consensus, TVCE, which beat the
official forecast at the 12-, 72-, and 96-h periods. Among the guidance models with sufficient
availability, EMXI was the best individual model, and GFSI and HWFI performed fairly well. The
skill of FSSE was close to that of TVCE, but it trailed TVCE by 5-10 % at 96 and 120 h.
For intensity, the official forecast errors in the eastern North Pacific basin were lower
than the 5-yr means at all times. The climatology and persistence (Decay-SHIFOR) model
errors in 2012 were slightly lower than their 5-yr means at all forecast times, indicating the
season’s storms were a little easier to forecast than normal. The official forecasts, in general,
performed as well as or better than all of the eastern Pacific guidance throughout the forecast
period. The ICON and DSHP were the best performers from 12 to 72 h. The LGEM was the best
individual model and beat the official forecast at 96 and 120 h. HWFI struggled late in the
forecast period and was the worst performer at the longer forecast times.
Quantitative probabilistic forecasts of tropical cyclogenesis (i.e., the likelihood of tropical
cyclone formation from a particular disturbance within 48 h) were made public for the first time in
2010. Forecasts were expressed in 10% increments and in terms of categories (“low”,
“medium”, or “high”). There was an under-forecast bias in the eastern North Pacific basin at
the middle probabilities with an over-forecast (high) bias at the high probabilities. Additional
details on the forecast verification for 2012 may be found in Cangialosi and Franklin (2013).
REFERENCES
Bell, G.D., M.S. Halpert, R.C. Schnell, R.W. Higgins, J. Lawrimore, V.E. Kousky, R. Tinker, W.
Thiaw, M. Chelliah, and A. Artusa, 2000: Climate assessment for 1999. Bull. Amer. Soc., s1-s50.
Cangialosi, J.P., and J.L. Franklin, 2013: 2012 National Hurricane Center Forecast Verification
Report [Available online at
http://www.nhc.noaa.gov/verification/pdfs/Verification_2012.pdf].

2012 Eastern North Pacific Hurricane Season 5
National Weather Service, Saffir-Simpson Team, 2010: The Saffir-Simpson Hurricane Wind Scale [Available online at http://www.nhc.noaa.gov/pdf/sshws.pdf].
Saffir, H.S., 1973: Hurricane wind and storm surge. Mil. Eng., 423, 4-5. Simpson, R. H., 1974: The hurricane disaster potential scale. Weatherwise, 27, 169 and 186.

2012 Eastern North Pacific Hurricane Season 6
Table 1. 2012 eastern North Pacific hurricane season statistics.
Name
Classa Datesb Maximum
1-min wind (kt)
Minimum sea level pressure
(mb) Direct deaths
Aletta TS May 14-19 45 1000
Bud MH May 20-26 100 961
Carlotta H June 14-16 95 973 3
Daniel MH July 4-12 100 961
Emilia MH July 7-15 120 945
Fabio H July 12-18 95 966
Gilma H August 7-11 70 984
Hector TS August 11-16 45 995
Ileana H August 27-September 2 75 978
John TS September 2-4 40 1000
Kristy TS September 12-17 50 998
Lane H September 15-19 75 985
Miriam MH September 22-27 105 959
Norman TS September 28-29 45 997
Olivia TS October 6-8 50 997
Paul MH October 13-17 105 959
Rosa TS October 30-November 3 45 1001
a TS = tropical storm, wind speed 34-63 kt (17-32 m s
-1); H = hurricane, wind speed 64 kt
(33 m s-1
) or higher; MH – major hurricane, hurricane with maximum winds 96 kt (49 m s-1
) or
higher. b Dates are based on UTC and include the tropical depression stage but exclude the post-tropical
stage.
2012 Eastern North Pacific Hurricane Season 7
Figure 1. Tracks of the first nine eastern North Pacific tropical storms and hurricanes of 2012.

2012 Eastern North Pacific Hurricane Season 8
Figure 2. Tracks of the last eight eastern North Pacific tropical storms and hurricanes of 2012.

2012 Eastern North Pacific Hurricane Season 9
Figure 3. July through October deep (1000-200 mb) layer wind anomalies for 2012. Note
that the wind barbs correspond to the actual wind anomalies multiplied by 5.
Anomalies are computed from the 1981-2010 mean.

2012 Eastern North Pacific Hurricane Season 10
Figure 4. WindSat 37-GHz color composite image of Hurricane Carlotta at 0030 UTC 16 June
2012, very near the time of landfall. Image courtesy of the Naval Research Laboratory.