2012 carbon dioxide price forecast - synapse energy economics
TRANSCRIPT

2012 Carbon Dioxide Price Forecast
October 4, 2012
AUTHORS
Rachel Wilson, Patrick Luckow,
Bruce Biewald, Frank Ackerman,
and Ezra Hausman

Table of Contents
1. EXECUTIVE SUMMARY .................................................................................................... 1
A. KEY ASSUMPTIONS .......................................................................................................... 1
B. STUDY APPROACH ........................................................................................................... 2
C. SYNAPSE’S 2012 CO2 PRICE FORECAST ....................................................................... 2
2. STRUCTURE OF THIS PAPER ........................................................................................ 5
3. DISCUSSION OF KEY ASSUMPTIONS ......................................................................... 6
A. FEDERAL GHG LEGISLATION IS INCREASINGLY LIKELY .................................................. 6
B. STATE AND REGIONAL INITIATIVES BUILDING TOWARD FEDERAL ACTION ....................... 6
4. MARGINAL ABATEMENT COSTS AND TECHNOLOGIES ....................................... 9
5. ANALYSES OF MAJOR CLIMATE CHANGE BILLS ................................................ 11
A. CAP-AND-TRADE PROPOSALS ....................................................................................... 11
B. CLEAN ENERGY STANDARD .......................................................................................... 13
6. KEY FACTORS AFFECTING ALLOWANCE PRICE PROJECTIONS .................... 15
A. ASSESSING THE POTENTIAL IMPACT OF A NATURAL GAS SUPPLY INCREASE ............... 16
7. THE U.S. INTERAGENCY SOCIAL COST OF CARBON .......................................... 18
8. CO2 PRICE FORECASTS IN UTILITY IRPS ................................................................ 19
9. RECOMMENDED 2012 CO2 PRICE FORECAST ....................................................... 20
APPENDIX A: STATE AND REGIONAL GHG INITIATIVES ............................................... 28

2012 Carbon Dioxide Price Forecast ▪ 1
1. Executive Summary Electric utilities and others should use a reasonable estimate of the future price of carbon dioxide
(CO2) emissions when evaluating resource investment decisions with multi-decade lifetimes.
Estimating this price can be difficult because, despite several attempts, the federal government
has not come to consensus on a policy (or a set of policies) to reduce greenhouse gas (GHG)
emissions in the U.S.
Although this lack of a defined policy certainly creates challenges, a “zero” price for the long-run
cost of carbon emissions is not a reasonable estimate. The need for a comprehensive effort in the
U.S. to reduce GHG emissions has become increasingly clear, and it is certain that any policy
requiring, or leading to, these reductions will result in a cost associated with emitting CO2 over
some portion of the life of long-lived electricity resources. Prudent planning requires a reasonable
effort to forecast CO2 prices despite the considerable uncertainty with regard to specific regulatory
details.
This 2012 forecast seeks to define a reasonable range of CO2 price estimates for use in utility
Integrated Resource Planning (IRP) and other electricity resource planning analyses. This forecast
updates Synapse’s 2011 CO2 price forecast, which was published in February of 2011. Our 2012
forecast incorporates new data that has become available since 2011, and extends the study
period end-date to 2040 in order to provide recommended CO2 price estimates for utilities
planning 30 years out into the future.
A. Key assumptions
Synapse’s 2012 CO2 price forecast reflects our expectation that cap-and-trade legislation will be
passed by Congress in the next five years, and the resultant allowance trading program will take
effect in or around 2020. These assumptions are based on the following reasoning:
We believe that a federal cap-and-trade program for GHGs is a key component of the
most likely policy outcome, as it enables the reduction of significant amounts of GHGs
while allowing those reductions to come from sources that can mitigate their emissions at
the least cost.
We believe that federal legislation is likely by the end of the session in 2017 (with
implementation by about 2020) prompted by one or more of the following factors:
o technological opportunity
o a patchwork of state policies to achieve state emission targets for 2020 spurring
industry demands for federal action
o a Supreme Court decision to allow nuisance lawsuits to go ahead, resulting in a
financial threat to energy companies
o increasingly compelling evidence of climate change
Given the interest and initiatives on climate change policies in states throughout the nation, a lack
of federal action will result in a hodgepodge of state policies. This scenario is a challenge for any
company that seeks to make investments in existing, modified, or new power plants. It would also

2012 Carbon Dioxide Price Forecast ▪ 2
lead to inefficient emissions decisions that are driven by inconsistent policies rather than
economics. Historically, this pattern of states and regions initiating policies that are eventually
superseded at a national level has been common for energy and environmental regulation in the
U.S. It seems likely that this will be the dynamic that ultimately leads to federal action on
greenhouse gases, as well.
In addition to the assumptions regarding a federal GHG program described above, we anticipate
that regional and state policies will lead to costs associated with GHGs in the near-term (i.e., prior
to 2020). Prudent planning requires that utilities take these costs into account when engaging in
resource planning.
B. Study approach
To develop its 2012 CO2 price forecast, Synapse reviewed more than 40 carbon price estimates
and related analyses, including:
McKinsey & Company’s 2010 analyses of the marginal abatement costs and abatement
potential of GHG mitigation technologies
Analyses of the CO2 allowance prices that would result from the major climate change bills
introduced in Congress over the past several years, including analyses by the Energy
Information Association (EIA) and the Environmental Protection Agency (EPA)
The U.S. Interagency Working Group’s estimates for the social cost of carbon
Analyses of the factors that affect projections of allowance prices, including analyses by
the EIA and Resources for the Future
CO2 price estimates used by utilities in a wide range of publicly available utility Integrated
Resource Plans
Because we expect that a federal cap and allowance trading program will ultimately be adopted,
analyses of the various Congressional proposals to date using this approach offer some of the
most relevant estimates of costs associated with greenhouse gas emissions under a variety of
regulatory scenarios. It is not possible to compare the results of all of these analyses directly,
however, because the specific models and the key assumptions vary.
Synapse also considered the impact on CO2 prices of regulatory measures outside of a cap-and-
trade program—such as a federal Renewable Portfolio Standard—that could simultaneously help
to achieve the emission-reduction goals of cap-and-trade. These “complementary policies” result
in lower CO2 allowance prices, since they would reduce the demand for CO2 emissions
allowances under cap-and-trade.
C. Synapse’s 2012 CO2 price forecast
Based on analyses of the sources described above, and relying on its own expert judgment,
Synapse developed Low, Mid, and High case forecasts for CO2 prices from 2020 to 2040. These
cases represent different appetites for reducing carbon, as described below.

2012 Carbon Dioxide Price Forecast ▪ 3
The Low case forecast starts at $15/ton in 2020, and increases to approximately $35/ton
in 2040.1 This forecast represents a scenario in which Congress begins regulation of
greenhouse gas emissions slowly—for example, by including a modest emissions cap, a
safety valve price, or significant offset flexibility. This price forecast could also be realized
through a series of complementary policies, such as an aggressive federal Renewable
Portfolio Standard, substantial energy efficiency investment, and/or more stringent
automobile CAFE mileage standards (in an economy-wide regulation scenario).
The Mid case forecast starts at $20/ton in 2020, and increases to approximately $65/ton in
2040. This forecast represents a scenario in which a federal cap-and-trade program is
implemented with significant but reasonably achievable goals, likely in combination with
some level of complementary policies to give some flexibility in meeting the reduction
goals. Also assumed in the Mid case is some degree of technological learning, i.e.
assuming that prices for emissions reductions technologies will decline as greater
efficiencies are realized in their design and manufacture and as new technologies become
available.
The High case forecast starts at $30/ton in 2020, and increases to approximately $90/ton
in 2040. This forecast is consistent with the occurrence of one or more factors that have
the effect of raising prices. These factors include somewhat more aggressive emissions
reduction targets; greater restrictions on the use of offsets (nationally or internationally);
restricted availability or high cost of technology alternatives such as nuclear, biomass and
carbon capture and sequestration; or higher baseline emissions.
Table ES-1 presents Synapse’s Low, Mid, and High case price projections for each year of the
study period, as well as the levelized cost for each case.
Figure ES-1 presents Synapse’s Low, Mid, and High case forecasts as compared to a broad
range of CO2 allowance prices used by utilities in resource planning over the past three years.
Synapse forecasts are represented by black lines, while utility forecasts are represented by grey.
1 Throughout this report, CO2 allowance prices are presented in $2012 per short ton CO2, except in reference to a
few original sources, where alternate units are clearly labeled. Results from other modeling analyses were converted to 2012 dollars using price deflators taken from the US Bureau of Economic Analysis. Because data were not available for 2012 in its entirety, values used for conversion were taken from Q2 of each year. Results originally provided in metric tonnes were converted to short tons by multiplying by a factor of 1.1.

2012 Carbon Dioxide Price Forecast ▪ 4
Table ES-1: Synapse 2012 CO2 allowance price projections (2012 dollars per ton CO2)
Figure ES-1: Synapse forecasts compared to a range of utility forecasts
Year Low Case Mid Case High Case
2020 $15.00 $20.00 $30.00
2021 $16.00 $22.25 $34.00
2022 $17.00 $24.50 $38.00
2023 $18.00 $26.75 $42.00
2024 $19.00 $29.00 $46.00
2025 $20.00 $31.25 $50.00
2026 $21.00 $33.50 $54.00
2027 $22.00 $35.75 $58.00
2028 $23.00 $38.00 $62.00
2029 $24.00 $40.25 $66.00
2030 $25.00 $42.50 $70.00
2031 $26.00 $44.75 $72.00
2032 $27.00 $47.00 $74.00
2033 $28.00 $49.25 $76.00
2034 $29.00 $51.50 $78.00
2035 $30.00 $53.75 $80.00
2036 $31.00 $56.00 $82.00
2037 $32.00 $58.25 $84.00
2038 $33.00 $60.50 $86.00
2039 $34.00 $62.75 $88.00
2040 $35.00 $65.00 $90.00
Levelized $23.24 $38.54 $59.38

2012 Carbon Dioxide Price Forecast ▪ 5
2. Structure of this Paper This paper presents Synapse’s assumptions, data sources, and estimates of reasonable future
CO2 prices for use in resource planning analyses. The report is structured as follows:
Section 3 discusses the key assumptions behind Synapse’s estimates
Sections 4 through 8 present data from the sources reviewed by Synapse in developing
its estimates of the future price of CO2 emissions
Section 9 presents Synapse’s 2012 Low, Mid, and High CO2 price forecasts, and
compares these projections to a range of utility forecasts
Appendix A provides a more detailed discussion of state and regional GHG initiatives.
Collectively, these initiatives suggest that momentum is building toward federal GHG
action

2012 Carbon Dioxide Price Forecast ▪ 6
3. Discussion of Key Assumptions
A. Federal GHG legislation is increasingly likely
Congressional action in the form of cap-and-trade or clean energy standards is only one avenue in
an increasingly dynamic and complex web of activities that could result in internalizing a portion of
the costs associated with emissions of greenhouse gases from the electric sector. The states, the
federal courts, and federal agencies are also grappling with the complex issues associated with
climate change. Many of these efforts are proceeding simultaneously.
Nonetheless, we believe that a federal cap-and-trade program for GHGs is the most likely policy
outcome, as it enables the reduction of significant amounts of GHGs while allowing those
reductions to come from sources that can mitigate their emissions at the least cost. Several cap-
and-trade proposals have been taken up by Congress in the past few years, though none yet have
been passed by both houses. (More discussion of this topic is provided in Section 5 of this report.)
We further believe that federal action will occur in the near-term. This 2012 CO2 price forecast
assumes that cap-and-trade legislation will be passed by Congress in the next five years, and the
resultant allowance trading program will take effect in 2020, prompted by one or more of the
following factors:
technological opportunity
a patchwork of state policies to achieve state emission targets for 2020 spurring industry
demands for federal action
a Supreme Court decision to allow nuisance lawsuits to go ahead, resulting in a financial
threat to energy companies
increasingly compelling evidence of climate change
Given the interest and initiatives on climate change policies in states throughout the nation, a lack
of federal action will result in a hodgepodge of state policies. This scenario is a challenge for any
company that seeks to make investments in existing, modified, or new power plants. It would also
lead to inefficient emissions decisions driven by inconsistent policies rather than economics.
Historically, this pattern of states and regions initiating policies that are eventually superseded at a
national level has been common for energy and environmental regulation in the U.S. It seems
likely that this will be the dynamic that ultimately leads to federal action on greenhouse gases, as
well.
B. State and regional initiatives building toward federal action
The states—individually and coordinating within regions—are leading the nation’s policies to
respond to the threat of climate change. In fact, several states, unwilling to wait for federal action,
are already pursuing policies on their own or in regional groups. These policies are described
below, and are discussed in more detail in Appendix A of this report.

2012 Carbon Dioxide Price Forecast ▪ 7
Cap-and-trade programs
The Northeast/Mid-Atlantic region and the state of California have developed, or are in the last
stages of developing, greenhouse gas caps and allowance trading. 2
Under the Regional Greenhouse Gas Initiative (RGGI), ten Northeast and Mid-Atlantic states have
agreed to a mandatory cap on CO2 emissions from the power sector with the goal of achieving a
ten percent reduction in these emissions from levels at the start of the program by 2018.
Meanwhile, California’s Global Warming Solutions Act (AB 32) has created the world’s second
largest carbon market, after the European Union’s Emissions Trading System (EU ETS). The first
compliance period for California’s cap-and-trade program will begin on January 1, 2013, and will
cover electricity generators, carbon dioxide suppliers, large industrial sources, and petroleum and
natural gas facilities emitting at least 25,000 metric tons of CO2e3 per year. The initial cap is set at
162.8 million metric tons of CO2e and decreases by 2% annually through 2015.
State GHG reduction laws
Massachusetts: In 2008, the Massachusetts Global Warming Solutions Act was signed into law.
In addition to the commitments to power sector emissions reductions associated with RGGI, this
law committed Massachusetts to reduce statewide emissions to 10-25% below 1990 levels by
2020 and 80% below 1990 levels by 2050. Following the development of a comprehensive plan on
steps to meet these goals, the 2020 target was set at 25% below 1990 levels.4 Rather than put a
price on carbon in the years before 2020, this plan will achieve a 25% reduction through a
combination of federal, regional, and state-level regulations applying to buildings, energy supply,
transportation, and non-energy emissions.
Minnesota: In 2008, the Next Generation Energy Act was signed to reduce Minnesota emissions
by 15% by 2015, 30% by 2025, and 80% by 2050.5 While the law called for the development of an
action plan that would make recommendations on a cap-and-trade system to meet these goals,
the near-term goals will be met by a combination of an aggressive renewable portfolio standard
and energy efficiency.
Connecticut: Also in 2008, the state of Connecticut passed its own Global Warming Solutions
Act, establishing state level targets 10% below 1990 levels by 2020 and 80% below 2001 levels by
2050. In December 2010, the state released a report on mitigation options focused on regulatory
mechanisms in addition to strengthening RGGI and reductions of non-CO2 greenhouse gases.6
2 The Midwest Greenhouse Gas Reduction Accord was developed in 2007. Though the agreement has not been
formally suspended, the participating states are no longer pursuing it. 3 CO2e refers to carbon dioxide equivalent, a measure that includes both carbon dioxide and other greenhouse
gases converted to an equivalent amount of carbon dioxide based on their global warming potential. 4 Massachusetts Clean Energy and Climate Plan for 2020, Available at:
http://www.mass.gov/green/cleanenergyclimateplan 5 Minnesota Statutes 2008 § 216B.241
6 See http://www.ctclimatechange.com for further details on CT plans for emissions mitigation.

2012 Carbon Dioxide Price Forecast ▪ 8
Renewable portfolio standards and other initiatives
A renewable portfolio standard (RPS) or renewable goal specifies that a minimum proportion of a
utility’s resource mix must be derived from renewable resources. The standards range from
modest to ambitious, and qualifying energy sources vary by state.
Currently, 29 U.S. states have renewable portfolio standards. Eight others have renewable
portfolio goals. In addition, many states are pursuing other policy actions relating to reductions of
GHGs. These policies include, but are not limited to: greenhouse gas inventories, greenhouse gas
registries, climate action plans, greenhouse gas emissions targets, and emissions performance
standards.
In the absence of a clear and comprehensive federal policy, many states have developed a broad
array of emissions and energy related policies. For example, Massachusetts has a RPS of 15% in
2020 (rising to 25% in 2030), belongs to RGGI (requiring specific emissions reductions from power
plants in the state), and has set in place aggressive energy efficiency targets through the 2008
Green Communities Act.
2012 Carbon Dioxide Price Forecast ▪ 9
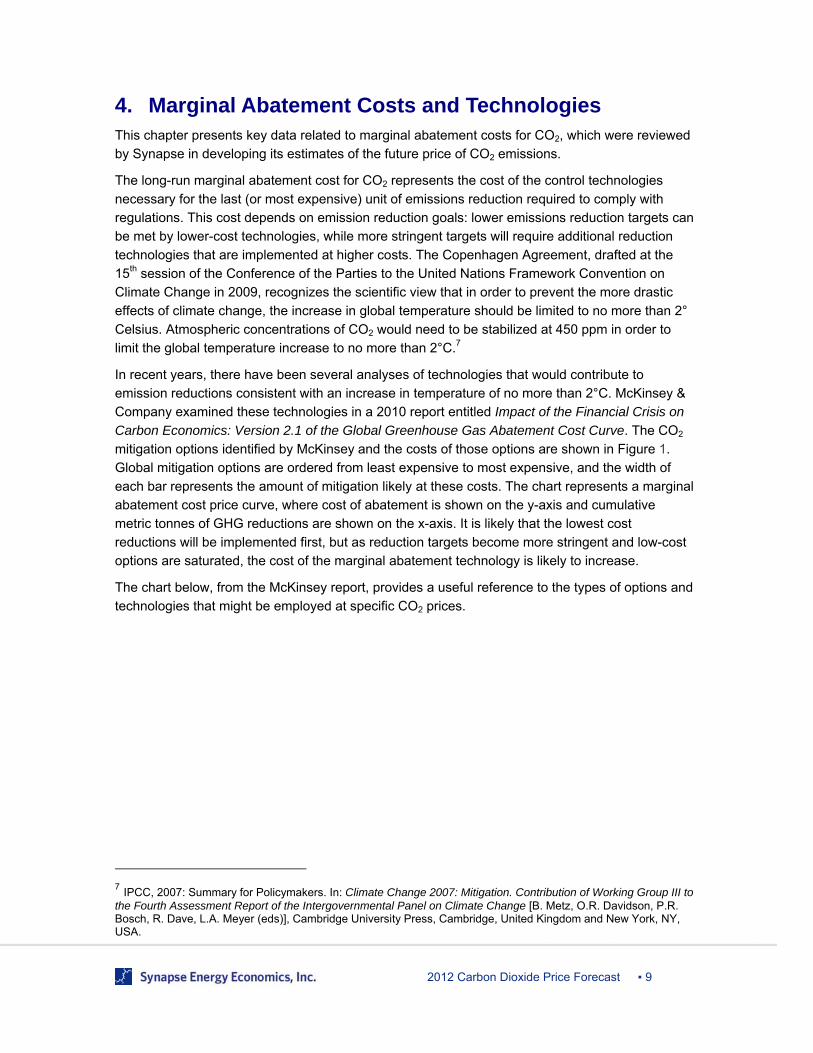
4. Marginal Abatement Costs and Technologies This chapter presents key data related to marginal abatement costs for CO2, which were reviewed
by Synapse in developing its estimates of the future price of CO2 emissions.
The long-run marginal abatement cost for CO2 represents the cost of the control technologies
necessary for the last (or most expensive) unit of emissions reduction required to comply with
regulations. This cost depends on emission reduction goals: lower emissions reduction targets can
be met by lower-cost technologies, while more stringent targets will require additional reduction
technologies that are implemented at higher costs. The Copenhagen Agreement, drafted at the
15th session of the Conference of the Parties to the United Nations Framework Convention on
Climate Change in 2009, recognizes the scientific view that in order to prevent the more drastic
effects of climate change, the increase in global temperature should be limited to no more than 2°
Celsius. Atmospheric concentrations of CO2 would need to be stabilized at 450 ppm in order to
limit the global temperature increase to no more than 2°C.7
In recent years, there have been several analyses of technologies that would contribute to
emission reductions consistent with an increase in temperature of no more than 2°C. McKinsey &
Company examined these technologies in a 2010 report entitled Impact of the Financial Crisis on
Carbon Economics: Version 2.1 of the Global Greenhouse Gas Abatement Cost Curve. The CO2
mitigation options identified by McKinsey and the costs of those options are shown in Figure 1.
Global mitigation options are ordered from least expensive to most expensive, and the width of
each bar represents the amount of mitigation likely at these costs. The chart represents a marginal
abatement cost price curve, where cost of abatement is shown on the y-axis and cumulative
metric tonnes of GHG reductions are shown on the x-axis. It is likely that the lowest cost
reductions will be implemented first, but as reduction targets become more stringent and low-cost
options are saturated, the cost of the marginal abatement technology is likely to increase.
The chart below, from the McKinsey report, provides a useful reference to the types of options and
technologies that might be employed at specific CO2 prices.
7 IPCC, 2007: Summary for Policymakers. In: Climate Change 2007: Mitigation. Contribution of Working Group III to the Fourth Assessment Report of the Intergovernmental Panel on Climate Change [B. Metz, O.R. Davidson, P.R. Bosch, R. Dave, L.A. Meyer (eds)], Cambridge University Press, Cambridge, United Kingdom and New York, NY, USA.

2012 Carbon Dioxide Price Forecast ▪ 10
Figure 1: McKinsey & Company marginal abatement technologies and associated costs for the year 20308
As shown in Figure 1, technologies for carbon mitigation that are available to the electric sector
include those related to energy efficiency, nuclear power, renewable energy, and carbon capture
and storage (CCS) for fossil-fired generating resources. McKinsey estimates CCS technologies to
cost 50-60 €/metric tonne (2005€). Converted into current dollars, this is equivalent to $65 to
$85/ton ($71.5 to $93.5/metric tonne, 2012$). According to the International Energy Agency (IEA),
“in order to reach the goal of stabilizing global emissions at 450 ppm by 2050, CCS will be
necessary.”9 If this is true, it is reasonable to expect that a CO2 allowance price will rise to $65/ton
or higher under a GHG policy designed to limit the global temperature increase to no more than
2°C. However, if significant reductions could be accomplished with CCS at the high $65 to $85/ton
CO2 range, we would not expect CO2 mitigation prices to significantly exceed the top of that range.
8 McKinsey & Company. Impact of the Financial Crisis on Carbon Economics: Version 2.1 of the Global
Greenhouse Gas Abatement Cost Curve. 2010. Page 8. 9 International Energy Agency. Technology Roadmap: Carbon Capture and Storage. 2009. Page 4.

2012 Carbon Dioxide Price Forecast ▪ 11
5. Analyses of Major Climate Change Bills This chapter presents key data related to analyses of major climate change bills proposed in
Congress over the past few years, which were reviewed by Synapse in developing its estimates of
the future price of CO2 emissions. Because we expect that a federal cap and allowance trading
program will ultimately be adopted, analyses of these proposals offer some of the most relevant
estimates of costs associated with greenhouse gas emissions under a variety of regulatory
scenarios. It is not possible to compare the results of all of these analyses directly, however,
because the specific models and the key assumptions vary.
A. Cap-and-trade proposals
In the past decade, the expectation has been that action on climate change policy will occur at the
Congressional level. Legislative proposals have largely taken the form of cap-and-trade programs,
which would reduce greenhouse gas emissions through a federal cap, and would allow trading of
allowances to promote reductions in GHG emissions where they are most economic. Legislative
proposals and President Obama’s stated target aim to reduce emissions by up to 80% from
current levels by 2050.
Comprehensive climate legislation was passed in the House in the 111th Congress in the form of the American Clean Energy and Security Act of 2009 (ACES, also known as Waxman-Markey and HR 2454); however, the Senate ultimately did not take up climate legislation in that session. HR 2454 was a cap-and-trade program that would have required a 17% reduction in emissions from 2005 levels by 2020, and an 83% reduction by 2050. It was approved by the House of Representatives in June, 2009, but the Senate bill, known as the American Power Act of 2010 (APA, also known as Kerry-Lieberman), never came to a vote.
Figure 2 shows the results of EIA and EPA analyses of HR 2454 and APA. The chart shows the
forecasted allowance prices in the central scenarios, as well as a range of sensitivities. Figure 3
shows these values as levelized prices for the time period 2015 to 2030.10
10 Consistent with EIA and EPA modeling analyses, a 5% real discount rate was used in all levelization calculations.

2012 Carbon Dioxide Price Forecast ▪ 12
Figure 2: Greenhouse gas allowance price projections for HR 2454 and APA 201011
11
Sources for Figure 2 include the following: U.S. Energy Information Administration (EIA); Energy Market and Economic Impacts of the American Power Act of 2010 (July 2010). Available at http://www.eia.gov/oiaf/servicerpt/kgl/index.html EIA; Energy Market and Economic Impacts of H.R. 2454, the American Clean Energy and Security Act of 2009 (August 2009). Available at http://www.eia.doe.gov/oiaf/servicerpt/hr2454/index.html U.S. Environmental Protection Agency (“EPA”); Analysis of the American Power Act of 2010 in the 111th Congress (June 2010). Available at http://www.epa.gov/climatechange/Downloads/EPAactivities/EPA_APA_Analysis_6-14-10.pdf EPA; Supplemental EPA Analysis of the American Clean Energy and Security Act of 2009 (H.R. 2454) (January 2010). Available at: Available at http://www.epa.gov/climatechange/economics/pdfs/HR2454_SupplementalAnalysis.pdf EPA; Analysis of the American Clean Energy and Security Act of 2009 (H.R. 2454) (June 2009). Available at: http://www.epa.gov/climatechange/Downloads/EPAactivities/HR2454_Analysis.pdf

2012 Carbon Dioxide Price Forecast ▪ 13
Figure 3: GHG allowance price projections for HR 2454 and APA 2010 - levelized 2015-2030
B. Clean Energy Standard
The 112th Congress chose not to revisit legislation establishing an economy-wide emissions cap,
and instead focused on policies aimed at fostering technology innovation and developing
renewable energy or clean energy standards. In March 2012, Senator Bingaman introduced the
Clean Energy Standard Act of 2012 (S.2146), under which larger utilities would be required to
meet a percentage of their sales with electric generation from sources that produce fewer
greenhouse gas emissions than a conventional coal-fired power plant. All generation from wind,
solar, geothermal, biomass, municipal solid waste, and landfill gas would earn a full CES credit, as
would hydroelectric and nuclear facilities. Lower-carbon fossil facilities, such as natural gas and
coal with carbon capture, would earn partial credits based on their CO2 emissions. Generation
owners would be required to hold credits equivalent to 24% of their sales beginning in 2015, and
the CES requirement rises over time to 84% by 2035, creating demand for renewable energy and
low-emissions technologies. The credits generated by these clean technologies would be tradable
and have a value that would change depending on how costly the policy is to achieve. The Clean
Energy Standard would apply to utilities with sales greater than 2 million MWh, and expand to
include those with sales greater than 1 million MWh by 2025.

2012 Carbon Dioxide Price Forecast ▪ 14
The EIA conducted analyses of a potential Clean Energy Standard in both 2011 and 2012.12,13 All
of these cases result in some level of increase in nuclear, gas, and renewable generation, typically
at the expense of coal. The exact generation mix, as well as the resulting reduction in emissions,
is highly dependent on both the technology costs and policy design. The resulting CES credit
prices (Figure 4) vary widely, from 25 to 70 mills/kWh in 2020,14 rising to 47 to 138 mills/kWh in
2035. The credit cap cases show a smaller rise in credit prices. When credit prices are capped at
a specific value, clean energy deployment and emissions abatement is reduced.
An effective CO2 allowance price can be calculated based on the fact that this policy gives existing
gas combined cycle units 0.48 credits and existing coal units zero credits, and the emissions from
an average gas unit are about 0.57 tCO2/MWh and from an average coal unit 1.125 tCO2/MWh.15
For the BCES 2012 case, for example, this conversion would result in effective allowance prices of
$18.4/tCO2 in 2015 and $71.4/tCO2 in 2035.
Figure 4: CES credit prices in EIA analyses of a U.S. Clean Energy Standard
12
US EIA. 2011. Analysis of Impacts of a Clean Energy Standard as requested by Chairman Bingaman. http://www.eia.gov/analysis/requests/ces_bingaman/. 13
US EIA. 2012. Analysis of the Clean Energy Standard Act of 2012. http://www.eia.gov/analysis/requests/bces12/. 14
A mill is one one-hundredth of a cent. Therefore, these CES prices in 2020 represent costs of 0.25 to 0.70 c/kWh, or $2.5 to $7/MWh. 15
EPA Air Emissions Overview, Available at: http://www.epa.gov/cleanenergy/energy-and-you/affect/air-emissions.htm
2012 Carbon Dioxide Price Forecast ▪ 15
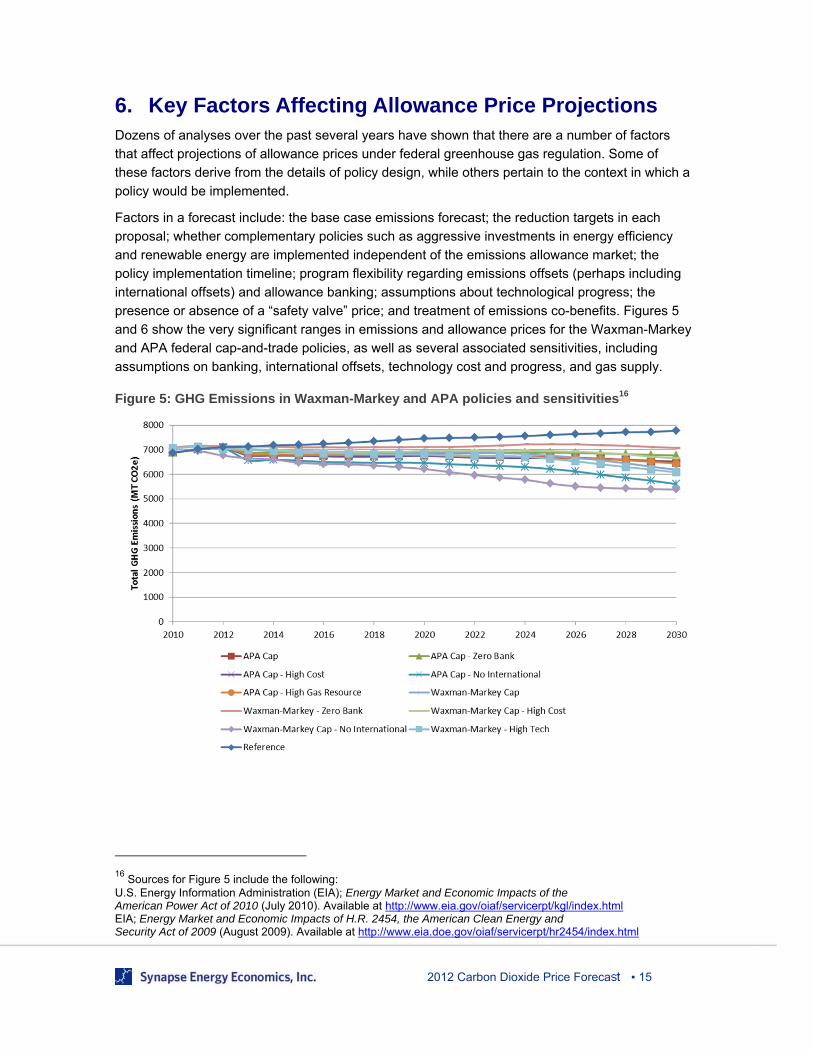
6. Key Factors Affecting Allowance Price Projections Dozens of analyses over the past several years have shown that there are a number of factors
that affect projections of allowance prices under federal greenhouse gas regulation. Some of
these factors derive from the details of policy design, while others pertain to the context in which a
policy would be implemented.
Factors in a forecast include: the base case emissions forecast; the reduction targets in each
proposal; whether complementary policies such as aggressive investments in energy efficiency
and renewable energy are implemented independent of the emissions allowance market; the
policy implementation timeline; program flexibility regarding emissions offsets (perhaps including
international offsets) and allowance banking; assumptions about technological progress; the
presence or absence of a “safety valve” price; and treatment of emissions co-benefits. Figures 5
and 6 show the very significant ranges in emissions and allowance prices for the Waxman-Markey
and APA federal cap-and-trade policies, as well as several associated sensitivities, including
assumptions on banking, international offsets, technology cost and progress, and gas supply.
Figure 5: GHG Emissions in Waxman-Markey and APA policies and sensitivities16
16
Sources for Figure 5 include the following: U.S. Energy Information Administration (EIA); Energy Market and Economic Impacts of the American Power Act of 2010 (July 2010). Available at http://www.eia.gov/oiaf/servicerpt/kgl/index.html EIA; Energy Market and Economic Impacts of H.R. 2454, the American Clean Energy and Security Act of 2009 (August 2009). Available at http://www.eia.doe.gov/oiaf/servicerpt/hr2454/index.html

2012 Carbon Dioxide Price Forecast ▪ 16
Figure 6: Allowance prices in ACES and APA policies and sensitivities17
A. Assessing the potential impact of a natural gas supply increase
The recent shale gas boom has put substantial downward pressure on natural gas prices. Several
factors could influence future gas prices, including the estimated ultimate recovery per well and
regulations addressing the environmental impacts of hydraulic fracturing.18 The impact of higher or
lower gas prices on carbon prices is uncertain. In the near term, lower natural gas prices are likely
to make emissions mitigation in the electric sector less expensive, as gas power plants can
displace coal plants at lower cost. Conversely, as marginal electricity prices are frequently set by
natural gas plants, lower gas prices will contribute to lower electricity prices, potentially increasing
electricity consumption and associated emissions. Lower electricity prices also make it more
difficult for renewable technologies with even lower emissions than gas to compete in electricity
markets.
In 2010, Resources for the Future (RFF) used a version of the EIA’s National Energy Modeling
System (NEMS) energy model to test effects of increased gas supply from shale gas on the
economics of energy policy. Under a moderate climate policy, the high gas scenario decreased
the 2030 allowance price by less than 1%, from $61.1 to $60.8 per ton of CO2.19 The EIA showed
17
Sources for Figure 6 include the following: U.S. Energy Information Administration (EIA); Energy Market and Economic Impacts of the American Power Act of 2010 (July 2010). Available at http://www.eia.gov/oiaf/servicerpt/kgl/index.html EIA; Energy Market and Economic Impacts of H.R. 2454, the American Clean Energy and Security Act of 2009 (August 2009). Available at http://www.eia.doe.gov/oiaf/servicerpt/hr2454/index.html 18
EIA (2012) “Projected natural gas prices depend on shale gas resource economics” http://www.eia.gov/todayinenergy/detail.cfm?id=7710 19
Brown et al (2010). “Abundant Shale Gas Resources: Some Implications for Energy Policy”. Available at: http://www.rff.org/RFF/Documents/RFF-BCK-Brownetal-ShaleGas.pdf

2012 Carbon Dioxide Price Forecast ▪ 17
similar results in its analysis of the American Power Act: increased gas supply decreased the 2030
allowance price by less than 0.1%, from $49.80 to $49.78 per ton of CO2.20 In the policies studied
by EIA and RFF, the result of an increased gas supply amounted to an inconsequential reduction
in CO2 prices. At this point it appears that, while a large shale gas resource may change how each
policy is met, it is not a significant factor in the CO2 cost that utilities should use for planning.
Ongoing studies are expected to provide further insight into this issue.21
20
EIA (2010) “Energy Market and Economic Impacts of the American Power Act of 2010”. Available at: http://www.eia.gov/oiaf/servicerpt/kgl/index.html 21
The Energy Modeling Forum will evaluate carbon constraints under cases of reference and high case supply levels in the EMF 26 study, which began in late 2011 and is ongoing (see http://emf.stanford.edu/research/emf_26/)

2012 Carbon Dioxide Price Forecast ▪ 18
7. The U.S. Interagency Social Cost of Carbon In 2010, the U.S. government began to use “social cost of carbon” values in an attempt to account
for the damages resulting from climate change.22 Four values for the social cost of carbon were
initially provided by the Interagency Working Group on the Social Cost of Carbon, a group
composed of members of the Department of Agriculture, Department of Commerce, Department
of Energy, Environmental Protection Agency, and Department of Transportation, among others.
This group was tasked with the development of a consistent value for the global societal benefits
of climate change abatement. These values, $5, $21, $35, and $65 per metric tonne of CO2 in
2007 dollars ($4.9, $20.7, $34.5, and $64.0 per ton in 2012 dollars), reflected three discount rates
and one estimate of the high cost tail-end of the distribution of impacts. As of May 2012, these
estimates have been used in at least 20 federal government rulemakings, for policies including
fuel economy standards, industrial equipment efficiency, lighting standards, and air quality rules.23
The U.S. “social cost” values are the result of analysis using the DICE, PAGE, and FUND
integrated assessment models. The combination of complex climate and economic systems with
these reduced-form integrated assessment models leads to substantial uncertainties. In a 2012
paper, Ackerman and Stanton24 explored the impact of specific assumptions used by the
Interagency Working Group, and found values for the social cost of carbon ranging from the
Working Group’s level up to more than an order of magnitude greater. Despite limitations in the
calculations for the social cost of carbon stemming from the choice of socio-economic scenarios,
modeling of the physical climate system, and quantifying damages around the globe for hundreds
of years into the future, this multi-agency effort represents an important initial attempt at
incorporating consistent values for the benefits associated with CO2 abatement in federal policy.
22
Interagency Working Group on the Social Cost of Carbon, U. S. G. (2010). Appendix 15a. Social cost of carbon for regulatory impact analysis under Executive Order 12866. In Final Rule Technical Support Document (TSD): Energy Efficiency Program for Commercial and Industrial Equipment: Small Electric Motors. U.S. Department of Energy. URL http://go.usa.gov/3fH. 23
Robert E. Kopp and Bryan K. Mignone (2012). The U.S. Government’s Social Cost of Carbon Estimates after Their First Two Years: Pathways for Improvement. Economics: The Open-Access, Open-Assessment E-Journal, Vol. 6, 2012-15. http://dx.doi.org/10.5018/economics-ejournal.ja.2012-15 24
Frank Ackerman and Elizabeth A. Stanton (2012). Climate Risks and Carbon Prices: Revising the Social Cost of Carbon. Economics: The Open-Access, Open-Assessment E-Journal, Vol. 6, 2012-10. http://dx.doi.org/10.5018/economics-ejournal.ja.2012-10

2012 Carbon Dioxide Price Forecast ▪ 19
8. CO2 Price Forecasts in Utility IRPs A number of electric companies have included projections of costs associated with greenhouse
gas emissions in their resource planning procedures. Figure 7 presents the mid-case values of
publicly available forecasts used by utilities in resource planning over the past three years.
Figure 7: Utility Mid Case CO2 Price Forecasts

2012 Carbon Dioxide Price Forecast ▪ 20
9. Recommended 2012 CO2 Price Forecast Based on analyses of the sources described in Sections 4 through 8, and relying on our own
expert judgment, Synapse developed Low, Mid, and High case forecasts for CO2 prices from 2020
to 2040. Figure 8 shows the range covered by the Synapse forecasts in three years: 2020, 2030,
and 2040. These forecasts share the common assumption that a federal cap-and-trade policy will
be passed sometime within the next five years, and will go into effect in 2020. All annual
allowance prices and levelized values are reported in 2012 dollars per ton of carbon dioxide.25
Figure 8: Synapse 2012 Forecast Values
Each of the forecasts shown in Figure 8 represents a different appetite for reducing carbon, as
described below.
The Low case forecast starts at $15/ton in 2020, and increases to approximately $35/ton
in 2040, representing a $23/ton levelized price over the period 2020-2040. This forecast
represents a scenario in which Congress begins regulation of greenhouse gas emissions
slowly—for example, by including a modest emissions cap, a safety valve price, or
significant offset flexibility. This price forecast could also be realized through a series of
complementary policies, such as an aggressive federal Renewable Portfolio Standard,
substantial energy efficiency investment, and/or more stringent automobile CAFE mileage
standards (in an economy-wide regulation scenario). Such complementary policies would
25
All values in the Synapse Forecast are presented in 2012 dollars. Results from EIA and EPA modeling analyses were converted to 2012 dollars using price deflators taken from the US Bureau of Economic Analysis, and available at: http://www.bea.gov/national/nipaweb/SelectTable.asp Because data were not available for 2012 in its entirety, values used for conversion were taken from Q2 of each year. Consistent with EIA and EPA modeling analyses, a 5% real discount rate was used in all levelization calculations.

2012 Carbon Dioxide Price Forecast ▪ 21
lead directly to a reduction in CO2 emissions independent of federal cap-and-trade, and
would thus lower the expected allowance prices associated with the achievement of any
particular federally mandated goal.
The Mid case forecast starts at $20/ton in 2020, and increases to approximately $65/ton in
2040, representing a $39/ton levelized price over the period 2020-2040. This forecast
represents a scenario in which a federal cap-and-trade program is implemented with
significant but reasonably achievable goals, likely in combination with some level of
complementary policies to give some flexibility in meeting the reduction goals. These
complementary policies would include renewables, energy efficiency, and transportation
standards, as well as some level of allowance banking and offsets. Also assumed in the
Mid case is some degree of technological learning, i.e. assuming that prices for emissions
reductions technologies will decline as greater efficiencies are realized in their design and
manufacture and as new technologies become available.
The High case forecast starts at $30/ton in 2020, and increases to approximately $90/ton
in 2040, representing a $59/ton levelized price over the period 2020-2040. This forecast is
consistent with the occurrence of one or more factors that have the effect of raising prices.
These factors include somewhat more aggressive emissions reduction targets; greater
restrictions on the use of offsets; restricted availability or high cost of technology
alternatives such as nuclear, biomass, and carbon capture and sequestration; more
aggressive international actions (thereby resulting in fewer inexpensive international
offsets available for purchase by U.S. emitters); or higher baseline emissions.
Synapse’s Low, Mid, and High case price projections for each year of the study period are
presented in graphic and tabular form, below.
Figure 9: Synapse 2012 CO2 Price Trajectories

2012 Carbon Dioxide Price Forecast ▪ 22
Table 1: Synapse 2012 CO2 Allowance Price Projections (2012 dollars per ton CO2)
The following charts compare the Synapse Mid, High, and Low case forecasts against various
utility estimates. Data on utility estimates was collected from a wide range of available public
Integrated Resource Plans (IRPs). We have excluded several IRPs with zero carbon prices or
IRPs with no carbon price given, accounting for 9 of 65 collected.
Figure 10 shows 26 utility CO2 price forecasts, with 2030 prices ranging from $10/tCO2 to above
$80/tCO2. Due to the extended development period of many IRPs, some of these forecasts may
not accurately reflect very recent years; a NM Public Service forecast, for example, begins in
2010, when there was no economy-wide CO2 price. Nevertheless, IRPs do their best to represent
accurate views of the future, in order to develop least-cost plans. The Synapse Mid forecast,
beginning at $20/tCO2 and rising to $65/tCO2, lies well within the range of the mid-case forecasts
shown here.
Year Low Case Mid Case High Case
2020 $15.00 $20.00 $30.00
2021 $16.00 $22.25 $34.00
2022 $17.00 $24.50 $38.00
2023 $18.00 $26.75 $42.00
2024 $19.00 $29.00 $46.00
2025 $20.00 $31.25 $50.00
2026 $21.00 $33.50 $54.00
2027 $22.00 $35.75 $58.00
2028 $23.00 $38.00 $62.00
2029 $24.00 $40.25 $66.00
2030 $25.00 $42.50 $70.00
2031 $26.00 $44.75 $72.00
2032 $27.00 $47.00 $74.00
2033 $28.00 $49.25 $76.00
2034 $29.00 $51.50 $78.00
2035 $30.00 $53.75 $80.00
2036 $31.00 $56.00 $82.00
2037 $32.00 $58.25 $84.00
2038 $33.00 $60.50 $86.00
2039 $34.00 $62.75 $88.00
2040 $35.00 $65.00 $90.00
Levelized $23.24 $38.54 $59.38

2012 Carbon Dioxide Price Forecast ▪ 23
Figure 10: Synapse 2012 Mid forecast as compared to the Mid forecasts of various U.S. utilities (2010-2012)26
Figure 11 overlays the Synapse High case and the high case forecasts of many IRPs on top of the
utility mid case forecasts shown in Figure 10 (now shaded in grey). Not all IRPs that provide mid-
level forecasts also provide high forecasts. The high cases generally reflect a nearer-term policy
start date, as well as a more rapid rate of increase in prices with time. The Synapse forecast starts
later than most, and rises from $30/tCO2 in 2020 to $90/tCO2 in 2040.
26
Legend given here is common to all subsequent utility price forecast charts. While scenario names may change, colors are constant for a given utility.

2012 Carbon Dioxide Price Forecast ▪ 24
Figure 11: Synapse High forecast as compared to the High and Mid forecasts of various utilities (see legend in Figure 10)
Figure 12 overlays the Synapse Low case and the low case forecasts of many IRPs on top of the
utility mid case forecasts shown in Figure 10 (shaded in grey). The low case forecasts both start at
substantially lower values (occasionally at zero values), and rise at slower rates. The Synapse
forecast starts later than most and rises from $15/tCO2 in 2020 to $35/tCO2 in 2040.

2012 Carbon Dioxide Price Forecast ▪ 25
Figure 12: Synapse Low forecast as compared to the Low and Mid forecasts of various utilities (see legend in Figure 10)
Figure 13 shows Synapse’s Low, Mid, and High forecasts compared to the full range of utility
forecasts shown above. The Synapse projections represent a plausible range of possible future
costs. Using all three recommended price trajectories will facilitate sensitivity testing of long-term
investment decisions in electric sector resource planning against likely federal climate policy
scenarios.

2012 Carbon Dioxide Price Forecast ▪ 26
Figure 13: Synapse forecasts compared to the range of utility forecasts
Figure 14 compares the levelized costs of Synapse’s Low, Mid, and High cases to the levelized
costs of utility estimates for 2020 through 2030, a period after the start and before the end of most
forecasts. While levelizing between 2020 and 2030 results in different Synapse values than
presented in Table 1 (where forecasts were levelized between 2020 and 2040), this approach
allows for overlap and comparison with a broader range of utility estimates.

2012 Carbon Dioxide Price Forecast ▪ 27
Figure 14: Levelized price of CO2, 2020-2030, utilities and Synapse27
27
All forecasts are levelized with a 5% discount rate based on CO2 prices between 2020 and 2030. Forecasts with a price for only a single year excluded.

2012 Carbon Dioxide Price Forecast ▪ 28
Appendix A: State and Regional GHG Initiatives The states—individually and coordinating within regions—are leading the nation’s policies to
respond to the threat of climate change. In fact, several states, unwilling to postpone and wait for
federal action, are pursuing policies specifically because of the lack of federal legislation.
This appendix provides a more thorough discussion of state and regional greenhouse gas (GHG)
initiatives. Collectively, these initiatives suggest that momentum is building toward more
comprehensive federal GHG action.
Cap-and-trade programs
The Northeast/Mid-Atlantic region and the state of California have developed, or are in the last
stages of developing, greenhouse gas caps and allowance trading. 28
Regional Greenhouse Gas Initiative: The Regional Greenhouse Gas Initiative (RGGI) is an
effort of ten Northeast and Mid-Atlantic states to limit greenhouse gas emissions, and is the first
market-based CO2 emissions reduction program in the United States. Participating states have
agreed to a mandatory cap on CO2 emissions from the power sector with the goal of achieving a
ten percent reduction in these emissions from levels at the start of the program by 2018.29 This is
the first mandatory carbon trading program in the nation. Recently, allowance prices have been
hitting the CO2 price floor, as actual emissions are far below the budget of 188 mtons/year.
California: In 2006, the California Legislature passed the Global Warming Solutions Act (AB 32),
which requires the state to reduce emissions of GHGs to 1990 levels by 2020. The California Air
Resources Board (CARB) outlined more than a dozen measures to reduce carbon emissions to
target levels in its 2008 Scoping Plan. Those measures include a renewable portfolio standard, a
low carbon fuel standard, and a cap-and-trade program. Approximately 22.5% of the emissions
reductions called for by AB 32 are estimated to occur under the cap-and-trade program. California
will have the world’s second largest carbon market, after the European Union’s Emissions Trading
System (EU ETS).
The first compliance period for the program will begin on January 1, 2013, and will cover electricity
generators, carbon dioxide suppliers, large industrial sources, and petroleum and natural gas
facilities emitting at least 25,000 metric tons of CO2e per year. The second compliance period will
run from 2015-2017, and the third compliance period will cover 2018-2020. During these periods,
the cap-and-trade program will expand to cover suppliers of natural gas, distillate fuel oil, and
liquefied petroleum gas if the combustion of their products would result in 25,000 metric tons of
CO2e or more.30 The initial cap is set at 162.8 million metric tons of CO2e and decreases by 2%
annually through 2015. When additional sources are added, the cap increases to accommodate
them, but then increases the percentage reductions in emissions to 3% in 2016, rising to 2.5% in
2020. The state plans to allocate the bulk of allowances for free in 2013, but will gradually auction
28
The Midwest Greenhouse Gas Reduction Accord was developed in 2007. Though the agreement has not been formally suspended, the participating states are no longer pursuing it. 29
The ten states are: Connecticut, Delaware, Maine, Maryland, Massachusetts, New Hampshire, New Jersey, New York, Rhode Island, and Vermont. Information on the RGGI program, including history, important documents, and auction results is available on the RGGI Inc website at www.rggi.org 30
§95812 (d)(1), page 48
2012 Carbon Dioxide Price Forecast ▪ 29
an increasing number of allowances between 2013 and 2020. Banking31 and offsets32 are both
allowed under the California program.
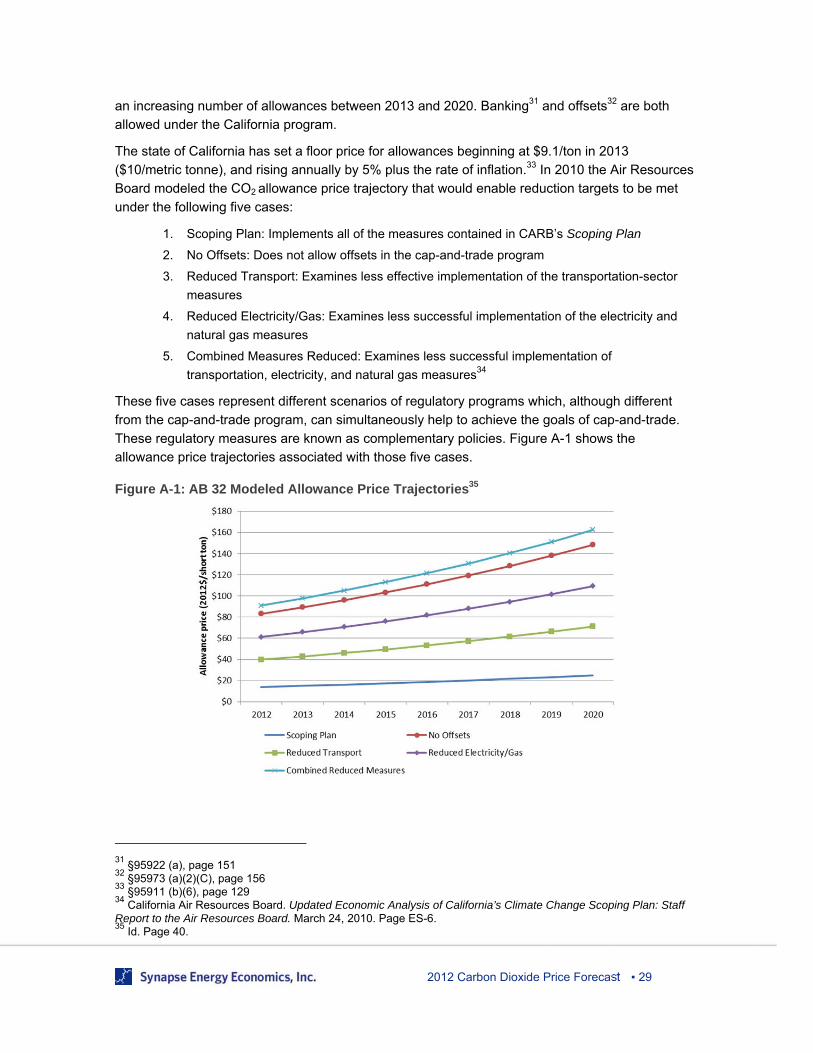
The state of California has set a floor price for allowances beginning at $9.1/ton in 2013
($10/metric tonne), and rising annually by 5% plus the rate of inflation.33 In 2010 the Air Resources
Board modeled the CO2 allowance price trajectory that would enable reduction targets to be met
under the following five cases:
1. Scoping Plan: Implements all of the measures contained in CARB’s Scoping Plan
2. No Offsets: Does not allow offsets in the cap-and-trade program
3. Reduced Transport: Examines less effective implementation of the transportation-sector
measures
4. Reduced Electricity/Gas: Examines less successful implementation of the electricity and
natural gas measures
5. Combined Measures Reduced: Examines less successful implementation of
transportation, electricity, and natural gas measures34
These five cases represent different scenarios of regulatory programs which, although different
from the cap-and-trade program, can simultaneously help to achieve the goals of cap-and-trade.
These regulatory measures are known as complementary policies. Figure A-1 shows the
allowance price trajectories associated with those five cases.
Figure A-1: AB 32 Modeled Allowance Price Trajectories35
31
§95922 (a), page 151 32
§95973 (a)(2)(C), page 156 33
§95911 (b)(6), page 129 34
California Air Resources Board. Updated Economic Analysis of California’s Climate Change Scoping Plan: Staff Report to the Air Resources Board. March 24, 2010. Page ES-6. 35
Id. Page 40.

2012 Carbon Dioxide Price Forecast ▪ 30
As shown in Figure A-1, when the policies that are complementary to the cap-and-trade program
are less effective, greater CO2 reductions need to occur under the cap-and-trade program, and the
allowance price is much higher. Similarly, the availability of offsets lowers the allowance price in
the cap-and-trade program, as compliance with reduction targets can be met with offsets. This
allows banking of allowances in the beginning of the program, which can keep allowance prices
lower in later years.
California’s first allowance auction is scheduled for November 14. A trial auction was completed
on August 30, and more than 430 entities that will be regulated under the cap-and-trade program
were invited to participate. CARB does not plan to release a settlement price, but on the date of
the test auction, futures for December 2013 were trading at $14.77/ton, and forward contracts had
sold for $14.77 and $14.82/ton.
State GHG reduction laws
Massachusetts: In 2008, the Massachusetts Global Warming Solutions Act was signed into law.
In addition to the commitments to power sector emissions reductions associated with RGGI, this
law committed Massachusetts to reduce statewide emissions to 10-25% below 1990 levels by
2020 and 80% below 1990 levels by 2050. Following the development of a comprehensive plan on
steps to meet these goals, the 2020 target was set at 25% below 1990 levels.36 Rather than put a
price on carbon in the years before 2020, this plan will achieve a 25% reduction through a
combination of federal, regional, and state level regulations applying to buildings, energy supply,
transportation, and non-energy emissions.
Minnesota: In 2008, the Next Generation Energy Act was signed to reduce Minnesota emissions
by 15% by 2015, 30% by 2025, and 80% by 2050.37 While the law called for the development of
an action plan that would make recommendations on a cap-and-trade system to meet these goals,
the near-term goals will be met by a combination of an aggressive renewable portfolio standard
and energy efficiency.
Connecticut: Also in 2008, the state of Connecticut passed its own Global Warming Solutions
Act, establishing state level targets 10% below 1990 levels by 2020 and 80% below 2001 levels by
2050. In December 2010, the state released a report on mitigation options focused on regulatory
mechanisms in addition to strengthening RGGI and reductions of non-CO2 greenhouse gases.38
Renewable portfolio standards and other initiatives
A renewable portfolio standard (RPS) or renewable goal specifies that a minimum proportion of a
utility’s resource mix must be derived from renewable resources. These policies require electric
utilities and other retail electric providers to supply a specified minimum amount—usually a
percentage of total load served—with electricity from eligible resources. The standards range from
modest to ambitious, and qualifying energy sources vary by state.
36
Massachusetts Clean Energy and Climate Plan for 2020, Available at: http://www.mass.gov/green/cleanenergyclimateplan 37
Minnesota Statutes 2008 § 216B.241 38
See http://www.ctclimatechange.com for further details on CT plans for emissions mitigation.

2012 Carbon Dioxide Price Forecast ▪ 31
In general the goal of an RPS policy is to increase the development of renewable resources by
creating a market demand. Increasing demand makes these technologies more economically
competitive with other less expensive, but polluting, forms of electric generation. Many other policy
objectives drive the adoption of an RPS or renewable goal, including climate change mitigation,
job creation, energy security, and cleaner air.
The impact of an RPS on CO2 emissions is dependent on factors such as:
the types of resources that are eligible to meet the standard,
the target level set by the RPS,
the base quantity of electricity sales upon which the standard is set,
how renewable energy credits (RECs) or attributes are tracked or counted,
how RECs are assigned to different resources,
banking, trading and borrowing of RECs,
alternative compliance options, and
coordination with other state and federal policies.
Currently, 29 US states have renewable portfolio standards. Eight others have renewable portfolio
goals.
In addition, many states are pursuing other policy actions relating to reductions of GHGs. These
policies include, but are not limited to: greenhouse gas inventories; greenhouse gas registries;
climate action plans, greenhouse gas emissions targets, and emissions performance standards.
In the absence of a clear and comprehensive federal policy, many states have developed a broad
array of emissions and energy related policies. For example, Massachusetts has a RPS of 15% in
2020 (rising to 25% in 2030), belongs to RGGI, requiring specific emissions reductions from power
plants in the state, and has set in place aggressive energy efficiency targets through the 2008
Green Communities Act.
Hawaii, while not part of a regional climate initiative, has an even more aggressive RPS, seeking
to achieve 40% renewable energy by 2030, coupled with an Energy Efficiency Portfolio Standard
with the goal of reducing electricity use by 4,300 GWh by 2030. After 2013, 2% of electricity
revenues in Hawaii will go towards a Public Benefit Fund, an independent entity tasked with
promoting and incentivizing energy efficiency measures across the state.