2012 bc education facts - bc teachers'...
TRANSCRIPT

2012 BC Education Facts http://www.bctf.ca/uploadedFiles/Public/Publications/2012EdFacts.pdf
Compiled by
BCTF Information Services and
BCTF Research Department
August 2012

2 BCTF Research, BCTF Information Services 2012 BC Education Facts
Table of contents SCHOOLS ..........................................................................................................................3
Number of public schools ........................................................................................3 Number of independent (private) schools ................................................................3 School closures ........................................................................................................4 Rural schools and students .......................................................................................5 School-district amalgamation ..................................................................................6 School safety: Seismic upgrades ..............................................................................7
STUDENT ENROLMENT ...............................................................................................8 FTE enrolment (public and independent) ................................................................8 FTE Kindergarten enrolment on the increase—public schools ...............................8 Headcount enrolment (school-age and adult students) ............................................9 Enrolment projections ............................................................................................10 Aboriginal students ................................................................................................11 English Language Learning (ELL) ........................................................................11 International (non-resident) students .....................................................................12 Students with special needs ...................................................................................13 Class size and composition ....................................................................................15 Distributed Learning (DL) students .......................................................................16 Adult Education students .......................................................................................17
GRADUATION RATES .................................................................................................18 Six-year completion rate ........................................................................................18 20 to 24 years old ...................................................................................................19
STAFFING: TEACHERS AND ADMINISTRATORS ...............................................21 Student/educator ratios—BC and Canada .............................................................21 Teaching employment decreasing ..........................................................................22 Full-time and part-time teaching employment—Gender differences ....................23 Learning Specialist Teachers .................................................................................25 Teacher/administrator ratios ..................................................................................26
EDUCATION FUNDING ...............................................................................................27 Provincial funding ..................................................................................................27 BC falls behind the rest of Canada ........................................................................28 Independent (private) schools ................................................................................30 International (non-resident) student tuition ...........................................................31 School-generated funds ..........................................................................................33 Fundraising for school resources ...........................................................................35 Education funding and taxation policy ..................................................................36
ECONOMIC WELL-BEING .........................................................................................38 Family poverty .......................................................................................................38 Educational attainment and economic well-being .................................................41 Overall benefits of public-school education to individuals and society ................43
STUDENT ACHIEVEMENT .........................................................................................44 Benefits of school libraries to student achievement ..............................................44 How does Canada’s education system compare to those in other countries? ........46

Schools
2012 BC Education Facts BCTF Research, BCTF Information Services 3
SCHOOLS Number of public schools Number of BC public schools, 2005–06 to 2011–12
2005–06 1,663 2006–07 1,655 2007–08 1,634 2008–09 1,624 2009–10 1,631 2010–11 1,610 2011–12 1,604
BC public schools by type of school, 2007–08 to 2011–12
2007–08 2008–09 2009–10 2010–11 2011–12 Elementary 1,066 1,042 1,040 1,023 1,019 Elementary Junior Secondary 36 38 41 38 37 Elementary Secondary 112 114 105 102 102 Junior Secondary 17 25 22 20 14 Middle 79 75 73 79 80 Secondary 318 319 343 338 347 Senior secondary 6 9 7 9 5
BCTF Research tables, with figures from BC Ministry of Education (2008, 2009, 2010, 2011, 2012), Summary of Key Information, Victoria, BC: Government of British Columbia. The ministry publishes the Summary of Key Information on its Reporting on K to 12 web page; see http://www.bced.gov.bc.ca/reporting/, for online availability.
Number of independent (private) schools Number of BC independent schools, 2005–06 to 2011–12
2005–06 355 2006–07 356 2007–08 351 2008–09 347 2009–10 345 2010–11 343 2011–12 347
BCTF Research table, with figures from BC Ministry of Education (2012), 2011/12 Summary of Key Information, Victoria, BC: Government of British Columbia; “Number of Independent Schools, 2002–03 to 2011–12”, p. 33. See Reporting on K to 12, http://www.bced.gov.bc.ca/reporting/, for online availability of this report.

Schools
4 BCTF Research, BCTF Information Services 2012 BC Education Facts
School closures The cumulative loss in number of schools from September 30, 2001 to June 30, 2012, is 197; expressed as a percentage, the number of schools decreased over the last decade by 11.01%.
Change in number of schools, 2001–02 to 2011–12
2001–02 (Sept. 30)
2007–08 (Sept. 30)
2009–10 (Sept. 30)
2010–11 (Sept. 30)
2011–12 (June 30)
Cumulative change 2001 to 2012
Number of schools
1,779 1,634 1,633 1,611 1,604
Change -116 -32 -26 -7 -196 % change -6.52% -1.92% -1.59% -0.43% -11.01%
BCTF table, with figures from BC Ministry of Education (2012), 2011–12 Summary of Key Information, “Number of Public Schools, 2002–03 to 2011–12”, p. 32. (See the ministry web page, Reporting on K to 12, http://www.bced.gov.bc.ca/reporting/, for online availability.)
Total number of schools closed, 2001–02 to 2011–12
Number of schools closed as of June
Net change 2001 to 2012
2002 40 1,739 2003 42 1,697 2004 18 1,679 2005 9 1,670 2006 10 1,660 2007 16 1,644 2008 24 1,620 2009 5 1,615 2010 26 1,589 2011 4 1,585 2012 3 1,582
Total number of schools closed 197
Data gathered by BCTF and from school district websites, June, 2012; http://www.bctf.ca/data.cfm?page=SchoolClosures.
Schools
2012 BC Education Facts BCTF Research, BCTF Information Services 5
Rural schools and students Rural schools have been particularly hard-hit by school closures in recent years. Yet there is considerable evidence to suggest there are many educational benefits associated with attending rural schools.
Research provides evidence of the following benefits of rural schools for rural students:
• Smaller classes • More individual attention from teachers • Better behaviour • Civic participation is fostered • Safe and nurturing environment • Low teacher-pupil ratio • School as the “heart of the community” • Sense of community within school • Strong relationships between students, even across grade levels • Innovative and creative teaching strategies and solutions are engendered by the challenges of
rural education. Canadian Council on Learning. (2006). The rural-urban gap in education. http://www.ccl-
cca.ca/pdfs/LessonsInLearning/10-03_01_06E.pdf Clarke, H., Surgenor, E., Imrich, J., & Wells, N. (2003). Enhancing Rural Learning: Report of the Task Force on
Rural Education. Victoria, BC: British Columbia Ministry of Education. http://www.bced.gov.bc.ca/taskforce/rural_task_rep.pdf
Research also shows that smaller schools, many of which are in rural areas:
• improve student achievement • increase attendance and graduation rates • elevate teacher satisfaction • improve school safety • increase parent and community involvement. Ayers, W., Bracey, G., & Smith, G. (2000). The Ultimate Education Reform? Make Schools Smaller. Milwaukee,
WI: Center for Education Research, Analysis, and Innovation. http://epsl.asu.edu/epru/point_of_view_essays/cerai-00-35.htm
People for Education. (2003). Ontario’s Small Schools. Toronto: People for Education. http://eric.ed.gov/PDFS/ED476870.pdf
However, research indicates that rural students may face more barriers accessing higher levels of education. According to the Canadian Council on Learning:
...among OECD countries, Canada has the worst rural-urban gap with respect to levels of education in the workforce. Canada’s rural areas are ‘experiencing out-migration, higher unemployment and lower incomes.’ A well-educated workforce is a necessary pre-condition to a region’s economic growth. Therefore, it is crucial for rural communities, and Canada as a whole, to find ways to narrow the rural-urban gap in education. (2006)
Canadian Council on Learning. (2006). The rural-urban gap in education. http://www.ccl-cca.ca/pdfs/LessonsInLearning/10-03_01_06E.pdf

Schools
6 BCTF Research, BCTF Information Services 2012 BC Education Facts
School-district amalgamation • Number of school districts in 2011: 60. • Number of school districts in 1995: 75 (amalgamated in 1996). • Much of the literature in earlier decades suggests that no significant advantages to school
jurisdiction consolidation exist. (Erhardt, 1997) • More recent research suggests that smaller, decentralized school districts result in better
educational outcomes, especially for vulnerable students. • There is little evidence that school district consolidation/amalgamation improves the
academic achievement of students. (Patterson 2006) • On the other hand, however, the available research shows that smaller, decentralized school
districts tend to see higher rates of achievement than larger, centralized districts. (Murray and Groen, 2004; Louisiana Department of Education, 2003; Howley, 2000)
• Furthermore, data has shown that at-risk students are especially benefited academically by smaller school districts, and that ethnic achievement gaps are smaller in decentralized districts. (Murray and Groen, 2004; Louisiana Department of Education, 2003)
Erhardt, G. (1997). Doing more with less: A simulated amalgamation of school boards. Regina: Saskatchewan School Boards Association. http://www.saskschoolboards.ca/old/ResearchAndDevelopment/ResearchReports/Governance/97-04.htm
Howley, C.B. (2000). School district size and school performance. Rural Education Issue Digest. Louisiana Department of Education. (2003). Small school districts and economies of scale. Presented to the State
Board of Elementary and Secondary Education Strategic Planning Study Group Committee, May. Murray, V., & Groen, R. (2004). Competition or Consolidation? The School District Consolidation Debate
Revisited. Policy Report no. 189. Arizona: Goldwater Institute. Patterson, C. (2006). School District Consolidation and Public School Efficiency: What Does the Research Say?
Policy Perspective. Texas Public Policy Foundation.

Schools
2012 BC Education Facts BCTF Research, BCTF Information Services 7
School safety: Seismic upgrades • The province budgeted $254 million in 2005 for improvement to 80 high-priority schools
(over 3 years). “More than 700 schools to be upgraded over the next 15 years or sooner” at a cost of $1.5 billion.
BC Ministry of Education. (2005, March 7). Province launches $1.5 billion school seismic upgrades. [Press release]. http://www2.news.gov.bc.ca/nrm_news_releases/2005BCED0028-000245.htm
• As of May 2008, only 13 seismic projects are completed and another 18 are currently under construction (Kines, 2008). Work is proceeding no faster than it was before the 2005 announcement.
Kines, L. (2008, May 15). BC lags on quake safety for schools; Minister denies government broke promise to fast-track seismic upgrades. Victoria Times-Colonist
• As of January 19, 2011, 90 seismic projects are complete, 21 are under construction, and 10 are proceeding to construction.
BC Ministry of Education. (2011). Seismic Mitigation Program Progress Report—Current project status (as of January 19, 2011). Victoria, BC: Government of British Columbia. Accessed on February 3, 2011: http://www.bced.gov.bc.ca/capitalplanning/seismic/progress_report.html
• The BC Auditor General’s report, Planning for School Seismic Safety, came out in December 2008. In a news release from December 4, 2008, Auditor General John Doyle is quoted as saying, “The original budget of $1.5 billion will not be enough to remediate all the schools included in the ministry’s plan….” However, the ministry has not increased the funding for the Seismic Mitigation Program.
Office of the Auditor-General of British Columbia. (2008). Improvements needed in planning for school seismic safety. Victoria, BC: Government of British Columbia. (News release.) http://www.bcauditor.com/files/publications/2008/report12/news-release/planning-school-seismic-safety-news-release.pdf
Office of the Auditor-General of British Columbia. (2008). Planning for school seismic safety. Victoria, BC: Government of British Columbia. (Report.) http://www.bcauditor.com/files/publications/2008/report12/report/planning-school-seismic-safety.pdf
• In October, 2011, a consultant found that the cost of bare-bones seismic upgrades for 48 of Vancouver’s most vulnerable schools will cost $618 million, or about 40% of the total provincial budget for the seismic upgrade program.
Carman, T., & Duggan, E. (2011). “Seismic upgrades set at $618 million; Repairs to 48 most vulnerable Vancouver sites takes 40 per cent of BC budget,” The Vancouver Sun, October 6, 2011, p. A6.
• As of March 6, 2012, 115 seismic projects are complete, 16 projects are under construction, and 6 projects are proceeding to construction.
BC Ministry of Education (2012), Seismic Mitigation Program Progress Report (online), http://www.bced.gov.bc.ca/capitalplanning/seismic/progress_report.html
• A ministry announcement on May 11, 2012 indicated $122 million in funding for structural upgrades at 14 high-priority schools. Projects for another 138 high-priority schools remain to be addressed.
BC Ministry of Education (2012). $122M for next round of school seismic upgrades. (News release.) http://www2.news.gov.bc.ca/news_releases_2009-2013/2012EDUC0046-000651.htm

Student enrolment
8 BCTF Research, BCTF Information Services 2012 BC Education Facts
STUDENT ENROLMENT FTE* enrolment (public and independent) * Full-time equivalent (FTE) enrolment figures take into account students who attend school on a part-time basis or who take more than a full-time course load.
FTE enrolment increased in both public and independent schools over the last five years: • FTE enrolment in public schools increased by 5,088.1 FTE since 2007–08, for a total of
549,836.4 FTE students in 2011–12.
• FTE enrolment in independent schools increased by 4,476.8 FTE since 2007–08, for a total of 70,444.3 FTE students in 2011–12.
FTE enrolment: BC public and independent schools, 2007–08 to 2011–12 FTE student enrolment
Year Public Independent 2007–08 544,748.3 65,967.5 2008–09 549,587.8 66,790.6 2009–10 546,510.6 66,532.7 2010–11 549,124.7 68,130.6 2011–12 549,836.4 70,444.3 Change Since 2007–08 +5088.1 +4,476.8 Since 2010–11 +711.7 +2,313.7
BCTF Research table, with figures from BC Ministry of Education (2012), Student Statistics 2011/12: Province—Public and Independent schools combined, p. 17.
FTE Kindergarten enrolment on the increase—public schools • 16,979.5 more FTE Kindergarten students enrolled in public schools in 2011–12 (37,188
FTE) than in 2007–08 (20,208.5 FTE), mostly due to the implementation of full-day Kindergarten in BC schools.
• Between 2009–10 and 2010–11, in Phase One of the full-day Kindergarten program, FTE Kindergarten enrolment increased by 8,280.5 FTE students.
• In 2011–12, when full-day Kindergarten became available to all students across the province, FTE Kindergarten enrolment increased by a further 7,997 students.
BC Ministry of Education (2012), Student Statistics 2011/12: Province—Public and Independent schools combined, p. 18.

Student enrolment
2012 BC Education Facts BCTF Research, BCTF Information Services 9
Headcount enrolment (school-age and adult students) Public Between 2007–08 and 2011–12:
• The total number of public school students decreased by 13,892 students (-2.4%).
• The population of school-aged students in public schools decreased by 3.8%, while the adult student population increased by 51.3%.
Headcount enrolment, BC public schools, 2007–08 to 2011–12 Headcount—Public
Year school-age adult all students 2007–08 568,081 15,539 583,620 2008–09 561,464 18,022 579,486 2009–10 558,002 22,482 580,484 2010–11 553,850 25,265 579,115 2011–12 546,219 23,509 569,728 Change in headcount enrolment: 2007–08 to 2011–12 Number -21,862 +7,970 -13,892 Percent -3.8% +51.3% -2.4%
BCTF Research table, with figures from BC Ministry of Education (2012), Student Statistics 2011/12: Province—Public and Independent schools combined, p. 15. There are slight differences in some of these numbers from previously published reports, reflecting adjustments made by the ministry to improve data quality.
Independent Between 2007–08 and 2011–12, school-age student enrolment in independent schools increased by 4.3%, while adult student enrolment decreased by 15.3%.
Headcount enrolment, BC independent schools, 2007–08 to 2011–12 Headcount—Independent
Year school-age adult all students 2007–08 68,635 294 68,929 2008–09 68,921 217 69,138 2009–10 69,273 194 69,467 2010–11 70,075 199 70,274 2011–12 71,615 249 71,864 Change in headcount enrolment: 2007–08 to 2011–12 Number +2,980 -45 +2,935 Percent +4.3% -15.3% +4.3%
BCTF Research table, with figures from BC Ministry of Education (2012), Student Statistics 2011/12: Province—Public and Independent schools combined, p. 15. There are slight differences in some of these numbers from previously published reports, reflecting adjustments made by the ministry to improve data quality.

Student enrolment
10 BCTF Research, BCTF Information Services 2012 BC Education Facts
Enrolment projections Projected Kindergarten enrolment over the next 10 years • Kindergarten enrolment is projected to increase by 5,739 students over the next 10 years,
from 37,177 students in 2011 to 42,916 in 2021.
Ministry projections for Kindergarten enrolment (headcount)
Year 2006 2009 2011 2016 (est.)
2021 (est.)
Change: 2011–2021 (est.) Number Percent
Number of students
35,131 35,738 37,177 39,143 42,916 +5,739 15.4%
BCTF Research chart with data from BC Ministry of Education (2012), Projection report for public school headcount enrolments, 2011/12, p. 2. Available online at http://www.bced.gov.bc.ca/capitalplanning/resources/databasesreports/enrolment/1558a-2011.pdf.
Increased growth in 0- to 14-year-old population projected for the next 10 years A 2011 report by BC Stats forecasts population growth for children and youth up to the age of 15 over the next 10 years. The number of children in British Columbia aged
• 0 to 4 years is forecast to increase from 223,700 in 2010 to 257,100 by 2020. • 5 to 9 years is forecast to increase from 220,900 in 2010 to 253,100 by 2020. • 10 to 14 years is forecast to increase from 241,800 in 2010 to 254,100 by 2020. • 15 to 19 years is forecast to decrease from 284,000 in 2010 to 256,000 by 2020.
BC Stats population forecast (number of individuals) Age group 2010 2015 2020 0 to 4 years 223,700 238,300 257,100 5 to 9 years 220,900 236,300 253,100 10 to 14 years 241,800 236,800 254,100 15 to 19 years 284,000 258,000 256,000
BCTF Research table, with figures from BC Stats (May 2011), British Columbia-level population projections, 2010–2036: Table 6: British Columbia population by 5-year age group. Available online at http://www.bcstats.gov.bc.ca/statisticsbysubject/Demography/PopulationProjections.aspx.

Student enrolment
2012 BC Education Facts BCTF Research, BCTF Information Services 11
Aboriginal students
Over the last decade, self-identified Aboriginal student enrolment in public schools has
grown by 14,514 students, with enrolment increasing from 46,885 students in 2000–01 to
61,399 students in 2011–12.
BC Ministry of Education (2012), 2011/12 Summary of Key Information, “Aboriginal Students, 2002/03 to 2011/12
(Public and Independent)”, p. 10, and 2009/10 Summary of Key Information, “Aboriginal Students, 2000/01
to 2009/10 (Public and Independent)”, p. 10.
In 2011–12, Aboriginal students comprised 10.8% of all public school students in BC.
BC Ministry of Education (2012), Student Statistics 2011/12: Province—Public and independent schools combined,
Headcount, p. 1.
Over the past five years, Aboriginal students enrolled in Aboriginal programs increased by
825 students, from 54,463 students in 2007–08 to 55,288 students in 2011–12. (Figures are
for both public and independent schools combined; not reported separately by the ministry.)
BC Ministry of Education (2012), Student Statistics 2011/12: Province—Public and Independent schools combined,
p. 30.
English Language Learning (ELL)* * formerly English as a Second Language (ESL)
English Language Learning Program
Student enrolment in the ELL program (public only) increased by 2,737 students, from
59,343 students in 2001–02 to 62,080 students in 2011–12.
Over the past nine years, ELL student enrolment as a percent of total public school enrolment
increased from 9.4% in 2001–02 to 10.9% in 2011–12.
Primary language spoken at home
In 2011–12, one in four (23.8 %) of public school students spoke a primary language at home
other than English.
Almost double the number of ELL students (135,651) live in families where the primary
language spoken at home is other than English, an increase of 16,874 students since 2001–02
and 8,676 students since 2007–08.
Change in enrolment—English Language Learning and Primary language spoken a home
Student group School year Change
2001–02 2007–08 2010–11 2011–12 Since
2001–02 Since
2007–08
ELL students 59,343 60,266 61,344 62,080 +2,737 +1,814
Primary language spoken at home is other than English
118,777 126,975 135,614 135,651 +16,874 +8,676
BCTF Research table; 2001–02 figures from BC Ministry of Education (2011), 2010/11 Summary of Key
Information, pp. 14, 16; 2002–03 to 2011–12 figures from BC Ministry of Education (2012), 2011/12 Summary of
Key Information, pp. 14, 16. See Reporting on K to 12, http://www.bced.gov.bc.ca/reporting/, for Summary of Key
Information online.

Student enrolment
12 BCTF Research, BCTF Information Services 2012 BC Education Facts
International (non-resident) students • Overall, enrolment of non-resident students increased by 271 students since 2007–08 (when
it was 9,512 students) to 9,783 students in 2011–12. • Enrolment of non-resident students decreased in the years after the 2008 global recession to a
low of 9,014 students in 2009–10, then increasing to 9,300 students in 2010–11 and to 9,783 students in 2011–12.
Student enrolment (headcount) in non-resident programs (Public schools K–12) Year Headcount 2007–08 9,512 2008–09 9,498 2009–10 9,014 2010–11 9,300 2011–12 9,783 Change Since 2007–08 +271 Since 2010–11 +483
BCTF Research table, with data from BC Ministry of Education (2012), Student Statistics 2011/12: Province—Public and Independent schools combined, p. 1.
Student enrolment
2012 BC Education Facts BCTF Research, BCTF Information Services 13
Students with special needs
Enrolment figures reported by the Ministry of Education reflect the number of students identified
with a special needs designation, and do not include students awaiting assessment, students in
need of learning support who have no designation/planned assessment, or students who are not
designated because there are no longer programs to support them (i.e., Gifted program).
Key points
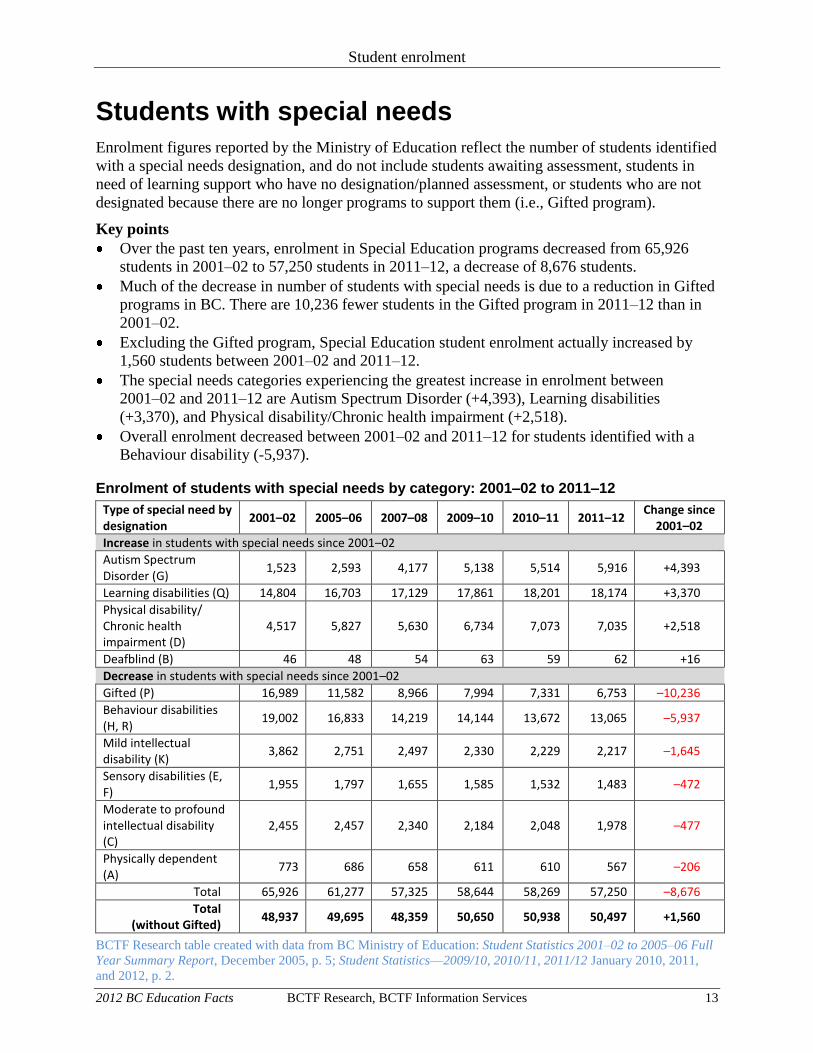
Over the past ten years, enrolment in Special Education programs decreased from 65,926
students in 2001–02 to 57,250 students in 2011–12, a decrease of 8,676 students.
Much of the decrease in number of students with special needs is due to a reduction in Gifted
programs in BC. There are 10,236 fewer students in the Gifted program in 2011–12 than in
2001–02.
Excluding the Gifted program, Special Education student enrolment actually increased by
1,560 students between 2001–02 and 2011–12.
The special needs categories experiencing the greatest increase in enrolment between
2001–02 and 2011–12 are Autism Spectrum Disorder (+4,393), Learning disabilities
(+3,370), and Physical disability/Chronic health impairment (+2,518).
Overall enrolment decreased between 2001–02 and 2011–12 for students identified with a
Behaviour disability (-5,937).
Enrolment of students with special needs by category: 2001–02 to 2011–12
Type of special need by designation
2001–02 2005–06 2007–08 2009–10 2010–11 2011–12 Change since
2001–02
Increase in students with special needs since 2001–02
Autism Spectrum Disorder (G)
1,523 2,593 4,177 5,138 5,514 5,916 +4,393
Learning disabilities (Q) 14,804 16,703 17,129 17,861 18,201 18,174 +3,370
Physical disability/ Chronic health impairment (D)
4,517 5,827 5,630 6,734 7,073 7,035 +2,518
Deafblind (B) 46 48 54 63 59 62 +16
Decrease in students with special needs since 2001–02
Gifted (P) 16,989 11,582 8,966 7,994 7,331 6,753 –10,236
Behaviour disabilities (H, R)
19,002 16,833 14,219 14,144 13,672 13,065 –5,937
Mild intellectual disability (K)
3,862 2,751 2,497 2,330 2,229 2,217 –1,645
Sensory disabilities (E, F)
1,955 1,797 1,655 1,585 1,532 1,483 –472
Moderate to profound intellectual disability (C)
2,455 2,457 2,340 2,184 2,048 1,978 –477
Physically dependent (A)
773 686 658 611 610 567 –206
Total 65,926 61,277 57,325 58,644 58,269 57,250 –8,676
Total (without Gifted)
48,937 49,695 48,359 50,650 50,938 50,497 +1,560
BCTF Research table created with data from BC Ministry of Education: Student Statistics 2001–02 to 2005–06 Full
Year Summary Report, December 2005, p. 5; Student Statistics—2009/10, 2010/11, 2011/12 January 2010, 2011,
and 2012, p. 2.

Student enrolment
14 BCTF Research, BCTF Information Services 2012 BC Education Facts
Students with special needs with and without supplemental funding—Provincial Operating Grants: 2001–02 to 2010–11 Key points • School districts receive a funding supplement for students designated in special needs
categories A–H in addition to the base per-student allocation. The amount of funding depends on whether the special needs category is Level 1 ($36,600—A, B), Level 2 ($18,300—C, D, E, F, G), or Level 3 ($9,200—H).
BC Ministry of Education (2011). 2011/12 Operating Grants Manual, p. 6. Available online at http://www.bced.gov.bc.ca/k12funding/funding/11-12/operating-grants-manual.pdf.
• The number of Level 1, Level 2, and Level 3 students with special needs increased by 6,187, from 17,842 students in 2001–02 to 24,029 students in 2011–12.
• The opposite was the case for students with special needs who do not receive a funding supplement outside of the base allocation. The number of students in these categories (K, P, Q, and R) decreased from 48,084 in 2001–02 to 33,221 in 2011–12.
Number of students with special needs with and without supplemental funding: 2001–02 to 2010–11
School year
Supplemental funding provided in addition to base allocation
(Categories A–H)
Funding supplied within base allocation after 2000–01
(Categories K, P, Q, and R) Total number
of students with special
needs # of students % of all public
school students
# of students % of all public
school students
2001–02 17,842 2.8% 48,084 7.6% 65,926 2002–03 18,358 3.0% 44,144 7.1% 62,502 2003–04 19,272 3.1% 41,972 6.8% 61,244 2004–05 20,141 3.3% 41,842 6.9% 61,983 2005–06 20,885 3.5% 40,392 6.7% 61,277 2006–07 21,181 3.6% 37,406 6.4% 58,587 2007–08 21,601 3.7% 35,724 6.1% 57,325 2008–09 22,628 3.9% 35,243 6.1% 57,871 2009–10 23,830 4.1% 34,814 6.0% 58,644 2010–11 24,238 4.2% 34,031 5.9% 58,269 2011–12 24,029 4.2% 33,221 5.8% 57,250 Total change 2001–02 to 2011–12 # of students 6,187 –14,863 –8,676 % of students +34.7% 1.4% –1.8% –13.2%
BCTF Research table created with data from BC Ministry of Education. Summary of Key Information: Special Education Students, 2001–02 to 2005–06—Public Only, (February 2006), and Summary of Key Information: Special Education Students, 2007–08 to 2011–12—Public Only, (April 2012), p. 12.
Type of special need by designation A Physically dependent B Deafblind C Moderate to profound intellectual disability D Physical disability/Chronic health impairment E Visual impairment F Deaf or hard of hearing
G Autism Spectrum Disorder H Intensive behaviour interventions/Severe mental illness K Mild intellectual disability P Gifted Q Learning disabilities R Moderate behaviour support/Mental illness

Student enrolment
2012 BC Education Facts BCTF Research, BCTF Information Services 15
Class size and composition Class size • There are 3,188 classes with more than 30 students in 2011–12.
Number of classes • The number of classes in BC public schools has decreased steadily from 68,693 classes in
2007–08 to 64,827 classes in 2011–12. • There are 3,866 fewer classes in BC standard public schools in 2011–12 than in 2007–08.
Class composition • There are 12,651 classes with 4 or more designated special needs students (entitled to an IEP)
in 2011–12, up from 12,240 classes in 2010–11. • In 2011–12, one in five classes in BC public schools has 4 or more designated special needs
students (entitled to an IEP). • There are 2,338 more classes with 4 or more designated special needs students (entitled to an
IEP) in 2011–12 than in 2007–08. • The number of classes with 4 or more designated special needs students (entitled to an IEP)
increased from 9,559 in 2006–07 to 12,651 classes in 2011–12. • 10,349 classes in BC public schools have 4 or more students in an ELL/ESD program. This is
an increase of 393 such classes since 2007–08.
Class composition, 2005–06 to 2011–12 Number of classes with more than 3 IEP students* Total classes
Year Grades K–3 Grades 4–12 All grades (K–12) Province 2005–06 240 10,702 10,942 67,499 2006–07 153 9,406 9,559 68,665 2007–08 141 10,172 10,313 68,693 2008–09 141 10,844 10,985 68,357 2009–10 127 11,832 11,959 67,473 2010–11 122 12,118 12,240 64,909 2011–12 122 12,529 12,651 64,827
BCTF Research table, with figures from BC Ministry of Education (various years). Overview of Class Size and Composition in BC Schools; accessible from the ministry data reporting page, http://www.bced.gov.bc.ca/reporting/. 2011–12 figures are available at http://www.bced.gov.bc.ca/reports/pdfs/class_size/2011/public.pdf. * The 2005–06 report uses the definition “All Special Education categories except Gifted”. All subsequent reports use the definition “Students entitled to an IEP”.

Student enrolment
16 BCTF Research, BCTF Information Services 2012 BC Education Facts
Distributed Learning (DL) students Total DL enrolment (public and independent schools combined) The actual total DL enrolment for any given year is considerably greater than the September enrolment, as students can enroll in DL courses throughout the year.
• 45,375 students enrolled in the DL program in 2011–12 (public and independent combined). • 25,286 students were taking most of their education program by DL in 2011–12
(headcount—public and independent combined). BC Ministry of Education (2012), Student Statistics 2011/12: Province—Public and Independent schools combined,
pp. 16, 30. Students taking most of their education by DL (as at September 30)
Public schools • The number of public school students taking most of their educational program by distributed
learning grew rapidly from 8,316 students in 2002–03 to 22,011 students in 2010–11, an increase of 13,695 students.
• In 2011–12, only 18,993 public school students took most of their educational program by distributed learning, 3,018 fewer students than in 2010–11.
Independent schools • Student enrolment in DL programs in independent schools has increased dramatically over
the past seven years, rising from 448 students in 2002–03 to 6,293 students in 2011–12.
Trends: Public vs. Independent • In 2011–12, 6,293 independent and 18,993 students were taking most of their education
program by DL. • The number of students taking most of their courses by DL between 2010–11 and 2011–12
decreased in public schools (-3,018 students) while increasing in independent schools (+766 students).
BC Ministry of Education. (2012), 2011/12 Summary of Key Information, p. 20. The Summary of Key Information is published on the ministry data reporting site, http://www.bced.gov.bc.ca/reporting/.
Districts with the highest number of DL students • The school districts with the greatest number of students taking most of their education by
Distributed Learning are Saanich (3,046), Comox Valley (2,067), Coquitlam (1,950), Kamloops/Thompson (1,008), Nechako Lakes (960), Chilliwack (934), and Surrey (930).
BC Ministry of Education. (2012), 2011/12 Summary of Key Information, p. 21. The Summary of Key Information is published on the ministry data reporting site, http://www.bced.gov.bc.ca/reporting/.

Student enrolment
2012 BC Education Facts BCTF Research, BCTF Information Services 17
Adult Education students Headcount • The ministry student statistics show 23,509 adult students (headcount) enrolled in public
education in 2011–12, the second-highest number in a decade. • The headcount enrolment in adult education fluctuated over the decade, with enrolment
peaking in 2010–11 at 25,266, and then decreasing by 1,757 students in 2011–12.
Full-time equivalent (FTE) • FTE student enrolment is much lower than headcount enrolment, because most adult students
are part-time. Funded FTE enrolment in adult education (public schools only) decreased steadily between 2001–02 (11,279.4277 FTE) and 2011–12 (6,779.2859 est.).
More adult students taking fewer courses • The ratio of adult students to funded FTE almost doubled over ten years. The number of
adult students per funded FTE increased from 1.86 in 2001–02 to 3.47 in 2011–12. • The ratio of funded FTE to adult student decreased from 0.54 FTE in 2001–02 to 0.29 FTE in
2011–12.
Adult Education enrolment (public), 2001–02 to 2011–12
Enrolment of Adult Education students
School Year Headcount Funded FTE Ratio of headcount
to funded FTE Ratio of funded FTE
to adult student 2001–02 21,019 11,279.43 1.86 0.54 2002–03 20,954 11,075.49 1.89 0.53 2003–04 21,460 11,042.32 1.94 0.51 2004–05 18,378 10,366.26 1.77 0.56 2005–06 17,394 9,721.22 1.79 0.56 2006–07 15,657 9,091.38 1.72 0.58 2007–08 15,539 9,072.10 1.71 0.58 2008–09 18,021 8,064.46 2.23 0.45 2009–10 22,483 8,384.00 2.68 0.37 2010–11 25,266 7,201.56 3.51 0.29 2011–12 23,509 6,779.29 3.47 0.29
* Funded FTE enrolment as of September 30, 2011, plus adult enrolment in Continuing Education and Distributed Learning for February 2012; May 2012 enrolment component is estimated. BCTF Research table and calculations, with figures from: Headcount data: 2001–02 to 2010–11 figures: BC Ministry of Education (2011), 2010/11 Summary of Key Information, p. 26; 2011–12 figures: BC Ministry of Education (2012), Student Statistics 2011/12: Province—Public and Independent schools combined, p. 15. Funded FTE: 2001–02 to 2010–11 figures: various BC Ministry of Education tables, sourced from http://www.bced.gov.bc.ca/k12funding/; BC Ministry of Education (2012). Interim Operating Grants following the February enrolment count. 2011/12 School Year: School District 99 Provincial Totals. (April). http://www.bced.gov.bc.ca/k12funding/funding/11-12/sd99.pdf.

Graduation rates
18 BCTF Research, BCTF Information Services 2012 BC Education Facts
GRADUATION RATES Six-year completion rate The Ministry of Education reports the six-year completion rate, which is the proportion of students who complete a Certificate of Graduation within six years from the time they enroll in Grade 8.
• The 2010–11 six-year completion rate for BC (Public and Independent schools) is 81%, up from 80% in 2009–10. Most of these students likely graduate by the age of 19.
BC Ministry of Education (2012). 2011/12 Summary of Key Information, p. 57. The Summary of Key Information is published on the ministry data reporting site, http://www.bced.gov.bc.ca/reporting/.
5-year comparison (public and independent schools) Year Overall Aboriginal
2006–07 80% 47% 2007–08 79% 47% 2008–09 79% 49% 2009–10 80% 50% 2010–11 81% 54%
2008–09 to 2010–11 six-year completion rates by gender (public and independent schools)
Students Overall Aboriginal
2008–09 2009–10 2010–11 2008–09 2009–10 2010–11 Male 76% 77% 79% 45% 45% 51% Female 82% 83% 83% 52% 56% 56% Both 79% 80% 81% 49% 50% 54%
2010–11 six-year completion rates by student groups/programs (public and independent schools*)
% of students All students 81% Aboriginal 54% Special education (excluding Gifted) 53% Gifted 100% French Immersion 93% English as a Second Language 83%
BCTF Research tables, with figures from BC Ministry of Education (2012), 2011/12 Summary of Key Information, pp. 56–65. The Summary of Key Information is published on the ministry data reporting site, http://www.bced.gov.bc.ca/reporting/.
* Special Needs student percentages are public schools only.

Graduation rates
2012 BC Education Facts BCTF Research, BCTF Information Services 19
20 to 24 years old To measure the graduation rate, taking into account youth who take longer than six years to graduate, Statistics Canada (2010) calculates the percentage of the population that is a high-school graduate by age group. This data shows that many students successfully complete high school between the ages of 20 to 24 years, with significant gains to the BC graduation rate.
• 7.8% of youth in BC aged 16–17 years completed high school in 2009–10. • 80.5% of youth in BC aged 18–19 years completed high school in 2009–10. • 92.7% of youth in BC aged 20–24 years completed high school in 2009–10.
BC as compared to Canada • BC has the highest graduation rate for young adults aged 20 to 24 years (92.7%) compared to
the rest of Canada (89.5%) in 2009–10. McMullen, K., & Gilmore, J. (2010). A note on high school graduation and school attendance, by age and province,
2009/2010. Statistics Canada. http://www.statcan.gc.ca/pub/81-004-x/2010004/article/11360-eng.htm
Youth (20 to 24 years) populations who are less likely to graduate Statistics Canada (2010) also calculates a drop-out rate defined as “the share of 20 to 24 year olds who are not attending school and who have not graduated from high school.” Using this measure, Statistics Canada (2010) data shows that:
• In 2009–10, 6.3% of the BC youth aged 20 to 24 years old are non-graduates, not attending school, the lowest percentage in Canada (8.5%). (McMullen and Gilmore, 2010)
Canadians aged 20 to 24 years who are male, live in rural areas, and/or are Aboriginal, are most at risk of not completing of high school. Overall, youth in immigrant families have lower-than-average drop-out rates, although this varies greatly by country of origin.
Gender (Canada) • In 2009–10, 8.5% of Canadians aged 20 to 24 years are non-graduates, not attending school.
This rate is higher than average for young men (10.3%) and lower than average for young women (6.6%).
Gilmore, J. (2010, November). Trends in drop-out rates and the labour market outcomes for young drop-outs. Statistics Canada Catalogue no. 81-004-X.
Rural/Urban (Canada) • On average, 15.5% of Canadians aged 20–24 years living in rural areas are non-graduates,
not attending school, compared to 7.9% of those living in large cities (2007–10). (Gilmore, 2010)
Aboriginal (Canada) • 25.8% of First Nations youth living off-reserve and 18.9% of Métis youth, 20–24 years of
age, are non-graduates, not attending school, compared to 8.5% of non-Aboriginal people (2007–10). (Gilmore, 2010)

Graduation rates
20 BCTF Research, BCTF Information Services 2012 BC Education Facts
Students immigrated to Canada • In 2009–10, 6.2% of 20- to 24-year-olds in immigrant families are non-graduates, not
attending school, which is lower than for those born in Canada (9.1%). Gilmore, J. (2010, November). Trends in drop-out rates and the labour market outcomes for young drop-outs.
Statistics Canada Catalogue no. 81-004-X.
• The percentage of Canadians aged 20 to 24 years who leave high school before graduating varies greatly by country of origin. Richard’s (2011) report on high school drop-out rates in 2006–07 states, “For example, those from East and South Asia have rates considerably below the national average, while Haitians, Portuguese, and Jamaicans have rates above the average.”
Richards, J. (2011). School Dropouts: Who are they and what can be done? C.D. Howe Institute, January 6, 2011, p. 4.

Staffing: Teachers and administrators
2012 BC Education Facts BCTF Research, BCTF Information Services 21
STAFFING: TEACHERS AND ADMINISTRATORS Student/educator* ratios—BC and Canada * Statistics Canada defines educators as “all employees in the public school system (either school-based or district-based), who belong to one of the three following categories: teachers, school administrators, and pedagogical support.” • BC had the highest student/educator ratio (16.6 students per educator) in Canada in 2009–10. • BC’s student/educator ratio (16.6 students per educator) is considerably higher than the
national average (14.0 students per educator). • The student/educator ratio in BC worsened significantly in 2002–03, widening the gap
between BC (17.6 students per educator) and Canada (15.9 students per educator). • The gap between the student/educator ratio in BC and the student-educator ratio in Canada
widened between the years 2007–08 (+2.1) and 2009–10 (+2.6).
Student/educator ratio: 2001–02 to 2009–10
2001–02 2002–03 2003–04 2004–05 2005–06 2006–07 2007–08 2008–09 2009–10
BC 16.8 17.6 17.7 17.5 17.0 16.6 16.5 16.4 16.6 Canada 15.9 15.9 15.8 15.5 15.2 14.7 14.4 14.1 14.0 Difference 0.9 1.7 1.9 2.0 1.8 1.9 2.1 2.3 2.6
BCTF Research table: For 2001–02 to 2007–08 figures, see Statistics Canada (2010), Summary Public School Indicators for Canada, the Provinces and Territories, 2001/2002 to 2007/2008—Table A.14 (p. 34). For 2005–06 to 2009–10 figures, see Statistics Canada. Summary Public School Indicators for Canada, the Provinces and Territories, 2005/2006 to 2009/2010, A.14 (p. 27), available at: http://www.statcan.gc.ca/pub/81-595-m/81-595-m2011095-eng.pdf.
Other provinces increased FTE educators during enrolment decline Between 2005–06 and 2009–10:
• FTE student enrolment decreased in all provinces and territories except Alberta. The percentage decrease in FTE student enrolment was less in BC than in six other provinces.
• Yet the number of FTE educators in BC decreased by 2% while most other provinces hired more educators. Overall the number of FTE educators in Canada increased by about 5%.
Statistics Canada. Summary Public School Indicators for Canada, the Provinces and Territories, 2005/2006 to 2009/2010, Charts A.2.2 (p. 10), A.13.2 (p. 25), and A.14 (p. 27), available at: http://www.statcan.gc.ca/pub/81-595-m/81-595-m2011095-eng.pdf

Staffing: Teachers and administrators
22 BCTF Research, BCTF Information Services 2012 BC Education Facts
Fewer FTE teachers, more FTE students in BC over the last five years BC Ministry of Education enrolment statistics show contradictory trends. While headcount enrolment decreased over the last five years, total FTE student enrolment increased significantly.
According to the Ministry of Education’s most recent student and teacher statistics reports:
• There are 30,407.4 FTE teachers in 2011–12, down from 31,049.4 in 2007–08. • There are 549,836.4 FTE students in 2011–12, up from 544,748.3 in 2007–08.
Between 2007–08 and 2011–12:
• FTE teaching positions decreased by 642 FTE (-2%). • FTE public school students increased by 5,088.1 FTE (+1%). BC Ministry of Education (2012). 2011/12 Student Statistics, p. 17, and 2011/12 Teacher Statistics, p. 3: available
on the ministry data reporting page, at http://www.bced.gov.bc.ca/reporting/.
Teaching employment decreasing Loss of FTE teaching positions over the decade • In 2001–02, before Bills 27 & 28, there were 33,275.4 FTE teachers, including 1,292.4 FTE
positions in teacher collective agreements to meet class size and composition provisions. • In 2011–12, ten years after Bills 27 & 28, there are 30,407.4 FTE teachers. • There is a total loss of 2,868 FTE teaching positions between 2001–02 and 2011–12,
including a loss of 1,488.9 FTE specialist teachers.
Decrease in FTE teachers over the last five years According to the Ministry of Education’s most recent teacher statistics report:
• There are 30,407.4 FTE teachers in 2011–12, down from 31,049.4 in 2007–08. • Between 2007–08 and 2011–12, FTE teaching positions decreased by 642 FTE (-2%). • The number of FTE teaching positions in BC public schools decreased steadily between
2007–08 (31,049.4 FTE) and 2010–11 (30,110.1 FTE). • FTE teaching positions increased by 297.3 FTE between 2010–11 and 2011–12, likely a
result of the expansion of full-day Kindergarten.
FTE teachers—Public schools: 2007–08 to 2011–12
FTE teachers
Year # of teachers # change % change
2007–08 31,049.4 n/a n/a
2008–09 30,867.3 -182.1 -0.6%
2009–10 30,393.0 -474.3 -1.5%
2010–11 30,110.1 -282.9 -0.9%
2011–12 30,407.4 297.3 1.0% Total change since 2007–08
-642.0 -2.0%
BCTF Research table, with figures from BC Ministry of Education (2012). Teacher Statistics—2011/12, Province—Public schools, p. 3. http://www.bced.gov.bc.ca/reporting/

Staffing: Teachers and administrators
2012 BC Education Facts BCTF Research, BCTF Information Services 23
Full-time and part-time teaching employment—Gender differences BC teachers—Gender In 2011–12, female teachers comprise 72% of all BC teachers in public schools.
Number and percent of teachers by gender (headcount): 2011–12 Number Percent of total Male teachers 9,252 28% Female teachers 24,238 72% Both 33,490 100%
BCTF Research table, with figures from BC Ministry of Education (2012). Teacher Statistics–2011/12, Province—Public Schools, p. 3.
Change in teaching employment by gender Between 2007–08 and 2011–12:
• Male teachers experienced a significant decline in employment (-685 teachers) while the number of female teachers decreased slightly (-177 teachers).
• The percentage of teachers who are female increased from 71% to 72% (rounded).
Change in teaching employment by gender: 2007–08 to 2011–12
Year Male Female Both Percentage of
teachers—female 2007–08 9,937 24,415 34,352 71.1% 2008–09 9,779 24,408 34,187 71.4% 2009–10 9,588 24,104 33,692 71.5% 2010–11 9,363 23,995 33,358 71.9% 2011–12 9,252 24,238 33,490 72.4% Change: 2007–08 to 2011–12
-685 -177 -862
BCTF Research table, with figures from BC Ministry of Education (2012), Teacher Statistics–2011/12, Province—Public Schools, February 2012, p. 3.

Staffing: Teachers and administrators
24 BCTF Research, BCTF Information Services 2012 BC Education Facts
Change in full-time and part-time employment by gender Teacher statistics show a gender shift in teaching employment between 2007–08 and 2011–12, with a considerable decrease in full-time male teachers.
Compared to 2007–08 there are:
• 639 fewer male teachers working full-time and 46 fewer male teachers working part-time • 233 more female teachers working full-time and 410 fewer female teachers working part-
time. Male teachers experienced a 7.2% decrease in full-time employment and a 4.2% decrease in part-time employment between 2007–08 and 2011–12.
Teacher headcount by gender: full-time and part-time employment
Male Female
Year full-time part-time total full-time part-time total 2007–08 8,846 1,091 9,937 16,779 7,636 24,415 2008–09 8,671 1,108 9,779 16,829 7,579 24,408 2009–10 8,478 1,110 9,588 16,505 7,599 24,104 2010–11 8,249 1,114 9,363 16,477 7,518 23,995 2011–12 8,207 1,045 9,252 17,012 7,226 24,238 Change: 2007–08 to 2011–12 Number -639 -46 -685 +233 -410 -177 Percentage -7.2% -4.2% -6.9% +1.4% -5.4% -0.7%
BCTF Research table, with figures from BC Ministry of Education (2012), Teacher Statistics–2011/12, Province—Public Schools, p. 3.

Staffing: Teachers and administrators
2012 BC Education Facts BCTF Research, BCTF Information Services 25
Learning Specialist Teachers
The number of FTE learning specialist teacher positions fell significantly over the last
decade, decreasing from 7,185.4 FTE positions in 2001–02 to 5,657.9 in 2011–12.
Learning specialist teaching positions decreased by 416.5 FTE positions from 2007–08 to
2011–12, based on the most recent ministry figures.
There are now 1,527.5 fewer FTE learning specialist teacher positions in 2011–12 than in
2001–02.
Library Services (-31.0%) and English Language Learning programs (formerly ESL)
(-33.7%) lost the highest proportions of learning specialist teachers over the decade.
The Special Education program experienced the greatest reduction in FTE learning specialist
teachers, with an overall loss of 769.2 FTE teaching positions between the years 2001–02
and 2011–12.
Change in FTE positions by type of specialist teacher: 2001–02 to 2011–12
Change since 2007–08
Change since 2001–02
FTE specialist teachers
2001–02 2007–08 2011–12 FTE Percent FTE Percent
Library Services 921.8 730.0 635.8 -94.2 -14.8% -286.0 -31.0%
Counselling 989.6 915.8 870.1 -45.7 -5.3% -119.5 -12.1%
Special Education 4,051.5 3,446.5 3,282.3 -164.2 -5.0% -769.2 -19.0%
English Language Learning
1,015.6 788.7 673.7 -115.0 -17.1% -341.9 -33.7%
Aboriginal Education
206.9 193.4 196.0 2.6 1.3% -10.9 -5.3%
Totals 7,185.4 6,074.4 5,657.9 -416.5 -7.4% -1,527.5 -21.3%
BCTF Research table, with figures from BC Ministry of Education (2002, 2008, 2012), Staff by Year and Program
Code (unpublished Form 1530 data).

Staffing: Teachers and administrators
26 BCTF Research, BCTF Information Services 2012 BC Education Facts
Teacher/administrator ratios In 2010, the ministry changed how teachers and administrators are defined. Based on a BCTF comparison of the ministry definitions described in the February and Fall versions of the 2009/10 Teacher Statistics report (both dated February 2010), administrators now include only Principals, Vice-principals and Directors of Instruction.
Other district administrative staffing categories (Supervisors of Instruction, Teacher Consultants, Co-ordinators, Helping Teachers, Other Instructional Support, Testing & Assessment—Professional Staff, Department Heads, and Teachers who have administration duty but are not Department Heads) are now counted as teachers, along with regular classroom teachers and learning specialist teachers.
The tables below show the employment figures and teacher/administrator ratios for 2005–06 to 2011–12, using the February 2010 (“old” definition) and Fall 2010 (“new” definition) versions of the 2009/10 Teacher Statistics report. Also included are the 2010–11 figures as published in the 2010/11 Teacher Statistics (February 2010) report.
Province—Teachers and administrators (FTE): 2005–06 to 2011–12
Teachers (FTE) Administrators (FTE)
Year “old”
definition (Feb. 2010)
“new” definition (Fall 2010)
difference “old”
definition (Feb. 2010)
“new” definition (Fall 2010)
difference
2005–06 30,583.0 31,006.9 +423.9 3,117.8 2,693.9 -423.9 2006–07 30,759.4 31,221.9 +462.5 3,206.2 2,743.7 -462.5 2007–08 30,573.5 31,049.4 +475.9 3,227.4 2,751.6 -475.8 2008–09 30,408.1 30,867.3 +459.2 3,177.3 2,718.1 -459.2 2009–10 29,937.5 30,393.0 +455.5 3,116.2 2,660.7 -455.5 2010–11
30,110.1
2,584.3
2011–12 30,407.4 2,600.8
BCTF Research table with figures from: BC Ministry of Education, Teacher Statistics–2009/10, Province—Public Schools. (2010—two versions, February and Fall); 2010–11 and 2011–12 figures from BC Ministry of Education (February 2012), Teacher Statistics–2011/12, Province—Public Schools, p. 3.
Province—Teacher/Administrator ratios (FTE): 2005–06 to 2011–12 Teacher/Administrator Ratio
Year “old” definition
Feb. 2010 “new” definition
Fall 2010 difference % difference
2005–06 9.81 11.51 1.70 17.33% 2006–07 9.59 11.38 1.79 18.67% 2007–08 9.47 11.28 1.81 19.11% 2008–09 9.57 11.36 1.79 18.70% 2009–10 9.61 11.42 1.81 18.83% 2010–11 11.65 2011–12 11.69
BCTF Research table with figures from BC Ministry of Education, Teacher Statistics–2009/10, Province—Public Schools. (February 2010—two versions, February and Fall); 2010–11 and 2011–12 figures from BC Ministry of Education (February 2012), Teacher Statistics–2011/12, Province—Public Schools, p. 3.

Education funding
2012 BC Education Facts BCTF Research, BCTF Information Services 27
EDUCATION FUNDING Provincial funding BC government freeze on K to 12 funding • BC government’s Budget 2012 implemented a freeze on district operating grants for the next
three years. • This means there is no additional funding for districts to cover the rising costs of delivering
public education such as BC hydro rate increases, rising fuel costs, and government-imposed increases to Medical Services Plan premiums.
• Based on a BC inflation rate of 2.37%, 2012–13 Operating Grants would need to increase by $112 million just to keep pace with inflation.
• Over three years, the cumulative impact of a freeze in district operating grants funding could result in a loss of up to $300 million in purchasing power, depending on the inflation rate.
White, M. (2012). 2012–13 Operating Grants—Too little to offset district budget shortfalls. Vancouver, BC: BC Teachers’ Federation. Available online at http://www.bctf.ca/uploadedFiles/Publications/Research_reports/2012-EF-01.pdf
K–12 education has received a diminishing share of the provincial budget • K–12 education has received a diminishing share of the provincial budget over the last
decade. Ministry of Education expenses as a percentage of the provincial budget (as measured by Consolidated Revenue Fund total expenditures) decreased from 19.67% in 2001–02 to 15.14% in 2011–12 (est.)
• The falling funding ratio has resulted in a significant loss of funding to public education. If 2011–12 funding for K–12 education were restored to the 2001–02 percentage of the provincial budget, as measured by Consolidated Revenue Fund total expenditures, an additional $1.6 billion would be available for public education.
Data sources: Saanich School District. Public Education Funding: Learning from the Past, Presentation to VISTA, February 27, 2010 (available at www.sd63.bc.ca, from Departments—Finance/Secretary-Treasurer). Figures are based on budget estimates for Ministry of Education expenses as a percentage of Consolidated Revenue Fund total expenditure in the table Estimated Expense by Organization, British Columbia Estimate, fiscal year ending March 31 for each of the fiscal years. 2011–12 calculations by BCTF Research are based on estimates published in Ministry of Finance (May 2011). Estimates: Fiscal year ending March 31, 2012, p. 7. Available online at http://www.bcbudget.gov.bc.ca/2011/estimates/2011_Estimates.pdf.

Education funding
28 BCTF Research, BCTF Information Services 2012 BC Education Facts
BC falls behind the rest of Canada BC K to 12 funding lags behind other provinces • While funding for elementary and secondary public schools increased across Canada
(including BC) between 2005–06 and 2009–10, British Columbia ranked at or near the bottom in terms of the percentage increase in education expenditures, in all key areas.
• Compared to other provinces, BC had the lowest percentage increase in education funding for six key indicators used by Statistics Canada to measure public school expenditures.
BC’s rank among provinces—Percentage change in education funding for elementary and secondary schools: Statistics Canada indicators, 2005–06 to 2009–10
Type of funding BC’s rank among provinces (1st=highest & 10th=lowest)
Operating expenditures (in current dollars) 10th Total expenditures (in current dollars) 10th Total expenditures per student (in current dollars) 10th Total expenditures per student (in 2002 constant dollars) 10th Total expenditures per capita (in current dollars) 10th Total expenditures per capita (in 2002 constant dollars) 10th Total expenditures as a percentage of GDP 9th Total expenditures per student as a percentage of GDP per capita 8th
BCTF Research table with information from Statistics Canada (2011). Summary Public School Indicators for Canada, the Provinces and Territories, 2005/2006 to 2009/2010, Charts A.17.2, A.19.2, A.20.1.2, A.20.2.2, A.26.1.2, A.26.2.2, A31.2, A.32.2.
BC falls behind in K–12 education spending as percentage of GDP The most recent Statistics Canada data shows:
• BC spent a higher percent of gross domestic product on public education than Canada as a whole in 2002–03. Since then, BC has fallen behind the rest of Canada.
• Total expenditures in public elementary and secondary schools as a percentage of the GDP decreased from 3.6% in 2002–03 to 3.3% in 2009–10 in BC.
• K–12 expenditures as a percent of GDP for Canada reached 3.6% in 2009–10, once again widening the gap between BC (3.3%) and Canada (3.6%), and leaving BC public schools relatively worse off than the rest of the country.

Education funding
2012 BC Education Facts BCTF Research, BCTF Information Services 29
Total expenditures in public elementary and secondary schools as a percentage of GDP, Canada and British Columbia, 2002–03 to 2009–10
Year Canada BC Difference between
BC and Canada 2002–03 3.5 3.6 +0.1 2003–04 3.4 3.3 -0.1 2004–05 3.4 3.2 -0.2 2005–06 3.4 3.2 -0.2 2006–07 3.3 3.2 -0.1 2007–08* 3.3 3.1 -0.2 2008–09 3.5 3.3 -0.2 2009–10 3.6 3.3 -0.3
BCTF Research chart with data from Statistics Canada. For 2002–03 to 2006–07 figures, see the 2010 report, Summary Public School Indicators for Canada, the Provinces and Territories, 2002/2003 to 2008/2009— Statistics Canada—Catalogue no. 81-595-M—No. 088, p. 37. For 2007–08 to 2009–10 figures, see the 2011 report, Summary Public School Indicators for Canada, the Provinces and Territories, 2005/2006 to 2009/2010. Statistics Canada—Catalogue no 81-595-M—No. 095, p. 46.
* Statistics Canada adjusted the 2007–08 figure for BC from 3.2% in the 2010 report to 3.1% in the 2011 report.
US study shows education cutbacks are hard on teachers, students, and families The MetLife Survey of the American Teacher: Teachers, Parents, and the Economy (2011) examined the impact of the economic downturn from the perspectives of teachers, students, and parents.
• 76% of teachers reported a decrease in school budgets in the past year, with teachers reporting negative impacts including layoffs of teachers and other staff, elimination of education programs, increased class size, and out-dated technology and learning resources.
• About two-thirds (64%) of teachers reported an increase in students and families in need of health and social services, with 28% reporting that health and social services were reduced or eliminated in the school.
• Teacher job satisfaction dropped significantly since 2009, to the lowest level in 20 years. Teachers with lower job satisfaction are more likely to work in schools experiencing staff layoffs, loss of education programs, or reduced health and social services. They were also less likely to feel their jobs were secure or that they were “treated as a professional by the community”.
• The percentage of teachers saying they are very or fairly likely to leave the profession increased from 17% to 29% since 2009.
BCTF Research (2012). Why are teachers so upset? One lesson to learn from the USA. Available online at http://www.bctf.ca/BargainingAndContracts.aspx?id=26357.
Markow, D., & Pieters, A. (2012). 2011 MetLife survey of the American teacher: Teachers, parents, and the economy. New York, NY: MetLife Inc. The report is available online at http://www.metlife.com/assets/cao/contributions/foundation/american-teacher/MetLife-Teacher-Survey-2011.pdf. Previous reports can be accessed from www.metlife.com/teachersurvey.
White, M. (2012). 2012–13 Operating Grants—Too little to offset district budget shortfalls. Vancouver, BC: BC Teachers’ Federation. See pp. 2–3. Available online at http://www.bctf.ca/uploadedFiles/Publications/Research_reports/2012-EF-01.pdf.

Education funding
30 BCTF Research, BCTF Information Services 2012 BC Education Facts
Independent (private) schools
Funding allocations There are 72,014 students enrolled in 347 BC independent schools in 2010–11, representing 11% of all K–12 students. Of these students:
• 78% are in Group 1 independent schools, which are funded at 50% of the local school district’s per-student operating grant;
• 20% are in Group 2 independent schools, which are funded at 35% of the local district’s per-student operating grant;
• 2% are in schools that are not funded by the province.
In 2010–11, provincial funding for independent schools totaled $249 million. Of this funding:
• $204 million went to the per-student operating grants to 318 Group 1 and 2 schools; • $ 22 million went to operating grants for 12 Distributed Learning (DL) schools; • $ 32 million went to special education grants to Group 1, 2, and DL schools; and • $ 0.3 million went to home schooling registration grants to Group 1, 2, & DL schools. BC Ministry of Education, Office of the Inspector of Independent Schools, “Overview of Independent Schools in
British Columbia,” revised June 2011. The ministry’s Independent Schools homepage is at http://www.bced.gov.bc.ca/independentschools/.
Independent and public schools’ funding • Funding for independent schools is increasing at a much faster rate than public schools’
funding. Between 2005–06 and 2010–11, public school funding increased by 13% while funding for independent schools increased by 34%.
BC Ministry of Education. (2010), Historic Budget Trends. Briefing material for 2010/11 estimates for Education Partners Groups.
BC opinion poll finds lack of public support for government funding of private schools Results of a British Columbia Society for Public Education (BCSPE) 2010 opinion survey found that 65% of respondents disagreed with the notion “that the provincial government should continue to use public funds to support private schools.” BC Society for Public Education. (2010). Media release backgrounder. (April 21, 2010.)
http://www.bcspe.ca/docs/2010/04/Survey-Information-Backgrounder-FINAL3.pdf

Education funding
2012 BC Education Facts BCTF Research, BCTF Information Services 31
International (non-resident) student tuition • The revenue from international students has more than doubled in a decade, from $55.5
million in 2001–02 to $129.4 million in 2010–11. This revenue is the most significant source of funding to BC K to 12 public schools outside of direct grants from the provincial government.
International student enrolment and tuition fee revenues, 2001–02 to 2010–11 2001–02 2010–11 Difference
Student enrolment 6,578 8,812 +2,234 Tuition fee revenues $55,505,404 $129,436,405 +$73,931,001
BCTF Research table, with data from BC Ministry of Education, Student Enrolment Reports 2000/01–2004/05 (includes students, educators and school facility information); BC Ministry of Education (2011). Student Statistics–2010/11 Province—Public and Independent Schools Combined; see the ministry’s data reporting page, http://www.bced.gov.bc.ca/reporting/. Figures for fee revenue are from Schedule A2 on District Audited Financial Statements, published annually on school district websites.
International student tuition revenues vary greatly by school district • Varying levels of income from international-student tuition fees result in significant
inequities among school districts. Some boards in the Metro Vancouver and South Island areas receive a significant boost to their budgets from international students’ fees, while many small and rural areas receive none.
• The five districts receiving the most revenue in 2010–11 from international-student tuition were Coquitlam ($15.37 million), Vancouver ($13.5 million), Burnaby ($9.5 million), Maple Ridge-Pitt Meadows ($8.86 million), and Greater Victoria ($8.7 million).
• The five districts receiving the lowest amount of revenue from international-student tuition in 2010–11 were Revelstoke ($9,500), Arrow Lakes ($9,000), Nicola-Similkameen ($6,000), Coast Mountains ($6,000), and Alberni ($1,250).
• Small and rural districts receiving no international-student tuition fee revenue at all include Central Coast, Haida Gwai'i/Queen Charlotte, Boundary, Okanagan Similkameen, Bulkley Valley, Gold Trail, Vancouver Island West, Vancouver Island North, Stikine, Nisga’a, and the Francophone Education Authority.
Kuehn, L. (2012). BC international student revenue grows again. Vancouver, BC: BC Teachers’ Federation. See the table in Appendix 3, “BC offshore tuition-fee revenue, 2010–11,” for the district revenue figures. Available online at http://bctf.ca/uploadedFiles/Public/Publications/ResearchReports/2012-EF-02_BC_international_student_revenue_grows_again[1].pdf.

Education funding
32 BCTF Research, BCTF Information Services 2012 BC Education Facts
Ten school districts with the highest amount of revenue from international student tuition fees, 2010–11
District Revenue 43 Coquitlam $15,370,648 39 Vancouver $13,497,843 41 Burnaby $9,508,931 42 Maple Ridge-Pitt Meadows $8,859,462 61 Greater Victoria $8,732,967 36 Surrey $8,007,341 45 West Vancouver $7,950,427 44 North Vancouver $7,835,473 38 Richmond $6,285,926 35 Langley $6,007,178
Ten school districts with the lowest amount of revenue from international student tuition fees, 2010–11
District Revenue 78 Fraser-Cascade $46,209 83 North Okanagan-Shuswap $44,249 81 Fort Nelson $22,000 91 Nechako Lakes $17,600 52 Prince Rupert $12,000 19 Revelstoke $9,500 10 Arrow Lakes $9,000 58 Nicola-Similkameen $6,000 82 Coast Mountains $6,000 70 Alberni $1,250
Eleven school districts receiving no revenue from international student tuition fees, 2010–11
District Revenue 49 Central Coast $0 50 Haida Gwai'i/Queen Charlotte $0 51 Boundary $0 53 Okanagan Similkameen $0 54 Bulkley Valley $0 74 Gold Trail $0 84 Vancouver Island West $0 85 Vancouver Island North $0 87 Stikine $0 92 Nisga’a $0 93 Francophone Education Authority $0
Tables prepared by BCTF Research with figures from 2010–11 District Audited Financial Statements, Schedule A2: Operating fund, Comparative schedule of revenue by source, year ended June 30, 2011. available on district websites.

Education funding
2012 BC Education Facts BCTF Research, BCTF Information Services 33
School-generated funds “School-generated funds” are funds collected and used at the school level. Revenue sources may include vending machines, cafeterias, field trips, yearbook sales, school fees, graduation fees, band fees, and fundraising.
Total amount of School-Generated Funds, 2010–11 • 2010–11 District Audited Financial Statements show that a provincial total of $175.4 million
in school-generated funds was available in that year. • The ten school districts with the highest amount of school-generated revenues totaled $97.5
million, or two-thirds of total revenues. • The ten school districts with the lowest amount of school-generated revenues totaled only
$2.4 million.
Total amount of school-generated funds (2010–11) Total for all 60 school districts $175,398,989 Total for Top 10 districts $97,538,426 Total for Bottom 10 districts $2,423,502
Table prepared by BCTF Research with data from 2010–11 District Audited Financial Statements, Schedule B1: Special Purpose Funds—School-generated funds, year ended June 30, 2011, available on school district websites.
Education funding
34 BCTF Research, BCTF Information Services 2012 BC Education Facts
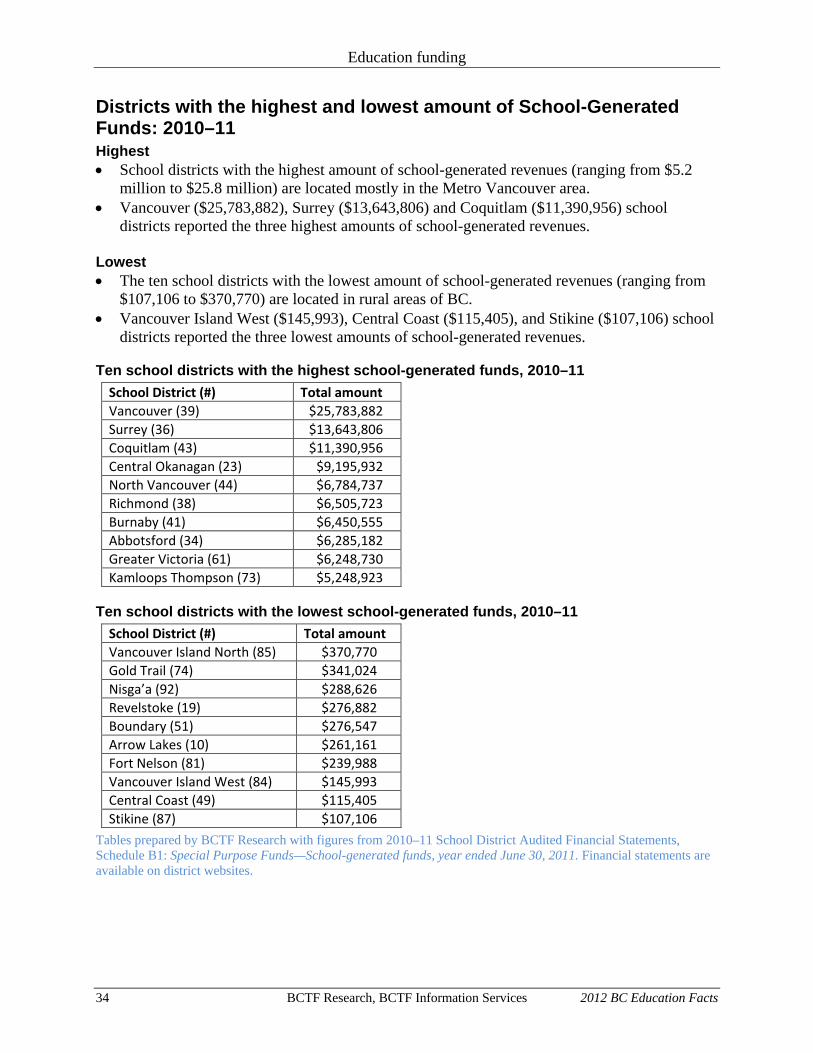
Districts with the highest and lowest amount of School-Generated Funds: 2010–11 Highest • School districts with the highest amount of school-generated revenues (ranging from $5.2
million to $25.8 million) are located mostly in the Metro Vancouver area. • Vancouver ($25,783,882), Surrey ($13,643,806) and Coquitlam ($11,390,956) school
districts reported the three highest amounts of school-generated revenues. Lowest • The ten school districts with the lowest amount of school-generated revenues (ranging from
$107,106 to $370,770) are located in rural areas of BC. • Vancouver Island West ($145,993), Central Coast ($115,405), and Stikine ($107,106) school
districts reported the three lowest amounts of school-generated revenues.
Ten school districts with the highest school-generated funds, 2010–11 School District (#) Total amount Vancouver (39) $25,783,882 Surrey (36) $13,643,806 Coquitlam (43) $11,390,956 Central Okanagan (23) $9,195,932 North Vancouver (44) $6,784,737 Richmond (38) $6,505,723 Burnaby (41) $6,450,555 Abbotsford (34) $6,285,182 Greater Victoria (61) $6,248,730 Kamloops Thompson (73) $5,248,923
Ten school districts with the lowest school-generated funds, 2010–11 School District (#) Total amount Vancouver Island North (85) $370,770 Gold Trail (74) $341,024 Nisga’a (92) $288,626 Revelstoke (19) $276,882 Boundary (51) $276,547 Arrow Lakes (10) $261,161 Fort Nelson (81) $239,988 Vancouver Island West (84) $145,993 Central Coast (49) $115,405 Stikine (87) $107,106
Tables prepared by BCTF Research with figures from 2010–11 School District Audited Financial Statements, Schedule B1: Special Purpose Funds—School-generated funds, year ended June 30, 2011. Financial statements are available on district websites.

Education funding
2012 BC Education Facts BCTF Research, BCTF Information Services 35
Fundraising for school resources Fundraising for library books, textbooks, and computers • Two-thirds (67%) of BC schools reported fundraising for library books, 57% raise funds for
technology, and 12% raise funds for textbooks. Canadian Teachers’ Federation and Canadian Centre for Policy Alternatives. (2006). Commercialism in Canadian
schools: Who’s calling the shots? Ottawa: CTF and CCPA. p. 33. http://www.ctf-fce.ca/documents/Resources/en/commercialism_in_school/en/FullReport.pdf
Funding for library books • According to the BC Teacher-Librarians’ Association (2008), budgets for materials have
dropped by more than 50% in 10 years and vary sharply across the province, from 80 cents per student per year in one district, to $35 per student per year in another.
BCTLA. (2008). 27th annual survey of working and learning conditions. Vancouver, BC: British Columbia Teacher-Librarians’ Association. http://www.bctf.ca/bctla/Bookmark/2008_WorkingLearning.pdf.
According to the BCTLA’s 2008–09 report of a survey representing library staff in 796 BC schools:
• Library budgets per school ranged from as little as $0 to as much as $47,505.00. Twenty-three schools actually reported having no budget for the library. The average budget allocation for the school library in responding schools in 2008–09 was $5,515.88 (including zero budgets).
• Over the last decade (1997–98 to 2008–09), the budget allocation per student FTE decreased from $15.54 to $13.88 for secondary schools, and from $14.73 to $12.90 for elementary schools. (Based on BCTLA annual survey results.)
BCTLA. (2009). 28th annual survey of working and learning conditions. Vancouver, BC: British Columbia Teacher-Librarians’ Association. http://bctf.ca/bctla/pub/reports/wlc/0809WLCreport.pdf.
The budget allocation per FTE student, as measured by the BCTLA survey, continues to be considerably lower than the amount recommended by the Canadian School Library Association and the Association for School Libraries in Canada in 2003. Canadian School Library Association and the Association for Teacher-Librarianship in Canada. (2003). Achieving
information literacy: Standards for school libraries. Ottawa: Canadian Association for School Libraries.
Library funds raised from other sources In the face of ongoing cutbacks to school library budgets, many schools have turned to fundraising to meet the most basic needs of the library. A 2009–10 survey by the BCTLA found:
• Three-quarters of responding schools raised funds for the library in 2008–09 from other sources such as Parent Advisory Committees or community donations.
• The average amount of funds raised for the school library in 2008–09 was $2,368.58, ranging from $70 to $50,000.
• Over half of schools raised less than $2,000 while 5% (25 schools) reported raising more than $5,000 from other sources.
BCTLA. (2010). The Bookmark’s 29th annual survey of working and learning conditions of public school libraries in British Columbia. Vancouver, BC: British Columbia Teacher-Librarians’ Association. http://bctf.ca/bctla/pub/reports/wlc/0910WLCreport.pdf

Education funding
36 BCTF Research, BCTF Information Services 2012 BC Education Facts
Education funding and taxation policy BC taxation policies erode funding for public education Loss of public schools funding to private sector • BC government requires school districts to purchase carbon offsets from a Crown
Corporation Pacific Carbon Trust, which uses the funds for private sector projects. Surrey ($496,892) and Vancouver ($406,094) each paid almost half a million dollars in carbon offsets in 2010.
Barrett, T. (2011). “Why the Pacific Carbon Trust draws political heat.” The Tyee. December 5. http://thetyee.ca/News/2011/12/05/CarbonTrustDrawsHeat/
• Bob Simpson, Independent MLA for Cariboo North, called on the legislature (March 5, 2012) to restore the corporate industrial school tax that Gordon Campbell cut in 2008 and direct the additional tax revenue to K to 12 education. This would result in an additional $228 million education funding over the next three years and at least $80 million dollars annually thereafter.
McGowan, R. (2012). “BC can afford to put more money into schools.” Burnaby NewsLeader (letter to the editor). March 9. http://www.burnabynewsleader.com/opinion/letters/142126793.html
Smith, C. (2012). “MLA and former teacher Bob Simpson condemns BC Liberal government's approach to education”. Straight.com. March 6. http://www.straight.com/article-624641/vancouver/mla-and-former-teacher-bob-simpson-condemns-bc-liberal-governments-approach-education
Radical shift in BC taxation policy undermines funding for public services A recent budget analysis by the Canadian Centre for Policy Alternatives (CCPA) reported that between 2000 and 2010:
• The share of provincial government revenues coming from personal income tax dropped by nearly one third.
• The shift in income taxation policy benefited the richest 20% of BC households the most. • Corporate income taxes have decreased from 16.5% to 10%. • BC’s taxation revenues as a percentage of GDP decreased by 1.7%, amounting to a loss of
$3.4 billion that would be in the provincial treasury if the BC government had collected the same share of the provincial economy in taxes as in 2000.
• According to the CCPA, this extra $3.4 billion in government revenues would be enough to balance the BC budget and pay for much-needed public services.
Lee, M., Ivanova, I., & Klein, S. (2011). BC’s regressive tax shift: A decade of diminishing tax fairness, 2000 to 2010. Vancouver, BC: Canadian Centre for Policy Alternatives. Available online at http://www.policyalternatives.ca/sites/default/files/uploads/publications/BC%20Office/2011/06/CCPA_BC_regressive_tax_shift.pdf
BCTF. (2011). Education Funding: A brief to the Select Standing Committee on Finance and Government Services. Available online at http://www.bctf.ca/uploadedFiles/Public/Publications/Briefs/2011EdFundingBrief.pdf

Education funding
2012 BC Education Facts BCTF Research, BCTF Information Services 37
Views of Canadians on taxation policy to address income inequality and protect public services Environics Research surveyed a representative sample of 2,000 Canadians, on behalf of the Broadbent Institute, about their views on income inequality and taxation policy. The survey results suggest Canadians are very concerned about the widening income gap in Canada and support taxation policies that protect public services and reduce income inequality. Views on income inequality as a problem with serious long-term consequences Of the survey respondents:
• 80% of British Columbians and 77% of Canadians agree that the widening income gap is a serious problem for Canada that will have long-term consequences for society.
• 71% believe the widening income gap between rich and poor undermines Canadian values. • Canadians are also concerned that growing income inequality will erode our standard of
living (79%), community safety (75%), public health care and other public services (72%), employment opportunities for young people (71%) and democratic principles (67%).
• 9 out of 10 think reducing income inequality should be a priority for the government (42% view this as a top priority and 47% a medium priority).
Views on tax policies to reduce income inequality in Canada Of the survey respondents:
• Two-thirds are willing to pay slightly higher taxes to protect social programs. • 83% support higher taxes for the wealthiest Canadians. • 73% support gradually increasing corporate tax rates to 2008 levels. • 69% support an inheritance tax of 35% on any estate valued above $5 million. Broadbent Institute. (2011). Equality Project. Available online at
http://www.broadbentinstitute.ca/sites/default/files/uploaded-manually/equality-project.pdf

Economic well-being
38 BCTF Research, BCTF Information Services 2012 BC Education Facts
ECONOMIC WELL-BEING Family poverty
Each year, the First Call: BC Child and Youth Advocacy Coalition releases a Child Poverty Report Card. Most of the information below, unless otherwise indicated, is from the 2011 Child Poverty Report Card, available at http://www.firstcallbc.org/pdfs/economicequality/3-reportcard2011.pdf.
BC child poverty increases in 2009—highest after-tax child poverty rate in Canada • The before-tax child poverty rate for BC increased from 14.5% (121,000 children) in 2008 to
16.4% (137,000 children) in 2009. Of these, an estimated 90,000 BC children living in poverty are school-aged (5+).
• In 2009, BC recorded the highest after-tax child poverty rate (12%) in Canada for the eighth year in a row. The national after-tax child poverty rate is 9.5%. The after-tax child poverty rate increased by 1.6% in BC compared to 0.4% for Canada as a whole.
FirstCall, 2011 Child Poverty Report Card, pp. 3–4.
Many of these families live in severe poverty • On average, the 2009 income for two-parent families with two children living in poverty was
$14,200 below the poverty line (p. 6). • In 2009, 34,011 BC children (on average) were in families on income assistance. A BC lone-
parent family with one child aged two received $16,899 per year, $10,775 less than the poverty line (p. 10).
FirstCall, 2011 Child Poverty Report Card, p. 6, p. 10.
The growing income-gap between the lowest- and highest-income families in BC • In 2009, the average family income of the wealthiest 10% of families with children was
$253,762, an increase of $89,118 since 1989, after adjusting for inflation. • In 2009, the average family income for the 10% of families in the lowest income group was
$18,815, an increase of $828 since 1989, after adjusting for inflation. • This means that the increase in income between 1989 and 2009 for the wealthiest 10% of
families was 108 times greater than for the poorest 10% of families. FirstCall, 2011 Child Poverty Report Card, p. 18.
BC has highest child poverty rate for families with one or more full-time earners • In 2009, about half of BC children (48%) in poverty were in families where at least one adult
worked in full-time, full-year employment, considerably higher than the national average (35%) and more than double the child poverty rate of families with one or more full-time earners in Quebec (19%).
FirstCall, 2011 Child Poverty Report Card, p. 8.

Economic well-being
2012 BC Education Facts BCTF Research, BCTF Information Services 39
BC minimum wage well below what families need to survive • First Call (2011) states that to meet basic needs “a two-earner family of four with two
children and two adults would require a ‘living wage’ of $18.81 an hour in Metro Vancouver” (p. 9). This calculation assumes both parents work 35 hours per week.
• Even with the upcoming increase to the minimum wage in 2012 ($9.50 per hour until May 1, 2012, increasing to $10.25 on May 1, 2012), the total earnings of a person employed 37.5 hours per week in a large city would be $4,043 below the poverty line (p. 26).
FirstCall, 2011 Child Poverty Report Card, p. 9, p. 26. Government support for child and family poverty
BC does less to reduce the child poverty rate than most other provinces • First Call publishes a chart showing the child poverty rate with and without government
income support programs. • In 2009, government transfers in BC helped reduce the child poverty rate from 24.8%
(without government help) to 16.4% (with government help). But compared to other provinces, BC did much less to alleviate child poverty.
• Some provinces made considerable progress reducing the child poverty rate in 2009. Most notable are Prince Edward Island (from 26.1% to 9%), Newfoundland and Labrador (from 32% to 15.1%), New Brunswick (from 24.8% to 9.9%) and Québec (from 27.1% to 13.3%).
FirstCall, 2011 Child Poverty Report Card, p. 19.
Funding for students “vulnerable” to poverty not enough • Assuming the 2009 before-tax child poverty rate of 16.4% remains the same in 2011–12, an
estimated 91,740 students in grades Kindergarten to grade 12 (excluding graduated adults) are in families with incomes below the poverty line.
• The BC Ministry of Education provides $51 million per year in CommunityLINK funding, and in 2012–13 allocates $11 million of operating grants funding for “vulnerable” children.
• The total amount ($62 million) allocated for 2012–13 to support students vulnerable to the effects of poverty works out to $675 per student per year, or $3.58 per student per school day. This estimate assumes the child poverty rate and student enrolment remain the same.
BC Ministry of Education. (2012). 2012/13 Operating Grants Manual. Victoria, BC: Government of British Columbia. Vulnerable students, see p. 7 and Table 4c. http://www.bced.gov.bc.ca/k12funding/funding/12-13/operating-grants-manual.pdf
BC Ministry of Education. (2012). Student Statistics 2011/12: Province—Public and Independent schools combined. Victoria, BC: Government of British Columbia. p. 9. http://www.bced.gov.bc.ca/reports/pdfs/student_stats/prov.pdf
CommunityLINK: http://www.bced.gov.bc.ca/k12funding/funding/12-13/summary-of-grants.pdf

Economic well-being
40 BCTF Research, BCTF Information Services 2012 BC Education Facts
Families most at-risk for poverty One-parent families (highest poverty rate) • Children in female lone-parent families are at much higher risk of poverty than two-parent
families. In 2009, 24.2% of children in female lone-parent families and 15% of children in two-parent families lived below the poverty line in BC.
• Between 2008 and 2009, the child poverty rate for two-parent families increased (from 12.2% to 15%) and decreased for female lone-parent families (from 30.9% to 24.2%).
FirstCall, 2011 Child Poverty Report Card, p. 6.
Two-parent families (greatest number of low-income children) • While lone-parent families are at a much higher risk of poverty, the absolute number of
children affected by poverty is higher for two-parent families because they comprise the majority of families. Of the 137,000 BC children living in poverty in 2009, 101,000 live in two-parent families, 24,000 in female lone-parent families, and 12,000 in male lone-parent families or other relatives (p. 6).
FirstCall, 2011 Child Poverty Report Card, p. 6.
Families with children under six • One in five (20.2%) or 51,900 BC children under the age of six lived in poverty in 2009.
Since 2002, BC’s poverty rate for children under six has exceeded the national average. • First Call notes that these persistently high poverty rates for “young children are very
alarming, given the importance of the early years for child development” citing Human Early Learning Partnership research showing developmental vulnerabilities for 31% of children entering BC schools.
FirstCall, 2011 Child Poverty Report Card, p. 4.
Aboriginal families • The child poverty rate for children of Aboriginal identity in Canada was 36% in 2005, the
most recent year that data is available. (FirstCall, 2011 Child Poverty Report Card, p. 7) • Statistics Canada recently published its 2006 Aboriginal Children’s Survey (O’Donnell,
2008), which shows high poverty rates among young Aboriginal children in Canada. Almost half (49%) of off-reserve Aboriginal children, and 31% of Métis children, under six years of age were in low-income families in 2006, compared to 18% of non-Aboriginal children.
O’Donnell, V. (2008, Winter). Selected findings of the Aboriginal Children’s Survey 2006: Family and community. Canadian Social Trends, 86, 65–72.

Economic well-being
2012 BC Education Facts BCTF Research, BCTF Information Services 41
Families newly-immigrated to Canada • One in two (49.6%) BC children of recent immigrants lived in poverty in 2005 (p. 7). • The poverty rate of children under 18 who arrived in BC between 2001 and 2006 is 49.6%
compared to 36.1% of families who arrived between 1996 and 2000, and 16.2% for Canadian-born families (p. 12).
• Between 2005 and 2009, 39,443 new immigrant children under 15 years of age came to BC, with 88 % in families planning to settle in Metro Vancouver (p. 13)
• Refugee children under 15 made up six percent (2,500 children) of the immigrant child arrivals between 2005 and 2009 (p. 13).
• One-third of children under 15 who arrived in BC between 2005 and 2009 spoke English or French (p. 13).
FirstCall, 2011 Child Poverty Report Card, pp. 7, 12–13.
Educational attainment and economic well-being Earnings and education • Overall, education results in higher-than-average earnings. In 2007, employees with a
master’s or doctoral degree earned an average of $30.44 per hour, 75% more than employees with just a high-school diploma. Since 1997, the hourly wage in constant 2007 dollars declined for workers with no high-school diploma, and increased by 5% for those with a post-secondary certificate. Wages stayed about the same for employees with a master’s or doctoral degree.
• While a gender gap in wages persists, it narrows with each level of education. In 2007, women with a bachelor’s degree earned 85 cents for every dollar earned by men, while women with Grade 8 or less earned 72 cents for every dollar earned by men.
Statistics Canada. (2008). The Canadian Labour Market at A Glance: Section J: Wages and Income (Vol. 71-222-X). Retrieved January 7, 2009, from http://www.statcan.gc.ca/bsolc/olc-cel/olc-cel?lang=eng&catno=71-222-X.
Employment • Completing a secondary education certificate almost doubles the employment rate for both
Aboriginals and non-Aboriginals. Richards, J., Hove, J., & Afolabi, K. (2008). Understanding the Aboriginal/Non-Aboriginal gap in student
performance. Vancouver, BC: C.D. Howe Institute.

Economic well-being
42 BCTF Research, BCTF Information Services 2012 BC Education Facts
Family poverty and education There is considerable evidence that education buffers families against poverty.
• The report Growing Up in North America (Canadian Council on Social Development et al., 2008) shows that the child poverty rate in 2000 was five times higher for families with a parent (considered the head of household) with less than a secondary education (27.6%), compared to those with a parent who completed a university or college education (5.4%), and twice as high as for those families where a parent completed secondary/vocational or some post-secondary education.
Canadian Council on Social Development, The Annie E. Casey Foundation, & Red Por Los Derechos de la Infancia en Mexico. (2008). Growing up in North America: The economic well-being of children in Canada, the United States, and Mexico. Baltimore, Maryland: The Annie E. Casey Foundation.
• Fleury (2008) found that the education level of a parent protected children from persistent poverty but not short-term poverty, indicating that education can help families to move out of poverty in the longer-term.
Fleury, D. (2008, May). Low-income children. Perspectives on Labour and Income, 9(5). Statistics Canada Catalogue no. 75-001-XIE.
Education is a buffer but no guarantee Of concern is that nearly one out of seven Canadian workers with a university degree, aged 25 to 64 years, earned less than $12 per hour in 2007 (Statistics Canada, 2008). The 2008 Organization for Economic Co-operation and Development (OECD) report, Education at a Glance, shows Canada having the highest proportion (18%) of highly-educated individuals earning less than half the median wage—the worst record of 27 OECD countries. OECD. (2008). Education at a Glance 2008: OECD Indicators. Paris: Organization for Economic Co-operation and
Development. Statistics Canada. (2008). The Canadian Labour Market at A Glance: Section J: Wages and Income (Vol. 71-222-
X). Retrieved January 7, 2009, from http://www.statcan.gc.ca/bsolc/olc-cel/olc-cel?lang=eng&catno=71-222-X.

Economic well-being
2012 BC Education Facts BCTF Research, BCTF Information Services 43
Overall benefits of public-school education to individuals and society • Schooling is generally accepted to contribute to social well-being and economic growth in
society. • According to one US study (Levin et al., 2007); boosting high-school graduation rates would
save US $127,000 per new graduate. Researchers found that if the US were to spend on average $82,000 for every student who became a high-school graduate (because of specific interventions), the economy would benefit during each of those students’ lifetimes from $209,000 in additional tax revenues and $70,000 in lower costs for public health, social welfare, and corrections.
• Those without high-school graduation live 9.2 years fewer than those who have graduated. The tax cost to society for health care for each person who drops out without completing high school is $120,000 (US).
Hawkey, C. (2008). Money matters: Education funding in BC. [PowerPoint slides for BCTF Public Education Conference]
Levin, H., Belfield, C., Muennig, P., & Rouse, C. (2007). The costs and benefits of an excellent education for all of America’s children. New York, NY: Columbia University Teachers College. Accessed online at: http://www.cbcse.org/media/download_gallery/Leeds_Report_Final_Jan2007.pdf
Higher education levels are associated with:
• Increased productivity and economic growth (Conference Board of Canada; OECD, 2010) • Living healthier and longer lives (OECD, 2010) • Higher earnings (OECD, 2010) • Higher levels of political interest and civic and social engagement (OECD, 2010) • Higher levels of interpersonal trust and social cohesion. (OECD, 2010) Conference Board of Canada. (2010). How Canada Performs: A Report Card on Canada, 2009–10 – Education and
Skills. http://www.conferenceboard.ca/hcp/details/education.aspx?pf=true OECD. (2010). Education at a Glance 2010. http://www.oecd.org/dataoecd/45/39/45926093.pdf

Student achievement
44 BCTF Research, BCTF Information Services 2012 BC Education Facts
STUDENT ACHIEVEMENT Benefits of school libraries to student achievement Benefits of teacher-librarians and school libraries in improving literacy Dr. Ken Haycock’s comprehensive review of current research on school libraries revealed that:
• The educational performance of students is higher in schools with a full-time teacher-librarian who engages in classroom collaboration, teaches literacy skills and is involved in technology programs.
• Having a school library open all day, staffed with a teacher-librarian, improves educational outcomes for students.
• Students in school libraries with higher spending on books and materials scored higher on reading tests.
Haycock, K. (2003). The crisis in Canada’s school libraries: The case for reform and re-investment. Toronto: Association of Canadian Publishers. http://bccsl.ca/download/HaycockReport.pdf
An Ontario Library Association study (Klinger, 2006) found that:
• Having a teacher-librarian in a school is the single strongest predictor of reading enjoyment for students in both Grades 3 and 6.
• Reading enjoyment is a significant factor in improving student performance in literacy, science, and mathematics.
• The presence of trained library staff is associated with higher reading achievement for Grades 3 and 6 students.
• School libraries also help even the playing field for students whose parents might not be able to provide print, audio, and electronic learning resources at home. (Klinger, 2006)
Klinger, D. (2006). School Libraries and Student Achievement in Ontario. Toronto: Ontario Library Association. http://www.accessola.com/data/6/rec_docs/137_eqao_pfe_study_2006.pdf

Student achievement
2012 BC Education Facts BCTF Research, BCTF Information Services 45
School libraries linked to student achievement Research has shown that professionally-staffed, accessible, and well-funded school libraries are linked to higher student achievement. (Klinger, 2006; Scholastic Library Publishing, 2008; Small, Snyder, and Parker, 2009; Lance, Rodney, and Hamilton-Pennell, 2005) Klinger, D. (2006). School Libraries and Student Achievement in Ontario. Toronto: Ontario Library Association.
http://www.accessola.com/data/6/rec_docs/137_eqao_pfe_study_2006.pdf Lance, K.C., Rodney, M.J., & Hamilton-Pennell, C. (2005). Powerful Libraries Make Powerful Learners: The
Illinois Study. Canton, IL: Illinois School Library Media Association. http://www.islma.org/pdf/ILStudy2.pdf
Scholastic Library Publishing. (2008). School Libraries Work! http://www2.scholastic.com/content/collateral_resources/pdf/s/slw3_2008.pdf
Small, R.V., Snyder, J., & Parker, K. (2009). The Impact of New York’s School Libraries on Student Achievement and Motivation: Phase I. School Library Media Research 12. American Association of School Librarians. http://www.ala.org/ala/mgrps/divs/aasl/aaslpubsandjournals/slmrb/slmrcontents/volume12/small.cfm
According to researchers Lance, Rodney, and Hamilton-Pennell,
• Schools that have libraries with larger book collections have higher average test scores than schools that have libraries with fewer books.
• Schools with more-current collections also average higher test scores. • Test scores also tend to be higher where:
• access to school libraries is flexibly scheduled, • school libraries are staffed more fully, • school librarians spend more time collaborating with classroom teachers, • educational technology is more-widely available to augment the local collection, and,
generally, to extend access to online resources into the classroom, • school libraries are better funded, and • students use school libraries, both individually and in groups, to learn and practice the
information literacy skills they will need to excel on tests and as lifelong learners. (Lance, Rodney, and Hamilton-Pennell, 2005)
Lance, K.C., Rodney, M.J., & Hamilton-Pennell, C. (2005). Powerful Libraries Make Powerful Learners: The Illinois Study. Canton, IL: Illinois School Library Media Association. http://www.islma.org/pdf/ILStudy2.pdf

Student achievement
46 BCTF Research, BCTF Information Services 2012 BC Education Facts
How does Canada’s education system compare to those in other countries? Where Canada excels: • When it comes to Education and Skills, Canada ranks second out of seventeen countries on
the Conference Board of Canada’s “Report Card on Canada.” Only Finland and Canada received an “A” grade in this section of the Report Card. Furthermore, the performance gap between Finland and Canada has narrowed.
The Conference Board of Canada 2010 report also commended Canada for:
• Delivery of a high-quality education through its public system to people between the ages of 5 and 25 with modest spending compared to other developed countries. A public school system that provides many Canadians with a good education in core subjects and the skills they need to be successful in the workforce.
• One of the highest rates of high-school and college completion in the world.
A recent Statistics Canada report (Knighton, Brochu and Gluszynski, 2010) finds Canada performs well in standardized tests relative to other OECD countries:
• Canada is recognized as one of the few PISA countries that demonstrate both high performance and high equity; that is, its overall scores are high while the gaps between the highest and lowest performing students are also low. This is an indicator of the equity of educational outcomes in Canada.
• In the latest round of PISA tests, Canadian 15-year-olds scored well above the OECD averages in reading, math, and science. Canada continues to be one of the highest-performing countries in the world in this respect.
• British Columbia performed at the Canadian averages for reading, math, and science, and above the OECD averages in all three subjects.
Where Canada falls short: The Conference Board of Canada 2010 report card also identified some shortcomings of Canada’s education system:
• Over 7 million adult Canadians lack the functional literacy they might need to adjust to the changing economy. Canada’s performance on adult literacy measures is about average when compared to 16 peer countries.
• Average numbers of university graduates in science, math, computer science, and engineering disciplines.
• Low numbers of Ph.D. graduates. • Lack of focus on work-based skills training and lifelong learning outside traditional academic
institutions. Conference Board of Canada. (2010). How Canada performs: A report card on Canada, 2009–10—Education and
skills. http://www.conferenceboard.ca/hcp/details/education.aspx?pf=true Knighton, T., Brochu, P., & Gluszynski, T. (2010). “Measuring up: Canadian Results of the OECD PISA Study. The
Performance of Canada’s Youth in Reading, Mathematics and Science. 2009 First Results for Canadians Aged 15.” Statistics Canada. http://www.statcan.gc.ca/pub/81-590-x/81-590-x2010001-eng.pdf
August 2012 MW:af/st:tfeu