2012 assessment guidance manual for assessing the … 2012e.pdf · quality of minnesota surface...
TRANSCRIPT

Minnesota Pollution Control Agency
Guidance Manual for Assessing the Quality of Minnesota Surface Waters for
Determination of Impairment: 305(b) Report and 303(d) List
2012 Assessment Cycle
wq- iw1-04

Minnesota Pollution Control Agency 520 Lafayette Road North Saint Paul, MN 55155-4194
http://www.pca.state.mn.us 651-296-6300 or 800-657-3864 toll free
TTY 651-282-5332 or 800-657-3864 toll free Available in alternative formats
Authors and Contributors Pam Anderson Will Bouchard
David Christopherson Mike Feist John Genet
Douglas Hansen Louise Hotka
Shannon Lotthammer Howard Markus Bruce Monson
Angela Preimesberger Carol Sinden
Minnesota Department of Health – Patricia McCann Minnesota Department of Agriculture – Daniel Stoddard, Joeseph Zachmann
wq-iw1-04
The MPCA is reducing printing and mailing costs by using the Internet to distribute reports and information to a wider audience.

Forward Since the Clean Water Act became law in 1972, very significant and often dramatic improvements in the water quality of the nation’s surface waters have been accomplished. Notable Minnesota examples include the Mississippi River below the Twin Cities, the Rainy River below International Falls, and the lower St. Louis River near Duluth, to name just three. Most of these gains can be attributed to vast improvements in domestic and industrial wastewater treatment, due largely to the Clean Water Act National Pollutant Discharge Elimination System permit program, and the Construction Grants program. Point source discharges have been significantly “cleaned up” as a result of these two programs (which is not to say that all point source pollution problems have been solved). The contribution of pollutants from nonpoint sources, from agriculture, construction and development sites, forestry, urban runoff, etc., is now the major reason that many of Minnesota’s waters are considered impaired. The prevention and control of nonpoint source pollution remains one of the Minnesota Pollution Control Agency’s, and the publics, greatest pollution challenges.
It is the responsibility of the Minnesota Pollution Control Agency to monitor Minnesota’s rivers and lakes, to assess water quality, and to report the results to the public. This task extends to documenting the water quality “success stories”, as well as documenting those rivers and lakes that still need improvement. This Guidance Manual deals with the need to assess water quality with available data, which may be plentiful in places but is often just enough to satisfy minimum data requirements. The methodologies in this Guidance Manual are designed to reap the most information, value, and benefit possible from limited data.
This Guidance Manual was developed to help federal, tribal, state, and county staff, and the public in general, understand the water quality assessment process. It will be updated as assessment methods improve and as new pollution problems emerge that require assessment. Comments and suggestions from readers are encouraged and will be used to help improve the guidance.
Michael J. Sandusky, Manager
Environmental Assessment and Outcomes Division
Minnesota Pollution Control Agency
St. Paul, Minnesota

G u id an ce Man ua l for A sses s ing th e Minne sota Po l lut ion Contro l Age n cy Qua l i ty o f Minne sota Sur fac e Wate rs December 2011 i
Table of Contents
Tables ...........................................................................................................................................iv
Figures ..........................................................................................................................................v
Abbreviations, Acronyms, and Symbols ......................................................................................vi
I. Introduction ............................................................................................................1 A. Background..............................................................................................................1
B. About the “TMDL List,” “Listing Cycle” and “Integrated Report” ...........................1
C. Monitoring and assessment approach ....................................................................2
II. Purpose and Scope .................................................................................................4 A. About the Assessment Guidance ............................................................................4
B. Disclaimers and future changes to the Guidance ...................................................4
C. Other Standards ......................................................................................................5
III. Assessment Process ...................................................................................................6
A. Steps in the Assessment Process ............................................................................6
1. Data compilation (pre-assessments) ............................................................6
2. Expert review…………………. ...........................................................................6
3. Desktop assessment ………………….. ................................................................6
4. Watershed Assessment Team (WAT) ...........................................................7
5. Professional Judgment Group (PJG) .............................................................7
IV. General Aspects of Data Assessment .......................................................................8
A. Delineation of reaches, lakes and wetlands............................................................8
B. Period of record .....................................................................................................8
C. Values below detection ..........................................................................................9
D. Uncertainty in water quality assessments ..............................................................9
E. Data sources and quality .........................................................................................10
F. Dataset quality and parameter-level evaluation .....................................................10
G. Reporting ..............................................................................................................12
V. Protection of Aquatic Life ..........................................................................................13
A. Pollutants with toxicity-based water quality standards .........................................13
1. Pollutants ......................................................................................................13
a) Trace metals .............................................................................................13
b) Un-ionized ammonia ...............................................................................14
c) Chloride ....................................................................................................14
2. Data requirements and determination of impaired condition ......................15
G u id an ce Man ua l for A sses s ing th e Minne sota Po l lut ion Contro l Age n cy Qua l i ty o f Minne sota Sur fac e Wate rs December 2011 i i
B. Conventional pollutants and biological indicators ..................................................15
1. Pollutant or water quality characteristic ......................................................15
a) Low dissolved oxygen ..............................................................................16
b) pH .............................................................................................................16
c) Turbidity ...................................................................................................16
d) Temperature ............................................................................................17
e) Biological indicators .................................................................................17
2. Data requirements and determination of impaired condition .....................19
VI. Protection of Aquatic Consumption & Drinking Water ...........................................22
A. Pollutants with Class 2 human health-based chronic standards ............................22
1. Algorithms for human health-based chronic standards ...............................22
2. Pollutants with human health-based chronic standards ..............................23
a) Mercury ....................................................................................................23
b) Polychlorinated biphenyls .......................................................................23
c) Dioxins and chlorinated pesticides ..........................................................24
3. Data requirements and determination of impaired condition.....................24
4. Pollutants with human health- and toxicity-based standards or criteria ......................................................................................................25
a) Pollutants .................................................................................................25
b) Data requirements and determination of impaired conditions ..............25
B. Protection for human consumption of fish .............................................................25
1. Basis for assessment of fish contaminants – narrative standards ...............26
2. MDH fish consumption advice and thresholds for consumption .................26
3. Selection of single fish meal-per-week impairment threshold ....................27
4. Mercury: numeric fish tissue standard .........................................................27
5. Data requirements and determination of impaired condition .....................28
C. Class 1 drinking water standards for nitrate nitrogen .............................................29
1. Nitrate nitrogen ............................................................................................29
2. Data requirements and determination of impaired condition.....................29
VII. Pollutants with Wildlife-Based Water Quality Standards ....................................31
VIII. Protection of Aquatic Recreation ..........................................................................32 A. Streams and rivers – E. coli bacteria .......................................................................32
1. Data requirements and determination of impaired condition.....................32
B. Lake eutrophication.................................................................................................35

G u id an ce Man ua l for A sses s ing th e Minne sota Po l lut ion Contro l Age n cy Qua l i ty o f Minne sota Sur fac e Wate rs December 2011 i i i
1. Waterbody classification and ecoregion determination ...............................35
2. Data requirements and determination of use assessment ...........................35
a) Minimum data requirements ............................................................35
b) Lake assessment determinations ......................................................35
c) Reservoirs and other special situations .............................................36
IX. Protection of Limited Resource Value Waters Class 7 ..........................................37
X. Removal of Waterbodies from 303(d) List ............................................................38
A. Waterbody no longer impaired ..............................................................................38
B. EPA approved TMDL plan .......................................................................................40
C. Waterbody impaired because of natural causes/conditions .................................40
D. List correction .........................................................................................................40
XI. Sources of Information and MPCA Contacts .........................................................41
A. MPCA staff ...............................................................................................................41
B. Websites ..................................................................................................................42
XII. Literature Cited .......................................................................................................43
XIII. Appendices .............................................................................................................45
A. Lake, shallow lake, and wetland classification matrix
B. Consolidated and listing methodology use assessment assignments
C. Supplemental information on Biological Assessment in Minnesota

G u id an ce Man ua l for A sses s ing th e Minne sota Po l lut ion Contro l Age n cy Qua l i ty o f Minne sota Sur fac e Wate rs December 2011 i v
Tables Table 1. Indicator quality rating for conventional pollutants .....................................................11
Table 2. Guidelines for making parameter-level assessments of conventional pollutants ........12
Table 3. Summary of data requirements and exceedance thresholds for assessment of pollutants with toxicity-based standards.....................................................................................15
Table 4. Summary of data requirements and exceedance thresholds for assessment of pollutants with human health-based and wildlife-based standards ..........................................24
Table 5. Fish tissue concentrations (in ppm) for levels of consumption advice established by MDH for mercury, total PCBs, and PFOS (April 2008) .........................................27
Table 6. Summary of data requirements and exceedance thresholds for assessment of nitrate nitrogen, Class 1 drinking water standard .......................................................................30
Table 7. E. coli water quality standards for Class 2 and Class 7 waters ......................................32
Table 8. Assessment of waterbodies for impairment of swimming use - data requirements and exceedance thresholds for E. coli bacteria ...........................................................................34
Table 9. Lake eutrophication standards for aquatic recreation use assessments ......................36

G u id an ce Man ua l for A sses s ing th e Minne sota Po l lut ion Contro l Age n cy Qua l i ty o f Minne sota Sur fac e Wate rs December 2011 v
Figures
Figure 1. Use of trace metal data for total metals standards ........................................................... 14
Figure 2. General diagram illustrating the characterization of individual biological indicator results ................................................................................................................................. 19

G u id an ce Man ua l for A sses s ing th e Minne sota Po l lut ion Contro l Age n cy Qua l i ty o f Minne sota Sur fac e Wate rs December 2011 v i
Abbreviations, Acronyms, and Symbols
AUID assessment unit identification
ch. Chapter
chl-a Chlorophyll-a, corrected for pheophytin
CLMP Citizen Lake Monitoring Program
CSMP Citizen Stream Monitoring Program
CWP Clean Water Partnerships
DELT Deformities, eroded fins, lesions or tumors
DO Dissolved oxygen
EPA U.S. Environmental Protection Agency
EQuIS Minnesota Pollution Control Agency’s data storage system
FAV Final Acute Value
GLI Great Lakes Water Quality Initiative
IBI Index of Biotic Integrity
L Liter
MDA Minnesota Department of Agriculture
MDH Minnesota Department of Health
MDNR Minnesota Department of Natural Resources
MFCA Minnesota Fish Consumption Advisory
μg/L microgram per liter or ppb
mg/L milligram per liter or ppm
MPCA Minnesota Pollution Control Agency
NCHF North Central Hardwood Forest Ecoregion
ng/L Nanogram per liter or parts per trillion
NGP Northern Glaciated Plains Ecoregion
NHD National Hydrographic Data
NLF Northern Lakes and Forests Ecoregion
NTU Nephelometric turbidity units
PCB Polychlorinated biphenyls
pg/L Picogram per liter or parts per quadrillion
ppb Microgram per liter or parts per billion
ppm Milligram per liter or parts per million

G u id an ce Man ua l for A sses s ing th e Minne sota Po l lut ion Contro l Age n cy Qua l i ty o f Minne sota Sur fac e Wate rs December 2011 v i i
QA/QC Quality Assurance/Quality Control
R. Rule
TMDL Total Maximum Daily Load
TP Total Phosphorus
TSI Trophic State Index
USGS United States Geological Survey
WCBP Western Corn Belt Plains Ecoregion
≥ Greater than or equal to
≤ Less than or equal to

G u id an ce Man ua l for A sses s ing th e Minne sota Po l lut ion Contro l Age n cy Qua l i ty o f Minne sota Sur fac e Wate rs December 2011 1
I. Introduction A. Background
Minnesota is blessed with abundant water resources. Our lakes, rivers, and streams play a vital role in the state’s economy and the richness of the quality of life residents and visitors enjoy. The enormous opportunities for water related recreation these resources provide, such as aesthetic enjoyment, swimming, fishing, boating and canoeing depend, to a great extent, on good water quality. Within Minnesota’s borders lie the headwaters of three major continental watersheds, the Great Lakes/ St. Lawrence River, the Mississippi River, and the Red River of the North/Hudson Bay watersheds. Thus, Minnesotans have the privilege and, with that, the huge responsibility of living “upstream” of millions of downstream users of these major waterways. Minnesota’s water resources include about 105,000 river miles, 4.5 million acres of lakes and reservoirs including approximately 1.4 million acres of Lake Superior in Minnesota, and about 9.3 million acres of wetlands.
The Minnesota Pollution Control Agency (MPCA) is charged under both federal and state law with the responsibility of protecting the water quality of Minnesota’s lakes, rivers, streams, and wetlands. The goal of the MPCA is to preserve the existing high quality of waterbodies that are meeting standards, so beneficial uses are maintained. However, too many surface waters receive enough pollutant loading from a variety of sources that they do not meet one or more water quality standards. If the extent of the violations of standards exceed the guidelines spelled out in this Guidance Manual (Guidance), those surface waters are considered to be “impaired”. The goal of the MPCA is to protect high-quality waters and improve the quality of impaired waters so water quality standards are met and beneficial uses are maintained and restored, where these uses are attainable.
B. About the “TMDL List,” “Listing Cycle” and “Integrated Report” The federal Clean Water Act (CWA) requires states to adopt water-quality standards to protect waters from pollution. These standards define how much of a pollutant can be in the water and still meet beneficial uses, such as drinking water, fishing and swimming. Water quality standards are the fundamental tools used to assess the quality of all surface waters. For more detailed information regarding standards see http://www.pca.state.mn.us/gp0r909. States must monitor and assess the water quality of their waters to identify those that are “impaired” (i.e. not fully supporting their beneficial uses). Section 303(d) of the CWA requires states to publish and update a list of impaired waters for which a Total Maximum Daily Load (TMDL) Study is needed. This list, known as the “303(d) List” or “TMDL List” is updated every two years via assessment of water quality data and an extensive public participation process. The draft TMDL list is developed by the MPCA and submitted to the U.S. Environmental Protection Agency (EPA) for final approval. The two-year timeline for assembling and submitting the draft TMDL List is known as the “listing cycle;” this Guidance has been prepared to reflect the 2012 Listing Cycle.
The CWA also requires states to submit a report on the status of all of their waters to help measure progress toward the national goals of fishable and swimmable waters. This “Integrated Report” includes the TMDL List as well as the Inventory of Impaired Waters – an accounting of all known impaired waters, not just those requiring TMDLs. The Inventory of Impaired Waters includes those waters needing a TMDL plan, those for which a plan has already been developed and approved by EPA, and waterbodies that are naturally impaired (such as the arsenic exceedances in the Red River of the North). The Integrated Report also includes information about waters that are meeting beneficial uses and also programmatic information about protection and restoration efforts. As part of the assessment process and the development of the Integrated Report, all waters for which sufficient data have been collected to allow a review are assigned to a category of impaired, unimpaired, or insufficient information to determine impairment status according to an EPA-established system called the Consolidated Assessment and Listing Methodology (CALM – see Appendix B).

G u id an ce Man ua l for A sses s ing th e Minne sota Po l lut ion Contro l Age n cy Qua l i ty o f Minne sota Sur fac e Wate rs December 2011 2
C. Monitoring and assessment approach The MPCA conducts a variety of surface water condition monitoring activities focused on providing critical information to assess the condition of Minnesota’s water resources. This information also is used to assess potential and actual threats to water quality and to evaluate the effectiveness of management activities taken to address impairments and other threats to water quality. Monitoring conducted by other local, state, and federal agencies, citizen monitoring as well as remote sensing data are also used for this purpose. For more details on the MPCA’s monitoring strategy, see http://www.pca.state.mn.us/0agx8f6.
The MPCA’s primary condition monitoring activities are organized around Minnesota’s 81 “major” watersheds. The watershed monitoring approach involves intensive monitoring on a subset of major watersheds every year. The MPCA has established and is implementing a schedule for intensively monitoring each major watershed every ten years, and the watershed outlets every year. An intended outcome of the monitoring is the identification of waters that are impaired and need restoration and waters that need further protection to prevent impairment. This is followed by TMDL and protection strategy development at the major watershed scale, and ongoing implementation (see http://www.pca.state.mn.us/irypabf for a more in-depth discussion of the watershed approach and for a map of the 10-year watershed monitoring schedule. An important feature of the watershed approach is the fact that restoration and protection planning and associated implementation will occur in all watersheds; the identification of an impaired status is not a key “trigger” for follow-on planning and implementation.
Until 2010, the MPCA assessed the condition of the state’s waters via a biennial, statewide assessment process. With the advent of the intensive watershed monitoring approach, which was piloted in 2006 and adopted in earnest beginning in 2007, the MPCA faced a need to revise the assessment process to align with the watershed monitoring approach, including the 10-year schedule and the increased volume of data generated during watershed monitoring.
An annual assessment process has been designed to keep up with the monitoring work and reflect the more detailed monitoring data available in the watersheds where intensive watershed monitoring has been completed. The development of an annual assessment process has been critical to the MPCA’s implementation of the overall watershed approach. With assessments taking place immediately following completion of intensive watershed monitoring, the entire process of monitoring-assessment-restoration-protection can be completed within ten years, at which time the watershed comes up for monitoring again as part of the next scheduled ten-year rotation. In addition, the revised process encourages earlier and more meaningful local involvement in assessment.
Some monitoring – namely monitoring of toxic parameters – continues to occur on a statewide basis. Assessment of those parameters is done statewide every two years, to reflect the monitoring design. Watershed assessments focus primarily on the aquatic life and recreation beneficial uses. Statewide assessments focus primarily on aquatic consumption and aquatic life toxicity.
Every two years the watershed and statewide assessment results are packaged together into the proposed TMDL List and Integrated Report. For the 2012 Listing Cycle, the assessed watersheds are:
• Pomme de Terre • North Fork of the Crow • Sauk • Little Fork • Le Sueur • Mississippi (St Cloud) • St. Croix (Stillwater) • St. Louis
• Chippewa • Mississippi (Red Wing) • Root • Cedar • Shell Rock • Buffalo • Tamarac (Red River of the North) • Red River of the North (Headwaters)

G u id an ce Man ua l for A sses s ing th e Minne sota Po l lut ion Contro l Age n cy Qua l i ty o f Minne sota Sur fac e Wate rs December 2011 3
While the MPCA’s monitoring and assessment efforts primarily follow the major watershed schedule, interested parties are able to propose additional listings outside of the watershed schedule during the public notice of the draft TMDL List. This proposal process is intended to accommodate instances when assessment and listing outside of the watershed schedule is necessary for a locally led initiative to move forward. To honor the watershed schedule and maintain the integrity of the systematic approach to monitoring/assessment, TMDL development, and implementation, any proposals for listing outside of the watershed schedule must 1) explain why moving forward with assessment is necessary prior to the comprehensive watershed assessment, 2) document how the efficiency and coordination that is lost by deviating from the watershed approach will be offset by a local benefit, and 3) demonstrate that the MPCA’s assessment methods in this Guidance were followed for the monitoring, analysis, and comparison of the data against state standards. The MPCA will review the proposal and make the determination regarding impairment and listing prior to submitting the draft list to EPA for approval.

G u id an ce Man ua l for A sses s ing th e Minne sota Po l lut ion Contro l Age n cy Qua l i ty o f Minne sota Sur fac e Wate rs December 2011 4
II. Purpose and Scope A. About the assessment guidance
The purpose of this Guidance is to define the required data and information and lay out the criteria by which waterbodies are assessed to determine if beneficial uses are supported.
The scope of this Guidance includes methods for assessing surface waters for the following beneficial uses:
• Aquatic Life (toxicity-based standards, conventional pollutants, biological indicators)
• Drinking Water and Aquatic Consumption (human health-based standards)
• Aquatic Consumption (wildlife-based standards)
• Aquatic Recreation (E. coli bacteria, eutrophication)
• Limited Value Resource Waters (toxicity-based standards, bacteria, conventional pollutants)
B. Disclaimers and future changes to the Guidance To people not involved with conducting water quality assessments, the determination of an impaired condition would seem to be a straight-forward process: waters are either impaired or not impaired. However, the assessment process can be very complex and it includes a certain amount of uncertainty. The Minnesota Pollution Control Agency (MPCA) must consider many different types and sources of data, different categories of pollutants, different uses of surface waters, the variability in natural systems, and many other variables. The goal of this Guidance is to accurately and completely describe the assessment methods, and to make the assessment process as clear and understandable to all parties as possible. Nevertheless, questions about the assessment process will invariably arise that the Guidance fails to answer. Readers are encouraged to access the many resources listed in Section XI, including MPCA staff, for additional information. Two MPCA products which may be especially useful and related to this Guidance are the Volunteer Surface Water Monitoring Guide (MPCA 2003) [http://www.pca.state.mn.us/water/monitoring-guide.html] and the Data Access Website [http://www.pca.state.mn.us/hqzq64e]. The Monitoring Guide provides information on planning a monitoring program, as well as data quality and management. The Data Access Website allows Minnesotans to access environmental data on surface waters statewide.
This Guidance does not affect the rights and administrative procedures available to all affected or interested parties. The Guidance is not part of any water quality rule – it does not have the force of law. It serves to guide the interpretation and application of current water quality standards that are in water quality rules. If any party feels that an MPCA decision based on the Guidance is not supported by the facts, or they have any issue related to the MPCA’s use of the Guidance, that party can comment or challenge the MPCA’s actions in the following ways:
• Directly contact MPCA staff, management, or the Commissioner, orally or in writing.
• Request that the issue be brought before the MPCA Citizens’ Board for hearing.
• Request a contested case hearing if the issue involves an MPCA permit action, or any other MPCA action for which a contested case hearing is an appropriate forum to resolve the concern.
• Challenge the MPCA action in the appropriate legal jurisdiction.
The MPCA updates this Guidance every two years since that is the current EPA mandated schedule for preparation of both the integrated narrative report and the 303(d) list. The MPCA involves the public when major changes to the Guidance are being considered.

G u id an ce Man ua l for A sses s ing th e Minne sota Po l lut ion Contro l Age n cy Qua l i ty o f Minne sota Sur fac e Wate rs December 2011 5
C. Other standards Other toxic or conventional pollutants that are found to exceed water quality standards will be assessed following equivalent methodologies discussed in this guidance, depending on the type of pollutant. Methodologies will be developed and included in this document as new pollutants are added to the assessment process.

G u id an ce Man ua l for A sses s ing th e Minne sota Po l lut ion Contro l Age n cy Qua l i ty o f Minne sota Sur fac e Wate rs December 2011 6
III. Assessment Process As noted in the Introduction, the MPCA redesigned the assessment process during the time between the 2010 and 2012 listing cycles. As mentioned in the agency’s Continuing Planning Process document (see http://www.pca.state.mn.us/yhiz926 under “Reports”), the shift to watershed-based monitoring and restoration/protection approach with a rotating 10-year watershed schedule resulted in a need for annual assessments. This adjustment along with the large amount of data that this new approach provides presented a timely opportunity to redesign the assessment process (MPCA 2010). As discussed in Minnesota’s Water Quality Monitoring Strategy 2011-2021, this process is designed to combine computerized data analysis, expert review, and internal and external partner input to use all available data and information to determine the appropriate assessment decisions for a number of beneficial uses (drinking water, aquatic life, recreation, and consumption, and limited use waters) (MPCA 2011).
A. Steps in the assessment process The redesigned process expands upon the data analysis steps of the previous assessment process. While this new process focused on the aquatic life use assessments in rivers and streams, concepts of the redesigned process have also influenced how other designated uses (e.g., aquatic recreation) are assessed. Additional reviews at the parameter level and the addition of an internal comprehensive review, prior to the professional judgment group meeting, are the largest changes. These changes reflect the increased volume and complexity of the data gathered during the intensive watershed monitoring effort, and help ensure a robust decision about the appropriate management actions to be pursued for each assessment unit (waterbody, or AUID) in the planning and implementation phases of the watershed approach (i.e. restoration for impaired waters, and protection for unimpaired waters). Further detail on the specific steps in the process is included below. A note should be made that the aquatic consumption (fish) assessment at this time utilizes only the first two steps in the process.
1. Data Compilation (pre-assessments)
The initial step in the process is a computerized screening that identifies monitoring results collected on AUIDs over the appropriate period of record and compares each data point to water quality criteria, summarizes the number of data points that exceed the criteria, the total number of data points, and the number of years of data. This step produces a parameter-specific pre-assessment (e.g., DO, Fish IBI, and E. coli).
2. Expert review
This stage involves a review of automated pre-assessments for quality assurance that the computerized screening captured the appropriate data and is properly calculating the pre-assessments (particularly important when new assessment methods or new parameters are added). Also included in this stage are additional analysis and review steps required for several parameters (e.g. E. coli, chloride, un-ionized ammonia, nitrate) prior to the calculation of the pre-assessment.
3. Desktop assessment
The desktop assessment involves a review of pre-assessments by resource-specific staff (e.g. water quality staff review chemistry data, biologists review biological data) for waterbodies within a specific 8-digit hydrologic unit code watershed (HUC-8). This review considers multiple lines of evidence – review of flow conditions, precipitation, land use, habitat, etc. – in addition to the pre-assessment to ascertain the quality of the dataset (temporal and spatial completeness, etc.) and whether the parameter is meeting or exceeding the criterion. During this process any candidates for delisting or natural background review are identified and work begins to determine if those AUIDs meet the criteria to be removed from the TMDL List.

G u id an ce Man ua l for A sses s ing th e Minne sota Po l lut ion Contro l Age n cy Qua l i ty o f Minne sota Sur fac e Wate rs December 2011 7
4. Watershed Assessment Team (WAT)
Joint internal meeting of the MPCA personnel involved in the individual desktop assessments, the regional watershed project manager and stressor identification staff for a specific HUC-8. In this meeting each AUID is reviewed, considering comments and parameter-level evaluations from the desktop assessment as well as supplemental information, to reach an overall use-support decision. Delisting and natural background candidates may also be identified at this time.
5. Professional Judgment Group (PJG)
The PJG meeting is a joint meeting of WAT and external parties (local data collectors, local government units, etc. as determined by the MPCA regional watershed project manager) to discuss the results of the WAT meeting for a specific HUC-8. Prior to the PJG meeting, the results of the WAT meeting are distributed to all invitees, including parameter-level evaluations, overall use-support recommendations and all comments. Invitees are asked to identify AUIDs they wish to discuss; an agenda is developed based on these submissions. The format of this meeting, instead of an exhaustive review of each AUID, is an overview of the process, a general discussion of the watershed and major subwatersheds and a review of requested AUIDs, delisting and natural background candidates. The results of this meeting are the final use-support determinations.
The analyses and recommendations for each AUID are documented in a transparency database that is archived following the completion of the assessments. Throughout the annual assessment process, care is taken to maintain consistency among the HUC-8 assessment meetings and decisions. This is accomplished via internal training and quality control, the assignment of individual staff to multiple HUC-8 data sets for the expert review and desktop assessments, “cross-pollination” of WATs, and the oversight and guidance provided by a Technical Team and management team charged with ensuring quality data analysis and consistency among watershed assessment discussions and decisions.

G u id an ce Man ua l for A sses s ing th e Minne sota Po l lut ion Contro l Age n cy Qua l i ty o f Minne sota Sur fac e Wate rs December 2011 8
IV. General Aspects of Data Assessment A. Delineation of reaches, lakes, and wetlands
Assessments of use support in Minnesota are made for individual waterbodies. The waterbody unit used for river systems, lakes, and wetlands is called the “assessment unit”. A river assessment unit usually extends from one significant tributary to another or from the headwaters to the first significant tributary and is typically less than 20 miles in length. The river may be further divided into two or more assessment units when there is a change in the use classification (as defined in Minn. R. ch. 7050), or when there is a significant morphological feature such as a dam, or a lake within the river.
The MPCA uses the 1:24,000 scale high resolutions National Hydrography Dataset (NHD) to create geospatial data to represent stream and lake assessment units. All of our assessment units are indexed to the NHD, or have had custom shapes created for addition to the NHD. The high resolution NHD was created from 1:24,000 scale USGS DLG’s (United States Geological Survey Digital Line Graphs) and Minnesota Department of Natural Resources (MDNR) stream and lake data.
Each waterbody is identified by a unique waterbody identifier code called an assessment unit identification or AUID. For streams, the code is comprised of the USGS eight digit subbasin code plus a three character code that is unique within each subbasin. It is for these specific reaches that the data are evaluated for potential use impairment. The MPCA consults with border states during the assessment process and documents reasons for any discrepancies in assessment determination between Minnesota and the specific border state.
The Protected Waters Inventory (MDNR) is the source for lake and wetland identifiers. MDNR uses an 8 digit identifier for waterbodies, consisting of a 2 digit prefix that represents county, 4-digit number identifying a lake, and a 2-digit suffix that represents either a whole lake (-00) or representing a specific bay of a lake (-01, -02, etc.). This 8-digit identifier is used by MPCA to represent an assessment unit for lakes and wetlands. Waterbodies determined to be wetlands will not be assessed using the eutrophication factors discussed in Section VIII.B; factors used to identify wetlands can be found in Appendix A.
Currently, the MPCA is only monitoring and assessing depressional open water/emergent wetlands. Assessed wetlands that were not included in the Protected Waters Inventory are assigned unique identification numbers by the MDNR using the same eight-digit format. Wetland assessment unit delineations are based on the National Wetland Inventory (NWI) digital data set. However, if there has been significant alterations (e.g., drainage, filling) in the wetland basin since the NWI (i.e., aerial photographs used to generate these maps were obtained in the late 70s/early 80s), assessment unit boundaries were modified to reflect these changes using Geographic Information System software and current aerial imagery.
Typically, the listing of impaired waters is by individual assessment unit. The major exception to this is the listing of rivers for contaminants in fish tissue. Over the time it takes fish, particularly game fish, to grow to “catchable” size and accumulate pollutants to unacceptable levels there is a good chance they have moved considerable distance to the site where they were sampled. The impaired reach is defined by the location of significant barriers to fish movement such as dams upstream and downstream of the sampled reach. Thus, the impaired reaches often include several assessment units, and for lakes, will include all bays on the lake (may be listed under the -00 suffix, representing the entire waterbody).
B. Period of record The MPCA uses data collected over the most recent 10-year period for all the water quality assessments considered for 303(d) impairments. Years of record are based on the USGS water year. Water years are from October 1 of one year through September 30 of the following year. It is preferable to split the year in the fall, when hydrological conditions are usually stable, than to use calendar years. A full 10 years of data are not required to make an assessment.

G u id an ce Man ua l for A sses s ing th e Minne sota Po l lut ion Contro l Age n cy Qua l i ty o f Minne sota Sur fac e Wate rs December 2011 9
The MPCA uses a period as long as 10 years in its assessments for several reasons. It provides reasonable assurance that data will have been collected over a range of weather and flow conditions and that all seasons will be adequately represented. From a practical standpoint, the 10-year period means there is a better chance of meeting the minimum data requirements.
C. Values below detection The concentrations of some pollutants in surface waters, particularly the highly bioaccumulative pollutants, may be below standard analytical detection limits. That is, the true concentration may be below the ability of the analytical method to measure. It may be difficult to determine in advance of monitoring whether ambient concentrations will be below detection. Thus, data sets that include values below the level of detection, or “less than values” are a possibility. Best professional judgment will be used in the assessment of these data sets, taking into account such information as the following:
• the relative number of “less-than” values compared to the number of “detects”
• the extent the “detects” are above the method detection limit
• the magnitude of the difference between the method detection limit, the chronic standard, and expected ambient concentrations
• information from data in other media such as fish tissue or sediment data
Re-sampling in these situations may be necessary if new analytical methods with lower method detection limits have become available. Values below the level of detection, even if greater than the standard, will not be considered an exceedance of the standard. Values below the level of detection will be considered a data point for the purposes of meeting the minimum data requirement.
Fish tissue analytical results below detection are assigned a value equal to one half the method detection limit for use in assessments. For pollutants other than those measured in fish tissue, if values below the level of detection must be assigned a number in order to include them in the calculation of an average, the formula shown below is used. A geometric or log mean is used to calculate a mean for data sets that include “less thans” when the data are not normally distributed. This formula adjusts the assigned value downward as the number of “less thans” goes up, relative to the total number of values, and vice versa.
Number of values < LOD Value assigned to “less thans” = LOD (1 - -----------------------------------)
Total number of values
Where LOD = level of detection
D. Uncertainty in water quality assessments The MPCA is very cognizant of the hazards of making assessments with limited data. One benefit of the watershed monitoring approach is that it provides a more robust dataset for assessment. The selection of the minimum data requirements for water quality assessment is clearly a compromise between the need to assess as many waterbodies as possible and the importance of minimizing the probability of making an erroneous assessment. The methods described in this Guidance deal with this problem in a variety of ways, depending on the pollutant category. Nonetheless, some level of uncertainty is part of every analysis of water quality data. There is always a chance that a waterbody will be assessed as impaired when in fact it is not or assessed as un-impaired when in fact it is. The number of data points the MPCA requires as a minimum for water quality assessments is small in the context of statistical analyses of uncertainty. The approach used by the MPCA to make impairment decisions, which is a screening of the data using the impairment thresholds, followed by a review by professionals, makes the best use of limited data. This is the approach recommended by the EPA.

G u id an ce Man ua l for A sses s ing th e Minne sota Po l lut ion Contro l Age n cy Qua l i ty o f Minne sota Sur fac e Wate rs December 2011 1 0
Essentially all assessments are subject to review by a team of professional water quality experts (see next section). Review of the data by professionals is a very important part of minimizing erroneous impairment determinations, and this review would be required whether or not statistical tests are used. The possible erroneous placement of a waterbody on the 303(d) impaired list is a concern because of the regulatory and monetary implications of 303(d) listing. It has been the experience of the MPCA that very few waterbodies have been incorrectly determined to be impaired.
When the professional review of data collected for a lake or stream finds conflicting or inadequate information to make a confident assessment, and more monitoring could resolve the need, notes are recorded in the transparency database and discussions are had with monitoring programs to determine if additional sampling can be pursued.
E. Data sources and quality Data for assessments are queried primarily from MPCA’s water-quality data management system, EQuIS; a limited amount of data from outside that system is also included in the process. However, to allow for the external data to be included in the process, it must be submitted to MPCA in time for incorporation into the assessment tables; this date is announced via a call for data and is typically November 1st prior to the start of the assessments.
The data used in assessment decisions must be of reliable quality and QA/QC protocols must be carefully followed for each step along the way from field sampling to lab analysis to data management in order to reduce the introduction of errors. Monitoring and data management at the MPCA are performed in accordance with the requirements specified in a Quality Management Plan approved by the EPA and available for review on the MPCA website at http://www.pca.state.mn.us/index.php/view-document.html?gid=5479.
The MPCA watershed assessment process assigns a quality rating to individual assessment parameters used to assess aquatic life, aquatic consumption, and aquatic recreation. The Assessment Database (ADB) requires that a four tiered assessment confidence rating system be used for each type of data included in the use-support assessment.
F. Dataset quality and parameter-level evaluation As noted previously, a key step in the assessment process is to determine if individual parameters meet or exceed their criteria (numeric or narrative standards) or have insufficient data to make that determination. In addition to this comparison against standards, the evaluator also makes a determination of dataset quality, assigning a low, medium, or high quality rating (Table 1). These results are stored in a working database and used in the WAT reviews and PJG meetings, with supporting information, to make the final use-support determinations.
For some parameters, the parameter-level evaluation is equivalent to the final use assessment decision (e.g. aquatic consumption). The dataset quality for many of these parameters uses the ADB categories for data quality for the use determination, instead of the matrix in Table 1. For other parameters (e.g. conventional chemistry, biota, bacteria), the parameter-level evaluations are then used in conjunction with supporting data, including dataset quality, to make a final use-support determination. This will be discussed further in specific sections that follow (i.e. aquatic life, aquatic recreation).
To assist in parameter-level evaluations, MPCA has developed guidance for technical staff to use in their analyses (Table 2). The 10 percent and 25 percent exceedance frequencies referenced in Table 2 for conventional pollutants are based on EPA guidance (EPA 1997) and have been used by the MPCA in assessments for many years. These thresholds are appropriate for the conventional category of pollutants for several reasons, including that none are considered “toxic” (or bioaccumulative), and all are subject to periodic “exceedances” because of natural causes. For example, turbidity typically increases in streams after a rain event even in relatively undisturbed parts of the state and dissolved oxygen can drop below the standard in low gradient rivers and streams for reasons other than

pollution, such as the AUID is located downstream of or flows through extensive wetland complexes. These potential pollutants are also natural characteristics of surface waters, the fluctuations of which aquatic organisms have adapted to cope with over time. The existence and extent of natural exceedances are considered during the assessment process.
It should be emphasized that the elements outlined in Tables 1 and 2 are not prescriptive rules, but rather are guidelines as to the types of considerations that are part of the water quality assessments.
The dataset quality rating and notes about the parameter-level evaluation are recorded in the transparency database for use by the Watershed Assessment Team (WAT) and Professional Judgment Group (PJG) in making the use-support assessment. The technical staff that completed the parameter-level evaluations participates in the WAT and PJG meetings.
Table 1. Indicator Quality Rating for Conventional Pollutants* for Assessing Aquatic Life Use in Streams (each pollutant rated independently).
* DO, pH, Turbidity/TSS/T-Tube, and Temperature
Rating Data Quantity/Technical Components
Data Spatial/Temporal coverage Data Currency
low - Data of insufficient quantity to provide good indication of overall conditions
- Diurnal cycle not represented (where applicable)
- Spatially, data very localized and do not provide good representation of overall reach
- Temporally, data cover limited portion of monitoring season or limited to single year
- Data biased towards certain types of conditions
Data do not reflect current conditions:
-Majority of data greater than 5 years old
-Significant changes in watershed since data collected
medium - Data of sufficient quantity to provide good indication of overall conditions AND
- Diurnal cycle not represented (where applicable)
- Spatially, data provide good representation of overall reach OR
- Temporally, data cover entire monitoring season through multiple years AND
- Data representative of overall conditions rather than biased towards certain types of conditions
Data older than ideal, but reasonable indicator of current conditions:
-Majority of data greater than 5 years old
-No significant changes in watershed since data collected
high - Extensive data set (many grab or probe measurements, or continuous monitoring) to provide good indication of overall conditions
- Diurnal cycle properly represented (where applicable)
- Spatially, data provide good representation of overall reach
- Temporally, data cover entire monitoring season through multiple years
- Data representative of overall conditions rather than biased towards certain types of conditions
Data reflect current conditions:
-Majority of data less than 5 years old
-No significant changes in watershed since data collected
G u id an ce Man ua l for A sses s ing th e Minne sota Po l lut ion Contro l Age n cy Qua l i ty o f Minne sota Sur fac e Wate rs December 2011 1 1

Table 2. Guidelines for parameter-level evaluations of conventional pollutants. Most parameters will have data sets that only allow frequency and magnitude to be evaluated. When sufficient data exist (e.g., continuous monitoring or extensive grab samples) or appropriate ancillary data (e.g., flow, precipitation) are accessible, duration or timing of exceedances may also be considered in the evaluation. The parameter-level evaluation requires best professional judgment to integrate information across all applicable columns.
1Based on evaluation of available flow data and/or precipitation records as well as observations made by monitoring staff.
Assessment Frequency of Exceedances
Magnitude of Exceedances
Duration of Exceedances Timing of Exceedances1
Water Chemistry Parameter Indicating Unimpaired or Supporting Conditions
Less than 10% exceedances of chronic standard
Exceedances generally within 10% of water quality criteria
Continuous data or extensive grab sample data set indicates no or few instances of prolonged exceedance
Exceedances only occurring during extreme events such as 100 year flood (e.g., TSS) or severe drought conditions (e.g., DO)
Water Chemistry Parameter Indicating Potential Impairment
Between 10 – 25% exceedances of chronic standard
Exceedances generally greater than 10% but less than 25% of water quality criteria
Continuous data or extensive grab sample data set indicates some instances of prolonged exceedance
Exceedances only occurring during periods in which they are most likely to occur (e.g., before 9 am, 7Q10 low flow, storm events, etc.); not counting extreme events above
Water Chemistry Parameter Indicating Potential for Severe Impairment
Greater than 25% exceedances of chronic standard
Exceedances generally greater than 25% of water quality criteria
Continuous data or extensive grab sample data set indicates chronic exceedance or many instances of prolonged exceedance
Exceedances occurring during periods (seasonal or daily cycle) in which they typically do not occur in addition to occurring in periods in which they are most likely to occur.
G. Reporting MPCA reports the results of the assessments in a number of different formats, in watershed assessment reports (HUC-8), and in the integrated report (narrative report, ADB data, and geospatial data). A brief description of each is below.
1. Watershed Monitoring and Assessment Report
Results of the assessments are compiled in a watershed monitoring and assessment report following the assessment determinations. AUIDs are discussed by sub-watersheds and overall water quality conditions, potential stressors, and protection areas are identified. These documents inform the restoration (TMDL) and protection strategies that are developed by the agency. An example of a watershed assessment report can be found at http://www.pca.state.mn.us/dm0rde2.
2. Integrated Reporting
The results of the assessments are reported as directed by guidance from EPA. The assessment decisions are loaded into EPA’s Assessment Database (ADB) (Currently Version 2.3.1). Categories and subcategories used to categorize each assessment unit in the ADB can be found in Appendix B. Each designated use is identified as “full support”, “not support,” “insufficient information,” or “not assessed” as a result of the assessments. In addition, the use assessment data types are rated per the levels in the ADB. Impaired use/pollutant combinations without approved TMDL plans or otherwise determined to be category 4 impaired waters are extracted from the ADB and make up the 303(d) list. In conjunction with the ADB upload, a narrative report to the US Congress as required by section 305(b) of the Clean Water Act (CWA) is developed. An Integrated Report consisting of the narrative report, the ADB data, a 303(d) list and NHD indexed geospatial data are completed and submitted to EPA by April 1 every even year.
G u id an ce Man ua l for A sses s ing th e Minne sota Po l lut ion Contro l Age n cy Qua l i ty o f Minne sota Sur fac e Wate rs December 2011 1 2

G u id an ce Man ua l for A sses s ing th e Minne sota Po l lut ion Contro l Age n cy Qua l i ty o f Minne sota Sur fac e Wate rs December 2011 1 3
V. Protection of Aquatic Life A. Pollutants with toxicity-based water quality standards
Protection of “aquatic life” with applicable Class 2 chronic standards means protection of the aquatic community from the direct harmful effects of toxic substances, and protection of human and wildlife consumers of fish or other aquatic organisms. This section of the Guidance deals with the former, the assessment of water quality for pollutants that have toxicity-based chronic standards and acute or Maximum Standards (MS) that are always aquatic life-toxicity based.
Surface waters are assessed to determine if they are of a quality needed to support the aquatic community that would be found in the river or stream under natural conditions. In general, two types of data are used in assessments: water chemistry data and biological data. Pre-assessments based on chemistry data and biological data are both considered, along with data quality indicators, in aquatic life use-support determinations.
1. Pollutants
The pollutants that have toxicity-based standards most often included in MPCA water quality assessments are briefly discussed. Pollutants other than those mentioned here may be assessed also, as data allow.
a) Trace metals
Trace metals with toxicity-based standards used in water quality assessments include cadmium, chromium, copper, lead, nickel, selenium and zinc. Mercury is discussed in the Chapter V, because it has a human health-based standard.
The MPCA water quality standards for trace metals are listed as “total” metal in both Minn. R. chs. 7050 and 7052, but they are applied to ambient waters as “dissolved” metal standards. The total standard is multiplied by the appropriate conversion factor to convert it to a dissolved standard. The change from total to dissolved metal standards is based on substantial evidence that the dissolved analysis better estimates the toxic fraction of metals in most natural waters. It is EPA policy that metal standards should be in the form of dissolved metal (EPA 1993). Total and dissolved metal data will be used in the assessments until there are adequate data to switch completely to dissolved metal data. Total metal data will be compared to total metal standards and dissolved data will be compared to dissolved standards.
The acute and chronic standards for cadmium, chromium III, copper, lead, nickel, and zinc vary with ambient total hardness. Thus, the standards for these metals are in the form of formulas that reflect the hardness/toxicity relationship. Each measured value for a hardness-dependent metal is compared to an individually calculated standard based on the hardness at the same time and place the metal sample was taken.
Water quality assessments using Class 2 water quality standards [Std] for trace metals listed as “Total,” include the following metals: Aluminum, Antimony, Arsenic, Cadmium, Chromium III, Chromium VI, Cobalt, Copper, Lead, Mercury, Nickel, Selenium, Silver, Thallium, and Zinc (Figure 1).

Figure 1. Use of trace metals data for total metals standards
Chronic Standard (Std) for Trace Metal (total)
Toxicity-based Human health-based Convert Std to dissolved Std No conversion to dissolved Std
Multiply total Std by adjustment Compare Std to total [unfiltered] factor in Minn. R. 7050.0222, subp. 9 analysis of ambient water
If factor <1.0 If factor =1.0, or no factor listed, (dissolved Std then factor = 1.0. total and is < total Std) dissolved Std are equal (adjustment factor is never > 1.0)
G u id an ce Man ua l for A sses s ing th e Minne sota Po l lut ion Contro l Age n cy Qua l i ty o f Minne sota Sur fac e Wate rs December 2011 1 4
Result is dissolved Std
Compare dissolved Std to dissolved ambient data (filtered sample)
Hypothetical example: Total Copper Std = 15 μg/L @ a hardness of 200 mg/L
Total Std = 15 μg/L, toxicity-based; factor = 0.960; Dissolved Std = 14.4 μg/L (15 μg/L X 0.960)
Therefore, compare the 14.4 μg/L dissolved std to the dissolved ambient copper analysis to assess for compliance with water quality standards.
b) Un-ionized ammonia Ammonia at elevated levels in the un-ionized form (NH3) is toxic to aquatic life. The chronic un-ionized ammonia standards are shown below:
• Class 2A. 0.016 mg/L un-ionized ammonia
• Class 2Bd, B, C, D. 0.04 mg/L un-ionized ammonia
The fraction of total ammonia in the un-ionized form in water is dependent on ambient pH and temperature. Therefore, pH and temperature as well as total ammonia must be measured at the same time and place to determine the un-ionized ammonia concentration.
c) Chloride Besides being a general indicator of human impacts on water quality, high levels of chloride can harm aquatic organisms, possibly by interfering with the organism’s osmoregulatory capabilities. The Class 2 chronic standard for chloride is 230 mg/L. Starting with the 2012 assessment reporting cycle, MPCA is assessing lakes against the existing chloride standard.

G u id an ce Man ua l for A sses s ing th e Minne sota Po l lut ion Contro l Age n cy Qua l i ty o f Minne sota Sur fac e Wate rs December 2011 1 5
2. Data requirements and determination of impaired condition
Exceedances of standards for toxic pollutants are evaluated over consecutive three-year periods (see Table 3). Two or more exceedances of the chronic standard in three years are considered an impairment. One exceedance of the maximum standard in three years indicates impairment. A minimum of five data points is generally desirable for assessments, but impairment determinations may be made with fewer data points when appropriate. If more than one sample was taken within a four-day period for flowing waters the values are averaged (usually an arithmetic mean is appropriate) and the four-day average is counted as one value in the assessment. When appropriate, for instance when taken at low flow, single measurements can be considered reasonable representations of four-day averages.
For lakes, depth of sample must be taken into consideration, as chloride concentrations increase with depth. The standard is applied to individual samples collected a minimum of four days apart for lakes.
The protocol for evaluating three-year intervals is to look first for exceedances in the most recent three years of available data. This is followed by a search for exceedances in any three-year interval containing the minimum five data points. The three-year intervals may overlap but the years must be consecutive. The selection of appropriate three-year intervals may be made by a professional judgment group. Most, if not all, impairment determinations for toxic pollutants will be reviewed by a professional judgment group.
Table 3. Summary of data requirements and exceedance thresholds for assessment of pollutants with toxicity-based standards.
Period of Record
Minimum No. of Data Points*
Use Support or Listing Category Based on Exceedances of
Chronic Standard**
Chronic Standard Exceedance Threshold
No more than 1 in 3 years 2 or more in 3 yrs.
Most recent 10 years
5, within a 3-yr. period Not Listed Listed
* 4-day central (mean or median) values for streams; individual values 4 days apart for lakes ** One exceedance of the maximum standard in three years is considered Not Supporting
B. Conventional pollutants and biological indicators Conventional pollutants or water quality characteristics most often included in MPCA water-quality assessments are dissolved oxygen, pH, temperature, and turbidity. Turbidity is measured directly or estimated from transparency tube and/or total suspended solids measurements. Biological indicators (fish and invertebrates in streams, and invertebrates and plants in wetlands) are also currently evaluated in MPCA assessments. Biological indicators for lakes are under development and not yet available for use in assessments.
Pre-assessments based on chemistry data and biological data are both considered, along with data quality indicators and supporting information, in aquatic life use-support determinations. Not all data types are available for all AUIDs, and not all datasets agree. The following paragraphs describe the parameter-level data that inform aquatic life use-support determinations and the process for evaluating the parameter-level and supporting data to make such decisions.
1. Pollutant or water quality characteristic
The conventional pollutants most often included in MPCA water quality assessments are briefly described. Pollutants other than those mentioned here may be assessed also, as data allow.

G u id an ce Man ua l for A sses s ing th e Minne sota Po l lut ion Contro l Age n cy Qua l i ty o f Minne sota Sur fac e Wate rs December 2011 1 6
a) Low dissolved oxygen Dissolved oxygen (DO) is required for essentially all aquatic organisms to live. When DO drops below acceptable levels, desirable aquatic organisms, such as fish, can be killed or harmed. Dissolved oxygen standards differ depending on the use class of the water:
• Class 2A. Not less than 7 mg/L as a daily minimum
• Class 2Bd, 2B, 2C. Not less than 5 mg/L as a daily minimum
• Class 2D. Maintain background
• Class 7. Not less than 1 mg/L as a daily average, provided that measurable concentrations are present at all times
Because of the seasonal and diurnal variability in DO concentrations, data sets of only 10 independent observations are seldom sufficient to provide the basis for a confident assessment. For this reason, a total of 20 independent observations are required for DO assessments. In open water months (April through November) measurements should be made before 9:00 am in order to measure the lowest diurnal DO concentration.
A stream is considered impaired if 1) more than 10 percent of the “suitable” (taken before 9:00) May through September measurements, or more than 10 percent of the total May through September measurements, or more than 10 percent of the October through April measurements violate the standard, and 2) there are at least three total violations. A designation of “full support” for DO requires at least 20 suitable measurements from a set of monitoring data that give a representative, unbiased picture of DO levels over at least two different years.
b) pH The pH of water is a measure of the degree of its acid or alkaline reaction. The applicable pH standard for most Class 2 waters is a minimum of 6.5 and a maximum of 8.5, based on the more stringent of the standards for the applicable multiple beneficial uses. pH values that are outside the range of the standard because of natural causes are not considered exceedances.
c) Turbidity Turbidity is caused by suspended soil particles, algae, etc., that scatter light in the water column making the water appear cloudy. Exceedance of the turbidity standard, especially for prolonged periods of time, can harm aquatic life. Aquatic organisms may have trouble finding food, gill function may be affected, and spawning beds may be covered.
Turbidity is measured in nephelometric turbidity units (NTU). The standards are shown below:
• 10 NTU, Class 2A waters
• 25 NTU, Class 2Bd, B, C, D waters
Transparency and total suspended solids (TSS) values reliably predict turbidity and can serve as surrogates at sites where there are an inadequate number of turbidity observations. A transparency tube measurement of less than 20 centimeters indicates a violation of the 25 NTU turbidity standard. For TSS, a measurement of more than 60 mg/L in the Western Corn Belt Plains (WCBP) and Northern Glaciated Plains (NGP) ecoregions or more than 100 mg/L in the North Central Hardwood Forest (NCHF) ecoregion indicates a violation.
Turbidity is a highly variable water quality measure. Because of this, a total of 20 independent observations are required for a turbidity assessment. The observations should allow for confident characterization of a percent exceedance of the water quality standard (i.e. the data should not be disproportionately composed of event samples). If sufficient turbidity measurements exist, only turbidity will be evaluated. If there are insufficient turbidity measurements, any combination of independent turbidity, transparency, and total suspended

G u id an ce Man ua l for A sses s ing th e Minne sota Po l lut ion Contro l Age n cy Qua l i ty o f Minne sota Sur fac e Wate rs December 2011 1 7
solids observations may be evaluated. If there are multiple observations of a single parameter in one day, the mean of the values will be used.
If there are observations of more than one of the three parameters in a single day, the hierarchy of consideration for assessment purposes will be turbidity, then transparency, then total suspended solids. For a water body to be listed as impaired for turbidity, at least three observations and 10 percent of observations must be in violation of the turbidity standard.
The MPCA has not analyzed enough data on Class 2A waters to determine transparency or TSS thresholds for violation of the 10 NTU standard. However, if turbidity related data (turbidity, t-tube, TSS) data indicate impairment on a Class 2A water (based on the 25 NTU standard), the waterbody is assessed as impaired for turbidity.
d) Temperature High water temperatures, or rapid elevations of temperature above ambient, can be very detrimental to fish. Cold water fish such as trout are particularly intolerant of high temperatures. The temperature standard for Class 2A cold water sport fish is a narrative statement of “no material increase”. A demonstration of a “material increase” means that temperature data must show a statistically significant increase when measured, for example, upstream and downstream of a stream modification, upstream and downstream of a point or nonpoint heat source, or before and after a modification that might impact stream temperature. Temperatures must be for similar time frames such as weeks or seasons. The larger the data set, the finer the precision in determining whether a material increase in stream temperature has occurred.
Currently the MPCA is evaluating only cold water fisheries for temperature caused impairment because of the special sensitivity of cold water fish to elevations in temperature.
e) Biological indicators The presence of a healthy, diverse, and reproducing aquatic community is a good indication that the aquatic life beneficial use is being supported by a lake, stream, or wetland. The aquatic community integrates the cumulative impacts of pollutants, habitat alteration, and hydrologic modification on a waterbody over time. Monitoring the aquatic community, or biological monitoring, is therefore a relatively direct way to assess aquatic life use support. Interpreting aquatic community data is accomplished using an index of biological integrity or IBI. The IBI incorporates multiple attributes of the aquatic community, called “metrics”, to evaluate a complex biological system. MPCA has developed fish and invertebrate IBIs to assess the aquatic life use of rivers and streams in Minnesota as well as plant and invertebrate IBIs to assess depressional wetlands. At this time, IBIs for aquatic communities in lakes are under development and not yet available for use in assessments.
Further interpretation of aquatic community data is provided by an assessment threshold or biocriteria against which an IBI score can be compared. In general, an IBI score above this threshold is indicative of aquatic life use support, while a score below the threshold is indicative of non-support. Currently, Minnesota is using a combination of two similar concepts to set biocriteria: the Biological Condition Gradient (BCG) and reference condition. To develop biocriteria that are protective of the structural and functional health of biological communities, Minnesota used the median of BCG level 4. Communities at the middle of this level can be best characterized as possessing “overall balanced distribution of all expected major groups; ecosystem functions largely maintained through redundant attributes” which is in line with the language of the CWA interim goal. This BCG-derived criteria was then compared to criteria derived from reference sites to insure that the two approaches were closely aligned in each fish and invertebrate IBI class.
Bracketing each IBI assessment threshold is a 90 percent confidence interval that is based on the variability of IBI scores obtained at sites sampled multiple times in the same year (i.e.,

G u id an ce Man ua l for A sses s ing th e Minne sota Po l lut ion Contro l Age n cy Qua l i ty o f Minne sota Sur fac e Wate rs December 2011 1 8
replicates). Confidence intervals account for variability due to natural temporal changes in the community as well as method error. For assessment purposes, sites with IBI scores within the 90 percent confidence interval are considered “potentially impaired”. Upon further review of available supporting information, an IBI parameter review may change to ”indicating support” or ”indicating severe impairment” depending on the extent and nature of this additional information (see Figure 2).
For further information regarding the basis of biological assessment in Minnesota’s water quality standards, the development of the BCG for rivers and streams in Minnesota, and the selection of river and stream reference sites in Minnesota see Appendix C.

Figure 2. General diagram illustrating the characterization of individual biological indicator results.
Assessment threshold
Upper 90% Confidence Limit
Lower 90%Confidence Limit
Indicating Potential Impairment
Indicating Severe Impairment
Indicating Unimpaired or Supporting Conditions
IBI S
core
2. Data requirements and determination of impaired condition
Overall assessment of whether an AUID adequately supports aquatic life involves the review of the parameter-level evaluations and data quality in conjunction with all available supporting information (flow, habitat, precipitation, etc.) to make an overall use-support determination. For a given AUID, there may be chemistry indicator data, biological indicator data, or both types of data available for assessment. The final assessment takes into consideration the strength of the various indicators and the quality of the data sets and, in addition, looks at upstream and downstream conditions to gain a better understanding of the interactions between the individual AUID and the larger waterbody and watershed.
In general:
a) A stream reach is considered to be fully supporting of aquatic life if:
• IBI scores for all available assemblages indicate fully supporting conditions, or
• the criteria for both dissolved oxygen and turbidity/t-tube/total suspended solids are adequately met, and
• other lines of evidence considered comprehensively, including upstream/downstream conditions, do not contradict a finding of full support
b) A stream reach is considered to be not supporting if:
• IBI scores for at least one biological assemblage indicate impairment, or
• one or more water chemistry parameters indicates impairment, and
• other lines of evidence considered comprehensively, including upstream/downstream conditions, do not contradict a finding of non-support
c) If the above criteria are not met and the assessment is inconclusive, the result is a determination of insufficient information.
G u id an ce Man ua l for A sses s ing th e Minne sota Po l lut ion Contro l Age n cy Qua l i ty o f Minne sota Sur fac e Wate rs December 2011 1 9
G u id an ce Man ua l for A sses s ing th e Minne sota Po l lut ion Contro l Age n cy Qua l i ty o f Minne sota Sur fac e Wate rs December 2011 2 0
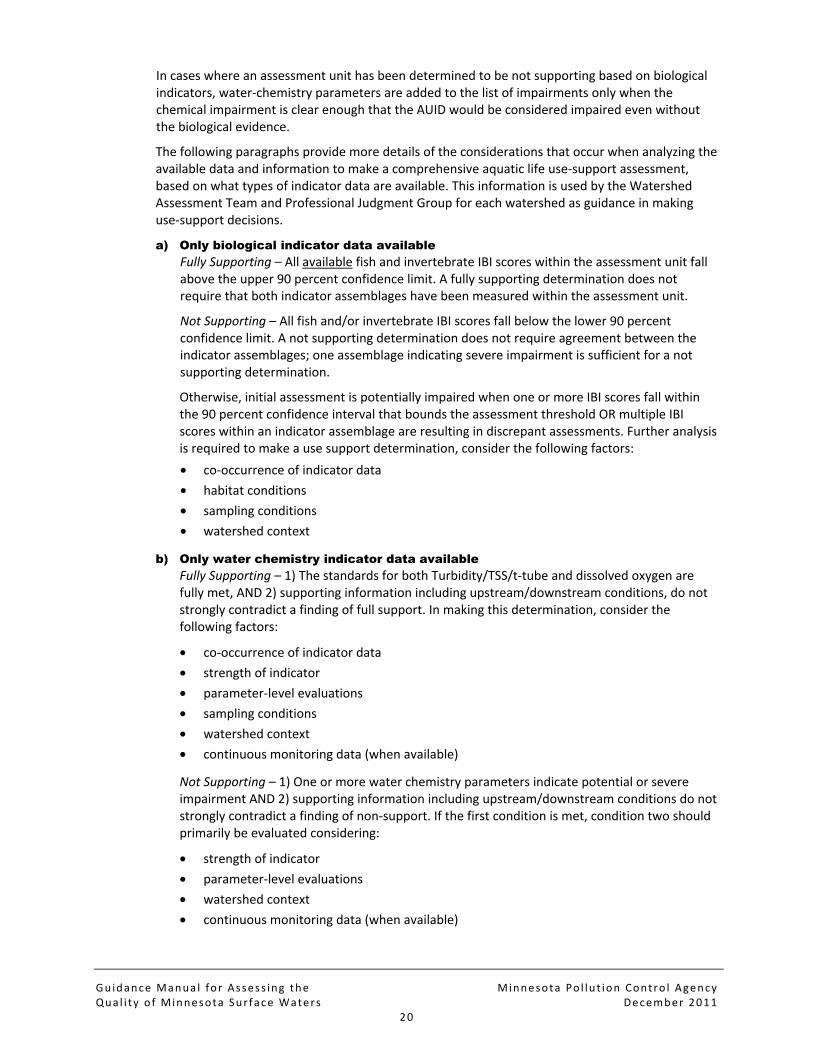
In cases where an assessment unit has been determined to be not supporting based on biological indicators, water-chemistry parameters are added to the list of impairments only when the chemical impairment is clear enough that the AUID would be considered impaired even without the biological evidence.
The following paragraphs provide more details of the considerations that occur when analyzing the available data and information to make a comprehensive aquatic life use-support assessment, based on what types of indicator data are available. This information is used by the Watershed Assessment Team and Professional Judgment Group for each watershed as guidance in making use-support decisions.
a) Only biological indicator data available Fully Supporting – All available fish and invertebrate IBI scores within the assessment unit fall above the upper 90 percent confidence limit. A fully supporting determination does not require that both indicator assemblages have been measured within the assessment unit.
Not Supporting – All fish and/or invertebrate IBI scores fall below the lower 90 percent confidence limit. A not supporting determination does not require agreement between the indicator assemblages; one assemblage indicating severe impairment is sufficient for a not supporting determination.
Otherwise, initial assessment is potentially impaired when one or more IBI scores fall within the 90 percent confidence interval that bounds the assessment threshold OR multiple IBI scores within an indicator assemblage are resulting in discrepant assessments. Further analysis is required to make a use support determination, consider the following factors:
• co-occurrence of indicator data
• habitat conditions
• sampling conditions
• watershed context
b) Only water chemistry indicator data available Fully Supporting – 1) The standards for both Turbidity/TSS/t-tube and dissolved oxygen are fully met, AND 2) supporting information including upstream/downstream conditions, do not strongly contradict a finding of full support. In making this determination, consider the following factors:
• co-occurrence of indicator data
• strength of indicator
• parameter-level evaluations
• sampling conditions
• watershed context
• continuous monitoring data (when available)
Not Supporting – 1) One or more water chemistry parameters indicate potential or severe impairment AND 2) supporting information including upstream/downstream conditions do not strongly contradict a finding of non-support. If the first condition is met, condition two should primarily be evaluated considering:
• strength of indicator
• parameter-level evaluations
• watershed context
• continuous monitoring data (when available)

G u id an ce Man ua l for A sses s ing th e Minne sota Po l lut ion Contro l Age n cy Qua l i ty o f Minne sota Sur fac e Wate rs December 2011 2 1
In general, information from within the assessment unit (strength of indicator and parameter-level evaluation) serves as the primary arbiter for making a not supporting determination, while assessments and data from adjacent assessment units (watershed context) provides additional information that either corroborates or refutes this determination. Considering these three factors together, a not supporting determination is more likely in situations where 1) parameter-level evaluations indicate potential or severe impairment, 2) the strength of these indicators is medium or high, AND 3) the assessment is corroborated by similar conditions upstream or downstream of the assessment unit in question. Continuous monitoring data, if available, can be used to either corroborate or refute the evidence provided by grab-sample data sets.
c) Both biological and water chemistry indicator data: Fully Supporting – 1) IBI score for at least one biological assemblage indicates supporting conditions OR the standards for both Turbidity/TSS/t-tube and dissolved oxygen are fully met, AND 2) other data and information considered comprehensively, including upstream/downstream conditions, do not strongly contradict a finding of full support. If the first condition is met, condition two should be evaluated considering the following factors:
• co-occurrence of indicator data
• strength of indicator
• parameter-level evaluations
• habitat conditions
• sampling conditions
• watershed context
• continuous monitoring data (when available)
Not Supporting – 1) IBI score for at least one biological assemblage indicates severe impairment OR 2) IBI score for at least one biological assemblage indicates potential impairment AND the parameter-level evaluations and other data and information considered comprehensively corroborate a finding of non-support OR 3) one or more water chemistry parameters indicate potential or severe impairment AND the evidence considered comprehensively leads to a conclusion of non-support. To evaluate all three conditions consider the following factors:
• co-occurrence of indicator data
• strength of indicator
• parameter-level evaluations
• habitat conditions
• sampling conditions
• watershed context
• continuous monitoring data (when available)
d) Insufficient information: If the criteria are not met for a fully supporting or not supporting assessment and the assessment is inconclusive, the result is a determination of insufficient information. “Insufficient information” determinations include situations where sufficient data are not available to assess the use, or the strength of the available indicator(s) is low and there is no supporting information available to help verify what the weak dataset is indicating. Sites receiving an “insufficient information” assessment may be prioritized for follow-up monitoring during MPCA stressor identification efforts, addressed by local monitoring efforts, or monitored further during the next round of intensive watershed monitoring.

G u id an ce Man ua l for A sses s ing th e Minne sota Po l lut ion Contro l Age n cy Qua l i ty o f Minne sota Sur fac e Wate rs December 2011 2 2
VI. Aquatic Consumption and Drinking Water This section addresses the assessment of water quality for pollutants that have human health-based standards. Standards based on protection to humans include Class 2 chronic standards (CS), narrative standards based on the Minnesota Department of Health’s (MDH) Fish Consumption Advisory program, and Class 1 drinking water standards. An overview of these standards and their application for assessment is provided below.
A. Pollutants with Class 2 human health-based chronic standards Class 2 CSs are set after determining the water column concentration that will be protective for long-term or chronic exposure for aquatic organisms, human health, and fish-eating wildlife (Minn. R. ch. 7052 only). The most protective CS is then listed in the rule under each beneficial use classification (2A, 2B, or 2Bd). This section discusses the development of human health protective numeric CSs.
1. Algorithms for human health-based chronic standards
The methods used to develop human health-based CSs depend on the beneficial use classification and toxicological profile of the pollutant. All Class 2 CSs ensure protection for fish consumption. For Class 2A and Class 2Bd surface waters, development of the CSs also include drinking water intake in the algorithm, as follows:
Class 2A or 2Bd CS = Toxicological value (Reference dose or Cancer risk level/Cancer slope factor)
Drinking water intake rate + (Fish consumption intake rate x Bioaccumulation factor)
Class 2B surface waters are not used as a source of drinking water, but instead base possible ingestion on a “mouthful” of water that may be incidentally consumed while swimming. This intake rate is much lower than drinking water intake; therefore, the CS for these waters is generally driven by the fish consumption intake rates.
Class 2B CS = Toxicological value (Reference dose or Cancer risk level/Cancer slope factor
Incidental water intake rate + (Fish consumption intake rate x Bioaccumulation Factor)
It is important to distinguish the basis for human health protection in the Class 2 subclasses as it is critical to understanding the exposure pathways included and to distinguish from the Class 1 drinking water standards that are further discussed in Section VI. C. In addition to the route of exposure addressed by each Class 2 subclass, the consideration of how bioaccumulative a pollutant is is also an important aspect to the application of human health-based standards in the integrated assessment.
Chemicals that persist in the environment and “build up” in the tissues of aquatic organisms to higher concentrations than the concentrations in the surrounding water are called bioaccumulative chemicals. Uptake through the food chain means that at each step, from plants to prey to predator, the concentrations in the biota increase. This “biomagnification” as it is called is a concern because many game fish (e.g., walleye and northern pike) are at the top of the aquatic food chain and they typically carry the highest tissue concentrations of the chemical in the aquatic system.
The bioaccumulation factor (BAF) is the ratio between the concentration of the chemical in the biota and the concentration of the chemical in the water. BAFs can exceed one million for very highly bioaccumulative chemicals. A BAF must be determined to calculate a human health-based water quality standard. (MPCA, 2000e). For pollutants with high BAFs, generally > 1000, the CSs are very low water column concentrations in order to limit their concentration in fish tissue; this means human health protection is the basis for these CSs as the concentrations are more stringent

G u id an ce Man ua l for A sses s ing th e Minne sota Po l lut ion Contro l Age n cy Qua l i ty o f Minne sota Sur fac e Wate rs December 2011 2 3
than those for aquatic organism protection. For these chemicals (such as mercury, PCBs, and dioxins), exposure from the fish consumption pathway also far exceeds that from drinking water consumption. Based on EPA guidance, MPCA adopted a fish tissue criterion for mercury in 2008 to provide a more accurate and directly usable standard to protect fish consumers (for further discussion, see V.B.)
2. Pollutants with human health-based chronic standards
The pollutants that have human health-based CSs that are most often included in MPCA water quality assessments are briefly described. Pollutants other than those mentioned here may be assessed also, as data allow.
a) Mercury Mercury is the classic example of a bioaccumulative element; it never degrades, it can bioaccumulate through the food chain to toxic levels from benign water concentrations, and it can cause serious health effects. Mercury numeric water quality standards are based on total concentrations and, thus, total mercury measurements are used in assessments. Minnesota has two water column Class 2 water quality standards for total mercury, as shown below (although the more stringent CS for Lake Superior is based on fish-eating wildlife, this value is protective of human consumers and assessed the same way as the statewide mercury CS):
• 6.9 ng/L. chronic standard, Minn. R. ch.7050.0222 (statewide)
• 1.3 ng/L. chronic standard, Minn. R. ch. 7052.0100 (waters of Lake Superior Basin)
In 2008, MPCA also adopted a fish tissue mercury standard into Minn. R. ch. 7050:
• 0.2 mg/kg, total in edible fish tissue
The MPCA began using clean sampling techniques for mercury and other trace metals in 1996, and only data collected in this manner will be used (EPA Method 1631 or equivalent). Mercury levels are assessed by comparing concentrations in water to the ambient standards shown above, and by assessing the mercury in fish tissue directly, as outlined in Section VI.B. where mercury is further discussed.
b) Polychlorinated biphenyls Polychlorinated biphenyls (PCBs) constitute a group of chlorinated organic compounds distributed world-wide. Their extensive use combined with their persistence, bioaccumulative properties, and cancer and non-cancer toxicity, make them very serious environmental pollutants. Concentrations of PCBs in water are very low (typically less than one part per trillion) and difficult to measure. But, because they bioaccumulate as much as a million fold or more in fish and other animals, they are readily measured in animal tissues. Thus, PCBs are usually assessed for the 303(d) list on the basis of their presence in fish, resulting in advice to anglers to limit their consumption of certain fish (see Section VI.B.). The MPCA has adopted human health-based water quality standards for total PCBs, as listed below:
Minn. R. ch. 7050.0222 (statewide standards)
• 14 pg/L, Class 2A chronic
• 29 pg/L, Class 2Bd, 2B, 2C and 2D chronic
Minn. R. ch. 7052.0100 (waters of Lake Superior Basin)
• 4.5 pg/L, Lake Superior chronic
• 6.3 pg/L, Class 2A chronic
• 25 pg/L, Class 2Bd, 2B, 2C and 2D chronic

G u id an ce Man ua l for A sses s ing th e Minne sota Po l lut ion Contro l Age n cy Qua l i ty o f Minne sota Sur fac e Wate rs December 2011 2 4
c) Dioxins and chlorinated pesticides Dioxins are similar to PCBs in many respects. Both represent a family of chlorinated organic chemicals, some of which are very persistent, bioaccumulative and toxic, as well as global in their distribution. Unlike PCBs, dioxins were never intentionally manufactured. The major sources of dioxins are combustion, chlorine bleaching of pulp wood (now largely phased out), and trace contaminants in other manufactured organic compounds, including PCBs. 2,3,7,8-Tetrachlorodibenzo-p-dioxin (TCDD) has been shown to be carcinogenic in animals at extremely low doses. The MPCA has Class 2 human health-based water quality standards for 2,3,7,8-TCDD in Minn. R. ch. 7052, applicable only to waters in the Lake Superior basin. These are shown below:
• 0.0014 pg/L, Lake Superior chronic
• 0.0020 pg/L, Class 2A chronic
• 0.0080 pg/L, Class 2Bd, 2B, 2C and 2D chronic
The only 2,3,7,8-TCDD standard in Minn. R. ch. 7050 is the EPA drinking water standard of 30 pg/L.
Organochlorine pesticides, such as DDT, Dieldrin, and toxaphene are persistent, bioaccumulative, and have reproductive toxicity to non-target organisms. The use of most organochlorine pesticides is banned in the United States and in most countries world-wide (EPA 2001b). The MPCA evaluates waters for dioxins or organochlorine pesticides only at site-specific locations where contamination is suspected or where data are needed to support remedial efforts.
3. Data requirements and determination of impaired condition
The data requirements for assessing waterbodies for exceedances of human health-based CSs are essentially the same as for chemicals with toxicity-based standards (Section V. A.) The major difference is that data compared to the chronic standard are “averaged” over a 30-day period if more than one sample was taken in the 30-day period. Samples taken in a once-per-month sampling regime occasionally result in two samples collected within 30 days. Such samples are considered separately and not averaged together unless the samples were taken within 21 days of each other, in which case they are averaged. A 30-day arithmetic mean is used, unless the data are not normally distributed, in which case a geometric mean, log mean or median is used.
Exceedances are evaluated over consecutive three-year periods. Two exceedances of the chronic standard or a single exceedance of the maximum standard in three years indicate impairment. A minimum of five data points is generally desirable for assessments, but impairment determinations may be made with fewer data points when appropriate.
Table 4. Summary of data requirements and exceedance thresholds for assessment of pollutants with human health-based and wildlife-based standards.
Period of Record
Minimum No. of Data Points*
Use Support or Listing Category
Based on Exceedances of
Chronic Standard
Chronic Standard Exceedance Threshold →
No more than 1 in 3 yrs.
2 or more in 3 yrs.
Most recent 10 years
5, within a 3-yr. period
Not Listed Listed
* 30-day central values

G u id an ce Man ua l for A sses s ing th e Minne sota Po l lut ion Contro l Age n cy Qua l i ty o f Minne sota Sur fac e Wate rs December 2011 2 5
4. Pollutants with human health- and toxicity-based standards or criteria
The MPCA calculates both a toxicity-based and a human health-based chronic criteria, and the more restrictive of the two is adopted into Minn. R. chs. 7050 or 7052 as the applicable chronic standard. Because of the different averaging times used when comparing human health-based or aquatic toxicity-based standards to monitoring data, a complete impaired waters assessment would require comparisons of monitoring data to both values. Minn. R. chs. 7050 and 7052 will only list the more stringent CS, but the MPCA retains a record of all calculated criteria values.
a) Pollutants Three pollutants - atrazine, cobalt, and pentachlorophenol - have human health-based and toxicity-based standards or criterions that have similar values. Cadmium, lindane, and 2,4,6-trichlorophenol are other pollutants in this category.
The chronic standard for atrazine is 3.4 µg/L for Class 2A and 2Bd waters. While this human health-based standard is lower than the aquatic toxicity-based criterion of 10 µg/L, the aquatic-toxicity value is applicable to all waters to ensure protection of aquatic organisms. Because Class 2B waters are not protected for drinking water, the aquatic toxicity criterion of 10 µg/L becomes the most stringent value and is the basis for the chronic standard. The human health-based criterion value for Class 2B waters is 100 µg/L, to protect people who eat fish.
Monitoring data available on atrazine often includes atrazine degradates. In most cases, not enough information is available to determine a water quality standard for degradates, but available human health and aquatic toxicity reviews are considered by the PJG when assessing waters for impairment. Pesticide reviews by MDH and EPA have provided guidance on factoring in toxicity of degradates.
b) Data requirements and determination of impaired condition The data requirements for assessing waterbodies for exceedances of pollutants like atrazine are the same as those for human health-based standards and toxicity-based standards. Thirty-day and four-day averages are calculated for those periods where exceedances of the standard are observed, and compared against the human health-based standard and aquatic toxicity-based standard/criterion, respectively.
Two exceedances of the human health-based standard or the aquatic toxicity-based standard within three consecutive years indicate impairment. Based on additional information on the timing and magnitude of an exceedance, the PJG would evaluate on a case-by-case basis the appropriateness of listing waters with one exceedance of each standard at different times within a three-year period. One exceedance of the maximum standard indicates impairment.
B. Protection for human consumption of fish In the context of water quality standards, support of the aquatic life beneficial use means that the concentrations of toxicants in water must be low enough that:
• the aquatic community is healthy, diverse and successfully reproducing
• the fish and other aquatic organisms are safe for people and wildlife to eat
This section describes the assessment of fish for human consumption based on fish contaminant data. The data used in the MPCA assessments is the same monitoring data used by the MDH to issue Fish Consumption Advisories (MFCA). The water quality standards used in the assessment include both a narrative standard based on MFCA and a mercury fish tissue-based CS.

G u id an ce Man ua l for A sses s ing th e Minne sota Po l lut ion Contro l Age n cy Qua l i ty o f Minne sota Sur fac e Wate rs December 2011 2 6
1. Basis for assessment of fish contaminants: narrative standard
The basis for assessing the contaminants in fish tissue is the narrative water quality standards and assessment factors in Minn. R. ch. 7050.0150, subp. 7 which states the following:
Subp. 7. Impairment of waters relating to fish for human consumption. In evaluating whether the narrative standards in subpart 3, which prevent harmful pesticide or other residues in aquatic flora or fauna, are being met, the commissioner will use the residue levels in fish muscle tissue established by the Minnesota Department of Health to identify surface waters supporting fish for which the Minnesota Department of Health recommends a reduced frequency of fish consumption for the protection of public health. A water body will be considered impaired when the recommended consumption frequency is less than one meal per week, such as one meal per month, for any member of the population. That is, a water body will not be considered impaired if the recommended consumption frequency is one meal per week, or any less restrictive recommendation such as two meals per week, for all members of the population. The impaired condition must be supported with measured data on the contaminant levels in the indigenous fish.
2. MDH fish consumption advice and thresholds for consumption
To support the continued good health of people that eat fish in Minnesota, the MDH issues guidelines for how often certain fish can be safely eaten. This is called the Minnesota Fish Consumption Advisory (MFCA) (MDH 2001; in VI.B.1 for the MFCA website). The determination of fish consumption advice for mercury, PCBs, and perfluorooctane sulfanate (PFOS) depends on two elements — toxicity and exposure. Toxicity refers to the harmful effects of the substance on humans at various doses. Exposure refers to the sources of the toxicant to humans — exposure is discussed in the next section. MDH uses extensive toxicity data from EPA and original studies for these pollutants to establish the concentrations of contaminants in fish that trigger the following levels of advice: unlimited consumption, 1 meal per week, 1 meal per month, and do not eat. As an advisory, the goal of the MFCA is to help people make intelligent decisions on which fish to eat and which to avoid. The advice is not mandatory or regulatory.
The MDH then established concentrations of mercury, total PCBs, and PFOS in fish tissue that corresponds to meal frequency recommendations (Table 5). Mercury concentrations in Table 5 are for consumption by the more sensitive life stage, young children, and sub-populations, women who are pregnant or may become pregnant. The concentrations for PCBs and PFOS apply to all humans. These concentration thresholds are derived from health-based estimates of exposure to the contaminants through fish consumption that are likely to be without appreciable risk of harmful effects on humans (assuming the advice is followed). The mercury advice of interest to 303(d) listing targets the most sensitive individuals in the population including, but not limited to, children, pregnant women, and their fetuses. It is not necessarily protective of hypersensitive individuals.

G u id an ce Man ua l for A sses s ing th e Minne sota Po l lut ion Contro l Age n cy Qua l i ty o f Minne sota Sur fac e Wate rs December 2011 2 7
Table 5. Fish tissue concentrations (in ppm) for levels of consumption advice established by MDH for mercury, total PCBs, and PFOS (April 2008)
Consumption Advice: Unrestricted
1 meal per week
1 meal per month
1 meal per
2 months Do not eat
*Mercury (mg/kg) ≤ 0.05 >0.05 - 0.22 >0.22** - 0.95 > 0.95
Total PCBs (mg/kg) ≤ 0.05 >0.05 - 0.22 >0.22 - 0.95 >0.95 - 1.89 > 1.89
PFOS (mg/kg) ≤ 0.040 >0.040 – 0.200 >0.200 – 0.800 > 0.800
http://www.health.state.mn.us/divs/eh/fish/eating/mealadvicetables.pdf
*Consumption advice for young children and women who are pregnant or may become pregnant.
Shaded cells indicate consumption advice that corresponds to non-support and an impaired condition.
**With MDH’s revised thresholds for MFCA for mercury, the mercury fish tissue criterion of 0.2 ppm adopted into Minn. R. ch. 7050 in 2008 is more stringent and is the applicable numeric standards for assessing mercury impairments in fish (See discussion in 4).
3. Selection of single fish meal-per-week impairment threshold
As discussed in Section VI.A. on human health-based water quality protection, the consumption of fish is an important route of exposure for bioaccumulative pollutants, such as mercury, PCBs, and PFOS. Exposure varies with how often people eat fish and with the contaminant concentrations in the fish they eat. MPCA has departed from EPA policy with regard to assumptions about fish consumption (exposure). This is based on the prevalence and importance of sport fishing in Minnesota. The EPA assumes people eat 17.5 grams per day for purposes of calculating their human health-based aquatic life criteria (EPA 2000b). This generic assumption applies to everybody in the United States. Minnesota human health-based water quality standards are calculated assuming people eat 30 grams of fish per day. Thirty grams per day is the 80th percentile fish consumption rate of sport-caught fish for the angling population based on several surveys of the fish eating habits of upper Midwest anglers (MPCA 2000e). Thirty grams per day equals about a half-pound meal per week (0.463 pounds/week).
The single fish meal-per-week consumption rate is the basis for the human health-based water quality standards in Minn. R. chs. 7050 and 7052. Therefore, the “fish consumption” use is judged to be supported if it is safe to eat one fish meal per week (over a life time), consistent with the assumption inherent in the numeric water quality standards. In other words, advice to limit consumption to “no more than one meal-per-week” or more is not considered an exceedance of water quality standards, and waterbodies with such advice will not be listed as impaired. Advice to limit consumption to less than one meal per week, such as one meal per month, for any member of the population is an indication of impairment.
Alternately, if reliable data are available to show that localized populations in Minnesota consistently eat more (or less) than 30 g/d, Minn. R. ch. 7050.0222, subp. 8 allow the MPCA to recalculate an existing standard using the local fish consumption data; this process would require EPA approval. So far no site-specific standards have been developed based on a different rate of local fish consumption.
4. Mercury: numeric fish tissue standard
In 2008, the MPCA promulgated a new mercury standard based on EPA’s revised human health-based water quality criterion for methylmercury (EPA 2001a). This new criterion is unique among all EPA criteria in that the environmental medium for the acceptable mercury concentration is fish tissue rather than water. A fish tissue criterion for mercury is logical because it is fish that are the main source of methylmercury exposure to both humans and wildlife.
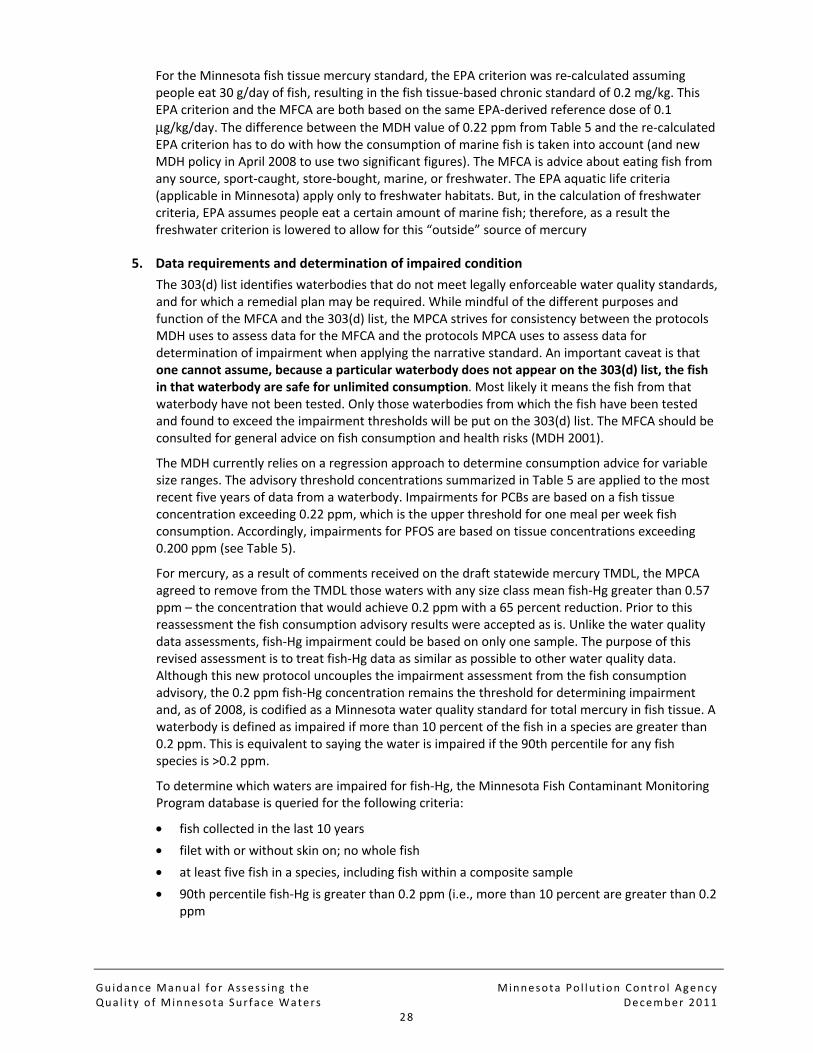
G u id an ce Man ua l for A sses s ing th e Minne sota Po l lut ion Contro l Age n cy Qua l i ty o f Minne sota Sur fac e Wate rs December 2011 2 8
For the Minnesota fish tissue mercury standard, the EPA criterion was re-calculated assuming people eat 30 g/day of fish, resulting in the fish tissue-based chronic standard of 0.2 mg/kg. This EPA criterion and the MFCA are both based on the same EPA-derived reference dose of 0.1 μg/kg/day. The difference between the MDH value of 0.22 ppm from Table 5 and the re-calculated EPA criterion has to do with how the consumption of marine fish is taken into account (and new MDH policy in April 2008 to use two significant figures). The MFCA is advice about eating fish from any source, sport-caught, store-bought, marine, or freshwater. The EPA aquatic life criteria (applicable in Minnesota) apply only to freshwater habitats. But, in the calculation of freshwater criteria, EPA assumes people eat a certain amount of marine fish; therefore, as a result the freshwater criterion is lowered to allow for this “outside” source of mercury
5. Data requirements and determination of impaired condition
The 303(d) list identifies waterbodies that do not meet legally enforceable water quality standards, and for which a remedial plan may be required. While mindful of the different purposes and function of the MFCA and the 303(d) list, the MPCA strives for consistency between the protocols MDH uses to assess data for the MFCA and the protocols MPCA uses to assess data for determination of impairment when applying the narrative standard. An important caveat is that one cannot assume, because a particular waterbody does not appear on the 303(d) list, the fish in that waterbody are safe for unlimited consumption. Most likely it means the fish from that waterbody have not been tested. Only those waterbodies from which the fish have been tested and found to exceed the impairment thresholds will be put on the 303(d) list. The MFCA should be consulted for general advice on fish consumption and health risks (MDH 2001).
The MDH currently relies on a regression approach to determine consumption advice for variable size ranges. The advisory threshold concentrations summarized in Table 5 are applied to the most recent five years of data from a waterbody. Impairments for PCBs are based on a fish tissue concentration exceeding 0.22 ppm, which is the upper threshold for one meal per week fish consumption. Accordingly, impairments for PFOS are based on tissue concentrations exceeding 0.200 ppm (see Table 5).
For mercury, as a result of comments received on the draft statewide mercury TMDL, the MPCA agreed to remove from the TMDL those waters with any size class mean fish-Hg greater than 0.57 ppm – the concentration that would achieve 0.2 ppm with a 65 percent reduction. Prior to this reassessment the fish consumption advisory results were accepted as is. Unlike the water quality data assessments, fish-Hg impairment could be based on only one sample. The purpose of this revised assessment is to treat fish-Hg data as similar as possible to other water quality data. Although this new protocol uncouples the impairment assessment from the fish consumption advisory, the 0.2 ppm fish-Hg concentration remains the threshold for determining impairment and, as of 2008, is codified as a Minnesota water quality standard for total mercury in fish tissue. A waterbody is defined as impaired if more than 10 percent of the fish in a species are greater than 0.2 ppm. This is equivalent to saying the water is impaired if the 90th percentile for any fish species is >0.2 ppm.
To determine which waters are impaired for fish-Hg, the Minnesota Fish Contaminant Monitoring Program database is queried for the following criteria:
• fish collected in the last 10 years
• filet with or without skin on; no whole fish
• at least five fish in a species, including fish within a composite sample
• 90th percentile fish-Hg is greater than 0.2 ppm (i.e., more than 10 percent are greater than 0.2 ppm

G u id an ce Man ua l for A sses s ing th e Minne sota Po l lut ion Contro l Age n cy Qua l i ty o f Minne sota Sur fac e Wate rs December 2011 2 9
Whole fish were not used for this process because they are not used for the fish consumption advisory. If a waterbody-species had less than five fish, but at least one fish sample was greater than 1.0 ppm Hg, it was assigned to a separate list for further consideration; five fish with one fish of 1.0 ppm would have an average greater than 0.2 ppm.
The 90th percentile rank is calculated by multiplying the number of fish (N) by 0.9 and rounding to the nearest whole number. The 90th percentile fish-Hg is determined for each waterbody-species by (1) ranking the samples within each waterbody-species from low to high Hg, (2) Hg concentration of a composite sample is treated as the concentration for all fish within the composite, (3) if the 90th percentile ranked fish is >0.2 ppm or is in a composite that is >0.2 ppm, it is marked as impaired. This evaluation complements assessment of waterbodies that are impaired based on water column mercury.
C. Class 1 drinking water standards for nitrate nitrogen Class 1 waters are protected as a source of drinking water. In Minnesota, all groundwater and selected surface waters are designated Class 1. The assessment of groundwater (Class 1A) for potential impairment of the drinking water use is outside the scope of this Guidance. The Minnesota Department of Health (MDH) monitors municipal finished water supplies for compliance with drinking water standards. The assessment of Class 1B and 1C listed surface waters for potential impairment by nitrate nitrogen is discussed in this Section.
1. Nitrate nitrogen
Nitrate nitrogen poses a risk to human health at concentrations exceeding 10 mg/L in drinking water. Humans, especially infants under six months of age, who are exposed to nitrate in drinking water at concentrations exceeding the 10 mg/L federal safe drinking water standard (which is incorporated by reference into Minn. R. ch. 7050.0221) can develop methemoglobinemia, a blood disorder that interferes with the ability of blood to carry oxygen. The 10 mg/L standard is an acute toxicity standard. Long term, chronic exposure to nitrate in drinking water is less well understood but has been linked to the development of cancer, thyroid disease, and diabetes in humans.
In recognition of the trend of increasing nitrate concentrations in Minnesota streams and the public health and economic impact arising from elevated nitrate concentrations in drinking water (a particular concern in Southeast Minnesota’s karst region), the MPCA assesses Class 1B and 1C designated surface waters for potential impairment by nitrate nitrogen.
2. Data requirements and determination of impaired condition
When assessing drinking water-protected surface waters Class 1B and 1C, MPCA compares 24-hour average nitrate concentrations to the 10 mg/L DC standard. Two 24-hour averages exceeding 10 mg/L within a three-year window indicates impairment. Exceedances are assessed over consecutive three-year periods. A minimum of five data points is generally desirable for assessments, but impairment determinations may be made with fewer data points when appropriate.
River or stream reaches with fewer than five data points, but with one exceedance of the nitrate nitrogen standard, will be given a high priority for follow-up sampling. These will be flagged by the professional judgment groups, and placed on an internal MPCA list of waters needing further monitoring and assessment.

G u id an ce Man ua l for A sses s ing th e Minne sota Po l lut ion Contro l Age n cy Qua l i ty o f Minne sota Sur fac e Wate rs December 2011 3 0
Table 6. Summary of data requirements and exceedance thresholds for assessment of nitrate nitrogen, Class 1 drinking water standard.
Period of Record
Minimum No. of Data Points
Use support or listing category based on exceedances of drinking water standard (10 mg/L)
Drinking water Acute Standard* Exceedance Threshold →
No more than 1 in 3 yrs. 2 or more in 3 yrs.
Most recent 10 years
5, within a 3-yr. period
Not Listed Listed
* 24-hour central value

G u id an ce Man ua l for A sses s ing th e Minne sota Po l lut ion Contro l Age n cy Qua l i ty o f Minne sota Sur fac e Wate rs December 2011 3 1
VII. Pollutants with Wildlife-Based Water Quality Standards Protection of the aquatic life use includes the protection of wildlife consumers of aquatic organisms. Minnesota has four wildlife-based water quality standards – all in Minn. R. ch. 7052, the Great Lakes Water Quality Initiative (GLI) rule. The GLI rule focuses on the reduction of bioaccumulative toxic chemicals in the Great Lakes ecosystem as a whole. The standards in Minn. R. ch. 7052 are applicable only to the surface waters of the Lake Superior basin in Minnesota. The GLI chronic wildlife-based standards are listed below:
• DDT – 11 pg/L
• Mercury – 1300 pg/L
• PCBs – 122 pg/L (GLI human health-based standards for PCBs are more stringent than the wildlife based standard)
• 2,3,7,8-TCDD – 0.0031 pg/L (GLI human health-based standards for dioxin are more stringent than the wildlife based standard for Lake Superior and Class 2A waters, but not for Class 2Bd and 2B,C&D waters)
The assessment of waterbodies for compliance with the GLI wildlife-based standards follows the same protocols used to assess waterbodies for human health-based standards, as described in the previous section (Table 4).

G u id an ce Man ua l for A sses s ing th e Minne sota Po l lut ion Contro l Age n cy Qua l i ty o f Minne sota Sur fac e Wate rs December 2011 3 2
VIII. Protection of Aquatic Recreation This section addresses the assessment of water quality for pollutants that have aquatic recreation-based standards. Standards based on protecting the ability to recreate on and in Minnesota’s waters are Class 2 standards. An overview of these standards and their application for assessment is provided below
A. Streams and rivers – E. coli bacteria The numeric standards in Minn. R. ch. 7050 that directly protect for primary (swimming and other recreation where immersion and inadvertently ingesting water is likely) and secondary (boating and wading where the likelihood of ingesting water is much smaller) body contact are the E. coli standards shown in Table 7. E. coli standards are applicable only during the warm months since there is very little swimming in Minnesota in the non-summer months. Exceedances of the E. coli standard mean the recreational use is not being met.
The MPCA uses an E. coli (Escherichia coli) standard based on a geometric mean EPA criterion of 126 E. coli colony forming units (cfu) per 100ml. E. coli has been determined by EPA to be the preferred indicator of the potential presence of waterborne pathogens.
Table 7. E. coli water quality standards for Class 2 and Class 7 waters.
Use Class
Standard
No. of Organisms Per 100 mL of Water Applicable
Season Use
Monthly Geometric Mean*
10 % of Samples Maximum** Body Contact
2A, trout streams and lakes,
2Bd, 2B, 2C, non-trout (warm) waters
126 1260 April 1 – October 31 Primary
2D, wetlands 126 1260 April 1 –
October 31 Primary, if the use is suitable
7, limited resource value waters 630 1260
May 1 – October 31 Secondary
* Not to be exceeded as the geometric mean of not less than 5 samples in a calendar month. ** Not to be exceeded by 10% of all samples taken in a calendar month, individually.
1. Data requirements and determination of impaired condition
There is a considerable amount of E. coli data available in Minnesota, and also older fecal coliform data. For assessment purposes, only E. coli measurements will be used. Exceptions to the exclusive use of E. coli data will be made only in special cases, using a ratio of 200 to 126 to convert fecal coliform to E. coli.
Data over the full 10-year period are aggregated by individual month (e.g., all April values for all 10 years, all May values, etc.). At least five values for each month is ideal, while a minimum of five values per month for at least three months, preferably between June and September, is necessary to make a determination. Assessment with less than these minimums may be made on a case-by-case basis.
Where multiple bacteria/pathogen samples have been taken on the same day on an assessment unit, then the geometric mean of all the measurements will be used for the assessment analysis.
If the geometric mean of the aggregated monthly values for one or more months exceeds 126 organisms per 100 ml, that reach is considered to be impaired. Also, a waterbody is considered

G u id an ce Man ua l for A sses s ing th e Minne sota Po l lut ion Contro l Age n cy Qua l i ty o f Minne sota Sur fac e Wate rs December 2011 3 3
impaired if more than 10 percent of individual values over the 10-year period (independent of month) exceed 1260 organisms per 100 ml This assessment methodology more closely approximates the five-samples-per-month requirement of the standard while recognizing typical sampling frequencies, which rarely provide five samples in a single month and usually only one. Table 8 summarizes the assessment process.

G u id an ce Man ua l for A sses s ing th e Minne sota Po l lut ion Contro l Age n cy Qua l i ty o f Minne sota Sur fac e Wate rs December 2011 3 4
Table 8. Assessment of waterbodies for impairment of swimming use - data requirements and exceedance thresholds for E. coli bacteria.
Period of Record Minimum No. of
Data Points
Use Support or Listing Category
Based on Exceedances of
The E. coli Standard
Standard Exceedance Thresholds →
Monthly geometric mean
> 126 orgs/100 mL (Class 2)
> 630 orgs/100 mL (Class 7)
No months 1 or more months
Most recent 10 years see text Not Listed Listed
Standard Exceedance Thresholds →
Exceeds 1260 orgs/100 ml* < 10 % >10 %
Most recent 10 years 15 Not Listed Listed
* In full data set over 10 years.
Expert review of the data provides a further evaluation. When fewer than five values are available for most or all months, the individual data are reviewed. Considerations in making the impairment determinations include the following:
• dates of sample collection (years and months) • variability of data within a month • magnitude of exceedances • ‘remark’ codes associated with individual values • previous assessments and 303d listings
In some circumstances where four values are available for some or all months, a mathematical analysis is done to determine the potential for a monthly geometric mean to exceed the 126 organisms/ 100mL standard. All assessments are reviewed by the Watershed Assessment Team (WAT) for each watershed.
Large datasets: Aggregating data by month across years for very large datasets diminishes the value of the data and assessment, making it less likely that periodic E. coli exceedances will be identified that indicate impairment. Data aggregation should be held to a minimum, no more than necessary to have sufficient data to satisfy the requirements for determining exceedances.
Alternative methods of data analysis may be used based on a professional judgment review of the data. Where there are five values per individual month or 30 day time period, the data will not be aggregated and individual monthly or 30 day geometric means may be calculated. Alternatively, data may be aggregated by month across consecutive two year or five year time periods. If more than 10 percent of the geometric means calculated exceed the 126 org/100 mL standard, the AUID is assessed as not supporting.

G u id an ce Man ua l for A sses s ing th e Minne sota Po l lut ion Contro l Age n cy Qua l i ty o f Minne sota Sur fac e Wate rs December 2011 3 5
B. Lake eutrophication Excessive nutrient loads, in particular total phosphorus (TP), lead to increased algae blooms and reduced transparency – both of which may significantly impair or prohibit the use of lakes for aquatic recreation. The ecoregion-based eutrophication standards are the primary basis for aquatic recreational use assessments in lakes.
1. Waterbody classification and ecoregion determination
As the eutrophication standards are specific to ecoregion and lake depth, a number of steps are required to be completed prior to the actual assessment of the waterbody. Statue defines lake, shallow lake, reservoir, and wetland (Minn. R. ch. 7050.0150). The determination between the four requires an analysis of basin depth and littoral area. Additionally, a series of questions was developed to help make the differentiation between shallow lake and wetland. These can be found in Appendix A. This step includes a desktop review using GIS and available morphometric data and may include a site visit, if the decisions cannot be made from this review. Decisions are recorded and stored in the assessment database for future reference.
Reservoirs with residence times less than 14 days will not be assessed as lakes, per EPA guidance (EPA 200a, Kennedy 2001). For this purpose, residence times are usually determined under conditions of low flow. A mean flow for the four-month summer season (June – September) with a once in 10 year recurrence interval is normally used. The MPCA may establish a minimum residence time of less than 14 days on a site-specific basis if credible scientific evidence shows that a shorter residence time is appropriate for that reservoir.
The majority of the lakes in the state (98 percent) reside in four of the seven ecoregions (EPA Omernik Level III ecoregions); the remaining 2 percent of lakes reside in one of three ecoregions (Heiskary and Wilson 2005). Land use and lake morphometry will be used to determine the proper ecoregion-based standard to address these lakes that do not fall in the ecoregions for which criteria have been developed.
2. Data requirements and determination of use assessment
a) Minimum data requirements Samples must be collected over a minimum of 2 years and data used for assessments must be collected from June to September. Typically, a minimum of 8 individual data points for TP, corrected chl-a (chl-a corrected for pheophytin), and Secchi are required.
b) Lake assessment determinations If more than one sample is collected in a lake per day, these values are averaged to yield a daily average value. Following this step, all June to September data for the 10-year assessment window are averaged to determine summer-mean values for TP, corrected chl-a, and Secchi depth. These values are then compared to the standards and the assessment is made (Table 9).
Lakes where TP and at least one of the response variables (corrected chl-a or Secchi) exceed the standards are considered impaired. For lakes with excellent data quality (2+ years of data) and where all parameters are better than the standards, an assessment of full support is made. Lakes with good quality data (1 year data plus Secchi trends) may be considered for full support assessment as well. In this case the assessment thresholds have been adjusted by 20 percent (made more stringent) and lakes with good quality data that meet these thresholds will be considered fully supporting. This modification of the thresholds provides a margin of safety to assure that lakes with lesser amounts of data are supporting the beneficial use.
For lakes that do not meet minimum data requirements and use support cannot be determined, a determination of insufficient data will be made. In some instances, a lake may have good or excellent quality data but only one of the thresholds is exceeded (e.g. TP or

G u id an ce Man ua l for A sses s ing th e Minne sota Po l lut ion Contro l Age n cy Qua l i ty o f Minne sota Sur fac e Wate rs December 2011 3 6
corrected chl-a or Secchi), while the other two are in compliance with the standards. In this instance, the lake will be considered to have insufficient data to determine impairment.
c) Reservoirs and other special situations Sampling design and assessments for aquatic recreational use for reservoirs may be different from those used for lakes. Since reservoirs typically exhibit distinct zones, often referred to as inflow segment, transitional segment, and near-dam segment, calculation of “whole reservoir” mean TP may not be an appropriate basis for assessing aquatic recreational use. Rather, the MPCA may evaluate the status of the reservoir based on a specific segment – most likely the near-dam segment. Also, water residence time may vary substantially as a function of river flow (e.g., Lake Pepin, Heiskary and Walker 1995) and may influence algal response to available nutrients. In addition, reservoirs often have very large watersheds that may drain portions of one or more ecoregion. Hence ecoregion-based standards based on where the reservoir is located may not always be the best basis for evaluating use support.
Lakes with distinct bays, such as Lake Minnetonka, may present a similar situation. The bays (basins) may need to be assessed on an individual basis (data is stored by specific basin, not by whole lake). In some instances a single bay may exceed the listing thresholds while other bays in the lake do not. In this case it should be determined whether the entire lake should be listed (e.g., there is distinct interaction between the bays) or simply the individual bay. This will likely require knowledge of flow-through patterns in the lake and assistance from local cooperators to make an appropriate determination.
Table 9. Lake eutrophication standards for aquatic recreation use assessments.
Ecoregion TP Chl-a Secchi
ppb ppb meters
NLF – Lake trout (Class 2A) < 12 < 3 > 4.8
NLF – Stream trout (Class 2A) < 20 < 6 > 2.5
NLF – Aquatic Rec. Use (Class 2B) < 30 < 9 > 2.0
NCHF – Stream trout (Class 2a) < 20 < 6 > 2.5
NCHF – Aquatic Rec. Use (Class 2b) < 40 < 14 > 1.4
NCHF – Aquatic Rec. Use (Class 2b) Shallow lakes
< 60 < 20 > 1.0
WCBP & NGP – Aquatic Rec. Use (Class 2B) < 65 < 22 > 0.9
WCBP & NGP – Aquatic Rec. Use (Class 2b) Shallow lakes
< 90 < 30 > 0.7

G u id an ce Man ua l for A sses s ing th e Minne sota Po l lut ion Contro l Age n cy Qua l i ty o f Minne sota Sur fac e Wate rs December 2011 3 7
IX. Protection of Limited Resource Value Waters (Class 7) Limited resource value waters include surface waters of the state that have been subject to a use attainability analysis and have been found to have limited value as a water resource. These waters are specifically listed in rule (Minn. R. ch. 7050.0470) and are protected so as to allow secondary body contact use, to preserve the groundwater for use as a potable water supply, and to protect aesthetic qualities of the water.
Standards for limited resource value waters include the following:
• Escherichia (E.) coli: Not to exceed 630 organisms per 100 mL as a geometric mean of not less than five samples representative of conditions within any calendar month, nor shall more than ten percent of all samples taken during any calendar month individually exceed 1260 organisms per 100 mL. The standard applies between May 1 and October 31. Assessment methodology is described in detail in Section VIII.A.
• Dissolved Oxygen: At concentrations which will avoid odors or putrid conditions or at concentrations not less than 1 mg/L as a daily average, provided that measurable concentrations are present at all times.
• pH: minimum value 6.0 maximum value 9.0
• Toxic pollutants not allowed in such quantities or concentrations that will impair the specified uses.
Application of toxic standards to Class 7 waters for assessment purposes includes applying the Maximum Standard (MS) for most pollutants or 100 times the Chronic Standard (CS), whichever is lower (Minn. R. ch. 7050.0222 subp.7, item E). However, for bioaccumulative pollutants (BCF>5000) the CS would apply. Because Class 7 waters may be used by game fish for spawning and/or maintaining minnow populations during brief periods in the spring, a special protection against bioaccumulative pollutants is needed.

G u id an ce Man ua l for A sses s ing th e Minne sota Po l lut ion Contro l Age n cy Qua l i ty o f Minne sota Sur fac e Wate rs December 2011 3 8
X. Removal of Waterbodies from the 303(d) List There are four basic ways in which waterbodies are removed from the 303(d) list:
1) If, during subsequent monitoring or the development of the TMDL study, new and reliable data or information indicates that the waterbody is no longer impaired and is meeting water quality standards. Such a waterbody would be de-listed before a TMDL plan was completed.
2) If a TMDL assessment and preliminary plan for reducing the sources of pollution is completed and approved by the EPA.
3) If the sources of impairment are determined to be non-anthropogenic in origin.
4) If it was determined that a reach was placed on the list in error.
It is important to note that in scenarios 2 and 3 above, the waterbody is still impaired and still appears on the Impaired Waters Inventory (until such time as the waterbody supports all its beneficial uses), but because a TMDL study is not required that waterbody is not included on the 303(d) list. The following paragraphs provide more details on the four scenarios for 303(d) List delisting.
A. Waterbody no longer impaired In general, waterbodies will be assessed and listing or de-listing decisions will be made using the methods described in this Guidance. In practice, there will usually be more data available for the “de-listing” assessment than was available for the “listing” assessment. New and old data will be considered together in the re-assessments, unless tangible improvements of sufficient dimension to change impairment status have taken place in the reach, in which case only new data will be used in the de-listing assessment. Improvements could include implementation of best management practices to reduce nonpoint sources, improvements in wastewater treatment, or some combination of nonpoint and point source reductions. If the new data show the waterbody to be un-impaired, the MPCA will recommend that the waterbody be de-listed.
All de-listing decisions are subject to review by the appropriate watershed assessment and professional judgment teams (see Section III.) or the delisting committee for waters outside of the watersheds being assessed that year. Information about watershed improvements should be brought to the watershed assessment and professional judgment team or delisting committee for consideration. The MPCA will make a final determination on whether a water can be considered no longer impaired, and should be submitted to the EPA for de-listing.
It is essential that data used in the de-listing assessment be collected under appropriate conditions. For dissolved oxygen and for pollutants with toxicity- and human health-based water quality standards, data should be from observations taken during critical conditions, i.e. those conditions most likely to result in exceedances of the standard. For example, if a waterbody was listed as impaired because of low dissolved oxygen, the measurements used to support de-listing would likely need to be collected in the early morning (generally no later than two hours after sunrise, so as to reflect the daily minimum) during periods of very low flow. For other pollutants, data should be from observations that provide an accurate representation of the overall period of time under consideration and are not biased by, for example, being collected only during a certain season or under certain flow conditions.

G u id an ce Man ua l for A sses s ing th e Minne sota Po l lut ion Contro l Age n cy Qua l i ty o f Minne sota Sur fac e Wate rs December 2011 3 9
The following is a summary of the specific data and assessment requirements needed to consider removing a waterbody from the 303(d) list, impaired because of exceedances of numeric standards:
Turbidity must have:
• at least 20 observations (new and old data) in the most recent 10 years, of which at least 10 observations (new and old data) are in the most recent 5 years
• at least 20 observations (new data) in the most recent 5 years, and evidence of action in the watershed of sufficient dimension to change impairment status, and in either case, there must be fewer than 10 percent of samples exceeding the water quality standard
Dissolved Oxygen must have:
• at least 20 observations (new and old data) in the most recent 10 years, of which at least 10 observations (new and old data) are in the most recent 5 years, or at least 20 observations (new data) in the most recent 5 years, and evidence of action in the watershed of sufficient dimension to change impairment status
• in either case, there must be fewer than 10 percent of samples exceeding the water quality standard
Un-ionized Ammonia and Chloride must have:
• at least 5 observations (new and old data) for any 3-year interval in the most recent 10 years, or
• at least 5 observations (new data) for any 3-year interval in the most recent 5 years, and evidence of action in the watershed of sufficient dimension to change impairment status
• in either case, no more than one exceedance of the chronic water quality standard in any 3-year interval (chronic standard is a 4-day average)
Mercury, water column data must have:
• at least 5 observations for any 3-year interval in the most recent 10 years
• no more than one exceedance of the chronic water quality standard in any 3-year interval (chronic standard is a 30-day average)
E. coli bacteria must have for step two:
• at least 15 observations over a two year period in the most recent 10 years
• A minimum of five values per month for at least three months when the standard is applicable (i.e. April – October), preferably between June and September – data are combined for each month over most recent 10 years, unless there are a sufficient number of observations to aggregate data by month over consecutive two year time periods or to calculate individual monthly or 30 day geometric means
• A minimum of five values per month for at least three months when the standard is applicable (i.e. April – October), preferably between June and September – data are combined for each month over most recent years since corrective actions were taken in the watershed of sufficient dimension to change impairment status, unless there are a sufficient number of observations to aggregate data by month over consecutive two year time periods or to calculate individual monthly or 30 day geometric means
• in either case, no exceedance of the monthly mean standard (126 organisms per liter) by the geometric mean in any of those months for 10 year aggregated data or less than 10 percent of months exceed the standard for two year aggregated or individual monthly or 30 day geometric means

G u id an ce Man ua l for A sses s ing th e Minne sota Po l lut ion Contro l Age n cy Qua l i ty o f Minne sota Sur fac e Wate rs December 2011 4 0
• in either case, fewer than 10 percent of sample observations exceed “maximum” standard (126 organisms per liter)
Lake nutrient eutrophication must have:
• At least 8 paired TP, corrected chl-a, and Secchi measurements (June to September) over a minimum of 2 years for the most recent 10 years
• If TP meets the standard, and either chl-a or Secchi meet the standard, the lake will be removed from the TMDL list.
• If TP exceeds the standard and corrected chl-a and Secchi meet the standard, and an improving trend in TP is observed or management activities are in place to maintain improved chl-a or Secchi observations, the lake may be delisted. This will require the local entity to provide information that details how the response conditions will be met over time.
Streams with impaired aquatic communities can be de-listed if additional bio-monitoring indicates that the community is no longer impaired when compared to the threshold IBI. Streams listed as impaired using the earlier narrative IBIs (Karr et al. 1986) can be de-listed using the same narrative IBIs if watershed-specific, reference site-based, IBIs have not been determined for that reach. Otherwise, streams will be de-listed using the reference site-based threshold IBIs (in Section V.B.).
Lakes and rivers listed as impaired because of fish tissue contaminants will be de-listed when additional sampling and analysis show that the fish tissue concentrations, by species and size class, are below 0.2 mg/kg (ppm) for either mercury or PCBs (in Section VI).
B. EPA-approved TMDL plan The second major way waters are removed from the 303(d) list is through the completion of the TMDL study. Under the current federal TMDL regulation, the TMDL process must progress through the step where an EPA-approved plan is in place that indicates in general how the river reach or lake is to be brought back into compliance with water quality standards. That is, under current EPA regulations, the waterbody does not need to be brought back to an un-impaired condition to be de-listed. Irrespective of this EPA regulation, the MPCA is committed, with the help of local entities, to improving the water quality in all impaired waters so beneficial uses are restored, where restoration is possible. To that end an AUID that has an approved TMDL plan for a pollutant no longer appears on the 303(d) list, but it remains on the Inventory of Impaired Waters until it is no longer impaired.
C. Waterbody impaired because of natural causes/conditions A third pathway for removing a waterbody from the impaired waters list is to determine that there are essentially no anthropogenic sources contributing to the impairment. Thus, the sources of the impairment are all natural. According to EPA’s Consolidated Assessment and Listing Methodology, these waters are impaired but no TMDL pollution reduction study plan is required.
D. List correction If a waterbody was placed on the list in error either by a wrong AUID being assigned to the data or due to an update in a standard or methodology that would not have caused an initial listing, the reach will be removed from the list as a correction.

G u id an ce Man ua l for A sses s ing th e Minne sota Po l lut ion Contro l Age n cy Qua l i ty o f Minne sota Sur fac e Wate rs December 2011 4 1
XI. Sources of Information and MPCA Contacts The readers of this document are encouraged to access the sources of information listed in this section. Included are e-mail addresses and phone numbers of MPCA staff that work in areas relevant to the protocols and procedures in this Guidance. They are listed alphabetically by subject area. Also provided are some pertinent websites, listed by agency.
A. MPCA staff 1. 303(d) list, general questions and comments. Howard Markus at [email protected] or
651-757-2551
2. Integrated Assessment [ADB] coordinator. Douglas Hansen at [email protected] or 651-757-2406
3. Integrated narrative report, preparation. Elizabeth Brinsmade at [email protected] or 651-757-2244
4. Basin or watershed planning questions. Doug Wetzstein at [email protected] or 651-757-2819
5. Biological impairment. Scott Niemela at [email protected] or 218-828-6076
6. Citizen lake monitoring program. Johanna Schussler at [email protected] or 651-757-2705
7. Citizen stream monitoring program. Laurie Sovell at [email protected] or 651-757-2750
8. Effluent limits for toxic pollutants and temperature standard for cold water fisheries; Dann White [email protected] or 651-757-2820
9. Fish consumption advice. Minnesota Department of Health at 800-657-3908. Patricia Mccann at [email protected]
10. Lake eutrophication methodology. Pam Anderson at [email protected] or 651-757-2190
11. Limited Resource Value Waters (Class 7). Carol Sinden at [email protected] or 651-757-2727.
12. Monitoring and data management. Louise Hotka at [email protected] or 651-757-2450
13. Quality assurance and quality control for surface water sampling and analysis. Roger Fisher at [email protected] or 651-757-2360
14. TMDL process, general questions and comments. Jeff Risberg at [email protected] or 651-757-2670 or Celine Lyman at [email protected] or 651-757-2541
15. Water quality data for specific waterbodies. Louise Hotka at [email protected] or 651-757-2450
16. Water quality standards. Angela Preimesberger at [email protected] or 651-757-2656
All MPCA staff can also be reached toll free at 800-657-3864 or 651-296-6300 in the TCMA

G u id an ce Man ua l for A sses s ing th e Minne sota Po l lut ion Contro l Age n cy Qua l i ty o f Minne sota Sur fac e Wate rs December 2011 4 2
B. Websites The MPCA and other agencies maintain a number of websites that provide information on aspects covered in this Guidance; some of the more pertinent sites are listed below:
1. MPCA websites
The MPCA home page is at http://www.pca.state.mn.us . From this site the reader can link to all the MPCA websites listed below and many more.
1. Water quality standards, general information: http://www.pca.state.mn.us/water/standards/index.html
2. 305(b) Report:
Rivers: http:// www.pca.state.mn.us/water/basins/305briver.html
Lakes: http:// www.pca.state.mn.us/water/basins/305blake.html
3. Lake protection, including Citizen Lake Monitoring Program and lake water quality:
http:// www.pca.state.mn.us/water/lake.html
4. MPCA Quality Management Plan. Provides guidance on monitoring and data management, approved by the EPA: http:// www.pca.state.mn.us/programs/pubs/qa-qmp.pdf
5. Phosphorus strategy: http:// www.pca.state.mn.us/water/phosphorus.html
6. Quality assurance and quality control requirements for water quality sampling and data assessment for lakes and streams: http:// www.pca.state.mn.us/programs/qa_p.html
7. TMDLs and the 303(d) list: http:// www.pca.state.mn.us/water/tmdl/index.html
8. Water quality standards and water quality rules; select Minn. R. ch. 7050, Minn. R. ch. 7052 or other rule from list: http:// www.pca.state.mn.us/water/standards/index.html
9. Watersheds and basin management: http:// www.pca.state.mn.us/water/basins/index.html
10. Data Access Website with environmental data on surface waters statewide: http://www.pca.state.mn.us/data/eda
2. Minnesota Department of Health websites, fish consumption advice
1. Fish consumption advice, general: http://www.health.state.mn.us/divs/eh/fish/
2. Site-specific advice: http://www.health.state.mn.us/divs/eh/fish/eating/sitespecific.html
3. EPA websites
The EPA main office in Washington D.C. maintains many relevant websites; their home page for water related topics is: http://www.epa.gov/owow/. The EPA Region 5 office in Chicago has their own relevant websites; their home page for water is: http://www.epa.gov/r5water/. Minnesota is in EPA Region 5.
1. EPA Region 5, TMDLs: http://www.epa.gov/r5water/wshednps/watersheds.html#tmdls
2. EPA Region 5, water quality monitoring and assessment: http://www.epa.gov/r5water/

G u id an ce Man ua l for A sses s ing th e Minne sota Po l lut ion Contro l Age n cy Qua l i ty o f Minne sota Sur fac e Wate rs December 2011 4 3
XII. Literature Cited Davies S. P. and S. K. Jackson. 2006. The biological condition gradient: a descriptive model for interpreting change in aquatic ecosystems. Ecological Applications 16:1251-1266.
1991. Technical Support Document for Water Quality-based Toxics Control, EPA, Office of Water, EPA-505/2-90-001 (Washington, D.C.), March 1991.
EPA. 1993. Memorandum to Water Management Division Directors from Martha Prothro, Acting Assistant Administrator of Water, EPA. Subject: Office of Water Policy and Technical Guidance on Interpretation and Implementation of Aquatic Life Metals Criteria, October 1, 1993.
EPA. 1996. Biological Criteria - Technical Guidance for Streams and Small Rivers, Revised Edition. EPA 822-B-96-001. U.S. Environmental Protection Agency, Office of Water Regulations and Standards, Washington, D.C.
EPA. 1997. Guidelines for Preparation of the Comprehensive State Water Quality Assessments (305(b) Reports) and Electronic Updates: Supplement, Office of Water, U.S. Environmental Protection Agency. EPA-841-B-97-002B. September 1997.
EPA. 2000a. Nutrient criteria technical guidance manual. 1st Edition. Office of Water. EPA-822-B00-001 Washington, DC.
EPA. 2000b. Methodology for deriving ambient water quality criteria for the protection of human health (2000). U.S. Environmental Protection Agency, Office of Water. EPA-822-B-00-004 Washington, DC.
EPA. 2001a. Water quality criterion for the protection of human health: methylmercury final. U.S. Environmental Protection Agency, Office of Water. EPA-823-R-01-001 Washington, DC.
EPA. 2001b. U.S. and internationally “banned” and “severely restricted” pesticides. U.S. Environmental Protection Agency, Office of Pesticide Programs, Washington, DC.
EPA. 2005. Use of biological information to better define designated aquatic life uses in state and tribal water quality standards: tiered aquatic life uses. In: Public Science Review Draft pp. 188. U.S. Environmental Protection Agency, Office of Water, Washington, D.C.
Fausch, K. et al. 1984. Regional application of an index of biotic integrity based on stream-fish communities. Transactions of the American Fisheries Society 113: 39-55.
Hawkins C. P. et al. 2000. Development and evaluation of predictive models for measuring the biological integrity of streams. Ecological Applications 10:1456-1477.
Heiskary, S. A. and W.W. Walker, Jr. 1995. Establishing a corrected chl-a goal for a run-of the-river reservoir. Lake and Reserv. Manage. 11(1): 67-76.
Heiskary, S.A. and C.B. Wilson. 2005. Minnesota Lake Water Quality Assesment Report: Developing Nutrient Criteria. 3rd Ed. MPCA. St. Paul MN 176 pp. http://www.pca.state.mn.us/publications/reports/lwq-a-nutrientcriteria.pdf
Jeremiason, J. et al. 1994. PCBs in Lake Superior, 1978-1992: decreases in water concentrations reflect loss by volatilization. Environ. Sci. Technol. 28: 90-914.
Karr, J. et al. 1986. Assessing biological integrity in running waters; a method and its rationale. Special Publication 5. Champaign, IL: Illinois Natural History Survey. 28 p.
Kennedy, R. 2001. Considerations for establishing nutrient criteria in reservoirs. Lake and Reservoir Management 17(3): 175-187.
Markus, H.D. 1999. Fecal coliform bacteria in rivers. Part A: The 1997/1998 fecal coliform special study. Part B: fecal coliform, stage and transparency interrelationships. Minnesota Pollution Control Agency. St. Paul, Minnesota.
Meador, M. et al. 1993. Methods for sampling fish communities as part of the National Water Quality Assessment Program. U.S. Geological Survey Open File Report 93-104. 40p.

G u id an ce Man ua l for A sses s ing th e Minne sota Po l lut ion Contro l Age n cy Qua l i ty o f Minne sota Sur fac e Wate rs December 2011 4 4
MDH. 2001. Eat fish often? A Minnesota guide to eating fish. Minnesota Department of Health, May 2001. 6 p.
MDNR. 1968. Bulletin 25: An inventory of Minnesota lakes. Division of Waters. Minnesota Department of Natural Resources. St. Paul, Minnesota. 499 p.
MPCA. 1999. Lake Superior/Duluth Harbor toxics loading study. Minnesota Pollution Control Agency, Environmental Outcomes Division. September 1999. 108 p.
MPCA. 2000b. Strategy for addressing phosphorus in National Pollutant Discharge Elimination System (NPDES) permitting. Minnesota Pollution Control Agency. St. Paul, Minnesota.
MPCA. 2000e. Guidelines for the development of surface water quality standards for toxic substances for protection of aquatic life, human health, and wildlife. Minnesota Pollution Control Agency, Environmental Outcomes Division. Draft, August, 2000.
Ohio EPA. 1988. Biological criteria for the protection of aquatic life. Vol. 1. The role of biological data in water quality assessments. Columbus, Ohio: Ohio Environmental Protection Agency. Paginated by chapter.
Stoks. 2007. Presentation at 2007 Enhancing State Lakes Management Programs, April 2007, Chicago, IL
Whittier T. et al. 2007. A Structured Approach for Developing Indices of Biotic Integrity: Three Examples from Streams and Rivers in the Western USA. Transactions of the American Fisheries Society 136:718-735.

G u id an ce Man ua l for A sses s ing th e Minne sota Po l lut ion Contro l Age n cy Qua l i ty o f Minne sota Sur fac e Wate rs December 2011 4 5
XIII. Appendices

G u id an ce Man ua l for A sses s ing th e Minne sota Po l lut ion Contro l Age n cy Qua l i ty o f Minne sota Sur fac e Wate rs December 2011 4 6
Appendix A
Some of the factors used to separate lakes, shallow lakes, and wetlands are as follows:
Factor Lakes Shallow lakes Wetlands
Protected Waters Inventory Code
Typically coded as “L or LP” in PWI
May be coded as either “L, LP or LW” in PWI
Typically coded as a “LW” in PWI
Depth, maximum Typically >15 feet Typically < 15 feet Typically < 7 feet
Littoral area Typically <80% Typically >80% Typically 100%
Area (minimum) > 10 acres (Bulletin 25) > 10 acres (Bulletin 25) No minimum
Thermal stratification (summer)
Stratification common but dependant upon depth, size and fetch
Typically do not thermally stratify
Typically do not stratify.
Fetch Significant fetch depending on size & shape
Fetch is variable depending on size & shape
Rarely has a significant fetch
Substrate Consolidated sand/silt/gravel Consolidated to mucky Mucky to unconsolidated
Shoreline features Generally wave formed, often sand, gravel or rock
Generally wave formed, often sand, gravel or rock
Generally dominated by emergents
Emergent vegetation & relative amount of open water
Shoreline may have ring of emergents; vast majority of basin open water.
Emergents common, may cover much of fringe of lake; basin often has high percentage of open water.
Emergents often dominate much of basin; often minimal open water.
Submergent vegetation
Common in littoral fringe, extent dependant on transparency
Abundant in clear lakes; however may be lacking in algal-dominated turbid lakes.
Common unless dominated by an emergent like cattail.
Dissolved Oxygen Aerobic epilimnion; hypolimnion often anoxic by midsummer
Aerobic epilimnion but wide diurnal flux possible
Diurnal flux & anaerobic conditions common
Fishery Typically managed for a sport/game fishery. May be stocked. MDNR fishery assessments typically available.
May or may not be managed for a sport fishery. If so, fishery assessment should be available. Winter aeration often used to minimize winterkill potential.
Typically not managed for a sport fishery. Little or no MDNR fishery information. Seldom aerated May be managed to remove fish & promote waterfowl.
Uses Wide range of uses including boating, swimming, skiing, fishing; boat ramps & beaches common
Boating, fishing, waterfowl production, hunting, aesthetics; limited swimming; may have boat ramp, beaches uncommon
Waterfowl & wildlife production, hunting, aesthetics. Unimproved boat ramp if any. No beaches.

G u id an ce Man ua l for A sses s ing th e Minne sota Po l lut ion Contro l Age n cy Qua l i ty o f Minne sota Sur fac e Wate rs December 2011 4 7
Appendix B. State Overall and Beneficial Use reporting categories Category/ Subcategory Description
1 All designated uses are fully assessed and met, and no use is threatened.
2 Some uses or parameters are met, but insufficient data to determine if remaining uses or parameters are met.
3A No data or information to determine if any designated use is attained.
3B Data are available for a review and generally indicate non-support, but insufficient data and information to determine TMDL impairment. (Example: single lake data point showing non-support)
3C Data available that currently has no assessment tools to allow its use in assessing. (Example: data with only eco-region expectation standards)
3D Data are available for a review and generally indicate full support, but insufficient data and information to assess for category 1 or 2.
3E Data are available for a review, but insufficient data and information to determine full support or TMDL impairment. (Example: lake data just below the threshold showing non-support)
4A Impaired or threatened but all needed TMDL plans have been completed.
4B Impaired or threatened but doesn’t require a TMDL plan because it is expected to attain standards within a reasonable period of time.
4C Impaired or threatened but doesn’t require a TMDL plan because impairment not caused by a pollutant.
4D Impaired or threatened but doesn't require a TMDL plan because the impairment is due to natural conditions with only insignificant anthropogenic influence. To be considered "insignificant", the elimination of the anthropogenic influence would not lead to the attainment of water quality standards and it would not be included in formal pollution reduction goal-setting activities. A reach-specific water quality standard based on local natural conditions has yet to be determined. Upon determination, the assessment unit will be considered non-impaired for the natural conditions and re-categorized to an appropriate category.
4E Impaired or threatened but existing data strongly suggests a TMDL plan is not required because impairment is solely a result of natural sources; a final determination of Category 4D will be made in the next assessment cycle pending confirmation from additional information (i.e. water quality or land use).
5A Impaired or threatened by multiple pollutants and no TMDL plans approved.
5B Impaired by multiple pollutants and either some TMDL plans are approved but not all or at least one impairment is the result of natural conditions.
5C Impaired or threatened by one pollutant.
In addition, the state may use the following categories as well as some of those above when defining a state cause category.
4X Preliminary new impairment parameter pending EPA approval of next draft 303d list.
5 Use assessment indicates an impaired status and no TMDL plan has been completed.

G u id an ce Man ua l for A sses s ing th e Minne sota Po l lut ion Contro l Age n cy Qua l i ty o f Minne sota Sur fac e Wate rs December 2011 4 8
5X Preliminary new impairment parameter pending EPA approval of next draft 303d list.

G u id an ce Man ua l for A sses s ing th e Minne sota Po l lut ion Contro l Age n cy Qua l i ty o f Minne sota Sur fac e Wate rs December 2011 4 9
Appendix C. Supplemental information on biological assessment in Minnesota
Basis for assessment of biological community – narrative standards
The basis for assessing the biological community for impairment is the narrative water quality standards and assessment factors in Minn. R. ch. 7050.0150. The most relevant part, Minn. R. ch. 7050.0150, subp. 6 is quoted below:
Subp. 6. Impairment of biological community and aquatic habitat. In evaluating whether the narrative standards in subpart 3, which prohibit serious impairment of the normal fisheries and lower aquatic biota upon which they are dependent and the use thereof, material alteration of the species composition, material degradation of stream beds, and the prevention or hindrance of the propagation and migration of fish and other biota normally present, are being met, the commissioner will consider all readily available and reliable data and information for the following factors of use impairment:
A. An index of biological integrity calculated from measurements of attributes of the resident fish community, including measurements of:
1) species diversity and composition; 2) feeding and reproduction characteristics; and 3) fish abundance and condition.
B. An index of biological integrity calculated from measurements of attributes of the resident aquatic invertebrate community, including measurements of:
1) species diversity and composition; 2) feeding characteristics; and 3) species abundance and condition.
C. An index of biological integrity calculated from measurements of attributes of the resident aquatic plant community, including measurements of:
1) species diversity and composition, including algae; and 2) species abundance and condition.
D. A quantitative or qualitative assessment of habitat quality, determined by an assessment of:
1) stream morphological features that provide spawning, nursery, and refuge areas for fish and invertebrates;
2) bottom substrate size and variety; 3) variations in water depth; 4) sinuosity of the stream course; 5) physical or hydrological alterations of the stream bed including excessive sedimentation; 6) types of land use in the watershed; and 7) other scientifically accepted and valid factors of habitat quality.
E. Any other scientifically objective, credible, and supportable factors.
A finding of an impaired condition must be supported by data for the factors listed in at least one of items A to C. The biological quality of any given surface water body will be assessed by comparison to the biological conditions determined for a set of reference water bodies which best represents the most natural condition for that surface water body type within a geographic region.

G u id an ce Man ua l for A sses s ing th e Minne sota Po l lut ion Contro l Age n cy Qua l i ty o f Minne sota Sur fac e Wate rs December 2011 5 0
Additional language supporting the use of narrative water quality standards in wetlands is found in Minn. R. ch. 7050.0222, subp. 6, which defines the protection of Class 2D waters (wetlands) as follow:
“The quality of Class 2D wetlands such as to permit the propagation and maintenance of a healthy community of aquatic and terrestrial species indigenous to wetlands, and their habitats. Wetlands also add to the biological diversity of the landscape. These waters shall be suitable for boating and other forms of aquatic recreation for which the wetland may be usable. This class of surface water is not protected as a source of drinking water. …”
The aquatic life use support assessment methodology described in this Guidance fully supports this narrative standard and protects the biological integrity of rivers, streams, and wetlands by:
• measuring attainment directly through sampling of the aquatic biota • controlling biological and sampling variability through regionalization, classification and strict
adherence to sampling protocol • establishing impairment thresholds based on data collected from reference (least-disturbed)
waters of the same class • incorporating a confidence limit (based on the repeatability of the IBI) to account for variability
within the aquatic community because of natural spatial and temporal differences and sampling or method errors
Biological Condition Gradient
The Biological Condition Gradient (BCG) is a conceptual model of aggregated biological knowledge used to describe changes in biological communities along a gradient of increasing stress. This model is based on a combination of ecological theory and empirical knowledge. A number of indices have been developed to measure the biological condition in aquatic systems (e.g., IBI, RIVPACS; Karr et al. 1986, Hawkins et al. 2000, Whittier et al. 2007), but these measures are based on the available conditions that are used to develop the models. The BCG differs from these in that it provides a common “yardstick” of biological condition that is rooted in the natural condition. As a result, the BCG can be used to develop biocriteria that are consistent across regions and stream types in Minnesota. This is particularly important for a state such as Minnesota where the range of conditions are regionally distinct and extreme (i.e., relatively pristine to degraded). The BCG divides biological condition into six levels that are intended to be manageable and useful for water quality managers (see BCG model below). More detailed descriptions of the BCG can be found in EPA (2005) and Davies and Jackson (2006).
The development of the BCG models for warmwater rivers and streams involved input from biological experts from the MPCA and Minnesota DNR familiar with aquatic communities in Minnesota. BCG models were developed for fish and macroinvertebrates for each of the 7 warmwater stream classes. A coldwater BCG was also developed and involved experts from Minnesota, Wisconsin, Michigan, and several tribes. In Minnesota this included 2 classes each for fish and macroinvertebrates. Model development for each class involved reviewing biological community data from monitoring sites and then assigning that community to a BCG level (1-6). A sufficient number of samples were assessed to develop a model which can duplicate the panel’s BCG level assignments. This model was then used to assign BCG levels to all monitoring sites in MPCA’s biological monitoring database.

Selection of Reference Sites for Rivers and Streams
Minnesota has developed an index to measure a priori the degree of human disturbance at a stream class called the Human Disturbance Score (HDS). The HDS includes both watershed and reach level measures of human disturbance which when combined have a maximum score of 81 (see Table 1 below). Reference sites for streams were identified as those with an HDS score of 61 or greater (i.e., a 25 percent decline from the maximum score). Reference sites for rivers (drainage area >300-500 mi2 depending on the class; Fish classes 1 and 4, Macroinvertebrate classes 1 and 2) were identified as those with an HDS score of 45 or greater (i.e., a 45 percent decline from the maximum score). The difference in HDS thresholds between different stream size classes was due to differences in how HDS scores relate to local biological condition. At equivalent HDS scores large rivers often perform better than small streams. This is in part due to the fact that the HDS uses several landscape measures that may reflect human activities far up in the watershed that have a reduced impact on the biological communities far downstream. Once sites were selected based on their HDS score, an additional filter was applied to remove sites disparately influenced by nearby stressors. All sites in close proximity to urban areas (site within or adjacent to urban area), feedlots (feedlot at or immediately upstream of site [only streams >50 mi2]), or point sources (continuous point source <5 mi upstream of site) were removed. The remaining sites (i.e., those meeting the HDS threshold and meeting the proximity criteria) were considered to be minimally or least disturbed and therefore representative of attainment of Minnesota’s aquatic life use goals. Reference sites were selected from each of the fish and macroinvertebrate classes and depending on the overall condition, the 25th or 10th percentile of IBI scores was determined. Northern and statewide stream classes used the 10th percentile due to the relatively good condition of these streams. The overall poorer condition of the southern stream classes necessitated the use of the 25th percentile to determine thresholds (see Table 2 below).
G u id an ce Man ua l for A sses s ing th e Minne sota Po l lut ion Contro l Age n cy Qua l i ty o f Minne sota Sur fac e Wate rs December 2011 5 1

G u id an ce Man ua l for A sses s ing th e Minne sota Po l lut ion Contro l Age n cy Qua l i ty o f Minne sota Sur fac e Wate rs December 2011 5 2
Table 1. Metrics and scoring for Minnesota’s Human Disturbance Score.
Human Disturbance Score Metric Scale Primary Metric or Adjustment
MaximumScore
Number of animal units per sq km watershed primary 10
Percent agricultural land use watershed primary 10
Number of point sources per square km watershed primary 10
Percent impervious surface watershed primary 10
Percent channelized stream per stream km watershed primary 10
Degree channelized at site reach primary 10
Percent disturbed riparian habitat watershed primary 10
Condition of riparian zone reach primary 10
Number of feedlots per sq km watershed adjustment -1
Percent agricultural land use on >3% slope watershed adjustment -1
Number of road crossings per sq km watershed adjustment -1 or +1
Percent agricultural land use in 100m buffer watershed adjustment -1
Feedlot adjacent to site reach (proximity) adjustment -1
Point source adjacent to site reach (proximity) adjustment -1
Urban land use adjacent to site reach (proximity) adjustment -1
Maximum 81
Table 2. Percentiles used to determine reference condition thresholds for Fish and Invertebrate IBI Classes (RR = riffle/run, GP = glide/pool).
Class Class Name Percentile Class Class Name Percentile Fish Invertebrates
1 Southern Rivers 25th 1 Northern Forest Rivers 10th 2 Southern Streams 25th 2 Prairie Forest Rivers 25th 3 Southern Headwaters 25th 3 Northern Forest 10th 4 Northern Rivers 10th 4 Northern Forest 10th 5 Northern Streams 10th 5 Southern Streams RR 25th 6 Northern Headwaters 10th 6 Southern Forest 25th 7 Low Gradient Streams 10th 7 Prairie Streams GP 25th
10 Southern Coldwater 25th 8 Northern Coldwater 10th 11 Northern Coldwater 10th 9 Southern Coldwater 25th