2012 annual salmon watcher report - king county, washington€¦ · watchers/reports.aspx. maps...
TRANSCRIPT

2012 Volunteer Salmon Watcher Program
Annual Report Lake Washington Watershed, Puget Sound WRIA 8 Streams,
and other Puget Sound Streams
June 2013

2012 Volunteer Salmon Watcher Program Lake Washington Watershed, Puget Sound WRIA 8 Streams, and other Puget Sound Streams
King County Water and Land Resources Division, in cooperation with: Lake Washington/Cedar/Sammamish Watershed (WRIA 8) Forum, Bellevue Stream Team, Cities of Bothell, Kirkland, Redmond, Renton, Seattle, and Woodinville, With support from King Conservation District.
Alternate Formats Available 206-296-7380 TTY Relay: 711

King County i 2011 Salmon Watcher Program Report
Summary The purpose of the Salmon Watcher Program is to document the distribution of spawning adult salmon throughout the greater Lake Washington Watershed via an active public outreach and education program and subsequently consolidate all the information into a single resource (this report). These data can be used to inform how aquatic resources are managed, to protect salmon and trout species, and to enhance their habitat.
For the 2012 program, 102 volunteers surveyed 106 sites on 40 streams from August 24, 2012, to February 19, 2013. Surveyed streams were located throughout the Lake Washington Watershed, other WRIA 8 streams in Central Puget Sound, and other streams draining to Puget Sound. Because volunteers collect the data in this program, the partnering jurisdictions are able to obtain more information from far more locations than would otherwise be possible. However, data in this report should be used with the following factors in mind:
(1) All volunteers have been trained, but volunteer expertise in locating and identifying fish species varies from very high to very low;
(2) Geographic and temporal coverage of streams by volunteers was not complete or consistent because: • Volunteers view stream sites for relatively brief periods of time during the spawning
season; • Determination of survey sites is based on volunteer availability and site accessibility (and
many survey locations change from year to year, even on the same creek); (3) Adult fish can be difficult to see and therefore may have passed through reaches undetected;
and (4) Volunteer data indicate only where minimum fish distributions extend to, but do not indicate
reaches where fish are definitively absent (in other words, the data may confirm fish presence but does not confirm absence).
This report describes the program methods, participation, and results. During the 2012 season, volunteers observed the following species: Chinook, sockeye, kokanee, coho, and chum salmon, as well as unspecified trout. The following results were compiled from volunteer observations: (1) Sockeye were seen in the greatest numbers (10,929, or 94 percent of all fish observed) and were seen in 7 out of 8 Lake Washington basins watched in 2012; (2) Chinook and coho were seen in 6 Lake Washington Watershed basins; (3) Kokanee were seen in very low numbers (15 enumerated) and were observed in 2 Lake Washington basins; and (4) Chum were reported in 3 streams draining to Puget Sound.
This report is published on the Internet and can be found using the hyperlinks on this web page: http://www.kingcounty.gov/environment/animalsAndPlants/salmon-and-trout/salmon-watchers/reports.aspx.
Maps included in this report have been published on the Internet and can be found using the hyperlinks on this web page: http://www.kingcounty.gov/environment/animalsAndPlants/salmon-and-trout/salmon-watchers/maps.aspx.
The home page for the Salmon Watcher Program web site is here: http://www.kingcounty.gov/environment/animalsandplants/salmon-and-trout/salmon-watchers.aspx.

King County ii 2011 Salmon Watcher Program Report
Acknowledgements Many thanks to all the dedicated volunteers for spending many hours in what is often cold and wet weather to collect the information for this report—some for the fourteenth year in a row, and some years without ever seeing a single fish. Without the volunteers there would be no data, no maps, and no report. They help make a positive difference in King County, not only by reporting fish species, but by acting as the eyes and ears of the streams, reporting stream blockages as well as occasionally suspect activities. They are the stewards of resources that make the Pacific Northwest so special. A huge Thank You to all our great volunteers!
We also want to acknowledge the various jurisdictions that support and participate in the program and their dedicated staff. Program partners are King County Water and Land Resources Division, Bellevue Stream Team, Redmond Stream Team, and the cities of Seattle, Bothell, Kirkland, Renton, and Woodinville. Thanks (in no particular order) to Laurie Devereaux, Debra Crawford, Peter Holte, Janet Geer, Gary Fink, Betsy Adams, Micah Bonkowski, Bill Malatinsky, Sarah Lindsay, Beth Miller, Lisa McCrink, Wendy Collins, and Karren Gratt. Every year these folks meet and plan the program, organize and stage the training sessions, and invest lots of time attending to the volunteers.
Jennifer Vanderhoof, from King County Water and Land Resources Division, Science Section, is the program’s technical lead and report author.
Finally, we would like to thank the Lake Washington/Cedar/ Sammamish Watershed (WRIA 8) Forum, which provided partial funding for this project through a King Conservation District grant.

King County iii 2011 Salmon Watcher Program Report
Table of Contents Summary ......................................................................................................................... i Acknowledgements ........................................................................................................ ii Table of Contents .......................................................................................................... iii List of Tables .................................................................................................................. iv List of Figures ................................................................................................................. v Introduction ................................................................................................................... 1 Methods ......................................................................................................................... 2
Volunteer Training .............................................................................................................. 3 Data Collection .................................................................................................................... 3 Quality Assurance/Quality Control ..................................................................................... 4
Results and Discussion .................................................................................................... 5 Volunteer Activity ............................................................................................................... 6 Contact with Residents ....................................................................................................... 6 Time Spent by Volunteers ................................................................................................... 7 Limitations of Volunteer Data ............................................................................................. 7
Fish Observation Summaries ........................................................................................... 8 Chinook Salmon .................................................................................................................. 9 Sockeye Salmon .................................................................................................................. 9 Coho Salmon ....................................................................................................................... 9 Kokanee ............................................................................................................................ 10 Chum ................................................................................................................................. 10 Unidentified Species ......................................................................................................... 10 Trout.................................................................................................................................. 10 Marked Fish and Juvenile Fish .......................................................................................... 10
Basin Summary ............................................................................................................. 12 Big Bear Creek Basin ......................................................................................................... 13 Cedar River Basin .............................................................................................................. 14 East Lake Washington Basin ............................................................................................. 16 West Lake Washington Basin ............................................................................................ 18 West Lake Sammamish Basin ........................................................................................... 18 Issaquah Creek Basin ........................................................................................................ 19 North Lake Washington Tributaries .................................................................................. 20 Sammamish River Tributaries ........................................................................................... 22 Puget Sound Streams ........................................................................................................ 24
References ................................................................................................................... 25 Appendix A ................................................................................................................... 26
Data Collection Form used in 2012 ................................................................................... 26 Appendix B ................................................................................................................... 28
Fauntleroy Creek Salmon Watch 2012 Summary ............................................................. 28

King County iv 2011 Salmon Watcher Program Report
List of Tables Table 1. Volunteer observers for the 2012 Salmon Watcher Program. ....................................................... 2 Table 2. Number of surveys per month during 2012 Salmon Watcher season. ........................................... 3 Table 3. Numbers of streams, sites, and volunteers involved in the 2012 spawning season. ..................... 5 Table 4. Number of resident contacts made by all Salmon Watcher volunteers in each of the
surveyed basins. ............................................................................................................................... 6 Table 5. Number of hours spent by Salmon Watcher volunteers in each of the surveyed basins. .............. 7 Table 6. Number of adipose fin clips as reported by volunteer Salmon Watchers. ................................... 11 Table 7. Species enumerated within surveyed basins during the 2012 Salmon Watcher season. ............ 12 Table 8. Stream number, site ID, site location (listed in river miles, RM), survey dates, total
number of surveys, number of volunteers, and years the sites were watched for each stream surveyed in the Big Bear Creek Basin relevant to the 2012 spawning season. ................. 13
Table 9. Site ID, RM, and fish counts (live and dead) with dates seen at each stream surveyed in the Big Bear Creek Basin for the 2012 spawning season. .............................................................. 13
Table 10. Stream number, site ID, site location (listed in river miles, RM), survey dates, total number of surveys, number of volunteers, and years the sites were watched for each stream surveyed in the Cedar River Basin relevant to the 2012 spawning season. ...................... 14
Table 11. Site ID, RM, and fish counts (live and dead) with dates seen at each stream surveyed in the Cedar River Basin for the 2012 spawning season. ................................................................... 15
Table 12. Stream number, site ID, site location (listed in river miles, RM), survey dates, total number of surveys, number of volunteers, and years the sites were watched for each stream surveyed in the East Lake Washington Basin relevant to the 2012 spawning season. ........................................................................................................................................... 16
Table 13. Site ID, RM, and fish counts (live and dead) with dates seen at each stream surveyed in the East Lake Washington Basin for the 2011 spawning season. .................................................. 17
Table 14. Stream number, site ID, site location (listed in river miles, RM), survey dates, total number of surveys, number of volunteers, and years the sites were watched for each stream surveyed in the West Lake Washington Basin relevant to the 2012 spawning season. ........................................................................................................................................... 18
Table 15. Site ID, RM, and fish counts (live and dead) with dates seen at each stream surveyed in the West Lake Sammamish Basin for the 2011 spawning season. ................................................ 18
Table 16. Stream number, site ID, site location (listed in river miles, RM), survey dates, total number of surveys, number of volunteers, and years the sites were watched for each stream surveyed in the West Lake Sammamish Basin relevant to the 2012 spawning season. ........................................................................................................................................... 18
Table 17. Stream number, site ID, site location (listed in river miles, RM), survey dates, total number of surveys, number of volunteers, and years the sites were watched for each stream surveyed in the Issaquah Creek Basin relevant to the 2012 spawning season. ................ 19
Table 18. Site ID, RM, and fish counts (live and dead) with dates seen at each stream surveyed in the Issaquah Creek Basin for the 2012 spawning season. ............................................................. 19
Table 19. Stream number, site ID, site location (listed in river miles, RM), survey dates, total number of surveys, number of volunteers, and years the sites were watched for each stream surveyed in the North Lake Washington Tributaries relevant to the 2012 spawning season. ........................................................................................................................... 20
Table 20. Site ID, RM, and fish counts (live and dead) with dates seen at each stream surveyed in the North Lake Washington Tributaries for the 2012 spawning season. ...................................... 21

King County v 2011 Salmon Watcher Program Report
Table 21. Stream number, site ID, site location (listed in river miles, RM), survey dates, total number of surveys, number of volunteers, and years the sites were watched for each stream surveyed in the Sammamish River Tributaries relevant to the 2012 spawning season. ........................................................................................................................................... 22
Table 22. Site ID, RM, and fish counts (live and dead) with dates seen at each stream surveyed in the Sammamish River Tributaries for the 2012 spawning season. ............................................... 23
Table 23. Stream number, site ID, site location (listed in river miles, RM), survey dates, total number of surveys, number of volunteers, and years the sites were watched for each stream surveyed in the Central Puget Sound relevant to the 2012 spawning season. ................. 24
Table 24. Site ID, RM, and fish counts (live and dead) with dates seen at each stream surveyed in Central Puget Sound for the 2012 spawning season. .................................................................... 24
List of Figures Figure 1. Basins and sites surveyed for the 2012 Salmon Watcher Program .............................................. 1 Figure 2. Total number of new and returning volunteers for each year of the Salmon Watcher Program. 5 Figure 3. Number of volunteers (defined as an individual, pair, or group) watching in the Lake
Washington Watershed from 1997 to 2012. .............................................................................. 6 Figure 4. Percentage of total fish observed in 2012 by volunteers in the Lake Washington Watershed. .. 8 Figure 5. Distribution of Chinook salmon in the program area based on Salmon Watcher observations. . 9 Figure 6. Distribution of sockeye salmon in the program area based on Salmon Watcher observations .. 9 Figure 7. Distribution of coho salmon in the program area based on Salmon Watcher observations. ...... 9 Figure 8. Distribution of kokanee in the program area based on Salmon Watcher observations. ........... 10
King County 1 2012 Salmon Watcher Program Report
Introduction The Salmon Watcher Program is a volunteer program that originated in 1996 with the purpose of recording observations of adult fall-spawning salmonids. Volunteers are recruited and trained to identify and watch for spawning salmon throughout Water Resource Inventory Area 8 (WRIA 8), which includes the Lake Washington Watershed and some streams leading to Puget Sound (Figure 1). Regional agencies who participated in the Salmon Watcher Program along with King County during the 2012 season include the Bellevue Stream Team, the cities of Bothell, Kirkland, Issaquah, Redmond, Renton, Seattle, and Woodinville.
The Salmon Watcher Program was initiated to expand on current efforts undertaken by resource agencies (such as Washington Department of Fish and Wildlife) to document the distribution of spawning salmon in WRIA 8. Eight basins comprise the Lake Washington Watershed, including Bear Creek, Cedar River, East Lake Washington, West Lake Sammamish, East Lake Sammamish, West Lake Sammamish, Issaquah Creek, and North Lake Washington (divided into the North Lake Washington tributaries and the Sammamish River tributaries). Other streams in WRIA 8 that were watched included Pipers, Venema, and Boeing creeks, all of which flow directly to Puget Sound.
Salmon Watcher volunteers annually collect information on the presence of fall-spawning salmonids, including Chinook, coho, sockeye, kokanee (resident form of sockeye), and chum salmon, as well as trout species. Data of this type become more important in the region as salmonid populations, in particular Puget Sound Chinook, are listed under the Endangered Species Act.
Because unpaid volunteers do this work, the program allows for gathering a large volume of salmon presence data with reduced agency resources. With current budget and time constraints of agency personnel, much of the data collected in this effort would not be collected otherwise. The Watershed’s residents can become involved and educated at the same time, and this involvement enhances their appreciation for the resource and increases the likelihood they will implement salmon-friendly practices in daily life. Further, interactions with agency personnel foster positive relationships between the public and government agencies.
In addition to summaries of fish observed during the fall season, this 2012 report contains information and some statistics about the volunteers. It should be noted that this report summarizes data collected only by Salmon Watcher volunteers, and it is therefore in no way intended to be an exhaustive report of fish distribution in WRIA 8. Other fish surveys are conducted annually by county, state, city, and federal agencies and non-profit organizations; results of these surveys are reported separately and are not included here.
Figure 1. Basins and sites surveyed for the 2012 Salmon Watcher Program (URL: http://www.kingcounty.gov/environment/animalsAndPlants/salmon-and-trout/salmon-watchers/maps/~/media/environment/animalsAndPlants/salmon_and_trout/SWMaps/1305_3306Fig1.ashx)

King County 2 2012 Salmon Watcher Program Report
Methods Program partners recruited volunteers during late summer and early fall of 2012 to observe fish in streams throughout the Lake Washington Watershed1 and other WRIA 8 streams plus streams within City of Seattle’s jurisdiction that are in WRIA 9. The 102 volunteers who participated in the program are listed in Table 1 (totals: 102 individuals, pairs, or groups totaling 118 people).
Table 1. Volunteer observers for the 2012 Salmon Watcher Program. Ann Aagaard Jeanne Hannah Cindy Reed Staci Adman Martin Hanson David L. Reitz Jack Armstrong Cameron Haslam Larry Reymann Russ Atkins Evelyn Heath David Richardson Kathleen Auld Ruth Ihlenfeldt Helen Romao Danielle Bannier Deborah Jensen Shirley & Isaac Rowe Ed Barnes Charles Johnson Kathleen Ryan Hilary Barnes Pam Kelly Ed Schein Cathleen Barry Bob Klee Bernice & Joe Schick Judith Barry Janusz Komorowski Kiyomi, Allan, & Jesse Sharp Winston Booth Tommy Kraft Patty & Dave Shelton Cindy Boyer Robert Larkin John & Peggy Sherman Richard Brashen Jim Laughlin Neil & Tim Skilton Janet Broadus Ginny Lodwig Gary Smith Arlene & Jarred Bruce Ken Mackey Brent Spurgeon Heather & Ryann Burton Ron Marshall Catherine Spurgeon Dick & Jane Christie Maria Matthews John, Johnny, & Becky Stephenson Nancy Daar John McAlpine Mike Stults Tianmin & Siyao Ding Michael McGunnigle Inge Theisen Ken Dorsch Jim McRoberts Krys Tierney Amelia Dumovic Jeff Mendenhall Kay Tokuda Bridget DuRuz Dave Mickelson Gary Tribble Gary Emerson Chris Mitchell Terry Trimingham Mary Farley Ethan Muhlestein Mary Vincent Dorothy Fischer Brian (Danny) Murray Leslie Waters Adrienne Fox Greta Nelson Todd Wentworth Hon Cheung Fung Veleda & Jerry Asher Nelson Andy Wickens Erik Gilbertson Paul & Patty Olmstead Mark Wilbert Karen Gilbertson Yoshiko Otonari David Wilbur Laurie Gogic Tammy Parise Jeff Williams Doug Greaves Betty Peltzer Karen Winter Rhoda Green Gary Pilawski Angie Woodstock Ron Green Katherine Quinn-Dumovic Andy Wright Carly Greyell Kelly Rau Ramalee & Lucas Wulf
1 In this document, the Lake Washington Watershed means all waters draining through the Ballard Locks, and the subbasins of the Lake Washington Watershed are referred to as basins (e.g., Issaquah Creek Basin).

King County 3 2012 Salmon Watcher Program Report
Volunteer Training Agency staff held a total of 4 classroom training sessions in 2012. Approximately 64 people attended a training session, and of those, about 19 were returning volunteers from prior seasons. Returning volunteers are not required to attend a training every year; however, they are encouraged to attend a session every other year.
During training sessions, all volunteers were taught to identify adult spawning salmon species with a slide presentation, which was placed on King County’s web site so volunteers could review it any time. During the training sessions, volunteers signed up for one or more sites to survey. They were given salmon identification materials, including color adult salmon identification cards and spawner timing charts. Volunteers were taught how to fill out and return data forms.
Some survey locations were prioritized by staff from each cooperating jurisdiction based on the need for information. However, sites were typically surveyed based on volunteer choice and availability. Volunteers were assigned to stream locations near their homes or customary walking places whenever possible. Volunteers were instructed to stay on public property (bridges, parks, etc.) unless they gained permission from the landowners to enter private property or the survey location was on their own property. Figure 1 shows all the sites watched by volunteers during the 2012 fall spawning season.
Data Collection Volunteers conducted surveys between August 24, 2012, and February 19, 2013, though most surveys began in September and were concluded in November or December (Table 2). Volunteers were asked to watch at their survey sites for at least 15 minutes, twice per week, and record any adult salmonids they observed. Actual survey frequency and duration varied greatly among volunteers.
Table 2. Number of surveys per month during 2012 Salmon Watcher season. Month Number of Surveys August 1
September 311 October 1,103
November 861 December 350 January 19 February 4
Volunteers counted all live and dead adult salmonids they observed. If a volunteer surveyed the same site more than one time on the same day, the highest fish count was used; however, occasionally more than one volunteer surveyed the same site on a single day and their individual observations were used. Volunteers were asked to report only once those dead fish observed on more than one occasion and to note subsequent observations of the same fish in their comments. Juvenile fish were noted if present. Unidentified fish were counted and described when possible.
Volunteers also reported if they could tell whether the fish they saw had an adipose fin. Volunteers noted how many citizens they came into contact with during their streamside duties. They were also asked if they noticed anything at their site that needed to be reported and whether they

King County 4 2012 Salmon Watcher Program Report
reported it. All data were recorded onto field data forms (Appendix A), which were mailed to Salmon Watcher staff on a monthly basis.
Volunteers were asked to fill out a “First Fish ID” form the first time they saw a new species and to turn the forms in with their data. This form had several multiple-choice questions about various key characteristics for identifying fish. The purpose of this form is twofold: (1) to aid volunteers in identification by highlighting key characteristics, and (2) to aid Salmon Watcher staff in quality control.
Quality Assurance/Quality Control Program staff used several means to assure that the data collected from volunteers were as accurate and consistent as possible during all phases of the program. Volunteers were provided with training by fish experts: data included in this report were collected either by returning volunteers or new volunteers who attended one of the training sessions for the 2012 season. Volunteers were provided laminated fish identification cards and a packet of training materials that included fish identification information. Duplicate as well as additional fish identification materials were placed on the Internet. Contact persons were made available to volunteers to answer questions and verify species identification when necessary; volunteers were encouraged to call upon these individuals if they were unsure of species identification.
Staff receiving volunteer data sheets screened them for anything requiring immediate attention such as an unusual fish sighting or potential water quality problems. If an unusual fish sighting was noticed on a data form, agency staff contacted the volunteer to further inquire about what characteristics were used to identify the fish. The First Fish ID forms were intended to provide another means by which fish identifications could be checked and verified.
Data were input into a SQL server database housed at King County. The database has been designed to catch anomalies in data entry, such as dates falling outside the sampling season. The database also poses questions when it detects that a count of a certain species has never been as high at that site in that month in previous years. These and other checks were built into the database software to increase accuracy of input data. Following data entry, the data were verified at least once by agency staff to ensure accuracy, as well as catch anything that might need addressing. The data reviewers are familiar with the basins and the fish runs typical for the basins.
Because of the limitations of data collected without the use of a rigorous scientific protocol (see Limitations of Volunteer Data, page 7), these data are intended to be used only to make preliminary evaluations of the distribution of spawning salmonids in the Lake Washington Watershed.

King County 5 2012 Salmon Watcher Program Report
Results and Discussion In 2012, a total of 106 sites on 40 streams were surveyed by 102 volunteers (Table 3).
Table 3. Numbers of streams, sites, and volunteers involved in the 2012 spawning season.
Area # sites # streams # volunteers
Lake Washington Watershed 96 36 95
Puget Sound Streams 10 4 7
Total 106 40 102
In 2012, 80 out of 102 volunteers (78 percent) participating in the program area were returnees (Figure 2). Of the 80 returnees, 2 have surveyed every year since the program began in 1996.
Figure 2. Total number of new and returning volunteers for each year of the Salmon Watcher Program.
0
50
100
150
200
250
1996
1997
1998
1999
2000
2001
2002
2003
2004
2005
2006
2007
2008
2009
2010
2011
2012
# of
Vol
unte
rs
Spawning Season
new returning

King County 6 2012 Salmon Watcher Program Report
Volunteer Activity The trend in the number of volunteers participating in the Salmon Watcher Program has varied over the 17 years of the program (Figure 3; data for 1996 not cataloged). Many volunteers watch more than one site, and many sites have more than one volunteer watching at it. Numbers of volunteers participating and numbers of sites and streams watched has remained relatively steady since 2004. However, the trend since 2006 has been a slight decrease in volunteer participation, generally a result of fewer new recruits.
Figure 3. Number of volunteers (defined as an individual, pair, or group) watching in the Lake Washington Watershed from 19972 to 2012.
Contact with Residents Volunteers were asked to keep track of how many people they came into contact with during their time by the streams. Salmon Watcher volunteers spoke with at least 536 people during the 2012 spawning season. Table 4 details the numbers of people who interacted with volunteers.
Table 4. Number of resident contacts made by all Salmon Watcher volunteers in each of the surveyed basins.
Big Bear Creek
Cedar River
E. Lake Wash.
W. Lake Wash.
W. Lake Samm.
Issaquah Creek
N. Lake Wash.
Samm. River Tribs.
Puget Sound
Total
69 51 132 6 0 3 68 126 81 536
2 See previous Salmon Watcher annual reports for details on yearly participation.
0
50
100
150
200
250 # sites
# volunteers
# streams

King County 7 2012 Salmon Watcher Program Report
Time Spent by Volunteers Salmon Watcher volunteers are asked to record the start and end times of each site visit. Those times are used to calculate the amount of time volunteers spend watching stream-side. Occasionally, some volunteers do not fill in that part of the data sheet. Additionally, some volunteers watched twice a day, and only one time period is included in these calculations. These factors result in an under-estimation of actual time volunteers watched for fish. Table 5 illustrates the approximate amount of time spent by volunteers in each basin. More than 835 hours were spent streamside by volunteers during the 2012 Salmon Watcher season.
Table 5. Number of hours spent by Salmon Watcher volunteers in each of the surveyed basins.
Big Bear Creek
Cedar River
E. Lake Wash.
W. Lake Wash.
W. Lake Samm.
Issaquah Creek
N. Lake Wash.
Samm. River Tribs.
Puget Sound
Total
70.2 152.8 321.8 5.2 2.4 22 98.3 125.2 37.4 835.3
Limitations of Volunteer Data Several qualifications should be kept in mind when reviewing the data in this report and especially when using the data for any purpose other than describing fish presence.
Every year volunteers from previous years return and new volunteers enter the program who must learn to identify the different species of salmonids they might encounter in their assigned streams. (The number of returning volunteers has remained relatively consistent for the past 8 years at around 60 percent.) The level of expertise of the volunteers varies widely: some volunteers have past experience identifying fish through professional or school training, recreational fishing, or personal interest. Other volunteers learned to identify salmon for the first time from the Salmon Watcher training session.
Although training sessions are thorough, identification materials are provided, and technical experts are available for help with identification, some misidentifications inevitably occur.
It is important to keep in mind that the absence of spawner sightings at a watched stream site (or in a stream) does not mean that spawning salmonids are not accessing that location or stream. It simply means that fish were not seen by the volunteer at the time of the survey. With very few exceptions, because most or all parameters (such as what sites were watched when, for how long, and by whom) are different for every stream surveyed from 1996 through 2012, comparisons of raw data likely would not yield valid information about changes in fish populations. Therefore, the best use for the fish data is in determining presence of fish and mapping fish distribution. For additional discussion on the limitations of volunteer data, please see previous reports (e.g., King County 2004).

King County 8 2012 Salmon Watcher Program Report
Fish Observation Summaries Salmon Watcher Program volunteers recorded observations of all salmonid fish located during their stationary surveys, including Chinook, coho, and sockeye salmon, kokanee, and trout (which may have been cutthroat or rainbow trout).
Of the 40 total streams surveyed in 2012, sockeye were found in 16 streams, coho were found in 10 streams, Chinook in 14 streams, kokanee were reported in 2 streams, chum were observed in 3 streams, and trout were reported in 3 streams. Fourteen streams had no adult salmonids reported.
If a volunteer was unable to positively identify what species a fish was, the fish was tallied as “unidentified” (reporting a fish as unidentified was preferable to misidentifying a species). Of the 11,971 total adult fish observed in the Lake Washington Watershed, other WRIA 8 streams, and other streams draining to Puget Sound in 2012, 322 were tallied as unidentified (2.7 percent). That percentage is very low compared to most years. For more information, see the section called “Unidentified Species” below.
The percentages of all fish observed in the Lake Washington Watershed (11,625 including unidentified fish), is depicted in Figure 4. Sockeye was the most abundant species counted by volunteers in the Lake Washington Watershed by far, followed by Chinook.
Figure 4. Percentage of total fish observed in 2012 by volunteers in the Lake Washington Watershed.

King County 9 2012 Salmon Watcher Program Report
Chinook Salmon Chinook were observed in 6 of the 8 Lake Washington basins observed during the 2012 surveys (Figure 5). A total of 278 live fish and 7 carcasses were found in 14 streams throughout the Lake Washington Watershed. Streams in which Chinook were reported include (in order of most to least fish seen): Sammamish River (119), Cottage Lake Creek (47), Big Bear Creek (28), North Creek (20), Taylor Creek (17), Issaquah Creek (11), Coal Creek (11), Carey Creek (9), Kelsey Creek (8), Cedar River (6), Cedar River Side Channel at Dorre Don (5), Mercer Slough (2), May Creek (1), and Little Bear Creek (1).
Figure 5. Distribution of Chinook salmon in the program area based on Salmon Watcher observations. (URL: http://www.kingcounty.gov/environment/animalsAndPlants/salmon-and-trout/salmon-watchers/maps/~/media/environment/animalsAndPlants/salmon_and_trout/SWMaps/1305_3306Fig5ChinDist.ashx)
Sockeye Salmon Sockeye were the most numerous fish counted by volunteers. Sockeye were observed in 7 Lake Washington basins (Figure 6). A total of 9,869 live fish and 1,060 carcasses were observed in 15 streams (in order of most to least fish seen): Cedar River (7,674), Little Bear Creek (1,233), North Creek (740), Big Bear Creek (732), May Creek (185), Taylor Creek (165), Taylor Creek (Seattle) (66), Sammamish River (46), Coal Creek (36), Cedar River Side Channel at Dorre Don (20), Carey Creek (14), Cottage Lake Creek (9), Rock Creek (5), Rutherford Creek (3), and Mercer Slough (1).
The sockeye reported in Seattle’s Taylor Creek (in the West Lake Washington basin) marks the first time sockeye have been observed by Salmon Watcher volunteers in this creek. Sockeye were also reported in Rutherford Creek (Bear Creek basin) for the first time by a volunteer.
Figure 6. Distribution of sockeye salmon in the program area based on Salmon Watcher observations. (URL: http://www.kingcounty.gov/environment/animalsAndPlants/salmon-and-trout/salmon-watchers/maps/~/media/environment/animalsAndPlants/salmon_and_trout/SWMaps/1305_3306Fig6SockDist.ashx)
Coho Salmon Coho were observed in 6 Lake Washington Watershed basins plus three catchments draining to Puget Sound (Figure 7). A total of 123 live coho and 63 carcasses were reported in 10 streams in the Lake Washington Watershed and 3 streams that drains to Puget Sound (in order of most to least fish seen): Boeing Creek (56), Longfellow Creek (50), Cedar River (18), Coal Creek (16), May Creek (15), Big Bear Creek (8), Little Bear Creek (7), Taylor Creek (Seattle) (6), Issaquah Creek (4), Cottage Lake Creek (3), North Creek (1), Peterson Creek (1), Pipers Creek (1).
The coho reported in Seattle’s Taylor Creek (in the West Lake Washington basin) marks the first time coho have been observed by Salmon Watcher volunteers in this creek.
Figure 7. Distribution of coho salmon in the program area based on Salmon Watcher observations. (URL: http://www.kingcounty.gov/environment/animalsAndPlants/salmon-and-trout/salmon-watchers/maps/~/media/environment/animalsAndPlants/salmon_and_trout/SWMaps/1305_3306Fig7CohoDist.ashx)

King County 10 2012 Salmon Watcher Program Report
Kokanee Kokanee were observed in 2 Lake Washington Watershed basins (Figure 8). A total of 15 live fish were counted in 2 streams: Little Bear Creek (14) and Big Bear Creek (1).
Figure 8. Distribution of kokanee in the program area based on Salmon Watcher observations. (URL: http://www.kingcounty.gov/environment/animalsAndPlants/salmon-and-trout/salmon-watchers/maps/~/media/environment/animalsAndPlants/salmon_and_trout/SWMaps/1305_3306Fig8KokDist.ashx)
Chum A total of 175 live chum and 55 carcasses were counted in 3 streams: Pipers Creek (158),Venema Creek (52), and Boeing Creek (20).
Unidentified Species Fish of unidentified species (247 live fish and 75 carcasses) were observed in 16 streams in 5 basins in the Lake Washington Watershed and in 1 stream that drains to Puget Sound. Streams in which fish of unidentified species were reported include (in order of most to least fish seen): Sammamish River (114), Big Bear Creek (69), Cedar River (64), Taylor Creek (16), Little Bear Creek (12), North Creek (12), Coal Creek (9), Pipers Creek (9), Kelsey Creek (5), Cedar River Side Channel at Dorre Don (4), May Creek (2), Peters Creek (2), Cottage Lake Creek (1), Juanita Creek (1), Richards Creek (1), and Willow Creek (1). The number of fish that went unidentified was approximately 2.7 percent of fish reported. Unidentified species sightings can be important: in 2012, the first and thus far only fish ever seen by a Salmon Watcher volunteer in Willow Creek (North Lake Washington Tribs.) was an unidentified dead salmon. 2012 marked the 8th season this creek was observed with a total of over 45 hours streamside.
Trout Four live trout (not identified to species) were reported in 3 creeks (Bear Creek, Little Bear Creek, and Richards Creek) in the Lake Washington Watershed in 2012.
Marked Fish and Juvenile Fish On the data forms (Appendix A), one column asked the volunteers to note the “# of fish without adipose.” Hatcheries in the Lake Washington Watershed remove the adipose fins of Chinook and coho before they are released into the stream. Volunteers were instructed to focus on species identification first and foremost and only try to report on adipose fin clips when possible. Most volunteers did not fill in this column, or sometimes they noted they could not tell. Generally, water clarity must be excellent and the fish must be close and somewhat still in order to determine the presence of an adipose fin on a live fish.
No sockeye have their adipose fins clipped. However, volunteers reported 9 sockeye without adipose fins (Table 6). Because sockeye are too small to have their adipose fins clipped when they are released from hatcheries, their adipose fins remain intact. Therefore, if sockeye are reported with missing adipose fins, either the fish are sockeye with adipose fins that were difficult to see in the stream, or the fish were another species such as coho who were missing their adipose fins. Because it is often hard to determine the presence of adipose fins, and because sockeye were the

King County 11 2012 Salmon Watcher Program Report
most abundant species in 2012, it is likely these fish were all sockeye with their adipose fins intact. (Although these data suggest a likely reporting error, it should be noted that the final number of sockeye reported as being clipped in 2012 was extremely low –0.08 percent of all sockeye reported).
Table 6. Number of adipose fin clips as reported by volunteer Salmon Watchers.
*See text for discussion about sockeye reported with adipose clips.
In some years, certain species of salmon are tagged (usually near the base of the dorsal fin) for scientific research when they enter the Ballard Locks. Fish tagged elsewhere may stray into the Lake Washington Watershed. It is also possible a fish was tagged when straying, then it returned to its birth stream in the Lake Washington Watershed. Volunteers are asked to record when they see tagged fish, and they are asked to notify a staff member. In 2012, 200 Chinook were tagged at the Locks; 11 tagged fish were observed by volunteers in three streams: Sammamish River, Bear Creek, and Taylor Creek (in the Cedar River Basin).
Volunteers made note of fry and/or juvenile fish in a total of 23 streams (Big Bear Creek, Boeing Creek, Cedar River, Coal Creek, Cottage Lake Creek, Issaquah Creek, Juanita Creek, Kelsey Creek, Little Bear Creek, Little Swamp Creek, May Creek, Mercer Slough, North Creek, Peters Creek, Pipers Creek, Richards Creek, Rutherford Creek, Sammamish River, Swamp Creek, Taylor Creek, Venema Creek, West Trib. Kelsey Creek, and Willow Creek).
Stream Chinook Coho Sockeye* Unid. Total Big Bear Creek 1 1 2 Boeing Creek 18 18 Carey Creek 5 5 Coal Creek 2 2 Cottage Lake Creek 10 10 Issaquah Creek 2 2 Kelsey Creek 1 1 North Creek 4 4 Pipers Creek 1 1 Taylor Creek (Cedar River Basin) 1 1
Total 15 20 9 2 46

King County 12 2012 Salmon Watcher Program Report
Basin Summary For the 2012 spawning season, Sockeye were reported in the largest numbers in the Cedar River Basin followed by the Sammamish River Tributaries. Chinook were reported in the greatest numbers in the North Lake Washington Tributaries (Table 7). Kokanee were seen in very small numbers in only 2 basins. Sockeye were seen in the most number of basins (7).
Table 7. Species enumerated within surveyed basins during the 2012 Salmon Watcher season.
Basin Chinook Chum Coho Kokanee Sockeye Trout Unid.* Basin Total
Big Bear Creek 75 0 11 1 744 1 70 902
Cedar River 28 0 19 0 7864 0 84 7,995
East Lake Washington 22 0 31 0 222 1 17 326
East Lake Sammamish 0 0 0 0 0 0 0 0
West Lake Washington 0 0 6 0 66 0 0 72
Issaquah Creek 20 0 4 0 14 0 0 38
North Lake Washington Tribs. 119 0 0 0 46 0 118 283
Samm. River Tribs. 21 0 8 14 1973 2 24 2,009
Middle Puget Sound - WRIA 8 0 230 57 0 0 0 9 296
Central Puget Sound - WRIA 9 0 0 50 0 0 0 0 50
Species Total 285 230 186 15 10,929 4 322 11,971 *Unidentified species.
The remainder of this report presents detailed results for each basin in the program. Data include stream name and state stream numbers as assigned in the “stream catalog” by Williams et al. (1975), corresponding stream sites (with Site ID and river mile), dates of surveys, number of surveys, number of surveyors, and number of each species observed. The unique Site ID numbers that correspond with each survey site are used to distinguish the sites. A site, with its unique ID number, will always have the same data associated with it, regardless of refined river mile (RM) designations. River mile designations are generally derived from the stream catalog combined with measurements made using King County’s Geographic Information System. Additionally, a designated site may vary a few feet from year to year: (1) if a volunteer watches on the upstream side of a bridge versus the downstream side, (2) if a new volunteer happens to watch a few yards from where a previous watcher observed, (3) if a volunteer moves a few feet to observe in an area of better spawning habitat or visibility, or (4) if restoration and/or overgrown vegetation improves or obstructs the view.
The streams surveyed in the Lake Washington Watershed were grouped into the following eight basins: Big Bear Creek, Cedar River, East Lake Washington, East and West Lake Sammamish, Issaquah Creek, and North Lake Washington (split into North Lake Washington tributaries and Sammamish River tributaries). Salmonids were observed in all basins surveyed in 2012 except East Lake Sammamish.
King County 13 2012 Salmon Watcher Program Report
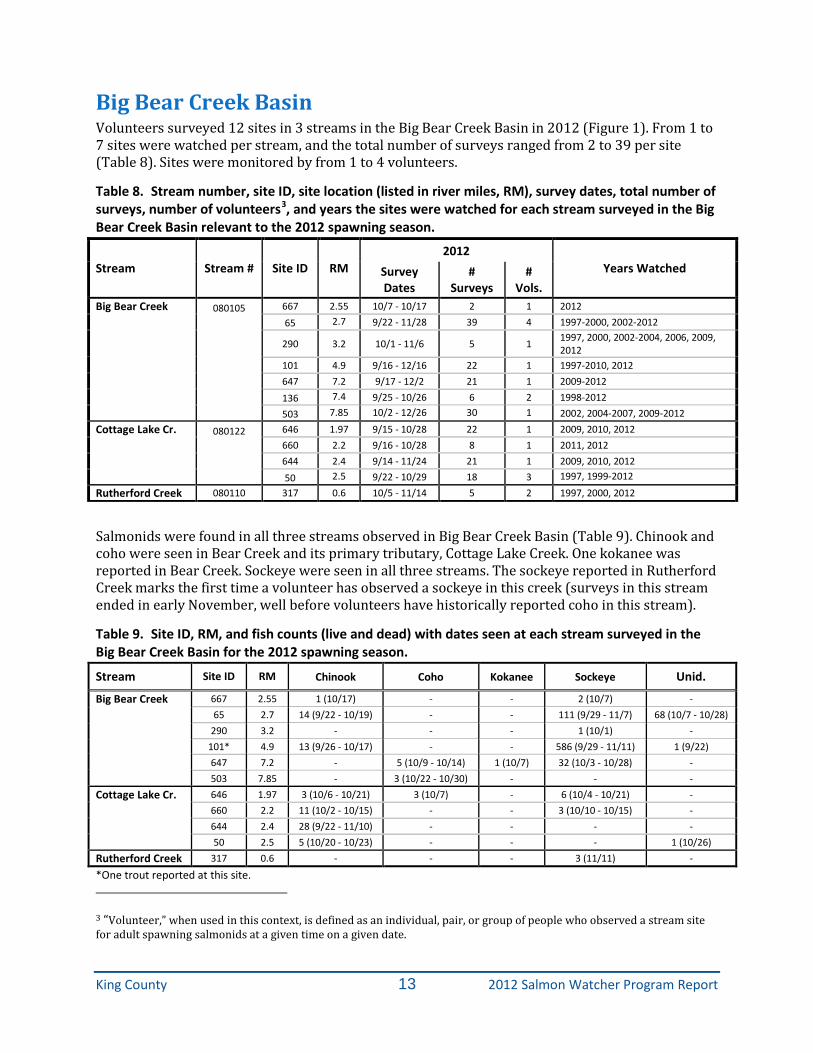
Big Bear Creek Basin Volunteers surveyed 12 sites in 3 streams in the Big Bear Creek Basin in 2012 (Figure 1). From 1 to 7 sites were watched per stream, and the total number of surveys ranged from 2 to 39 per site (Table 8). Sites were monitored by from 1 to 4 volunteers.
Table 8. Stream number, site ID, site location (listed in river miles, RM), survey dates, total number of surveys, number of volunteers3, and years the sites were watched for each stream surveyed in the Big Bear Creek Basin relevant to the 2012 spawning season.
Stream Stream # Site ID RM 2012
Years Watched Survey Dates
# Surveys
# Vols.
Big Bear Creek 080105 667 2.55 10/7 - 10/17 2 1 2012 65 2.7 9/22 - 11/28 39 4 1997-2000, 2002-2012 290 3.2 10/1 - 11/6 5 1 1997, 2000, 2002-2004, 2006, 2009,
2012 101 4.9 9/16 - 12/16 22 1 1997-2010, 2012 647 7.2 9/17 - 12/2 21 1 2009-2012 136 7.4 9/25 - 10/26 6 2 1998-2012 503 7.85 10/2 - 12/26 30 1 2002, 2004-2007, 2009-2012 Cottage Lake Cr. 080122 646 1.97 9/15 - 10/28 22 1 2009, 2010, 2012 660 2.2 9/16 - 10/28 8 1 2011, 2012 644 2.4 9/14 - 11/24 21 1 2009, 2010, 2012 50 2.5 9/22 - 10/29 18 3 1997, 1999-2012
Rutherford Creek 080110 317 0.6 10/5 - 11/14 5 2 1997, 2000, 2012
Salmonids were found in all three streams observed in Big Bear Creek Basin (Table 9). Chinook and coho were seen in Bear Creek and its primary tributary, Cottage Lake Creek. One kokanee was reported in Bear Creek. Sockeye were seen in all three streams. The sockeye reported in Rutherford Creek marks the first time a volunteer has observed a sockeye in this creek (surveys in this stream ended in early November, well before volunteers have historically reported coho in this stream).
Table 9. Site ID, RM, and fish counts (live and dead) with dates seen at each stream surveyed in the Big Bear Creek Basin for the 2012 spawning season.
Stream Site ID RM Chinook Coho Kokanee Sockeye Unid.
Big Bear Creek 667 2.55 1 (10/17) - - 2 (10/7) - 65 2.7 14 (9/22 - 10/19) - - 111 (9/29 - 11/7) 68 (10/7 - 10/28) 290 3.2 - - - 1 (10/1) - 101* 4.9 13 (9/26 - 10/17) - - 586 (9/29 - 11/11) 1 (9/22) 647 7.2 - 5 (10/9 - 10/14) 1 (10/7) 32 (10/3 - 10/28) - 503 7.85 - 3 (10/22 - 10/30) - - - Cottage Lake Cr. 646 1.97 3 (10/6 - 10/21) 3 (10/7) - 6 (10/4 - 10/21) - 660 2.2 11 (10/2 - 10/15) - - 3 (10/10 - 10/15) - 644 2.4 28 (9/22 - 11/10) - - - - 50 2.5 5 (10/20 - 10/23) - - - 1 (10/26) Rutherford Creek 317 0.6 - - - 3 (11/11) -
*One trout reported at this site. 3 “Volunteer,” when used in this context, is defined as an individual, pair, or group of people who observed a stream site for adult spawning salmonids at a given time on a given date.

King County 14 2012 Salmon Watcher Program Report
Cedar River Basin Volunteers surveyed 16 sites in 6 streams in the Cedar River Basin in 2012 (Figure 1). From 1 to 6 sites were watched per stream, and the total number of surveys ranged from 2 to 98 per site (Table 10). Sites were monitored by 1 to 3 volunteers.
Table 10. Stream number, site ID, site location (listed in river miles, RM), survey dates, total number of surveys, number of volunteers, and years the sites were watched for each stream surveyed in the Cedar River Basin relevant to the 2012 spawning season.
Stream Stream # Site ID RM 2012
Years Watched Survey Dates #
Surveys #
Vols. Cedar River 080299 595 0 9/1 - 11/22 20 1 2006, 2009, 2010, 2012
198 0.1 9/5 - 11/22 19 1 2009, 2010, 2012 199 1.0 9/5 - 12/16 34 2 1999, 2006, 2009-2012 205 2.9 9/18 - 11/15 5 1 1999, 2001, 2005-2008, 2011, 2012 207 5.3 9/7 - 12/15 25 1 1999-2003,2005-2007, 2011, 2012 (Cavanaugh Pond) 139 6.4 10/10 - 2/19/13 24 1 1997-2012
C.R. Side Channel - 557 0.15 9/24 - 12/23 21 2 2003, 2005-2012 Madsen Creek 080305 156 0.2 9/29 - 10/7 2 1 1999, 2000, 2012 Peterson Creek 080328 25 1.5 9/23 - 12/23 16 1 2000,2002, 2011, 2012 Rock Creek 080338 410 0.2 9/30 - 12/8 70 1 2001-2012 154 0.4 9/30 - 12/8 21 1 1999-2010, 2012 Taylor Creek 080320 588 0.37 9/24 - 12/17 98 3 2004-2012 596 0.5 9/30 - 12/8 70 1 2004-2012 655 0.6 9/24 - 12/8 84 3 2010-2012 71 1.8 9/30 - 12/8 21 1 1998-2010, 2012 126 2.4 9/30 - 12/8 21 1 1998, 2001-2010, 2012
Chinook were observed in the Cedar River and Taylor Creek (Table 11). Sockeye were observed in the Cedar River, Taylor Creek, and in Rock Creek. Coho were seen in the Cedar River and one coho was reported in Peterson Creek (the only fish seen in Peterson Creek). No fish were seen in Madsen Creek.

King County 15 2012 Salmon Watcher Program Report
Table 11. Site ID, RM, and fish counts (live and dead) with dates seen at each stream surveyed in the Cedar River Basin for the 2012 spawning season.
Stream Site ID RM Chinook Coho Sockeye Unidentified
Cedar River 595 0 - - 738 (9/1 - 11/22) - 198 0.1 - - 501 (10/1 - 11/22) - 199 1 5 (9/13 - 10/23) - 5086 (9/13 - 12/16) 21 (10/7 - 12/16) 205 2.9 - - - 25 (10/7 - 11/15)
207 5.3 1 (10/13) 18 (9/26 - 11/1) 617 (9/14 - 11/30) 18 (9/26 - 11/12) (Cavanaugh Pond) 139 6.4 - - 732 (10/15 - 2/16/2013) - C.R. Side Channel 557 0.15 5 (10/4 - 10/23) - 20 (10/23 - 11/20) 4 (10/25 - 11/28)
Madsen Creek 156 0.2 - - - - Peterson Creek 25 1.5 - 1 (11/2) - - Rock Creek 410 0.2 - - 5 (10/21 - 11/5) - 154 0.4 - - - - Taylor Creek 588 0.37 17 (9/24 - 10/19) - 78 (9/30 - 11/28) 15 (10/1 - 11/28) 596 0.5 - - 81 (10/5 - 11/30) - 655 0.6 - - 6 (10/28 - 11/17) 1 (10/28) 71 1.8 - - - - 126 2.4 - - - -

King County 16 2012 Salmon Watcher Program Report
East Lake Washington Basin Volunteers surveyed 25 sites in 8 streams in the East Lake Washington Basin in 2012 (Figure 1). From 1 to 8 sites were watched per stream, and the total number of surveys ranged from 10 to 88 per site (Table 12). Each site was monitored by 1 to 4 volunteers.
Table 12. Stream number, site ID, site location (listed in river miles, RM), survey dates, total number of surveys, number of volunteers, and years the sites were watched for each stream surveyed in the East Lake Washington Basin relevant to the 2012 spawning season.
Stream Stream # Site ID RM 2012
Years Watched Survey Dates # Surveys
# Vols.
Coal Creek 080268 46 0.8 9/29 - 12/28 17 1 1997-2005, 2008, 2010, 2012 656 1.4 9/22 - 12/30 65 1 2011, 2012 443 1.7 9/12 - 12/23 46 2 2001, 2011, 2012 441 2 9/14 - 1/18/13 49 3 2001-2008, 2010-2012 442 2.1 10/2 - 1/18/13 27 2 2001-2012
Trib. to Coal Creek
212 0.1 10/17 - 1/17/13 10 1 1999, 2002-2004, 2006, 2009, 2012
East Creek - 514 0.2 9/28 - 12/23 22 1 2003, 2005-2012 Goff Creek 080285 447 0.1 9/15 - 12/13 17 1 2003-2007, 2010-2012 Kelsey Creek 080259 13 2 9/16 - 1/22/13 60 3 1997-2012 124 2.4 9/14 - 12/30 25 2 1997-2012 657 2.8 9/12 - 12/10 39 3 2011, 2012 120 3 9/17 - 12/13 29 2 1997-2012 115 3.5 9/17 - 11/27 46 1 1998, 2004, 2010, 2012 614 4.7 9/15 - 12/17 14 1 2006, 2012 586 4.9 9/19 - 12/16 21 1 2004-2012 45 5 9/14 - 11/29 22 1 1997-2000, 2003, 2006-2012 May Creek 080282 208 0.2 9/22 - 11/30 19 1 2001-2012 432 0.5 9/22 - 11/30 19 1 2000, 2004-2012 Mercer Slough 080259 445 1.6 9/21 - 1/22/13 63 3 2001, 2003-2012 Richards Creek 080261 75 0.4 9/14 - 12/30 17 1 1998-2000, 2007-2012 27 0.7 9/14 - 12/30 19 1 1997-2012 West Trib. 080264 116 0.25 9/12 - 12/30 88 4 1998, 1999, 2001-2012 Kelsey Cr. 325 0.7 10/4 - 12/31 25 1 1997, 2001-2007, 2009, 2011, 2012 506 0.9 9/29 - 12/28 19 2 2002-2012 73 1.1 9/15 - 12/13 17 1 1998, 2000, 2004-2010, 2012
Salmonids were found in 5 of the 8 streams surveyed in 2012 (Table 13). Chinook and sockeye were reported in Coal Creek, May Creek, and in Mercer Slough. Chinook were reported in Kelsey Creek. Coho were observed in only Coal and May creeks. The only fish observed in Richards Creek was an unidentified species. No fish were observed in East Creek, Goff Creek, a tributary to Coal Creek, or West Trib. Kelsey creeks.
Chinook were observed in Coal Creek by Salmon Watcher volunteers further upstream than ever before: they were seen at river mile 1.6 (upstream of 125th Ave. SE), approximately 0.8 miles further upstream than previously seen.

King County 17 2012 Salmon Watcher Program Report
Table 13. Site ID, RM, and fish counts (live and dead) with dates seen at each stream surveyed in the East Lake Washington Basin for the 2011 spawning season.
Stream Site ID RM Chinook Coho Sockeye Unid.
Coal Creek 46 0.8 - - - - 656 1.4 11 (10/16 - 10/26) 9 (10/25 - 11/14) 33 (10/27 - 12/8) 5 (11/3 - 11/24)
443 1.7 - 7 (11/2 - 12/16) - 2 (11/15 - 11/16) 441 2 - - - 1 (11/30) 442 2.1 - - 3 (11/14) 1 (10/25)
Trib. to Coal Creek 116 0.25 - - - - East Creek 514 0.2 - - - - Goff Creek 447 0.1 - - - - Kelsey Creek 13 2 6 (10/15 - 10/18) - - - 124 2.4 2 (10/17) - - 3 (9/30) 657 2.8 - - - 2 (10/28 - 10/29) 120 3 - - - - 115 3.5 - - - - 614 4.7 - - - - 586 4.9 - - - - 45 5 - - - - May Creek 208 0.2 - 11 (10/15 - 10/22) 155 (10/15 - 11/28) - 432 0.5 1 (10/28) 4 (10/15 - 10/22) 30 (10/15 - 11/28) 2 (11/15) Mercer Slough 445 1.6 2 (10/12) - 1 (10/14) - Richards Creek 75 0.4 - - - 1 (10/28) 27* 0.7 - - - - West Trib. Kelsey Cr. 212 0.1 - - - - 325 0.7 - - - - 506 0.9 - - - - 73 1.1 - - - -
*One trout observed at this location.

King County 18 2012 Salmon Watcher Program Report
West Lake Washington Basin One volunteer surveyed a single site on Taylor Creek in the West Lake Washington Basin (Figure 1). Taylor Creek had not been observed by Salmon Watcher volunteers since 2006. Coho and sockeye were both observed in Taylor Creek (Table 15). Prior to this season, salmonids had never been observed by volunteers in Taylor Creek in the 5 other seasons it had been watched.
Table 14. Stream number, site ID, site location (listed in river miles, RM), survey dates, total number of surveys, number of volunteers, and years the sites were watched for each stream surveyed in the West Lake Washington Basin relevant to the 2012 spawning season.
Stream Stream # Site ID RM 2012
Years Watched Survey Dates # Surveys # Vols.
Taylor Creek (Seattle) - 223 0.1 10/11 - 12/27 20 1 2001-2003, 2006, 2012
Table 15. Site ID, RM, and fish counts (live and dead) with dates seen at each stream surveyed in the West Lake Sammamish Basin for the 2011 spawning season. Stream Site ID RM Coho Sockeye
Taylor Creek (Seattle) 223 0.1 6 (10/31 - 12/3) 66 (10/31 - 12/10)
West Lake Sammamish Basin Volunteers surveyed a single site on Vasa Creek in the West Lake Sammamish Basin in 2012 (Figure 1) and viewed the site 10 times (Table 16). No salmonids were observed.
Table 16. Stream number, site ID, site location (listed in river miles, RM), survey dates, total number of surveys, number of volunteers, and years the sites were watched for each stream surveyed in the West Lake Sammamish Basin relevant to the 2012 spawning season. Stream Stream # Site ID RM 2012 Years Watched
Survey Dates # Surveys # Vols.
Vasa Creek 080156 641 0.4 10/10 - 10/29 10 1 2009-2012

King County 19 2012 Salmon Watcher Program Report
Issaquah Creek Basin Volunteers surveyed 3 sites in 3 streams in Issaquah Creek Basin in 2012 (Figure 1). The total number of surveys ranged from 15 to 32 per site (Table 17). Each site was monitored by 1 or 2 volunteers.
Table 17. Stream number, site ID, site location (listed in river miles, RM), survey dates, total number of surveys, number of volunteers, and years the sites were watched for each stream surveyed in the Issaquah Creek Basin relevant to the 2012 spawning season.
Stream Stream # Site ID RM 2012
Years Watched Survey Dates # Surveys # Vols.
Carey Creek 080218 635 1.7 10/2 - 12/26 32 2 2007-2012
Fifteenmile Creek 080207 669 0.11 10/4 - 11/10 16 1 2012
Issaquah Creek 080178 211 7.3 10/9 - 11/10 15 1 2003, 2012
In 2012, Chinook was reported in Carey Creek and Issaquah Creek (Table 18). Note that the site watched on Issaquah Creek (where Chinook and coho were both seen) was about 4 stream miles upstream of the hatchery. Sockeye were seen in Carey Creek. No fish were observed in Fifteenmile Creek.
Table 18. Site ID, RM, and fish counts (live and dead) with dates seen at each stream surveyed in the Issaquah Creek Basin for the 2012 spawning season.
Stream Site ID RM Chinook Coho Sockeye
Carey Creek 635 1.7 9 (11/18 - 11/22) - 14 (11/6 - 11/16)
Fifteenmile Creek 669 0.11 - - -
Issaquah Creek 211 7.3 11 (10/9 - 10/25) 4 (10/27 - 11/8) -

King County 20 2012 Salmon Watcher Program Report
North Lake Washington Tributaries The North Lake Washington Tributaries are those streams flowing into the north end of Lake Washington (e.g., Thornton Creek, Sammamish River). Volunteers surveyed 17 sites in 9 streams in 2012 (Figure 1). From 1 to 3 sites were watched per stream, and the total number of surveys ranged from 4 to 51 per site (Table 19). Sites were monitored by 1 or 2 volunteers.
Table 19. Stream number, site ID, site location (listed in river miles, RM), survey dates, total number of surveys, number of volunteers, and years the sites were watched for each stream surveyed in the North Lake Washington Tributaries relevant to the 2012 spawning season.
Stream Stream # Site ID RM 2012
Years Watched Survey Dates # Surveys # Vols.
Denny Creek 080228 5 0.1 9/18 - 10/23 4 1 1997, 2000, 2002, 2003, 2005-2007, 2010, 2012
Juanita Creek 080230 389 0 9/18 - 1/2/13 10 1 2000, 2001, 2004-2007, 2011, 2012 411 0.7 10/18 - 11/29 11 1 2000, 2004-2009, 2011, 2012 390 1.8 9/17 - 11/30 12 2 2000-2003, 2012 Lyon Creek 080052 427 0 9/18 - 12/19 27 1 2000, 2003, 2004, 2005, 2008, 2012 Peters Creek 080104 47 0 10/4 - 11/20 15 1 1998, 2003, 2009-2012 510 0.6 9/29 - 1/1/13 28 1 2011, 2012 Sammamish River 080057 587 3.9 9/19 - 11/25 14 1 2006, 2011, 2012 454 11.4 9/14 - 12/30 51 2 2002, 2003, 2011, 2012 271 12.5 9/13 - 11/17 11 1 1997, 1999, 2001-2004, 2007, 2009-
2012 S. Fk. Thornton Cr. 080033 526 0.8 10/18 - 12/27 11 1 2002, 2011, 2012 527 1.15 10/1 - 12/21 22 1 2002-2012 Thornton Creek
080030
183 0.1 8/24 - 12/20 21 2 1997, 2000-2012 186 0.9 9/19 - 10/24 10 1 1997, 1999-2002, 2006-2008, 2010-
2012 386 1.1 10/2 - 10/24 7 1 2002, 2005, 2007, 2008, 2010-2012 Trib. to Sammamish River
275 1.8 9/14 - 11/30 21 1 2009, 2012
Willow Creek 080102 649 0.3 9/29 - 1/1/13 28 1 2010-2012
Salmonids were found in 4 of the 9 streams surveyed in the North Lake Washington Tributaries (Table 20); however, of those 4 streams, the only salmonids reported in 3 were unidentified. Chinook, sockeye, and more unidentified species were observed in only Sammamish River in this subbasin. No salmonids were seen in Denny Creek, Lyon Creek, Thornton Creek, South Fork Thornton Creek, or a tributary to the Sammamish River.
The single unidentified species reported in Willow Creek marks the first and thus far only fish ever seen by a Salmon Watcher volunteer in Willow Creek, despite volunteers watching the creek for 8 seasons and a total of over 45 hours streamside

King County 21 2012 Salmon Watcher Program Report
Table 20. Site ID, RM, and fish counts (live and dead) with dates seen at each stream surveyed in the North Lake Washington Tributaries for the 2012 spawning season.
Stream Site ID RM Chinook Sockeye Unid.
Denny Creek 5 0.1 - - - Juanita Creek 389 0 - - 1 (11/15) 411 0.7 - - - 390 1.8 - - - Lyon Creek 427 0 - - - Peters Creek 47 0 - - - 510 0.6 - - 2 (12/1 - 12/22) Sammamish River 587 3.9 - - 51 (9/19 - 10/20) 454 11.4 119 (9/22 - 10/7) 32 (9/22 - 11/11) 61 (9/14 - 12/27) 271 12.5 - 14 (9/26 - 10/13) 2 (10/5) Trib. to Samm. R. 275 1.8 - - - South Fk. 526 0.8 - - - Thornton Creek 527 1.15 - - - Thornton Creek 183 0.1 - - - 186 0.9 - - - 386 1.1 - - - Willow Creek 649 0.3 - - 1 (11/3)
.

King County 22 2012 Salmon Watcher Program Report
Sammamish River Tributaries The Sammamish River Tributaries are those streams flowing into the Sammamish River from waters originating in Snohomish County (Little Bear, North, and Swamp creeks; Big Bear Creek is discussed separately above). Volunteers surveyed 21 sites on 4 Sammamish River tributaries in 2012 (Figure 1). The total number of surveys ranged from 3 to 63 per site (Table 21). Each site was monitored by from 1 to 3 volunteers.
Table 21. Stream number, site ID, site location (listed in river miles, RM), survey dates, total number of surveys, number of volunteers, and years the sites were watched for each stream surveyed in the Sammamish River Tributaries relevant to the 2012 spawning season.
Stream Stream # Site ID RM
2012 Years Watched Survey
Dates #
Surveys #
Vols. Little Bear Creek 080080 114 0 9/18 - 12/14 36 2 1999, 2001, 2002, 2005-2012 640 0.1 9/20 - 11/8 15 1 2008, 2012 67 0.2 9/18 - 11/27 14 1 1997-1999, 2001-2009, 2012 311 0.4 9/30 - 11/18 7 1 1997, 2001, 2004, 2010-2012 312 1.5 10/2 - 11/8 17 2 1997, 2002, 2003, 2010-2012 176 1.6 9/14 - 12/22 38 3 1997, 2000-2007, 2009-2012 651 1.65 10/4 - 11/8 5 1 2010, 2011, 2012 14 2.1 9/20 - 11/28 15 2 1999, 2000, 2002-2004, 2006-2012 231 3.2 9/17 - 11/4 16 2 1997, 1999, 2000, 2002, 2004, 2006, 2012 Little Swamp Cr. 080060 505 0.24 9/18 - 11/30 20 1 2002-2008, 2011, 2012 North Creek 080070 438 0.01 10/17 - 11/27 12 1 2000, 2003, 2004, 2006, 2008, 2009, 2012 112 0.9 10/1 - 11/27 9 2 1998-2012 57 0.95 9/22 - 12/21 37 2 1998, 2001, 2004-2012 408 1.05 10/5 - 11/16 9 1 2000-2009, 2011, 2012 113 1.5 10/10 - 10/31 3 1 1998, 2000, 2001, 2003, 2006-2010, 2012 255 1.8 10/4 - 11/27 7 1 1999-2004, 2006, 2007, 2009-2012 425 2.6 9/18 - 11/30 43 3 2006, 2008, 2009, 2010, 2011, 2012 254 2.8 9/24 - 12/26 29 1 2004, 2007, 2009, 2011, 2012 253 3 9/17 - 12/31 63 2 1997, 1999-2001, 2006-2012 636 3.3 9/17 - 12/20 24 1 2007, 2010, 2011, 2012 Swamp Creek 080059 34 0.3 9/18 - 11/30 18 1 1997, 1999, 2000, 2002-2008, 2011, 2012
Fish were only seen in Little Bear and North creeks: Chinook, coho, kokanee, and sockeye were all reported in Little Bear Creek (Table 22). Chinook, sockeye, and a single coho were seen in North Creek. No fish were seen in Swamp Creek or Little Swamp Creek.

King County 23 2012 Salmon Watcher Program Report
Table 22. Site ID, RM, and fish counts (live and dead) with dates seen at each stream surveyed in the Sammamish River Tributaries for the 2012 spawning season.
Stream Site ID RM Chinook Coho Kokanee Sockeye Unid.
Little Bear Creek 114 0 - 2 (9/22) - 537 (9/22 - 11/8) - 640 0.1 - - - 193 (9/26 - 11/3) - 67 0.2 - - 3 (9/27 - 10/2) 64 (9/27 - 11/4) - 311 0.4 - - - 25 (9/30 - 11/4) - 312 1.5 - - - 126 (10/2 - 11/3) - 176* 1.6 - - 11 (10/13 - 10/13) 159 (9/15 - 11/5) - 651 1.65 - - - 30 (10/4 - 10/24) - 14 2.1 1 (10/8) 3 (10/12 - 11/9) - 60 (9/29 - 11/9) 5 (9/20 - 11/9) 231 3.2 - 2 (10/8) - 39 (10/8 - 10/28) 7 (10/8 - 11/4) Little Swamp Cr. 505 0.24 - - - - - North Creek 438 0.01 - 1 (10/19) - - 3 (10/19 - 10/26) 112 0.9 - - - 93 (10/1 - 11/16) 2 (10/4 - 10/14) 57 0.95 17 (10/5 - 10/13) - - 207 (10/5 - 11/11) 5 (10/8 - 10/11) 408 1.05 3 (10/5 - 10/8) - - 61 (10/5 - 11/5) 1 (10/17) 113 1.5 - - - 3 (10/10 - 10/15) - 255 1.8 - - - 2 (10/7) - 425 2.6 - - - 302 (10/3 - 11/16) 1 (10/24) 254 2.8 - - - 5 (10/10 - 11/6) - 253 3 - - - 66 (10/6 - 11/16) - 636 3.3 - - - 1 (11/7) - Swamp Creek 34 0.3 - - - - -
*Two trout observed at this location.

King County 24 2012 Salmon Watcher Program Report
Puget Sound Streams Streams draining to Puget Sound that were surveyed during the 2012 Salmon Watcher season are both inside and outside WRIA 8 (Figure 1). Those streams within WRIA 8 include Boeing Creek, Pipers Creek, and Venema Creek. Longfellow Creek, watched annually, is part of WRIA 94. A total of 10 sites in 4 streams draining to Puget Sound were watched in 2012 (Table 23). All sites were monitored by 1 volunteer.
Table 23. Stream number, site ID, site location (listed in river miles, RM), survey dates, total number of surveys, number of volunteers, and years the sites were watched for each stream surveyed in the Central Puget Sound relevant to the 2012 spawning season.
Stream Stream # Site ID RM 2012
Years Watched Survey Dates # Surveys # Vols.
Boeing Creek* 080017 436 0.1 10/6 - 12/7 6 1 2000-2016
Longfellow Creek 090360 179 0.8 10/21 - 12/28 13 1 1998-2012
380 1 10/15 - 11/9 11 1 2000, 2001, 2010, 2012
Pipers Creek* 080023 70 0 10/21 - 12/13 19 1 1999-2005, 2007, 2008, 2010-2012
181 0.2 10/9 - 12/9 9 1 1999-2002, 2004-2008, 2010, 2012
381 0.3 10/12 - 12/9 8 1 2001-2003, 2005, 2012 98 0.4 10/21 - 12/13 19 1 1998-2002, 2007-2012
99 0.53 10/21 - 12/13 19 1 1999, 2002-2004, 2008, 2011, 2012
Venema Creek* - 383 0.02 10/9 - 12/26 17 1 2000, 2001, 2004-2012 222 0.03 10/5 - 12/15 21 1 1999, 2005, 2012
*Streams within WRIA 8.
Adult salmon were seen in all four creeks (Table 24). Chum were observed in Boeing, Pipers, and Venema creeks. Coho were reported Boeing, Longfellow, and Pipers creeks. Chum were reported slightly more upstream than previously ever reported by Salmon Watcher volunteers (site 222).
Table 24. Site ID, RM, and fish counts (live and dead) with dates seen at each stream surveyed in Central Puget Sound for the 2012 spawning season.
Stream Site ID RM Chum Coho Unidentified
Boeing Creek 436 0.1 20 (11/12 - 12/7) 56 (10/6 - 11/12) - Longfellow Creek 179 0.8 27 (10/21 - 11/25) 380 1 23 (10/19 - 11/8) Pipers Creek 70 0 16 (10/27 - 12/8) - 2 (10/29)
181 0.2 11 (11/3 - 12/9) - 2 (11/1) 381 0.3 14 (11/1 - 11/25) 1 (11/3) 4 (11/21 - 11/25) 98 0.4 117 (10/29 - 11/27) - 1 (10/29) 99 0.53 - - -
Venema Creek 383 0.02 31 (11/2 - 12/8) - - 222 0.03 21 (10/29 - 11/18) - -
4 Fauntleroy Creek, a WRIA 9 stream that drains to Puget Sound, is also watched by volunteers; however, survey methods are different from those of this program. See Appendix B for a summary of salmonid observations at Fauntleroy Creek in 2011.

King County 25 2012 Salmon Watcher Program Report
References King County. 2004. 2003 Volunteer Salmon Watcher Program: Lake Washington Watershed and
Vashon Island. 48pp. {Vanderhoof author}
Williams, R.W., R.M. Laramie, and J.J. Ames. 1975. A Catalog of Washington Streams and Salmon Utilization, Volume 1, Puget Sound. Washington Department of Fisheries, Olympia, WA.

King County A-1 Appendix A
Appendix A
Data Collection Form used in 2012

King County A-1 Appendix A
2012 datasheet looks like this:

King County B-1 Appendix B
Appendix B
Fauntleroy Creek Salmon Watch 2012 Summary
From an email by Judy Pickens on 11-19-12
We closed Salmon Watch 2012 this morning, not wanting to subject watchers to this weather. We had 5 latecoming spawners on Saturday but none yesterday so felt we were okay to call it a wrap. Eighteen watchers of record documented 274 coho spawners between Oct. 24 and Nov. 17. The big rush was the first week of November, with the 5 stragglers coming in with the renewal of rain a few days ago. Our previous high was 167, in 2001. We had an estimated 290 visitors, including five school groups. Ample publicity on the West Seattle Blog brought new watchers and several contacts that will serve our watershed council well. With heavy predation here, we were not able to examine many carcasses to determine pre-spawn mortality or disease. Watchers were able to see that nearly all the fish were hatchery release.