2012 annual report sears canada inc. - s3.amazonaws.comannual+report.pdf · 48 management's...
TRANSCRIPT

2012 AnnuAl RepoRtSeARS CAnAdA InC.

A little over a year ago, we set our company upon a different course. We are now emboldened by a great and simple purpose: to make every day a great day for our customers. the more we matter to those who matter most to our business, the more valuable our business will be.
Table of Contents
2 Financial Highlights 4 Letter to Our Shareholders 10 Five Year Summary 11 Quarterly Performance/Common Share Market Information 12 Management's Discussion and Analysis 48 Management's Responsibility for Financial Statements 49 Report of Independent Registered Chartered Accountants 51 Consolidated Statements of Financial Position
52 Consolidated Statements of Net Earnings (Loss) and Comprehensive Income (Loss) 53 Consolidated Statements of Changes in Shareholders' Equity 54 Consolidated Statements of Cash Flows
55 Notes to the Consolidated Financial Statements
97 Directors and Officers
98 Corporate Information
Certain information in the accompanying “Letter to Our Shareholders” is forward-looking and is subject to important risks and uncertainties, which are described in the “Cautionary statement regarding forward-looking information” on page 13 of this Annual Report.

2
Financial Highlights
Unless otherwise noted, 2012 results reflect a 53-week period while 2011 results reflect a 52-week period.
(in CAD millions, except per share amounts) Fiscal 2012 Fiscal 2011Total revenue $ 4,300.7 $ 4,619.3Same store sales (%)* (5.6)% (7.5)%Adjusted EBITDA* 47.0 124.0Net earnings (loss) 101.2 (50.3)
As atFebruary 2, 2013
As atJanuary 28, 2012
Cash and cash equivalents $ 237.0 $ 397.4Working capital 415.3 471.0Inventories 851.4 823.9Total assets 2,479.1 2,730.7Total long-term obligations, includingprincipal payments on long-termobligations due within one year 36.1 122.7Shareholders' equity 1,076.4 1,092.0
As atFebruary 2, 2013
As atJanuary 28, 2012
Per share of capital stock Basic net earnings (loss) $ 0.99 $ (0.48) Diluted net earnings (loss) $ 0.99 $ (0.48) Shareholders' equity $ 10.57 $ 10.63
* Same store sales and Adjusted EBITDA are operating performance and non-International Financial Reporting Standards ("IFRS") measures, respectively. See Section 1.e. “Use of Non-IFRS Measures, Measures of Operating Performance, and Reconciliation of Net Earnings (Loss) to Adjusted EBITDA”.
• Revenue was $4,300.7 million for the 53-week period ended February 2, 2013 (“Fiscal 2012”) compared to $4,619.3 million for the 52-week period ended January 28, 2012 (“Fiscal 2011”), a decrease of 6.9%. The decrease is primarily attributable to sales declines in Craftsman®, electronics, bedroom and bath, women's apparel, and menswear categories, partially offset by higher revenue from major appliances. In addition, the decrease in revenues is partially attributable to the closure of 4 Full-Line stores during Fiscal 2012 and the sale of Cantrex Group Inc. ("Cantrex") during the second quarter of 2012.
• Revenue was approximately $25.5 million lower as a result of the closure of 4 Full-Line stores during Fiscal 2012. Revenue was also positively impacted by approximately $38.3 million due to the 53rd week in Fiscal 2012.
• Same store sales decreased 5.6% compared to Fiscal 2011. Same store sales is a measure of operating performance used by management, the retail industry and investors to compare retail operations, excluding the impact of store openings and closures. See Section 1.e. “Use of Non-IFRS Measures, Measures of Operating Performance and Reconciliation of Net Earnings (Loss) to Adjusted EBITDA.”

3
• Gross margin rate was 36.1% for Fiscal 2012 compared to 36.5% in Fiscal 2011. In Fiscal 2011 there was a one-time inventory charge, relating to planned disposition of excess inventory. The Fiscal 2011 gross margin rate excluding the one-time inventory charge was 37.4%. The decrease in the gross margin rate in Fiscal 2012 compared to Fiscal 2011 was due primarily to reduced margin in fitness and recreation, Corbeil Electique Inc. ("Corbeil"), children's wear, jewelery, accessories and luggage and footwear categories.
• Fiscal 2012 Adjusted EBITDA was $47.0 million compared to $124.0 million for Fiscal 2011. Adjusted EBITDA is a non-IFRS measure. See Section 1.e. “Use of Non-IFRS Measures, Measures of Operating Performance and Reconciliation of Net Earnings (Loss) to Adjusted EBITDA” regarding the use of non-IFRS measures and an explanation of components of Adjusted EBITDA for respective periods.
• Basic net earnings per common share was $0.99 in Fiscal 2012 compared to a basic net loss per common share of $0.48 for Fiscal 2011.
• Total cash and cash equivalents was $237.0 million as at February 2, 2013 compared to $397.4 million as at January 28, 2012. The decrease of $160.4 million was primarily due to repayment of long-term obligations of $142.3 million, $101.9 million in dividend payments during the latter part of Fiscal 2012, and the purchase of $97.5 million in property, plant and equipment and intangible assets, partially offset by $175.0 million in proceeds from lease terminations received during Fiscal 2012, and the net proceeds received of $38.3 million from the sale of the Company's interest in Medicine Hat Mall at the end of Fiscal 2012.
4
Letter to Our Shareholders
A message from Calvin McDonald, President and Chief Executive Officer
Sears Canada is concluding the first full year of our Transformation plan. The three-year plan is centered on re-establishing the business and carrying out strategies designed to trade ourselves out of what we traded ourselves into over a period of several years. Our focus in 2012 was to get the basics, executing on fundamentals and reconnecting with customers in a significant way.
In delivering against our Vision of creating lifelong relationships built on trust and our Mission centered on working for Canadian families, we established several initiatives during the year. These were positioned to get at basics and build our foundation for the future.
Since we launched the Transformation, we have consistently used the Formula for Growth, expressed as five components, as our foundation for improvement:1. Build the Core2. Be Customer Driven and Marketing Led3. Get Value Right4. Operate the Best Formats5. Organize the Right Talent and Create a Winning Attitude
The unique initiatives we introduced this year are spread across these five strategic pillars and linked by two common themes: improve our product and change our behaviour.
With this framework in mind, here are some of the accomplishments we saw in 2012 as we moved forward to strengthen Sears relationship with Canadian consumers.
Build the Core
This pillar of the Formula for Growth is our focus on core competencies. We must protect and build market share in the categories where we can win by promoting our unrivaled blend of authoritative assortment, unique services and exclusive brands. Our goal is to deliver consistently across these categories and be Canadians' retailer of choice for their needs…head to toe, wall to wall, for self, family and home.
Some of the accomplishments within Build the Core were:• The establishment of our Hero shops: We cannot be all things to all customers, so we identified
categories where Canadians will give us strong consideration because of our established position in the marketplace such as Major Appliances, Mattresses, Kids, Women's Dresses, Men's Dresswear, and Kitchen. We need to support these categories and present them to Canadians effectively. A big piece of the work that lies ahead of us is to turn dollar share into share of mind; this way, customers can be advocates for Sears in these important categories. An increase in same store sales for our apparel business in the fourth quarter of 2012 for the first time in eight quarters was a positive result of the work we have been doing on building the core;

5
• The full execution of our aggressive “attack plan” for both major appliances and mattresses: This included uplifted advertising, associate training, innovative financing programs and 'after-sale' service enhancements. Sears considers itself a leader in these categories and is determined to maintain its market leading position;
• The launch of “The Baby's Room” in June, a full-service headquarters for baby products and nursery equipment: We introduced new products, new brands, updated signing and a reflow of the floor plan. Young families are a key target market, and our aim is to attract new parents to Sears and convert them to loyal shoppers for life. We have achieved monthly double-digit sales increases on average since we launched, a strong signal that we're resonating with customers in a meaningful way; and
• Establishing strategic alliances: In January 2013 we joined with Buffalo International Inc. to design and build Sears private brand of denim based apparel, Nevada. The Aldo Group will be working with us in a similar fashion for men's and women's private brand Attitude and Nevada footwear, as well as the Jessica brand for women. We also teamed up with SHS Services Management Inc. to manage and operate our installed home services business. These are organizations that have the capacity and desire to work with Sears, and who can execute better on the sourcing end using our expertise and capability on the distribution and brand reputation end. Our approach is to align with companies that can provide immediate credibility and continuity to our brands and services.
We will continue to assess our strengths and core competencies and evolve the business model as appropriate to strengthen Sears position in the marketplace.
Be Customer Driven and Marketing Led
We need to be focused on our customers who come from all walks of life and demographic profiles. Taking into account the breadth of product in our Hero shops and our market share, it follows that we already attract a broad range of Canadian consumers, and many of them have a Sears Financial Credit Card. Our opportunity is to utilize this information to be more targeted in our marketing, convert in-store traffic into transactions and change the perception of our brand. This pillar is about using the information customers share with us to make their shopping experience with Sears more effective and more likely to result in lifelong relationships.
Some of the accomplishments within Be Customer Driven and Marketing Led were:• The relaunch of the Sears brand under the statement “Make Every Day a Great Day”: Over
half a million views of our Holiday-timed video-commercial was an early and encouraging sign that Canadians are responding positively to the changes we are making and the Company we are trying to become. Every day being a great day is what we want our customers to experience as a result of using our products and services;
6
• The seasonal publication of the LOOK! report: Four editions were distributed in 2012 - Spring, Summer, Fall and Holiday - highlighting the season's fashion trends with handy tips from our trend directors aimed at establishing Sears as a trusted resource to customers looking for style and product tips along with great fashion. Our Buyers vie to get their items selected for the LOOK! report and the friendly competition has resulted in a high quality publication featuring the best of the season. The LOOK! report has produced check out rates of advertised merchandise at three times the average of other promotional vehicles;
• The creation of meaningful events that fulfill the occasion-based needs of our customers: The Great Canadian Coat Sale in the fall, the Little Black Dress Event for Holiday, the Shape Your Shape Event in January for fitness - these are important time frames for our customers and Sears responded with meaningful assortments and in-store presence to demonstrate leadership in product and marketing. These events increased customer consideration of Sears for key lines like apparel and helped us acquire new customers; and
• The delivery of our 60th Wish Book: Since 1953 Canadian households have marked the coming of the Christmas Season with the arrival of the Wish Book and this year's version did not disappoint, garnering orders from some 600,000 unique households. During 2013, we will celebrate our 60th anniversary and invite customers to join in the celebration on various occasions.
Get Value Right
We believe Value is more than price. It is a blend of price, quality and the service that customers experience when they shop at Sears, and our value proposition holds a unique place within the Canadian marketplace. Throughout the year, we introduced initiatives that helped to strengthen all three components of our value equation.
Some of the accomplishments within Get Value Right were:• The “Over 5,000 new lower prices” initiative was a campaign to effectively convey our
approach to pricing: Sears is a promotional business, and we will continue to have sale prices that Canadians desire. We focused on striking a balance among three principles: being competitive at all times on highly identifiable and often-purchased items, building line structures that provide a good-better-best range of product, and having realistic regular prices that customers can believe;
• The introduction of Sears “Canada's Best” seal of approval: An item reflecting the highest standards of quality, style and innovation, at surprising prices. The items are labelled with special product tags and supported by informative marketing so that customers know they are buying the very best available when they buy a product identified as “Canada's Best” and still getting the value they expect from Sears;
• The expansion of our Price Protection guarantee for big-ticket items: We want to ensure that customers can shop us with confidence for larger purchases, so we extended our 60-day Price Protection Plus guarantee on major appliances to match any competitor 90 days after a Sears purchase and we also introduced an industry leading 365-day sleep guarantee for mattresses so customers feel comfortable with this long-term investment;
7
• The re-affirmation, in May, of the Company's commitment to customer service with a renewed customer promise: The Company invested in over 100,000 hours of hands-on training nationwide touching every store associate on expectations. Unfriendly policies were replaced with practices that customers would expect from Sears including an updated returns policy that allows 90 days for a return to be made on most products using a Sears credit card; and
• The introduction of the Gold Badge program, which recognizes individual store customer service excellence: Each store is rated based on feedback from customers who have specifically shopped in that store. Stores must achieve a rating of 9 or 10 on all questions by at least 73% of customers who filled out a survey. If they achieve this, every associate gets to wear a gold-coloured badge for the ensuing year as a visible sign of their accomplishment. Fifteen stores achieved this highly coveted symbol of recognition in 2012.
Operate the Best Formats
A competitive advantage for Sears is our ability to trade through multiple formats operating in many different sizes of communities. Operating the best formats is focused on aligning our category strengths with the market and creating more value from our trading strategies with retail concepts that align to customer needs.
Some of the accomplishments within Operate the Best Formats were:• The complete refresh of eight full-line stores in 2012: Our goal was to create a stage for
product which we accomplished by focusing on four components: showcasing our hero categories, conducting a substantial merchandise re-mix, creating centres of interest where we could promote events with authority, and paying special attention to the basics business so customers can count on Sears every time they visit to be in stock of the most wanted items. The stores are performing well above comparable stores in both sales and gross profit and Apparel is outperforming our other businesses reinforcing our decision to make significant enhancements to the visual presentation in that area;
• The unveiling of a brand new relocated 78,000 square foot state-of-the-art Sears Home store at Ottawa's Pinecrest shopping centre: The store has significantly improved its sales and features 54 mattress sets, our largest, and 475 major appliances, compared to 300 in an average store. Associates are equipped with tablets so they can find additional product information for customers and verify any competing offers in the marketplace;
• The establishment of Sears wholly-owned subsidiary Corbeil Appliances in the Greater Toronto area: This successful, Quebec-based chain, previously unknown in this area, brought a mid-to-high level of appliances to Vaughan, Richmond Hill, Mississauga and Burlington and introduced southern Ontario to an appliance specialist with kitchen renovation capability;
• The investment in our website, Sears.ca: We made the site easier to navigate, increased the functionality, improved searching capability and redesigned the home page. We made Direct our Toy headquarters this year by reallocating the Toy department space in retail to The Baby's Room, and directing Toy customers with effective in-store presentations to sears.ca where the Direct channel enjoyed a significant increase in business as a result; and
8
• Identifying opportunities for non-strategic businesses and assets: During 2012, the Company vacated four full-line stores, surrendering early its leases on two stores in Calgary and one each in Vancouver and Ottawa. This was an opportunity for Sears that was based on leaving locations that did not trade to our strengths as a retailer, and that also provided financial consideration that would have taken a substantially long time to generate had we kept operating them as we were.
We constantly review our businesses and assets and will continue to act on those that are no longer strategic for Sears and where we can help Sears to be more profitable in the long term. We need to be operating in formats and locations where we can trade most effectively.
Organize the Right Talent and Create a Winning Attitude
Organizing talent compels us to address structure, breaking down silos, fixing bad processes, and putting in place efficient models designed to increase productivity. Creating a winning attitude speaks to culture…changing our behaviour, thinking differently, and putting in place plans and initiatives that let the organization believe in success, exude confidence and adopt the retail swagger prevalent in winning organizations.
Some of the accomplishments within Organize the Right Talent and Create a Winning Attitude were:• The open communication channels that have been established between the retail support centre
and individual associates: An online idea sharing forum, a regular blog from me, a recognition program called WOW that allows for accolades of exceptional actions to be called out, and a cross-functional Associate Advisory Council have all been avenues through which associates can provide input into how improvements can be made enterprise-wide for optimal results;
• The first graduating “class” of the Sears Future Leaders program: This concentrated development program selects 24 candidates each term from within Sears and externally who want to establish a career in retailing blending hands-on experience with a formal sharing of knowledge and skills of the retail industry;
• The strengthening of the Executive Leadership Team: In addition to some changes within our merchandising, marketing and operational leaders with a focus on action and results, of particular note is the appointment of Doug Campbell to Executive Vice-President and Chief Operating Officer overseeing various operational functions and efficiency improvements across the organization; and
• Right-sizing the organization: As we continue to make improvements in efficiencies, we must maintain an organizational structure that reflects best of breed without compromising customer service. At the end of fiscal 2012, we reduced our staff count by 700 associates, mostly from logistics and non customer-facing store roles. The organization needs to remain competitive within an industry that is increasing its pace and responsiveness capacity.
We will continue to review our business as processes are improved and ensure we have an allocation of resources that properly supports the organization as it evolves.
9
In 2012, our job was to get the basics…reestablish the fundamentals needed to operate a successful retail business. We rebalanced prices, we brought in sound customer service policies, we identified our “core” Hero categories and put resources behind them, we restructured buying and store operations teams, we defined what a Sears department store and Sears Home store should look like, we began to change behaviour, and we started to install a high-performing management team that can lead an organization of 29,000 through a transformation of significant proportion.
These were fundamental accomplishments, and we needed to do this to establish our retail rhythm. In 2013, we will focus on maintaining that retail rhythm, living it, and gaining momentum. While there are some external factors that can impact our business, there is much within our control that we can do to improve our performance. “Control the Controllables” is an internal theme that we are spreading across the enterprise. In tough times, great retailers find a way. Sears needs to act differently and start to achieve different results.
Sears Canada celebrates its 60th anniversary in 2013. We issued our inaugural catalogue in early 1953: the Spring and Summer catalogue of that year. A few months later, on September 17, we opened our first store in Stratford, Ontario. Since then, the Company has become one of Canada's major retailers with operations coast to coast, boasting a powerful brand and coveted reputation.
But it's a different landscape in 2013 than it was six decades ago. Sears cannot rely on its accomplishments of the past to be successful. Today, our customers have a lot of choice, some of it close by and reachable from their homes and some of it across the world and reachable by a click of their keyboard. We need to respond and, as a merchant, this is centered around changing our product and changing our behaviour.
Our aim is to have the products and services customers receive from Sears help make every day a great day for them. That is relevance. And that is how much a part of their lives we need to be. The foundation built over 60 years can help us, but it can't sustain us. We need to be top of mind in the minds of Canadians for the lines of products in which we trade, and the Transformation we have begun is the route that can help us get there successfully.
I wish to acknowledge associates, past and present, who, over six decades, have provided Sears with a level of dedication and commitment that is needed to form and operate a Company of our significance, and I look forward to working with the team in place today to take us to the next level and journey through the Transformation of Sears Canada.
Sincerely,
Calvin McDonald, President and Chief Executive Officer

10
Five Year Summary IFRS IFRS IFRS CGAAP CGAAP CGAAPFiscal 2012A
Fiscal 2011A
Fiscal 2010A
Fiscal 2010B
Fiscal 2009C
Fiscal2008D
Results for the year (in CAD millions)Total revenue $ 4,300.7 $ 4,619.3 $ 4,938.5 $ 4,957.8 $ 5,200.6 $ 5,733.2Depreciation and amortization 113.3 114.9 123.6 104.6 117.4 126.9Earnings (Loss) before income taxes 114.2 (56.9) 187.1 219.8 347.6 422.0Income tax (expense) recovery (13.0) 6.6 (62.1) (70.0) (112.9) (131.3)Net earnings (loss) 101.2 (50.3) 125.0 149.8 234.7 290.7Dividends declared 101.9 — 753.4 753.4 — —Capital expendituresE 97.5 84.3 60.0 62.4 65.7 97.1Year end position (in CAD millions)Accounts receivable, net $ 76.2 $ 116.2 $ 144.0 $ 143.2 $ 131.1 $ 138.7InventoriesF 851.4 823.9 953.2 953.2 852.3 968.3Property, plant and equipment 840.0 872.0 900.7 577.4 620.2 696.0Total assets 2,479.1 2,730.7 2,907.5 2,509.8 3,404.8 3,237.3Working capital 415.3 471.0 536.9 610.6 1,114.7 1,148.8Total long-term obligations, includingprincipal payments on long-term obligationsdue within one year 36.1 122.7 129.1 136.1 350.7 364.6Shareholders' equity 1,076.4 1,092.0 1,260.4 1,000.5 1,657.5 1,483.2Per share of capital stockBasic net earnings (loss) $ 0.99 $ (0.48) $ 1.16 $ 1.40 $ 2.18 $ 2.70Dividends declared 1.00 — 7.00 7.00 — —Shareholders' equity 10.57 10.63 11.96 9.32 15.40 13.78Financial ratiosReturn on average shareholders equity (%)G 9.3 (4.3) 7.7 11.3 14.9 22.6
Current ratio 1.5 1.5 1.5 1.6 1.8 2.0
Return on total revenues (%) 2.4 (1.1) 2.5 3.0 4.5 5.1
Debt/equity ratio 3/97 10/90 9/91 12/88 17/83 20/80
Pre-tax margin (%) 2.7 (1.2) 3.8 4.4 6.7 7.4Number of Selling UnitsFull-line Department stores 118 122 122 122 122 122Sears Home stores 48 48 48 48 48 48Outlet stores 11 11 11 11 12 11
Specialty type: Appliances and Mattresses 4 4 4 4 4 6
Hometown Dealer stores 261 285 268 268 186 171
Sears Floor Covering Centres — 17 20 20 22 30
Sears Home Services Showrooms 9 13 13 13 13 13
Cantrex — 799 768 768 793 824
Corbeil 33 30 30 30 30 30
Travel offices 101 108 108 108 108 106
Catalogue merchandise pick-up locations 1,512 1,734 1,822 1,822 1,853 1,858A The 2012 fiscal year ("Fiscal 2012"), 2011 fiscal year ("Fiscal 2011") and 2010 fiscal year ("Fiscal 2010") refers to the 53-week period ended February 2, 2013, and the 52-week period ended January 28, 2012, and January 29, 2011 respectively, reported under International Financial Reporting Standards ("IFRS").B The 2010 fiscal year ("Fiscal 2010") represents the 52-week period ended January 29, 2011, reported under Canadian Generally Accepted Accounting Principles ("CGAAP").C The 2009 fiscal year ("Fiscal 2009") represents the 52-week period ended January 30, 2010, reported under CGAAP.D The 2008 fiscal year ("Fiscal 2008") represents the 52-week period ended January 31, 2009, reported under CGAAP.E Capital expenditures have not been reduced by cash payments outstanding at year end resulting from normal trade terms.F As a result of the Company's change in accounting policy for inventories in Fiscal 2008, the inventory balances included in this table are not comparable. See Note 2 "Significant accounting policies" of the Notes to the Consolidated Financial Statements.G The return on average shareholders' equity (%) for IFRS Fiscal 2010 was calculated taking net earnings for Fiscal 2010, divided by the average of shareholders' equity for the period ended January 29, 2011 ($1,260.4 million) and the opening Consolidated Statement of Financial Position as at January 31, 2010 ($2,004.4 million) reported under IFRS.

11
Quarterly Performance
The Company's operations are seasonal in nature. Accordingly, merchandise and service revenue, as well as performance payments received from JPMorgan Chase Bank, N.A. (Toronto Branch), referred to as commission revenue, will vary by quarter based upon consumer spending behaviour. Historically, the Company's revenue and earnings are higher in the fourth quarter than in any of the other three quarters due to the holiday season. The Company is able to adjust certain variable costs in response to seasonal revenue patterns; however, costs such as occupancy are fixed, causing the Company to report a disproportionate level of earnings in the fourth quarter. Other factors that affect the Company's sales and financial performance include actions by its competitors, timing of its promotional events, and changes in population and other demographics. Accordingly, the Company's results for any one fiscal quarter are not necessarily indicative of the results to be expected for any other quarter, or the full year, and comparable store sales for any particular period may increase or decrease.
The table below outlines select financial data for the eight most recently completed quarters. The quarterly results are unaudited and have been prepared under IFRS.
Fourth Quarter Third Quarter Second Quarter First Quarter(in CAD millions, exceptper share amounts) 2012 2011 2012 2011 2012 2011 2012 2011
Total revenue $1,298.0 $ 1,365.9 $ 1,037.5 $ 1,113.2 $ 1,050.1 $ 1,147.7 $ 915.1 $ 992.5Net earnings (loss) $ 39.9 $ 41.0 $ (21.9) $ (44.1) $ (9.8) $ (0.2) $ 93.1 $ (47.0)Basic net earnings (loss) per share $ 0.39 $ 0.39 $ (0.22) $ (0.42) $ (0.10) $ 0.00 $ 0.91 $ (0.45)Diluted net earnings (loss) per share $ 0.39 $ 0.39 $ (0.22) $ (0.42) $ (0.10) $ 0.00 $ 0.91 $ (0.45)
Common Share Market Information
The table below provides prices for the Company's common shares traded on the Toronto Stock Exchange (symbol: SCC).
Fourth Quarter Third Quarter Second Quarter First Quarter
2012 2011 2012 2011 2012 2011 2012 2011
High $ 12.98 $ 15.33 $ 11.79 $ 15.51 $ 13.73 $ 19.78 $14.24 $ 20.35Low $ 9.50 $ 10.12 $ 10.10 $ 12.51 $ 9.76 $ 15.27 $11.60 $ 19.11Close $ 9.50 $ 11.63 $ 10.69 $ 15.10 $ 10.16 $ 15.27 $13.50 $ 19.88Average daily tradingvolume 122,655 27,473 23,487 11,609 16,694 45,750 7,784 17,473

12
Management’s Discussion and Analysis
Table of Contents
1. Company Performance 2. Consolidated Financial Position, Liquidity and Capital Resources 3. Financial Instruments 4. Funding Costs 5. Related Party Transactions 6. Shareholders’ Equity 7. Profit Sharing and Stock-Based Compensation 8. Event After the Reporting Period 9. Accounting Policies and Estimates 10. Disclosure Controls and Procedures 11. Risk and Uncertainties

13
Management’s Discussion and Analysis
“Sears”, “Sears Canada” or “the Company” refers to Sears Canada Inc. and its subsidiaries, together with its investment in joint venture interests.
Management’s Discussion and Analysis (“MD&A”) contains commentary from the Company’s management regarding strategy, operating results and financial position. Management is responsible for its accuracy, integrity and objectivity, and develops, maintains and supports the necessary systems and controls to provide reasonable assurance as to the accuracy of the comments contained herein.
This MD&A should be read in conjunction with the Consolidated Financial Statements and Notes to the Consolidated Financial Statements for the 53-week period ended February 2, 2013 (“Fiscal 2012” or “2012”). The 2011 fiscal year refers to the 52-week period ended January 28, 2012 (“Fiscal 2011” or “2011”). The fourth quarter unaudited results for Fiscal 2012 and Fiscal 2011 reflect the 14-week period ended February 2, 2013 (“Q4 2012”) and the 13-week period ended January 28, 2012 (“Q4 2011”), respectively.
This MD&A is current as of March 14, 2013 unless otherwise stated.
Additional information relating to the Company, including the Company’s Annual Information Form (“AIF”) dated March 14, 2013 and the Management Proxy Circular dated March 14, 2013, can be obtained by contacting the Company at 416-941-4428. The 2012 Annual Report, together with the AIF and Management Proxy Circular, have been filed electronically with securities regulators in Canada through the System for Electronic Document Analysis and Retrieval (“SEDAR”) and can be accessed on the SEDAR website at www.sedar.com and on the U.S. Securities Exchange Commission ("SEC") website at www.sec.gov.
Unless otherwise indicated, all amounts are expressed in Canadian dollars.
Cautionary Statement Regarding Forward-Looking Information
Certain information in the Annual Report and in this MD&A is forward-looking and is subject to important risks and uncertainties. Forward-looking information concerns, among other things, the Company's future financial performance, business strategy, plans, expectations, goals and objectives, and includes statements concerning possible or assumed future results set out under Section 1 “Company Performance”, Section 2 “Consolidated Financial Position, Liquidity and Capital Resources”, Section 3 “Financial Instruments”, Section 6 “Shareholders' Equity”, Section 9 “Accounting Policies and Estimates” and Section 11 "Risks and Uncertainties". Often, but not always, forward-looking information can be identified by the use of words such as “plans”, “expects” or “does not expect”, “is expected”, “scheduled”, “estimates”, “intends”, “anticipates” or “does not anticipate”, or “believes”, or variations of such words and phrases, or statements that certain actions, events or results “may”, “could”, “would”, “might” or “will” be taken, occur or be achieved. Although the Company believes that the estimates reflected in such forward-looking information are reasonable, such forward-looking information involves known and unknown risks, uncertainties and other factors which may cause actual results, performance or achievements to be materially different from any future results, performance or achievements expressed or implied by the forward-looking information and undue reliance should not be placed on such information.
Factors which could cause actual results to differ materially from current expectations include, but are not limited to: the ability of the Company to successfully implement its strategic initiatives; productivity improvement and cost reduction initiatives and whether such initiatives will yield the expected benefits; the results achieved pursuant to the Company's long-term credit card marketing and servicing alliance with JPMorgan Chase Bank, N.A. (Toronto Branch), or JPMorgan Chase; general economic conditions; competitive conditions in the businesses in which the Company participates; changes in consumer spending; seasonal weather patterns; weaker business performance in the fourth quarter; customer preference toward product offerings; ability to retain senior management and key personnel; ability of the Company to successfully manage its inventory levels; disruptions to the Company's computer systems; economic, social, and political instability in jurisdictions where suppliers are located; increased shipping costs, potential transportation delays and interruptions;

14
damage to the reputations of the brands the Company sells; changes in the Company's relationship with its suppliers; the outcome of product liability claims; any significant security compromise or breach of the Company's customer, associate or Company information; the credit worthiness and financial stability of tenants, partners and co-venturers, with respect to the Company's real estate joint venture interests; possible changes in the Company's ownership by Sears Holdings Corporation ("Sears Holdings") and other significant shareholders following the spin-off of a minority interest in Sears Canada by Sears Holdings; interest rate fluctuations and other changes in funding costs and investment income; fluctuations in foreign currency exchange rates; the possibility of negative investment returns in the Company's pension plan or an unexpected increase to the defined benefit obligation; the impairment of goodwill and other assets; new accounting pronouncements, or changes to existing pronouncements, that impact the methods we use to report our financial condition and results from operations; uncertainties associated with critical accounting assumptions and estimates; the outcome of pending legal proceedings; compliance costs associated with environmental laws and regulations; the possible future termination of certain intellectual property rights associated with the "Sears" name and brand names if Sears Holdings reduces its interest in the Company to less than 25%; and changes in laws, rules and regulations applicable to the Company. Information about these factors, other material factors that could cause actual results to differ materially from expectations and about material factors or assumptions applied in preparing forward-looking information, may be found in this MD&A and in the Company's 2011 recast Annual Report under Section 12 “Risks and Uncertainties” and elsewhere in the Company's filings with securities regulators. The forward-looking information in the Annual Report and in this MD&A are, unless otherwise indicated, stated as of the date hereof and are presented for the purpose of assisting investors and others in understanding our financial position and results of operations as well as our objectives and strategic priorities, and may not be appropriate for other purposes. The Company does not undertake any obligation to update publicly or to revise any forward-looking information, whether as a result of new information, future events or otherwise, except as required by law.

15
1. Company Performance
a. Operations
The Company’s operations are focused on merchandising and include the sale of goods and services through the Company’s Retail channels, which includes its Full-Line, Sears Home, Hometown Dealer, Outlet, Appliances and Mattresses, Corbeil Electrique Inc. (“Corbeil”) stores, and its Direct (catalogue/internet) channel. It also includes service revenue related to product repair and home improvement. Commission revenues include travel, insurance, and performance payments which are primarily received from the Company’s long-term credit card marketing and servicing alliance with JPMorgan Chase. The Company has also partnered with Thomas Cook Canada Inc. (“Thomas Cook”) in a multi-year licensing arrangement, under which Thomas Cook manages the day-to-day operations of all Sears Travel offices and provides commissions and licensing fees to the Company. Licensing fee revenues are comprised of payments received from licensees that operate within the Company’s stores. The Company is a party to a number of joint ventures which have been classified as jointly controlled entities for financial reporting purposes. These joint ventures are jointly controlled by the joint venture partners who are entitled to a share of the respective joint ventures’ income or loss.
Retail Channel
Full-Line Department stores – Sears Full-Line Department stores are located primarily in suburban enclosed shopping centres. The major merchandise categories include the following:
Apparel & Accessories - Women’s, men’s and children’s apparel, nursery products, cosmetics, jewellery, footwear and accessories.
Home & Hardlines - Home furnishings and mattresses, home décor, lawn and garden, hardware, electronics and leisure, and seasonal products.
Major Appliances - refrigeration, laundry, ranges, floorcare and sewing.
Although merchandise varies by store, the merchandise sales mix between the three major categories are approximately 55% Apparel and Accessories, 25% Home and Hardlines and 20% Major Appliances.
Full-Line Department stores also offer Sears Home Services and include a Sears catalogue merchandise pick-up location. Sears Travel offices and licensed businesses, such as optical centres and portrait studios, are also located in most of the Company’s Full-Line Department stores.
Sears Home stores – Sears Home stores are typically located in power centres and present an extensive selection of furniture, mattresses and box-springs, major appliances and electronics. The majority of these stores range in size from 35,000 to 60,000 square feet. Home Improvement Products and Services operations are located within 8 of 9 Sears Home stores. The showrooms provide a range of products and services sold under the Sears Home Services banner that are complementary to home furnishings and major appliances.
Hometown Dealer stores – Sears Hometown Dealer locations are independently operated and offer major appliances, furniture, home electronics, outdoor power equipment as well as a catalogue merchandise pick-up location. Most Hometown Dealer stores are located in markets that had previously been served by a catalogue agent and continue to lack the population to support a Full-Line Department store.
Outlet stores – Sears Outlet stores offer clearance merchandise, particularly from the Company’s Direct channel, as well as surplus big-ticket items from all channels.
Appliances and Mattresses stores – The Sears Appliances and Mattresses stores are part of the Company’s strategy to bring its product categories to a growing number of customers who shop in conveniently located power centres. These stores are smaller in size (approximately 10,000 to 15,000 square feet) and feature a wide selection of major appliances, mattresses and box-springs, and include Sears private labels and a variety of national brands.
Corbeil – Corbeil is a chain of major appliance specialty stores located throughout Québec, Greater Toronto Area and Eastern Ontario. There are 33 stores in the chain, 17 of which are franchised. The chain also includes one liquidation centre and one distribution centre in Montreal. Stores average approximately 6,500 square feet in size.
16
Sears Travel – Sears Travel service operates within 101 Sears locations across Canada, an online travel service at www.searstravel.ca and 1-866-FLY-SEARS, which connects customers to the nearest geographical branch. As of January 30, 2011, Thomas Cook manages the day-to-day operations of all Sears Travel offices and the Sears Travel website.
Sears Home Services
Sears Home Services was formed as a result of combining Home Improvement Products and Services and Product Repair Services. Sears Home Services is marketed through 82 Full-line department stores, 21 Parts and Services stores and 8 of 9 Sears Home Services Showrooms located within Sears Home and Outlet stores, by telephone at 1-800-4-MY-HOME (English) or 1-800-LE-FOYER (French) and online at Sears.ca. Sears Home Services provides a broad range of home services, including the sale, installation, maintenance and repair of heating and cooling equipment, roofing, doors and windows, flooring, window coverings, energy audits, kitchen and bathroom renovations, carpet and upholstery cleaning and duct cleaning. Sears Home Services also offers the largest and most comprehensive parts and service network in Canada, with over 1 million parts available and a network of more than 2,000 technicians and contractors.
Direct Channel
The Company’s Direct channel is comprised of its catalogue business, which is Canada’s largest general merchandise catalogue business, and Sears.ca, one of Canada’s leading online shopping destinations with over 91 million visits in Fiscal 2012. With two distribution centres exclusively dedicated to servicing the Direct channel and 1,512 catalogue merchandise pick-up locations nationwide, Sears can deliver orders in most areas of the country. Orders can be placed by telephone at 1-800-26-SEARS, by mail, fax, online at Sears.ca or in person through Sears stores and catalogue agents. At the end of Fiscal 2012, over 1,300 of the total 1,512 catalogue merchandise pick-up locations were independently operated under independent local ownership, with the remaining 168 units located within Sears corporate stores.
Catalogue – In Fiscal 2012, over 15 different catalogues were distributed throughout Canada reaching up to approximately 2.9 million households. In addition, during Fiscal 2012, Sears distributed 7 Specialogues designed to offer more seasonally relevant merchandise to specific customers.
Sears.ca – The Company’s website, Sears.ca, enables the Company to provide new and exciting merchandise offers directly to web customers and highlights the Company’s extensive general merchandise selection. In Fiscal 2012, the Company continued to invest in its online capabilities to improve the user experience, and engage new customers and demographics. Sears is committed to maintaining its reputation as a trusted Canadian retailer by focusing on customer privacy, security, and satisfaction when shopping on Sears.ca.
Logistics
National Logistics Centres– Sears operates 6 logistics centres strategically located across the country. The total floor area of these logistics centres was 6.5 million square feet at the end of Fiscal 2012, of which 5.6 million square feet is devoted to warehouse and logistics operations. The remainder of the space is utilized for other Sears operations, including call centre services.
S.L.H. Transport Inc. (“SLH”) – The Company’s wholly-owned subsidiary, SLH, transports merchandise to stores, catalogue merchandise pick-up locations and directly to customers. SLH is responsible for providing logistics services for the Company’s merchandising operations by operating a fleet of tractors and trailers to provide carrier services for Sears and contract carrier services to commercial customers who are unrelated to Sears. The arrangements with third parties increase SLH’s fleet utilization and improve the efficiency of its operations. SLH continues to grow and has developed a nationwide distribution network to provide better and more consistent service to its customers.
17
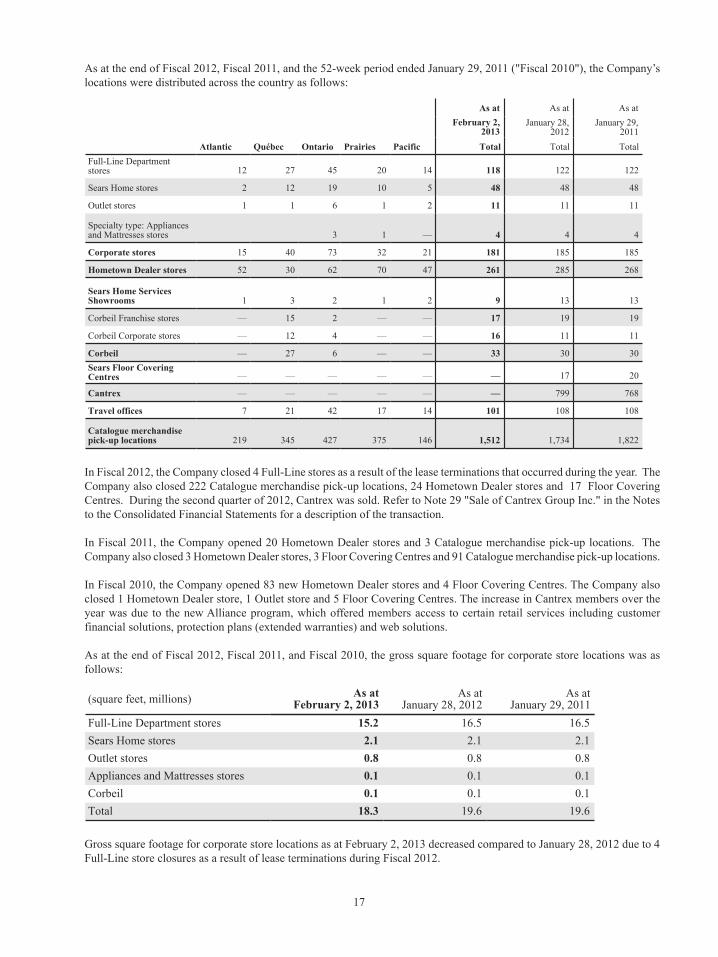
As at the end of Fiscal 2012, Fiscal 2011, and the 52-week period ended January 29, 2011 ("Fiscal 2010"), the Company’s locations were distributed across the country as follows:
As at As at As atFebruary 2,
2013January 28,
2012January 29,
2011Atlantic Québec Ontario Prairies Pacific Total Total Total
Full-Line Departmentstores 12 27 45 20 14 118 122 122
Sears Home stores 2 12 19 10 5 48 48 48
Outlet stores 1 1 6 1 2 11 11 11
Specialty type: Appliancesand Mattresses stores 3 1 — 4 4 4
Corporate stores 15 40 73 32 21 181 185 185
Hometown Dealer stores 52 30 62 70 47 261 285 268
Sears Home ServicesShowrooms 1 3 2 1 2 9 13 13
Corbeil Franchise stores — 15 2 — — 17 19 19
Corbeil Corporate stores — 12 4 — — 16 11 11
Corbeil — 27 6 — — 33 30 30Sears Floor CoveringCentres — — — — — — 17 20
Cantrex — — — — — — 799 768
Travel offices 7 21 42 17 14 101 108 108
Catalogue merchandisepick-up locations 219 345 427 375 146 1,512 1,734 1,822
In Fiscal 2012, the Company closed 4 Full-Line stores as a result of the lease terminations that occurred during the year. The Company also closed 222 Catalogue merchandise pick-up locations, 24 Hometown Dealer stores and 17 Floor Covering Centres. During the second quarter of 2012, Cantrex was sold. Refer to Note 29 "Sale of Cantrex Group Inc." in the Notes to the Consolidated Financial Statements for a description of the transaction.
In Fiscal 2011, the Company opened 20 Hometown Dealer stores and 3 Catalogue merchandise pick-up locations. The Company also closed 3 Hometown Dealer stores, 3 Floor Covering Centres and 91 Catalogue merchandise pick-up locations.
In Fiscal 2010, the Company opened 83 new Hometown Dealer stores and 4 Floor Covering Centres. The Company also closed 1 Hometown Dealer store, 1 Outlet store and 5 Floor Covering Centres. The increase in Cantrex members over the year was due to the new Alliance program, which offered members access to certain retail services including customer financial solutions, protection plans (extended warranties) and web solutions.
As at the end of Fiscal 2012, Fiscal 2011, and Fiscal 2010, the gross square footage for corporate store locations was as follows:
(square feet, millions) As atFebruary 2, 2013
As atJanuary 28, 2012
As atJanuary 29, 2011
Full-Line Department stores 15.2 16.5 16.5Sears Home stores 2.1 2.1 2.1Outlet stores 0.8 0.8 0.8Appliances and Mattresses stores 0.1 0.1 0.1Corbeil 0.1 0.1 0.1Total 18.3 19.6 19.6
Gross square footage for corporate store locations as at February 2, 2013 decreased compared to January 28, 2012 due to 4 Full-Line store closures as a result of lease terminations during Fiscal 2012.
18
Gross square footage for corporate store locations as at January 28, 2012 remained the same as compared to January 29, 2011.
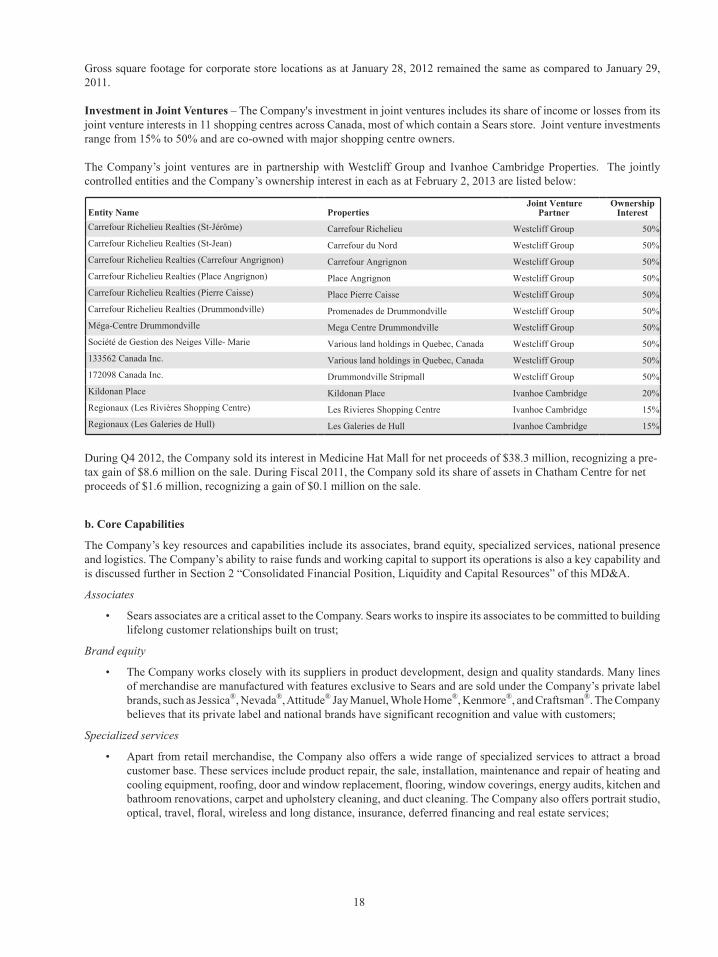
Investment in Joint Ventures – The Company's investment in joint ventures includes its share of income or losses from its joint venture interests in 11 shopping centres across Canada, most of which contain a Sears store. Joint venture investments range from 15% to 50% and are co-owned with major shopping centre owners.
The Company’s joint ventures are in partnership with Westcliff Group and Ivanhoe Cambridge Properties. The jointly controlled entities and the Company’s ownership interest in each as at February 2, 2013 are listed below:
Entity Name Properties Joint Venture
Partner Ownership
InterestCarrefour Richelieu Realties (St-Jérôme) Carrefour Richelieu Westcliff Group 50%Carrefour Richelieu Realties (St-Jean) Carrefour du Nord Westcliff Group 50%Carrefour Richelieu Realties (Carrefour Angrignon) Carrefour Angrignon Westcliff Group 50%Carrefour Richelieu Realties (Place Angrignon) Place Angrignon Westcliff Group 50%Carrefour Richelieu Realties (Pierre Caisse) Place Pierre Caisse Westcliff Group 50%Carrefour Richelieu Realties (Drummondville) Promenades de Drummondville Westcliff Group 50%Méga-Centre Drummondville Mega Centre Drummondville Westcliff Group 50%Société de Gestion des Neiges Ville- Marie Various land holdings in Quebec, Canada Westcliff Group 50%133562 Canada Inc. Various land holdings in Quebec, Canada Westcliff Group 50%172098 Canada Inc. Drummondville Stripmall Westcliff Group 50%Kildonan Place Kildonan Place Ivanhoe Cambridge 20%Regionaux (Les Rivières Shopping Centre) Les Rivieres Shopping Centre Ivanhoe Cambridge 15%Regionaux (Les Galeries de Hull) Les Galeries de Hull Ivanhoe Cambridge 15%
During Q4 2012, the Company sold its interest in Medicine Hat Mall for net proceeds of $38.3 million, recognizing a pre-tax gain of $8.6 million on the sale. During Fiscal 2011, the Company sold its share of assets in Chatham Centre for net proceeds of $1.6 million, recognizing a gain of $0.1 million on the sale.
b. Core Capabilities
The Company’s key resources and capabilities include its associates, brand equity, specialized services, national presence and logistics. The Company’s ability to raise funds and working capital to support its operations is also a key capability and is discussed further in Section 2 “Consolidated Financial Position, Liquidity and Capital Resources” of this MD&A.
Associates
• Sears associates are a critical asset to the Company. Sears works to inspire its associates to be committed to building lifelong customer relationships built on trust;
Brand equity
• The Company works closely with its suppliers in product development, design and quality standards. Many lines of merchandise are manufactured with features exclusive to Sears and are sold under the Company’s private label brands, such as Jessica®, Nevada®, Attitude® Jay Manuel, Whole Home®, Kenmore®, and Craftsman®. The Company believes that its private label and national brands have significant recognition and value with customers;
Specialized services
• Apart from retail merchandise, the Company also offers a wide range of specialized services to attract a broad customer base. These services include product repair, the sale, installation, maintenance and repair of heating and cooling equipment, roofing, door and window replacement, flooring, window coverings, energy audits, kitchen and bathroom renovations, carpet and upholstery cleaning, and duct cleaning. The Company also offers portrait studio, optical, travel, floral, wireless and long distance, insurance, deferred financing and real estate services;
19
National Presence
• The Company’s expansive physical and online presence puts it in proximity to customers all across Canada. Sears operates 118 Full-Line department stores, 357 specialty stores (including 48 Sears Home stores, 11 Outlet stores, 4 Appliances and Mattresses stores, 261 Hometown Dealer stores operated under independent local ownership and 33 Corbeil stores), 101 Sears Travel offices and over 1,500 merchandise pick-up locations for orders placed through the catalogue or online at www.sears.ca; and
Logistics
• The ability to move merchandise efficiently to stores, merchandise pick-up locations or directly to customers is one of the Company's key capabilities. The Company's wholly-owned subsidiary, SLH, is responsible for providing transportation services for the Company's merchandising operations and has arrangements with third parties to increase SLH's fleet utilization and improve its operating effectiveness. The Company conducts operations in six National Logistics Centres located in Vancouver, Calgary, Regina, Vaughan, Belleville and Montreal.
c. Strategic Initiatives
During Fiscal 2012, Sears Canada remained focused on executing its three-year Transformation strategy announced in 2011. This year, the Company implemented a number of significant changes, including the introduction of a new pricing model, the promotion of Sears fashion through the new LOOK! report, the start of the Full-Line and Sears Home store refreshes, the re-launch of the Gold Badge program designed to reward outstanding customer service, and the introduction of the new master brand strategy. Sears will continue with further initiatives to retain its competitive position within the Canadian retail landscape.
The Transformation's Formula for Growth is comprised of five key pillars as follows:
1. Build the Core: Implementing fundamental merchandise category plans to ensure that the right products and services are being offered in categories where the Company has a strong competitive position with Canadians, such as major appliances and mattresses;
2. Be Customer Driven: More fully and effectively utilizing our customer database to develop our merchandising and marketing strategies;
3. Get Value Right: Demonstrating a competitive value equation where our everyday price is more competitive, our promotions are well understood and balanced, our quality is superior and our service is dependable;
4. Operate Effective Formats: We are a multi-format retailer, operating in many different markets. We are working to align our category strengths with the market and to create more value from our trading strategies with retail concepts aligned to customer needs, including developing separate tactical approaches for our Full-line Department stores, Sears Home stores, Hometown Dealer stores, and Corbeil stores; and
5. Organize the Right Talent and Create a Winning Attitude: Maintaining a strong leadership team supported by loyal and dedicated associates who are committed to the implementation of our Transformation strategy.
The initiatives and corresponding results listed below include both new results seen in the fourth quarter and a recap of results from Fiscal 2012.
Build the core
• Announced three new alliances with The Aldo Group ("Aldo"), Buffalo International Inc. ("Buffalo") and SHS Services Management Inc. ("SHS"). The Company will continue to deepen relationships with successful organizations which can provide immediate credibility and continuity to our brands and services. Aldo is considered an industry leader in footwear fashion design and manufacturing capability, Buffalo's design and sourcing capability in denim-based apparel will help us attract a new and younger customer, and the combination of Sears brand, reputation and customer service with SHS's expertise, processes and technology is expected to improve the operating efficiency of the Home Services business;

20
• Implemented a new strategy for toys by moving the focus to online sales, in order to free up floor space previously dedicated to a category that was only a key focus area for three months of the year. The online approach was augmented with an in-store aisle program in the fourth quarter to display 15 of the best toys for the holiday season;
• Introduced “The Baby's Room,” the new nursery and infant accessories department, part of the Kids Room children's area. In May 2012 Sears held a vendor tradeshow to 'baby-train' store associates from across Canada; on June 1, 2012 a public launch was held in Toronto featuring a seminar by parenting expert Nanny Robina;
• In September, 2012 Sears Canada became the first Canadian retailer to earn the Parent Tested Parent Approved (PTPA) seal of approval from North America's largest parent tester community; and
• Launched an online points redemption system in Sears Financial for its five million plus card members - one of the first major retail loyalty programs in Canada to do so.
Be customer driven
• Launched the new Sears brand positioning, “Make every day a great day” at a gathering of more than 1,500 associates and media on November 7, 2012. Sears developed and ran the new Holiday-themed TV commercial called “The Gift” with a background song called “Best Year” commissioned by Sears to represent the new brand. As of the end of January 2013, Sears has had over 5,000 downloads of “Best Year” and over half a million views of “The Gift.” On December 15, 2012 Sears reinforced its dedication to customers and associates through its "Sears National Great Day" event featuring Holiday festivities, giveaways and one-day deals at stores across Canada;
• Published 4 editions of the LOOK! report including the fourth quarter's November Holiday edition. The LOOK! report features fashion, beauty, and lifestyle trends and highlights the Company's newest products of the season. The releases were supported with in-store fashion shows, an exclusive evening event for Sears VIP customers, and smaller customer events in stores across the country;
• Launched the 60th edition of the annual Wish Book, the Company's Christmas catalogue. This year's edition featured a commemorative cover that included images of every Wish Book published since our very first one 60 years ago in 1953. Over 3 million copies of the special edition Wish Book were distributed across Canada, featuring 736 pages of holiday gift ideas; and
• Waived the 2.5% foreign currency transaction charge on purchases made using Sears Financial™ MasterCard and Sears Financial ™ Voyage ™ MasterCard to appeal to the 65% of Canadians shopping and travelling abroad.
Get value right
• Reaffirmed Sears role as a Canadian retailer dedicated to keeping Canadians shopping at home by extending its annual “Black Friday” promotion to run from Thursday, November 22 through Sunday, November 25 (through Monday, November 26 for major appliances, electronics, fitness and snowblowers). Sears brought Black Friday savings to Canadians with hundreds of items at specially marked prices backed by a price match guarantee;
• Introduced the first products that meet Sears “Canada's Best” seal of approval criteria. The Canada's Best label will be assigned to an assortment of fashion and home products that meet required standards in quality, style and innovation. Products offered with this label are intended to be desirable and offer customers clear value when compared to competitors' offerings;
• Introduced a hassle-free return policy that includes a satisfaction guarantee with every purchase: if not completely satisfied, customers can now exchange or return almost all products within 30 days, or 90 days if they use their Sears Financial credit cards; and
• Lowered the price on over 5,000 products including items in every store and in every department and concurrently introduced specially-priced must-have WOW items.

21
Operate effective formats
• Continued to invest in store refreshes, with refreshes in Grande Prairie and Nanaimo stores underway, building on the new store concept implemented in Fiscal 2012, with the first round of refreshes in Barrie, Belleville, Newmarket and the Lime Ridge Mall in Hamilton stores and the second round of refreshes in Ville d'Anjou, St. Jerome, Oshawa and Sudbury stores. The refreshed store concept features improved presentation, wider aisles, streamlined offerings with new brands and a blend of items priced at both everyday value and at sale prices;
• Unveiled the 78,000 sq. ft. Sears Home store at the Pinecrest Shopping Centre in Ottawa, housing the largest major appliance and mattress shops of any Sears location, an expanded selection of accent furniture, chairs and tables and new brands of furniture;
• Opened 4 Corbeil stores in Sears initial Greater Toronto Area expansion plans for Corbeil. The Corbeil stores are located in Richmond Hill, Mississauga, Vaughan and Burlington;
• Launched an e-commerce transactional shoppable iPad application that features the 60th anniversary Wish Book, and due to the positive response from customers, this application will serve as a permanent Sears iPad Catalogue application, which will be updated throughout the year;
• Invested in upgrading Sears.ca, the largest Canadian transactional retail website. Sears Canada revamped its bilingual website to improve functionality, navigation, and overall shopping experience; and
• Sold the Company's 40% ownership of the leasehold interest in Medicine Hat Mall in Alberta to the Company's joint venture partner, Sleeping Bay Building Corp., and received net proceeds of $38.3 million. Earlier this year, Sears exited and returned leases on 4 properties to the landlords for financial consideration comprising Vancouver's Pacific Centre, Chinook Centre and Deerfoot Mall locations in Calgary, and the Rideau Centre store in Ottawa.
Organize the right talent and create a winning attitude
• Created the Associate Advisory Council consisting of 21 individuals from different business lines and across Canada with the mandate to provide critical insight, perspective and counsel to senior management;
• Unveiled the new team of Store Managers, District Managers and Category Specialists operating under a new structure in store operations and executed a large-scale associate move in the Company's retail support centre, designed to ensure physical organization aligns with work flow; and
• Appointed Douglas C. Campbell Executive Vice-President and Chief Operating Officer of the Company, overseeing retail operations, logistics, replenishment, information technology and international sourcing, and leading the Company's undertaking to improve efficiency across the enterprise. Sears has made changes to its management team designed to lead the organization effectively through the Transformation and help the Company achieve its operational and financial objectives.
“Live Green” Initiatives
The Company conducts its operations with a commitment to achieving success on economic, social and environmental levels. The Company continues to build upon the following three-point plan on environmental sustainability:
1. Enable customers to “Live Green”, reduce their energy bills and create a healthy home;
2. Reduce the environmental impact of Sears Canada's operations; and
3. Nurture a culture of sustainability among the Company's associates, customers and the communities in which the Company operates.
Sears Canada continued to focus on these three priorities by implementing the following initiatives during Q4 2012:
• Partnered with electric utility companies in Nova Scotia, British Columbia and Saskatchewan to promote major appliances and electronics energy saving products;
22
• Launched a province-wide fridge and freezer pick-up and recycling program in Ontario; and
• Completed a national re-lamping project which resulted in the replacement of over 625,000 bulbs, and which is expected to provide energy savings of over 13 million kilowatt hours annually.
SLH:
• Installation of wide-base tires and trailer skirts and the reduction of metric tonne miles, resulting in fuel savings of approximately 1.8 million litres;
• Implemented best in class route optimization technology to improve route planning, as well as driver and truck utilization; and
• SLH continued its participation in the Ontario LCV (Long Combination Vehicle) pilot project run by the Ministry of Transportation, which is restricted to a select group of qualified carriers and Ontario Trucking Association members. In 2012, SLH's LCV program generated fuel savings of over 620,000 litres.
Corporate Social Responsibility
The following is a summary of the results of the Company and its associates' corporate social responsibility efforts during Fiscal 2012:
• Assisted our local store charity partners through the sale of our 60th Anniversary charity plush, CooperTM/MC the bear. Sears charity plush has been helping children since 1998, raising over $1.3 million since 2005. Two dollars from the sale of each bear supported the healthy development of Canadian youth through after-school and children's health initiatives;
• Held our 25th annual Sears Boys & Girls Club of Canada (“BGCC”) Golf Tournament near Toronto, in cooperation with our vendors, raising over $200,000 to support BGCC youth programs, funds which Sears matched;
• Presented our 14th annual Tree of Wishes program in-stores, for which customers and associates donated holiday season gifts valued at over $230,000 to less fortunate children, with the help of local charities;
• Held the second annual Sears Great Canadian Run (the “Run”), a full day running adventure hosted in two cities: Toronto in September and Ottawa in October. The Runs were held to benefit local pediatric oncology hospitals and organizations in the cities where the Runs took place, such as the Children's Hospital of Eastern Ontario. Support was also extended to Sears National pediatric oncology research initiatives such as The Sears Childhood Cancer Fellowship at the Hospital for Sick Children in Toronto; and
• The Sears Great Canadian Chill took place in four communities between New Year's Day and Family Day: Toronto and Ottawa on New Year's Day, Vancouver on February 18 and London on March 3. This traditional Canadian “polar-bear dip” is held to raise funds for the fight against childhood cancer. Several hundred people braved the cold waters to help support this worthy cause, with funds going to the Sears Canada Charitable Foundation to be distributed to children's hospitals for oncology needs.
d. Outlook
As Canadians' needs in a shopping experience evolve, Sears Canada is focused on keeping pace with emerging trends and innovative delivery of products and services, and is reinvigorating its business to better serve and grow with its customers. For the upcoming year, Sears will continue to execute on its Transformation. Some of the priorities for the 52-week period ending February 1, 2014 (“Fiscal 2013”) include the following:
• Continuing to maximize opportunities in merchandising categories where the Company has already established authority with customers, such as major appliances and mattresses, further developing private brands, and renewing focus on several additional "hero" categories;
• Improving customer service across all shopping formats and more effectively leveraging customer research, insights and loyalty data;

23
• Enhancing efficiency of marketing programs;
• Refining the approach to pricing and creating a logical blend of everyday value items, weekly specials and compelling sales promotions, providing merchandise with a quality level that customers should expect from Sears, resulting in an improved mix of regular versus promotional and clearance sales; and
• Attracting and retaining top talent in the industry, conducting associate engagement initiatives, and developing a performance-based culture across the Company.
Although management believes that Sears will achieve its long-term goal of sustainable and profitable growth, there can be no assurance that the Company will successfully implement these strategic initiatives or whether such initiatives will yield the expected results. For a discussion of the risks and uncertainties inherent in the Company's business, refer to Section 11 "Risks and Uncertainties".
e. Use of Non-IFRS Measures, Measures of Operating Performance and Reconciliation of Net Earnings (Loss) to Adjusted EBITDA
The Company’s consolidated financial statements are prepared in accordance with IFRS. Management uses IFRS, non-IFRS and operating performance measures as key performance indicators to better assess the Company’s underlying performance and provides this additional information in this MD&A.
Same store sales is a measure of operating performance used by management, the retail industry and investors to compare retail operations, excluding the impact of store openings and closures. Same store sales represents merchandise sales generated through operations in the Company’s Full-line, Sears Home, Hometown Dealer and Corbeil stores that were continuously open during both of the periods being compared. More specifically, the same store sales metric compares the same calendar weeks for each period and represents the 14 and 53-week periods ended February 2, 2013 and the 13 and 52-week periods ended January 28, 2012. The calculation of same store sales is a performance metric and may be impacted by store space expansion and contraction.
A reconciliation of the Company’s total revenue to same store sales is outlined in the following table:
Fourth Quarter Fiscal
(in CAD millions) 2012 2011 2012 2011Total revenue $ 1,298.0 $ 1,365.9 $ 4,300.7 $ 4,619.3 Non-comparable store sales 364.5 318.6 1,169.6 1,119.5 Same store sales 933.5 1,047.3 3,131.1 3,499.8Same store sales percentage change (3.8)% (7.4)% (5.6)% (7.5)%
Adjusted EBITDA is a non-IFRS measure and excludes finance costs, interest income, share of income or loss from joint ventures, income tax expense or recovery, depreciation and amortization and income or expenses of a non-recurring or one-time nature. Adjusted EBITDA is a measure used by management, the retail industry and investors as an indicator of the Company's operating performance, ability to incur and service debt, and as a valuation metric. The Company uses Adjusted EBITDA to evaluate the operating performance of its business as well as an executive compensation metric. While Adjusted EBITDA is a non-IFRS measure, management believes that it is an important indicator of operating performance because it excludes the effect of financing and investing activities by eliminating the effects of interest and depreciation and removes the impact of certain non-recurring items that are not indicative of our ongoing operating performance. Therefore, management believes Adjusted EBITDA gives investors greater transparency in assessing the Company's results of operations.
These measures do not have any standardized meaning prescribed by IFRS and therefore may not be comparable to similar measures presented by other reporting issuers. Adjusted EBITDA should not be considered in isolation or as an alternative to measures prepared in accordance with IFRS.
24
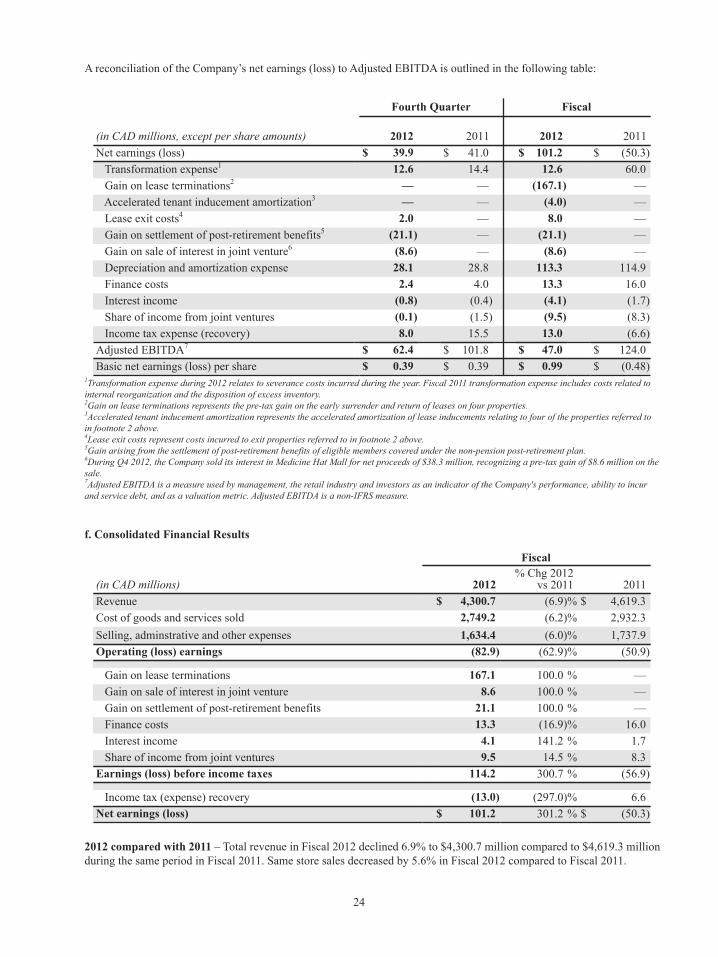
A reconciliation of the Company’s net earnings (loss) to Adjusted EBITDA is outlined in the following table:
Fourth Quarter Fiscal
(in CAD millions, except per share amounts) 2012 2011 2012 2011Net earnings (loss) $ 39.9 $ 41.0 $ 101.2 $ (50.3) Transformation expense1 12.6 14.4 12.6 60.0 Gain on lease terminations2 — — (167.1) — Accelerated tenant inducement amortization3 — — (4.0) — Lease exit costs4 2.0 — 8.0 — Gain on settlement of post-retirement benefits5 (21.1) — (21.1) — Gain on sale of interest in joint venture6 (8.6) — (8.6) — Depreciation and amortization expense 28.1 28.8 113.3 114.9 Finance costs 2.4 4.0 13.3 16.0 Interest income (0.8) (0.4) (4.1) (1.7) Share of income from joint ventures (0.1) (1.5) (9.5) (8.3) Income tax expense (recovery) 8.0 15.5 13.0 (6.6)Adjusted EBITDA7 $ 62.4 $ 101.8 $ 47.0 $ 124.0Basic net earnings (loss) per share $ 0.39 $ 0.39 $ 0.99 $ (0.48)
1Transformation expense during 2012 relates to severance costs incurred during the year. Fiscal 2011 transformation expense includes costs related to internal reorganization and the disposition of excess inventory. 2Gain on lease terminations represents the pre-tax gain on the early surrender and return of leases on four properties.3Accelerated tenant inducement amortization represents the accelerated amortization of lease inducements relating to four of the properties referred to in footnote 2 above. 4Lease exit costs represent costs incurred to exit properties referred to in footnote 2 above.5Gain arising from the settlement of post-retirement benefits of eligible members covered under the non-pension post-retirement plan. 6During Q4 2012, the Company sold its interest in Medicine Hat Mall for net proceeds of $38.3 million, recognizing a pre-tax gain of $8.6 million on the sale.7Adjusted EBITDA is a measure used by management, the retail industry and investors as an indicator of the Company's performance, ability to incur and service debt, and as a valuation metric. Adjusted EBITDA is a non-IFRS measure.
f. Consolidated Financial Results
Fiscal
(in CAD millions) 2012 % Chg 2012
vs 2011 2011Revenue $ 4,300.7 (6.9)% $ 4,619.3Cost of goods and services sold 2,749.2 (6.2)% 2,932.3Selling, adminstrative and other expenses 1,634.4 (6.0)% 1,737.9Operating (loss) earnings (82.9) (62.9)% (50.9)
Gain on lease terminations 167.1 100.0 % — Gain on sale of interest in joint venture 8.6 100.0 % — Gain on settlement of post-retirement benefits 21.1 100.0 % — Finance costs 13.3 (16.9)% 16.0 Interest income 4.1 141.2 % 1.7 Share of income from joint ventures 9.5 14.5 % 8.3Earnings (loss) before income taxes 114.2 300.7 % (56.9)
Income tax (expense) recovery (13.0) (297.0)% 6.6Net earnings (loss) $ 101.2 301.2 % $ (50.3)
2012 compared with 2011 – Total revenue in Fiscal 2012 declined 6.9% to $4,300.7 million compared to $4,619.3 million during the same period in Fiscal 2011. Same store sales decreased by 5.6% in Fiscal 2012 compared to Fiscal 2011.

25
The decrease is primarily attributable to sales declines in Craftsman®, electronics , bedroom and bath, womens' apparel and menswear categories, partially offset by revenue improvements in major appliances, specifically in the refrigerators , laundry and ranges categories. In addition, $25.5 million of the decrease in revenues is attributable to the closure of 4 Full-Line stores during Fiscal 2012 and the sale of Cantrex during Q2 2012. Revenue was positively impacted by approximately $38.3 million due to the additional 53rd week in Fiscal 2012.
Cost of goods and services sold was $2,749.2 million in Fiscal 2012 compared to $2,932.3 million in Fiscal 2011, a 6.2% decrease year-over-year. This decrease was primarily attributable to lower sales volumes.
The Company’s gross margin rate was 36.1% for Fiscal 2012 compared to 36.5% in Fiscal 2011. In Fiscal 2011 there was a one-time inventory charge, relating to planned disposition of excess inventory. The Fiscal 2011 gross margin rate excluding the one-time inventory charge was 37.4%. The decrease in the gross margin rate in Fiscal 2012 compared to Fiscal 2011 was due primarily to reduced margin in fitness and recreation, Corbeil, children's wear, jewelery, accessories and luggage and footwear categories.
Selling, administrative and other expenses including depreciation and amortization expense was $1,634.4 million in Fiscal 2012 compared to $1,737.9 million in Fiscal 2011. The decrease in expense was primarily driven by reduced spending in advertising. Advertising expense decreased primarily due to planned reductions in catalogue pages and circulation, decreases in retail advertising relating to Full-Line, and a reduction in pre-print advertising. Expenses were negatively impacted by Transformation costs of $12.6 million related primarily to severance associated with approximately 700 associates in the Retail Support Centre, Full-Line stores and logistics areas.
On March 2, 2012, the Company entered into an agreement to surrender and terminate early the operating leases on three properties: Vancouver Pacific Centre, Chinook Centre (Calgary) and Rideau Centre (Ottawa). The Company was a long-term and important anchor tenant in the three properties, and the landlord approached the Company with a proposal to terminate early the three leases and vacate the premises in exchange for $170.0 million. The payment represents the amount the landlord was willing to pay for the right to redevelop the property based upon its analysis of the potential returns from redevelopment.
On the closing date, April 20, 2012, the Company received cash proceeds of $170.0 million for the surrender of the three leases, resulting in a pre-tax gain of $164.3 million for the 13-week period ended April 28, 2012, net of the de-recognition of leasehold improvements of $5.7 million. The Company exited all three properties on October 31, 2012, and has no further financial obligation related to the transaction. The pre-tax gain is excluded from Adjusted EBITDA. Included in “Selling, administrative and other expenses” in the Consolidated Statements of Net Earnings (Loss) and Comprehensive Income (Loss) for the 53-week period ended February 2, 2013 is $8.0 million of exit costs relating to these three properties, partially offset by $4.0 million of accelerated amortization of deferred lease inducements.
On June 20, 2012, the Company entered into an agreement to surrender and terminate early the operating lease on its Deerfoot (Calgary) property. The landlord approached the Company with a proposal to terminate early the lease in exchange for cash proceeds of $5.0 million, subject to certain closing conditions, on the closing date of October 26, 2012. In Fiscal 2010, the Company incurred an impairment loss of $2.9 million relating to the property, plant and equipment at its Deerfoot property. As a result of the agreement and expected proceeds, the Company recorded an impairment loss reversal (net of accumulated amortization) of $2.1 million in "Selling, administrative and other expenses" in the second quarter of 2012. On the closing date of October 26, 2012, the Company vacated the property and received cash proceeds of $5.0 million, resulting in a pre-tax gain of $2.8 million for the 13-week period ended October 27, 2012, net of the de-recognition of leasehold improvements and furniture and fixtures of $2.2 million. The pre-tax gain is excluded from Adjusted EBITDA. The Company has no further financial obligation related to the transaction.
Finance costs in Fiscal 2012 decreased by 16.9% to $13.3 million compared to $16.0 million during Fiscal 2011 due to lower long-term debt levels compared to last year.
Interest income increased by 141.2% to $4.1 million in Fiscal 2012 compared to $1.7 million in Fiscal 2011 primarily due to interest income of $1.6 million earned on deposits made to tax authorities and higher levels of cash and cash equivalents, prior to the dividend payment of $101.9 million in January 2013.
Share of income from joint ventures in Fiscal 2012 increased by 14.5% to $9.5 million compared to $8.3 million for Fiscal 2011. The increase is primarily due to lower expenses incurred by the Westcliff joint venture properties, partially offset by an impairment loss of $2.2 million on the Promenades de Drummondville property recorded in Q4 2012, and lower income due to the sale of the Chatham joint venture property in the third quarter of 2011.

26
During Q4 2012, the Company sold its interest in Medicine Hat Mall for net proceeds of $38.3 million, recognizing a pre-tax gain of $8.6 million on the sale.
In the fourth quarter of 2012, the Company made a voluntary offer to settle health and dental benefits of eligible members covered under the non-pension post retirement plan. Based on the accepted offers, the Company paid $18.1 million and recorded a pre-tax settlement gain of $21.1 million ($21.9 million net of $0.8 million of expenses), as shown on the Consolidated Statements of Net Earnings (Loss) and Comprehensive Income (Loss). The gain has been excluded from Adjusted EBITDA.
Income tax expense was $13.0 million for Fiscal 2012 compared to an income tax recovery of $6.6 million in Fiscal 2011. The year-over-year change was primarily attributable to higher taxable earnings as a result of the gain recognized on the termination of the 4 leases during Fiscal 2012.
Adjusted EBITDA for Fiscal 2012 was $47.0 million compared to $124.0 million in Fiscal 2011, a decrease of $77.0 million.
g. Fourth Quarter Results
Fourth Quarter
(in CAD millions) 2012 % Chg 2012
vs 2011 2011Revenue $ 1,298.0 (5.0)% $ 1,365.9Cost of goods and services sold 848.7 (1.8)% 864.6Selling, adminstrative and other expenses 429.6 (3.0)% 442.7Operating earnings 19.7 (66.4)% 58.6
Gain on sale of interest in joint venture 8.6 100.0 % — Gain on settlement of post-retirement benefits 21.1 100.0 % — Finance costs 2.4 (40.0)% 4.0 Interest income 0.8 100.0 % 0.4 Share of income from joint ventures 0.1 (93.3)% 1.5Earnings before income taxes 47.9 (15.2)% 56.5
Income tax expense (8.0) (48.4)% (15.5)Net earnings $ 39.9 (2.7)% $ 41.0
Q4 2012 compared with Q4 2011 – Total revenue in Q4 2012 decreased by 5.0% to $1,298.0 million compared to $1,365.9 million in Q4 2011, with same store sales declines of 3.8% in Q4 2012. The revenue decline is mainly attributed to sales declines in electronics, the Craftsman®, fitness and recreation, and men's casual wear categories. In addition, $29.1 million of the decrease in revenues is attributable to the closure of 4 Full-Line stores during Fiscal 2012 and the sale of Cantrex during the second quarter of 2012.
During Q4 2012, the Company has achieved improved results in sales of major appliances, specifically in the refrigerators, laundry and ranges categories. In addition, there were sales increases in apparel and accessories, specifically in children's furniture and children's wear. Revenue in Q4 2012 was also positively impacted by approximately $38.3 million due to the 53rd week in Fiscal 2012.
Cost of goods and services sold was $848.7 million in Q4 2012 compared to $864.6 million in Q4 2011, a 1.8% decrease quarter-over-quarter. This decrease is primarily attributable to lower sales volumes and lower merchandise losses, despite the 53rd week of additional sales volume in Fiscal 2012. The Company’s gross margin rate was 34.6% in Q4 2012 compared to 36.7% in Q4 2011. The decrease in the gross profit rate was due primarily to reduced margins in Corbeil, accessories, women's intimates and footwear categories.
Selling, administrative and other expenses, including depreciation and amortization expense was $429.6 million in Q4 2012 compared to $442.7 million in Q4 2011. The decrease in expense was primarily driven by reduced spending in advertising.

27
Advertising expense decreased primarily due to reductions in catalogue pages and circulation and decreases in retail advertising relating to Full-Line. Expenses were negatively impacted by Transformation costs of $12.6 million incurred in Q4 2012 related to severance primarily associated with approximately 700 associates in the Retail Support Centre, Full-Line stores and logistics areas.
Depreciation and amortization expense in Q4 2012 was comparable to the depreciation and amortization expense for Q4 2011.
Finance costs in Q4 2012 decreased to $2.4 million compared to $4.0 million in Q4 2011 due to lower long-term debt levels compared to last year. Interest income increased to $0.8 million in Q4 2012 compared to $0.4 million in Q4 2011. The increase in the period is due to higher levels of cash and cash equivalents compared to the same time last year.
During Q4 2012, the Company sold its interest in Medicine Hat Mall for net proceeds of $38.3 million, recognizing a pre-tax gain of $8.6 million on the sale.
In the fourth quarter of 2012, the Company made a voluntary offer to settle health and dental benefits of eligible members covered under the non-pension post retirement plan. Based on the accepted offers, the Company paid $18.1 million and recorded a pre-tax settlement gain of $21.1 million ($21.9 million net of $0.8 million of expenses), as shown on the Consolidated Statements of Net Earnings (Loss) and Comprehensive Income (Loss).
Income tax expense decreased to $8.0 million in Q4 2012 compared to $15.5 million in Q4 2011 due to lower taxable earnings. Adjusted EBITDA for Q4 2012 was $62.4 million compared to $101.8 million in Q4 2011, a decrease of $39.4 million.
2. Consolidated Financial Position, Liquidity and Capital Resources
Current assets as at February 2, 2013 were $169.3 million lower than at January 28, 2012 due primarily to the reduction of $160.4 million in cash and cash equivalents, a decrease in accounts receivable of $40.0 million compared to last year, partially offset by a $27.5 million increase in inventories compared to last year due primarily to the timing of inventory receipts.
Current liabilities as at February 2, 2013 were $113.6 million lower than January 28, 2012 due primarily to a reduction in accounts payable and accrued liabilities of $94.8 million, primarily due to the timing of inventory and expense receipts, and vendor payments.
Inventories were $851.4 million as at February 2, 2013 compared to $823.9 million at January 28, 2012. The $27.5 million increase in the inventory balance is primarily due to the timing of inventory receipts, and a reduction in inventory reserve balances due to improved inventory quality.
Total cash and cash equivalents was $237.0 million as at February 2, 2013 compared to $397.4 million as at January 28, 2012. The decrease of $160.4 million was primarily due to repayment of long-term obligations of $142.3 million, $101.9 million in dividend payments during Q4 2012, and the purchase of $97.5 million in property, plant and equipment and intangible assets, partially offset by $175.0 million in proceeds from lease terminations received during Fiscal 2012, and $38.3 million received for the sale of the Company's interest in Medicine Hat Mall.
Total assets and liabilities as at the end of Fiscal 2012 and Fiscal 2011 are as follows:
As at As at(in CAD millions, at period end) February 2, 2013 January 28, 2012Total assets $ 2,479.1 $ 2,730.7Total liabilities $ 1,402.7 $ 1,638.7
Total assets as at February 2, 2013 decreased by $251.6 million to $2,479.1 million compared to $2,730.7 million in Fiscal 2011 due primarily to lower cash and cash equivalents, property plant and equipment and investment in joint ventures as a result of the sale of the Company's interest in Medicine Hat Mall which occurred during Q4 2012.

28
Total liabilities as at February 2, 2013 decreased by $236.0 million to $1,402.7 million compared to $1,638.7 million in Fiscal 2011, due primarily to lower accounts payable and accrued liabilities, long-term obligations and retirement benefit liability.
Cash flow generated from (used for) operating activities - Cash flow from operating activities decreased by $164.9 million for the period ended February 2, 2013 to cash flow used for operating activities of $79.9 million compared to cash flow generated from operating activities of $85.0 million during the period ended January 28, 2012. The Company's primary source of operating cash flow is the sale of goods and services to customers, while the primary use of cash in operating activities is the purchase of merchandise inventories. The decrease in cash from operating activities is attributable to unfavourable changes in accounts payable and accrued liabilities, retirement benefit contributions, inventories and deferred revenue, partially offset by favourable changes in accounts receivable.
Accounts payable and accrued liabilities decreased $94.8 million from January 28, 2012 to $482.0 million as at February 2, 2013 primarily due to timing of payments to vendors and inventory receipts.
Retirement benefit liability decreased by $36.6 million due primarily to a voluntary offer to settle health and dental benefits of eligible members covered under the non-pension post retirement plan. Based on the accepted offers, the Company paid $18.1 million and recorded a pre-tax settlement gain of $21.1 million ($21.9 million net of $0.8 million of expenses).
Inventories increased by $27.5 million from January 28, 2012 to $851.4 million as at February 2, 2013 due to the timing of inventory receipts in addition to a reduction in inventory reserves during the year due to improvements in inventory quality.
Accounts receivable decreased by $40.0 million from January 28, 2012 to $76.2 million as at February 2, 2013 primarily due to the sale of the Cantrex operations at the beginning of the second quarter of 2012.
Cash flow (used for) generated from investing activities - Cash flow generated from investing activities increased by $203.4 million for the period ended February 2, 2013 to $139.9 million compared to cash flow used for investing activities of $63.5 million for the period ended January 28, 2012 primarily due to proceeds received from lease terminations of $175.0 million and proceeds received from the sale of the Company's interest in Medicine Hat Mall of $38.3 million. Cash flow generated from these transactions was partially offset by $97.5 million of capital expenditures incurred during the year.
Cash flow used for financing activities - Cash flow used for financing activities increased by $164.2 million to $220.5 million for the period ended February 2, 2013 compared to $56.3 million for the period ended January 28, 2012. The increase in cash flow used is primarily due to an extraordinary dividend payment of $101.9 million which occurred during Q4 2012, and additional repayments made on the credit facility during Fiscal 2012.
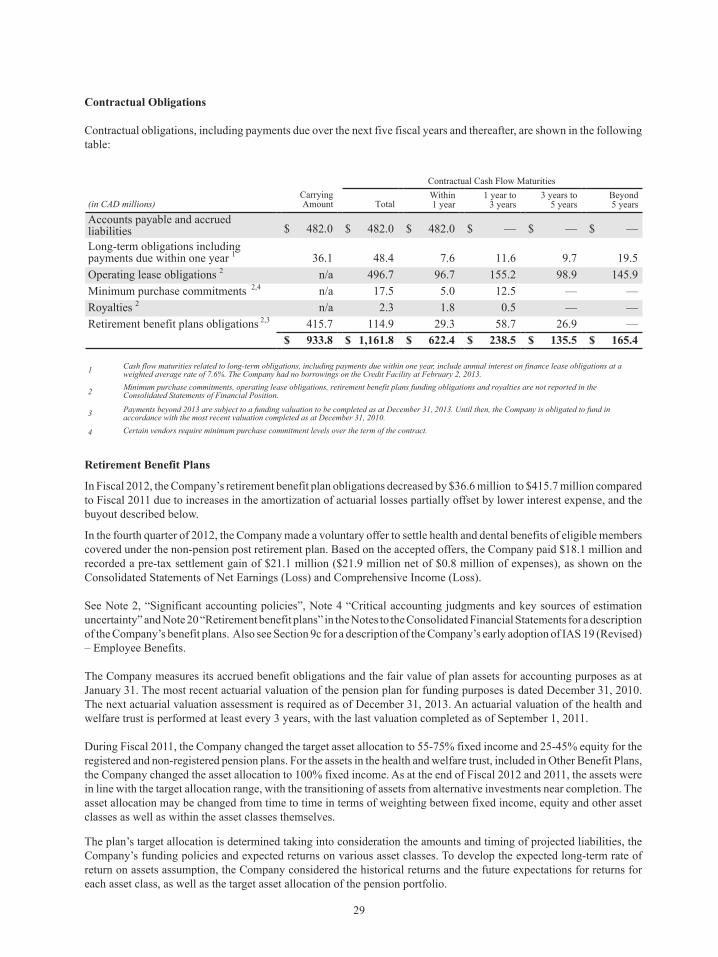
29
Contractual Obligations
Contractual obligations, including payments due over the next five fiscal years and thereafter, are shown in the following table:
(in CAD millions)CarryingAmount
Contractual Cash Flow Maturities
TotalWithin1 year
1 year to3 years
3 years to5 years
Beyond5 years
Accounts payable and accruedliabilities $ 482.0 $ 482.0 $ 482.0 $ — $ — $ —Long-term obligations including payments due within one year 1 36.1 48.4 7.6 11.6 9.7 19.5Operating lease obligations 2 n/a 496.7 96.7 155.2 98.9 145.9Minimum purchase commitments 2,4 n/a 17.5 5.0 12.5 — —Royalties 2 n/a 2.3 1.8 0.5 — —Retirement benefit plans obligations 2,3 415.7 114.9 29.3 58.7 26.9 —
$ 933.8 $ 1,161.8 $ 622.4 $ 238.5 $ 135.5 $ 165.4
1 Cash flow maturities related to long-term obligations, including payments due within one year, include annual interest on finance lease obligations at a weighted average rate of 7.6%. The Company had no borrowings on the Credit Facility at February 2, 2013.
2 Minimum purchase commitments, operating lease obligations, retirement benefit plans funding obligations and royalties are not reported in theConsolidated Statements of Financial Position.
3 Payments beyond 2013 are subject to a funding valuation to be completed as at December 31, 2013. Until then, the Company is obligated to fund inaccordance with the most recent valuation completed as at December 31, 2010.
4 Certain vendors require minimum purchase commitment levels over the term of the contract.
Retirement Benefit Plans
In Fiscal 2012, the Company’s retirement benefit plan obligations decreased by $36.6 million to $415.7 million compared to Fiscal 2011 due to increases in the amortization of actuarial losses partially offset by lower interest expense, and the buyout described below.
In the fourth quarter of 2012, the Company made a voluntary offer to settle health and dental benefits of eligible members covered under the non-pension post retirement plan. Based on the accepted offers, the Company paid $18.1 million and recorded a pre-tax settlement gain of $21.1 million ($21.9 million net of $0.8 million of expenses), as shown on the Consolidated Statements of Net Earnings (Loss) and Comprehensive Income (Loss).
See Note 2, “Significant accounting policies”, Note 4 “Critical accounting judgments and key sources of estimation uncertainty” and Note 20 “Retirement benefit plans” in the Notes to the Consolidated Financial Statements for a description of the Company’s benefit plans. Also see Section 9c for a description of the Company’s early adoption of IAS 19 (Revised) – Employee Benefits.
The Company measures its accrued benefit obligations and the fair value of plan assets for accounting purposes as at January 31. The most recent actuarial valuation of the pension plan for funding purposes is dated December 31, 2010. The next actuarial valuation assessment is required as of December 31, 2013. An actuarial valuation of the health and welfare trust is performed at least every 3 years, with the last valuation completed as of September 1, 2011.
During Fiscal 2011, the Company changed the target asset allocation to 55-75% fixed income and 25-45% equity for the registered and non-registered pension plans. For the assets in the health and welfare trust, included in Other Benefit Plans, the Company changed the asset allocation to 100% fixed income. As at the end of Fiscal 2012 and 2011, the assets were in line with the target allocation range, with the transitioning of assets from alternative investments near completion. The asset allocation may be changed from time to time in terms of weighting between fixed income, equity and other asset classes as well as within the asset classes themselves.
The plan’s target allocation is determined taking into consideration the amounts and timing of projected liabilities, the Company’s funding policies and expected returns on various asset classes. To develop the expected long-term rate of return on assets assumption, the Company considered the historical returns and the future expectations for returns for each asset class, as well as the target asset allocation of the pension portfolio.
30
The Company early adopted the amendments to IAS 19 beginning January 29, 2012, with retrospective application to prior reporting periods. A description of the nature of the change in accounting policy and a summary of its impact to the Company’s consolidated financial statements are included in Note 2 "Significant Accounting Policies" of the Notes to the Consolidated Financial Statements.
Capital Resources
The Company’s capital expenditures, working capital needs, debt repayment and other financing needs are funded primarily through cash generated from operations. In selecting appropriate funding choices, the Company’s objective is to manage its capital structure in such a way as to diversify its funding sources, while minimizing its funding costs and risks. Sears expects to be able to satisfy all of its financing requirements through cash on hand, cash generated by operations and available credit facilities. The Company’s cost of funding is affected by a variety of general economic conditions, including the overall interest rate environment, as well as the Company’s financial performance, credit ratings and fluctuations of its credit spread over applicable reference rates.
The Company’s debt consists of a secured credit facility and finance lease obligations. In September 2010, the Company entered into an $800.0 million senior secured revolving credit facility (the "Credit Facility") with a syndicate of lenders with a maturity date of September 10, 2015. The Credit Facility is secured with a first lien on inventory and credit card receivables. Availability under the Credit Facility is determined pursuant to a borrowing base formula. Availability under the Credit Facility was $501.5 million as at February 2, 2013 (January 28, 2012: $415.1 million). The current availability may be reduced by reserves currently estimated by the Company to be approximately $300.0 million, which may be applied by the lenders at their discretion pursuant to the Credit Facility agreement. As a result of judicial developments relating to the priorities of pension liability relative to certain secured obligations, the Company has executed an amendment to its Credit Facility agreement which would provide additional security to the lenders, with respect to the Company's unfunded pension liability by pledging certain real estate assets as collateral, thereby partially reducing the potential reserve amount the lenders could apply by up to $150.0 million. The potential additional reserve amount may increase or decrease in the future based on estimated net pension liabilities. The Company regularly monitors its sources and uses of cash and its level of cash on hand, and considers the most effective use of cash on hand including, repayment of obligations, potential acquisitions, stock purchases and dividends.
As at February 2, 2013, the Company had no borrowings on the Credit Facility and had unamortized transaction costs incurred to establish the Credit Facility of $6.2 million included in "Other long-term assets" in the Consolidated Statements of Financial Position (January 28, 2012: borrowings of $93.1 million, net of unamortized transaction costs of $8.0 million, included in "Long-term obligations"). In addition, the Company had $19.7 million (January 28, 2012: $6.3 million) of standby letters of credit outstanding against the Credit Facility. These letters of credit cover various payments including third party payments, utility commitments and defined benefit plan deficit funding (See Note 20 "Retirement benefit plans" of the Notes to the Consolidated Financial Statements for additional information on retirement benefits plans). Interest on drawings under the Credit Facility is determined based on bankers’ acceptance rates for one to three month terms or the prime rate plus a spread. Interest amounts on the Credit Facility are due monthly and are added to principal amounts outstanding.
As at February 2, 2013, the Company had outstanding merchandise letters of credit of U.S. $7.9 million (January 28, 2012: U.S. $5.5 million) used to support the Company’s offshore merchandise purchasing program with restricted cash and cash equivalents pledged as collateral.
3. Financial Instruments
The Company is exposed to credit, liquidity and market risk as a result of holding financial instruments. Market risk consists of foreign exchange and interest rate risk. See Note 14 “Financial instruments” of the Notes to the Consolidated Financial Statements for additional information.
Credit risk
Credit risk refers to the possibility that the Company can suffer financial losses due to the failure of the Company’s counterparties to meet their payment obligations. Exposure to credit risk exists for derivative instruments, cash and cash equivalents, short-term investments, accounts receivable and other long-term assets.

31
Cash and cash equivalents, short-term investments, accounts receivable and other long-term assets of $314.5 million as at February 2, 2013 (January 28, 2012: $514.9 million) expose the Company to credit risk should the borrower default on maturity of the investment. The Company manages this exposure through policies that require borrowers to have a minimum credit rating of A, and limiting investments with individual borrowers at maximum levels based on credit rating.
The Company is exposed to minimal credit risk from customers as a result of ongoing credit evaluations and review of accounts receivable collectability. As at February 2, 2013, no customers represented greater than 10.0% of the Company’s accounts receivable (January 28, 2012 : one customer represented 26.5% of the Company's accounts receivable).
Liquidity risk
Liquidity risk is the risk that the Company may not have cash available to satisfy financial liabilities as they come due. The Company actively maintains access to adequate funding sources to ensure it has sufficient available funds to meet current and foreseeable financial requirements at a reasonable cost.
Market risk
Market risk exists as a result of the potential for losses caused by changes in market factors such as foreign currency exchange rates, interest rates and commodity prices.
From time to time, the Company enters into foreign exchange contracts to reduce the foreign exchange risk with respect to U.S. dollar denominated assets and liabilities and for purchases of goods or services. As at February 2, 2013 and January 28, 2012, there were no contracts outstanding and therefore no derivative financial assets or liabilities were recognized in the Consolidated Statements of Financial Position.
During Fiscal 2012, the Company recorded a loss of $0.6 million (2011: gain of $0.9 million), relating to the translation or settlement of U.S. dollar denominated monetary items consisting of cash and cash equivalents, accounts receivable and accounts payable.
The period end exchange rate was 1.0027 U.S. dollar to Canadian dollar. A 10% appreciation or depreciation of the U.S. and or the Canadian dollar exchange rate was determined to have an after-tax impact on net earnings (loss) of $4.3 million for U.S. dollar denominated balances included in cash and cash equivalents, accounts receivable and accounts payable.
Interest rate risk
From time to time, the Company enters into interest rate swap contracts with approved financial institutions to manage exposure to interest rate risks. Interest rate risk reflects the sensitivity of the Company’s financial condition to movements in interest rates. Financial assets and liabilities which do not bear interest or bear interest at fixed rates are classified as non-interest rate sensitive. As at February 2, 2013 and January 28, 2012, there were no contracts outstanding and therefore no derivative financial assets or financial liabilities were recognized in the Consolidated Statements of Financial Position.
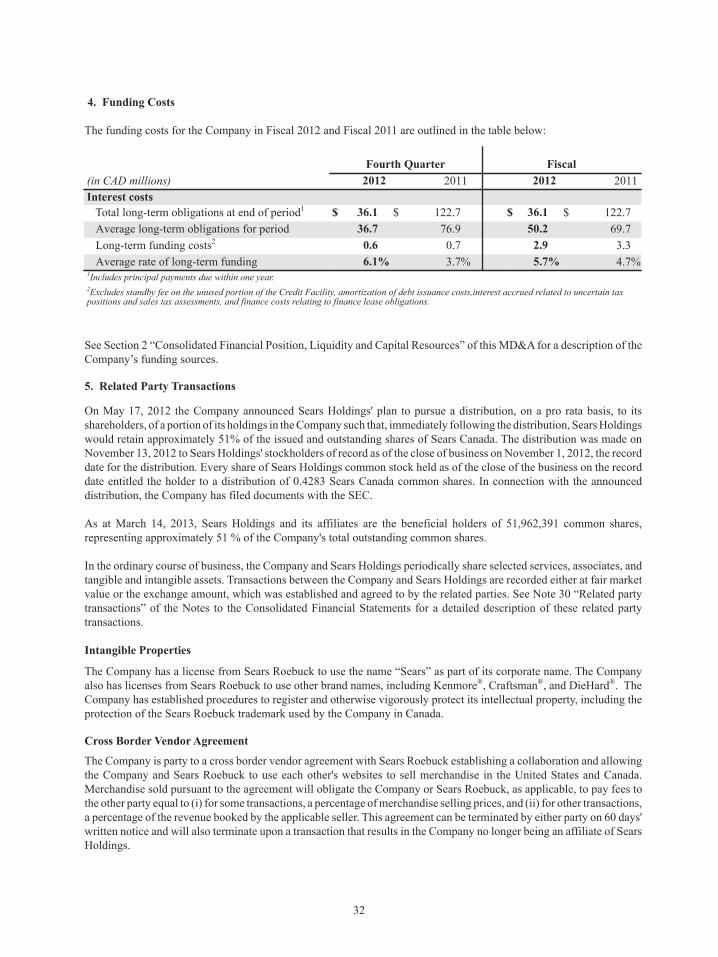
32
4. Funding Costs
The funding costs for the Company in Fiscal 2012 and Fiscal 2011 are outlined in the table below:
Fourth Quarter Fiscal(in CAD millions) 2012 2011 2012 2011Interest costs Total long-term obligations at end of period1 $ 36.1 $ 122.7 $ 36.1 $ 122.7 Average long-term obligations for period 36.7 76.9 50.2 69.7 Long-term funding costs2 0.6 0.7 2.9 3.3 Average rate of long-term funding 6.1% 3.7% 5.7% 4.7%1Includes principal payments due within one year.2Excludes standby fee on the unused portion of the Credit Facility, amortization of debt issuance costs,interest accrued related to uncertain tax positions and sales tax assessments, and finance costs relating to finance lease obligations.
See Section 2 “Consolidated Financial Position, Liquidity and Capital Resources” of this MD&A for a description of the Company’s funding sources.
5. Related Party Transactions
On May 17, 2012 the Company announced Sears Holdings' plan to pursue a distribution, on a pro rata basis, to its shareholders, of a portion of its holdings in the Company such that, immediately following the distribution, Sears Holdings would retain approximately 51% of the issued and outstanding shares of Sears Canada. The distribution was made on November 13, 2012 to Sears Holdings' stockholders of record as of the close of business on November 1, 2012, the record date for the distribution. Every share of Sears Holdings common stock held as of the close of the business on the record date entitled the holder to a distribution of 0.4283 Sears Canada common shares. In connection with the announced distribution, the Company has filed documents with the SEC.
As at March 14, 2013, Sears Holdings and its affiliates are the beneficial holders of 51,962,391 common shares, representing approximately 51 % of the Company's total outstanding common shares.
In the ordinary course of business, the Company and Sears Holdings periodically share selected services, associates, and tangible and intangible assets. Transactions between the Company and Sears Holdings are recorded either at fair market value or the exchange amount, which was established and agreed to by the related parties. See Note 30 “Related party transactions” of the Notes to the Consolidated Financial Statements for a detailed description of these related party transactions.
Intangible Properties
The Company has a license from Sears Roebuck to use the name “Sears” as part of its corporate name. The Company also has licenses from Sears Roebuck to use other brand names, including Kenmore®, Craftsman®, and DieHard®. The Company has established procedures to register and otherwise vigorously protect its intellectual property, including the protection of the Sears Roebuck trademark used by the Company in Canada.
Cross Border Vendor Agreement
The Company is party to a cross border vendor agreement with Sears Roebuck establishing a collaboration and allowing the Company and Sears Roebuck to use each other's websites to sell merchandise in the United States and Canada. Merchandise sold pursuant to the agreement will obligate the Company or Sears Roebuck, as applicable, to pay fees to the other party equal to (i) for some transactions, a percentage of merchandise selling prices, and (ii) for other transactions, a percentage of the revenue booked by the applicable seller. This agreement can be terminated by either party on 60 days' written notice and will also terminate upon a transaction that results in the Company no longer being an affiliate of Sears Holdings.

33
Software Agreement
The Company and Sears Roebuck are party to an information technology agreement for the sharing of information technology and software development, ownership and costs, which agreement (i) either party may terminate on 90 days' written notice, or (ii) will automatically terminate if Sears Holdings ceases to control 50% of the voting power of Sears Canada.
Import Services
Pursuant to an agreement between Sears Roebuck and the Company dated January 1, 1995, Sears Canada utilizes the international merchandise purchasing services of Sears Holdings. Sears Holdings may provide assistance to the Company with respect to monitoring and facilitating the production, inspection and delivery of imported merchandise and the payment to vendors. Sears Canada pays Sears Holdings a stipulated percentage of the value of the imported merchandise. In Fiscal 2012, Sears Canada paid $5.1 million to Sears Holdings in connection with this agreement compared to $4.7 million in Fiscal 2011.
Review and Approval
Material related party transactions are currently reviewed by the Audit Committee of the Company’s Board of Directors (the “Audit Committee”). The Audit Committee is responsible for pre-approving all related party transactions that have a value greater than $1.0 million.
6. Shareholders’ Equity
The only outstanding shares of the Company are common shares. The number of outstanding common shares at the end of Fiscal 2012 and Fiscal 2011 Consolidated Statement of Financial Position are as follows:
As atFebruary 2, 2013
As atJanuary 28, 2012
Outstanding common shares 101,877,662 102,748,295
In Fiscal 2012, no common shares were issued (2011: no common shares were issued) with respect to the exercise of options pursuant to the Employees Stock Plan.
On May 24, 2011, the Company filed a Normal Course Issuer Bid with the Toronto Stock Exchange (“TSX”) for the period of May 25, 2011 to May 24, 2012 (“2011 NCIB”). Pursuant to the 2011 NCIB, the Company was permitted to purchase for cancellation up to 5% of its issued and outstanding common shares, equivalent to 5,268,599 common shares based on the common shares issued and outstanding as at May 9, 2011. The Company did not purchase common shares under the 2011 NCIB if such shares could not be purchased at prices that the Company considered attractive. Decisions regarding the timing of purchases were based on market conditions and other factors. The Company did not renew its 2011 NCIB subsequent to May 24, 2012.
From time to time, when the Company did not possess material undisclosed information about itself or its securities, it entered into a pre-defined plan with a designated broker to allow for the repurchase of common shares at times when the Company ordinarily would not have been active in the market due to its own internal trading blackout periods, insider trading rules, or otherwise. Any such plans entered into with the Company's designated broker were adopted in accordance with the requirements of applicable Canadian securities laws.
During Fiscal 2012, 870,633 shares were purchased for $9.7 million (2011: 2,668,800 shares were purchased for $42.0 million) and cancelled. As at March 14, 2013, there were 101,877,662 common shares and 5,080 tandem award options outstanding under the Employees Stock Plan. Shareholders may obtain, without charge, a copy of the Notice of 2011 NCIB that the Company filed with the TSX by contacting the Company at 416-941-4428 or [email protected].

34
7. Profit Sharing and Stock-Based Compensation
a. Employee Profit Sharing Plan
The Sears Plan for Sharing Profits with Employees (“Employee Profit Sharing Plan”), established in 1976, was discontinued on January 1, 2005. Upon the announcement of the discontinuance of the plan, members had the option to retain or sell their common shares of the Company held in the plan. During Fiscal 2012, the Company wound up the Employee Profit Sharing Plan and distributed the remaining assets to its eligible members.
b. Stock Option and Share Purchase Plans for Employees and Directors
The Company has three stock-based compensation plans: the Employees Stock Plan, the Stock Option Plan for Directors and the Directors’ Share Purchase Plan.
The Employees Stock Plan, which expired on April 19, 2008, provided for the granting of options and Special Incentive Shares and Options, which vested over three years and expired ten years from the grant date. The Employee Stock Plan permitted the issuance of tandem awards. Following the last grant in 2004, the Company discontinued the granting of options and Special Incentive Shares and Options under the Employees Stock Plan. Notwithstanding the expiry of the Employees Stock Plan, all outstanding stock options may be exercised or allowed to expire in accordance with the terms of their grants. For the fiscal year ended February 2, 2013 there were 5,440 options outstanding under the Employees Stock Plan.
The Stock Option Plan for Directors provides for the granting of stock options to Directors who are not employees of the Company or Sears Holdings. Options granted under the Stock Option Plan for Directors generally vest over three years and are exercisable within ten years from the grant date. No stock options have been granted under the Stock Option Plan for Directors since the last grant in 2003.
The Directors’ Share Purchase Plan provides for the granting of common shares to Directors, to be purchased by the Company on the TSX, as part of their annual remuneration for services rendered on the Board. Following the last grant in 2005, the Company has discontinued the granting of shares under the Directors’ Share Purchase Plan.
8. Event After the Reporting Period
Subsequent to year end, the Company finalized an exclusive, multi-year licensing arrangement with SHS Services Management Inc. ("SHS Services"), which will result in SHS Services overseeing the day-to-day operations of all Sears installed home improvements business. The licensing agreement, effective March 3, 2013, is expected to result in a reduction to revenues and expenses; however, the impact to net earnings is not expected to be significant.
9. Accounting Policies and Estimates
a. Critical Accounting Estimates
In the application of the Company’s accounting policies, management is required to make judgments, estimates and assumptions with regard to the carrying amounts of assets and liabilities that are not readily apparent from other sources. The estimates and underlying assumptions are based on historical experience and other factors that are considered to be relevant. Actual results may differ from these estimates. The estimates and underlying assumptions are reviewed on an ongoing basis. Revisions to accounting estimates are recognized in the period in which the estimate is revised if the revision affects only that period, or in the period of the revision and future periods, if the revision affects both current and future periods.
The following are the critical judgments that management has made in the process of applying the Company’s accounting policies, key assumptions concerning the future and other key sources of estimation uncertainty that have the potential to materially impact the carrying amounts of assets and liabilities within the next fiscal year.
Legal Liabilities
Assessing the financial outcome of uncertain legal positions requires judgment to be made regarding the relative merits of each claim and the extent to which a claim is likely to be successful. The assessments are based on reviews conducted by internal and external counsel, when appropriate.

35
Changes in estimates or assumptions could cause changes to “Provisions” on the Consolidated Statements of Financial Position and a charge or credit to “Selling, administrative and other expenses” in the Consolidated Statements of Net Earnings (Loss) and Comprehensive Income (Loss). For additional information, see Note 16 “Provisions” in the Notes to the Consolidated Financial Statements.
Inventory
Obsolescence, Valuation and Inventory Stock Losses Inventory is written-down to reflect future losses on the disposition of obsolete merchandise. Future losses are estimated based on historical trends that vary depending on the type of inventory.
An adjustment is made each period to value inventory at the lower of cost and net realizable value. This adjustment is estimated based on historical trends that vary depending on the type of inventory.
Inventory is adjusted to reflect estimated inventory stock losses incurred in the year based on recent historical inventory count data.
Vendor RebatesInventory is adjusted to reflect vendor rebates received or receivable based on vendor agreements. This adjustment is estimated based on historical data and current vendor agreements.
Freight Inbound freight incurred to bring inventory to its present location is estimated each reporting period and is included in the cost of inventory. This estimate is based on historical freight costs incurred.
Changes in estimates may result in changes to “Inventories” on the Consolidated Statements of Financial Position and a charge or credit to “Cost of goods and services sold” in the Consolidated Statements of Net Earnings (Loss) and Comprehensive Income (Loss). For additional information, see Note 7 “Inventories” in the Notes to the Consolidated Financial Statements.
Impairment of Property, Plant and Equipment and Intangible Assets
The Company’s property, plant and equipment and intangible assets have been allocated to Cash Generating Units (“CGU”). Determining whether the CGU is impaired requires an estimation of the recoverable amount of the CGU, which is the higher of the fair value less costs to sell and its value in use. To determine the recoverable amount of the CGU, management is required to estimate its fair value by evaluating the expected future cash flows using an appropriate growth rate, the estimated costs to sell and a suitable discount rate to calculate the value in use.
Changes in estimates may result in changes to “Property, plant and equipment” and “Intangible assets” on the Consolidated Statements of Financial Position and a charge or credit to “Selling, administrative and other expenses” in the Consolidated Statements of Net Earnings (Loss) and Comprehensive Income (Loss). For additional information, see Note 9 “Property, plant and equipment and investment property”, and Note 10.2 “Intangible assets” respectively, in the Notes to the Consolidated Financial Statements.
Impairment of Goodwill
Determining whether goodwill is impaired requires the Company to determine the recoverable amount of the CGU to which the goodwill is allocated. To determine the recoverable amount of the CGU, management is required to estimate its fair value by evaluating expected future cash flows using an appropriate growth rate, the estimated costs to sell and a suitable discount rate to calculate the value in use.
Changes in estimates may result in reduction to “Goodwill” on the Consolidated Statements of Financial Position and a charge to “Selling, administrative and other expenses” in the Consolidated Statements of Net Earnings (Loss) and Comprehensive Income (Loss). For additional information, see Note 10 “Goodwill and intangible assets” in the Notes to the Consolidated Financial Statements.
36
Retirement Benefit Liability
The retirement benefit liability is estimated based on certain actuarial assumptions, including the discount rate, inflation rate, salary growth and mortality rates. New regulations and market driven changes may impact the assumptions made.
Changes in estimates may result in changes to the “Retirement benefit liability” on the Consolidated Statements of Financial Position and a charge or credit to “Selling, administrative and other expenses” in the Consolidated Statements of Net Earnings (Loss) and Other Comprehensive Income (Loss). For additional information, see Note 20 “Retirement benefit plans” in the Notes to the Consolidated Financial Statements.
Loyalty Program Deferred Revenue
The fair value of Sears Club points granted is deferred at the time of the related initial sale transaction and is recognized upon redemption of the points for merchandise. The redemption value of the points is estimated based on historical behaviour and trends in redemption rates and redemption values.
Changes in estimates may result in changes to “Deferred revenue” (current and non-current) in the Consolidated Statements of Financial Position and an increase or decrease to “Revenue” and/or “Cost of goods and services sold” in the Consolidated Statements of Net Earnings (Loss) and Comprehensive Income (Loss). For additional information, see Note 13 “Deferred revenue” in the Notes to the Consolidated Financial Statements.
Derivative Assets and Liabilities
All derivatives are measured at fair value. U.S. dollar option contracts are traded over-the-counter and give holders the right to buy, or sell, a specified amount of U.S. currency at an agreed upon price and date in the future. Fair values of the U.S. dollar option contracts are derived using a Black-Scholes valuation model. The Company is required to estimate various inputs which are used in this model that are a combination of quoted prices and observable market inputs. The fair values of derivatives include an adjustment for credit risk when appropriate.
Changes in estimates may result in changes to “Derivative financial assets” and “Derivative financial liabilities” on the Consolidated Statements of Financial Position and a charge or credit to “Cost of goods and services sold”, “Selling, administrative and other expenses” or “Other comprehensive income (loss)” in the Consolidated Statements of Net Earnings (Loss) and Comprehensive Income (Loss). For additional information, see Note 14 “Financial instruments” in the Notes to the Consolidated Financial Statements.
Provisions
Provisions are estimated based on historical data, cost estimates provided by specialists and future projections. Changes in estimates or assumptions could cause changes to “Provisions” on the Consolidated Statements of Financial Position and a charge or credit to “Cost of goods and services sold” or “Selling, administrative and other expenses” in the Consolidated Statements of Net Earnings (Loss) and Comprehensive Income (Loss). For additional information, see Note 16 “Provisions” in the Notes to the Consolidated Financial Statements.
Leasing Arrangements
The Company has applied judgment in the classification of its leasing arrangements, which is determined at the inception of the lease and is based on the substance of the transaction, rather than its legal form. The Company’s leases were evaluated based on certain significant assumptions including the discount rate, economic life of a building, lease term and existence of a bargain renewal option.
Changes in estimates or assumptions could cause changes to “Property, plant and equipment”, “Principal payments on long-term obligations due within one year” and “Long-term obligations” on the Consolidated Statements of Financial Position and a charge or credit to “Selling, administrative and other expenses” and “Finance costs” in the Consolidated Statements of Net Earnings (Loss) and Comprehensive Income (Loss). For additional information, see Note 19 “Leasing arrangements” in the Notes to the Consolidated Financial Statements.

37
Taxes
In the ordinary course of business, the Company is subject to ongoing audits by tax authorities. While the Company believes that its tax filing positions are appropriate and supportable, certain matters are periodically challenged by tax authorities. The Company applies judgment and routinely evaluates and provides for potentially unfavourable outcomes with respect to any tax audits. If the result of a tax audit materially differs from the existing provisions, the Company’s effective tax rate and its net earnings (loss) will be affected positively or negatively.
Changes in estimates or assumptions could cause changes to “Income taxes recoverable”, “Deferred tax assets”, “Income and other taxes payable” and “Deferred tax liabilities” on the Consolidated Statements of Financial Position and a charge or credit to “Income tax expense (recovery)” in the Consolidated Statements of Net Earnings (Loss) and Comprehensive Income (Loss). For additional information, see Note 22 “Income taxes” in the Notes to the Consolidated Financial Statements.
b. Issued Standards Not Yet Adopted
The Company monitors the standard setting process for new standards and interpretations issued by the IASB that the Company may be required to adopt in the future. Since the impact of a proposed standard may change during the review period, the Company does not comment publicly until the standard has been finalized and the effects have been determined.
On December 16, 2011, the IASB issued amendments to three previously released standards. They are as follows:
IAS 32, Financial Instruments: Presentation (“IAS 32”)
The IASB amended IAS 32 to address inconsistencies in current practice in the application of offsetting criteria. The amendments provide clarification with respect to the meaning of ‘currently has a legally enforceable right of set-off’ and that some gross settlement systems may be considered equivalent to net settlement. These amendments are effective for annual periods beginning on or after January 1, 2014. The Company is currently assessing the impact of these amendments on the Company’s consolidated financial statements and related note disclosures.
IFRS 7, Financial Instruments: Disclosures (“IFRS 7”)
The IASB first amended IFRS 7 on October 7, 2010, to require additional disclosures regarding transfers of financial assets. These amendments are effective for annual periods beginning on or after July 1, 2011. The Company applied these amendments beginning the first quarter of its Fiscal 2012 year.
On December 16, 2011, the IASB approved amendments to IFRS 7, which establishes disclosure requirements to help users better assess the effect or potential effect of offsetting arrangements on a company’s financial position. These amendments are effective for annual periods beginning on or after January 1, 2013. The Company will apply these amendments beginning the first quarter of its Fiscal 2013 year and is currently assessing the impact on the Company’s disclosures.
IFRS 9, Financial Instruments (“IFRS 9”)
The IASB issued IFRS 9 on November 12, 2009, which will ultimately replace IAS 39, Financial Instruments: Recognition and Measurement (“IAS 39”). The replacement of IAS 39 is a three-phase project with the objective of improving and simplifying the reporting for financial instruments.
The first phase of the project provides guidance on the classification and measurement of financial assets. IFRS 9 was subsequently reissued on October 28, 2010, incorporating new requirements on accounting for financial liabilities. On December 16, 2011, the IASB amended the mandatory effective date of IFRS 9 to fiscal years beginning on or after January 1, 2015. The amendment also provides relief from the requirement to recast comparative financial statements for the effect of applying IFRS 9. The Company is monitoring the impact of amendments to this standard and is currently assessing the impact on the Company's disclosures.

38
On June 16, 2011, the IASB issued amendments to the following standard:
IAS 1, Presentation of Financial Statements (“IAS 1”)
The IASB has amended IAS 1 to require additional disclosures for items presented in OCI on a before-tax basis and requires items to be grouped and presented in OCI based on whether they are potentially reclassifiable to earnings or loss subsequently (i.e. items that may be reclassified and those that will not be reclassified to earnings or loss). These amendments are effective for annual periods beginning on or after July 1, 2012 and require full retrospective application. The Company will apply these amendments beginning the first quarter of its Fiscal 2013 year and is currently assessing the impact to its consolidated financial statements.
On May 12, 2011, the IASB issued four new standards, all of which are applicable to Annual Reporting periods beginning on or after January 1, 2013. The Company is currently assessing the impact of these standards on its consolidated financial statements and related note disclosures. The following is a list and description of these standards:
IAS 28, Investments in Associates and Joint Ventures (“IAS 28”)
IAS 28 (as amended in 2011) supersedes IAS 28 (2003), Investments in Associates and outlines how to apply, with certain limited exceptions, the equity method to investments in associates and joint ventures. The standard also defines an associate by reference to the concept of "significant influence", which requires power to participate in financial and operating policy decisions of an investee (but not joint control or control of those polices);
IFRS 10, Consolidated Financial Statements (“IFRS 10”)
IFRS 10 establishes the standards for the presentation and preparation of consolidated financial statements when an entity controls one or more entities;
IFRS 11, Joint Arrangements (“IFRS 11”)
IFRS 11 replaces IAS 31, Interests in Joint Ventures (“IAS 31”) and requires that a party in a joint arrangement assess its rights and obligations to determine the type of joint arrangement and account for those rights and obligations accordingly;
IFRS 12, Disclosure of Involvement with Other Entities (“IFRS 12”)
IFRS 12, along with IFRS 11 described above, replaces IAS 31. IFRS 12 requires the disclosure of information that enables users of financial statements to evaluate the nature of and the risks associated with, the entity’s interests in joint ventures and the impact of those interests on its financial position, financial performance and cash flows; and
IFRS 13, Fair Value Measurement (“IFRS 13”)
IFRS 13 provides guidance to improve consistency and comparability in fair value measurements and related disclosures through a ‘fair value hierarchy’. This standard applies when another IFRS requires or permits fair value measurements or disclosures. IFRS 13 does not apply for share-based payment transactions, leasing transactions and measurements that are similar to, but are not fair value.
c. Early adoption of IAS 19 (Revised) – Employee Benefits (“IAS 19”)
The Company has elected to early adopt IAS 19 (Revised) in the first quarter of 2012. On June 16, 2011, the IASB issued amendments to IAS 19 which included the elimination of the “corridor approach,” which is the option to defer and amortize the recognition of actuarial gains and losses. The significant amendments to IAS 19 are as follows:
• The “corridor approach” is to be replaced with full and immediate recognition of actuarial gain and loss remeasurements in “Other comprehensive (loss) income” (“OCI”);
• Retirement benefit costs are to consist of service costs, net interest and remeasurements, with remeasurements being recorded in OCI;
• Past service costs are to be recognized immediately in the Consolidated Statements of Net Earnings (Loss);

39
• Expected returns on plan assets will no longer be recognized in profit or loss. Instead, interest income on plan assets, calculated using the discount rate used to measure the pension obligation, will be recognized in the Consolidated Statements of Net Earnings (Loss),
• Plan administration costs are to be expensed as incurred; and• Disclosures relating to retirement benefit plans will be enhanced and will include discussions on risk associated
with each plan, an explanation of items recognized in the consolidated financial statements and descriptions of the amount, timing and uncertainty on the Company’s future cash flows.
The amendments to IAS 19 are effective for annual periods beginning on or after January 1, 2013 with early adoption permitted. The amendments are required to be applied retrospectively in accordance with IAS 8, Accounting Policies, Changes in Accounting Estimates and Errors. As discussed above, the Company has elected to early adopt the amendments to IAS 19, and as such, the Company has retrospectively adjusted the assets and liabilities for the 52-week periods ending January 28, 2012, January 29, 2011 and January 31, 2010 and income and expenses and cash flows for the 52-week periods ended January 28, 2012 and January 29, 2011.
Impact on financial statement captions
A summary of the impact arising from the application of the change in accounting policy is as follows:
Consolidated Statements of Financial Position
(Increase (decrease) in CAD millions)As at
January 28, 2012
Retirement benefit asset $ (187.7)Retirement benefit liability 308.2
Net change to retirement benefit asset and liability (495.9)Deferred tax assets 84.0Deferred tax liabilities (43.6)
Net change to deferred tax assets and liabilities 127.6Accumulated other comprehensive loss (141.7)Retained earnings (226.6)
Consolidated Statements of Net Earnings (Loss) and Comprehensive Income (Loss)
(Increase (decrease) in CAD millions, except per share amounts)
53-WeekPeriod Ended
February 2, 2013
Selling, administrative and other expenses $ (24.4)Earnings before income taxes 24.4Deferred income tax expense 6.4Net earnings 18.0Basic net earnings per share 0.17Diluted net earnings per share 0.17Other comprehensive income 1.3Total comprehensive income 19.3
Consolidated Statements of Cash Flows
(Increase (decrease) in CAD millions)
53-WeekPeriod Ended
February 2, 2013
Net earnings $ 18.0Retirement benefit plans expense (24.4)Income tax expense 6.4
Please refer to Note 20 "Retirement benefit plans" in the Notes to the Consolidated Financial Statements for the prior year comparative figures.

40
10. Disclosure Controls and Procedures
Disclosure Controls and Procedures
Management of the Company is responsible for establishing and maintaining a system of disclosure controls and procedures (“DC&P”) that are designed to provide reasonable assurance that information required to be disclosed by the Company in its public disclosure documents, including its Annual and Interim MD&A, Annual and Interim Financial Statements, and Annual Information Form is recorded, processed, summarized and reported within required time periods and includes controls and procedures designed to ensure that the information required to be disclosed by the Company in its public disclosure documents is accumulated and communicated to the Company’s management, including the Chief Executive Officer (“CEO”) and Interim Chief Financial Officer ("Interim CFO"), to allow timely decisions regarding required DC&P.
Management of the Company, including the CEO and Interim CFO, has caused to be evaluated under their supervision, the Company’s DC&P, and has concluded that the Company’s DC&P was effective for the year ended February 2, 2013.
Internal Control over Financial Reporting
Management of the Company is also responsible for establishing and maintaining adequate internal control over financial reporting to provide reasonable assurance regarding the reliability of financial reporting and the preparation of financial statements for external purposes in accordance with IFRS.
Internal control systems, regardless of superiority in design, have inherent limitations. Therefore, even those systems that have been determined to have been designed effectively can only provide reasonable assurance with respect to financial reporting and financial statement preparation.
Management of the Company has evaluated whether there were changes in the internal control over financial reporting during Fiscal 2012 that have materially affected, or are reasonably likely to materially affect, the Company’s internal control over financial reporting and has determined that no material changes occurred during this period.
11. Risks and Uncertainties
Risks Relating to Our Business
If the Company is unable to compete effectively in the highly competitive retail industry, the Company's business and results of operations could be materially adversely affected. The Canadian retail market remains highly competitive as key players and new entrants compete for market share. International retailers continue to expand into Canada while existing competitors enhance their product offerings and become direct competitors. The Company's competitors include traditional full-line department stores, discount department stores, wholesale clubs, ''big-box'' retailers, internet retailers and specialty stores offering alternative retail formats. Failure to develop and implement appropriate competitive strategies and the performance of Sears competitors could have a material adverse effect on the Company's business, results of operations and financial condition.
To stay competitive and relevant to Sears customers, significant initiatives in support of the Company's strategic plan are underway for Fiscal 2012. These initiatives include improvements in business processes, advancements in information technology and other organizational changes. The achievement of strategic goals may be adversely affected by a wide range of factors, many of which are beyond the Company's control. The inability to execute and integrate strategic plans could have a negative impact on the Company's current operations, market reputation, customer satisfaction and financial position. The Company's potential to implement and achieve Sears long-term strategic objectives is dependent on the achievement of these strategic plans and initiatives. There can be no assurance that such plans and initiatives will yield the expected results, either of which could cause the Company to fall short in achieving financial objectives and long-range goals.
Additional risk may arise when foreign retailers carrying on business in Canada in competition with Sears engage in marketing activities which are not in full compliance with Canadian legal requirements regarding advertising and labeling rules and product quality standards. Such retailers may gain an unfair advantage and their activities may negatively affect the Company's business and results of operations.
41
The majority of the performance payments earned pursuant to the credit card marketing and servicing alliance with JPMorgan Chase are related to customers' purchases using the Sears Card and Sears MasterCard. The credit card industry is highly competitive as credit card issuers continue to expand their product offerings to distinguish their cards. As competition increases, there is a risk that a reduction in the percentage of purchases charged to the Sears Card and Sears MasterCard may negatively impact the Company's results of operations and financial condition.
Due to the seasonality of the Company's business, the Company's results of operations would be adversely affected if Sears business performed poorly in the fourth quarter or as a result of unseasonable weather patterns.The Company's operations are seasonal in nature with respect to results of operations and in products and services offered. Merchandise and service revenues, as well as performance payments received from JPMorgan Chase, vary by quarter based upon consumer spending behavior. Historically, the Company's revenues and earnings have been higher in the fourth quarter due to the holiday season and we have reported a disproportionate level of earnings in that quarter. As a result, the fourth quarter results of operations significantly impacts the Company's annual results of operations. The Company's fourth quarter results of operations may fluctuate significantly, based on many factors, including holiday spending patterns and weather conditions. In addition, the Company offers many seasonal goods and services. The Company establishes budgeted inventory levels and promotional activity in accordance with its strategic initiatives and expected consumer demand. Businesses that generate revenue from the sale of seasonal merchandise and services are subject to the risk of changes in consumer spending behavior as a result of unseasonable weather patterns.
If the Company fails to offer merchandise and services that Sears customers want, Sears sales may be limited, which would reduce the Company's revenues and profits and adversely impact Sears results of operations.To be successful, the Company must identify, obtain supplies and offer to customers attractive, relevant and high-quality merchandise and services on a continuous basis. Customers' preferences may change over time. If we misjudge either the demand for products and services Sears sells or the Company's customers' purchasing habits and tastes, the Company may be faced with excess inventories of some products and missed opportunities for products and services Sears chose not to offer. This could have a negative effect on the Company's revenues and profits and adversely impact Sears results of operations.
The Company's failure to retain Sears senior management team and to continue to attract qualified new personnel could adversely affect the Company's business and results of operations.The Company's success is dependent on its ability to attract, motivate and retain senior leaders and other key personnel. The loss of one or more of the members of the Company's senior management may disrupt Sears business and adversely affect Sears results of operations. Furthermore, the Company may not be successful in attracting, assimilating and retaining new personnel to grow Sears business profitably. The inability to attract and retain key personnel could have an adverse effect on the Company's business.
If the Company does not successfully manage its inventory levels, the Company's results of operations will be adversely affected.
The Company must maintain sufficient in-stock inventory levels to operate the business successfully while minimizing out- of-stock levels. A significant portion of inventory is sourced from vendors requiring advance notice periods in order to supply the quantities that we require. These lead times may adversely impact the Company's ability to respond to changing consumer preferences, resulting in inventory levels that are insufficient to meet demand or in merchandise that may have to be sold at lower prices. Inappropriate inventory levels or a failure to accurately anticipate the future demand for a particular product or the time it will take to obtain new inventory may negatively impact the Company's results of operations.
The Company relies extensively on computer systems to process transactions, summarize results and manage its business. Disruptions in these systems could harm the Company's ability to run its business.Given the number of individual transactions that the Company processes each year, it is critical that the Company maintain uninterrupted operation of its computer and communications hardware and software systems. These systems are subject to obsolescence, damage or interruption from power outages, computer and telecommunications failures, computer viruses, security breaches, catastrophic events such as fires, natural disasters and adverse weather occurrences and usage errors by the Company's employees. If the systems are damaged or cease to function properly, the Company may have to make a significant investment to fix or replace them, may suffer interruptions in operations in the interim and the Company's reputation with its customers may be harmed.

42
The Company's ability to maintain sufficient inventory levels in its stores is critical to the Company's success and largely depends upon the efficient and uninterrupted operation of its computer and communications hardware and software systems. Any material interruption in the Company's computer operations may have a material adverse effect on the Company's business and results of operations.
The Company relies on foreign sources for significant amounts of its merchandise, and the Company's business may therefore be negatively affected by the risks associated with international trade.The Company is dependent upon a significant amount of products that originate from non-Canadian markets. In particular, the Company sources a significant amount of products from China. The Company is subject to the risks that are associated with the sourcing and delivery of this merchandise, including: potential economic, social and political instability in jurisdictions where suppliers are located; increased shipping costs, potential transportation delays and interruptions; adverse foreign currency fluctuations, changes in international laws, rules and regulations pertaining to the importation of products and quotas; and the imposition and collection of taxes and duties. Any increase in cost to the Company of merchandise purchased from foreign vendors or restriction on the merchandise made available to the Company by such vendors could have an adverse effect on the Company's business and results of operations.
Damage to the reputations of the brands the Company sells could reduce the Company's revenues and profits and adversely impact the Company's results of operations.As a diverse and multi-channel retailer, the Company promotes many brands as part of the Company's normal course of business. These brands include the Sears brand, Sears private label brands for product lines such as Jessica, and non-proprietary brands exclusive to Sears. Damage to the reputation of these brands or the reputation of the suppliers of these brands could negatively impact consumer opinions of the Company or its related products and reduce its revenues and profits and adversely impact its results of operations. In those circumstances, it may be difficult and costly for Sears to regain customer confidence.
If the Company's relationships with its significant suppliers were to be impaired, it could have a negative impact on the Company's competitive position and its results of operations and financial condition.Although the Company's business is not substantially dependent on any one supplier, the Company's relationship with certain suppliers is of significance to its merchandising strategy, including attracting customers to its locations, cross-segment sales and image. The loss of a significant supplier relationship could result in lower revenues and decreased customer interest in Sears stores, which, in turn, would adversely affect Sears results of operations and financial condition. In addition, Sears may not be able to develop relationships with new suppliers, and products from alternative sources, if any, may be of a lesser quality and more expensive than those Sears currently purchases.
The lack of willingness of the Company's vendors to provide acceptable payment terms could negatively impact Sears liquidity and/or reduce the availability of products or services that Sears seeks to procure.
The Company depends on its vendors to provide it with financing for the Company's purchases of inventory and services. Sears vendors could seek to limit the availability of vendor credit to Sears or other terms under which they sell to Sears, or both, which could negatively impact the Company's liquidity. In addition, the inability of the Company's vendors to access liquidity, or the insolvency of the Company's vendors, could lead to their failure to deliver inventory or other services to Sears. Certain of the Company's vendors may finance their operations and/or reduce the risk associated with collecting accounts receivable from Sears by selling or “factoring” the receivables or by purchasing credit insurance or other forms of protection from loss associated with Sears credit risks. The ability of Sears vendors to do so is subject to the Company's perceived credit quality. The Company's vendors could be limited in their ability to factor receivables or obtain credit protection in the future because of sears perceived financial position and credit worthiness, which could reduce the availability of products or services the Company seeks to procure.
The Company may be subject to product liability claims if people or properties are harmed by the products the Company sells or the services it offers.The Company sells products produced by third party manufacturers. Some of these products may expose the Company to product liability claims relating to personal injury, death or property damage caused by such products and may require the Company to take actions, such as product recalls. In addition, the Company also provides various services which could give rise to such claims. Although Sears maintains liability insurance to mitigate these potential claims, Sears cannot be certain that its coverage will be adequate for liabilities actually incurred or that insurance will continue to be available on economically reasonable terms or at all.

43
Product liability claims can be expensive to defend and can divert the attention of management and other personnel for significant periods, regardless of the ultimate outcome. Claims of this nature, as well as product recalls, could also have a negative impact on customer confidence in the products and services Sears offers and on the Company's reputation, and adversely affect the Company's business and its results of operations.
If the Company does not maintain the security of its customers, associates or Company information, the Company could damage its reputation, incur substantial additional costs and become subject to litigation.Any significant security compromise or breach of customer, associate or Company data, either held or maintained by the Company or its third party providers, could significantly damage the Company's reputation and brands and result in additional costs, lost sales, fines and/or lawsuits. The regulatory environment in Canada related to information security and privacy is very rigorous. There is no guarantee that the procedures that we have implemented to protect against unauthorized access to secured data are adequate to safeguard against all data security breaches. A data security breach could negatively impact the Company's business and its results of operations.
The performance of the Company's real estate joint ventures may be affected by events outside of the Company's control.The primary objective of the Company's real estate joint venture operations is to maximize the returns on its investments in shopping center real estate. Sears reviews the performance of these joint ventures on a regular basis. Shopping center investments are non-core assets that Sears sells when Sears believes it is financially advantageous to do so. Similarly, the Company may also develop excess land within these real estate holdings and shopping center joint venture investments when it is advantageous to do so. The return on such transactions is contingent on the state of the economic environment and other factors. In addition, the credit worthiness and financial stability of tenants and partners could negatively impact the Company's results of operations.
The Company is subject to a number of long-term real estate leases which could restrict the Company's ability to respond to changes in demographics or the retail environment and adversely affect the Company's results of operations.As of February 2, 2013, the Company operated a total of 118 Full-line Department stores, 357 specialty stores (including 48 Sears Home stores, 11 Outlet stores, four Appliances and Mattresses stores, 261 Hometown Dealer stores operated under independent local ownership and 33 Corbeil stores), 1,512 catalogue merchandise pick-up locations and 101 Sears Travel offices. Company owned stores consist of 14 Full-line Department stores and two Sears Home stores, with the majority of the remainder held under long-term leases. While the Company is able to change its merchandise mix and relocate stores in order to maintain competitiveness, the Company is restricted from vacating a current site without breaching its contractual obligations and incurring lease-related expenses for the remaining portion of the lease-term. The long-term nature of the leases may limit the Company's ability to respond in a timely manner to changes in the demographic or retail environment at any location, which could adversely affect the Company's results of operations. In addition, when leases for the stores in the Company's ongoing operations expire, the Company may be unable to negotiate renewals, either on commercially acceptable terms, or at all, which could cause us to close stores. Accordingly, the Company is subject to the risks associated with leasing real estate, which could have an adverse effect on the Company's results of operations.
The Company may be subject to legal proceedings if the Company violates the operating covenants in its real estate leases that could adversely affect the Company's business and results of operations.As of February 2, 2013, the Company had operating covenants with landlords for approximately 100 Sears brand corporate stores. An operating covenant generally requires the Company, during normal operating hours, to operate a store continuously as per the identified format in the lease agreement. As of February 2, 2013, the remaining term of the various Sears operating covenants ranged from less than one year to 25 years, with an average remaining term of approximately seven years. Failure to observe operating covenants may result in legal proceedings against the Company and adversely affect the Company's business and results of operations.
The Company is subject to laws and regulations that impact its business and a failure to comply with such laws and regulations could lead to lawsuits or regulatory actions against the Company that could adversely affect the Company's business and results of operations.Laws and regulations are in place to protect the interests and well-being of the Company's customers and communities, business partners, suppliers, employees, shareholders and creditors. Changes to statutes, laws, regulations or regulatory policies, including changes in the interpretation, implementation or enforcement of statutes, laws, regulations and regulatory policies, could adversely affect the Company's business and results of operations. In addition, Sears may incur significant costs in the course of complying with any changes to applicable statutes, laws, regulations and regulatory policies.

44
The Company's failure to comply with applicable statutes, laws, regulations or regulatory policies could result in a judicial or regulatory judgment or sanctions and financial penalties that could adversely impact the Company's reputation, business and results of operations. Although the Company believes that it has taken reasonable measures designed to ensure compliance with governing statutes, laws, regulations and regulatory policies in the jurisdictions in which it conducts business, there is no assurance that the Company will always be in compliance or deemed to be in compliance.
The Company is required to comply with federal and provincial environmental laws and regulations, the cost of which may adversely affect the Company's results of operations and financial condition.The Company is exposed to environmental risk as an owner, lessor and lessee of property. Under federal and provincial laws, the owner, lessor or lessee could be liable for the costs of removal and remediation of certain hazardous substances on its properties or disposed of at other locations. The failure to remove or remediate such substances, if any, could lead to claims against the Company.
The Company is currently remediating various locations across Canada where it operated auto centers, gas bars and a logistics facility. The extent of the remediation and the costs thereof have not yet been determined. Sears continues to monitor the costs of remediation and appropriately provide for these costs in its reserves. If we commit to renovating a leased or owned building that contains or may contain asbestos, or if asbestos is inadvertently disturbed, we will be legally obligated to comply with asbestos removal standards. The extent of this liability has not yet been determined because the costs to remove asbestos depend upon factors including, among others, the location and extent of any renovations undertaken. Inadvertent disturbance of asbestos cannot be foreseen. The costs incurred by Sears could be significant and may negatively impact the Company's results of operations and financial condition.
The Company is exposed to a variety of legal proceedings, including class action lawsuits, and tax audits which, if adversely decided, could materially adversely affect the Company.The Company is currently involved in various legal proceedings incidental to the normal course of business. Although the Company is of the view that the final disposition of any such litigation is not expected to have a material adverse effect on its liquidity, consolidated financial position or results of operations, the outcome of such litigation cannot be predicted with certainty.
In the ordinary course of business, the Company is subject to ongoing audits by tax authorities. While we believe that the Company's tax filing positions are appropriate and supportable, periodically, certain matters are reviewed and from time to time and challenged by the tax authorities. As the Company routinely evaluates and provides for potentially unfavorable outcomes with respect to any tax audits, it believes that the final disposition of tax audits will not have a material adverse effect on its liquidity, consolidated financial position or results of operations. If the result of a tax audit materially differs from the existing provisions, the Company's effective tax rate and net earnings could be affected positively or negatively in the period in which the tax audits are completed.
Events outside the Company's control such as social or political unrest, natural disasters, extreme or unseasonable weather, acts of war or terrorism, systems breakdowns or power outages could have a material adverse effect on the Company's business and results of operations.The Company's business is sensitive to customers' spending patterns, which may be affected by domestic and international social or political unrest, natural disasters, extreme or unseasonable weather, acts of war or terrorism, or other significant events outside of the Company's control, any of which could lead to a decrease in spending by consumers. In addition, such events as well as systems breakdowns and power outages could cause store closures, disrupt supply chain or other operations, delay shipments of merchandise to consumers, reduce revenue and result in expenses to repair or replace facilities. Disruptions during a peak season such as the month of December, which may account for up to 40% of a year's earnings, could have a particularly adverse effect on the Company's business and results of operations.
The Company's business could suffer if it is unsuccessful in making, integrating, and maintaining acquisitions and investments. From time to time we pursue strategic acquisitions of, joint ventures with, or investments in, other companies or businesses, although the Company has no present commitments with respect to any material acquisitions or investments. Any such acquisition, joint venture or investment that the Company makes may require Sears to spend its cash, or incur debt, contingent liabilities, or amortization expenses related to intangible assets, any of which could reduce the Company's profitability and harm its business.

45
Acquisitions, joint ventures and investments also increase the complexity of the Company's business and place strain on its management, personnel, operations, supply chain, financial resources, and internal financial controls and reporting functions. The Company may not be able to manage acquisitions, joint ventures or investments effectively, which could damage the Company's reputation, limit its growth and adversely affect its business and results of operations.
Financial Risks
The Company's business has been and will continue to be affected by Canadian and worldwide economic conditions; a persistence or worsening of current economic conditions could lead to reduced revenues and gross margins, and negatively impact the Company's liquidity.The Company plans its operations giving regard to economic and financial variables that are beyond its control. Changes to these variables may adversely impact the Company's performance. Should the current economic conditions persist or worsen, heightened competition, a further decline in consumer confidence, lower disposable income, higher unemployment and personal debt levels may result, which could lead to reduced demand for the Company's products and services. Any of these events could cause the Company to increase inventory markdowns and promotional expenses, thereby reducing the Company's gross margins and results of operations. The Company's results of operations have been negatively impacted as a result of the current economic conditions and the volatility in the Canadian and global economies and it is difficult to accurately assess the potential impact on the Company's business. If the Canadian or global economies continue to worsen, however, the Company could experience a decline in same store sales, erosion of gross profit and profitability.
Increasing fuel and energy costs may have a significant negative impact on the Company's operations. The Company requires significant quantities of fuel for the vehicles used to distribute and deliver inventory and the Company is exposed to the risk associated with variations in the market price for petroleum products. The Company could experience a disruption in energy supplies, including its supply of gasoline, as a result of factors that are beyond the Company's control, which could have an adverse effect on the Company's business. Certain of the Company's vendors also are experiencing increases in the cost of various raw materials, such as cotton, oil- related materials, steel and rubber, which could result in increases in the prices that the Company pays for merchandise, particularly apparel, appliances and tires and adversely affect the Company's results of operations.
Liquidity Risk
The Company could face liquidity risk due to various factors, including but not limited to, the unpredictability of the current economic climate, failure to secure appropriate funding vehicles and cash flow issues relating to the operation and management of the business. Failure to fulfill financial obligations due and owing from the Company as a result of this liquidity risk could have undesirable consequences on Sears.
Fluctuations in U.S. and Canadian dollar exchange rates may affect the Company's results of operations.The Company's foreign exchange risk is currently limited to currency fluctuations between the Canadian and U.S. dollar. The Company is vulnerable to increases in the value of the U.S. dollar relative to the Canadian dollar because the majority of its revenues are denominated in Canadian dollars and a substantial amount of the merchandise the Company purchases is priced in U.S. dollars. The costs of these goods in Canadian dollars rise when the U.S. dollar increases in value relative to the Canadian dollar and, as a result, the Company may be forced to increase its prices or reduce its gross margins. We may use foreign currency forward and option contracts to hedge the exchange rate risk on a portion of the Company's expected requirement for U.S. dollars. There can be no assurance that the Company's hedging efforts will achieve their intended results or that the Company's estimate of its requirement for U.S. dollars will be accurate, with the result that currency fluctuations may have an adverse impact on the Company's results of operations.
In addition, the appreciation of the Canadian dollar over the past few years relative to the U.S. dollar presents an additional challenge to the Company as its customers are motivated to cross-border shop, which may have an adverse impact on the Company's results of operations.
The Company is exposed to counterparty credit risk which could adversely affect its results of operations.Credit risk refers to the possibility that the Company can suffer financial losses due to the failure of counterparties to meet their payment obligations to the Company. Exposure to credit risk exists for derivative instruments, cash and cash equivalents, short- term investments, accounts receivable and investments included in other long-term assets. Cash and cash equivalents, accounts receivable, derivative financial assets, and other long-term assets of $314.5 million as at February 2, 2013 (January 28, 2012: $514.9 million) expose the Company to credit risk should the borrower default on maturity of the investment.
46
Although the Company seeks to manage this exposure through policies that require borrowers to have a minimum credit rating of A, and limiting investments with individual borrowers at maximum levels based on credit rating, there can be no assurance that the Company will be able to successfully manage its credit risk.
The Company invests its surplus cash in investment grade, short-term money market instruments, the return on which depends upon interest rates and the credit worthiness of the issuer. The Company attempts to mitigate credit risk resulting from the possibility that an issuer may default on repayment by requiring that issuers have a minimum credit rating and limiting exposures to individual borrowers.
The Company is exposed to interest rate risk which could adversely affect its results of operations.Interest rate risk reflects the sensitivity of the Company's financial condition to movements in interest rates. Financial assets and liabilities which do not bear interest or bear interest at fixed rates are classified as non-interest rate sensitive. Cash and cash equivalents and borrowings under the Company's $800.0 million senior secured revolving credit facility, or the Credit Facility, are subject to interest rate risk. The total outstanding balance subject to interest rate risk as at February 2, 2013 was a net asset of $238.3 million (January 28, 2012: $297.7 million). An increase or decrease in interest rate of 0.25% would cause an immaterial after-tax impact on net earnings (loss).
Expenses associated with the Company's retirement benefit plans may fluctuate significantly depending on changes in actuarial assumptions, future market performance of plan assets, and other events outside of the Company's control and adversely affect the Company's results of operations.The Company currently maintains a defined benefit registered pension plan, a non-registered supplemental savings arrangement and a defined benefit non-pension post-retirement plan, which provides life insurance, medical and dental benefits to eligible retired associates through a health and welfare trust. The defined benefit plan continues to accrue benefits related to future compensation increases although no further service credit is earned. In addition, the Company no longer provides medical, dental and life insurance benefits at retirement for associates who had not achieved the eligibility criteria for these non- pension post-retirement benefits as at December 31, 2008.
There is no assurance that the Company's retirement benefit plans will be able to earn the assumed rate of return. New regulations and market driven changes may result in changes in the discount rates and other variables which would result in the Company being required to make contributions in the future that differ significantly from the estimates.
Management is required to use assumptions to account for the plans in conformity with IFRS. However, actual future experience will differ from these assumptions giving rise to actuarial gains or losses. In any year, actual experience differing from the assumptions may be material. Plan assets consist primarily of cash, alternative investments, marketable equity and fixed income securities. The value of the marketable equity and fixed income investments will fluctuate due to changes in market prices. Plan obligations and annual pension expense are determined by independent actuaries and through the use of a number of assumptions.
Although the Company believes that the assumptions used in the actuarial valuation process are reasonable, there remains a degree of risk and uncertainty which may cause results to differ materially from expectations. Significant assumptions in measuring the benefit obligations and pension plan costs include the discount rate and the rate of compensation increase. See Note 20.4 “Pension assumptions” of the Notes to the 2012 Annual Consolidated Financial Statements for more information on the weighted-average actuarial assumptions for the plans.
The Company faces risks associated with impairment of goodwill and other assets.The Company's goodwill, intangible assets and long-lived assets, primarily consisting of stores and joint ventures, are subject to periodic testing for impairment. A significant amount of judgment is involved in the periodic testing. Failure to achieve sufficient levels of cash flow within each of the Company's cash generating units or specific operating units could result in impairment charges for goodwill and intangible assets or fixed asset impairment for long-lived assets, which could have a material adverse effect on the Company's reported results of operations.
47
Risks Relating to the Company's Relationship with Sears Holdings
The Company may lose rights to some intellectual property if Sears Holdings' equity ownership in the Company falls below specified thresholds.The Company relies on its right to use the “Sears” name, including as part of the Company's corporate and commercial name, which the Company considers a significant and valuable aspect of its business. The Company's right to use the “Sears” name and certain other brand names was granted pursuant to a license agreement with Sears Holdings.
The Company's license to use the “Sears” name and certain brand names may be terminated if Sears Holdings' indirect ownership interest in the Company is reduced to less than 25%. In addition, the Company's license to use the “Sears” name may also terminate upon the occurrence of certain bankruptcy events. Losing the Company's right to use these intellectual properties could significantly diminish the Company's competitiveness and could materially harm its business. If the license agreement is terminated, the Company would attempt to renegotiate the license agreement although the terms of any renegotiated license agreement would likely be less favorable to the Company.
Some of the Company's directors and executive officers may have conflicts of interest because of their ownership of Sears Holdings common stock and positions with Sears Holdings. Some of our directors and executive officers own Sears Holdings common stock. In addition, one of our directors, William R. Harker, is a consultant to Sears Holdings. Ownership of Sears Holdings common stock by our directors and officers and the presence of persons associated with Sears Holdings on the Company's board of directors could create, or appear to create, conflicts of interest with respect to matters involving both the Company and Sears Holdings.
Risks Relating to Our Common Shares
As long as Sears Holdings or ESL Investments, Inc. (“ESL”) controls the Company, a shareholder's ability to influence matters requiring shareholder approval will be limited. Sears Holdings controls approximately 51% of the Company's voting power and ESL directly controls approximately 28% of the Company's voting power. As of the date of this MD&A, ESL controlled Sears Holdings and, therefore, ESL directly or indirectly controls approximately 79% of the Company's voting power. So long as ESL directly or indirectly controls a majority of the Company's outstanding common shares, ESL will have the ability to control the election of the board of directors and the outcome of certain shareholder votes.
Accordingly, Sears Holdings and ESL will continue to have the ability to exercise control over certain actions to be taken or approved by the Company's directors and shareholders, including with respect to certain mergers or business combinations or dispositions of all or substantially all of the Company's assets. Sears Holdings and ESL's voting control may discourage transactions involving a change of control of the Company, including transactions in which a shareholder might otherwise receive a premium for his/her shares over the then-current market price. Subject to certain limits, Sears Holdings is also not prohibited from selling a controlling interest in the Company to a third party and may do so without shareholder approval and, subject to applicable laws, without providing for a purchase of a shareholder's common shares. Sears Holdings and ESL's interests may be different than a shareholder's interests and Sears Holdings and ESL may have investments in other companies that may compete with the Company, and may have interests from time to time that diverge from the interests of shareholders, particularly with regard to new investment opportunities.
In addition, conflicts of interest may arise between Sears Holdings and/or ESL and the Company, including corporate opportunities, potential acquisitions or transactions, as well as other matters. The Company may be adversely affected by any conflicts of interest between Sears Holdings and/or ESL and the Company.
Furthermore, neither Sears Holdings nor ESL owes the Company or the Company's shareholders any fiduciary duties under Canadian law.
48
MANAGEMENT'S RESPONSIBILITY FOR FINANCIAL STATEMENTS
The preparation and presentation of the Company's consolidated financial statements and the overall accuracy and integrity of the Company's financial reporting are the responsibility of management. The accompanying consolidated financial statements have been prepared in accordance with International Financial Reporting Standards as issued by the International Accounting Standards Board (IASB), and include certain amounts that are based on management's best estimates and judgments. Financial information contained elsewhere in this Annual Report is consistent with the information set out in the consolidated financial statements.
In fulfilling its responsibilities, management has developed and maintains an extensive system of disclosure controls and procedures and internal control over financial reporting processes that are designed to provide reasonable assurance that assets are safeguarded, transactions are properly recorded and reported within the required time periods, and financial records are reliable for the preparation of the financial statements. The Company's internal auditors, who are employees of the Company, also review and evaluate internal controls on behalf of management.
The Board of Directors monitors management's fulfillment of its responsibilities for financial reporting and internal controls principally through the Audit Committee. The Audit Committee, which is comprised solely of independent directors, meets regularly with management, the internal audit department and the Company's external auditors to review and discuss audit activity and results, internal accounting controls and financial reporting matters. The external auditors and the internal audit department have unrestricted access to the Audit Committee, management and the Company's records. The Audit Committee is also responsible for recommending to the Board of Directors the proposed nomination of the external auditors for appointment by the shareholders. Based upon the review and recommendation of the Audit Committee, the consolidated financial statements and Management's Discussion and Analysis have been approved by the Board of Directors.
The Company's external auditors, Deloitte LLP, have audited the consolidated financial statements in accordance with International Financial Reporting Standards as issued by the IASB.
Calvin McDonaldPresident and Chief Executive Officer
E.J. BirdInterim Chief Financial Officer
Toronto, OntarioMarch 14, 2013

49
Report of Independent Registered Chartered Accountants
To the Shareholders and Board of Directors ofSears Canada Inc.
We have audited the accompanying consolidated financial statements of Sears Canada Inc. and subsidiaries, which comprise the consolidated statements of financial position as at February 2, 2013 and January 28, 2012 and the consolidated statements of net earnings (loss) and comprehensive income (loss), consolidated statements of changes in shareholders’ equity and consolidated statements of cash flows for the 53 and 52-week periods ended February 2, 2013 and January 28, 2012, and a summary of significant accounting policies and other explanatory information.
Management’s Responsibility for the Consolidated Financial Statements
Management is responsible for the preparation and fair presentation of these consolidated financial statements in accordance with International Financial Reporting Standards as issued by the International Accounting Standards Board, and for such internal control as management determines is necessary to enable the preparation of consolidated financial statements that are free from material misstatement, whether due to fraud or error.
Auditor’s Responsibility
Our responsibility is to express an opinion on these consolidated financial statements based on our audits. We conducted our audits in accordance with Canadian generally accepted auditing standards and the standards of the Public Company Accounting Oversight Board (United States). Those standards require that we comply with ethical requirements and plan and perform the audit to obtain reasonable assurance about whether the consolidated financial statements are free from material misstatement.
An audit involves performing procedures to obtain audit evidence about the amounts and disclosures in the consolidated financial statements. The procedures selected depend on the auditor’s judgment, including the assessment of the risks of material misstatement of the consolidated financial statements, whether due to fraud or error. In making those risk assessments, the auditor considers internal control relevant to the entity’s preparation and fair presentation of the consolidated financial statements in order to design audit procedures that are appropriate in the circumstances, but not for the purpose of expressing an opinion on the effectiveness of the entity’s internal control. An audit also includes evaluating the appropriateness of accounting policies used and the reasonableness of accounting estimates made by management, as well as evaluating the overall presentation of the consolidated financial statements.
We believe that the audit evidence we have obtained in our audits is sufficient and appropriate to provide a basis for our audit opinion.
Opinion
In our opinion, the consolidated financial statements present fairly, in all material respects, the financial position of Sears Canada Inc. and subsidiaries as at February 2, 2013 and January 28, 2012 and their financial performance and cash flows for the 53 and 52-week periods ended February 2, 2013 and January 28, 2012 in accordance with International Financial Reporting Standards as issued by the International Accounting Standards Board.
Independent Registered Chartered AccountantsLicensed Public AccountantsMarch 14, 2013Toronto, Canada
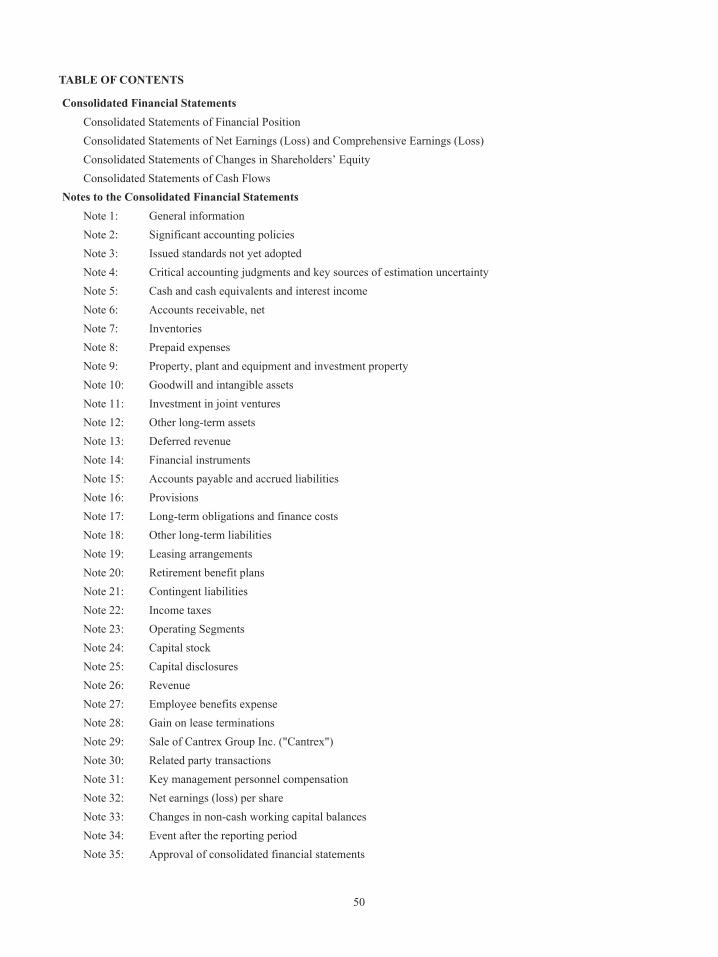
50
TABLE OF CONTENTS
Consolidated Financial Statements Consolidated Statements of Financial PositionConsolidated Statements of Net Earnings (Loss) and Comprehensive Earnings (Loss) Consolidated Statements of Changes in Shareholders’ EquityConsolidated Statements of Cash Flows
Notes to the Consolidated Financial StatementsNote 1: General informationNote 2: Significant accounting policiesNote 3: Issued standards not yet adoptedNote 4: Critical accounting judgments and key sources of estimation uncertaintyNote 5: Cash and cash equivalents and interest incomeNote 6: Accounts receivable, netNote 7: InventoriesNote 8: Prepaid expensesNote 9: Property, plant and equipment and investment propertyNote 10: Goodwill and intangible assetsNote 11: Investment in joint venturesNote 12: Other long-term assetsNote 13: Deferred revenueNote 14: Financial instrumentsNote 15: Accounts payable and accrued liabilitiesNote 16: ProvisionsNote 17: Long-term obligations and finance costsNote 18: Other long-term liabilitiesNote 19: Leasing arrangementsNote 20: Retirement benefit plansNote 21: Contingent liabilitiesNote 22: Income taxesNote 23: Operating SegmentsNote 24: Capital stockNote 25: Capital disclosuresNote 26: RevenueNote 27: Employee benefits expenseNote 28: Gain on lease terminationsNote 29: Sale of Cantrex Group Inc. ("Cantrex")Note 30: Related party transactionsNote 31: Key management personnel compensationNote 32: Net earnings (loss) per shareNote 33: Changes in non-cash working capital balancesNote 34: Event after the reporting periodNote 35: Approval of consolidated financial statements

51
CONSOLIDATED STATEMENTS OF FINANCIAL POSITION
(in CAD millions) NotesAs at
February 2, 2013As at
January 28, 2012
ASSETSCurrent assetsCash and cash equivalents 5 $ 237.0 $ 397.4Accounts receivable, net 6,14 76.2 116.2Income taxes recoverable 22 5.5 4.1Inventories 7 851.4 823.9Prepaid expenses 8 30.1 27.9
Total current assets 1,200.2 1,369.5
Non-current assetsProperty, plant and equipment 9,19 840.0 872.0Investment property 9 21.7 21.7Intangible assets 10.2 27.2 23.6Goodwill 10.1 8.7 8.7Investment in joint ventures 11 263.4 301.4Deferred tax assets 22 83.8 84.6Other long-term assets 12,14,16,22 34.1 49.2
Total assets $ 2,479.1 $ 2,730.7
LIABILITIESCurrent liabilitiesAccounts payable and accrued liabilities 14,15 $ 482.0 $ 576.8Deferred revenue 13 197.5 208.0Provisions 16 66.3 64.8Income taxes payable 22 — 1.0Other taxes payable 33.9 42.8Current portion of long-term obligations 14,17,19,25 5.2 5.1
Total current liabilities 784.9 898.5
Non-current liabilitiesLong-term obligations 14,17,19,25 30.9 117.6Deferred revenue 13 90.7 89.2Retirement benefit liability 20.1 415.7 452.3Deferred tax liabilities 22 5.8 5.3Other long-term liabilities 16,18 74.7 75.8
Total liabilities 1,402.7 1,638.7
SHAREHOLDERS’ EQUITYCapital stock 24 14.9 15.0Retained earnings 24,25 1,208.2 1,218.5Accumulated other comprehensive loss (146.7) (141.5)Total shareholders’ equity 1,076.4 1,092.0Total liabilities and shareholders’ equity $ 2,479.1 $ 2,730.7
The accompanying notes are an integral part of these consolidated financial statements.
On Behalf of the Board of Directors,
W.C.Crowley E.J. BirdChairman of the Board Director

52
CONSOLIDATED STATEMENTS OF NET EARNINGS (LOSS) AND COMPREHENSIVE INCOME (LOSS) For the 53 and 52-week periods ended February 2, 2013 and January 28, 2012
(in CAD millions, except per share amounts) Notes 2012 2011
Revenue 26 $ 4,300.7 $ 4,619.3Cost of goods and services sold 7 2,749.2 2,932.3Selling, administrative and other expenses 9,10,20.4,27 1,634.4 1,737.9Operating loss (82.9) (50.9)
Gain on lease terminations 28 167.1 —Gain on sale of interest in joint venture 11 8.6 —Gain on settlement of post-retirement benefits 20 21.1 —Finance costs 17,22 13.3 16.0Interest income 5 4.1 1.7Share of income from joint ventures 11 9.5 8.3Earnings (loss) before income taxes 114.2 (56.9)
Income tax (expense) recoveryCurrent 22 (8.2) (18.7)Deferred 22 (4.8) 25.3
(13.0) 6.6Net earnings (loss) $ 101.2 $ (50.3)
Basic net earnings (loss) per share 32 $ 0.99 $ (0.48)Diluted net earnings (loss) per share 32 $ 0.99 $ (0.48)
Net earnings (loss) $ 101.2 $ (50.3)
Other comprehensive loss, net of taxes:
Loss on foreign exchange derivatives, net of income taxrecovery of nil (2011: recovery of $1.7) — (4.1)Reclassification to net earnings (loss) of (gain) loss onforeign exchange derivatives, net of income tax recoveryof nil (2011: recovery of $2.8) (0.2) 7.1Remeasurement loss on net defined retirement benefitliability, net of income tax recovery of $3.5 (2011:recovery of $27.4) 20.7 (5.0) (79.1)
Total other comprehensive loss (5.2) (76.1)Comprehensive income (loss) $ 96.0 $ (126.4)
The accompanying notes are an integral part of these consolidated financial statements.

53
CONSOLIDATED STATEMENTS OF CHANGES IN SHAREHOLDERS’ EQUITYFor the 53 and 52-week periods ended February 2, 2013 and January 28, 2012
Accumulated other comprehensive loss (income)
(in CAD millions) NotesCapital
stockRetainedearnings
Foreign exchange
derivativesdesignated as
cashflow hedges
Remeasurementloss
Total Accumulated
othercomprehensive
loss (income)Shareholders’
equity
Balance as at January 28, 2012 $ 15.0 $1,218.5 $ 0.2 $ (141.7) $ (141.5) $ 1,092.0
Net earnings 101.2 — — — 101.2
Other comprehensive lossReclassification of gain on foreignexchange derivatives (0.2) — (0.2) (0.2)Remeasurement loss on net definedretirement benefit liability — (5.0) (5.0) (5.0)
Total other comprehensive loss — — (0.2) (5.0) (5.2) (5.2)Total comprehensive income (loss) — 101.2 (0.2) (5.0) (5.2) 96.0
Repurchases of common shares 24 (0.1) (9.6) (9.7)Dividends declared (101.9) (101.9)
Balance as at February 2, 2013 $ 14.9 $1,208.2 $ — $ (146.7) $ (146.7) $ 1,076.4
Balance as at January 29, 2011 $ 15.4 $1,310.4 $ (2.8) $ (62.6) $ (65.4) $ 1,260.4
Net loss (50.3) — — — (50.3)
Other comprehensive (loss) incomeLoss on foreign exchange derivatives (4.1) — (4.1) (4.1)Reclassification of loss on foreignexchange derivatives 7.1 — 7.1 7.1Remeasurement loss on net definedretirement benefit liability — (79.1) (79.1) (79.1)
Total other comprehensive (loss) income — — 3.0 (79.1) (76.1) (76.1)Total comprehensive (loss) income — (50.3) 3.0 (79.1) (76.1) (126.4)
Repurchases of common shares 24 (0.4) (41.6) (42.0)Balance as at January 28, 2012 $ 15.0 $1,218.5 $ 0.2 $ (141.7) $ (141.5) $ 1,092.0
The accompanying notes are an integral part of these consolidated financial statements.
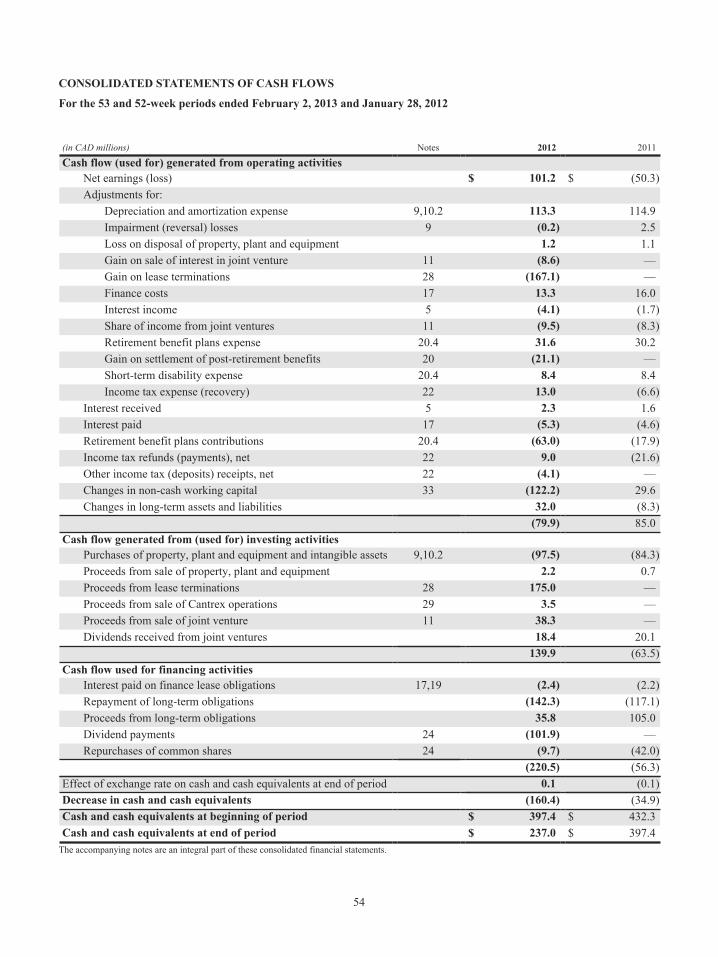
54
CONSOLIDATED STATEMENTS OF CASH FLOWS
For the 53 and 52-week periods ended February 2, 2013 and January 28, 2012
(in CAD millions) Notes 2012 2011
Cash flow (used for) generated from operating activitiesNet earnings (loss) $ 101.2 $ (50.3)Adjustments for:
Depreciation and amortization expense 9,10.2 113.3 114.9Impairment (reversal) losses 9 (0.2) 2.5Loss on disposal of property, plant and equipment 1.2 1.1Gain on sale of interest in joint venture 11 (8.6) —Gain on lease terminations 28 (167.1) —Finance costs 17 13.3 16.0Interest income 5 (4.1) (1.7)Share of income from joint ventures 11 (9.5) (8.3)Retirement benefit plans expense 20.4 31.6 30.2Gain on settlement of post-retirement benefits 20 (21.1) —Short-term disability expense 20.4 8.4 8.4Income tax expense (recovery) 22 13.0 (6.6)
Interest received 5 2.3 1.6Interest paid 17 (5.3) (4.6)Retirement benefit plans contributions 20.4 (63.0) (17.9)Income tax refunds (payments), net 22 9.0 (21.6)Other income tax (deposits) receipts, net 22 (4.1) —Changes in non-cash working capital 33 (122.2) 29.6Changes in long-term assets and liabilities 32.0 (8.3)
(79.9) 85.0Cash flow generated from (used for) investing activities
Purchases of property, plant and equipment and intangible assets 9,10.2 (97.5) (84.3)Proceeds from sale of property, plant and equipment 2.2 0.7Proceeds from lease terminations 28 175.0 —Proceeds from sale of Cantrex operations 29 3.5 —Proceeds from sale of joint venture 11 38.3 —Dividends received from joint ventures 18.4 20.1
139.9 (63.5)Cash flow used for financing activities
Interest paid on finance lease obligations 17,19 (2.4) (2.2)Repayment of long-term obligations (142.3) (117.1)Proceeds from long-term obligations 35.8 105.0Dividend payments 24 (101.9) —Repurchases of common shares 24 (9.7) (42.0)
(220.5) (56.3)Effect of exchange rate on cash and cash equivalents at end of period 0.1 (0.1)Decrease in cash and cash equivalents (160.4) (34.9)Cash and cash equivalents at beginning of period $ 397.4 $ 432.3Cash and cash equivalents at end of period $ 237.0 $ 397.4
The accompanying notes are an integral part of these consolidated financial statements.
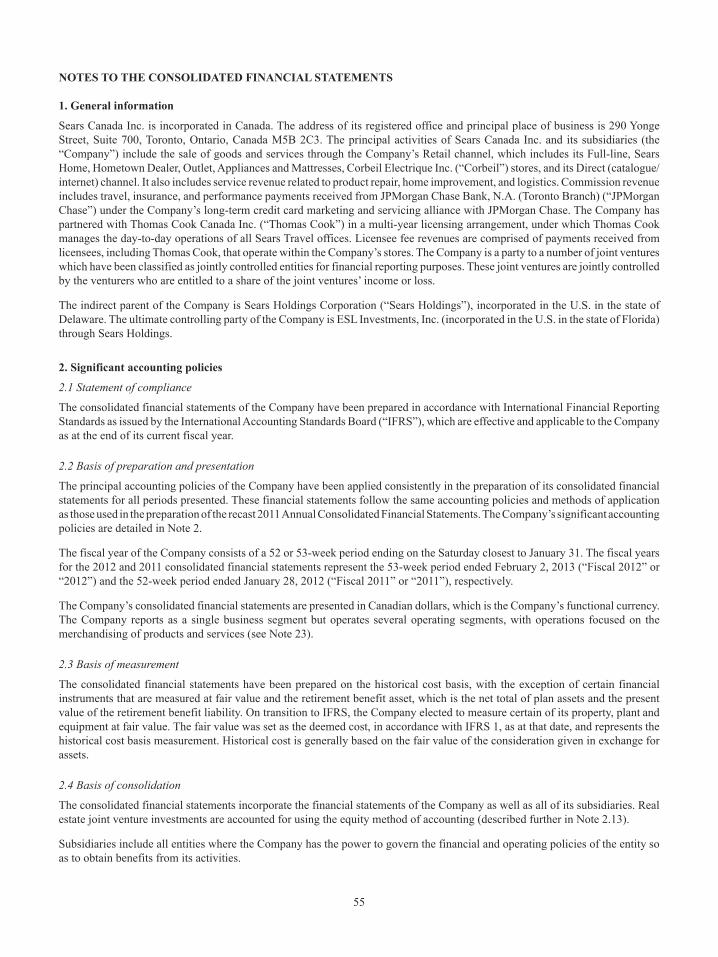
55
NOTES TO THE CONSOLIDATED FINANCIAL STATEMENTS
1. General information
Sears Canada Inc. is incorporated in Canada. The address of its registered office and principal place of business is 290 Yonge Street, Suite 700, Toronto, Ontario, Canada M5B 2C3. The principal activities of Sears Canada Inc. and its subsidiaries (the “Company”) include the sale of goods and services through the Company’s Retail channel, which includes its Full-line, Sears Home, Hometown Dealer, Outlet, Appliances and Mattresses, Corbeil Electrique Inc. (“Corbeil”) stores, and its Direct (catalogue/internet) channel. It also includes service revenue related to product repair, home improvement, and logistics. Commission revenue includes travel, insurance, and performance payments received from JPMorgan Chase Bank, N.A. (Toronto Branch) (“JPMorgan Chase”) under the Company’s long-term credit card marketing and servicing alliance with JPMorgan Chase. The Company has partnered with Thomas Cook Canada Inc. (“Thomas Cook”) in a multi-year licensing arrangement, under which Thomas Cook manages the day-to-day operations of all Sears Travel offices. Licensee fee revenues are comprised of payments received from licensees, including Thomas Cook, that operate within the Company’s stores. The Company is a party to a number of joint ventures which have been classified as jointly controlled entities for financial reporting purposes. These joint ventures are jointly controlled by the venturers who are entitled to a share of the joint ventures’ income or loss.
The indirect parent of the Company is Sears Holdings Corporation (“Sears Holdings”), incorporated in the U.S. in the state of Delaware. The ultimate controlling party of the Company is ESL Investments, Inc. (incorporated in the U.S. in the state of Florida) through Sears Holdings.
2. Significant accounting policies
2.1 Statement of compliance
The consolidated financial statements of the Company have been prepared in accordance with International Financial Reporting Standards as issued by the International Accounting Standards Board (“IFRS”), which are effective and applicable to the Company as at the end of its current fiscal year.
2.2 Basis of preparation and presentation
The principal accounting policies of the Company have been applied consistently in the preparation of its consolidated financial statements for all periods presented. These financial statements follow the same accounting policies and methods of application as those used in the preparation of the recast 2011 Annual Consolidated Financial Statements. The Company’s significant accounting policies are detailed in Note 2.
The fiscal year of the Company consists of a 52 or 53-week period ending on the Saturday closest to January 31. The fiscal years for the 2012 and 2011 consolidated financial statements represent the 53-week period ended February 2, 2013 (“Fiscal 2012” or “2012”) and the 52-week period ended January 28, 2012 (“Fiscal 2011” or “2011”), respectively.
The Company’s consolidated financial statements are presented in Canadian dollars, which is the Company’s functional currency. The Company reports as a single business segment but operates several operating segments, with operations focused on the merchandising of products and services (see Note 23).
2.3 Basis of measurement
The consolidated financial statements have been prepared on the historical cost basis, with the exception of certain financial instruments that are measured at fair value and the retirement benefit asset, which is the net total of plan assets and the present value of the retirement benefit liability. On transition to IFRS, the Company elected to measure certain of its property, plant and equipment at fair value. The fair value was set as the deemed cost, in accordance with IFRS 1, as at that date, and represents the historical cost basis measurement. Historical cost is generally based on the fair value of the consideration given in exchange for assets.
2.4 Basis of consolidation
The consolidated financial statements incorporate the financial statements of the Company as well as all of its subsidiaries. Real estate joint venture investments are accounted for using the equity method of accounting (described further in Note 2.13).
Subsidiaries include all entities where the Company has the power to govern the financial and operating policies of the entity so as to obtain benefits from its activities.

56
All intercompany balances and transactions, income and expenses arising from intercompany transactions are eliminated in the preparation of the consolidated financial statements.
2.5 Cash and cash equivalents
Cash and cash equivalents include highly liquid investments with maturities of 90 days or less at the date of purchase. Cash and cash equivalents are considered to be restricted when they are subject to contingent rights of a third party customer, vendor, government agency or financial institution.
2.6 Short-term investments
Short-term investments include investments with maturities between 91 to 364 days from the date of purchase.
2.7 Inventories
Inventories are measured at the lower of cost and net realizable value. Cost is determined using the weighted average cost method, based on individual items. The cost is comprised of the purchase price, plus the costs incurred in bringing the inventory to its present location and condition. Net realizable value is the estimated selling price in the ordinary course of business less the estimated costs to sell. Rebates and allowances received from vendors are recognized as a reduction to the cost of inventory, unless the rebates clearly relate to the reimbursement of specific expenses. A provision for shrinkage and obsolescence is calculated based on historical experience. All inventories consist of finished goods.
2.8 Property, plant and equipment
Property, plant and equipment are measured at cost or deemed cost less accumulated depreciation and accumulated impairment losses. Costs include expenditures that are directly attributable to the acquisition of the asset. The cost of self-constructed assets includes site preparation costs, design and engineering fees, freight (only on initial freight costs incurred between the vendor and the Company), installation expenses and provincial sales tax (Saskatchewan, Manitoba and Prince Edward Island), and is net of any vendor subsidies or reimbursements. An allocation of general and specific incremental interest charges for major construction projects is also included in the cost of related assets.
When the significant parts of an item of property, plant and equipment have varying useful lives, they are accounted for as separate components of property, plant and equipment. Depreciation is calculated based on the depreciable amount of the asset or significant component thereof, if applicable, which is the cost of the asset or significant component less its residual value. Depreciation is recognized using the straight-line method for each significant component of an item of property, plant and equipment and is recorded in “Selling, administrative and other expenses” in the Consolidated Statements of Net Earnings (Loss) and Comprehensive Income (Loss) . The estimated useful lives are 2 to 13 years for equipment and fixtures and 10 to 50 years for buildings and building improvements. The estimated useful lives, residual values and depreciation methods for property, plant and equipment are reviewed annually and adjusted, if appropriate, with the effect of any changes in estimates accounted for on a prospective basis.
Assets held under finance leases are depreciated over their expected useful lives on the same basis as owned assets or, where shorter, the term of the relevant lease, unless it is reasonably certain that the Company will obtain ownership by the end of the lease term.
The gain or loss arising on the disposal or retirement of an item of property, plant and equipment is determined as the difference between the proceeds from sale or the cost of retirement and the carrying amount of the asset, and is recognized in the Consolidated Statements of Net Earnings (Loss) and Comprehensive Income (Loss).
For a discussion on the impairment of tangible assets refer to Note 2.11. Property, plant and equipment are reviewed at the end of each reporting period to determine whether there is an indicator of impairment.
2.9 Investment property
The Company’s investment property consists of vacant land which is not currently used in its operations. Investment property is measured at its deemed cost less accumulated impairment losses.
The fair values of the investment property is estimated using observable data based on the current cost of acquiring comparable properties within the market area and the capitalization of the property’s anticipated revenue. The Company engages independent qualified third parties to conduct appraisals of its investment property.

57
The gain or loss arising on the disposal or retirement of an item of investment property is determined as the difference between the proceeds from sale or the cost of retirement, and the carrying amount of the asset, and is recognized in the Consolidated Statements of Net Earnings (Loss) and Comprehensive Income (Loss).
Investment property is reviewed at the end of each reporting period to determine whether there is any indicator of impairment.
2.10 Intangible assets
2.10.1 Finite life intangible assets other than goodwill
Finite life intangible assets consist of purchased and internally developed software. Intangible assets are carried at cost less accumulated amortization and accumulated impairment losses and are amortized on a straight-line basis over their estimated useful lives which range from 2 to 5 years. The useful lives of all intangible assets other than goodwill are finite. Amortization expense is included in “Selling, administrative and other expenses” in the Consolidated Statements of Net Earnings (Loss) and Comprehensive Income (Loss). The estimated useful lives and amortization methods for intangible assets other than goodwill are reviewed annually, with the effect of any changes in estimates being accounted for on a prospective basis.
Internally developed software costs are capitalized when the following criteria are met:• It is technically feasible to complete the software so that it will be available for use;• The Company intends to complete the software product;• The Company has an ability to use the software;• The Company can demonstrate how the software will generate probable future economic benefits;• Adequate technical, financial and other resources to complete the development and to use the software product are
available; and• The expenditure attributable to the software product during its development can be reliably measured.
Costs that qualify for capitalization are limited to those that are directly related to each software development project.
2.10.2 Goodwill
Goodwill arising in a business combination is recognized as an asset at the date that control is acquired (“the acquisition date”). Goodwill is measured as the excess of the sum of the consideration transferred, over the net fair value of identifiable assets acquired less liabilities assumed as of the acquisition date.
2.11 Impairment of tangible assets and intangible assets with finite useful lives
At the end of each reporting period, the Company reviews property, plant and equipment, investment property, intangible assets and goodwill for indicators of impairment. If any such indication exists, the recoverable amount of the asset is estimated in order to determine the extent of the impairment loss, if any. Where it is not possible to estimate the recoverable amount of an individual asset, the assets are then grouped together into the smallest group of assets that generate independent cash inflows from continuing use (the “cash generating unit” or “CGU”) and a recoverable amount is estimated for that CGU.
Where a reasonable and consistent basis of allocation can be identified, corporate assets are also allocated to individual CGUs. Otherwise, they are allocated to the smallest group of CGUs for which a reasonable and consistent allocation basis can be identified.
If the recoverable amount of an asset or a CGU is estimated to be less than its carrying amount, the asset or CGU will be reduced to its recoverable amount and an impairment loss is recognized immediately. If an impairment for a CGU has been identified, the impairment is first allocated to goodwill before other assets held by the CGU. Where goodwill is not part of a CGU, an impairment loss is recognized as a reduction in the carrying amount of the assets included in the CGU on a pro rata basis.
Where an impairment loss subsequently reverses (not applicable to goodwill), the carrying amount of the asset or CGU is revised to an estimate of its recoverable amount limited to the carrying amount that would have been determined had no impairment loss been recognized for the asset or CGU in prior years. A reversal of an impairment loss is recognized immediately.
2.12 Impairment of goodwill
Goodwill is not amortized but is reviewed for impairment at least annually. For the purposes of impairment testing, goodwill is allocated to each of the Company’s CGUs expected to benefit from the synergies of the combination.
CGUs to which goodwill has been allocated are tested for impairment annually, or more frequently when there is an indication that the unit may be impaired. If the recoverable amount of the CGU is less than its carrying amount, the impairment loss is allocated first to reduce the carrying amount of any goodwill allocated to the CGU, and then to the other assets of the unit on a
58
pro-rata basis, based on the carrying amount of each asset in the unit. Impairment losses for goodwill are not reversed in subsequent periods.
2.13 Investment in joint ventures
Joint ventures are those entities over which the Company has joint control, established by contractual agreement. The Company is a party to a number of joint ventures which have been classified as jointly controlled entities for financial reporting purposes. These joint ventures are jointly controlled by the venturers who are entitled to a share of the joint ventures’ income or loss.
Investments in joint ventures are accounted for using the equity method as follows:• From the date that joint control commences, until the date that it ceases, the Company’s share of post-acquisition income
or losses from joint ventures is recognized in the Consolidated Statements of Net Earnings (Loss) and Comprehensive Income (Loss), with a corresponding increase or decrease to the carrying amount of the investments.
• The joint venture reporting periods used in the application of the equity method differ from the Company’s reporting period end by 1 to 2 months.
• The accounting policies of the joint ventures are aligned with those of the Company for the purposes of applying the equity method.
• Gains on transactions between the Company and its joint ventures are eliminated to the extent of the Company’s interest in the joint ventures, and losses are eliminated unless the transaction provides evidence of an impairment of the assets transferred.
The Company presents its joint venture investments in “Investment in joint ventures” on the Consolidated Statements of Financial Position. The Company presents its share of income or losses from joint ventures in “Share of income from joint ventures” in the Consolidated Statements of Net Earnings (Loss) and Comprehensive Income (Loss).
2.14 Leasing arrangements
Leases are classified as finance leases when the terms of the lease transfer substantially all the risks and rewards of ownership to the lessee. All other leases are classified as operating leases.
2.14.1 The Company as lessor
The Company has entered into a number of agreements to sub-lease premises to third parties. All sub-leases to third parties are classified as operating leases. Rental income from operating leases is recognized on a straight-line basis over the term of the lease.
2.14.2 The Company as lessee
Assets held under finance leases are initially recognized by the Company at the lower of the fair value of the asset and the present value of the minimum lease payments. The corresponding current and non-current liabilities to the lessor are included in the Consolidated Statements of Financial Position as a finance lease obligation in “Principal payments on long-term obligations due within one year” and “Long-term obligations,” respectively. The assets are depreciated using the same accounting policy as applicable to property, plant and equipment (see Note 2.8).
Lease payments are apportioned between finance costs and the lease obligation in order to achieve a constant rate of interest on the remaining balance of the liability. The minimum lease payments are allocated between the land and building element in proportion to the relative fair values of the leasehold interests, in each of these elements of the lease.
Assets under operating leases are not recognized by the Company. Operating lease payments are recognized in “Selling, administrative and other expenses” in the Consolidated Statements of Net Earnings (Loss) and Comprehensive Income (Loss).
In the event that lease incentives are received to enter into leases, such incentives are recognized as a liability. The aggregate benefit of incentives is recognized as a reduction of rental expense on a straight-line basis over the lease term, except where another systematic basis is more representative of the time pattern in which economic benefits from the leased asset are consumed.
2.15 Retirement benefit plans
The Company currently maintains a defined contribution and a defined benefit registered pension plan, which covers eligible regular full-time and part-time associates, a non-registered supplemental savings arrangement and a defined benefit non-pension post retirement plan, which provides life insurance, medical and dental benefits to eligible retired associates through a health and welfare trust.
59
2.15.1 Defined contribution plan
A defined contribution plan is a post-employment benefit plan under which the Company pays fixed or matching contributions based on employee contributions into a separate legal entity and has no further legal or constructive obligation to pay additional amounts. Company contributions to the defined contribution retirement benefit plan are recognized as an expense when employees have rendered services entitling them to the contributions.
2.15.2 Defined benefit plans
For defined benefit retirement benefit plans, the cost of providing benefits is determined using the Projected Unit Credit Method, with actuarial valuations prepared by independent qualified actuaries at least every 3 years. Remeasurements comprising of actuarial gains and losses, the effect of the asset ceiling (if applicable) and the return on plan assets (excluding interest) are recognized immediately in the statement of financial position with a charge or credit to other comprehensive income (loss) in the period in which they occur. Remeasurements recorded in Other comprehensive income (loss) are not recycled into profit or loss. However, the entity may transfer those amounts recognized in other comprehensive income (loss) within Accumulated other comprehensive income (loss). Past service cost is recognized in profit or loss in the period of plan amendment. Net-interest is calculated by applying the discount rate to the net defined benefit liability or asset. Defined benefit costs are split into three categories:
• service cost, past-service cost, gains and losses on curtailments and settlements;• net interest expense or income;• remeasurements.
The Company presents the first two components of defined benefit costs in “Selling, administrative and other expenses” in the Consolidated Statements of Net Earnings (Loss) and Comprehensive Income (Loss).
Remeasurements are recorded in Other comprehensive income (loss).
The retirement benefit obligation recognized in the Consolidated Statements of Financial Position represents the actual deficit or surplus in the Company’s defined benefit plans. Any surplus resulting from this calculation is limited to the present value of any economic benefits available in the form of refunds from the plans or reductions in future contributions to the plans.
2.15.3 Termination benefits
A liability for a termination benefit is recognized at the earlier of when the entity can no longer withdraw the offer of the termination benefit and when the entity recognizes any related restructuring costs.
2.16 Revenue recognition
Revenue is measured at the fair value of the consideration received or receivable, excluding sales taxes. Revenue is reduced for estimated customer returns, discounts and other similar allowances.
2.16.1 Sale of goods
Revenue from the sale of goods is recognized upon delivery to the customer. Revenue relating to goods sold subject to installation, such as home improvement products, is recognized when the goods have been delivered and the installation is complete.
2.16.2 Rendering of services
Revenue from a contract to provide services is recognized by reference to the stage of completion of the contract.
Extended warranty service contracts
The Company sells extended warranty service contracts with terms of coverage generally between 12 and 60 months. Revenue from the sale of each contract is deferred and amortized on a straight-line basis over the term of the related contract.
Product repair, handling and installation services
Product repair, handling and installation services revenue is recognized once the services are complete. These services are performed within a short timeframe which is typically one day.

60
2.16.3 Commission and licensee fee revenue
Commission revenue
The Company earns commission revenue by selling various products and services that are provided by third parties, such as sales of travel services, home improvement products and insurance programs. As the Company is not the primary obligor in these transactions, these commissions are recognized upon sale of the related product or service.
Licensee fee revenue
Fee revenue is received from a variety of licensees that operate in the Company’s stores. Revenue earned is based on a percentage of licensee sales. Revenue is recorded upon sale of the related product or service.
Credit card revenue
Revenue is received from JPMorgan Chase relating to credit sales. Revenue is based on a percentage of sales charged on the Sears Card or Sears MasterCard and is included in revenue when the sale occurs.
2.16.4 Interest income
Interest income is recognized when it is probable that the economic benefits will flow to the Company and the amount of income can be reliably measured. Interest income is accrued on a periodic basis by reference to the principal outstanding and the applicable interest rate.
2.16.5 Customer loyalty program
The Sears Club Points Program (the “Program”) allows members to earn points from eligible purchases made on their Sears Card and/or Sears MasterCard. Members can then redeem points in accordance with the Program rewards schedule for merchandise. When points are earned, the Company defers revenue equal to the fair value of the awards adjusted for expected redemptions. When awards are redeemed, the redemption value of the awards is charged against deferred revenue and recognized as revenue. The redemption rates are reviewed on an ongoing basis and are adjusted based upon expected future activity.
2.16.6 Cost of goods and services sold
Cost of goods and services sold includes the purchase price of merchandise sold, freight and handling costs incurred in preparing the related inventory for sale, installation costs incurred relating to the sale of goods subject to installation, write-downs taken on inventory during the period, physical inventory losses and costs of services provided during the period relating to services sold, less rebates from suppliers relating to merchandise sold.
2.17 Foreign currency translation
Transactions in currencies other than the Company’s functional currency are recognized at the rates of exchange prevailing at the dates of the transactions. At the end of each reporting period, monetary assets and liabilities denominated in foreign currencies are retranslated to the functional currency at the exchange rates prevailing at that date.
Non-monetary assets and liabilities denominated in a foreign currency that are measured at historical cost are translated using the exchange rate at the date of the transaction and are not retranslated.
Exchange differences arising on retranslation are recognized in the Consolidated Statements of Net Earnings (Loss) and Comprehensive Income (Loss) in the period in which they arise, except for exchange differences on certain foreign currency hedging transactions.
2.18 Consideration from a vendor
The Company has arrangements with its vendors that provide for rebates subject to binding contractual agreements. Rebates on inventories subject to binding agreements are recognized as a reduction of the cost of sales or related inventories for the period, provided the rebates are probable and reasonably estimable. Rebates on advertising costs subject to binding agreements are recognized as a reduction of the advertising expense for the period, provided the rebates are probable and reasonably estimable.
2.19 Taxation
Income tax expense represents the sum of current tax expense and deferred tax expense.
61
2.19.1 Current tax
Tax currently payable or recoverable is based on taxable earnings or loss for the reporting period. Taxable income differs from earnings as reported in the Consolidated Statements of Net Earnings (Loss) and Comprehensive Income (Loss), due to income or expenses that are taxable or deductible in other years and items that are not taxable or deductible for tax purposes. The Company’s liability for current tax is calculated using tax rates that have been enacted or substantively enacted as at the end of the reporting period and includes any adjustments to taxes payable and/or taxes recoverable in respect of prior years.
2.19.2 Deferred tax
Deferred tax is recognized on temporary differences between the carrying amounts of assets and liabilities and the corresponding tax bases used in the computation of taxable earnings or loss.
Deferred tax liabilities are generally recognized for taxable temporary differences. Deferred tax assets are generally recognized for deductible temporary differences to the extent that it is probable that taxable income will be available, against which deductible temporary differences can be utilized. Such deferred tax assets and liabilities are not recognized if the temporary differences arise from the initial recognition of goodwill or from the initial recognition (other than in a business combination) of other assets and liabilities in a transaction that affects neither the taxable net earnings or loss nor the accounting income or loss.
Deferred tax liabilities are recognized for taxable temporary differences associated with investments in subsidiaries and investments in joint ventures, except where the Company is able to control the reversal of the temporary difference and it is probable that the temporary difference will not reverse in the foreseeable future. Deferred tax assets arising from deductible temporary differences associated with such investments are only recognized to the extent that it is probable that there will be sufficient taxable earnings against which to utilize the benefits of the temporary differences and they are expected to reverse in the foreseeable future.
The carrying amount of deferred tax assets is reviewed at the end of each reporting period and reduced to the extent that it is no longer probable that sufficient taxable income will be available to allow all or part of the asset to be recovered.
Deferred tax assets and liabilities are measured at the tax rates that are expected to be applicable in the period in which the liability is settled or the asset realized, based on tax rates and tax laws that have been enacted or substantively enacted by the end of the reporting period. The measurement of deferred tax liabilities and assets reflects the tax consequences that would follow from the manner in which the Company expects, at the end of the reporting period, to recover or settle the carrying amount of its assets and liabilities.
Deferred tax assets and liabilities are offset when there is a legally enforceable right to offset current tax assets against current tax liabilities, when they relate to income taxes levied by the same taxation authority and when the Company intends to settle its current tax assets and liabilities on a net basis. Deferred tax assets and liabilities are not discounted.
2.19.3 Current and deferred tax for the period
Current and deferred tax are recognized as a tax expense or recovery in the Consolidated Statements of Net Earnings (Loss) and Comprehensive Income (Loss), except when they relate to items that are recognized outside of earnings or loss (whether in Other comprehensive income (loss), “OCI”, or directly in equity), in which case, the tax is also recognized outside of earnings or loss, or where they arise from the initial accounting for a business combination. In the case of a business combination, the tax effect is included in the accounting for the business combination. Interest on the Company’s tax position is recognized as a finance cost.
2.20 Provisions
Provisions are recognized when the Company has a present obligation, legal or constructive, as a result of a past event, it is probable that the Company will be required to settle the obligation and a reliable estimate can be made for the amount of the obligation.
The amount recognized as a provision is the best estimate of the consideration required to settle the present obligation at the end of the reporting period, taking into account the risks and uncertainties specific to the obligation. Where a provision is measured using the cash flow estimated to settle the present obligation, its carrying amount is the present value of such cash flows.
When some or all of the economic resources required to settle a provision are expected to be recovered from a third party, a receivable is recognized as an asset if it is virtually certain that reimbursement will be received and the amount of the receivable can be measured reliably.
62
2.20.1 Onerous contract provisions
An onerous contract provision is recognized when the expected benefits to be derived by the Company from a contract are lower than the unavoidable cost of meeting its obligations. The provision is measured at the present value of the lower of the expected cost of terminating the contract or the expected cost of continuing with the contract. Before a provision is established, the Company recognizes any impairment loss on the assets associated with that contract.
2.20.2 General liability provisions
The Company purchases third party insurance for automobile, damage to a claimant’s property or bodily injury from use of a product, and general liability claims that exceed a certain dollar level. However, the Company is responsible for the payment of claims under these insured limits. In estimating the obligation associated with incurred losses, the Company utilizes actuarial methodologies which are based on historical data and validated by an independent third party. Loss estimates are adjusted based on actual claims settlements and reported claims.
2.20.3 Warranty provisions
An estimate for warranty provisions is made at the time the merchandise is sold based on historical warranty trends. Please also see Note 16.
2.20.4 Returns and allowances provisions
Provisions for returns and allowances are made based on historical rates which represent the expected future outflow of economic resources on current sales.
2.20.5 Environmental provisions
The Company is exposed to environmental risks as an owner, lessor and lessee of property. Under federal and provincial laws, the owner, lessor or lessee could be liable for the costs of removal and remediation of certain hazardous substances on its properties or disposed of at other locations. The failure to remove or remediate such substances, if any, could lead to claims against the Company. The provision is based on assessments conducted by third parties, as well as historical data.
2.21 Financial assets
All financial assets are recognized and derecognized on the trade date where the purchase or sale of a financial asset is under a contract whose terms require delivery of the financial asset within the timeframe established by the market concerned. Financial assets are initially measured at fair value plus transaction costs, except for those financial assets at ‘fair value through profit or loss’ (“FVTPL”) for which the transaction costs are expensed as incurred.
Financial assets and liabilities are offset with the net amount presented in the Consolidated Statements of Financial Position when, and only when, the Company has a legal right to offset the amounts and intends either to settle on a net basis or to realize the asset and settle the liability simultaneously.
Financial assets are classified into the following categories: financial assets at FVTPL, ‘held-to-maturity’ investments, ‘available-for-sale’ (“AFS”) financial assets and ‘loans and receivables’. The classification depends on the nature and purpose of the financial assets and is determined at the time of initial recognition. Currently the Company does not have any ‘held-to-maturity’ investments.
2.21.1 Effective interest method
The effective interest method calculates the amortized cost of a financial asset or financial liability and allocates interest income or expense over the relevant period. The effective interest rate is the rate that exactly discounts estimated future cash
flow (including all fees on points paid or received that form an integral part of the effective interest rate, transaction costs and other premiums or discounts) through the expected life of the financial instrument, or (where appropriate) a shorter period, to the net carrying amount on initial recognition.
Interest income or expense is recognized on an effective interest basis for financial assets and financial liabilities other than those classified as at FVTPL.
2.21.2 Financial assets at FVTPL
Financial assets are classified at FVTPL when the financial asset is either held-for-trading or it is designated as at FVTPL.

63
2.21.3 AFS financial assets
The Company’s cash equivalents have been classified as AFS financial assets and are measured at fair value. Gains and losses arising from changes in fair value are recognized in OCI, with the exception of impairment losses, interest calculated using the effective interest method and foreign exchange gains and losses on monetary assets, which are recognized in “Selling, administrative and other expenses” or “Interest Income” in the Consolidated Statements of Net Earnings (Loss) and Comprehensive Income (Loss). Where the investment is disposed of or is determined to be impaired, the cumulative gain or loss previously included in accumulated other comprehensive income (loss)” (“AOCI”) is reclassified to “Selling, administrative and other expenses” in the Consolidated Statements of Net Earnings (Loss) and Comprehensive Income (Loss).
2.21.4 Loans and receivables
Cash held by the bank and restricted cash and cash equivalents are classified as ‘loans and receivables’ and are measured at amortized cost.
Trade receivables and other receivables that have fixed or determinable payments that are not quoted in an active market are also classified as ‘loans and receivables’. Loans and receivables are measured at amortized cost using the effective interest method, less any impairment. Interest income is recognized by applying the effective interest rate, except for short-term receivables, where the recognition of interest would be immaterial.
2.21.5 Impairment of financial assets
Financial assets, other than those at FVTPL, are assessed for indicators of impairment at the end of each reporting period. Financial assets are considered to be impaired when there is objective evidence that the estimated future cash flow of the financial asset have been negatively affected as a result of events that have occurred after its initial recognition.
For all financial assets, objective evidence of impairment could include:• Significant financial difficulty of the issuer or counterparty; or• Default or delinquency in interest or principal payments; or• Probability that the borrower will enter bankruptcy or financial reorganization.
For financial assets carried at amortized cost, the amount of any impairment loss recognized is the difference between the asset’s carrying amount and the present value of estimated future cash flow discounted at the financial asset’s initial effective interest rate. When a subsequent event causes the amount of any impairment loss to decrease, the decrease in impairment loss is reversed through the Consolidated Statements of Net Earnings (Loss) and Comprehensive Income (Loss).
The carrying amount of the financial asset is reduced by any impairment loss directly for all financial assets with the exception of trade receivables, where the carrying amount is reduced through the use of an allowance account. When a trade receivable is considered uncollectible its carrying amount is written off including any amounts previously recorded in the allowance account. Subsequent recoveries of amounts previously written off are credited to “Selling, administrative and other expenses” in the Consolidated Statements of Net Earnings (Loss) and Comprehensive Income (Loss). Changes in the carrying amount of the allowance account are also recognized in “Selling, administrative and other expenses”.
2.21.6 Derecognition of financial assets
The Company derecognizes a financial asset only when the contractual rights to the cash flow from the asset expire, or when substantially all the risks and rewards of ownership of the asset are transferred to another entity. If the Company retains substantially all the risks and rewards of ownership of a transferred financial asset, the Company continues to recognize the financial asset and also recognizes a collateralized borrowing for the proceeds received.
2.22 Financial liabilities and equity instruments
2.22.1 Classification as debt or equity
Debt and equity instruments are classified as either financial liabilities or as equity in accordance with the substance of the contractual arrangement.
2.22.2 Equity instruments
An equity instrument is any contract that evidences a residual interest in the assets of an entity after deducting all of its liabilities. Equity instruments issued by the Company are recognized at the proceeds received, net of direct issuance costs.

64
2.22.3 Financial liabilities
Financial liabilities are recognized on the trade date at which the Company becomes a party to the contractual provisions of the instrument. Financial liabilities are classified as either financial liabilities at ‘FVTPL’ or ‘other financial liabilities’.
2.22.4 Financial liabilities at FVTPL
Financial liabilities are classified as at FVTPL when they are either held-for-trading or designated as at FVTPL. Currently the Company does not have any financial liabilities that have been designated as at FVTPL upon initial recognition.
2.22.5 Other financial liabilities
Other financial liabilities, including borrowings, are initially measured at fair value, net of transaction costs. Other financial liabilities are subsequently measured at amortized cost with interest expense recognized on an effective interest method.
The Company amortizes debt issuance transaction costs over the life of the debt using the effective interest method.
2.22.6 Derecognition of financial liabilities
The Company derecognizes financial liabilities when, and only when, the Company’s obligations are discharged, cancelled or expired.
2.23 Net earnings (loss) per share
Net earnings (loss) per share is calculated using the weighted average number of shares outstanding during the reporting period. Diluted net earnings (loss) per share is determined using the ‘treasury stock method,’ which considers the potential for the issuance of new shares created by unexercised in-the-money options.
2.24 Changes in Accounting Policy
IAS 19 (Revised), Employee Benefits (“IAS 19”)
The Company elected to early adopt IAS 19 (Revised) in the first quarter of 2012. On June 16, 2011, the IASB issued amendments to IAS 19 which included the elimination of the “corridor approach,” which is the option to defer and amortize the recognition of actuarial gains and losses. The significant amendments to IAS 19 are as follows:
• The “corridor approach” is to be replaced with full and immediate recognition of actuarial gain and loss remeasurements in “Other comprehensive income (loss)” (“OCI”);
• Retirement benefit costs are to consist of service costs, net interest and remeasurements, with remeasurements being recorded in OCI;
• Past service costs are to be recognized immediately in the Consolidated Statements of Net Earnings (Loss);• Expected returns on plan assets will no longer be recognized in profit or loss. Instead, interest income on plan assets,
calculated using the discount rate used to measure the pension obligation, will be recognized in the Consolidated Statements of Net Earnings (Loss);
• Plan administration costs are to be expensed as incurred; and• Disclosures relating to retirement benefit plans will be enhanced and will include discussions on risk associated with
each plan, an explanation of items recognized in the consolidated financial statements and descriptions of the amount, timing and uncertainty on the Company’s future cash flows.
The amendments to IAS 19 are effective for annual periods beginning on or after January 1, 2013 with early adoption permitted. The amendments are required to be applied retrospectively in accordance with IAS 8, Accounting Policies, Changes in Accounting Estimates and Errors.
As the Company adopted the amendments to IAS 19 in the first quarter of 2012, the Company has retrospectively adjusted the assets and liabilities as at January 28, 2012, January 29, 2011 and January 31, 2010 and income, expenses and cash flow for the 52-week periods ended January 28, 2012 and January 29, 2011.
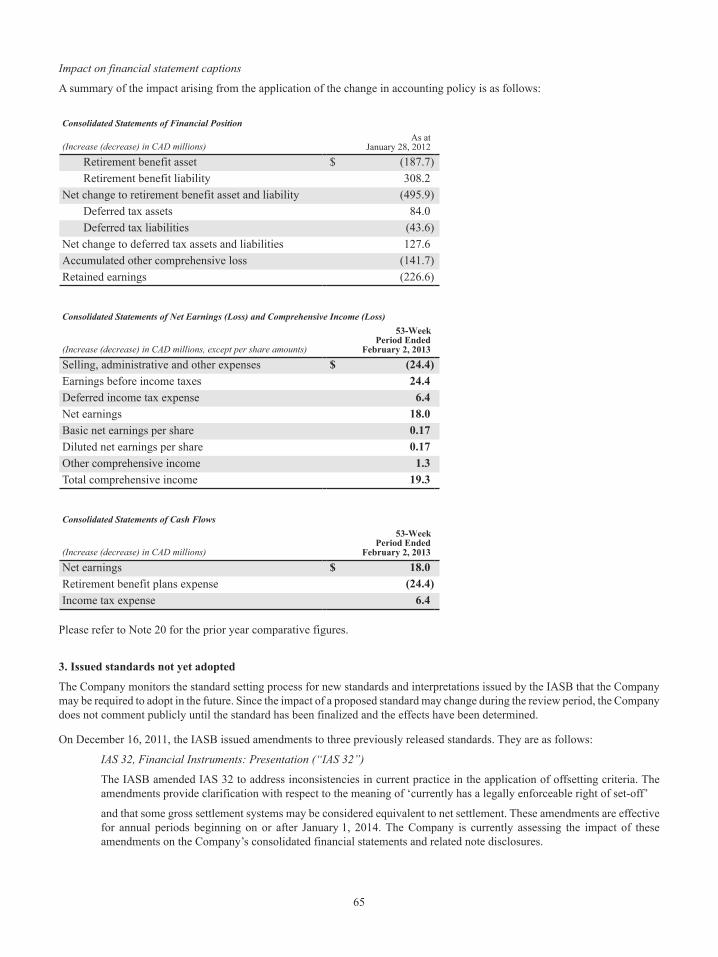
65
Impact on financial statement captions
A summary of the impact arising from the application of the change in accounting policy is as follows:
Consolidated Statements of Financial Position
(Increase (decrease) in CAD millions)As at
January 28, 2012
Retirement benefit asset $ (187.7)Retirement benefit liability 308.2
Net change to retirement benefit asset and liability (495.9)Deferred tax assets 84.0Deferred tax liabilities (43.6)
Net change to deferred tax assets and liabilities 127.6Accumulated other comprehensive loss (141.7)Retained earnings (226.6)
Consolidated Statements of Net Earnings (Loss) and Comprehensive Income (Loss)
(Increase (decrease) in CAD millions, except per share amounts)
53-WeekPeriod Ended
February 2, 2013
Selling, administrative and other expenses $ (24.4)Earnings before income taxes 24.4Deferred income tax expense 6.4Net earnings 18.0Basic net earnings per share 0.17Diluted net earnings per share 0.17Other comprehensive income 1.3Total comprehensive income 19.3
Consolidated Statements of Cash Flows
(Increase (decrease) in CAD millions)
53-WeekPeriod Ended
February 2, 2013
Net earnings $ 18.0Retirement benefit plans expense (24.4)Income tax expense 6.4
Please refer to Note 20 for the prior year comparative figures.
3. Issued standards not yet adopted
The Company monitors the standard setting process for new standards and interpretations issued by the IASB that the Company may be required to adopt in the future. Since the impact of a proposed standard may change during the review period, the Company does not comment publicly until the standard has been finalized and the effects have been determined.
On December 16, 2011, the IASB issued amendments to three previously released standards. They are as follows:
IAS 32, Financial Instruments: Presentation (“IAS 32”)
The IASB amended IAS 32 to address inconsistencies in current practice in the application of offsetting criteria. The amendments provide clarification with respect to the meaning of ‘currently has a legally enforceable right of set-off’
and that some gross settlement systems may be considered equivalent to net settlement. These amendments are effective for annual periods beginning on or after January 1, 2014. The Company is currently assessing the impact of these amendments on the Company’s consolidated financial statements and related note disclosures.

66
IFRS 7, Financial Instruments: Disclosures (“IFRS 7”)
The IASB first amended IFRS 7 on October 7, 2010, to require additional disclosures regarding transfers of financial assets. These amendments are effective for annual periods beginning on or after July 1, 2011. The Company applied these amendments beginning the first quarter of its Fiscal 2012 year.
On December 16, 2011, the IASB approved amendments to IFRS 7, which establishes disclosure requirements to help users better assess the effect or potential effect of offsetting arrangements on a company’s financial position. These amendments are effective for annual periods beginning on or after January 1, 2013. The Company will apply these amendments beginning the first quarter of its Fiscal 2013 year and is currently assessing the impact on the Company’s disclosures.
IFRS 9, Financial Instruments (“IFRS 9”)
The IASB issued IFRS 9 on November 12, 2009, which will ultimately replace IAS 39, Financial Instruments: Recognition and Measurement (“IAS 39”). The replacement of IAS 39 is a three-phase project with the objective of improving and simplifying the reporting for financial instruments.
The first phase of the project provides guidance on the classification and measurement of financial assets. IFRS 9 was subsequently reissued on October 28, 2010, incorporating new requirements on accounting for financial liabilities. On December 16, 2011, the IASB amended the mandatory effective date of IFRS 9 to fiscal years beginning on or after January 1, 2015. The amendment also provides relief from the requirement to recast comparative financial statements for the effect of applying IFRS 9. The Company is monitoring the impact of amendments to this standard and is currently assessing the impact on the Company's disclosures.
On June 16, 2011, the IASB issued amendments to the following standard:
IAS 1, Presentation of Financial Statements (“IAS 1”)
The IASB has amended IAS 1 to require additional disclosures for items presented in OCI on a before-tax basis and requires items to be grouped and presented in OCI based on whether they are potentially reclassifiable to earnings or loss subsequently (i.e. items that may be reclassified and those that will not be reclassified to earnings or loss). These amendments are effective for annual periods beginning on or after July 1, 2012 and require full retrospective application. The Company will apply these amendments beginning the first quarter of its Fiscal 2013 year and is currently assessing the impact to its consolidated financial statements.
On May 12, 2011, the IASB issued four new standards, all of which are applicable to Annual Reporting periods beginning on or after January 1, 2013. The Company is currently assessing the impact of these standards on its consolidated financial statements and related note disclosures. The following is a list and description of these standards:
IAS 28, Investments in Associates and Joint Ventures (“IAS 28”)
IAS 28 (as amended in 2011) supersedes IAS 28 (2003), Investments in Associates and outlines how to apply, with certain limited exceptions, the equity method to investments in associates and joint ventures. The standard also defines an associate by reference to the concept of "significant influence", which requires power to participate in financial and operating policy decisions of an investee (but not joint control or control of those polices);
IFRS 10, Consolidated Financial Statements (“IFRS 10”)
IFRS 10 establishes the standards for the presentation and preparation of consolidated financial statements when an entity controls one or more entities;
IFRS 11, Joint Arrangements (“IFRS 11”)
IFRS 11 replaces IAS 31, Interests in Joint Ventures (“IAS 31”) and requires that a party in a joint arrangement assess its rights and obligations to determine the type of joint arrangement and account for those rights and obligations accordingly;
IFRS 12, Disclosure of Involvement with Other Entities (“IFRS 12”)
IFRS 12, along with IFRS 11 described above, replaces IAS 31. IFRS 12 requires the disclosure of information that enables users of financial statements to evaluate the nature of and the risks associated with, the entity’s interests in joint ventures and the impact of those interests on its financial position, financial performance and cash flows; and
67
IFRS 13, Fair Value Measurement (“IFRS 13”)
IFRS 13 provides guidance to improve consistency and comparability in fair value measurements and related disclosures through a ‘fair value hierarchy’. This standard applies when another IFRS requires or permits fair value measurements or disclosures. IFRS 13 does not apply for share-based payment transactions, leasing transactions and measurements that are similar to, but are not fair value.
4. Critical accounting judgments and key sources of estimation uncertainty
In the application of the Company’s accounting policies, management is required to make judgments, estimates and assumptions with regards to the carrying amounts of assets and liabilities that are not readily apparent from other sources. The estimates and underlying assumptions are based on historical experience and other factors that are considered to be relevant. Actual results may differ from these estimates. The estimates and underlying assumptions are reviewed on an ongoing basis. Revisions to accounting estimates are recognized in the period in which the estimate is revised if the revision affects only that period, or in the period of the revision and future periods, if the revision affects both current and future periods.
The following are the critical judgments that management has made in the process of applying the Company’s accounting policies, key assumptions concerning the future and other key sources of estimation uncertainty that have the potential to materially impact the carrying amounts of assets and liabilities within the next fiscal year.
4.1 Legal liabilities
Assessing the financial outcome of uncertain legal positions requires judgment to be made regarding the relative merits of each claim and the extent to which a claim is likely to be successful. The assessments are based on reviews conducted by internal and external counsel, when appropriate.
Changes in estimates or assumptions could cause changes to “Provisions” on the Consolidated Statements of Financial Position and a charge or credit to “Selling, administrative and other expenses” in the Consolidated Statements of Net Earnings (Loss) and Comprehensive Income (Loss). For additional information, see Note 16.
4.2 Inventory
4.2.1 Obsolescence, valuation and inventory stock losses
Inventory is written-down to reflect future losses on the disposition of obsolete merchandise. Future losses are estimated based on historical trends that vary depending on the type of inventory.
An adjustment is made each period to value inventory at the lower of cost and net realizable value. This adjustment is estimated based on historical trends that vary depending on the type of inventory.
Inventory is adjusted to reflect estimated inventory stock losses incurred in the year based on recent historical inventory count data.
4.2.2 Vendor rebates
Inventory is adjusted to reflect vendor rebates received or receivable based on vendor agreements. This adjustment is estimated based on historical data and current vendor agreements.
4.2.3 Freight
Inbound freight incurred to bring inventory to its present location is estimated each reporting period and is included in the cost of inventory. This estimate is based on historical freight costs incurred.
Changes in estimates may result in changes to “Inventories” on the Consolidated Statements of Financial Position and a charge or credit to “Cost of goods and services sold” in the Consolidated Statements of Net Earnings (Loss) and Comprehensive Income (Loss). For additional information, see Note 7.
4.3 Impairment of property, plant and equipment and intangible assets
The Company’s property, plant and equipment and intangible assets have been allocated to CGUs. Determining whether the CGU is impaired requires an estimation of the recoverable amount of the CGU, which is the higher of the fair value less costs to sell and its value in use. To determine the recoverable amount of the CGU, management is required to estimate its fair value by

68
evaluating the expected future cash flow using an appropriate growth rate, the estimated costs to sell and a suitable discount rate to calculate the value in use.
Changes in estimates may result in changes to “Property, plant and equipment” and “Intangible assets” on the Consolidated Statements of Financial Position and a charge or credit to “Selling, administrative and other expenses” in the Consolidated Statements of Net Earnings (Loss) and Comprehensive Income (Loss). For additional information, see Note 9 and Note 10.2.
4.4 Impairment of goodwill
Determining whether goodwill is impaired requires the Company to determine the recoverable amount of the CGU to which the goodwill is allocated. To determine the recoverable amount of the CGU, management is required to estimate its fair value by evaluating expected future cash flow using an appropriate growth rate, the estimated costs to sell and a suitable discount rate to calculate the value in use.
Changes in estimates may result in changes to “Goodwill” on the Consolidated Statements of Financial Position and a charge to “Selling, administrative and other expenses” in the Consolidated Statements of Net Earnings (Loss) and Comprehensive Income (Loss). For additional information, see Note 10.1.
4.5 Retirement benefit liability
The retirement benefit liability is estimated based on certain actuarial assumptions, including the discount rate, inflation rate, salary growth and mortality rates. New regulations and market driven changes may impact the assumptions made.
Changes in estimates may result in changes to the “Retirement benefit liability” on the Consolidated Statements of Financial Position and a charge or credit to “Selling, administrative and other expenses” in the Consolidated Statements of Net Earnings (Loss) and Comprehensive Income (Loss). For additional information, see Note 20.
4.6 Loyalty program deferred revenue
The fair value of Sears Club points granted is deferred at the time of the related initial sale transaction and is recognized upon redemption of the points for merchandise. The redemption value of the points is estimated based on historical behaviour and trends in redemption rates and redemption values.
Changes in estimates may result in changes to “Deferred revenue” (current and non-current) on the Consolidated Statements of Financial Position and an increase or decrease to “Revenue” and/or “Cost of goods and services sold” in the Consolidated Statements of Net Earnings (Loss) and Comprehensive Income (Loss). For additional information, see Note 13.
4.7 Derivative assets and liabilities
All derivatives are measured at fair value. U.S. dollar option contracts are traded over-the-counter and give holders the right to buy, or sell, a specified amount of U.S. currency at an agreed upon price and date in the future. Fair values of the U.S. dollar option contracts are derived using a Black-Scholes valuation model. The Company is required to estimate various inputs which are used in this model that are a combination of quoted prices and observable market inputs. The fair values of derivatives include an adjustment for credit risk when appropriate.
Changes in estimates may result in changes to “Derivative financial assets” and “Derivative financial liabilities” on the Consolidated Statements of Financial Position and a charge or credit to “Cost of goods and services sold”, “Selling, administrative and other expenses” or “Other comprehensive income (loss)” in the Consolidated Statements of Net Earnings (Loss) and Comprehensive Income (Loss). For additional information, see Note 14.
4.8 Provisions
Provisions are estimated based on historical data, cost estimates provided by specialists and future projections.
Changes in estimates or assumptions could cause changes to “Provisions” on the Consolidated Statements of Financial Position and a charge or credit to “Cost of goods and services sold” or “Selling, administrative and other expenses” in the Consolidated Statements of Net Earnings (Loss) and Comprehensive Income (Loss). For additional information, see Note 16.
4.9 Leasing arrangementsThe Company has applied judgment in the classification of its leasing arrangements, which is determined at the inception of the lease and is based on the substance of the transaction, rather than its legal form. The Company’s leases were evaluated based on
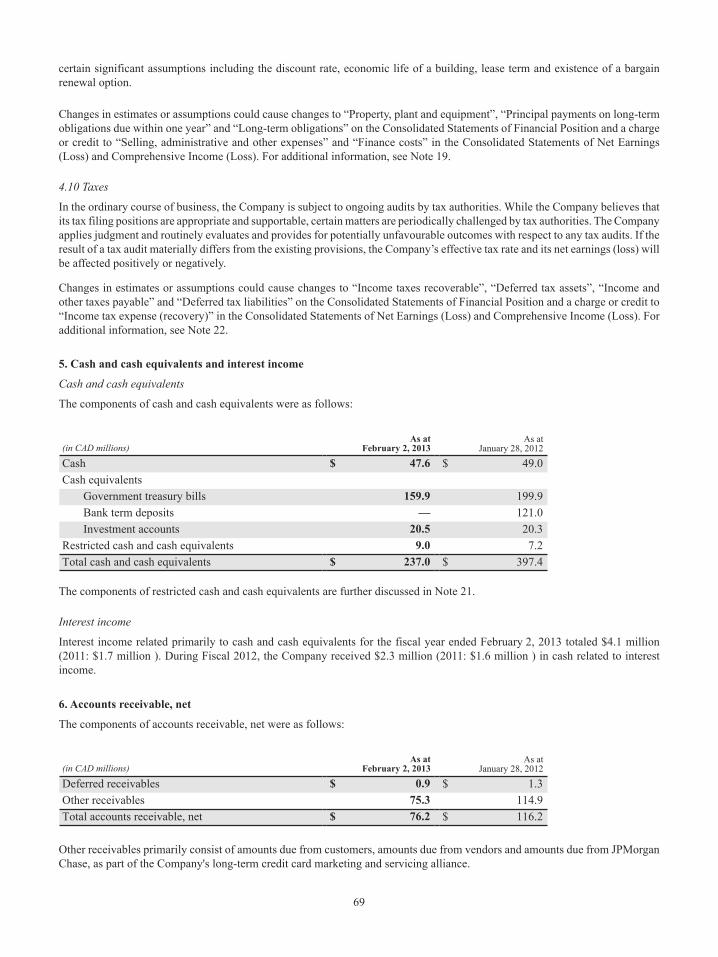
69
certain significant assumptions including the discount rate, economic life of a building, lease term and existence of a bargain renewal option.
Changes in estimates or assumptions could cause changes to “Property, plant and equipment”, “Principal payments on long-term obligations due within one year” and “Long-term obligations” on the Consolidated Statements of Financial Position and a charge or credit to “Selling, administrative and other expenses” and “Finance costs” in the Consolidated Statements of Net Earnings (Loss) and Comprehensive Income (Loss). For additional information, see Note 19.
4.10 Taxes
In the ordinary course of business, the Company is subject to ongoing audits by tax authorities. While the Company believes that its tax filing positions are appropriate and supportable, certain matters are periodically challenged by tax authorities. The Company applies judgment and routinely evaluates and provides for potentially unfavourable outcomes with respect to any tax audits. If the result of a tax audit materially differs from the existing provisions, the Company’s effective tax rate and its net earnings (loss) will be affected positively or negatively.
Changes in estimates or assumptions could cause changes to “Income taxes recoverable”, “Deferred tax assets”, “Income and other taxes payable” and “Deferred tax liabilities” on the Consolidated Statements of Financial Position and a charge or credit to “Income tax expense (recovery)” in the Consolidated Statements of Net Earnings (Loss) and Comprehensive Income (Loss). For additional information, see Note 22.
5. Cash and cash equivalents and interest income
Cash and cash equivalents
The components of cash and cash equivalents were as follows:
(in CAD millions)As at
February 2, 2013As at
January 28, 2012
Cash $ 47.6 $ 49.0Cash equivalents
Government treasury bills 159.9 199.9Bank term deposits — 121.0Investment accounts 20.5 20.3
Restricted cash and cash equivalents 9.0 7.2Total cash and cash equivalents $ 237.0 $ 397.4
The components of restricted cash and cash equivalents are further discussed in Note 21.
Interest income
Interest income related primarily to cash and cash equivalents for the fiscal year ended February 2, 2013 totaled $4.1 million (2011: $1.7 million ). During Fiscal 2012, the Company received $2.3 million (2011: $1.6 million ) in cash related to interest income.
6. Accounts receivable, net
The components of accounts receivable, net were as follows:
(in CAD millions)As at
February 2, 2013As at
January 28, 2012
Deferred receivables $ 0.9 $ 1.3Other receivables 75.3 114.9Total accounts receivable, net $ 76.2 $ 116.2
Other receivables primarily consist of amounts due from customers, amounts due from vendors and amounts due from JPMorgan Chase, as part of the Company's long-term credit card marketing and servicing alliance.

70
Included in the accounts receivable balances above are amounts that are past due but are not provided for, as the Company considers the balances to be collectible. These past due accounts receivable balances are listed below:
(in CAD millions)As at
February 2, 2013As at
January 28, 2012
Greater than 30 days $ 5.5 $ 3.2Greater than 60 days 2.9 3.5Greater than 90 days 6.8 6.4Total $ 15.2 $ 13.1
7. Inventories
The amount of inventory recognized as an expense during Fiscal 2012 was $2,537.5 million (2011: $2,703.5 million), which includes $92.7 million (2011: $115.4 million) of inventory write-downs. These expenses are included in “Cost of goods and services sold” in the Consolidated Statements of Net Earnings (Loss) and Comprehensive Income (Loss).
Inventory is pledged as collateral under the Company’s revolving credit facility.
8. Prepaid expenses
The components of prepaid expenses were as follows:
(in CAD millions)As at
February 2, 2013As at
January 28, 2012
Rent $ 13.1 $ 14.2Contracts 7.9 5.2Advertising raw materials 1.7 1.5Supplies 3.1 3.6Insurance 0.4 0.3Miscellaneous 3.9 3.1Total prepaid expenses $ 30.1 $ 27.9

71
9. Property, plant and equipment and investment property
The following is a continuity of property, plant and equipment:
(in CAD millions) Land
Buildings andLeasehold
Improvements
FinanceLease
Buildings
FinanceLease
Equipment
Equipmentand
Fixtures TotalCost or deemed costBalance at January 29, 2011 $ 231.0 $ 1,125.8 $ 37.5 $ — $ 1,151.5 $ 2,545.8
Additions — 31.1 — 3.5 45.1 79.7Disposals — (4.8) — — (17.8) (22.6)
Balance at January 28, 2012 $ 231.0 $ 1,152.1 $ 37.5 $ 3.5 $ 1,178.8 $ 2,602.9Additions — 29.8 11.7 — 40.6 82.1Disposals — (32.2) (3.5) — (45.0) (80.7)
Balance at February 2, 2013 $ 231.0 $ 1,149.7 $ 45.7 $ 3.5 $ 1,174.4 $ 2,604.3
Accumulated depreciation andimpairmentBalance at January 29, 2011 $ — $ 656.4 $ 6.5 $ — $ 982.2 $ 1,645.1
Depreciation expense 1 — 51.0 5.5 1.0 49.3 106.8Disposals — (3.8) — — (17.2) (21.0)
Balance at January 28, 2012 $ — $ 703.6 $ 12.0 $ 1.0 $ 1,014.3 $ 1,730.9Depreciation expense 1 — 49.2 5.3 1.0 47.4 102.9Disposals — (25.7) (3.5) — (40.1) (69.3)
Impairment losses (reversals) 1 $ — $ 0.5 $ — $ — $ (0.7) $ (0.2)Balance at February 2, 2013 $ — $ 727.6 $ 13.8 $ 2.0 $ 1,020.9 $ 1,764.3
Total property, plant and equipment
Net Balance at February 2, 2013 $ 231.0 $ 422.1 $ 31.9 $ 1.5 $ 153.5 $ 840.0Net Balance at January 28, 2012 $ 231.0 $ 448.5 $ 25.5 $ 2.5 $ 164.5 $ 872.0
1 Depreciation expense and impairment losses are included in “Selling, administrative and other expenses” in the Consolidated Statements of Net Earnings (Loss) and Comprehensive Income (Loss) .
Impairment loss
The Company engaged independent qualified third party appraisers to conduct appraisals of its land and building properties. The valuation methods used to determine fair value include the direct capitalization and discounted cash flow methods for buildings and the direct sales comparison for land.
During Fiscal 2012, the Company recognized an impairment loss of $1.9M on the Montreal distribution centre (2011: Nil). The impairment loss is due to the application of a lower market rent rate in the valuation model in comparison to the prior year. The impairment loss of $1.9M is included in “Selling, administrative and other expenses” in the Consolidated Statements of Net Earnings (Loss) and Comprehensive Income (Loss) .
During Fiscal 2012, the Company recorded an impairment loss reversal relating to leasehold improvements (net of accumulated amortization) of $2.1 million in "Selling, administrative and other expenses". The impairment loss reversal was a result of the proceeds received from the agreement to surrender and terminate early the operating lease on its Deerfoot (Calgary) Full-line store. The Company did not record any reversals of previously recorded impairment losses during Fiscal 2011.
Investment property
Investment property owned by the Company represents vacant land with no operating activity. During Fiscal 2012, there were no investment property additions, disposals or impairment losses. As at February 2, 2013, the carrying value and fair value of investment property were $21.7 million and $25.4 million, respectively (January 28, 2012: $21.7 million and $23.2 million).

72
10. Goodwill and intangible assets
10.1 Allocation of goodwill to cash generating units
Goodwill has been allocated for impairment testing purposes to the following CGUs:• Corbeil• Home Improvement Product Services
The following is a continuity of goodwill, as allocated by CGU:
(in CAD millions) 2012 2011
Corbeil Balance, beginning of fiscal year $ 2.6 $ 2.6Balance, end of fiscal year $ 2.6 $ 2.6
Home Improvement Product ServicesBalance, beginning of fiscal year $ 6.1 $ 8.6Impairment losses — (2.5)Balance, end of fiscal year $ 6.1 $ 6.1
Total goodwill $ 8.7 $ 8.7
In the assessment of impairment, management used historical data and past experience as the key assumptions in the determination of the recoverable amount. The Company completed a test for goodwill impairment on an annual basis in Fiscal 2012 and Fiscal 2011.
The Company has made certain assumptions for the discount and terminal growth rates to reflect variations in expected future cash flows. These assumptions may differ or change quickly depending on economic conditions or other events. Therefore, it is possible that future changes in assumptions may negatively impact future valuations of CGU's and goodwill, which would result in further impairment losses.
• Corbeil
The recoverable amount of this CGU is determined based on its estimated fair value less costs to sell. The fair value was determined based on the present value of the estimated cash flow over a 10 year period and a terminal value equivalent to the present value of 5 times after-tax cash flow representing the value of the business beyond the 10 year cash flow projection. Cost to sell was estimated to be 2% of the fair value, which reflects management’s best estimate of the potential costs associated with divesting of the businesses considered. A discount rate of 10.2% was applied to the cash flow projections based on management’s best estimate of the CGU’s weighted average cost of capital considering the risks facing the CGU. Annual growth rates of 5% for the first 5 years and 2% for the subsequent 5 years were used for Corbeil given the businesses’ historical growth experience and anticipated growth. The recoverable amount was determined to be greater than the carrying value including the goodwill allocated to the Corbeil CGU, therefore, no impairment was identified in Fiscal 2012 (2011: Nil).
• Home Improvement Product Services
The recoverable amount of this CGU is determined based on its estimated fair value less costs to sell. The fair value was determined based on the present value of the estimated cash flow over a 10 year period. Cost to sell was estimated to be 2% of the fair value of the business. This reflects management’s best estimate of the potential costs associated with divesting of the business. A discount rate of 12% per annum was used, based on management’s best estimate of the CGU’s weighted average cost of capital considering the risks facing the CGU. The cash flow projection is based on management's best estimate given the new strategic relationship with SHS Services Management Inc. to commence in Fiscal 2013. For additional information, please see Note 34. The recoverable amount was determined to be greater than the carrying value including the goodwill allocated to the Home Improvement Product Services CGU, therefore, no impairment was identified in Fiscal 2012 (2011: $2.5 million).

73
10.2 Intangible assets
The following is a continuity of intangible assets:
(in CAD millions)Application
SoftwareInformation
System Software Total
Cost or deemed costBalance at January 29, 2011 $ 20.0 $ 124.6 $ 144.6
Additions 6.8 1.5 8.3Disposals — (0.1) (0.1)
Balance at January 28, 2012 $ 26.8 $ 126.0 $ 152.8Additions 8.1 5.8 13.9Disposals — (0.4) (0.4)
Balance at February 2, 2013 $ 34.9 $ 131.4 $ 166.3Accumulated amortizationBalance at January 29, 2011 $ 10.2 $ 110.9 $ 121.1
Amortization expense 1 3.7 4.4 8.1Balance at January 28, 2012 $ 13.9 $ 115.3 $ 129.2
Amortization expense 1 5.1 5.3 10.4Disposals — (0.5) (0.5)
Balance at February 2, 2013 $ 19.0 $ 120.1 $ 139.1Total intangible assetsNet Balance at February 2, 2013 $ 15.9 $ 11.3 $ 27.2Net Balance at January 28, 2012 $ 12.9 $ 10.7 $ 23.6
1 Amortization expense and impairment losses are included in “Selling, administrative and other expenses” in the Consolidated Statements of Net Earnings (Loss) and Comprehensive Income (Loss) . No impairment losses were recognized on intangible assets for both Fiscal 2012 and Fiscal 2011.
11. Investment in joint ventures
The Company’s investment in joint ventures includes its share of income or losses from its joint venture interests in 11 shopping centres across Canada, most of which contain a Sears store. Joint venture investments range from 15% to 50% and are co-owned with Westcliff Group and Ivanhoe Cambridge Properties. The jointly controlled entities and Sears ownership interest in each as at February 2, 2013 are listed below:
Entity Name Properties Joint Venture Partner Ownership
InterestCarrefour Richelieu Realties (St-Jérôme) Carrefour Richelieu Westcliff Group 50%Carrefour Richelieu Realties (St-Jean) Carrefour du Nord Westcliff Group 50%Carrefour Richelieu Realties (Carrefour Angrignon) Carrefour Angrignon Westcliff Group 50%Carrefour Richelieu Realties (Place Angrignon) Place Angrignon Westcliff Group 50%Carrefour Richelieu Realties (Pierre Caisse) Place Pierre Caisse Westcliff Group 50%Carrefour Richelieu Realties (Drummondville) Promenades de Drummondville Westcliff Group 50%Méga-Centre Drummondville Mega Centre Drummondville Westcliff Group 50%Société de Gestion des Neiges Ville- Marie Various land holdings in Quebec, Canada Westcliff Group 50%133562 Canada Inc. Various land holdings in Quebec, Canada Westcliff Group 50%172098 Canada Inc. Drummondville Stripmall Westcliff Group 50%Kildonan Place Kildonan Place Ivanhoe Cambridge 20%Regionaux (Les Rivières Shopping Centre) Les Rivieres Shopping Centre Ivanhoe Cambridge 15%Regionaux (Les Galeries de Hull) Les Galeries de Hull Ivanhoe Cambridge 15%
During the fourth quarter of 2012, the Company sold its interest in Medicine Hat Mall for net proceeds of $38.3 million, recognizing a pre-tax gain of $8.6 million on the sale. During the third quarter of 2011, the Company sold its share of assets in Chatham Centre for net proceeds of $1.6 million, recognizing a pre-tax gain of $0.1 million on the sale.

74
The following represents the Company’s share of investments in the assets and liabilities, revenues and expenses of the joint ventures:
(in CAD millions)As at
February 2, 2013As at
January 28, 2012
Current assets $ 3.0 $ 6.4Non-current assets 287.9 333.5Total assets $ 290.9 $ 339.9Current liabilities $ 5.8 $ 7.9Non-current liabilities 21.7 30.6Total liabilities $ 27.5 $ 38.5
Investment in joint ventures $ 263.4 $ 301.4
(in CAD millions) 2012 2011
Revenues $ 46.2 $ 48.0Expenses
Administrative and other expenses 19.8 23.3Impairment loss 2.2 —Finance costs 1.5 2.0Tax expense — 0.1Depreciation expense 13.2 14.3
Share of income from joint ventures $ 9.5 $ 8.3
Impairment loss
The Company engaged independent qualified third-party appraisers to conduct appraisals of its land and building properties. The valuation methods used to determine fair value include the direct capitalization and discounted cash flow methods for buildings and the direct sales comparison for land.
During Fiscal 2012, the Company recognized an impairment loss of $2.2 million on the Promenades de Drummondville property (2011: Nil). The fair value of these assets were determined based on an independent, qualified third-party appraisal. The impairment loss of $2.2 million is included in “Share of income from joint ventures” in the Consolidated Statements of Net Earnings (Loss) and Comprehensive Income (Loss).
12. Other long-term assets
The components of other long-term assets were as follows:
(in CAD millions)As at
February 2, 2013As at
January 28, 2012
Income taxes recoverable $ 13.9 $ 30.3Prepaid rent 9.4 11.0Receivables 3.3 6.6Investments 1.3 1.3Unamortized debt transaction costs 6.2 —Other long-term assets $ 34.1 $ 49.2
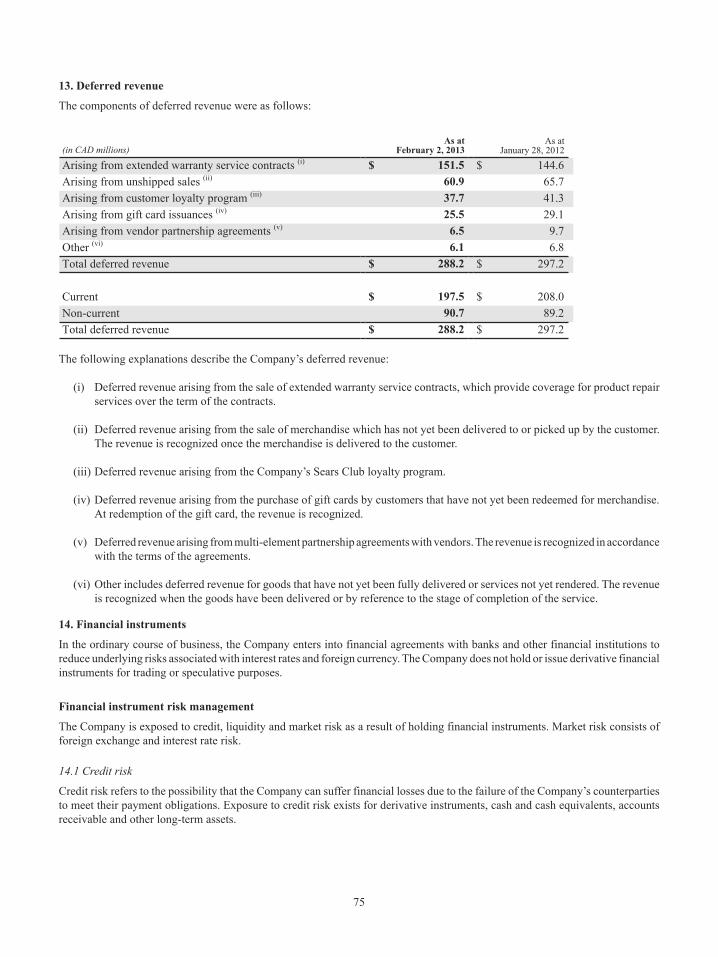
75
13. Deferred revenue
The components of deferred revenue were as follows:
(in CAD millions)As at
February 2, 2013As at
January 28, 2012
Arising from extended warranty service contracts (i) $ 151.5 $ 144.6Arising from unshipped sales (ii) 60.9 65.7Arising from customer loyalty program (iii) 37.7 41.3Arising from gift card issuances (iv) 25.5 29.1Arising from vendor partnership agreements (v) 6.5 9.7Other (vi) 6.1 6.8Total deferred revenue $ 288.2 $ 297.2
Current $ 197.5 $ 208.0Non-current 90.7 89.2Total deferred revenue $ 288.2 $ 297.2
The following explanations describe the Company’s deferred revenue:
(i) Deferred revenue arising from the sale of extended warranty service contracts, which provide coverage for product repair services over the term of the contracts.
(ii) Deferred revenue arising from the sale of merchandise which has not yet been delivered to or picked up by the customer. The revenue is recognized once the merchandise is delivered to the customer.
(iii) Deferred revenue arising from the Company’s Sears Club loyalty program.
(iv) Deferred revenue arising from the purchase of gift cards by customers that have not yet been redeemed for merchandise. At redemption of the gift card, the revenue is recognized.
(v) Deferred revenue arising from multi-element partnership agreements with vendors. The revenue is recognized in accordance with the terms of the agreements.
(vi) Other includes deferred revenue for goods that have not yet been fully delivered or services not yet rendered. The revenue is recognized when the goods have been delivered or by reference to the stage of completion of the service.
14. Financial instruments
In the ordinary course of business, the Company enters into financial agreements with banks and other financial institutions to reduce underlying risks associated with interest rates and foreign currency. The Company does not hold or issue derivative financial instruments for trading or speculative purposes.
Financial instrument risk management
The Company is exposed to credit, liquidity and market risk as a result of holding financial instruments. Market risk consists of foreign exchange and interest rate risk.
14.1 Credit risk
Credit risk refers to the possibility that the Company can suffer financial losses due to the failure of the Company’s counterparties to meet their payment obligations. Exposure to credit risk exists for derivative instruments, cash and cash equivalents, accounts receivable and other long-term assets.
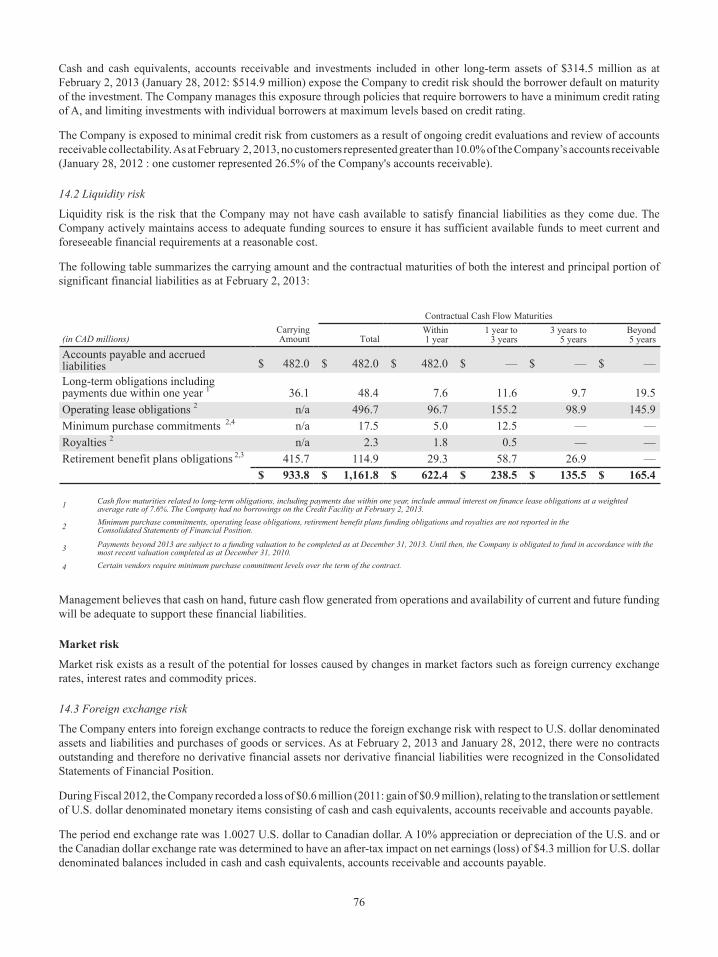
76
Cash and cash equivalents, accounts receivable and investments included in other long-term assets of $314.5 million as at February 2, 2013 (January 28, 2012: $514.9 million) expose the Company to credit risk should the borrower default on maturity of the investment. The Company manages this exposure through policies that require borrowers to have a minimum credit rating of A, and limiting investments with individual borrowers at maximum levels based on credit rating.
The Company is exposed to minimal credit risk from customers as a result of ongoing credit evaluations and review of accounts receivable collectability. As at February 2, 2013, no customers represented greater than 10.0% of the Company’s accounts receivable (January 28, 2012 : one customer represented 26.5% of the Company's accounts receivable).
14.2 Liquidity risk
Liquidity risk is the risk that the Company may not have cash available to satisfy financial liabilities as they come due. The Company actively maintains access to adequate funding sources to ensure it has sufficient available funds to meet current and foreseeable financial requirements at a reasonable cost.
The following table summarizes the carrying amount and the contractual maturities of both the interest and principal portion of significant financial liabilities as at February 2, 2013:
(in CAD millions)CarryingAmount
Contractual Cash Flow Maturities
TotalWithin1 year
1 year to3 years
3 years to5 years
Beyond5 years
Accounts payable and accruedliabilities $ 482.0 $ 482.0 $ 482.0 $ — $ — $ —Long-term obligations including payments due within one year 1 36.1 48.4 7.6 11.6 9.7 19.5Operating lease obligations 2 n/a 496.7 96.7 155.2 98.9 145.9Minimum purchase commitments 2,4 n/a 17.5 5.0 12.5 — —Royalties 2 n/a 2.3 1.8 0.5 — —Retirement benefit plans obligations 2,3 415.7 114.9 29.3 58.7 26.9 —
$ 933.8 $ 1,161.8 $ 622.4 $ 238.5 $ 135.5 $ 165.4
1 Cash flow maturities related to long-term obligations, including payments due within one year, include annual interest on finance lease obligations at a weighted average rate of 7.6%. The Company had no borrowings on the Credit Facility at February 2, 2013.
2 Minimum purchase commitments, operating lease obligations, retirement benefit plans funding obligations and royalties are not reported in the Consolidated Statements of Financial Position.
3 Payments beyond 2013 are subject to a funding valuation to be completed as at December 31, 2013. Until then, the Company is obligated to fund in accordance with themost recent valuation completed as at December 31, 2010.
4 Certain vendors require minimum purchase commitment levels over the term of the contract.
Management believes that cash on hand, future cash flow generated from operations and availability of current and future funding will be adequate to support these financial liabilities.
Market risk
Market risk exists as a result of the potential for losses caused by changes in market factors such as foreign currency exchange rates, interest rates and commodity prices.
14.3 Foreign exchange risk
The Company enters into foreign exchange contracts to reduce the foreign exchange risk with respect to U.S. dollar denominated assets and liabilities and purchases of goods or services. As at February 2, 2013 and January 28, 2012, there were no contracts outstanding and therefore no derivative financial assets nor derivative financial liabilities were recognized in the Consolidated Statements of Financial Position.
During Fiscal 2012, the Company recorded a loss of $0.6 million (2011: gain of $0.9 million), relating to the translation or settlement of U.S. dollar denominated monetary items consisting of cash and cash equivalents, accounts receivable and accounts payable.
The period end exchange rate was 1.0027 U.S. dollar to Canadian dollar. A 10% appreciation or depreciation of the U.S. and or the Canadian dollar exchange rate was determined to have an after-tax impact on net earnings (loss) of $4.3 million for U.S. dollar denominated balances included in cash and cash equivalents, accounts receivable and accounts payable.

77
14.4 Interest rate risk
From time to time, the Company enters into interest rate swap contracts with approved financial institutions to manage exposure to interest rate risks. As at February 2, 2013, the Company had no interest rate swap contracts in place (January 28, 2012: nil).
Interest rate risk reflects the sensitivity of the Company’s financial condition to movements in interest rates. Financial assets and liabilities which do not bear interest or bear interest at fixed rates are classified as non-interest rate sensitive.
Cash and cash equivalents and borrowings under the secured revolving credit facility are subject to interest rate risk. The total subject to interest rate risk as at February 2, 2013 was a net asset of $238.3 million (January 28, 2012: net asset of $297.7 million). An increase or decrease in interest rates of 0.25% would cause an immaterial after-tax impact on net (loss) earnings.
14.5 Classification and fair value of financial instruments
The estimated fair values of financial instruments presented are based on relevant market prices and information available at those dates. The following table summarizes the classification and fair value of certain financial instruments as at the specified dates. The Company determines the classification of a financial instrument when it is initially recorded, based on the underlying purpose of the instrument. As a significant number of the Company’s assets and liabilities, including inventories and capital assets, do not meet the definition of financial instruments, values in the tables below do not reflect the fair value of the Company as a whole.
The fair value of financial instruments are classified and measured according to the following three levels, based on the fair value hierarchy.
• Level 1: Quoted prices in active markets for identical assets or liabilities• Level 2: Inputs other than quoted prices in active markets that are observable for the asset or liability either directly (i.e.
as prices) or indirectly (i.e. derived from prices)• Level 3: Inputs for the asset or liability that are not based on observable market data
(in CAD millions)
Classification Balance Sheet CategoryFair ValueHierarchy1
As atFebruary 2, 2013
As atJanuary 28, 2012
Available for sale
Cash equivalents Cash and cash equivalents1 Level 1 159.9 199.9
Cash equivalents Cash and cash equivalents1 Level 2 20.5 20.3
Fair value through profit or loss
Long-term investments Other long-term assets Level 3 1.3 1.3
1 Interest income related to cash and cash equivalents is disclosed in Note 5.
All other assets that are financial instruments not listed in the chart above have been classified as “Loans and receivables”. All other financial instrument liabilities have been classified as “Other liabilities” and are measured at amortized cost in the Consolidated Statements of Financial Position. The carrying value of these financial instruments approximate fair value given that they are short-term in nature.

78
15. Accounts payable and accrued liabilities
The components of “Accounts payable and accrued liabilities” as included in the Consolidated Statements of Financial Position were as follows:
(in CAD millions)As at
February 2, 2013As at
January 28, 2012
Total accounts payable $ 305.7 $ 401.9
Payroll and employee benefits 29.1 28.7Merchandise accruals 71.0 45.3Short-term leasehold inducements 9.8 8.4Advertising accruals 12.4 12.7Other accrued liabilities 54.0 79.8
Total accrued liabilities $ 176.3 $ 174.9
Total accounts payable and accrued liabilities $ 482.0 $ 576.8
16. Provisions
The following is a continuity which shows the change in provisions during Fiscal 2012 and Fiscal 2011:
(in CAD millions)As at
January 28, 2012AdditionalProvisions
Release ofProvisions
ReversedProvisions
As atFebruary 2, 2013
Insurance (i) $ 19.4 $ 0.2 $ (1.3) $ — $ 18.3Returns and allowances (ii) 12.2 9.8 (9.0) — 13.0Warranties (iii) 11.0 0.3 (0.2) (0.1) 11.0Sales tax (iv) 1.6 2.5 (0.3) (1.4) 2.4Severance (v) 13.5 19.3 (16.0) (2.1) 14.7Environmental (vi) 4.6 2.9 (1.3) (1.4) 4.8Other provisions (vii) 3.0 1.1 (1.2) (0.4) 2.5Total provisions $ 65.3 $ 36.1 $ (29.3) $ (5.4) $ 66.7
Current $ 64.8 $ 36.1 $ (29.2) $ (5.4) $ 66.3Non-current (iii) 0.5 — (0.1) — 0.4Total provisions $ 65.3 $ 36.1 $ (29.3) $ (5.4) $ 66.7
(in CAD millions)As at
January 29, 2011AdditionalProvisions
Release ofProvisions
ReversedProvisions
As atJanuary 28, 2012
Insurance (i) $ 23.8 $ 1.4 $ (5.8) $ — $ 19.4Returns and allowances (ii) 14.3 12.2 (14.3) — 12.2Warranties (iii) 13.1 — (2.1) — 11.0Sales tax (iv) 5.4 — (3.8) — 1.6Severance (v) 2.7 12.9 (2.1) — 13.5Environmental (vi) 5.0 2.9 (2.0) (1.3) 4.6Other provisions (vii) 1.6 2.7 (1.3) — 3.0Total provisions $ 65.9 $ 32.1 $ (31.4) $ (1.3) $ 65.3
Current $ 65.3 $ 32.1 $ (31.3) $ (1.3) $ 64.8Non-current (iii) 0.6 — (0.1) — 0.5Total provisions $ 65.9 $ 32.1 $ (31.4) $ (1.3) $ 65.3

79
The following explanations describe the Company’s provisions:(i) The provision for insurance, or general liability claims, represents the Company’s best estimate of the future outflow of
economic resources due to automobile, product and other general liability claims. Insurance claims relating to this provision are expected to be paid over the next several years; however, as the Company has no unconditional right to defer the settlement past at least 12 months, this provision is considered to be current. In estimating the obligation associated with incurred losses, the Company utilizes actuarial methodologies validated by an independent third party.These actuarial methodologies utilize historical data to project future incurred losses. Loss estimates are adjusted based on reported claims and actual settlements.
(ii) The provision for returns and allowances represents the Company’s best estimate of the future outflow of economic resources due to merchandise returns and allowances. Returns and allowances relating to this provision are expected to be realized over the next 12 months. Uncertainty exists relating to the amount and timing of returns and allowances, therefore, historical data has been used to arrive at this estimate.
(iii) The provision for warranty claims represents the Company’s best estimate of the future outflow of economic resources that will be required due to the Company’s warranty obligations. Costs incurred to service warranty claims relating to this provision are expected to be paid out over the next 2 years. Uncertainty exists relating to the number of incidents requiring merchandise repair and the related costs. This provision is estimated based on historical warranty trends and costs. The amount of expected reimbursements recorded as at February 2, 2013 was $2.6 million (January 28, 2012: $2.3 million) and is reflected in “Accounts receivable, net” and “Other long-term assets” in the Consolidated Statements of Financial Position. The provision for warranty claims is comprised of both a current (claims realized within 12 months) and non-current component (claims realized between 13 and 24 months), with the balances respectively reflected in “Provisions” and “Other long-term liabilities” (see Note 18) in the Consolidated Statements of Financial Position.
(iv) The Company maintains provisions for sales tax assessments under active discussion, audit, dispute or appeal with tax authorities. These provisions represent the Company’s best estimate of the amount expected to be paid based on qualitative and quantitative assessments. Though uncertainty exists around the timing of settlement of the disputes or appeals with tax authorities, the Company expects that sales tax provisions will be settled within 4 years. However, as the Company has no unconditional right to defer the settlement of these provisions past at least 12 months, these provisions are classified as current.
(v) The provision for severance represents the Company’s best estimate of the future outflow of payments to terminated employees who have made claims. Uncertainty exists relating to the amount of severance that will be awarded in court proceedings. As the Company has no unconditional right to defer these payments past 12 months, this provision is classified as current.
(vi) The environmental provision represents the costs to remediate environmental contamination associated with decommissioning auto centres as well as the cost to remove asbestos to meet regulatory requirements. The provision is based on assessments conducted by third parties as well as historical data. Given the timing of payments to remediate is uncertain and that the Company has no unconditional right to defer these payments past at least 12 months, this provision is classified as current.
(vii) The provisions for other represent the Company’s best estimate of various reserves relating to the future outflow of economic resources due to obligations for miscellaneous claims. The estimates for these provisions have been made on the basis of information currently available to determine the obligations. These provisions are classified as current.
17. Long-term obligations and finance costs
Long-term obligations
Total outstanding long-term obligations were as follows:
(in CAD millions)As at
February 2, 2013As at
January 28, 2012
Finance lease obligations - Current 5.2 5.1Total principal payments on long-term obligations due within one year $ 5.2 $ 5.1Secured revolving credit facility, net $ — $ 93.1Finance lease obligations - Non-current 30.9 24.5Total long-term obligations $ 30.9 $ 117.6

80
The Company’s debt consists of a secured credit facility and finance lease obligations. In September 2010, the Company entered into an $800.0 million senior secured revolving credit facility (the "Credit Facility") with a syndicate of lenders with a maturity date of September 10, 2015. The Credit Facility is secured with a first lien on inventory and credit card receivables. Availability under the Credit Facility is determined pursuant to a borrowing base formula. Availability under the Credit Facility was $501.5 million as at February 2, 2013 (January 28, 2012: $415.1 million). The current availability may be reduced by reserves currently estimated by the Company to be approximately $300.0 million, which may be applied by the lenders at their discretion pursuant to the Credit Facility agreement. As a result of judicial developments relating to the priorities of pension liability relative to certain secured obligations, the Company has executed an amendment to its Credit Facility agreement which would provide additional security to the lenders, with respect to the Company's unfunded pension liability by pledging certain real estate assets as collateral, thereby partially reducing the potential reserve amount the lenders could apply by up to $150.0 million. The potential additional reserve amount may increase or decrease in the future based on estimated net pension liabilities.
The Credit Facility contains covenants which are customary for facilities of this nature and the Company was in compliance with all covenants as at February 2, 2013.
As at February 2, 2013, the Company had no borrowings on the Credit Facility and had unamortized transaction costs incurred to establish the Credit Facility of $6.2 million included in "Other long-term assets" in the Consolidated Statements of Financial Position (January 28, 2012: borrowings of $93.1 million, net of unamortized transaction costs of $8.0 million, included in "Long-term obligations"). In addition, the Company had $19.7 million (January 28, 2012: $6.3 million) of standby letters of credit outstanding against the Credit Facility. These letters of credit cover various payments including third party payments, utility commitments and defined benefit plan deficit funding (See Note 20 for additional information on Retirement benefits plans). Interest on drawings under the Credit Facility is determined based on bankers’ acceptance rates for one to three month terms or the prime rate plus a spread. Interest amounts on the Credit Facility are due monthly and are added to principal amounts outstanding.
As at February 2, 2013, the Company had outstanding merchandise letters of credit of U.S. $7.9 million (January 28, 2012: U.S. $5.5 million) used to support the Company’s offshore merchandise purchasing program with restricted cash and cash equivalents pledged as collateral.
Finance costs
Interest expense on long-term obligations, including finance lease obligations, the current portion of long-term obligations, amortization of transaction costs and commitment fees on the unused portion of the Credit Facility for Fiscal 2012 totaled $9.4 million (2011: $9.3 million). Interest expense is included in “Finance costs” in the Consolidated Statements of Net Earnings (Loss) and Comprehensive Income (Loss). Also included in "Finance costs" for Fiscal 2012, were $3.9 million (2011: $5.2 million) of interest on accruals for uncertain tax positions and nil (2011: $1.5 million) related to interest on a sales tax assessment.
The Company’s cash payments for interest on long-term obligations, including finance lease obligations, the current portion of long-term obligations and commitment fees on the unused portion of the Credit Facility for Fiscal 2012 totaled $7.7 million (2011: $6.8 million).
18. Other long-term liabilities
The components of other long-term liabilities were as follows:
(in CAD millions)As at
February 2, 2013As at
January 28, 2012
Leasehold inducements $ 67.1 $ 66.8Straight-line rent liability 5.0 6.4Miscellaneous 2.6 2.6Total other long-term liabilities $ 74.7 $ 75.8
The non-current portion of the warranties provision (see Note 16) is reflected in the miscellaneous component of “Other long-term liabilities” in the Consolidated Statements of Financial Position.

81
19. Leasing arrangements
19.1 Finance lease arrangements – Company as lessee
As at February 2, 2013, the Company had finance lease arrangements related to the building and equipment components of certain leased properties, which include retail, office and warehouse locations. The related land components of these properties have been separately classified as operating leases. The buildings and equipment held under finance leases are used in the normal course of operations and do not contain significant unusual or contingent lease terms or restrictions. Building leases typically run for a period of 1 to 10 years, with some leases providing an option to renew after that date. Equipment leases typically run for a period of 1 to 5 years, with some leases providing an option to renew after that date.
Finance lease buildings and equipment are included in the Consolidated Statements of Financial Position under “Property, plant and equipment.” Note 9 provides further details on the net carrying value of these assets, which as at February 2, 2013 was $33.4 million (January 28, 2012: $28.0 million).
As at February 2, 2013, the corresponding finance lease obligations, current and non-current, were $5.2 million (January 28, 2012: $5.1 million) and $30.9 million (January 28, 2012: $24.5 million), included in the Consolidated Statements of Financial Position under “Principal payments on long-term obligations due within one year” and “Long-term obligations,” respectively (see Note 17).
The table below presents the future minimum lease payments of the Company’s finance lease obligations:
As at
February 2, 2013As at
January 28, 2012
(in CAD millions)
Financelease
payments
Futurefinance
costs
Present value ofminimum lease
payments
Financelease
payments
Futurefinance
costs
Present value ofminimum lease
payments
Within 1 year $ 7.6 $ 2.4 $ 5.2 $ 7.0 $ 1.9 $ 5.12 years 6.5 2.1 4.4 6.0 1.5 4.53 years 5.1 1.9 3.2 4.8 1.2 3.64 years 4.8 1.6 3.2 3.3 1.1 2.25 years 4.9 1.4 3.5 3.1 0.9 2.2Thereafter 19.5 2.9 16.6 14.2 2.2 12.0Total minimum payments $ 48.4 $ 12.3 $ 36.1 $ 38.4 $ 8.8 $ 29.6
Interest on finance lease obligations is recognized immediately in “Finance costs” in the Consolidated Statements of Net Earnings (Loss) and Comprehensive Income (Loss) (see Note 17). Included in total “Finance costs” in Fiscal 2012, was $2.4 million (2011: $2.2 million) of interest related to finance lease obligations.
19.2 Operating lease arrangements – Company as lessor
The Company has a number of agreements to sub-lease premises to third parties, which are all classified as operating leases. During Fiscal 2012, total sub-lease income from leased premises was $3.0 million (2011: $2.8 million).
As at February 2, 2013, total future minimum lease payments receivable from third party tenants were $10.3 million (2011: $9.7 million).
19.3 Operating lease arrangements – Company as lessee
As at February 2, 2013, the Company had operating lease arrangements related to leased retail and office properties as well as equipment assets. The leases typically run for a period of 1 to 10 years, with some leases providing an option to renew after that date. Some leases include additional or contingent rent payments that are based on sales and step rent payments which are recognized on a straight-line basis over the term of the lease. During Fiscal 2012, contingent rent recognized as an expense in respect of operating leases totaled $0.9 million (2011: $0.9 million). Rental expense for all operating leases totaled $105.6 million in Fiscal 2012 (2011: $103.4 million). These expenses are included in “Selling, administrative and other expenses” in the Consolidated Statements of Net Earnings (Loss) and Comprehensive Income (Loss).

82
The table below presents the contractual maturities of future minimum lease payments for the Company’s operating leases:
(in CAD millions)As at
February 2, 2013As at
January 28, 2012
Within 1 year $ 96.7 $ 102.72 years 85.1 86.23 years 70.1 66.84 years 52.9 55.95 years 46.0 42.1Thereafter 145.9 156.4Total operating lease obligations 1 $ 496.7 $ 510.1
1 Operating lease obligations are not reported in the Consolidated Statements of Financial Position
20. Retirement benefit plans
The Company currently maintains a defined benefit registered pension plan and a defined contribution registered pension plan which covers eligible, regular full-time associates as well as some of its part-time associates. The defined benefit plan provides pensions based on length of service and final average earnings. In addition to a registered retirement savings plan, the pension plan includes a non-registered supplemental savings arrangement in respect to the defined benefit plan. The non-registered portion of the plan is maintained to enable certain associates to continue saving for retirement in addition to the registered limit as prescribed by the Canada Revenue Agency. The Company also maintains a defined benefit non-pension post retirement plan which provides life insurance, medical and dental benefits to eligible retired associates through a health and welfare trust (“Other Benefits Plan”). Also provided for under the health and welfare trust are short-term disability payments for active associates. The Company’s accounting policies related to retirement benefit plans are described in Note 2.15.
In July 2008, the Company amended its pension plan and introduced a defined contribution component. The defined benefit component continues to accrue benefits related to future compensation increases although no further service credit is earned. In addition, the Company no longer provides medical, dental and life insurance benefits at retirement for associates who had not achieved the eligibility criteria for these non-pension post retirement benefits as at December 31, 2008. Effective December 2009, the Company made the decision to change funding for non pension post retirement benefits from an actuarial basis to a pay-as-you-go basis to allow the surplus in the health and welfare trust to be utilized to make benefit payments. In addition, to further utilize the surplus, short-term disability payments of eligible associates are paid on a pay-as-you-go basis from the health and welfare trust and are no longer funded by the Company.
In the fourth quarter of 2012, the Company made a voluntary offer to settle health and dental benefits of eligible members covered under the non-pension post retirement plan. Based on the accepted offers, the Company paid $18.1 million and recorded a pre-tax settlement gain of $21.1 million ($21.9 million net of $0.8 million of expenses), as shown on the Consolidated Statements of Net Earnings (Loss) and Comprehensive Income (Loss).
The Company early adopted the amendments to IAS 19 beginning January 29, 2012, with retrospective application to prior reporting periods. A description of the nature of the change in accounting policy and a summary of its impact to the Company’s consolidated financial statements are included in Note 2.
Risks associated with retirement benefit plans
There is no assurance that the Company’s retirement benefit plans will be able to earn the assumed rate of return. New regulations and market driven changes may result in changes in the discount rates and other variables which would result in the Company being required to make contributions in the future that differ significantly from the estimates. Management is required to use assumptions to account for the plans in conformity with IFRS. However, actual future experience will differ from these assumptions giving rise to actuarial gains or losses. In any year, actual experience differing from the assumptions may be material.
Plan assets consist primarily of cash, alternative investments and marketable equity and fixed income securities. The value of the marketable equity and fixed income investments will fluctuate due to changes in market prices. Plan obligations and annual pension expense are determined by independent actuaries and through the use of a number of assumptions. Although the Company believes that the assumptions used in the actuarial valuation process are reasonable, there remains a degree of risk and uncertainty which may cause results to differ from expectations. Significant assumptions in measuring the benefit obligations and pension plan costs include the discount rate and the rate of compensation increase.
83
Asset-liability matching strategies
Beginning in Fiscal 2011, the Company adopted an asset-liability matching strategy in the Other Benefits Plan wherein assets are invested in accordance with a short-term fixed income mandate. The current portfolio is primarily bonds with maturities not exceeding two years. This investment strategy is aligned with the expected use of the assets, which is to fund the Company’s retiree health benefits and short-term disability payments within the next two years.
Plan amendments, curtailments and settlements
In Fiscal 2012, the Company amended the non-registered supplemental savings arrangement in respect to the defined benefit plan to allow the use of letters of credit to satisfy the funding requirement of its deficit. At February 2, 2013 a letter of credit with a notional value of $4.6 million was on deposit with the Trustee for the non-registered portion of the defined benefit plan.
In January 2013, the Company announced the termination of 700 associates. This event did not require the recording of a curtailment as its impact on the pension plan was not significant.
Maturity profile of retirement benefit plan obligations
The weighted average durations of the Registered Retirement Plans, Non-registered Pension Plan and Other Benefit Plan are all approximately 11 years.
The Company’s contractual cash flow maturity relating to retirement benefit plan obligation payments is included under “Liquidity Risk” in Note 14.
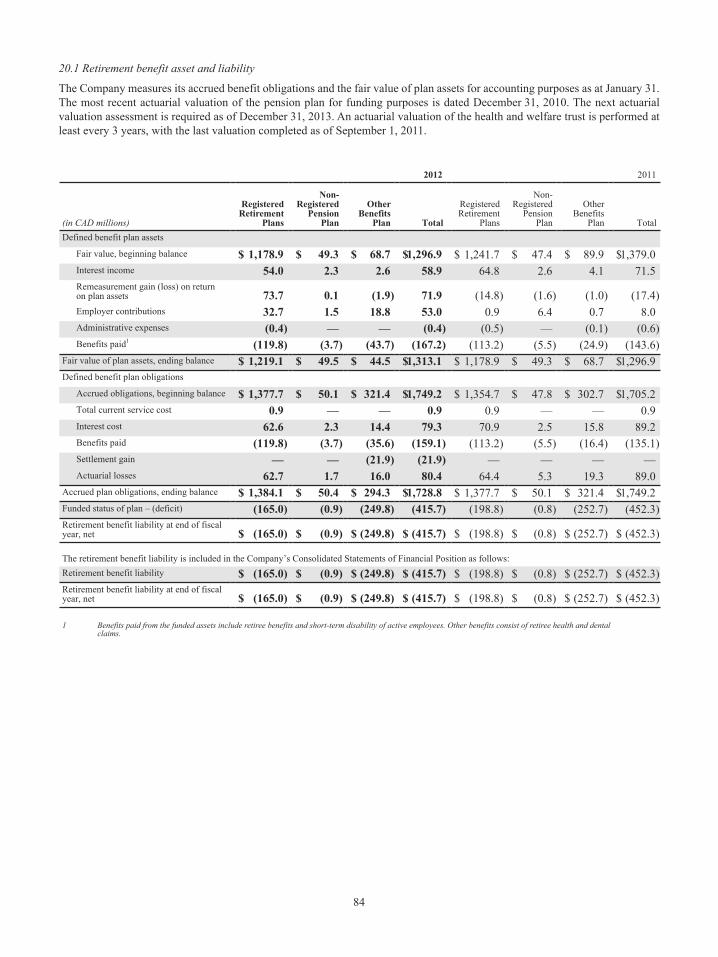
84
20.1 Retirement benefit asset and liability
The Company measures its accrued benefit obligations and the fair value of plan assets for accounting purposes as at January 31. The most recent actuarial valuation of the pension plan for funding purposes is dated December 31, 2010. The next actuarial valuation assessment is required as of December 31, 2013. An actuarial valuation of the health and welfare trust is performed at least every 3 years, with the last valuation completed as of September 1, 2011.
2012 2011
(in CAD millions)
RegisteredRetirement
Plans
Non-Registered
PensionPlan
OtherBenefits
Plan Total
RegisteredRetirement
Plans
Non-Registered
PensionPlan
OtherBenefits
Plan TotalDefined benefit plan assets
Fair value, beginning balance $ 1,178.9 $ 49.3 $ 68.7 $1,296.9 $ 1,241.7 $ 47.4 $ 89.9 $1,379.0Interest income 54.0 2.3 2.6 58.9 64.8 2.6 4.1 71.5Remeasurement gain (loss) on return on plan assets 73.7 0.1 (1.9) 71.9 (14.8) (1.6) (1.0) (17.4)Employer contributions 32.7 1.5 18.8 53.0 0.9 6.4 0.7 8.0Administrative expenses (0.4) — — (0.4) (0.5) — (0.1) (0.6)Benefits paid1 (119.8) (3.7) (43.7) (167.2) (113.2) (5.5) (24.9) (143.6)
Fair value of plan assets, ending balance $ 1,219.1 $ 49.5 $ 44.5 $1,313.1 $ 1,178.9 $ 49.3 $ 68.7 $1,296.9Defined benefit plan obligations
Accrued obligations, beginning balance $ 1,377.7 $ 50.1 $ 321.4 $1,749.2 $ 1,354.7 $ 47.8 $ 302.7 $1,705.2Total current service cost 0.9 — — 0.9 0.9 — — 0.9Interest cost 62.6 2.3 14.4 79.3 70.9 2.5 15.8 89.2Benefits paid (119.8) (3.7) (35.6) (159.1) (113.2) (5.5) (16.4) (135.1)Settlement gain — — (21.9) (21.9) — — — —Actuarial losses 62.7 1.7 16.0 80.4 64.4 5.3 19.3 89.0
Accrued plan obligations, ending balance $ 1,384.1 $ 50.4 $ 294.3 $1,728.8 $ 1,377.7 $ 50.1 $ 321.4 $1,749.2Funded status of plan – (deficit) (165.0) (0.9) (249.8) (415.7) (198.8) (0.8) (252.7) (452.3)Retirement benefit liability at end of fiscalyear, net $ (165.0) $ (0.9) $ (249.8) $ (415.7) $ (198.8) $ (0.8) $ (252.7) $ (452.3)
The retirement benefit liability is included in the Company’s Consolidated Statements of Financial Position as follows:Retirement benefit liability $ (165.0) $ (0.9) $ (249.8) $ (415.7) $ (198.8) $ (0.8) $ (252.7) $ (452.3)Retirement benefit liability at end of fiscalyear, net $ (165.0) $ (0.9) $ (249.8) $ (415.7) $ (198.8) $ (0.8) $ (252.7) $ (452.3)
1 Benefits paid from the funded assets include retiree benefits and short-term disability of active employees. Other benefits consist of retiree health and dental claims.
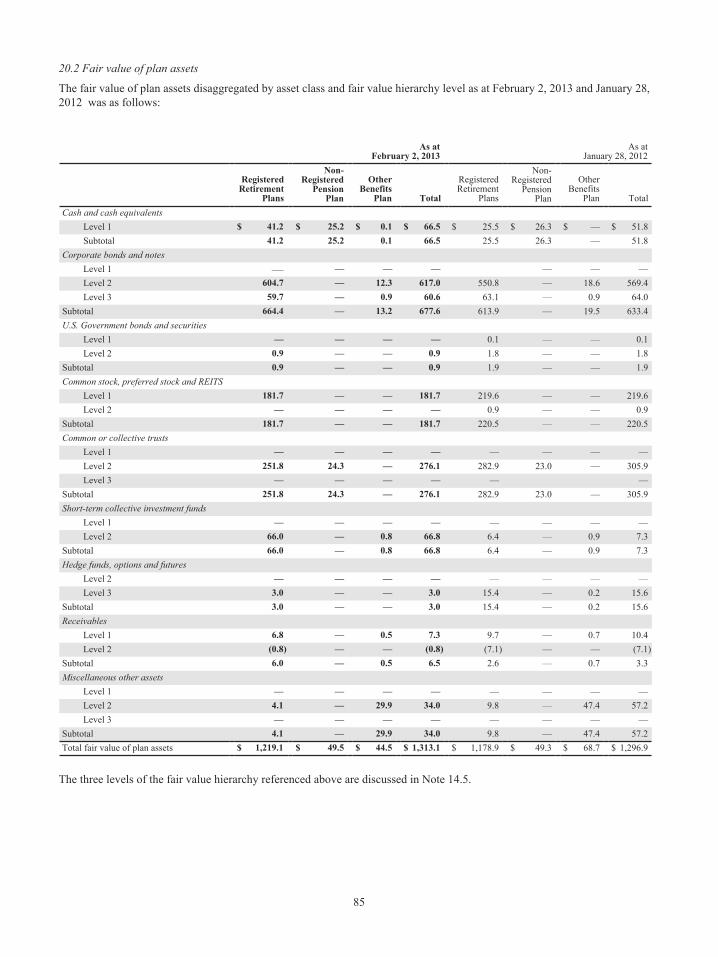
85
20.2 Fair value of plan assets
The fair value of plan assets disaggregated by asset class and fair value hierarchy level as at February 2, 2013 and January 28, 2012 was as follows:
As at
February 2, 2013As at
January 28, 2012
Registered
RetirementPlans
Non-Registered
PensionPlan
OtherBenefits
Plan Total
RegisteredRetirement
Plans
Non-Registered
PensionPlan
OtherBenefits
Plan TotalCash and cash equivalents
Level 1 $ 41.2 $ 25.2 $ 0.1 $ 66.5 $ 25.5 $ 26.3 $ — $ 51.8Subtotal 41.2 25.2 0.1 66.5 25.5 26.3 — 51.8
Corporate bonds and notesLevel 1 — — — — — — —Level 2 604.7 — 12.3 617.0 550.8 — 18.6 569.4Level 3 59.7 — 0.9 60.6 63.1 — 0.9 64.0
Subtotal 664.4 — 13.2 677.6 613.9 — 19.5 633.4U.S. Government bonds and securities
Level 1 — — — — 0.1 — — 0.1Level 2 0.9 — — 0.9 1.8 — — 1.8
Subtotal 0.9 — — 0.9 1.9 — — 1.9Common stock, preferred stock and REITS
Level 1 181.7 — — 181.7 219.6 — — 219.6Level 2 — — — — 0.9 — — 0.9
Subtotal 181.7 — — 181.7 220.5 — — 220.5Common or collective trusts
Level 1 — — — — — — — —Level 2 251.8 24.3 — 276.1 282.9 23.0 — 305.9Level 3 — — — — — —
Subtotal 251.8 24.3 — 276.1 282.9 23.0 — 305.9Short-term collective investment funds
Level 1 — — — — — — — —Level 2 66.0 — 0.8 66.8 6.4 — 0.9 7.3
Subtotal 66.0 — 0.8 66.8 6.4 — 0.9 7.3Hedge funds, options and futures
Level 2 — — — — — — — —Level 3 3.0 — — 3.0 15.4 — 0.2 15.6
Subtotal 3.0 — — 3.0 15.4 — 0.2 15.6Receivables
Level 1 6.8 — 0.5 7.3 9.7 — 0.7 10.4Level 2 (0.8) — — (0.8) (7.1) — — (7.1)
Subtotal 6.0 — 0.5 6.5 2.6 — 0.7 3.3Miscellaneous other assets
Level 1 — — — — — — — —Level 2 4.1 — 29.9 34.0 9.8 — 47.4 57.2Level 3 — — — — — — — —
Subtotal 4.1 — 29.9 34.0 9.8 — 47.4 57.2Total fair value of plan assets $ 1,219.1 $ 49.5 $ 44.5 $ 1,313.1 $ 1,178.9 $ 49.3 $ 68.7 $ 1,296.9
The three levels of the fair value hierarchy referenced above are discussed in Note 14.5.

86
20.3 Plan assets investment allocation
During Fiscal 2011, the Company changed the target asset allocation to 55-75% fixed income and 25-45% equity for the registered and non-registered pension plans. For the assets in the health and welfare trust, included in Other Benefit Plans, the Company changed the asset allocation to 100% fixed income. As at the end of Fiscal 2012 and 2011, the assets were in line with the target allocation range, with the transitioning of assets from alternative investments near completion. The asset allocation may be changed from time to time in terms of weighting between fixed income, equity and other asset classes as well as within the asset classes themselves.
The plan’s target allocation is determined taking into consideration the amounts and timing of projected liabilities, the Company’s funding policies and expected returns on various asset classes. To develop the expected long-term rate of return on assets assumption, the Company considered the historical returns and the future expectations for returns for each asset class, as well as the target asset allocation of the pension portfolio.
At as the end of the current and prior fiscal years, plan assets were invested in the following classes of securities:
As at
February 2, 2013As at
January 28, 2012
RegisteredRetirement
Plans
Non-Registered
PensionPlan
OtherBenefits
Plan
RegisteredRetirement
Plans
Non-Registered
PensionPlan
OtherBenefits
Plan
Fixed income securities 72.3% 66.5% 100.0% 69.8% 69.5% 99.7%Alternative investments 0.2% —% —% 1.3% 0.4% 0.3%Equity securities 27.5% 33.5% —% 28.9% 30.1% —%Total 100.0% 100.0% 100.0% 100.0% 100.0% 100.0%
20.4 Pension assumptions
The significant actuarial assumptions were as follows (weighted average assumptions) as at February 2, 2013 and January 28, 2012 :
As at
February 2, 2013As at
January 28, 2012
RegisteredRetirement
Plans
Non-Registered
PensionPlan
OtherBenefits
Plan
RegisteredRetirement
Plans
Non-Registered
PensionPlan
OtherBenefits
Plan
Discount rate used in calculation ofAccrued benefit plan obligations 4.20% 4.20% 4.20% 4.70% 4.70% 4.60%Benefit plans expense 4.20% 4.20% 4.20% 4.70% 4.70% 4.60%
Rate of compensation increase used in calculation ofAccrued benefit plan obligations 3.50% 3.50% 3.50% 3.50% 3.50% 3.50%Benefit plans expense 3.50% 3.50% 3.50% 3.50% 3.50% 3.50%
Expected long-term rate of return on plan assets used incalculation of benefit plans expense 4.20% 4.20% 4.20% 4.70% 4.70% 4.60%Health care cost trend rates
Used in calculation of accrued benefit planobligations 6.14% 6.23%Used in calculation of benefit plans expense 6.23% 6.78%Cost trend rate declines to 3.82% 3.82%Year that the rate reaches assumed constant 2030 2030
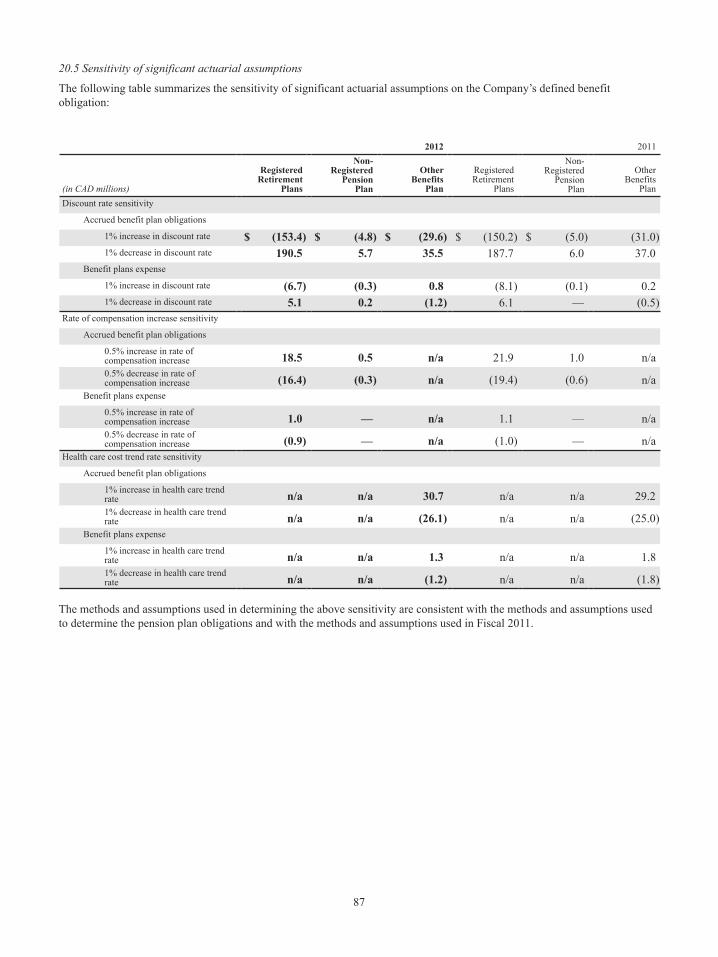
87
20.5 Sensitivity of significant actuarial assumptions
The following table summarizes the sensitivity of significant actuarial assumptions on the Company’s defined benefit obligation:
2012 2011
(in CAD millions)
RegisteredRetirement
Plans
Non-Registered
PensionPlan
OtherBenefits
Plan
RegisteredRetirement
Plans
Non-Registered
PensionPlan
OtherBenefits
PlanDiscount rate sensitivity
Accrued benefit plan obligations
1% increase in discount rate $ (153.4) $ (4.8) $ (29.6) $ (150.2) $ (5.0) (31.0)1% decrease in discount rate 190.5 5.7 35.5 187.7 6.0 37.0
Benefit plans expense
1% increase in discount rate (6.7) (0.3) 0.8 (8.1) (0.1) 0.21% decrease in discount rate 5.1 0.2 (1.2) 6.1 — (0.5)
Rate of compensation increase sensitivity
Accrued benefit plan obligations
0.5% increase in rate of compensation increase 18.5 0.5 n/a 21.9 1.0 n/a0.5% decrease in rate of compensation increase (16.4) (0.3) n/a (19.4) (0.6) n/a
Benefit plans expense
0.5% increase in rate of compensation increase 1.0 — n/a 1.1 — n/a0.5% decrease in rate of compensation increase (0.9) — n/a (1.0) — n/a
Health care cost trend rate sensitivity
Accrued benefit plan obligations
1% increase in health care trend rate n/a n/a 30.7 n/a n/a 29.21% decrease in health care trend rate n/a n/a (26.1) n/a n/a (25.0)
Benefit plans expense
1% increase in health care trend rate n/a n/a 1.3 n/a n/a 1.81% decrease in health care trend rate n/a n/a (1.2) n/a n/a (1.8)
The methods and assumptions used in determining the above sensitivity are consistent with the methods and assumptions used to determine the pension plan obligations and with the methods and assumptions used in Fiscal 2011.

88
20.6 Retirement benefit plans expense and contributions
The expense for the defined benefit, defined contribution and other benefit plans for Fiscal 2012 and Fiscal 2011, was as follows:
2012 2011
(in CAD millions)
RegisteredRetirement
Plans
Non-Registered
PensionPlan
OtherBenefits
Plan Total
RegisteredRetirement
Plans
Non-Registered
PensionPlan
OtherBenefits
Plan TotalCurrent service cost, net ofemployee contributions $ 0.9 $ — $ — $ 0.9 $ 0.9 $ — $ — $ 0.9Net interest 8.7 (0.1) 11.8 20.4 6.1 (0.1) 11.7 17.7Settlement gain — — (21.9) (21.9) — — — —Administrative expenses 0.4 — — 0.4 0.5 — 0.1 0.6Net defined benefit plans expense (income) $ 10.0 $ (0.1) $ (10.1) $ (0.2) $ 7.5 $ (0.1) $ 11.8 $ 19.2Net defined contribution planexpense 9.7 — 0.2 9.9 10.7 — 0.3 11.0Total retirement benefit plans expense (income) 1 $ 19.7 $ (0.1) $ (9.9) $ 9.7 $ 18.2 $ (0.1) $ 12.1 $ 30.2
1Not included in total expense recognized are short-term disability payments of $8.1 million (2011: $8.4 million) that were paid from the health and welfare trust. Both short-term disability and the retirement benefit plans expense are included in “Selling, administrative and other expenses”, unless disclosed elsewhere, in the Company’s Consolidated Statements of Net Earnings (Loss) and Comprehensive Income (Loss).
Total cash contributions made by the Company to its defined benefit, defined contribution and other benefit plans, including payments to settle health and dental benefits of eligible members covered under the non-pension post retirement plan, for the fiscal year ended February 2, 2013 were $63.0 million (2011: $17.9 million). For Fiscal 2013, it is estimated that the Company will make contributions of approximately $44.5 million to its defined benefit, defined contribution and other benefit plans, which include funding obligations as described in Note 14.2.
20.7 Remeasurements of the net defined retirement benefit liability
2012 2011
(in CAD millions)
RegisteredRetirement
Plans
Non-Registered
PensionPlan
OtherBenefits
Plan Total
RegisteredRetirement
Plans
Non-Registered
PensionPlan
OtherBenefits
Plan TotalActuarial gain (loss) on difference between expected interest income and actual return on plan assets $ 73.7 $ 0.1 $ (1.9) $ 71.9 $ (14.8) $ (1.6) $ (1.0) $ (17.4)Actuarial gain (loss) due tochange in demographic — — — — 19.0 0.3 (0.6) 18.7Actuarial loss due to change in financial assumptions (80.9) (2.5) (16.0) (99.4) (108.6) (3.6) (27.0) (139.2)Actuarial gain (loss) due to allother experiences 18.2 0.8 — 19.0 25.2 (2.0) 8.2 31.4Total pre-tax remeasurementlosses $ 11.0 $ (1.6) $ (17.9) $ (8.5) $ (79.2) $ (6.9) $ (20.4) $ (106.5)Income tax recovery onremeasurement losses 3.5 27.4Total remeasurement losses, net of income taxes 1 $ (5.0) $ (79.1)
1 Total remeasurement losses, net of income taxes, are included in “Other comprehensive loss” in the Company’s Consolidated Statements of Net Earnings (Loss) and Comprehensive Income (Loss).
The actuarial losses associated with changes in financial assumptions are due to changes in the discount rate. The discount rate as at February 2, 2013 decreased 0.5% for the Registered Retirement Plans and the Non-registered Pension Plan (2011: a decrease of 0.7%), and 0.4% for the Other Benefits Plan (2011: a decrease of 0.8%).

89
21. Contingent liabilities
21.1 Legal Proceedings
The Company is involved in various legal proceedings incidental to the normal course of business. The Company takes into account all available information, including guidance from experts (such as internal and external legal counsel) at the time of reporting to determine if it is probable that a present obligation (legal or constructive) exists, if it is probable that an outflow of resources embodying economic benefit will be required to settle such obligation and whether the Company can reliably measure such obligation at the end of the reporting period. The Company is of the view that, although the outcome of such legal proceedings cannot be predicted with certainty, the final disposition is not expected to have a material adverse effect on the Company’s Consolidated Financial Statements, including its Consolidated Statements of Financial Position, Consolidated Statements of Net Earnings (Loss) and Comprehensive Income (Loss), and Consolidated Statements of Cash Flows.
21.2 Commitments and guarantees
Commitments
As at February 2, 2013, cash and cash equivalents that are restricted represent cash and investments pledged as collateral for letter of credit obligations issued under the Company’s offshore merchandise purchasing program of $9.0 million (January 28, 2012: $7.2 million), which is the Canadian equivalent of U.S. $9.0 million (January 28, 2012: U.S. $7.2 million).
The Company has certain vendors which require minimum purchase commitment levels over the term of the contract. Refer to Note 14.2 "Liquidity Risk".
Guarantees
The Company has provided the following significant guarantees to third parties:
Royalty License Agreements
The Company pays royalties under various merchandise license agreements, which are generally based on the sale of products. Certain license agreements require a minimum guaranteed payment of royalties over the term of the contract, regardless of sales. Total future minimum royalty payments under such agreements were $2.3 million as at February 2, 2013 (January 28, 2012: $3.1 million).
Other Indemnification Agreements
In the ordinary course of business, the Company has provided indemnification commitments to counterparties in transactions such as leasing transactions, royalty agreements, service arrangements, investment banking agreements and director and officer indemnification agreements. The Company has also provided certain indemnification agreements in connection with the sale of the credit and financial services operations in November 2005. The foregoing indemnification agreements require the Company to compensate the counterparties for costs incurred as a result of changes in laws and regulations, or as a result of litigation or statutory claims, or statutory sanctions that may be suffered by a counterparty as a consequence of the transaction. The terms of these indemnification agreements will vary based on the contract and typically do not provide for any limit on the maximum potential liability. Historically, the Company has not made any significant payments under such indemnifications and no amounts have been accrued in the consolidated financial statements with respect to these indemnification commitments.
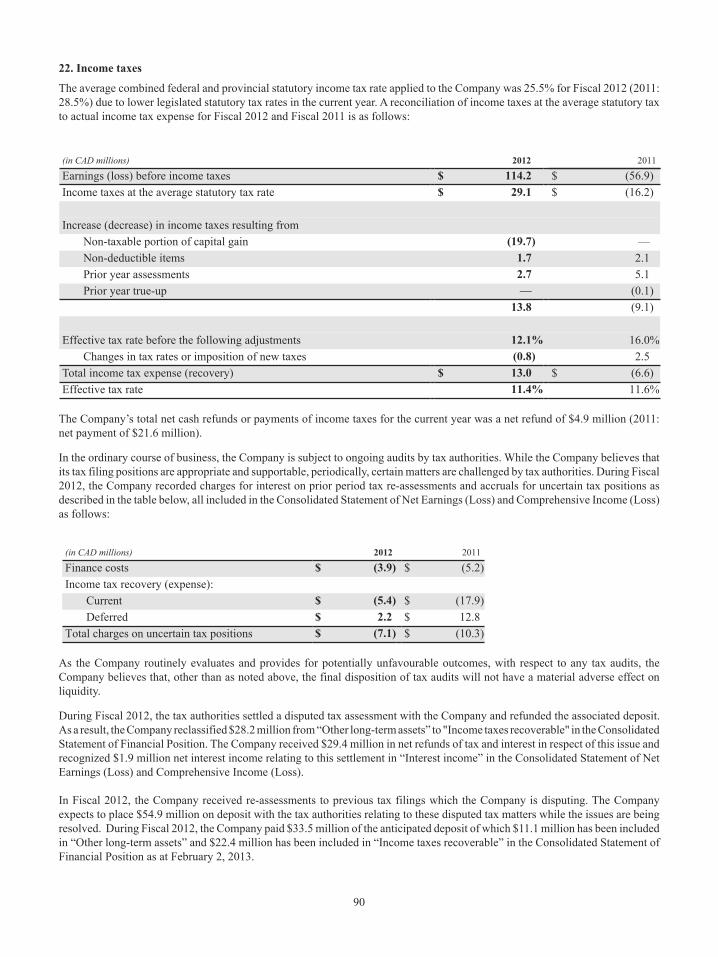
90
22. Income taxes
The average combined federal and provincial statutory income tax rate applied to the Company was 25.5% for Fiscal 2012 (2011: 28.5%) due to lower legislated statutory tax rates in the current year. A reconciliation of income taxes at the average statutory tax to actual income tax expense for Fiscal 2012 and Fiscal 2011 is as follows:
(in CAD millions) 2012 2011
Earnings (loss) before income taxes $ 114.2 $ (56.9)Income taxes at the average statutory tax rate $ 29.1 $ (16.2)
Increase (decrease) in income taxes resulting fromNon-taxable portion of capital gain (19.7) —Non-deductible items 1.7 2.1Prior year assessments 2.7 5.1Prior year true-up — (0.1)
13.8 (9.1)
Effective tax rate before the following adjustments 12.1% 16.0%Changes in tax rates or imposition of new taxes (0.8) 2.5
Total income tax expense (recovery) $ 13.0 $ (6.6)Effective tax rate 11.4% 11.6%
The Company’s total net cash refunds or payments of income taxes for the current year was a net refund of $4.9 million (2011: net payment of $21.6 million).
In the ordinary course of business, the Company is subject to ongoing audits by tax authorities. While the Company believes that its tax filing positions are appropriate and supportable, periodically, certain matters are challenged by tax authorities. During Fiscal 2012, the Company recorded charges for interest on prior period tax re-assessments and accruals for uncertain tax positions as described in the table below, all included in the Consolidated Statement of Net Earnings (Loss) and Comprehensive Income (Loss) as follows:
(in CAD millions) 2012 2011
Finance costs $ (3.9) $ (5.2)Income tax recovery (expense):
Current $ (5.4) $ (17.9)Deferred $ 2.2 $ 12.8
Total charges on uncertain tax positions $ (7.1) $ (10.3)
As the Company routinely evaluates and provides for potentially unfavourable outcomes, with respect to any tax audits, the Company believes that, other than as noted above, the final disposition of tax audits will not have a material adverse effect on liquidity.
During Fiscal 2012, the tax authorities settled a disputed tax assessment with the Company and refunded the associated deposit. As a result, the Company reclassified $28.2 million from “Other long-term assets” to "Income taxes recoverable" in the Consolidated Statement of Financial Position. The Company received $29.4 million in net refunds of tax and interest in respect of this issue and recognized $1.9 million net interest income relating to this settlement in “Interest income” in the Consolidated Statement of Net Earnings (Loss) and Comprehensive Income (Loss).
In Fiscal 2012, the Company received re-assessments to previous tax filings which the Company is disputing. The Company expects to place $54.9 million on deposit with the tax authorities relating to these disputed tax matters while the issues are being resolved. During Fiscal 2012, the Company paid $33.5 million of the anticipated deposit of which $11.1 million has been included in “Other long-term assets” and $22.4 million has been included in “Income taxes recoverable” in the Consolidated Statement of Financial Position as at February 2, 2013.
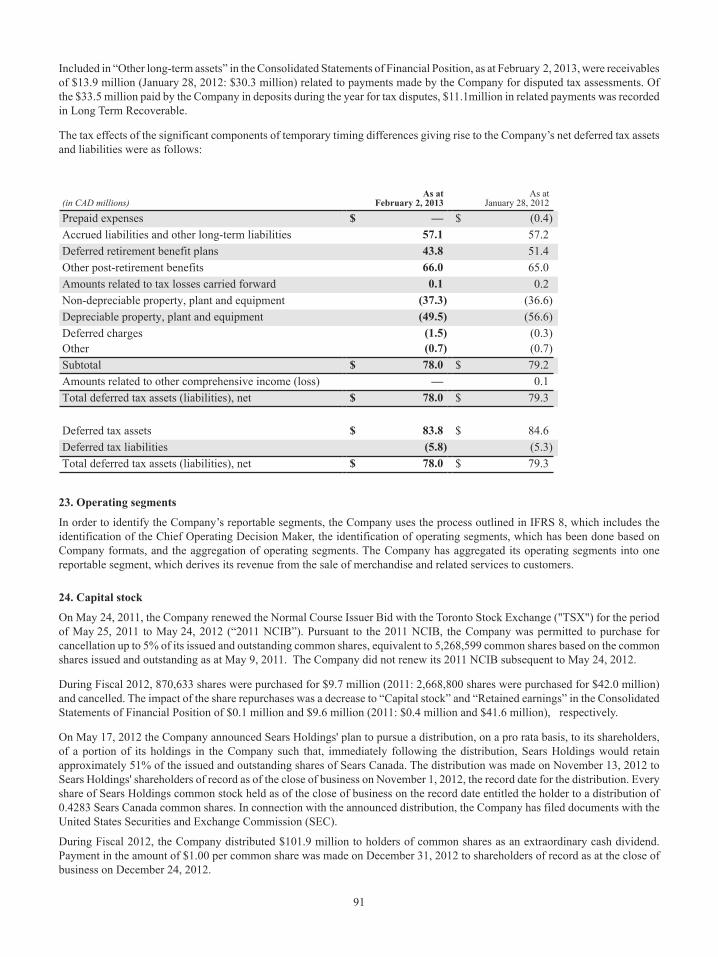
91
Included in “Other long-term assets” in the Consolidated Statements of Financial Position, as at February 2, 2013, were receivables of $13.9 million (January 28, 2012: $30.3 million) related to payments made by the Company for disputed tax assessments. Of the $33.5 million paid by the Company in deposits during the year for tax disputes, $11.1million in related payments was recorded in Long Term Recoverable.
The tax effects of the significant components of temporary timing differences giving rise to the Company’s net deferred tax assets and liabilities were as follows:
(in CAD millions)As at
February 2, 2013As at
January 28, 2012
Prepaid expenses $ — $ (0.4)Accrued liabilities and other long-term liabilities 57.1 57.2Deferred retirement benefit plans 43.8 51.4Other post-retirement benefits 66.0 65.0Amounts related to tax losses carried forward 0.1 0.2Non-depreciable property, plant and equipment (37.3) (36.6)Depreciable property, plant and equipment (49.5) (56.6)Deferred charges (1.5) (0.3)Other (0.7) (0.7)Subtotal $ 78.0 $ 79.2Amounts related to other comprehensive income (loss) — 0.1Total deferred tax assets (liabilities), net $ 78.0 $ 79.3
Deferred tax assets $ 83.8 $ 84.6Deferred tax liabilities (5.8) (5.3)Total deferred tax assets (liabilities), net $ 78.0 $ 79.3
23. Operating segments
In order to identify the Company’s reportable segments, the Company uses the process outlined in IFRS 8, which includes the identification of the Chief Operating Decision Maker, the identification of operating segments, which has been done based on Company formats, and the aggregation of operating segments. The Company has aggregated its operating segments into one reportable segment, which derives its revenue from the sale of merchandise and related services to customers.
24. Capital stock
On May 24, 2011, the Company renewed the Normal Course Issuer Bid with the Toronto Stock Exchange ("TSX") for the period of May 25, 2011 to May 24, 2012 (“2011 NCIB”). Pursuant to the 2011 NCIB, the Company was permitted to purchase for cancellation up to 5% of its issued and outstanding common shares, equivalent to 5,268,599 common shares based on the common shares issued and outstanding as at May 9, 2011. The Company did not renew its 2011 NCIB subsequent to May 24, 2012.
During Fiscal 2012, 870,633 shares were purchased for $9.7 million (2011: 2,668,800 shares were purchased for $42.0 million) and cancelled. The impact of the share repurchases was a decrease to “Capital stock” and “Retained earnings” in the Consolidated Statements of Financial Position of $0.1 million and $9.6 million (2011: $0.4 million and $41.6 million), respectively.
On May 17, 2012 the Company announced Sears Holdings' plan to pursue a distribution, on a pro rata basis, to its shareholders, of a portion of its holdings in the Company such that, immediately following the distribution, Sears Holdings would retain approximately 51% of the issued and outstanding shares of Sears Canada. The distribution was made on November 13, 2012 to Sears Holdings' shareholders of record as of the close of business on November 1, 2012, the record date for the distribution. Every share of Sears Holdings common stock held as of the close of business on the record date entitled the holder to a distribution of 0.4283 Sears Canada common shares. In connection with the announced distribution, the Company has filed documents with the United States Securities and Exchange Commission (SEC).
During Fiscal 2012, the Company distributed $101.9 million to holders of common shares as an extraordinary cash dividend. Payment in the amount of $1.00 per common share was made on December 31, 2012 to shareholders of record as at the close of business on December 24, 2012.
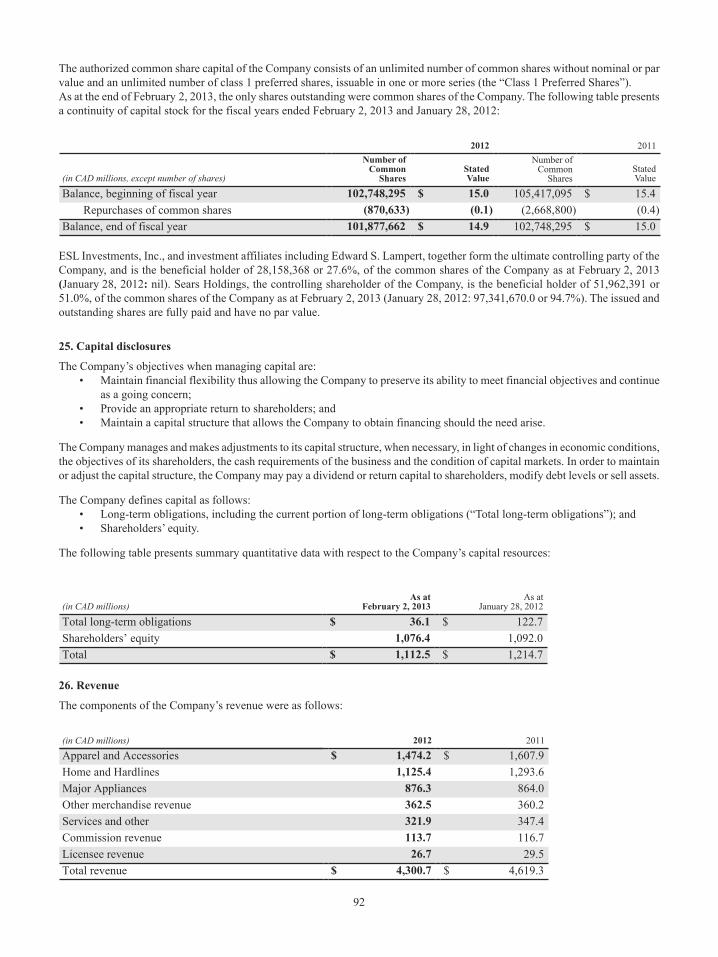
92
The authorized common share capital of the Company consists of an unlimited number of common shares without nominal or par value and an unlimited number of class 1 preferred shares, issuable in one or more series (the “Class 1 Preferred Shares”).As at the end of February 2, 2013, the only shares outstanding were common shares of the Company. The following table presents a continuity of capital stock for the fiscal years ended February 2, 2013 and January 28, 2012:
2012 2011
(in CAD millions, except number of shares)
Number ofCommon
SharesStatedValue
Number ofCommon
SharesStatedValue
Balance, beginning of fiscal year 102,748,295 $ 15.0 105,417,095 $ 15.4Repurchases of common shares (870,633) (0.1) (2,668,800) (0.4)
Balance, end of fiscal year 101,877,662 $ 14.9 102,748,295 $ 15.0
ESL Investments, Inc., and investment affiliates including Edward S. Lampert, together form the ultimate controlling party of the Company, and is the beneficial holder of 28,158,368 or 27.6%, of the common shares of the Company as at February 2, 2013 (January 28, 2012: nil). Sears Holdings, the controlling shareholder of the Company, is the beneficial holder of 51,962,391 or 51.0%, of the common shares of the Company as at February 2, 2013 (January 28, 2012: 97,341,670.0 or 94.7%). The issued and outstanding shares are fully paid and have no par value.
25. Capital disclosures
The Company’s objectives when managing capital are:• Maintain financial flexibility thus allowing the Company to preserve its ability to meet financial objectives and continue
as a going concern;• Provide an appropriate return to shareholders; and• Maintain a capital structure that allows the Company to obtain financing should the need arise.
The Company manages and makes adjustments to its capital structure, when necessary, in light of changes in economic conditions, the objectives of its shareholders, the cash requirements of the business and the condition of capital markets. In order to maintain or adjust the capital structure, the Company may pay a dividend or return capital to shareholders, modify debt levels or sell assets.
The Company defines capital as follows:• Long-term obligations, including the current portion of long-term obligations (“Total long-term obligations”); and• Shareholders’ equity.
The following table presents summary quantitative data with respect to the Company’s capital resources:
(in CAD millions)As at
February 2, 2013As at
January 28, 2012
Total long-term obligations $ 36.1 $ 122.7Shareholders’ equity 1,076.4 1,092.0Total $ 1,112.5 $ 1,214.7
26. Revenue
The components of the Company’s revenue were as follows:
(in CAD millions) 2012 2011
Apparel and Accessories $ 1,474.2 $ 1,607.9Home and Hardlines 1,125.4 1,293.6Major Appliances 876.3 864.0Other merchandise revenue 362.5 360.2Services and other 321.9 347.4Commission revenue 113.7 116.7Licensee revenue 26.7 29.5Total revenue $ 4,300.7 $ 4,619.3

93
27. Employee benefits expense
The components of the Company’s employee benefits expense for the current and prior fiscal year were as follows:
(in CAD millions) 20122011
(Recast - Note 2)
Wages and salaries $ 657.9 $ 685.0Paid absences 1 62.1 67.1Benefits
Provincial healthcare costs 15.5 15.4Flex benefits 16.6 16.2Retirement benefit plans expense 9.7 30.2Statutory deductions 2 45.7 46.0Severance 3 17.1 25.3Other employer paid benefits (1.2) 2.1
Total benefits expense $ 823.4 $ 887.3
1 Paid absences are expenses related to vacation, statutory holidays and sick days.2 Statutory deductions consist of the employer portion of payment for the Canada Pension Plan and Employment Insurance.3 Included in Severance for Fiscal 2012 were $12.6 million (2011: $19.3 million) of costs related to transformation.
These expenses are included in “Cost of goods and services sold” and “Selling, administrative and other expenses” in the Consolidated Statements of Net Earnings (Loss) and Comprehensive Income (Loss).
28. Gain on lease terminations
On March 2, 2012, the Company entered into an agreement to surrender and terminate early the operating leases on three properties: Vancouver Pacific Centre, Chinook Centre (Calgary) and Rideau Centre (Ottawa). The Company was a long-term and important anchor tenant in the three properties, and the landlord approached the Company with a proposal to terminate early the three leases and vacate the premises in exchange for $170.0 million. The payment represents the amount the landlord was willing to pay for the right to redevelop the property based upon their analysis of the potential returns from redevelopment.
On the closing date, April 20, 2012, the Company received cash proceeds of $170.0 million for the surrender of the three leases, resulting in a pre-tax gain of $164.3 million, net of the de-recognition of leasehold improvements of $5.7 million. The Company exited all three properties on October 31, 2012, and has no further financial obligation related to the transaction.
On June 20, 2012, the Company entered an agreement to surrender and terminate early the operating lease on its Deerfoot (Calgary) property. The landlord approached the Company with a proposal to terminate early the lease in exchange for cash proceeds of $5.0 million, subject to certain closing conditions, on the closing date of October 26, 2012. In Fiscal 2010, the Company incurred an impairment loss of $2.9 million relating to the property, plant and equipment at its Deerfoot property. As a result of the agreement and expected proceeds, the Company recorded an impairment loss reversal (net of accumulated amortization) of $2.1 million in "Selling, administrative and other expenses". On the closing date of October 26, 2012, the Company vacated the property and received cash proceeds of $5.0 million, resulting in a pre-tax gain of $2.8 million, net of the de-recognition of leasehold improvements and furniture and fixtures of $2.2 million. The Company has no further financial obligation related to the transaction.
29. Sale of Cantrex Group Inc. (“Cantrex”)
On April 24, 2012, the Company entered an agreement to sell the operations of its subsidiary, Cantrex, to Nationwide Marketing Group, LLC for $3.5 million, equal to the net carrying amount of specified Cantrex assets and liabilities. On April 29, 2012, the Company received the proceeds on the sale, de-recognized the assets and liabilities sold and recorded a gain on sale of nil.
30. Related party transactions
The immediate parent of the Company is Sears Holdings. The ultimate controlling party of the Company is ESL Investments, Inc. (incorporated in the U.S. in the state of Florida) through Sears Holdings. The Company also has investments in joint ventures, as described in Note 11.

94
Balances and transactions between the Company and its subsidiaries, which are related parties of the Company, have been eliminated on consolidation and are not disclosed in this note. Details of transactions between the Company and other related parties are disclosed below.
30.1 Trading transactions
During the current and prior fiscal year, the Company entered into the following trading transactions with related parties:
2012 2011
(in CAD millions)Purchaseof goods
Servicesreceived Other Total
Purchaseof goods
Servicesreceived Other Total
Sears Holdings Corporation $ — $ 5.0 $ 0.2 $ 5.2 $ 0.3 $ 4.8 $ 0.5 $ 5.6Real estate joint ventures — 4.5 — 4.5 — 4.4 — 4.4Total related party transactions $ — $ 9.5 $ 0.2 $ 9.7 $ 0.3 $ 9.2 $ 0.5 $ 10.0
The following balances were outstanding as at the end of the fiscal year:
Amounts receivable from related parties
(in CAD millions)As at
February 2, 2013As at
January 28, 2012
Sears Holdings Corporation $ 0.3 $ 0.1Total $ 0.3 $ 0.1
Amounts payable to related parties
(in CAD millions)As at
February 2, 2013As at
January 28, 2012
Sears Holdings Corporation $ 0.7 $ 0.6Total $ 0.7 $ 0.6
The related party transactions with Sears Holdings are in the ordinary course of business for shared merchandise purchasing services. These transactions were recorded either at fair market value or the exchange amount, which was established and agreed to by the related parties. These balances are included in “Accounts payable and accrued liabilities” and “Accounts receivable, net” in the Consolidated Statements of Financial Position.
The related party transactions with the various real estate joint ventures represent lease payments for the lease of the Company’s stores. These transactions were recorded either at fair market value or the exchange amount, which was established and agreed to by the related parties.
The amounts outstanding are unsecured and will be settled in cash. No guarantees have been given or received. No expense has been recognized in the current or prior fiscal periods for bad or doubtful debts in respect of the amounts owed by related parties.
The Company’s Audit Committee is responsible for pre-approving all related party transactions that have a value greater than $1.0 million.
31. Key management personnel compensation
Key management personnel are those individuals having the authority and responsibility for planning, directing and controlling the activities of the Company. The Company considers the Board of Directors and the following former and current members of senior management to be key management personnel:
Chief Executive Officer; Former Senior Vice-President and Chief Financial Officer; Executive Vice-President and Chief Operating Officer;Former Executive Vice-President and Chief Administrative Officer;Former Executive Vice-President, Merchandising, Apparel and Accessories;Former Senior Vice-President, Merchandising, Home and Hardlines;
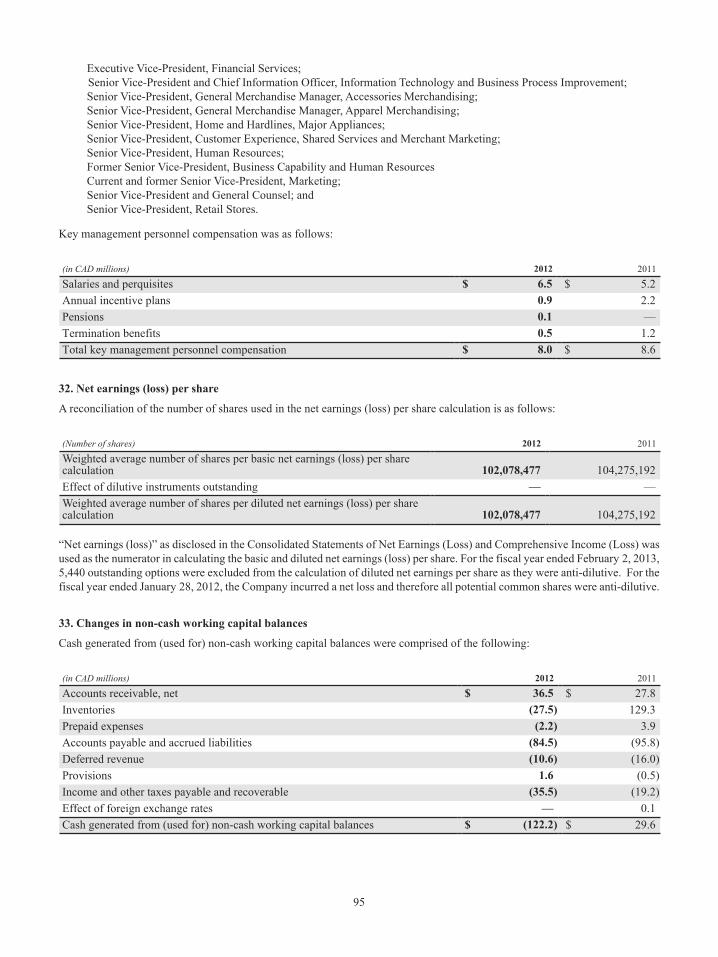
95
Executive Vice-President, Financial Services; Senior Vice-President and Chief Information Officer, Information Technology and Business Process Improvement; Senior Vice-President, General Merchandise Manager, Accessories Merchandising; Senior Vice-President, General Merchandise Manager, Apparel Merchandising; Senior Vice-President, Home and Hardlines, Major Appliances;Senior Vice-President, Customer Experience, Shared Services and Merchant Marketing; Senior Vice-President, Human Resources;Former Senior Vice-President, Business Capability and Human ResourcesCurrent and former Senior Vice-President, Marketing;Senior Vice-President and General Counsel; andSenior Vice-President, Retail Stores.
Key management personnel compensation was as follows:
(in CAD millions) 2012 2011
Salaries and perquisites $ 6.5 $ 5.2Annual incentive plans 0.9 2.2Pensions 0.1 —Termination benefits 0.5 1.2Total key management personnel compensation $ 8.0 $ 8.6
32. Net earnings (loss) per share
A reconciliation of the number of shares used in the net earnings (loss) per share calculation is as follows:
(Number of shares) 2012 2011
Weighted average number of shares per basic net earnings (loss) per share calculation 102,078,477 104,275,192Effect of dilutive instruments outstanding — —Weighted average number of shares per diluted net earnings (loss) per share calculation 102,078,477 104,275,192
“Net earnings (loss)” as disclosed in the Consolidated Statements of Net Earnings (Loss) and Comprehensive Income (Loss) was used as the numerator in calculating the basic and diluted net earnings (loss) per share. For the fiscal year ended February 2, 2013, 5,440 outstanding options were excluded from the calculation of diluted net earnings per share as they were anti-dilutive. For the fiscal year ended January 28, 2012, the Company incurred a net loss and therefore all potential common shares were anti-dilutive.
33. Changes in non-cash working capital balances
Cash generated from (used for) non-cash working capital balances were comprised of the following:
(in CAD millions) 2012 2011
Accounts receivable, net $ 36.5 $ 27.8Inventories (27.5) 129.3Prepaid expenses (2.2) 3.9Accounts payable and accrued liabilities (84.5) (95.8)Deferred revenue (10.6) (16.0)Provisions 1.6 (0.5)Income and other taxes payable and recoverable (35.5) (19.2)Effect of foreign exchange rates — 0.1Cash generated from (used for) non-cash working capital balances $ (122.2) $ 29.6
96
34. Event after the reporting period
Subsequent to year end, the Company finalized an exclusive, multi-year licensing arrangement with SHS Services Management Inc. ("SHS Services"), which will result in SHS Services overseeing the day-to-day operations of all Sears Home Improvements Product Services business. The licensing agreement, effective March 3, 2013, is expected to result in a reduction to revenues and expenses, however, the impact to net earnings is not expected to be significant.
35. Approval of consolidated financial statements
The consolidated financial statements were approved by the Board of Directors and authorized for issue on March 14, 2013.
97
DIRECTORS AND OFFICERS
Board of Directors Officers
E. J. Bird 3
Interim Chief Financial Officer of the CorporationCalvin McDonaldPresident and Chief Executive Officer
William C. Crowley 2,3
Managing MemberCRK Capital Partners, LLC
E. J. Bird Interim Chief Financial Officer
William R. Harker 2,3
PrincipalThe Harker Group LLC
Doug CampbellExecutive Vice-President and Chief Operating Officer
R. Raja Khanna 1,4
Chief Executive OfficerBlue Ant Media Inc.
Peter KalenExecutive Vice-President, Financial Services
James McBurney 1,4
Chief Executive OfficerWhite Tiger Gold Ltd.
Klaudio LeshnjaniSenior Vice-President and General Counsel
Calvin McDonaldPresident and Chief Executive Officer of the Corporation Deborah E. Rosati 1,2,4
Corporate Director and Advisor
Donald C. Ross 2,4
PartnerOsler, Hoskin & Harcourt LLP
Committees
1 Audit Committee2 Human Resources and Compensation Committee3 Investment Committee4 Nominating and Corporate Governance Committee
98
CORPORATE INFORMATIONHead Office
Sears Canada Inc.290 Yonge StreetSuite 700Toronto, OntarioM5B 2C3
Website:www.sears.caE-mail:[email protected]
For more information about the Company, or for additional copies of the Annual Report, write to the Corporate Communications Department at the Head Office of Sears Canada Inc., or call 416-941-4428.
The Company's regulatory filings can be found on the SEDAR website at www.sedar.com.
Stock Exchange Listing
Toronto Stock ExchangeTrading symbol: SCC
Transfer Agent and Registrar
CIBC Mellon Trust Company1
P.O. Box 700, Station BMontreal, QuébecH3B 3K3
Answerline:416-682-38601-800-387-0825
Fax: 1-888-249-6189
Website:www.canstockta.com
E-Mail:[email protected]
Annual Meeting
The Annual Meeting of Shareholders of Sears Canada Inc. will be held on Thursday, April 25, 2013 at 8:00 a.m. in Room 5B1, Fifth floor, 290 Yonge Street, Toronto, Ontario, Canada.
Édition française du Rapport annuel
On peut se procurer l'édition française de ce rapport en écrivant au:
Service de Communications de l'entrepriseSears Canada Inc.290 Yonge StreetSuite 700Toronto, OntarioM5B 2C3
Pour de plus amples renseignments au sujet de la Société, veuillez écrire au service national de communication, ou composer le 416-941-4428.
Les dépots réglementaires de la Société figurent sur le site Web de SEDAR à l`adresse www.sedar.com.
1Canadian Stock Transfer Company Inc. acts as the Administrative Agent for CIBC Mellon Trust Company.

99This page intentionally left blank

100This page intentionally left blank

A little over a year ago, we set our company upon a different course. We are now emboldened by a great and simple purpose: to make every day a great day for our customers. the more we matter to those who matter most to our business, the more valuable our business will be.
2012 AnnuAl RepoRtSeARS CAnAdA InC.