2012 annual report
DESCRIPTION
2012 Annual Report of the County of NewellTRANSCRIPT

2012 ANNUALFINANCIAL REPORT
Home of Dinosaur Provincial Park
COUNTy OF NEwELL, ALbERTA, CANAdA
FOR ThE yEAR ENdINg dECEmbER 31, 2012

Photo courtesy of the Brooks & County Chronicle

County of newell, AlbertA, CAnAdA
2012 AnnuAl finAnciAl RepoRtfor the fisCAl period ending deCember 31, 2012
Produced by the Finance Department in cooperation with all County departments
For information on programs and services, or to obtain a copy of this document, contact:
ADMINISTRATIONTelephone: 403-362-3266
E-Mail: [email protected]
The 2012 Annual Financial Report is available online at www.countyofnewell.ab.ca

PAge 2
C o u n t y o f n e w e l l - 2 0 1 2 A n n u A l f i n A n C i A l R e p o R t

C o u n t y o f n e w e l l - 2 0 1 2 A n n u A l f i n A n C i A l R e p o R t
PAge 3
tAble of contents
seCtion 1the County of newell
�� Vision & Mission 7�� County Profile 8�� County Council 9�� Organizational Chart 10
seCtion 2ConsolidAted finAnCiAl stAtements
�� Report from the Manager of Finance 11�� Management’s Responsibility for the Consolidated Financial Statements 25�� Independent Auditors’ Report 26�� Consolidated Statement of Financial Position 27�� Consolidated Statement of Financial Activities 28�� Consolidated Statement of Change in Net Financial Assets 29�� Consolidated Statement of Cash Flows 30�� Notes to Consolidated Financial Statements 31�� Schedule of Segmented Disclosures 47
seCtion 3stAtistiCAl seCtion
�� Demographics & Other Statistics 50�� Expenses by Function 51�� Expenses by Object 51�� Revenues by Source 52

PAge 4
C o u n t y o f n e w e l l - 2 0 1 2 A n n u A l f i n A n C i A l R e p o R t

C o u n t y o f n e w e l l - 2 0 1 2 A n n u A l f i n A n C i A l R e p o R t
PAge 5
seCtion 1
the county of newell

PAge 6
C o u n t y o f n e w e l l - 2 0 1 2 A n n u A l f i n A n C i A l R e p o R t

C o u n t y o f n e w e l l - 2 0 1 2 A n n u A l f i n A n C i A l R e p o R t
PAge 7
Vision & Mission stAteMent
VISION STATEMENTTo encourage and support sustainable growth and quality of life.
MISSION STATEMENTThe County of Newell
through leadership and policyprovides services, structure and stability.

C o u n t y o f n e w e l l - 2 0 1 2 A n n u A l f i n A n C i A l R e p o R t
PAge 8
C o u n t y o f n e w e l l - 2 0 1 2 A n n u A l f i n A n C i A l R e p o R t
county pRofile
The County of Newell is a rural municipality (5900 sq. km.) located in southeast Alberta in an area bounded by the City of Calgary 180 km east, 100 km west of the City of Medicine Hat, and 150 km northeast of the City of Lethbridge. The largest urban communities within the County are the City of Brooks and the Town of Bassano.
The County provides a number of services – directly or jointly with other municipalities – to the residents of the rural area and Hamlets. These services include general administration and maintenance, fire protection, garbage disposal, planning and development administration, agricultural services, recreation and parks, family and community support services and bylaw enforcement.
The County has a dynamic and diverse economy driven by three pillars: Agriculture; Oil and Gas; and Tourism. There are approximately 500 primary agricultural producers in the County, and approximately
1500 non-agricultural business enterprises within the County and its municipalities.
The County of Newell has a thriving and extensive agricultural base with ready access to Calgary and its global transportation linkages. With a younger work force and average farm receipts in the range of $100,000 to $249,999, the region is home to some of the most profitable farmers in Alberta.
The County has one of Alberta’s most active natural gas fields. There are roughly 30,000 wells in the County, which accounts for half of all wells in Alberta, and 37% of all wells in Canada. Approximately 170 production and service companies employ 4,000 to 5,000 people in the energy sector in the region.
Key tourism anchors include Lake Newell - one of Canada’s largest man-made lakes, Dinosaur Provincial Park - a UNESCO World Heritage Site, and recreation activity as diverse as golfing, boating, camping, fishing, hunting, and wildlife watching.
Business costs are low. Quality of life is high – with a full range of recreation, health and cultural amenities.

C o u n t y o f n e w e l l - 2 0 1 2 A n n u A l f i n A n C i A l R e p o R t C o u n t y o f n e w e l l - 2 0 1 2 A n n u A l f i n A n C i A l R e p o R t
PAge 9
county councilCOuNTy Of Newell COuNCIllORS
Division 10Brooks
Councillor Lionel Juss(403) [email protected]
Division 9Gem
Reeve Molly Douglass(403) [email protected]
Division 8Duchess
Councillor Brian de Jong(403) [email protected]
Division 7Rosemary
Councillor Allen Eastman(403) [email protected]
Division 6Bassano
Councillor Joel Bulger(403) [email protected]
Division 5Cassils/Lake Newell Resort
Councillor Mara Nesbitt(403) [email protected]
Division 4Rainier/Scandia/Bow City
Councillor Ryan Andrews(403) [email protected]
Division 3Patricia/Millicent
Councillor Anne Marie Philipsen(403) [email protected]
Division 2Tilley
Councillor Ike Schroeder(403) [email protected]
Division 1Rolling Hills
Councillor Clarence Amulung(403) [email protected]

C o u n t y o f n e w e l l - 2 0 1 2 A n n u A l f i n A n C i A l R e p o R t
PAge 10
C o u n t y o f n e w e l l - 2 0 1 2 A n n u A l f i n A n C i A l R e p o R t
oRgAnizAtionAl chARt
ECONOMIC DEVELOPMENT & TOURISM COORDINATOR
REEVE & COUNCIL
MANAGER OF FINANCE
CHIEF ADMINISTRATIVE OFFICER
ASSISTANT ADMINISTRATOR
MANAGER OF PLANNING & DEVELOPMENT
MANAGER OF IT & GIS
CORPORATE SAFETY SUPERVISOR
FIRE & EMERGENCY SERVICES COORDINATOR
AGRICULTURAL FIELDMAN
SUPERINTENDENT OF PUBLIC WORKS
ASSISTANT SUPERINTENDENT OF PUBLIC WORKS
TECHNICAL MANAGER
EXECUTIVE ASSISTANT
COMMUNITY PEACE OFFICER SUPERVISOR
C o u n t y o f n e w e l l - 2 0 1 2 A n n u A l f i n A n C i A l R e p o R t C o u n t y o f n e w e l l - 2 0 1 2 A n n u A l f i n A n C i A l R e p o R t
PAge 11
RepoRt fRoM the MAnAgeR of finAnce
introduCtion
The annual financial report provides readers with an opportunity to assess the County’s financial activities and available resources. It also provides an opportunity to analyze and comment on the principal features of the financial information contained in the 2012 audited Consolidated Financial Statements and to highlight key financial results that occurred during the year. Management at the County of Newell is responsible for the information contained in the annual financial report.
gfoA CAnAdiAn AwArd for finAnCiAl reporting
The Government Finance Officers Association of the United States and Canada (GFOA) awarded a Canadian Award for Financial Reporting to the County of Newell for its annual financial report for the fiscal year ended December 31, 2011. The Canadian Award for Financial Reporting program was established to encourage municipal governments throughout Canada to publish high quality financial reports and to provide peer recognition and technical guidance for officials preparing these reports.
In order to be awarded a Canadian Award for Financial Reporting, a government unit must publish an easily readable and efficiently organized annual financial report, whose contents conform to program standards. Such reports should go beyond the minimum requirements of generally accepted accounting principles and demonstrate an effort to clearly communicate the municipal government’s financial picture, enhance an understanding of financial reporting by municipal governments, and address user needs.
A Canadian Award for Financial Reporting is valid for a period of one year only. We believe our current report continues to conform to the Canadian Award for Financial Reporting program requirements, and we are submitting it to GFOA.

C o u n t y o f n e w e l l - 2 0 1 2 A n n u A l f i n A n C i A l R e p o R t
PAge 12
C o u n t y o f n e w e l l - 2 0 1 2 A n n u A l f i n A n C i A l R e p o R t
RepoRt fRoM the MAnAgeR of finAnce
mAnAgement reporting & Control The major components of the County’s financial management and control programs include the budget process, accounting procedures, external audit, investment and purchasing policies which are described below.
Budget Process On an annual basis, Council considers a proposed operating budget and a five year capital forecast and adopts the operating and capital budgets for the coming year. The budget process involves Council, department heads, staff and the public. Council approves the budget taking into account current economic conditions, provincial policy changes and service needs within the County. It should be noted that under provincial legislation sufficient revenues must be raised to meet all budgeted expenditures.
After the budget is adopted by Council, expenditures are controlled against budget by formal purchasing policies and financial systems designed specifically to prevent budget overruns.
Accounting Procedures
The County’s accounting system and related internal controls are designed to provide reasonable assurance that financial records are complete and accurate and that assets are safeguarded against loss from unauthorized use or disposition. The County’s Purchasing Bylaw and Budget variance policy ensure that controls and reporting requirements are appropriate. Generally accepted accounting principles for local governments are adhered to. External Audit Council is required by the Municipal Government Act to engage independent auditors to express an opinion as to whether the County’s financial statements present fairly, in all material respects, the County’s operating results and financial position. The auditors have full and free access to all County records and they meet periodically with staff to discuss matters arising from the audit or from new policies and procedures. The auditors also provide the County with a management letter providing comments on internal controls.
While Council engages an independent auditor to express an opinion on the financial statements, the County’s management is responsible for the preparation of the financial statements and the integrity and objectivity of the financial information and representations contained in the financial statements.
Investment Policy The County’s excess funds are invested in accordance with Investment Policy 2008-PAD-032. This policy has as its objectives the preservation of capital, maintenance of liquidity and the realization of a competitive rate of return. Municipal investments are governed by restrictive legislation under the Municipal Government Act. The County’s investment policy meets all of these requirements.

C o u n t y o f n e w e l l - 2 0 1 2 A n n u A l f i n A n C i A l R e p o R t C o u n t y o f n e w e l l - 2 0 1 2 A n n u A l f i n A n C i A l R e p o R t
PAge 13
RepoRt fRoM the MAnAgeR of finAnce
Purchasing Policy The County ensures that consistent procedures are followed for purchases through Purchasing Policy 2011-PAD-051 which sets expenditure limits for the County. The policy ensures that items purchased have been approved through the budget process or by separate resolution of Council.
finAnCiAl indiCAtors disCussion & AnAlysis
The 2012 Consolidated Financial Statements are prepared in compliance with Public Sector Accounting Standards. The consolidated financial statements provide a snapshot of the County’s financial position at its fiscal year end (December 31) and the results of its operations, and changes in both cash flow and net assets for the preceding year. However, the consolidated financial statements do not provide a complete indication of the financial health of the County nor indicate how well it is performing in relation to its economic and fiscal environment. The Annual Financial Report seeks to expand on and explain information in the financial statements by applying PSAB issued Statement of Recommended Practices (SORP) 4: Indicators of Financial Condition. This information may help financial statement users better understand the risks facing the County in maintaining the programs and services it currently provides, as well as the policy and operational decisions it must make in light of its financial health.
This SORP is not part of generally accepted accounting principles (GAAP) and there is no requirement for governments to implement its recommendations. Although there are numerous indicators to assess a government’s financial condition, the SORP recommends that, at a minimum, indicators related to s u s t a i n a b i l i t y, flexibility and v u l n e r a b i l i t y be considered. Definitions of these assessors follow, as well as a selection of indicators related to each.
C o u n t y o f n e w e l l - 2 0 1 2 A n n u A l f i n A n C i A l R e p o R t
PAge 14
C o u n t y o f n e w e l l - 2 0 1 2 A n n u A l f i n A n C i A l R e p o R t
sustAinAbility Sustainability measures the ability of the County to maintain its existing programs and services, including maintaining its financial obligations to creditors, without increasing its debt or raising taxes. The following indicators have been selected to assess sustainability.
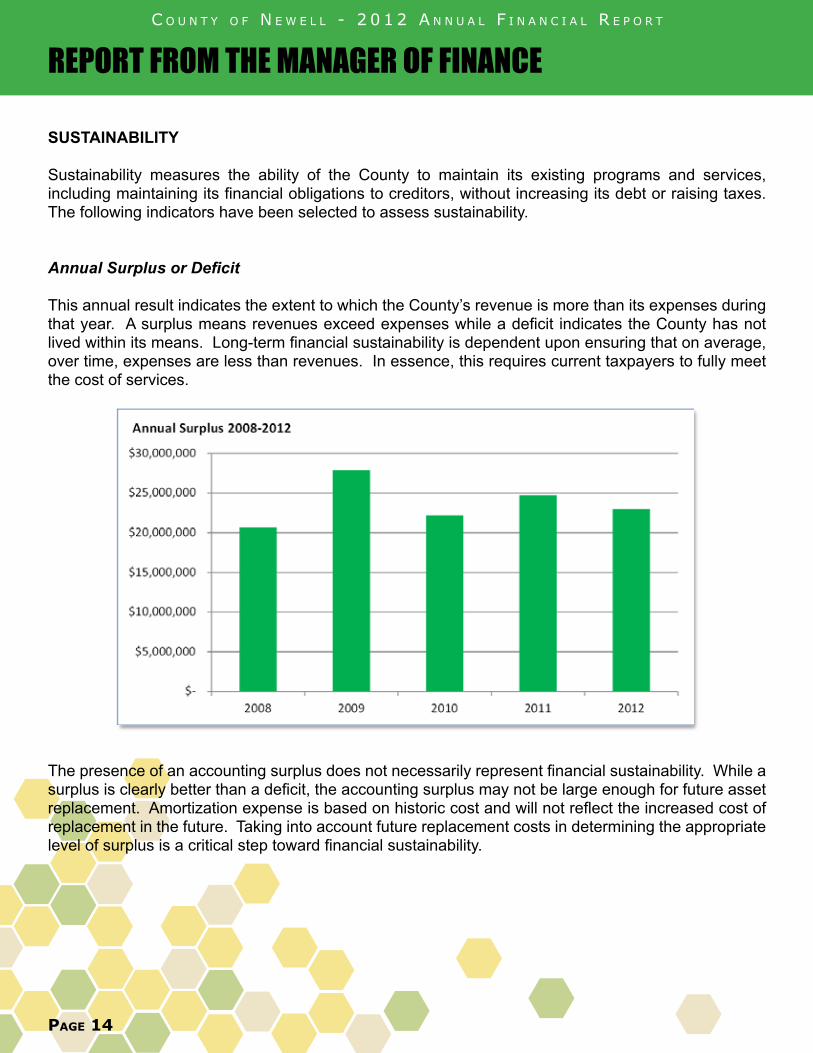
Annual Surplus or Deficit This annual result indicates the extent to which the County’s revenue is more than its expenses during that year. A surplus means revenues exceed expenses while a deficit indicates the County has not lived within its means. Long-term financial sustainability is dependent upon ensuring that on average, over time, expenses are less than revenues. In essence, this requires current taxpayers to fully meet the cost of services.
The presence of an accounting surplus does not necessarily represent financial sustainability. While a surplus is clearly better than a deficit, the accounting surplus may not be large enough for future asset replacement. Amortization expense is based on historic cost and will not reflect the increased cost of replacement in the future. Taking into account future replacement costs in determining the appropriate level of surplus is a critical step toward financial sustainability.
RepoRt fRoM the MAnAgeR of finAnce
$‐
$5,000,000
$10,000,000
$15,000,000
$20,000,000
$25,000,000
$30,000,000
2008 2009 2010 2011 2012
Annual Surplus 2008‐2012

C o u n t y o f n e w e l l - 2 0 1 2 A n n u A l f i n A n C i A l R e p o R t C o u n t y o f n e w e l l - 2 0 1 2 A n n u A l f i n A n C i A l R e p o R t
PAge 15
RepoRt fRoM the MAnAgeR of finAnce
Financial Assets-to-Liabilities This indicator shows the extent to which the County’s future revenues will be required to pay for past transactions or events. A ratio greater than one indicates that financial assets are sufficient to meet obligations and to finance future operations while a ratio less than one may mean a reliance on future revenues or increasing debt to pay for past decisions.
The issuance of $17,400,000 in debentures during 2012 to fund the rural water project is the main driver behind the decrease in this ratio. This ratio is expected to decrease further in 2013 as an additional $5,000,000 in debentures are issued to fund the rural water project, after which the ratio should begin to improve as annual principal payments on that debt decrease the liability balance.
5.88
4.71 4.22 4.34
2.37
‐
1.00
2.00
3.00
4.00
5.00
6.00
7.00
2008 2009 2010 2011 2012
Financial Assets‐to‐Liabilities

C o u n t y o f n e w e l l - 2 0 1 2 A n n u A l f i n A n C i A l R e p o R t
PAge 16
C o u n t y o f n e w e l l - 2 0 1 2 A n n u A l f i n A n C i A l R e p o R t
RepoRt fRoM the MAnAgeR of finAnce
Taxes Receivable as a % of Tax Levies
The following chart reflects the total uncollected property taxes as a percentage of the total tax levy. Every year, a percentage of property owners are unable to pay property taxes for a variety of reasons. If this percentage increases over time, it may indicate an overall decline in the County’s economic health. Additionally, as uncollected property taxes rise, liquidity decreases.
2008 2009 2010 2011 2012
Total Tax Levy (includes requisitions) 38,077,534 40,131,740 37,906,610 37,798,648 38,571,558 Taxes Receivable (before allowance)
Current 297,544 279,540 389,320 427,744 411,923 Arrears 386,589 436,631 532,931 452,891 498,988
684,133 716,171 922,251 880,635 910,911 Taxes Receivable as a %
of the Current LevyCurrent 0.78% 0.70% 1.03% 1.13% 1.07%Arrears 1.02% 1.09% 1.41% 1.20% 1.29%
Taxable Assessment3,814,704,390 4,151,150,920 3,898,515,520 3,879,853,980 3,990,255,860
Municipal Tax RatesResidential and Farmland 3.33% 3.33% 3.33% 3.33% 3.33%Non‐residential 6.69% 6.70% 6.70% 6.71% 6.71%
0.00%
0.20%
0.40%
0.60%
0.80%
1.00%
1.20%
1.40%
1.60%
2008 2009 2010 2011 2012
Taxes Receivable as a % of the Current Levy
Current Arrears
Page 16 -
Page 21 -
2008 2009 2010 2011 2012
Total Tax Levy (includes requisitions) 38,077,534 40,131,740 37,906,610 37,798,648 38,571,559 Taxes Receivable (before allowance)
Current 297,544 279,540 389,320 427,744 411,923 Arrears 386,589 436,631 532,931 452,891 498,988
684,133 716,171 922,251 880,635 910,911 Taxes Receivable as a %
of the Current LevyCurrent 0.78% 0.70% 1.03% 1.13% 1.07%Arrears 1.02% 1.09% 1.41% 1.20% 1.29%
Taxable Assessment3,814,704,390 4,151,150,920 3,898,515,520 3,879,853,980 3,990,255,860
Municipal Tax RatesResidential and Farmland 3.33% 3.33% 3.33% 3.33% 3.33%Non-residential 6.69% 6.70% 6.70% 6.71% 6.71%
2008 2009 2010 2011 2012
Government transfers for capital 8,426,937 26,771,730 13,323,847 17,648,743 9,710,706 Government transfers for operating 2,141,579 1,733,210 1,601,670 1,198,557 1,294,814
Total transfers 10,568,516 28,504,940 14,925,517 18,847,300 11,005,520 Total revenue 40,733,249 59,894,549 45,089,583 47,816,577 43,063,568
Government transfers-to-total revenue 25.9% 47.6% 33.1% 39.4% 25.6%
Transfers for capital-to-total transfers 79.7% 93.9% 89.3% 93.6% 88.2%Transfers for operating-to-total transfers 20.3% 6.1% 10.7% 6.4% 11.8%
C o u n t y o f n e w e l l - 2 0 1 2 A n n u A l f i n A n C i A l R e p o R t C o u n t y o f n e w e l l - 2 0 1 2 A n n u A l f i n A n C i A l R e p o R t
PAge 17
fleXibility Flexibility is the degree to which the County can change its debt burden or raise taxes to respond to rising commitments. Increasing debt and taxation reduces flexibility and the County’s ability to respond to changing circumstances.
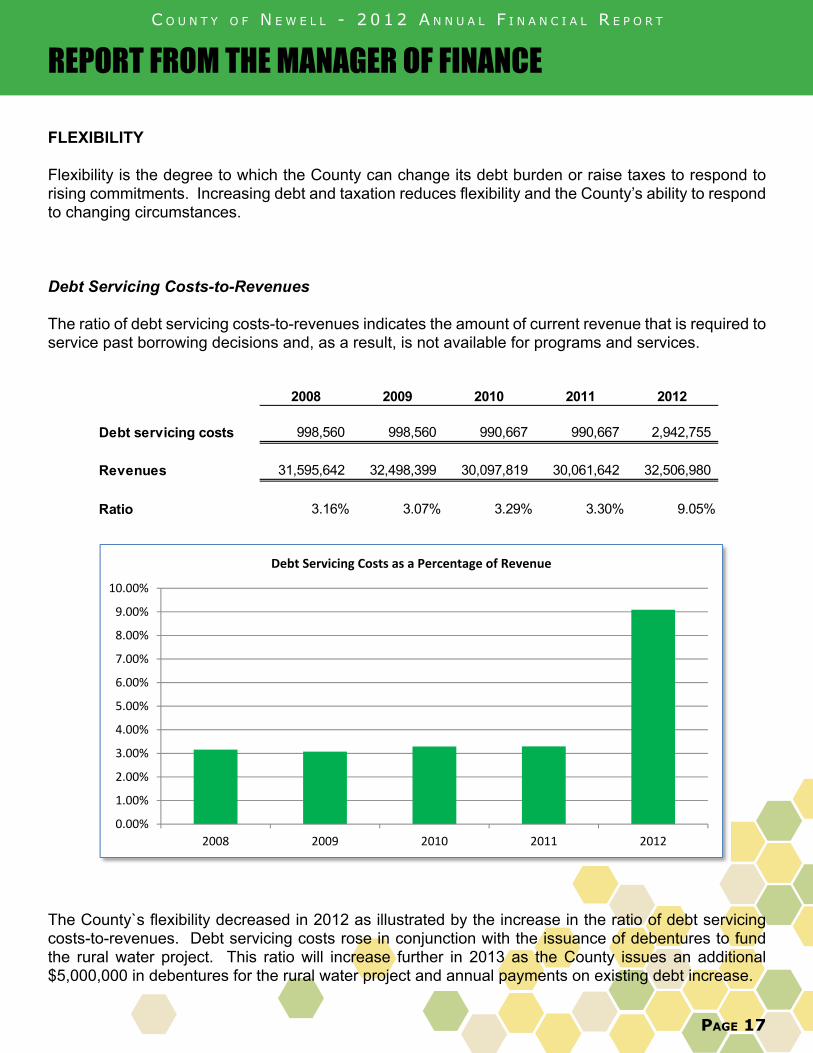
Debt Servicing Costs-to-Revenues The ratio of debt servicing costs-to-revenues indicates the amount of current revenue that is required to service past borrowing decisions and, as a result, is not available for programs and services.
The County`s flexibility decreased in 2012 as illustrated by the increase in the ratio of debt servicing costs-to-revenues. Debt servicing costs rose in conjunction with the issuance of debentures to fund the rural water project. This ratio will increase further in 2013 as the County issues an additional $5,000,000 in debentures for the rural water project and annual payments on existing debt increase.
RepoRt fRoM the MAnAgeR of finAnce
2008 2009 2010 2011 2012
Debt servicing costs 998,560 998,560 990,667 990,667 2,942,755
Revenues 31,595,642 32,498,399 30,097,819 30,061,642 32,506,980
Ratio 3.16% 3.07% 3.29% 3.30% 9.05%
0.00%
1.00%
2.00%
3.00%
4.00%
5.00%
6.00%
7.00%
8.00%
9.00%
10.00%
2008 2009 2010 2011 2012
Debt Servicing Costs as a Percentage of Revenue

C o u n t y o f n e w e l l - 2 0 1 2 A n n u A l f i n A n C i A l R e p o R t
PAge 18
C o u n t y o f n e w e l l - 2 0 1 2 A n n u A l f i n A n C i A l R e p o R t
Debt Limits and Debt Payments The County is limited in the amount of debt that it can incur beyond the limitations specified in Alberta Regulation 255/00. The maximum allowable debt the County could hold within this regulation is approximately $48.7 million. The County held outstanding debt balances representing 44.3% of this maximum allowable amount at the end of 2012. This leaves the County with approximately $27,166,000 of borrowing room.
Bylaw 1731-11, authorizing Council to incur indebtedness of up to $22,400,000 to assist with constructing the rural water distribution system, was passed on September 8, 2011. As at December 31, 2012 $17,400,000 has been drawn under this bylaw. This borrowing limits the flexibility of the County in financing future projects as the debt limit used is forecasted to increase to approximately 50% by the end of 2013.
RepoRt fRoM the MAnAgeR of finAnce
2008 2009 2010 2011 2012
Debt limitMaximum allowable debt 48,529,187 48,747,599 45,193,529 45,092,463 48,760,469Total debt 7,338,304 6,737,971 6,104,914 5,445,212 21,594,161Percentage used 15.1% 13.8% 13.5% 12.1% 44.3%
Maximum Allowable Annual Debt PaymentMaximum allowable annual debt payment 8,088,198 8,124,600 7,532,255 7,515,411 8,126,745 Annual payments on existing debt 998,560 998,560 990,667 990,667 2,942,755 Percentage used 12.3% 12.3% 13.2% 13.2% 36.2%
Debt Per Capita 1,069 949 860 767 3,182
Population 6,862 7,101 7,101 7,101 6,786 * Source: Alberta Municipal Affairs Statistics Profile

C o u n t y o f n e w e l l - 2 0 1 2 A n n u A l f i n A n C i A l R e p o R t C o u n t y o f n e w e l l - 2 0 1 2 A n n u A l f i n A n C i A l R e p o R t
PAge 19
restriCted surplus Restricted Surplus funds are included as part of the County’s accumulated surplus and details of these balances are disclosed in note 12 to the financial statements. Restricted surplus funds are a critical component of the County’s long-term financing plan. County Council adopted Restricted Surplus Policy 2012-PAD-062 on September 6, 2012. This policy establishes specific restricted surplus funds to: �� Stabilize tax rates in the face of variable and
uncontrollable factors (consumption, interest rates, unemployment rates, changes in subsidies)
�� Provide financing for one-time or short term requirements without permanently impacting the tax and utility rates
�� Make provisions for replacement or acquisitions of assets and infrastructure that are currently being consumed and amortized
�� Avoid spikes in funding requirements of the capital plan by reducing the reliance on long-term debt borrowings
�� Provide a source of internal financing�� Ensure adequate cash flows�� Provide flexibility to manage debt levels and protect the municipality’s financial position�� Provide for future liabilities incurred in the current year but paid for in the future
Restricted surplus offers liquidity which enhances the County’s flexibility in addressing operating requirements and in permitting the County to temporarily fund capital projects internally, allowing it time to access debt markets and take advantage of favourable conditions. The level of restricted surplus funds required will vary for a number of reasons including:�� Services provided by the County�� Age and condition of infrastructure, inventory of fleet and vehicles supporting County operations�� Economic conditions and projections �� Internal debt and restricted surplus policies
Restricted Surplus Policy 2012-PAD-062 specifies minimum balances to be maintained for the restricted surplus funds listed below. The County is in compliance with this policy as at December 31, 2012.
RepoRt fRoM the MAnAgeR of finAnce
46
48
50
52
54
56
58
2008 2009 2010 2011 2012Millions
Restricted Surplus Balance
Fund descriptionBalance at
Dec. 31, 2012Minimum Balance
Required % of minimum balance held
Infrastructure 10,357,044 9,994,596 104%Vehicles, Machinery & Equipment 6,004,010 3,371,053 178%Stabilization 2,847,112 2,591,337 110%Facilities 402,215 402,214 100%Fire Apparatus 250,000 250,000 100%

C o u n t y o f n e w e l l - 2 0 1 2 A n n u A l f i n A n C i A l R e p o R t
PAge 20
C o u n t y o f n e w e l l - 2 0 1 2 A n n u A l f i n A n C i A l R e p o R t
Tangible Capital Assets
The County’s tangible capital assets (TCA) increased by a net $33,868,822 in 2012 which includes new asset acquisitions of $38,237,553 offset by $3,896,602 in amortization expense and asset disposals with a net book value of $472,130.
Significant acquisitions include:�� $6,997,925 – Regional Water System�� $10,664,369 – Rural Water System�� $5,917,373 – New County Facilities�� $5,782,626 – Paving projects�� $2,101,272 – Scandia Storm Drainage�� $2,137,336 – Bridge Files�� $1,185,342– Machinery and equipment
Net Book Value of Tangible Capital Assets-to-Cost of Tangible Capital Assets Net book value of TCA compared to total cost of TCA measures the extent to which the estimated useful lives of the County’s tangible capital assets are available to provide its products and services.
As at December 31, 2012 approximately 77% of the County’s assets useful lives remain available to provide its services.
RepoRt fRoM the MAnAgeR of finAnce
‐
50,000
100,000
150,000
200,000
250,000
2008 2009 2010 2011 2012
Thou
sand
s
Net Book Value of Tangible Capital Assets‐to‐Cost of Tangible Capital Assets
NBV OF TCA COST OF TCA
C o u n t y o f n e w e l l - 2 0 1 2 A n n u A l f i n A n C i A l R e p o R t C o u n t y o f n e w e l l - 2 0 1 2 A n n u A l f i n A n C i A l R e p o R t
PAge 21
VulnerAbility
Vulnerability is the degree to which the County becomes dependent on, and therefore vulnerable to, sources of funding outside its control or influence. The lower the County’s own-source revenue is, the more it relies on fiscal decisions of others.
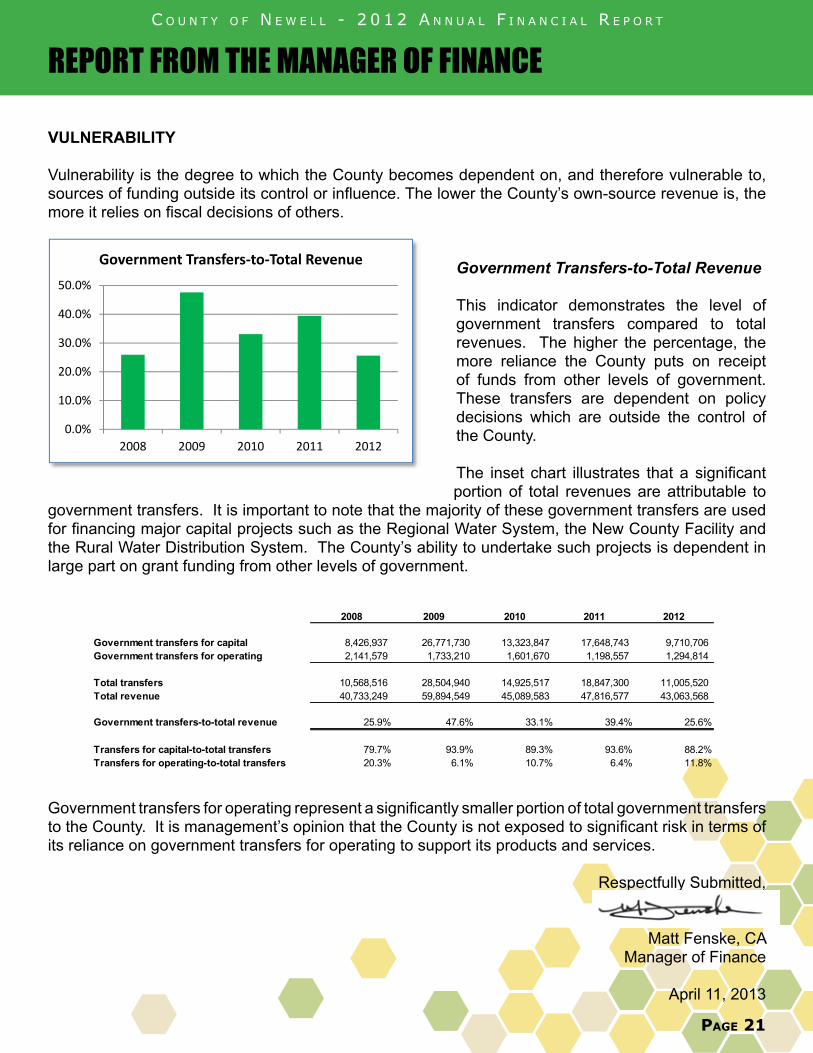
Government Transfers-to-Total Revenue This indicator demonstrates the level of government transfers compared to total revenues. The higher the percentage, the more reliance the County puts on receipt of funds from other levels of government. These transfers are dependent on policy decisions which are outside the control of the County. The inset chart illustrates that a significant portion of total revenues are attributable to
government transfers. It is important to note that the majority of these government transfers are used for financing major capital projects such as the Regional Water System, the New County Facility and the Rural Water Distribution System. The County’s ability to undertake such projects is dependent in large part on grant funding from other levels of government.
Government transfers for operating represent a significantly smaller portion of total government transfers to the County. It is management’s opinion that the County is not exposed to significant risk in terms of its reliance on government transfers for operating to support its products and services.
Respectfully Submitted,
Matt Fenske, CAManager of Finance
April 11, 2013
RepoRt fRoM the MAnAgeR of finAnce
0.0%
10.0%
20.0%
30.0%
40.0%
50.0%
2008 2009 2010 2011 2012
Government Transfers‐to‐Total RevenuePage 16 -
Page 21 -
2008 2009 2010 2011 2012
Total Tax Levy (includes requisitions) 38,077,534 40,131,740 37,906,610 37,798,648 38,571,559 Taxes Receivable (before allowance)
Current 297,544 279,540 389,320 427,744 411,923 Arrears 386,589 436,631 532,931 452,891 498,988
684,133 716,171 922,251 880,635 910,911 Taxes Receivable as a %
of the Current LevyCurrent 0.78% 0.70% 1.03% 1.13% 1.07%Arrears 1.02% 1.09% 1.41% 1.20% 1.29%
Taxable Assessment3,814,704,390 4,151,150,920 3,898,515,520 3,879,853,980 3,990,255,860
Municipal Tax RatesResidential and Farmland 3.33% 3.33% 3.33% 3.33% 3.33%Non-residential 6.69% 6.70% 6.70% 6.71% 6.71%
2008 2009 2010 2011 2012
Government transfers for capital 8,426,937 26,771,730 13,323,847 17,648,743 9,710,706 Government transfers for operating 2,141,579 1,733,210 1,601,670 1,198,557 1,294,814
Total transfers 10,568,516 28,504,940 14,925,517 18,847,300 11,005,520 Total revenue 40,733,249 59,894,549 45,089,583 47,816,577 43,063,568
Government transfers-to-total revenue 25.9% 47.6% 33.1% 39.4% 25.6%
Transfers for capital-to-total transfers 79.7% 93.9% 89.3% 93.6% 88.2%Transfers for operating-to-total transfers 20.3% 6.1% 10.7% 6.4% 11.8%

PAge 22
C o u n t y o f n e w e l l - 2 0 1 2 A n n u A l f i n A n C i A l R e p o R t
C o u n t y o f n e w e l l - 2 0 1 2 A n n u A l f i n A n C i A l R e p o R t
PAge 23
seCtion 2
consoliDAteDfinAnciAl stAteMents

PAge 24
C o u n t y o f n e w e l l - 2 0 1 2 A n n u A l f i n A n C i A l R e p o R t

C o u n t y o f n e w e l l - 2 0 1 2 A n n u A l f i n A n C i A l R e p o R t
PAge 25
mAnAgement’s responsibility for the ConsolidAted finAnCiAl stAtements
The accompanying consolidated financial statements and other information contained in this Financial Report are the responsibility of the management of the County of Newell No. 4 (the “County”).
These financial statements have been prepared by management using the accounting policies disclosed in the notes to these financial statements. Financial statements are not precise since they include certain amounts based on estimates and judgments. Management has determined such amounts on a reasonable basis in order to ensure that the financial statements are presented fairly, in all material respects.
The County maintains systems of internal accounting and administrative controls that are designed to provide reasonable assurance that the financial information is relevant, reliable and accurate and that the County’s assets are properly accounted for and adequately safeguarded.
The elected Council of the County of Newell No. 4 is responsible for ensuring that management fulfils its responsibilities for financial reporting.
The Council meets annually with management and the external auditors to discuss internal controls over the financial reporting process, auditing matters and financial reporting issues, and to satisfy itself that each party is properly discharging its responsibilities.
The consolidated financial statements have been audited by KPMG LLP, the external auditors, in accordance with Canadian generally accepted auditing standards. KPMG LLP has full and free access to Council.
County ManagerApril 11, 2013
consoliDAteD finAnciAl stAteMents

C o u n t y o f n e w e l l - 2 0 1 2 A n n u A l f i n A n C i A l R e p o R t
PAge 26
C o u n t y o f n e w e l l - 2 0 1 2 A n n u A l f i n A n C i A l R e p o R t
consoliDAteD finAnciAl stAteMents

C o u n t y o f n e w e l l - 2 0 1 2 A n n u A l f i n A n C i A l R e p o R t C o u n t y o f n e w e l l - 2 0 1 2 A n n u A l f i n A n C i A l R e p o R t
PAge 27
consoliDAteD finAnciAl stAteMents
1
COUNTY OF NEWELL Consolidated Statement of Financial Position December 31, 2012, with comparative figures for 2011 2012 2011 Financial assets:
Cash and temporary investments (note 2) $ 24,544,459 $ 26,438,521 Taxes and grants in place of taxes receivable (note 3) 890,911 860,635 Trade and other receivables 6,258,580 7,805,038 Land held for resale 35,139 35,139 Investments (note 4) 35,901,728 27,660,432 Notes receivable (note 5) 5,920,763 6,791,226 73,551,580 69,590,991
Financial liabilities:
Accounts payable and accrued liabilities 7,253,208 6,918,716 Employee benefit obligations (note 7) 321,915 233,205 Unearned revenue (note 8) 1,055,761 2,552,468 Long-term debt - operating (note 9) 4,479,144 5,095,521 Long-term debt - capital (note 10) 17,115,017 349,691 Provision for landfill closure and post-closure costs (note 11) 292,215 339,507 Provision for gravel pit closure and post-closure costs (note 11) 315,376 293,701 Deposit liabilities (note 2) 158,270 149,067 Other financial liabilities 7,371 99,885 30,998,277 16,031,761
Net financial assets 42,553,303 53,559,230 Non-financial assets:
Prepaid expenses 86,082 156,570 Tangible Capital Assets (note 6) 156,681,903 122,813,081 Inventory for consumption 1,122,799 953,361 157,890,784 123,923,012
Contingent liabilities (note 19) Accumulated surplus (note 12) $200,444,087 $177,482,242 The accompanying notes are an integral part of these consolidated financial statements.

C o u n t y o f n e w e l l - 2 0 1 2 A n n u A l f i n A n C i A l R e p o R t
PAge 28
C o u n t y o f n e w e l l - 2 0 1 2 A n n u A l f i n A n C i A l R e p o R t
consoliDAteD finAnciAl stAteMents
2
COUNTY OF NEWELL Consolidated Statement of Financial Activities Year ended December 31, 2012, with comparative figures for 2011 Budget 2012 2011 (Unaudited) Revenues:
Net municipal property taxes (note 13) $ 26,752,947 $ 26,174,091 $ 25,337,414 Special levies 858,431 711,465 685,797 User fees and sale of goods 929,890 988,258 828,787 Government transfers (note 14) 1,420,100 1,294,814 1,198,557 Penalties and cost of taxes 125,750 164,918 167,589 Investment income 653,254 1,736,993 1,371,013 Licenses and permits 75,000 166,302 70,292 Other revenue 1,124,437 1,393,890 271,655 Gain (loss) on disposal of tangible
capital assets 3,470,000 (123,751) 130,537 35,409,809 32,506,980 30,061,641
Expenses (note 15): Legislative 453,500 433,035 456,142 Administration 4,357,737 4,025,438 3,130,338 Corporate safety services 274,612 251,127 236,523 Fire and by-law enforcement 1,207,323 1,060,690 881,245 Disaster and emergency services 161,359 145,619 133,965 Roads, streets, walks and lighting 14,879,702 9,722,194 12,581,127 Airport 113,105 92,701 112,297 Water and waste water 1,023,576 1,195,158 2,906,261 Waste management 345,000 259,826 255,619 Family and community support 61,812 60,812 41,668 Municipal planning 341,424 380,354 260,789 Community and agricultural services 1,416,163 1,300,551 1,048,306 Subdivision land and development 368,460 265,710 174,056 Recreation and parks 768,912 767,826 731,661 Culture and library 140,682 140,682 139,473 Other - - 37,454 25,913,367 20,101,723 23,126,924
Excess of revenues over expenses before the undernoted 9,496,442 12,405,257 6,934,717
Other:
Contributed assets - 845,882 106,193 Government transfers (note 14) 16,869,872 9,710,706 17,648,743
Excess of revenues over expenses 26,366,314 22,961,845 24,689,653 Accumulated surplus, beginning of year 177,482,242 177,482,242 152,792,589 Accumulated surplus, end of period $203,848,556 $200,444,087 $ 177,482,242 The accompanying notes are an integral part of these consolidated financial statements.

C o u n t y o f n e w e l l - 2 0 1 2 A n n u A l f i n A n C i A l R e p o R t C o u n t y o f n e w e l l - 2 0 1 2 A n n u A l f i n A n C i A l R e p o R t
PAge 29
consoliDAteD finAnciAl stAteMents
3
COUNTY OF NEWELL Consolidated Statement of Change in Net Financial Assets December 31, 2012, with comparative figures for 2011 Budget 2012 2011 (Unaudited) Excess of revenues over expenses $26,366,314 $ 22,961,845 $ 24,689,653
Acquisition of tangible capital assets (61,134,218) (37,391,671) (28,471,766) Contributed tangible capital assets - (845,882) (106,193) Proceeds on disposal of tangible capital assets - 348,379 804,072 Amortization of tangible capital assets 5,634,802 3,896,602 3,538,428 (Gain) loss on disposal of tangible capital assets (3,470,000) 123,751 (130,537) (32,603,102) (10,906,976) 323,657 Use (acquisition) of inventories for consumption - (169,438) 33,423 Use (acquisition) of prepaid expenses - 70,487 (12,784) Change in net financial assets (25,663,102) (11,005,927) 344,296 Net financial assets, beginning of year 53,559,230 53,559,230 53,214,934 Net financial assets, end of period $20,956,128 $ 42,553,303 $ 53,559,230 The accompanying notes are an integral part of these consolidated financial statements.
C o u n t y o f n e w e l l - 2 0 1 2 A n n u A l f i n A n C i A l R e p o R t
PAge 30
C o u n t y o f n e w e l l - 2 0 1 2 A n n u A l f i n A n C i A l R e p o R t
consoliDAteD finAnciAl stAteMents
4
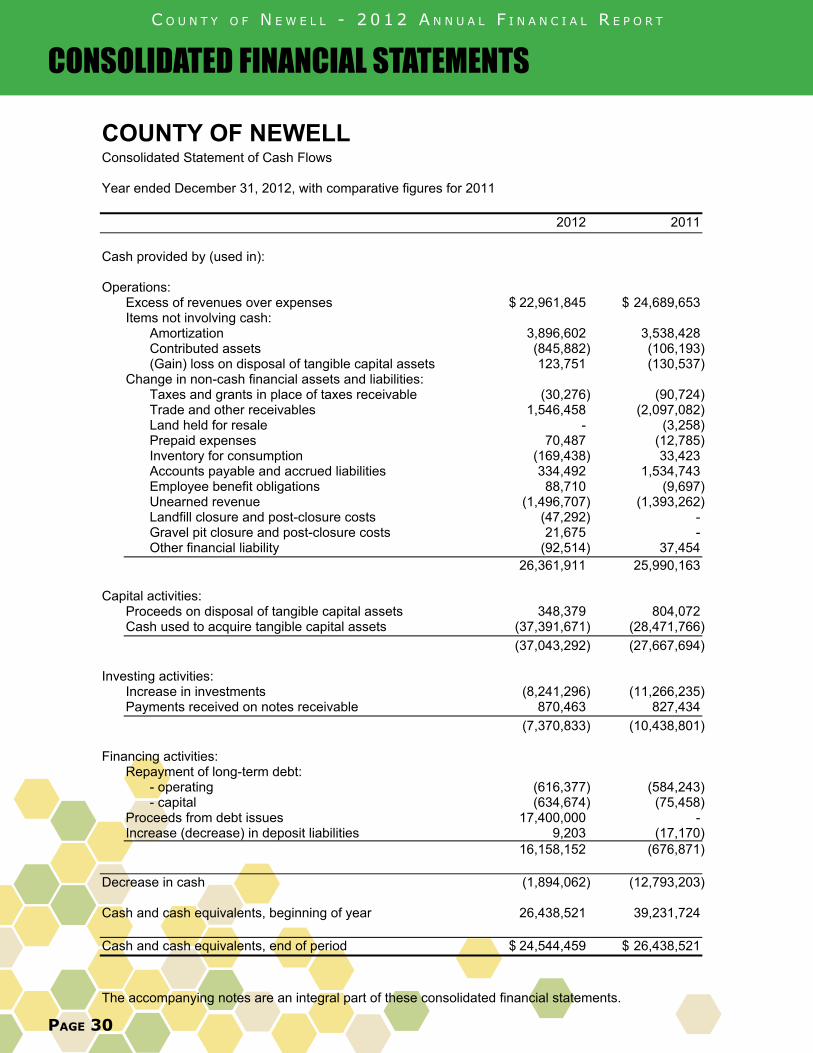
COUNTY OF NEWELL Consolidated Statement of Cash Flows Year ended December 31, 2012, with comparative figures for 2011 2012 2011 Cash provided by (used in): Operations:
Excess of revenues over expenses $ 22,961,845 $ 24,689,653 Items not involving cash:
Amortization 3,896,602 3,538,428 Contributed assets (845,882) (106,193) (Gain) loss on disposal of tangible capital assets 123,751 (130,537)
Change in non-cash financial assets and liabilities: Taxes and grants in place of taxes receivable (30,276) (90,724) Trade and other receivables 1,546,458 (2,097,082) Land held for resale - (3,258) Prepaid expenses 70,487 (12,785) Inventory for consumption (169,438) 33,423 Accounts payable and accrued liabilities 334,492 1,534,743 Employee benefit obligations 88,710 (9,697) Unearned revenue (1,496,707) (1,393,262) Landfill closure and post-closure costs (47,292) - Gravel pit closure and post-closure costs 21,675 - Other financial liability (92,514) 37,454
26,361,911 25,990,163 Capital activities:
Proceeds on disposal of tangible capital assets 348,379 804,072 Cash used to acquire tangible capital assets (37,391,671) (28,471,766) (37,043,292) (27,667,694)
Investing activities:
Increase in investments (8,241,296) (11,266,235) Payments received on notes receivable 870,463 827,434 (7,370,833) (10,438,801)
Financing activities:
Repayment of long-term debt: - operating (616,377) (584,243) - capital (634,674) (75,458)
Proceeds from debt issues 17,400,000 - Increase (decrease) in deposit liabilities 9,203 (17,170) 16,158,152 (676,871)
Decrease in cash (1,894,062) (12,793,203) Cash and cash equivalents, beginning of year 26,438,521 39,231,724 Cash and cash equivalents, end of period $ 24,544,459 $ 26,438,521 The accompanying notes are an integral part of these consolidated financial statements.

C o u n t y o f n e w e l l - 2 0 1 2 A n n u A l f i n A n C i A l R e p o R t C o u n t y o f n e w e l l - 2 0 1 2 A n n u A l f i n A n C i A l R e p o R t
PAge 31
consoliDAteD finAnciAl stAteMents
5
COUNTY OF NEWELL Notes to Consolidated Financial Statements Year ended December 31, 2012 1. Significant accounting policies:
The consolidated financial statements of the County of Newell (the “County”) are the representations of management prepared in accordance with accounting principles for local governments as established by the Public Sector Accounting Board of the Canadian Institute of Chartered Accountants. Significant aspects of the accounting policies adopted by the County are as follows:
(a) Cash and cash equivalents:
Cash and cash equivalents include cash on hand and short-term deposits which are highly liquid with original maturities of less than three months from the date of acquisition.
(b) Reporting entity:
The consolidated financial statements reflect the assets, liabilities, revenues and expenses, changes in net financial assets and cash flows of the County, which comprises of all the organizations that are owned or controlled by the County and are, therefore accountable to the Council for the administration of their financial affairs and resources.
All significant inter-department transactions and balances are eliminated on consolidation.
Taxes levied also include requisitions for educational, health care, social and other external organizations that are not part of the County.
The statements exclude trust assets that are administered for the benefit of external parties.
(c) Basis of accounting:
The financial statements are prepared using the accrual basis of accounting. The accrual basis of accounting records revenue as it is earned and measurable. Expenses are recognized as they are incurred and measurable based upon receipt of goods or services and/or the legal obligation to pay.
Funds from external parties and earnings thereon restricted by agreement or legislation are accounted for as deferred revenue until used for the purpose specified.
(d) Investments:
Investments are recorded at cost. Where there has been a loss in value of an investment other than a temporary decline, the investment is written down to reflect the loss.
(e) Requisition over-levy and under-levy:
Over-levies and under-levies arise from the difference between the actual property tax levy made to cover each requisition and the actual amount requisitioned.
If the actual levy exceeds the requisition, the over-levy is accrued as a liability and property tax revenue is reduced. Where the actual levy is less than the requisition amount, the under-levy is accrued as a receivable and as property tax revenue.
Requisition tax rates in the subsequent year are adjusted for any over-levies for the prior year.

C o u n t y o f n e w e l l - 2 0 1 2 A n n u A l f i n A n C i A l R e p o R t
PAge 32
C o u n t y o f n e w e l l - 2 0 1 2 A n n u A l f i n A n C i A l R e p o R t
consoliDAteD finAnciAl stAteMents
COUNTY OF NEWELL Notes to Consolidated Financial Statements Year ended December 31, 2012
1. Significant accounting policies (continued):
(f) Inventories:
Land held for resale is recorded at the lower of cost and net realizable value. Cost includes costs for land acquisition and improvements required to prepare the land for servicing such as clearing, stripping, and leveling charges. Related development costs incurred to provide infrastructure such as water and waste water services, roads, sidewalks and street lighting are recorded as capital assets under their respective function.
(g) Landfill and gravel pit closure and post-closure costs:
Pursuant to the Alberta Environment Protection and Enhancement Act, the County is required to fund the closure of its landfill site and gravel pits and provide for post-closure care. Closure and post-closure activities include the final clay cover, landscaping, as well as surface and ground water monitoring, leachate control and visual inspection. The requirement is being provided for over the estimated remaining life of the landfill site and gravel pit based on usage.
(h) Government transfers:
Government transfers are recognized in the financial statements as revenues in the period that the events giving rise to the transfer occurred, providing the transfers are authorized, all eligibility criteria have been met by the County, and reasonable estimates of the amounts can be made.
(i) Non-financial assets:
Non-financial assets are not available to discharge existing liabilities and are held for use in the provision of services. They have useful lives extending beyond the current year and are not intended for sale in the normal course of operations.
(i) Tangible capital assets:
Tangible capital assets are recorded at cost which includes all amounts that are directly attributable to acquisition, construction, development or betterment of the asset. The cost, less residual value, of the tangible capital assets is amortized on a straight-line basis over the estimated useful life as follows: Years
Land Improvements 15-45 Buildings 25-70 Engineered structures 15-75 Machinery and equipment 5-40 Vehicles 5-14
Assets under construction are not amortized until the asset is available for productive use.

C o u n t y o f n e w e l l - 2 0 1 2 A n n u A l f i n A n C i A l R e p o R t C o u n t y o f n e w e l l - 2 0 1 2 A n n u A l f i n A n C i A l R e p o R t
PAge 33
consoliDAteD finAnciAl stAteMents
7
COUNTY OF NEWELL Notes to Consolidated Financial Statements Year ended December 31, 2012
1. Significant accounting policies (continued):
(i) Non-financial assets (continued):
(ii) Contributions of tangible capital assets:
Tangible capital assets received as contributions are recorded at fair value at the date of receipt and recorded as revenue.
(iii) Inventories
Inventories of materials and supplies held for consumption are recorded at the lower of cost and replacement cost with cost determined by the average cost method.
(iv) Cultural and historical tangible capital assets:
Works of art for display are not recorded as tangible capital assets but are disclosed.
(j) Pension expenses:
The County participates in a multi-employer defined benefit pension plan, wherein contributions for current and past service pension benefits are recorded as expenses in the year in which they become due.
(k) Use of estimates:
The preparation of the financial statements in conformity with generally accepted accounting principles requires management to make estimates and assumptions that affect the reported amounts of assets and liabilities and disclosure of contingent assets and liabilities at the date of the financial statements and the reported amounts of revenues and expenses during the reporting period. Significant areas requiring the use of management estimates relate to the determination of allowance for doubtful accounts, provision for closure and post-closure care, employee benefit obligations and the useful life of tangible capital assets.
Contributions of tangible capital assets are recorded at estimated fair value at the date of receipt.
Actual results could differ from those estimates.

C o u n t y o f n e w e l l - 2 0 1 2 A n n u A l f i n A n C i A l R e p o R t
PAge 34
C o u n t y o f n e w e l l - 2 0 1 2 A n n u A l f i n A n C i A l R e p o R t
consoliDAteD finAnciAl stAteMents
8
COUNTY OF NEWELL Notes to Consolidated Financial Statements Year ended December 31, 2012
2. Cash and temporary investments:
2012 2011 Cash $ 3,749,538 $ 16,923,576 Temporary investments 20,794,921 9,514,945 $ 24,544,459 $ 26,438,521 Included in cash are amounts aggregating $158,270 (2011 - $149,067) not available for current use. Also included in cash and temporary investments is $6,698,261 of unexpended debt proceeds.
The temporary investments have an average interest rate of 1.57% (2011 – 1.33%). 2012 2011 Tax sale surplus $ 12,254 $ 12,114 Public reserve 146,016 136,953 $ 158,270 $ 149,067
3. Taxes and grants in place of taxes receivable:
2012 2011 Current year $ 411,923 $ 427,744 Arrears 498,988 452,891 910,911 880,635 Allowance for uncollectible taxes (20,000) (20,000) $ 890,911 $ 860,635

C o u n t y o f n e w e l l - 2 0 1 2 A n n u A l f i n A n C i A l R e p o R t C o u n t y o f n e w e l l - 2 0 1 2 A n n u A l f i n A n C i A l R e p o R t
PAge 35
consoliDAteD finAnciAl stAteMents
9
COUNTY OF NEWELL Notes to Consolidated Financial Statements Year ended December 31, 2012
4. Investments: 2012 2011 Fixed income securities $ 35,828,243 $ 27,586,947 Credit Union Common shares 5 5 Newell Regional Services Corporation:
Common shares 20 20 Preferred shares 73,460 73,460 73,480 73,480
$ 35,901,728 $ 27,660,432 Long-term investments consist of fixed income securities that yield interest rates from 1.34% to 6.54% and mature in periods 2013 through 2026. The investments have an average expected yield of 2.73% and an aggregate market value of $36,225,703 (2011 - $27,586,947).
5. Notes receivable:
2012 2011 Newell Foundation, repayable in annual installments of
$896,630 including interest at 5.5%, maturing in 2018. $ 4,479,144 $ 5,095,521 Tilley and District Fire Association, repayable in annual
installments of $96,327 including interest at 3.497%, 660,908 731,649 maturing in 2020. Newell Regional Services Corporation, non-interest bearing, maturing in 2017. 550,000 550,000 Division 5 & 10, repayable in annual installments of
$131,082 including interest at 5.25%, maturing in 2013. 124,542 242,873 Bow Slope Fire Division, repayable in annual installments of
$32,113 including interest at 4.39%, maturing in 2013. 30,763 60,231 Rolling Hills Fire Division, repayable in annual installments of
$39,585 including interest at 3.954%, maturing in 2014. 75,406 110,952 $ 5,920,763 $ 6,791,226

C o u n t y o f n e w e l l - 2 0 1 2 A n n u A l f i n A n C i A l R e p o R t
PAge 36
C o u n t y o f n e w e l l - 2 0 1 2 A n n u A l f i n A n C i A l R e p o R t
consoliDAteD finAnciAl stAteMents
10
COUNTY OF NEWELL Notes to Consolidated Financial Statements Year ended December 31, 2012
6. Tangible capital assets: Cost 2011 Additions Disposals 2012 Land $ 5,326,320 $ 11,250 $ -- $ 5,337,570 Land improvements 997,981 115,495 -- 1,113,476 Buildings 1,119,418 94,060 -- 1,213,478 Engineered structures 97,911,265 18,101,395 (422,971) 115,589,689 Machinery and equipment 8,964,683 1,185,342 (619,458) 9,530,567 Vehicles 3,394,713 489,076 (180,000) 3,703,789 Work in progress 47,985,399 18,240,935 -- 66,226,334 Total $ 165,699,779 $38,237,553 $ (1,222,429) 202,714,903 Accumulated Amortization amortization 2011 Disposals expense 2012 Land improvements $ 265,188 $ -- $ 93,455 $ 358,643 Buildings 420,821 -- 24,963 445,784 Engineered structures 37,482,084 (292,446) 2,788,744 39,978,382 Machinery and equipment 2,960,784 (314,853) 725,122 3,371,053 Vehicles 1,757,821 (143,001) 264,318 1,879,138 Total $ 42,886,698 $ (750,300) $ 3,896,602 $ 46,033,000
Net book value 2012 2011 Land $ 5,337,570 $ 5,326,320 Land improvements 754,833 732,793 Buildings 767,694 698,597 Engineered structures 75,611,307 60,429,181 Machinery and equipment 6,159,514 6,003,899 Vehicles 1,824,651 1,636,892 Work in progress 66,226,334 47,985,399 Total $156,681,903 $122,813,081

C o u n t y o f n e w e l l - 2 0 1 2 A n n u A l f i n A n C i A l R e p o R t C o u n t y o f n e w e l l - 2 0 1 2 A n n u A l f i n A n C i A l R e p o R t
PAge 37
consoliDAteD finAnciAl stAteMents
11
COUNTY OF NEWELL Notes to Consolidated Financial Statements Year ended December 31, 2012 7. Employee benefit obligation:
Vacation
The vacation liability is comprised of the vacation that employees are deferring to future years. Employees have either earned the benefits (and are vested) or are entitled to these benefits within the next budgetary year.
8. Unearned Revenue: Recognized as
Description 2011 Additions revenue 2012 Rural Water Deposits $ 1,670,971 $ 11,700 $ (1,020,361) $ 662,310 Street Improvement Grant -- 173,520 -- 173,520 Other 881,497 203,926 (865,492) 219,931 Total $ 2,552,468 $ 389,146 $ (1,885,853) 1,055,761
9. Long-term debt – operating:
2012 2011 Debenture supported with notes receivable $ 4,479,144 $ 5,095,521
Principal and interest repayments are due as follows:
Principal Interest Total 2013 $ 650,277 $ 246,353 $ 896,630 2014 686,043 210,587 896,630 2015 723,775 172,855 896,630 2016 763,583 133,047 896,630 2017 805,580 91,050 896,630 Thereafter 849,886 46,743 896,629 $ 4,479,144 $ 900,635 $ 5,379,779
Debenture debt is repayable to Alberta Capital Finance Authority and bears interest at 5.5% per annum, before Provincial subsidy, and matures in 2018. Debenture debt is issued on the credit and security of the County of Newell at large.
Interest on long-term debt amounted to $341,841 (2011 – $304,567).
The County’s total cash payments for interest in 2012 were $280,253 (2011 - $342,845).

C o u n t y o f n e w e l l - 2 0 1 2 A n n u A l f i n A n C i A l R e p o R t
PAge 38
C o u n t y o f n e w e l l - 2 0 1 2 A n n u A l f i n A n C i A l R e p o R t
consoliDAteD finAnciAl stAteMents
12
COUNTY OF NEWELL Notes to Consolidated Financial Statements Year ended December 31, 2012
10. Long-term debt – capital:
2012 2011 Tax supported debentures $ 17,115,017 $ 349,691
Principal and interest repayments are due as follows: Principal Interest Total 2013 $ 1,665,739 $ 380,386 $ 2,046,125 2014 1,705,169 340,956 2,046,125 2015 1,745,575 300,550 2,046,125 2016 1,698,792 260,080 1,958,872 2017 1,737,393 221,479 1,958,872 Thereafter 8,562,349 501,598 9,063,947 $ 17,115,017 $ 2,005,049 $ 19,120,066
Debenture debt is repayable to Alberta Capital Finance Authority and bears interest at rates ranging from 2.177% to 7.125% per annum, before Provincial subsidy, and matures in periods 2015 through 2022. The average annual interest rate is 2.28% for 2012 (2011 – 4.57%). For qualifying debentures, the Province of Alberta rebates 60% of interest in excess of 8%, 9% and 11% to a maximum annual rate of 12.5%, depending on the date borrowed. Debenture debt is issued on the credit and security of the County of Newell at large.
Interest on long-term debt amounted to $173,917 (2011 - $21,346).
The County’s total cash payments for interest in 2012 were $155,855 (2011 - $18,577).
11. Provision for landfill and gravel pit closure and post-closure costs:
Alberta environmental law requires closure and post-closure care of landfill sites, which includes final covering and landscaping, pumping of ground water and leachates from the site, and on-going environmental monitoring, site inspections and maintenance.
The accrued liability for the remaining post-closure costs of the County’s landfill and closure and post-closure costs for the County’s gravel pit is based on an estimate of future discounted costs.
The estimated closure and post-closure costs for the landfill are $292,215 and $315,376 for the gravel pits, all of which have been accrued in the financial statements.
The County has not designated assets for settling closure and post-closure liabilities.

C o u n t y o f n e w e l l - 2 0 1 2 A n n u A l f i n A n C i A l R e p o R t C o u n t y o f n e w e l l - 2 0 1 2 A n n u A l f i n A n C i A l R e p o R t
PAge 39
consoliDAteD finAnciAl stAteMents
13
COUNTY OF NEWELL Notes to Consolidated Financial Statements Year ended December 31, 2012 12. Accumulated surplus:
Equity in
tangible Unrestricted capital Restricted Total Total net assets assets (1) Surplus (2) 2012 2011
Beginning
balance $ 4,317,204 $122,463,390 $50,701,648 $177,482,242 $152,792,589 Excess of revenues over expenses 22,961,845 -- -- 22,961,845 24,689,653 Transfer to
restricted surplus (15,382,507) -- 15,382,507 -- -- Transfers from
restricted surplus 16,082,804 -- (16,082,804) -- -- Amortization of
tangible capital assets 3,896,602 (3,896,602) -- -- --
Net book value of assets disposed 472,130 (472,130) -- -- --
Capital assets internally funded (26,689,932) 26,689,932 -- -- --
Capital assets debt funded (10,701,739) 10,701,739 -- -- -- Contributed capital
assets (845,882) 845,882 -- -- -- Debt issued 17,400,000 (17,400,000) -- -- -- Unexpended debt (6,698,261) 6,698,261 -- -- -- Debt paid (634,674) 634,674 -- -- -- Total $ 4,177,590 $146,265,146 $50,001,351 $200,444,087 $177,482,242
(1) Equity in tangible capital assets:
2012 2011 Tangible capital assets $ 202,714,902 $ 165,699,779 Accumulated amortization (46,033,000) (42,886,698) Long-term debt (note 9) (17,115,017) (349,691) Unexpended debt 6,698,261 -- $ 146,265,146 $ 122,463,390

C o u n t y o f n e w e l l - 2 0 1 2 A n n u A l f i n A n C i A l R e p o R t
PAge 40
C o u n t y o f n e w e l l - 2 0 1 2 A n n u A l f i n A n C i A l R e p o R t
consoliDAteD finAnciAl stAteMents
14
COUNTY OF NEWELL Notes to Consolidated Financial Statements Year ended December 31, 2012 12. Accumulated surplus (continued):
(2) Restricted surplus is comprised of funds internally restricted as follows: 2012 2011
Paving $ 10,730,423 $ 13,117,298 Infrastructure 10,357,044 -- Future Expenditure 13,041,337 -- Vehicles, Machinery & Equipment 6,004,010 -- Regional Enhancement 3,684,072 6,370,691 Stabilization 2,847,112 -- Facilities 402,215 -- Fire Apparatus 250,000 63,165 Unexpended Budget Appropriation 2,685,138 -- Municipal Surplus -- 9,706,571 Administration -- 13,042,616 Secondary highway #847 -- 700,145 Agriculture Service Board -- 740,636 Planning -- 141,668 Disaster Services -- 71,023 Special Constable -- 64,928 Shop -- 70,212 Public Works -- 5,912,339 Public Transportation -- 136,919 Economic Development -- 118,025 Rolling Hills water and sewer -- 80,817 Scandia water reservoir -- 69,185 Patricia sewer -- 73,484 Lake Newell sewer -- 31,626 Corporate Safety -- 4,300 Water -- 56,000 Sewer -- 108,000 Parks -- 22,000
$ 50,001,351 $ 50,701,648

C o u n t y o f n e w e l l - 2 0 1 2 A n n u A l f i n A n C i A l R e p o R t C o u n t y o f n e w e l l - 2 0 1 2 A n n u A l f i n A n C i A l R e p o R t
PAge 41
consoliDAteD finAnciAl stAteMents
15
COUNTY OF NEWELL Notes to Consolidated Financial Statements Year ended December 31, 2012 13. Net municipal property taxes:
Budget 2012 2011 (Unaudited)
Taxation: Real property taxes $ 13,611,477 $ 12,942,564 $ 12,602,000 Linear property taxes 25,407,884 25,407,884 24,927,486 Government grants in place of property
taxes 228,429 221,111 269,162 39,247,790 38,571,559 37,798,648
Requisitions: Alberta School Foundation Fund 11,830,795 11,733,419 11,830,796 Newell Foundation 664,048 664,049 630,438 12,494,843 12,397,468 12,461,234 Net municipal property taxes $ 26,752,947 $ 26,174,091 $ 25,337,414
14. Government transfers:
Budget 2012 2011 (Unaudited)
Transfers for operating: Provincial government $ 987,346 $ 938,457 $ 1,035,371 Federal government 27,200 - 30,969 Local government 405,554 356,357 132,217 1,420,100 1,294,814 1,198,557
Transfers for capital: Provincial government 16,869,872 9,640,616 17,076,929 Local government - 70,090 571,814 16,869,872 9,710,706 17,648,743
$ 18,289,972 $ 11,005,520 $ 18,847,300

C o u n t y o f n e w e l l - 2 0 1 2 A n n u A l f i n A n C i A l R e p o R t
PAge 42
C o u n t y o f n e w e l l - 2 0 1 2 A n n u A l f i n A n C i A l R e p o R t
consoliDAteD finAnciAl stAteMents
16
COUNTY OF NEWELL Notes to Consolidated Financial Statements Year ended December 31, 2012 15. Expenses by object:
Budget 2012 2011 (Unaudited)
Salaries, wages and benefits $ 7,419,098 $ 6,626,248 $ 6,063,168 Contracted and general services 6,613,127 3,829,256 6,532,596 Materials, goods, supplies and utilities 3,591,801 2,495,296 2,401,879 Transfers to organizations 2,283,092 2,530,290 4,039,138 Bank charges and short-term interest 600 596 508 Interest on long-term debt 282,847 442,926 325,913 Other expenditures 88,000 280,509 225,294 Amortization 5,634,802 3,896,602 3,538,428 $ 25,913,367 $ 20,101,723 $ 23,126,924
16. Salary and benefits disclosure:
Disclosure of salaries and benefits for elected municipal officials and the chief administrative officer as required by provincial regulation is as follows: 2012 2011 Benefits & Salary (1) Allowances (2) Total Total Council: Division 1 $ 31,635 $ 5,835 $ 37,470 $ 33,192 Division 2 27,523 582 28,105 34,291 Division 3 33,525 5,867 39,392 40,569 Division 4 22,273 1,122 23,395 22,936 Division 5 22,911 1,148 24,059 35,552 Division 6 24,390 4,586 28,976 30,588 Division 7 28,572 5,666 34,238 34,062 Division 8 30,428 1,451 31,879 32,803 Division 9 47,733 2,202 49,935 45,305 Division 10 27,488 5,623 33,111 34,751 $ 296,478 $ 34,082 $ 330,560 $ 344,049 Chief Administrative Officer $ 190,632 $ 38,970 $ 229,602 $ 226,311
C o u n t y o f n e w e l l - 2 0 1 2 A n n u A l f i n A n C i A l R e p o R t C o u n t y o f n e w e l l - 2 0 1 2 A n n u A l f i n A n C i A l R e p o R t
PAge 43
consoliDAteD finAnciAl stAteMents
17
COUNTY OF NEWELL Notes to Consolidated Financial Statements Year ended December 31, 2012 16. Salary and benefits disclosure (continued):
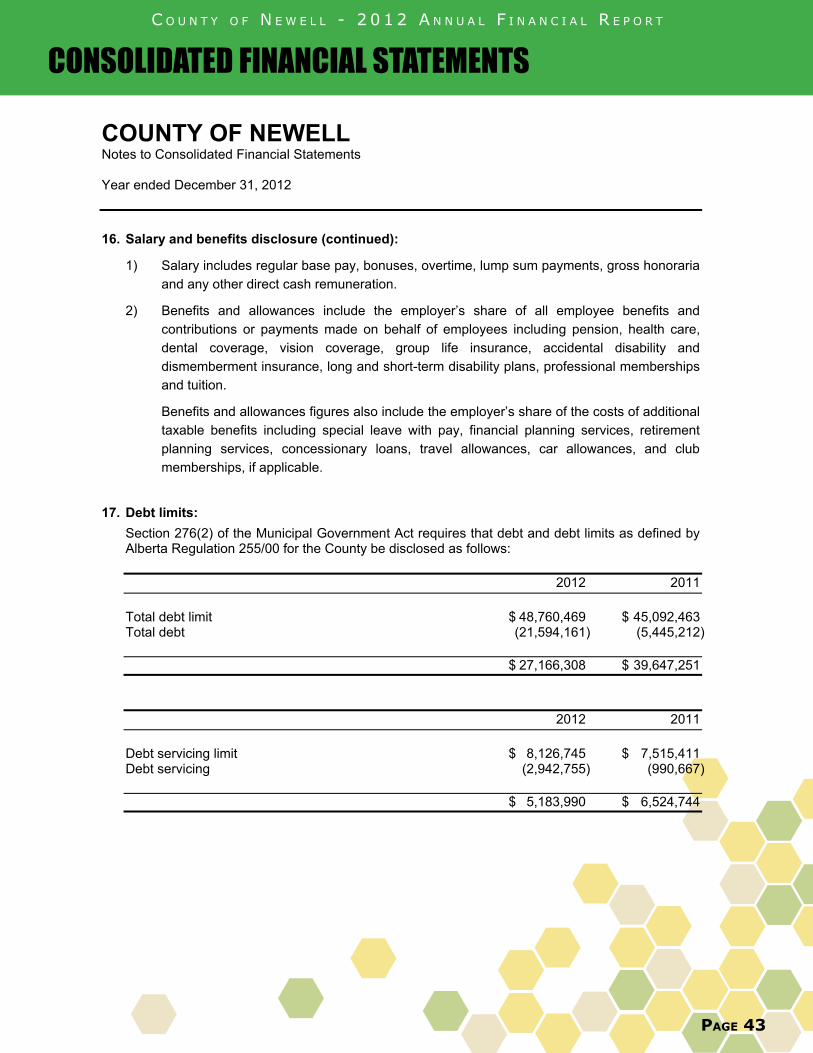
1) Salary includes regular base pay, bonuses, overtime, lump sum payments, gross honoraria and any other direct cash remuneration.
2) Benefits and allowances include the employer’s share of all employee benefits and contributions or payments made on behalf of employees including pension, health care, dental coverage, vision coverage, group life insurance, accidental disability and dismemberment insurance, long and short-term disability plans, professional memberships and tuition.
Benefits and allowances figures also include the employer’s share of the costs of additional taxable benefits including special leave with pay, financial planning services, retirement planning services, concessionary loans, travel allowances, car allowances, and club memberships, if applicable.
17. Debt limits:
Section 276(2) of the Municipal Government Act requires that debt and debt limits as defined by Alberta Regulation 255/00 for the County be disclosed as follows:
2012 2011 Total debt limit $ 48,760,469 $ 45,092,463 Total debt (21,594,161) (5,445,212) $ 27,166,308 $ 39,647,251
2012 2011 Debt servicing limit $ 8,126,745 $ 7,515,411 Debt servicing (2,942,755) (990,667) $ 5,183,990 $ 6,524,744

C o u n t y o f n e w e l l - 2 0 1 2 A n n u A l f i n A n C i A l R e p o R t
PAge 44
C o u n t y o f n e w e l l - 2 0 1 2 A n n u A l f i n A n C i A l R e p o R t
consoliDAteD finAnciAl stAteMents
18
COUNTY OF NEWELL Notes to Consolidated Financial Statements Year ended December 31, 2012 17. Debt limits (continued):
The debt limit is calculated at 1.5 times revenue of the County (as defined in Alberta Regulation 255/00) and the debt service limit is calculated at 0.25 times such revenue. Incurring debt beyond these limitations requires approval by the Minister of Municipal Affairs. These thresholds are guidelines used by Alberta Municipal Affairs to identify municipalities which could be at financial risk if further debt is acquired. The calculation taken alone does not represent the financial stability of the County. Rather, the financial statements must be interpreted as a whole.
18. Local authorities pension plan:
The County participates in a multi-employer defined benefit pension plan. This plan is accounted for as a defined contribution plan.
Employees of the County participate in the Local Authorities Pension Plan (LAPP), which is one of the plans covered by the Public Sector Pension Plans Act. The LAPP serves about 214,326 people and about 423 employers. The LAPP is financed by employer and employee contributions and investment earnings of the LAPP fund.
Contributions for current service are recorded as expenditures in the year in which they become due. The County is required to make current service contributions to the Plan of 9.91% of pensionable earnings up to the year’s maximum pensionable earnings under the Canada Pension Plan and 13.74% on pensionable earnings above this amount. Employees of the County are required to make current service contributions of 8.91% of pensionable salary up to the year’s maximum pensionable salary and 12.74% on pensionable salary above this amount.
Total current service contributions by the County to the LAPP in 2012 were $410,759 (2011 - $359,721). Total current service contributions by the employees of the County to the LAPP in 2012 were $373,677 (2011 - $325,775).
At December 31, 2011, the LAPP disclosed an actuarial deficiency of $4.6 billion.

C o u n t y o f n e w e l l - 2 0 1 2 A n n u A l f i n A n C i A l R e p o R t C o u n t y o f n e w e l l - 2 0 1 2 A n n u A l f i n A n C i A l R e p o R t
PAge 45
consoliDAteD finAnciAl stAteMents
19
COUNTY OF NEWELL Notes to Consolidated Financial Statements
Year ended December 31, 2012
19. Contingent liabilities:
The County of Newell is a member of the Alberta Municipal Insurance Exchange (MUNIX). Under the terms of membership, the County of Newell could become liable for its proportionate share of any claim losses in excess of the funds held by the exchange. Any liability incurred would be accounted for as a current transaction in the year the losses are determined.
The County has been named defendant in legal actions. In the opinion of management this matter is without substantial merit and no provision has been made in the accounts.
20. Recent accounting pronouncements:
The Public Sector Accounting Board recently announced the following accounting pronouncements:
(a) Liability for contaminated sites:
This accounting pronouncement establishes standards on how to account for and report a liability associated with the remediation of contaminated sites. It is effective for fiscal years beginning on or after April 1, 2014, with early adoption encouraged.
(b) Government transfers:
This accounting pronouncement establishes standards on how to account for and report government transfers to individuals, organizations, and other governments from both a transferring government and a recipient government perspective. It is effective for fiscal years beginning on or after April 1, 2012, with early adoption encouraged.
(c) Financial instruments:
This accounting pronouncement establishes standards on how to account for and report all types of financial instruments including derivatives. Financial instruments include primary instruments and derivative instruments. It is effective for fiscal years beginning on or after April 1, 2015 for governments and for fiscal years beginning on or after April 1, 2012 for government organizations, with early adoption encouraged.
(d) Foreign currency translation:
This accounting pronouncement establishes standards on how to account for and report transactions that are denominated in a foreign currency in government financial statements. It is effective for fiscal years beginning on or after April 1, 2015 for governments and for fiscal years beginning on or after April 1, 2012 for government organizations, with early adoption encouraged.
Management is assessing the impact of the adoption of these standards which is not known or reasonably estimable at this time.

C o u n t y o f n e w e l l - 2 0 1 2 A n n u A l f i n A n C i A l R e p o R t
PAge 46
C o u n t y o f n e w e l l - 2 0 1 2 A n n u A l f i n A n C i A l R e p o R t
consoliDAteD finAnciAl stAteMents
20
COUNTY OF NEWELL Notes to Consolidated Financial Statements
Year ended December 31, 2012
21. Segment Disclosures:
Segment disclosures (Schedule 1) are intended to enable users to better understand the government reporting entity and the major expense and revenue activities of the County.
The segments have been selected based upon functional activities provided by the County. For each reported segment, revenues and expenses represent both amounts directly attributable to the segment and amounts that are allocated on a reasonable basis. The functional areas that have been separately disclosed, along with the services they provide are as follows:
(a) General government is comprised of Council, Legislative, Corporate Administration, Finance, Information and Computer Services, Planning, Economic Development, Corporate Safety, Agricultural Services, Fire and Disaster Services, Bylaw Enforcement, Community Services, Recreation, Parks and Programs and Library.
(b) Public Works and Transportation is comprised of Roads and Engineering Services.
(c) Public Utilities is comprised of Water, Wastewater and Solid Waste.
22. Budget data:
The unaudited budget data presented in these consolidated financial statements is based upon the 2012 budget approved by Council on December 22, 2011 and any subsequent budget adjustments.
23. Approval of financial statements:
These financial statements were approved by Council and Management.

C o u n t y o f n e w e l l - 2 0 1 2 A n n u A l f i n A n C i A l R e p o R t C o u n t y o f n e w e l l - 2 0 1 2 A n n u A l f i n A n C i A l R e p o R t
PAge 47
scheDule of segMenteD DisclosuRes
COUNTY OF NEWELL Schedule 1Schedule of Segmented Disclosures
Year ended December 31, 2012, with comparative figures for 2011
General Government
Public Works and
Transportation Public Utilities Total
2012 General
Government
Public Works and
Transportation Public Utilities Total
2011
RevenueNet taxes for municipal purposes 26,174,091$ -$ -$ 26,174,091$ 25,337,414$ -$ -$ 25,337,414$ Special levies 658,598 - 52,867 711,465 624,498 - 61,299 685,797 User Fees and sale of goods 532,828 221,442 233,988 988,258 427,612 120,924 280,251 828,787 Government transfers - operating 899,075 395,739 - 1,294,814 797,345 401,212 - 1,198,557 Penalties and costs of taxes 164,918 - - 164,918 167,589 - - 167,589 Investment income 1,736,993 - - 1,736,993 1,155,798 215,215 - 1,371,013 License and permits 166,302 - - 166,302 70,292 - - 70,292 Other 300,242 73,287 1,020,361 1,393,890 128,033 31,293 112,329 271,655 Gain (loss) on disposal of capital assets 9,364 (133,115) - (123,751) 9,537 121,000 - 130,537
30,642,411 557,353 1,307,216 32,506,980 28,718,118 889,644 453,879 30,061,641
Salaries, wages and benefits 3,700,379 2,925,869 - 6,626,248 3,079,985 2,983,183 - 6,063,168 Contracted and general services 1,222,880 2,179,404 426,972 3,829,256 1,044,504 5,072,805 415,287 6,532,596 Materials, goods, supplies and utilities 931,130 1,105,422 458,744 2,495,296 732,203 1,243,982 425,694 2,401,879 Transfer to Organization 2,255,975 - 274,315 2,530,290 1,844,588 2,194,550 - 4,039,138 Bank charges and short term interest 596 - - 596 508 - - 508 Interest on long-term debt 280,254 - 162,672 442,926 307,336 - 18,577 325,913 Other expenditures 165,650 114,859 - 280,509 35,719 189,575 - 225,294 Amortization 367,680 3,396,641 132,281 3,896,602 248,109 3,182,547 107,772 3,538,428
8,924,544 9,722,195 1,454,984 20,101,723 7,292,952 14,866,642 967,330 23,126,924
Excess (deficiency) of revenue overexpenses before the undernoted 21,717,867 (9,164,842) (147,768) 12,405,257 21,425,166 (13,976,998) (513,451) 6,934,717
Contributed assets 162,000 246,494 437,388 845,882 106,193 - - 106,193 Government transfers - capital 1,929,223 1,649,507 6,131,976 9,710,706 8,433,378 2,109,984 7,105,381 17,648,743 Excess (deficiency) of revenue over
expenses for the year 23,809,090$ (7,268,841)$ 6,421,596$ 22,961,845$ 29,964,737$ (11,867,014)$ 6,591,930$ 24,689,653$

PAge 48
C o u n t y o f n e w e l l - 2 0 1 2 A n n u A l f i n A n C i A l R e p o R t
Photo by Bruce Parker, Brooks Bulletin

C o u n t y o f n e w e l l - 2 0 1 2 A n n u A l f i n A n C i A l R e p o R t
PAge 49
seCtion 3
stAtisticAl section

C o u n t y o f n e w e l l - 2 0 1 2 A n n u A l f i n A n C i A l R e p o R t
PAge 50
C o u n t y o f n e w e l l - 2 0 1 2 A n n u A l f i n A n C i A l R e p o R t
Demographics & Other StatisticsstAtisticAl section
Demographics & Other Statistics
2008 2009 2010 2011 2012
Population* 6,862 6,862 7,101 7,101 6,786
Households 2,781 2,815 2,842 2,857 2,957
Area in hectares 623,537 623,537 623,537 623,537 623,537
Continuous full-time employees 57 55 54 55 55
Debt supported by property taxes 579,840 504,421 425,150 349,691 17,115,017
Debt supported by notes receivable 6,758,464 6,233,550 5,679,764 5,095,521 4,479,144
Debt per capita 1,069 949 860 767 3,182
Annual surplus 20,658,875 27,859,930 22,190,324 24,689,653 22,961,845
Accumulated surplus 101,827,656 129,687,586 152,792,589 177,482,242 200,444,087
Net financial assets 51,696,054 55,022,926 53,214,934 53,559,230 42,553,303
Permits Issued:Building Permit 101 76 69 58 90 Electrical Permit 223 360 201 166 202 Gas Permit 112 57 61 67 81 Plumbing Permit 54 39 30 32 51 Private Sewage Permit 18 25 17 17 21
508 557 378 340 445 *Source: Alberta Municipal Affairs Statistics Prof ile

C o u n t y o f n e w e l l - 2 0 1 2 A n n u A l f i n A n C i A l R e p o R t C o u n t y o f n e w e l l - 2 0 1 2 A n n u A l f i n A n C i A l R e p o R t
PAge 51
Expenses by Function & Expenses by ObjectstAtisticAl section
Expenses by Function
Expenses by Object
EXPENSES 2008 2009 2010 2011 2012
Legislative 411,868$ 419,156$ 438,302$ 456,142$ 433,035$ Administration 5,020,940 4,197,280 2,900,474 3,130,338 4,025,438 Corporate safety services 197,892 216,334 238,257 236,523 251,127 Fire and bylaw enforcement 926,748 953,991 1,032,879 881,245 1,060,690 Disaster and emergency services 91,733 12,314 180,571 133,965 145,619 Roads, streets, walks and lighting 8,503,831 10,142,187 8,628,420 12,581,127 9,722,194 Airport - - 90,641 112,297 92,701 Water and waste water 2,304,183 13,464,843 6,612,354 2,906,261 1,195,158 Waste management 233,743 234,308 249,413 255,619 259,826 Family and community support 40,880 41,217 43,949 41,668 60,812 Municipal planning 168,179 216,496 224,308 260,789 380,354 Community and agricultural services 1,308,869 1,141,585 1,140,078 1,048,306 1,300,551 Subdivision land and development 15,700 166,050 171,491 174,056 265,710 Recreation and parks 674,439 701,270 733,752 731,661 767,826 Culture and library 123,720 137,222 138,125 139,473 140,682 Other 51,649 (9,634) 76,245 37,454 -
TOTAL EXPENSES BY FUNCTION 20,074,374$ 32,034,619$ 22,899,259$ 23,126,924$ 20,101,723$
EXPENSES 2008 2009 2010 2011 2012
Salaries, wages and benefits 5,395,633$ 5,499,995$ 5,731,502$ 6,063,168$ 6,626,248$ Contracted and general services 4,314,291 4,850,898 3,354,805 6,532,596 3,829,256 Materials, goods, supplies and utilities 2,217,314 2,009,729 1,935,961 2,401,879 2,495,296 Transfers to organizations 5,932,034 16,327,408 8,150,298 4,039,138 2,530,290 Bank charges and short-term interest 563 528 497 508 596 Interest on long-term debt 428,683 391,030 357,911 325,913 442,926 Other expenditures 104,892 70,262 38,960 225,294 280,509 Amortization 1,680,964 2,884,769 3,329,325 3,538,428 3,896,602
TOTAL EXPENSES BY OBJECT 20,074,374$ 32,034,619$ 22,899,259$ 23,126,924$ 20,101,723$

C o u n t y o f n e w e l l - 2 0 1 2 A n n u A l f i n A n C i A l R e p o R t
PAge 52
Revenues by SourcestAtisticAl section
Revenues by Source
REVENUES 2008 2009 2010 2011 2012
Net municipal property taxes 25,368,889$ 27,529,024$ 25,357,073$ 25,337,414$ 26,174,091$Special levies 811,565 725,363 784,728 685,797 711,465 User fees and sale of goods 685,892 800,859 798,453 828,787 988,258 Government transfers 2,141,579 1,733,210 1,601,670 1,198,557 1,294,814 Penalties and cost of taxes 76,391 112,218 138,669 167,589 164,918 Investment income 2,388,286 1,448,226 1,180,134 1,371,013 1,736,993 Licenses and permits 31,495 27,125 30,700 70,292 166,302 Other revenue 122,375 161,852 114,928 271,655 1,393,890 Gain (loss) on disposal of tangible capital assets (30,830) (39,478) 91,464 130,537 (123,751) Operating revenues 31,595,642 32,498,399 30,097,819 30,061,641 32,506,980
Other:Contributed assets 710,670 624,420 1,667,917 106,193 845,882 Government transfers 8,426,937 26,771,730 13,323,847 17,648,743 9,710,706
9,137,607 27,396,150 14,991,764 17,754,936 10,556,588
TOTAL REVENUE 40,733,249$ 59,894,549$ 45,089,583$ 47,816,577$ 43,063,568$