2012-2013 operating budget - hampton city schools
TRANSCRIPT
HAMPTON CITY SCHOOLS
School Board’s Final Approved Budget
Fiscal 2012-2013
HAMPTON CITY PUBLIC SCHOOLS
SCHOOL BOARD OPERATING BUDGET
FISCAL YEAR 2012-2013
APPROVED MARCH 28, 2012 by SCHOOL BOARD
APPROVED MAY 16, 2012 by CITY COUNCIL
REVISIONS APPROVED JUNE 6, 2012 by SCHOOL BOARD
1 Franklin Street Hampton, VA 23669
http://hampton.k12.va.us/

HAMPTON CITY SCHOOLS TABLE OF CONTENTS
INTRODUCTORY
City of Hampton School Board 2011-2012.…………………………….……………….….1 Division Structure ………..……………………………………………………………………2 Superintendent’s Budget Message ...……………………………………………………….3 Executive Summary Budget Process………………………………………………………………………. 5 Fiscal Year 2013 Budget Approach and Challenges…………………………… 5 School Board Strategic Goals……………………………………………………….. 6 Budget Format ……..………………………………………………………….……. 7 Future Challenges…………………………………………………………………... 7 Population Changes in Hampton…………………………………………………. 8 School Enrollment…………………………………………………………………… 8 Fiscally Dependent School Division………………………………………………. 10 Capital Improvement Plan………………………………………………………….. 10 Parent Satisfaction Survey…………………………………………………………. 13 MGT Efficiency Review…………………………………………………………….. 13 Academic Efficiency of Dollars Spent…………………………………………….. 14 Per Capita Spending……………………………………………… ……………….. 15 Summary of Operating Fund Revenue…………………………………………… 16 Local Funding Formula…………………………………………………………….. 17 Graph of Local Contribution FY09-FY13…………………………………………. 19 Chart of Changes in Local Contribution and Total Budget FY09-FY13………. 20 Summary of Personnel Resource Changes….. ………………………………… 21 Financial Overview – Expenditures….. ………………………………………….. 22 Summary of Major Operating Expenditure Changes……………………………. 23 Summary of Funds…………………………………………………………………. 25 Division Performance Highlights……………………………………………………27 Chart of Student Population by Gender and Ethnicity…………………………...28 ASBO Meritorious Budget Award for Fiscal 2011-2012………………………….29 ORGANIZATIONAL Geographical Area and Location………………………………………………………….. 31 Hampton History and Facts……………………….……………………………………….. 32 Hampton City School Division………………………………………….………………..... 33 Strategic Plan 2010-2015…………………………………………………………………... 33 Mission, Values and Goals…………………………………………………………………. 33 Area Map of Hampton City Schools………………………………………………………..36 Hampton City Schools Strategic Plan 2015 Summary………………………………….. 37 Hampton City Schools Organizational Chart 2011-2012………………….....…………. 38 Budget Development Process………………………………………………………………39
i
HAMPTON CITY SCHOOLS TABLE OF CONTENTS
FY13 Process….….………………………………………………………………….40 Budget Administration and Management………….………………………………41 Decision Flowchart Model………………………………………..………………… 43 Decision Process Model……………………………………….............................. 44
Budget Development Calendar……………………………………………………………..46 Organization of Financial Data……………...……………………………………………... 48
FINANCIAL
Revenues and Expenditures – Significant Trends and Assumptions.………………… 51
Revenues…………………………………………………………………………….. 51 State…………………………………………………………………………...51 Federal……………………………………………………………………….. 52 Local………………………………………………………………….………. 52 Miscellaneous……………………………………………………………….. 53
Expenditures……………………………………………………………………….... 53 Instruction……………………………………………………………………. 53 Administration/Attendance and Health…………………………………… 54 Pupil Transportation………………………………………………………… 54 Operations and Maintenance……………………………………………… 54 Technology………………………………………………………………….. 54 Graph of Expenditures by Category……………………………………… 54 School Construction Fund…………………………………………………. 55
Composite Index of Local Ability to Pay…………………………………………………. 57 Total Budget Summary for All Funds…………………………………………………….. 58 Operating Fund (Fund 50)…………………………………………………………………. 59 School Operating Fund Revenues and Expenditure Summary…………………………60 Revenue Summary……..…………………………………………………………………… 61 Revenue Detail……..……………………………………………………………………….. 62 State Revenue Summary and Definitions…….………………………………………….. 63
Chart – Revenue as % of Total Budget…….…………………………………….. 64 Cost String Glossary………………………………………………………………………... 65 Comparative Expenditures by Category and Classification ……..…………………….. 67
Chart – Expenditures by State Function Categories……………………………. 68 Chart – Expenditures by Classification…………………………………………… 69
Comparative Expenditure Summary by Program and Category……………………….. 70 Program Expenditures by Cost Center FY13…………………………………………….. 74
Chart – Expenditures by Cost Center FY13……………………………………… 78 Program Expenditures by Cost Center FY12…………………………………………….. 79 Program Expenditures by Category FY13………………………………………………... 83 Program Expenditures by Category FY12.……………………………………………….. 86 Comparative Expenditures by Category and Object Code
Category 1 – Instruction……………………………………………………………. 90 Category 2 – Administration/Attendance and Health...…………………………. 98 Category 3 – Pupil Transportation...……………………………………………...104 Category 4 – Operations and Maintenance..…………………………………….106
ii
HAMPTON CITY SCHOOLS TABLE OF CONTENTS
Category 7 – Fund Transfers………………..…………………………………… 110 Category 9 – Technology...………………………………………...................... 112
Operating Fund Comparative Expenses by Program FY13..………………………… 117 Operating Fund Budgeted Expenses by Department FY13………………………….. 215 Other Funds Food and Nutrition Services Budget (Fund 51)……………………………………… 299 Reimbursable Projects Fund Budget (Fund 60) ......….…………..………………… 304 Student Activities Fund Budget (Fund 94).………..…………………………………. 307
INFORMATIONAL
Overview of Hampton City Schools.…………………………………………………….. 311 Summary of Revenues, Expenditures and Changes in Fund Balance Operating Fund……………………………………………………………………. 312 Food and Nutrition Services Fund………………………………………………..313 Reimbursable Projects Fund……………………………………………………...314 Student Activities Fund…………………………………………………………….315 Peer Comparison of Per Pupil Expenditures FY11…………………………………..... 316 Hampton City Schools Per Pupil Expenditures FY98 – FY13………………………… 317 Enrollment Forecasting and Historical Data……………………………………………..318 Actual Enrollment by School FY06 – FY12...…………………………………………… 319 Actual and Projected ADM FY03 – FY15...…………………………………………….. 320 Per Pupil Allocations FY13...………………………………………………………………321 Impact Aid Funding Data…………………………………………………………………. 322 School Staffing Formulas...…………………………………………………………….... 323 Operating Fund Position Overview...………………………………………...……….… 324 Operating Fund Position Summary by Program and Category…………………….... 325 Performance Measures…………………………………………………………………… 331 Hampton City Schools Commitment to Excellence...……………………………….… 338 Glossary of Key Financial Terms…..………………………………………………….… 342
Compensation Plan 2012-2013 School Year Teacher Pay Scale FY13……..…………………………………………………............. 347 General Salary Scale for Exempt Positions FY13…………………………………….. 349 Hourly Pay Scale for Non-Exempt Positions FY13…………………………………… 351 Job Classifications FY13…………………………………………………………………. 352 Athletic Supplement Schedule FY13……………………………………………………. 360 Co-Curricular Supplement Schedule FY13…………………………………………….. 361 Education Supplement Schedule FY13………………………………………………… 362 General Supplement Schedule FY13……....…………………………………………... 363 Substitute Pay Rates FY13...……………………………………………………………. 364 Hampton City Schools Non-Discrimination Notice…………………………………….. 365
iii

INTRODUCTORY

Phyllis T. HenryVice Chairman
Fred A. Brewer, Jr.Chairman
Dr. Linda Shifflett Ed. D.Superintendent
Dr. Linda Shifflett Ed. D.Superintendent
Dr. Linda Shifflett Ed. D.Superintendent
Joseph C. KilgoreLinwood D. Harper Jennifer PhillipsMartha Mugler William D. Pearson
City of Hampton 2011-2012
In collaboration with our community, Hampton City Schools ensures academic excellence for every child, every day, whatever it takes.
We believe that the developmental needs of children are central to every aspect of the opera-tions of Hampton City Schools and that interactions with our stakeholders must be governed by our core values—integrity, responsibility, innovation, excel-lence, and professionalism.
1
HAMPTON CITY PUBLIC SCHOOLS DIVISION STRUCTURE
FY 2011-2012 The Hampton City School Board is a seven member group of citizens elected to serve four year overlapping terms. The School Board is charged by the statutes of Virginia and the regulations of the Virginia Board of Education to provide and operate the public schools of Hampton, Virginia. It is the function of the Board to set general school policy and, within the framework of Virginia Board of Education regulations, to establish guidelines that will ensure the proper administration of the city school program.
Mr. Fred A. Brewer, Jr. Mrs. Phyllis T. Henry
Chairman Vice Chairman
Chesapeake District Chesapeake District
MEMBERS Mr. Joseph Kilgore Mr. Linwood D. Harper
Chesapeake District Hampton Roads District
Mrs. Martha Mugler Mrs. Jennifer Phillips
At-Large Districts Hampton Roads District
William D. Pearson
Hampton Roads District
Dr. Linda M. Shifflette
Superintendent
Mrs. Nanci Reaves Ms. Carolyn Bowers School Board Attorney Clerk of the Board
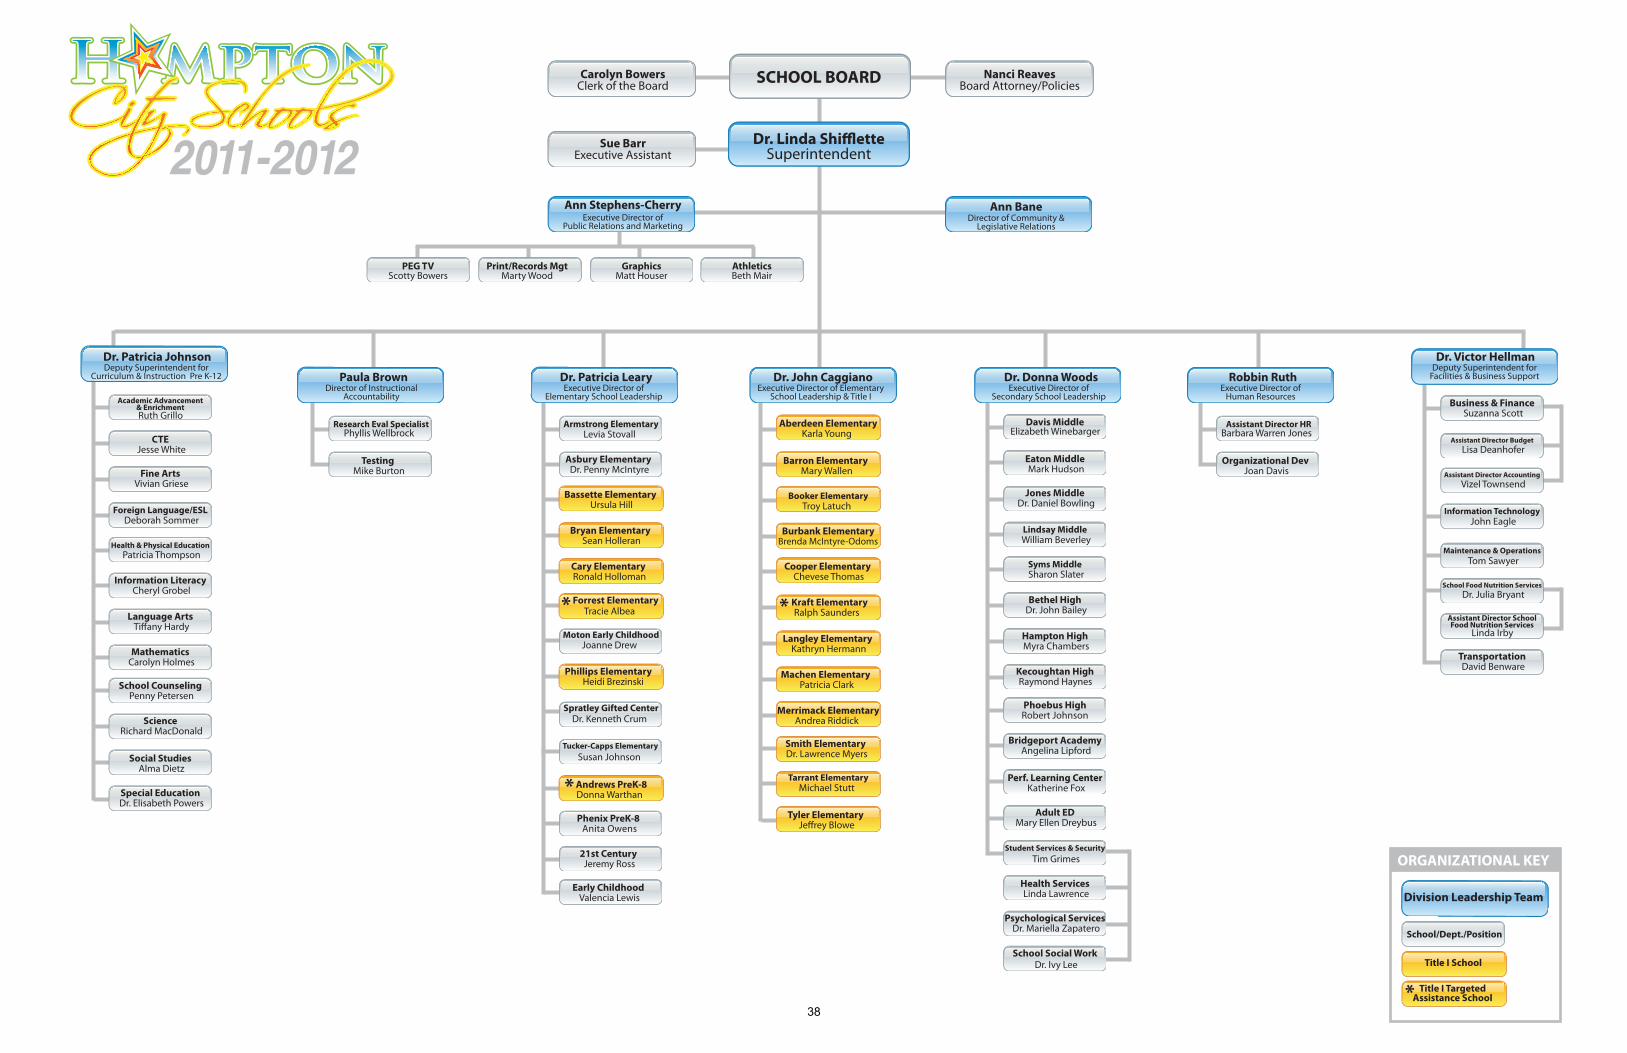
DIVISION LEADERSHIP TEAM Curriculum and Instruction Pre K-12, Deputy Superintendent………………Dr. Patricia Johnson Facilities and Business Support, Deputy Superintendent……………………....Dr. Victor Hellman Instructional Accountability, Executive Director………….………………….……Mrs. Paula Brown Elementary School Leadership, Executive Director….…………………….…...Dr. John Caggiano Elementary School Leadership, Executive Director ….…………….…………… Dr. Patricia Leary Secondary School Leadership, Executive Director……..……………………….Dr. Donna Woods Human Resources, Executive Director…………………………………….………Mrs. Robbin Ruth Public Relations and Communications, Director………………………. Mrs. Ann Stephens-Cherry Community and Legislative Relations, Director…………………………….…… ….Mrs. Ann Bane
2
Mr. Fred A. Brewer, Jr., Chairman l Ms. Phyllis T. Henry, Vice ChairmanMr. Linwood D. Harper l Mr. Joseph C. Kilgore l Ms. Martha M. Mugler l Mr. William D. Pearson l Ms. Jennifer P. Phillips
One Franklin Street l Hampton, Virginia 23669-3570 l www.sbo.hampton.k12.va.us
AMERICA’S FIRSTIN FREE EDUCATION
School Board of the City of Hampton
June 30, 2012
Dear Citizens of Hampton:
We are pleased to present to you the School Board’s Adopted Budget for 2012-2013. This budget was approved by the School Board at its meeting on March 28, 2012, and by City Council on May 16, 2012. The total approved budget is $191,909,156, which represents an increase of $7,017,683 or 3.8%, over 2011-2012.
Although it appears that our school division received a significant increase, the majority of the additional fund-ing is going to mandatory cost increases, primarily a 6.04% increase in the Virginia Retirement System (VRS) rates for retirement, group life insurance and the retiree health care credit. The annual contribution to the Hampton Employees Retirement System (HERS) also increases by just over $2M. Additional funding is also received based on a projected increase in our March Average Daily Membership (ADM), a significant funding driver. One of the most significant changes to come out of the 2012 General Assembly session is a change in the way VRS receives its funding. For over twenty years, the majority of school divisions were allowed to pay the 5% employee share of the VRS retirement cost. As of July 1, 2012, this is no longer the case. The 5% must be passed back to the employee no later than July 1, 2016 (phased in at no less than 1% per year) with a com-mensurate salary increase. Therefore, our FY13 budget includes passing 1% of the VRS employee share back to the employee, as well as a 1% salary increase for all full-time employees. In addition, this budget includes the addition of 69.4 net new full-time equivalent (FTE) positions, the majority (86%) being teachers, instructional assistants and cafeteria monitors (transferred from the Education Jobs Fund).
The local composite index (LCI), a measure of a locality’s wealth, is recalculated each biennium. In 2010-2011, the new composite index for Hampton City Schools was calculated as .2690, an increase of .0332. Beginning with FY13, the LCI has again been recalculated and is now .2912, an increase of .0222 over the previous bien-nium. This change equates to a loss of approximately $3M per year in state funding. In addition, due to the impact of the continuing decline in real property values, local contribution is down by 2.14%, or $1.42M. Of the $64,925,178 appropriated by the city for local contribution, $898,570 is included as a one-time contribution to fund the final year of lease payments for the facility on Commander Sheppard Boulevard (formerly Bridge-port Academy) and to fund transportation to Jones Magnet Middle School and Cooper Elementary School. As of FY14, we will have completed the move to The Campus at Lee and will no longer need the rented facility. In addition, we propose to eliminate transportation at Jones and Cooper as of the 2013-2014 school year.
As part of our continued restructuring to meet the needs of the division in light of reduced funding, staffing formulas were developed in FY10 to ensure that schools are staffed equitably and appropriately according to
3

their needs. Formulas were developed for the following positions: Assistant Principals, School Nurses, School Counselors, Deans, Instructional Assistants, School Security Officers, Custodians, Cafeteria Monitors, Health Clerks, Librarians, Library Clerical, School Clerical, and Food Services (part of Fund 51). These staffing for-mulas were again reviewed for FY13 with no additional changes made.
The FY13 budget maintains the health insurance premiums at the same level as FY12 and includes a premium holiday for employees in November and December 2012. We have also maintained class size and are imple-menting online benchmark testing for all grades 2-11 as of Fall 2012. The athletic fee for Virginia High School League (VHSL) sports has been raised from $5 to $20 per VHSL activity to help offset the cost of participating in these programs. The budget also consolidates the division’s alternative and adult education learning programs into one facility, the former Lee Elementary, renamed to The Campus at Lee. This facility will now house Adult Education, the Performance Learning Center and Bridgeport Academy. In addition, Merrimack Elementary has been consolidated and the division is exploring options for the facility.
On the non-personnel side, changes include a reduction in expenditures for census, surveys and reports, VPSA funding (due to the consolidation of Merrimack), technology software, unemployment insurance, self-insur-ance, supplies, leases and rental of buildings, and utilities. The division will also maintain a mandatory shutdown for four days during winter break (a utility cost saving measure). Other non-personnel changes include cost increases to city services such as School Resource Officers and Procurement.
Revenues are based on a projected enrollment (March 2013 ADM) of 20,700 students. This reflects an increase in average daily membership of 100 students over that budgeted for FY12. This estimate is based on both current and projected statewide and division trends. While enrollment is still declining, the rate of decline has slowed significantly, and more quickly than anticipated. This translates into an increase of just over $500K total in per pupil funded state revenue. In addition, the budget reflects $1.3M in state funding provided for additional assistance to school divisions to support increased retirement employer contribution rates, inflation costs, and one-time costs associated with Virginia Preschool Initiative programs.
In conclusion, we have worked hard to fund those items that most directly impact services to our children. As we move forward, we will continue to deliver quality services to every child, every day, whatever it takes. We believe that the developmental needs of children are central to every aspect of the operation of Hampton City Schools and that all interactions with our stakeholders must be governed by our core values - integrity, respon-sibility, innovation, excellence, and professionalism. There is no greater single investment that a city can make than to support the public schools. Money invested in our public schools pays remarkable dividends. Whether excellence is defined in academics or athletics, Hampton City Schools can point with pride to its students and their achievements.
Thank you to each of our staff and community members for supporting Hampton City Schools and for helping us to equip students with the knowledge and opportunities necessary for 21st century success. Together we will continue to make Hampton City Schools the place to be!
Fred A. Brewer, Jr. Linda M. ShiffletteChairman, Hampton City School Board Superintendent of Schools
4
EXECUTIVE SUMMARY
Budget Process State code requires that the School Board present a balanced budget to the city on or before April 1. The annual budget process begins in September with the development of the budget calendar. The regular process of sending budget templates out to all department heads for completion was followed for the FY13 budget, modified slightly to have principals meet with their Executive Directors to review the DAPPIF flowchart rather than completing the process individually. Department heads also submitted their DAPPIF results to their respective Division Leadership Team (DLT) member for review. Meetings were held December 2-15, 2011 with final input provided to Finance by December 16, 2011. As each meeting was held, DLT members reviewed each department’s budget with the principal/department head in order to determine if there were mandatory new costs that needed to be captured, and to review potential reductions that could be made. The flowchart developed for FY10 to facilitate the decision-making process (shown on page 43) was again used for FY13. The School Board conducted three public hearings on the Superintendent’s Proposed Operating Budget (Fund 50). The initial budget was presented on March 7 and the budgets for Funds 51 (Food and Nutrition Services), 60 (Reimbursable Projects) and 94 (Student Activities) on March 14. All four budgets were adopted on March 28, 2012. Because school divisions in the Commonwealth of Virginia are fiscally dependent on the local government, after the School Board approves the budget it is forwarded to the City Council of the City of Hampton for their consideration. The City Council must approve a budget for educational purposes by May 15 or within 30 days of the receipt by the municipality of the estimates of state funds, whichever shall later occur (Code of VA §22.1-93). If City Council makes adjustments to the School Board’s request, the School Board is required to adjust its budget within the parameters of state law. The final School Board Adopted Budget is approved by late May or early June (if changes have been made since the School Board initially adopted the budget). For FY13, City Council approved the one-time appropriation of an additional $898,570 in local contribution to cover the cost of the expiring Bridgeport Academy lease, and to pay for one more year of transportation for Jones Magnet Middle School and Cooper Elementary School. The funding for transportation to Jones and Cooper is proposed to be eliminated for school year 2013-14. The reconvened General Assembly session did not end this year until May 14, and changes were made in the Veto Session. As a result, a revised budget was presented to the School Board on May 16 and again on June 6 to reflect additional state funds appropriated. Fiscal Year 2013 Budget Approach and Challenges The FY13 budget is the first year of the biennium for the state budget. Hampton’s Local Composite Index (LCI), which is recalculated each biennium, increased from .2690 to .2912, an increase of .0222. The funded amount for local contribution from the City of Hampton is based on a funding formula, and the amount budgeted for FY13, including a one-time payment of $898,570, is down by 2.14% over FY12. Local contribution; however, still well exceeds the state minimum based on the LCI. The total operating budget for Hampton City Schools is $191,909,156, an increase of $7,017,683, or 3.8% more than FY12. Nearly half
5

EXECUTIVE SUMMARY
of the revenue increase is attributable to a mandatory 5.75% rate increase for retirement and group life to ensure the fiscal health of the Commonwealth’s defined benefit pension plan for current and future retirees. The division is in a period of declining enrollment; however, the decline is slowing. In addition, although enrollment for FY12 was slightly lower than originally projected when the budget was developed, we have still increased the budgeted enrollment for FY13 by 100 more than FY12 based on the latest projections. Revenue challenges at the state level resulted in the General Assembly again declining to include any funding for compensation supplements for the fifth year in a row; however, school division and political subdivision employees whose employers currently pay all or part of the 5 percent contribution on their behalf will begin paying the member contribution effective July 1, 2012 on a salary reduction basis. Employers have the option to elect to phase in the amount the employee pays at a minimum of 1 percent in each of the next five years. The bill provides for an offsetting salary increase in the amount the employee begins paying on July 1. All Plan 1 and Plan 2 employees who are hired or re-employed on or after July 1, 2012 must pay the entire 5 percent member contribution with no phase-in option. HCS chose to phase in the amount the employees pay starting with passing on 1% as of July 1, with a corresponding 1% salary increase for all VRS participating employees. The flowchart developed last year to facilitate the decision-making process for schools and departments (which is further detailed in the Budget Development Process under the Organizational tab) was again used for the FY13 budget process. Overall, this budget includes the addition of a net 69.4 FTE new positions, including 27 FTE cafeteria monitors, 17 FTE instructional assistants and Early Reading Intervention Specialists, 16 classroom teachers and 2 Graduation Specialists. Many of these positions were funded under the Education Jobs Fund during FY12. We were also able to continue funding Moton Early Childhood Center as a stand alone preschool program, maintain our class sizes, implement online benchmark testing, and maintain level health insurance premiums for our employees with no change in benefits. In addition, there will be a premium holiday for employees in November and December 2012. Merrimack Elementary closed as of June 30, and our Performance Learning Center, Bridgeport Academy and Adult Education programs are being consolidated into one facility – the former Lee Elementary – and will be known collectively as The Campus at Lee. The building has been renovated and will be open when the new school year begins. School Board Strategic Goals The Hampton School Board established the following five goals as part of the 2010-2015 Strategic Plan: • Goal One: Maximize every child’s learning • Goal Two: Create safe, nurturing learning environments • Goal Three: Enhance parent and community engagement and satisfaction • Goal Four: Attract, develop and retain exceptional staff • Goal Five: Maintain effective, efficient and innovative support systems • Goal Six: Manage fiscal resources effectively and efficiently
6
EXECUTIVE SUMMARY
The Strategic Plan was approved by the Board on March 30, 2011 and may be viewed on our website at http://www.hampton.k12.va.us/StrategicPlan2015March%202011.pdf. Budget Format Beginning with the fiscal 2008-2009 year, the school operating budget uses a programmatic basis to facilitate review and analysis by the School Board and the citizens of the City of Hampton. The high level of line item account detail presented in this budget document is intended to facilitate its review and understanding by the reader. The same information may be presented in multiple formats in order to provide the reader with greater insight into how our resources are utilized. Future Challenges The continuing slow economic recovery makes the next few years a challenge. Funds provided through the Education Jobs Fund will expire as of September 30, 2012, and the division must continue to explore ways to provide a high quality education to our students with more limited resources. We continue to see signs that enrollment declines are slowing and that our enrollment will again grow sooner than expected. We are projecting 20,700 students for FY13, 20,725 for FY14 and 20,750 for FY15 for budget purposes. This is in line with our expectation that enrollment decline is slowing and beginning to turn around. We anticipate continued increases in the VRS rate in the next biennium as well as another increase in the LCI. Based on this, we anticipate increased revenue from the state; however, much of it will be for mandated expenditure increases. Providing competitive compensation to our employees will continue to be a challenge, but it must be high on our priority list if we want to continue to attract and retain the very best and brightest to our division. We will continue to work to provide all children with an appropriate, high caliber learning environment while being fiscally responsible with our limited resources. Food and Nutrition Services is expected to continue to see revenue growth based on modest meal price increases and increased sales. They also continue to work to increase efficiency and streamline operations in order to keep costs under control. We anticipate the continuation of a solid, self-sufficient food services operation despite economic and cost pressures. Based on the looming specter of sequestration, it is very hard to predict the impact on our Reimbursable Projects (grant) funds; however, we anticipate that total revenue will increase slightly based on new and increased program funding. The decline in state and local funding over the last few years has increased the need to seek funding from other sources. We will continue to explore these options going forward. Our Student Activity Fund is fairly stable from year to year. The economy has somewhat impacted attendance (and therefore gate receipts) at games, but is expected to level out and begin to rise again. The implementation of student fees also helps to stabilize and
7

EXECUTIVE SUMMARY
enhance the funding. Overall, Student Activities is expected to maintain stable funding over the next few years. The chart below summarizes the projected expenditures for all funds for fiscal years 2014 through 2016 based on current estimates:
Fund FY14 FY15 FY1650 193,009,322 195,950,899 198,941,77551 10,547,301 10,752,248 10,961,29260 16,670,823 17,004,239 17,344,32494 492,326 496,433 500,621
Population Changes in Hampton Since 2010, the City of Hampton has had a net population decline of 64 people, or .05% of its population in 2010. Hampton ranked 17th in the state for population decline. The decennial census count ranks Hampton as the 13th largest of Virginia’s localities. Source: July 1, 2011 Population Estimates for Virginia and its Counties and Cities
Published on January 30, 2012 by the Weldon Cooper Center for Public Service, Demographics & Workforce Group, www.coopercenter.org/demographics/
Source: Demographics & Workforce Group, Weldon Cooper Center, University of Virginia School Enrollment The School Board utilizes enrollment projections based on data from the Weldon Cooper Center combined with HCS historical data and trends to prepare the budget. The School Board’s approved FY12 Operating Budget was prepared using 20,600 projected students. Actual enrollment was 20,615 (March ADM), which is a decrease over the previous year’s enrollment (20,656) of 41 students. Our enrollment projection of 20,700 for FY13 represents 85 or .41% more students than FY12 actual. Student enrollment projections are a major consideration when developing the School Board budget. Student enrollment drives the amount of state and federal funding the School Division receives. It is also significant because it drives the number of instructional and support staff needed to provide
8
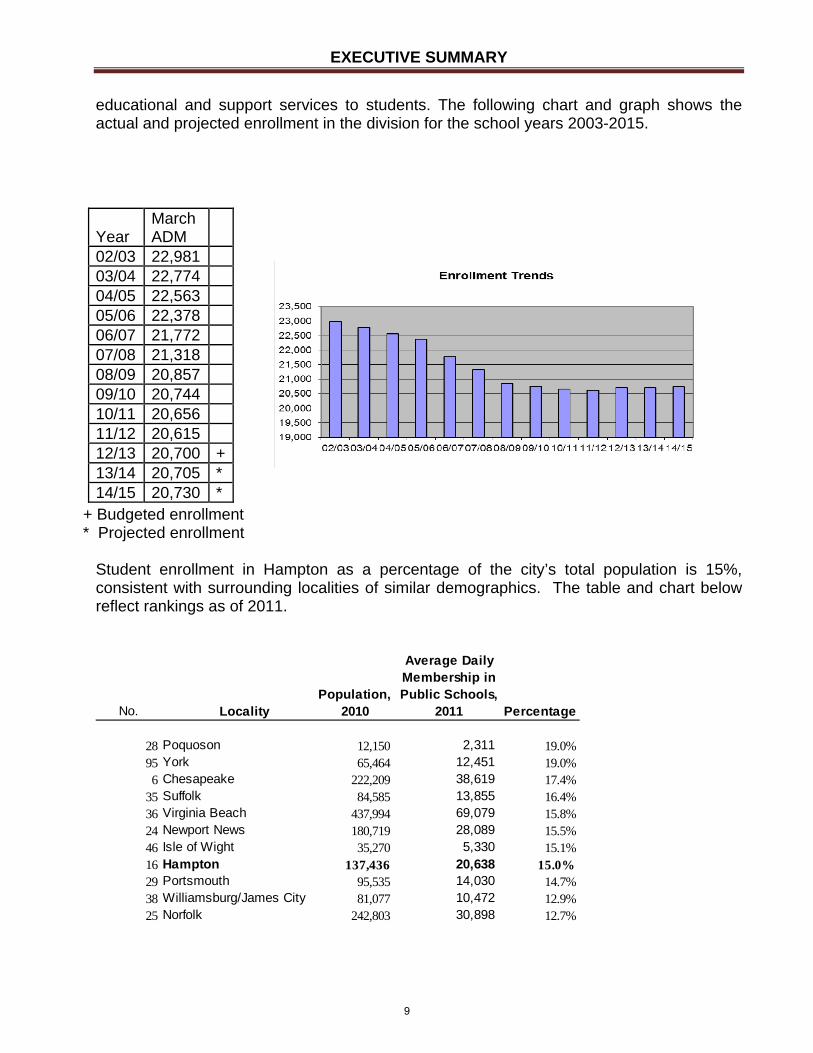
EXECUTIVE SUMMARY
educational and support services to students. The following chart and graph shows the actual and projected enrollment in the division for the school years 2003-2015.
+ Budgeted enrollment * Projected enrollment
Student enrollment in Hampton as a percentage of the city’s total population is 15%, consistent with surrounding localities of similar demographics. The table and chart below reflect rankings as of 2011.
Average DailyMembership in
Population, Public Schools,No. Locality 2010 2011 Percentage
28 Poquoson 12,150 2,311 19.0%95 York 65,464 12,451 19.0%6 Chesapeake 222,209 38,619 17.4%
35 Suffolk 84,585 13,855 16.4%36 Virginia Beach 437,994 69,079 15.8%24 Newport News 180,719 28,089 15.5%46 Isle of Wight 35,270 5,330 15.1%16 Hampton 137,436 20,638 15.0%29 Portsmouth 95,535 14,030 14.7%38 Williamsburg/James City 81,077 10,472 12.9%25 Norfolk 242,803 30,898 12.7%
Year March ADM
02/03 22,981 03/04 22,774 04/05 22,563 05/06 22,378 06/07 21,772 07/08 21,318 08/09 20,857 09/10 20,744 10/11 20,656 11/12 20,615 12/13 20,700 + 13/14 20,705 * 14/15 20,730 *
9

EXECUTIVE SUMMARY
Source: State Auditor of Public Accounts; Comparative Report; Fiscal Year Ended 6/30/11 Fiscally Dependent School Division Hampton City School Division is a fiscally dependent school division pursuant to state law. As a fiscally dependent school division, assessed and market value of taxable property and tax rates do not apply, nor does the school division maintain a debt service fund. State law prohibits the school division from entering into debt that extends beyond the current fiscal year without the approval of the local governing body. The governing body in the City of Hampton is the City Council. The School Division does not prepare or administer a budget for school debt service. The school debt service budget is prepared and administered by the City of Hampton. The school division is currently paying $2,000,000 per year to the city as a debt service reserve for the two new PK-8 schools that opened in September, 2010. These funds are budgeted in category 1, account 9924 (see page 96). The school division has paid $12,000,000 through June, 2012. Capital Improvement Plan In 2005, the city created school investment panel (SIP) established funds for school renovations and maintenance and support for construction by issuing bonds. Small capital improvement projects are under the supervision of the Director of School Maintenance and Operations. The capital improvement plan (CIP) funds approximately $2.4 million in improvements each year, meeting requests developed through a planning process involving stakeholders at each school. In addition, the city allocates $2.9 million that was recommended by the SIP to be provided annually beginning in FY 2007, for school
10
EXECUTIVE SUMMARY
renovation and remodeling. The total available is $5,287,500 per year. The SIP also recommended funds for new construction. The division has completed the construction of two new PK-8 schools that opened in fall 2010. George P. Phenix PK-8 is located behind Bethel High School on Big Bethel Road, and Hunter B. Andrews PK-8 is located on Victoria Blvd at the site of the old Sentara Hospital. (Source: MGT Efficiency Review of Hampton City Schools, May, 2009)
The current CIP/SIP process was established approximately seven years ago to ensure the Division solicited information and concerns directly from key stakeholders at each school facility. The Director of School Operations and Maintenance schedules site visits at each school to meet with a committee composed of administrators, instructional staff, support personnel, parents, and student(s). The primary goal of these meetings is to establish in priority order the most important facility improvements relative to safety, code compliance, student achievement, and maintaining a comfortable learning environment. A composite list of needs based on the outcome of these meetings is established for each school. New site visits are scheduled for Fall 2012.
The City Council and School Board has endorsed a funding formula recommended by the School Investment Panel (SIP) to provide additional annual funds dedicated to meet these needs. The Division is in the process of revising its current five year plan as a result of the economic downturn and limited funding to proceed with new projects. The revised project list is expected to be completed by Fall 2012.
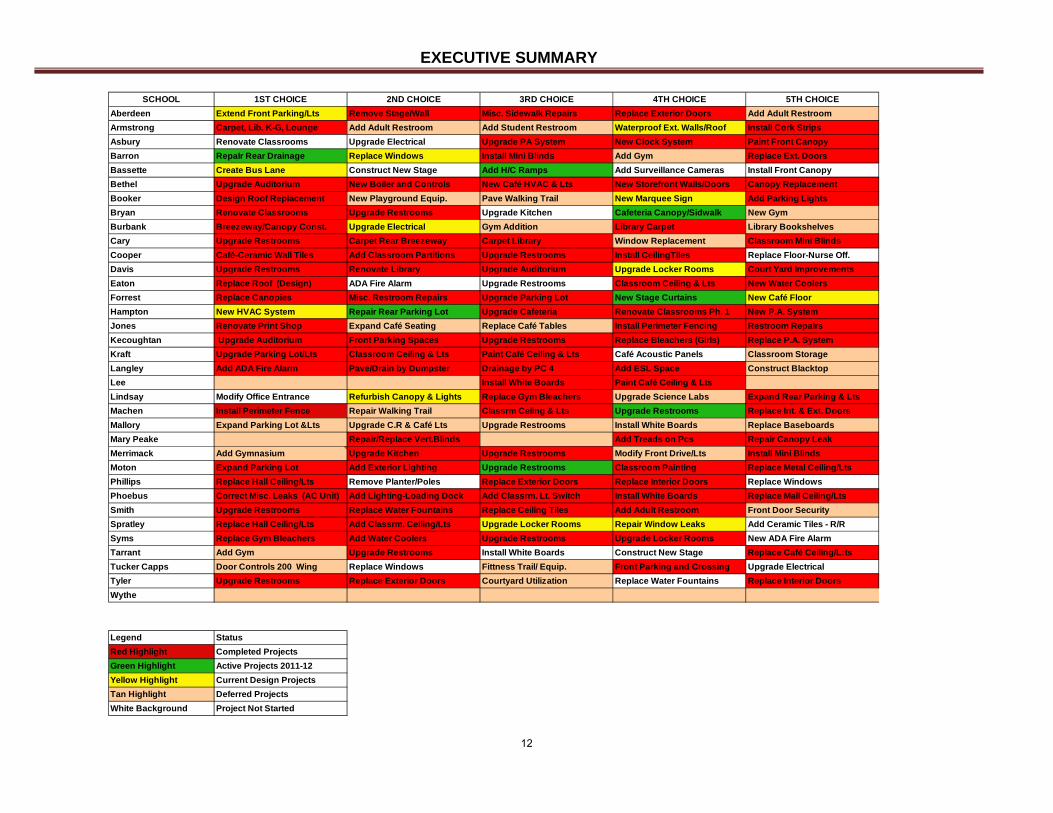
The current list of priorities by school is shown below (updated as of August 2012).
11
EXECUTIVE SUMMARY
SCHOOL 1ST CHOICE 2ND CHOICE 3RD CHOICE 4TH CHOICE 5TH CHOICE
Aberdeen Extend Front Parking/Lts Remove Stage/Wall Misc. Sidewalk Repairs Replace Exterior Doors Add Adult Restroom
Armstrong Carpet, Lib. K-G, Lounge Add Adult Restroom Add Student Restroom Waterproof Ext. Walls/Roof Install Cork Strips
Asbury Renovate Classrooms Upgrade Electrical Upgrade PA System New Clock System Paint Front Canopy
Barron RepaIr Rear Drainage Replace Windows Install Mini Blinds Add Gym Replace Ext. Doors
Bassette Create Bus Lane Construct New Stage Add H/C Ramps Add Surveillance Cameras Install Front Canopy
Bethel Upgrade Auditorium New Boiler and Controls New Café HVAC & Lts New Storefront Walls/Doors Canopy Replacement
Booker Design Roof Replacement New Playground Equip. Pave Walking Trail New Marquee Sign Add Parking Lights
Bryan Renovate Classrooms Upgrade Restrooms Upgrade Kitchen Cafeteria Canopy/Sidwalk New Gym
Burbank Breezeway/Canopy Const. Upgrade Electrical Gym Addition Library Carpet Library Bookshelves
Cary Upgrade Restrooms Carpet Rear Breezeway Carpet Library Window Replacement Classroom Mini Blinds
Cooper Café-Ceramic Wall Tiles Add Classroom Partitions Upgrade Restrooms Install CeilingTiles Replace Floor-Nurse Off.
Davis Upgrade Restrooms Renovate Library Upgrade Auditorium Upgrade Locker Rooms Court Yard Improvements
Eaton Replace Roof (Design) ADA Fire Alarm Upgrade Restrooms Classroom Ceiling & Lts New Water Coolers
Forrest Replace Canopies Misc. Restroom Repairs Upgrade Parking Lot New Stage Curtains New Café Floor
Hampton New HVAC System Repair Rear Parking Lot Upgrade Cafeteria Renovate Classrooms Ph. 1 New P.A. System
Jones Renovate Print Shop Expand Café Seating Replace Café Tables Install Perimeter Fencing Restroom RepaIrs
Kecoughtan Upgrade Auditorium Front Parking Spaces Upgrade Restrooms Replace Bleachers (Girls) Replace P.A. System
Kraft Upgrade Parking Lot/Lts Classroom Ceiling & Lts Paint Café Ceiling & Lts Café Acoustic Panels Classroom Storage
Langley Add ADA Fire Alarm Pave/Drain by Dumpster Drainage by PC 4 Add ESL Space Construct Blacktop
Lee Install White Boards Paint Café Ceiling & Lts
Lindsay Modify Office Entrance Refurbish Canopy & Lights Replace Gym Bleachers Upgrade Science Labs Expand Rear Parking & Lts
Machen Install Perimeter Fence Repair Walking Trail Classrm Celing & Lts Upgrade Restrooms Replace Int. & Ext. Doors
Mallory Expand Parking Lot &Lts Upgrade C.R & Café Lts Upgrade Restrooms Install White Boards Replace Baseboards
Mary Peake Repair/Replace Vert.Blinds Add Treads on Pcs Repair Canopy Leak
Merrimack Add Gymnasium Upgrade Kitchen Upgrade Restrooms Modify Front Drive/Lts Install Mini Blinds
Moton Expand Parking Lot Add Exterior Lighting Upgrade Restrooms Classroom Painting Replace Metal Ceiling/Lts
Phillips Replace Hall Ceiling/Lts Remove Planter/Poles Replace Exterior Doors Replace Interior Doors Replace Windows
Phoebus Correct Misc. Leaks (AC Unit) Add Lighting-Loading Dock Add Classrm. Lt. Switch Install White Boards Replace Mall Ceiling/Lts
Smith Upgrade Restrooms Replace Water Fountains Replace Ceiling Tiles Add Adult Restroom Front Door Security
Spratley Replace Hall Ceiling/Lts Add Classrm. Ceiling/Lts Upgrade Locker Rooms Repair Window Leaks Add Ceramic Tiles - R/R
Syms Replace Gym Bleachers Add Water Coolers Upgrade Restrooms Upgrade Locker Rooms New ADA Fire Alarm
Tarrant Add Gym Upgrade Restrooms Install White Boards Construct New Stage Replace Café Ceiling/L:ts
Tucker Capps Door Controls 200 Wing Replace Windows Fittness Trail/ Equip. Front Parking and Crossing Upgrade Electrical
Tyler Upgrade Restrooms Replace Exterior Doors Courtyard Utilization Replace Water Fountains Replace Interior Doors
Wythe
Legend Status
Red Highlight Completed Projects
Green Highlight Active Projects 2011-12
Yellow Highlight Current Design Projects
Tan Highlight Deferred Projects
White Background Project Not Started
12

EXECUTIVE SUMMARY
Parent Satisfaction Survey
For three consecutive years since the Hampton school division made a decision to query parents about their perceptions of Hampton City Schools, the division has received outstanding parent approval. Our 2010 Parent Survey has yielded great results from our Hampton parents regarding their perceptions about Hampton City Schools.
The survey results showed that 81% of our parents gave the Hampton school division an overall grade of “A” or “B”.
This is highly significant in that a national survey conducted in 2009 by the Phi Delta Kappa/Gallup Poll, recorded only 74% of parents awarding their local public schools an “A” or B” rating. In addition, 96% of the Hampton parents gave the school division an overall grade of “A”, “B” or “C.”
The 2010 Parent Survey consisted of statements in six categories, which were School Environment, Student Achievement, Teacher/Staff Expectations, Support and Service, Bell Schedule and Transportation. The Response choices ranged from “Strongly Agree” to “No Opinion.” The Overall Grade category included “A”, “B”, “C”, ”D” and “F”, and the survey also included a section for written comments.
Surveys are conducted on a biennial basis. A survey was conducted during the 2011-2012 school year. Results are being collated and are expected to be presented to the Board in Fall 2012.
MGT Efficiency Review
The Commonwealth of Virginia inaugurated the school efficiency review program in the 2004-05 school year as the governor’s Education for a Lifetime initiative. The program involves contracting with outside educational experts to perform efficiency reviews for school divisions within the Commonwealth; school divisions volunteer to participate. The goals of the reviews are to ensure that non-instructional functions are running efficiently so that as much of school division funding as possible goes directly into the classroom and to identify savings that can be gained in the school division through best practices. School divisions participating in this program are required to pay 25 percent of the cost of the study, 25 percent of internal direct costs to be reimbursed, plus an additional 25 percent if certain implementation targets are not met. The efficiency review results provide guidance to school divisions in determining whether educational dollars are being utilized to the fullest extent possible. In July 2008, MGT of America, Inc. (MGT), was awarded a contract to conduct an efficiency review of Hampton City Schools (HCS). As stated in the Request for Proposal (RFP), the purpose of the study is to conduct an external review of the efficiency of various offices and operations within the division and to present a final report of the findings, commendations, recommendations, and projected costs and/or cost savings associated with the recommendations.
13
EXECUTIVE SUMMARY
The final report was issued May 7, 2009 and may be found at: http://www.hampton.k12.va.us/reports_data/MGT_Report.pdf Source: MGT Efficiency Review of Hampton City Schools, May, 2009 As of May, 2011, Hampton City Schools reported to the Department of Planning and Budget that total cumulative net savings to date equal $43,684,355. This is well in excess of the 50% requirement. The division is in the process of implementing 89.22% of the recommendations; again, well above the 50% requirement.
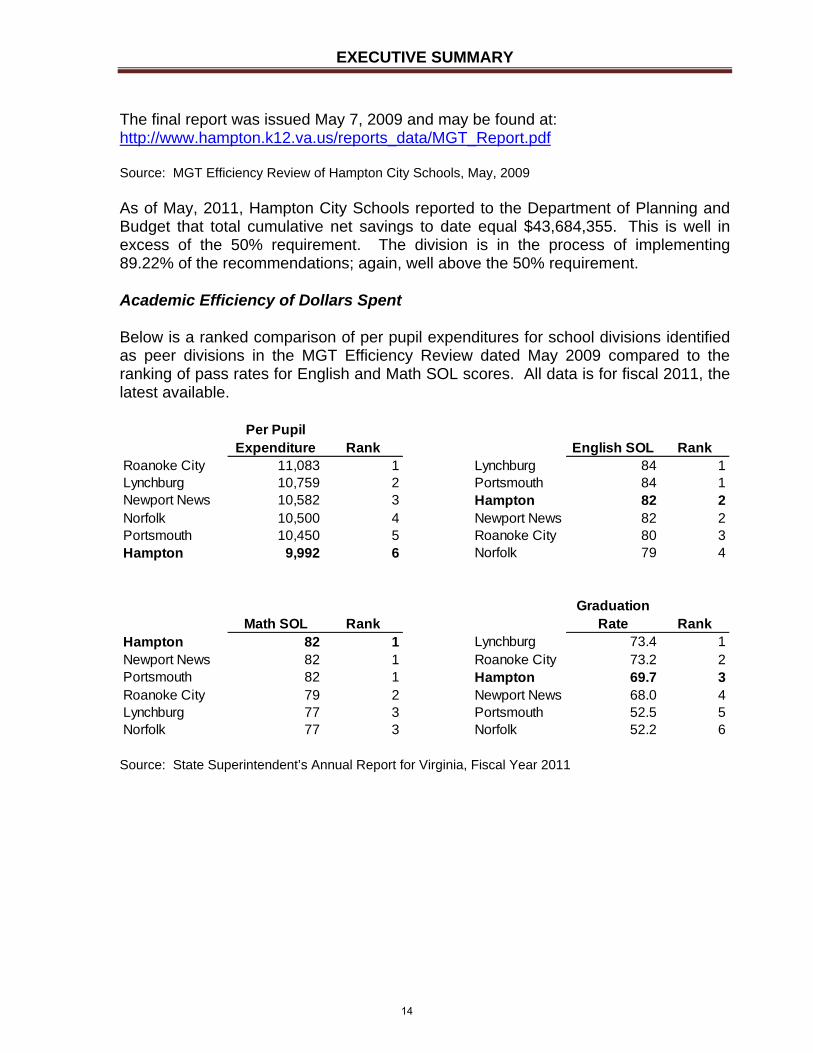
Academic Efficiency of Dollars Spent
Below is a ranked comparison of per pupil expenditures for school divisions identified as peer divisions in the MGT Efficiency Review dated May 2009 compared to the ranking of pass rates for English and Math SOL scores. All data is for fiscal 2011, the latest available.
Per Pupil Expenditure Rank English SOL Rank
Roanoke City 11,083 1 Lynchburg 84 1Lynchburg 10,759 2 Portsmouth 84 1Newport News 10,582 3 Hampton 82 2Norfolk 10,500 4 Newport News 82 2Portsmouth 10,450 5 Roanoke City 80 3Hampton 9,992 6 Norfolk 79 4
Math SOL RankGraduation
Rate RankHampton 82 1 Lynchburg 73.4 1Newport News 82 1 Roanoke City 73.2 2Portsmouth 82 1 Hampton 69.7 3Roanoke City 79 2 Newport News 68.0 4Lynchburg 77 3 Portsmouth 52.5 5Norfolk 77 3 Norfolk 52.2 6
Source: State Superintendent’s Annual Report for Virginia, Fiscal Year 2011
14
EXECUTIVE SUMMARY
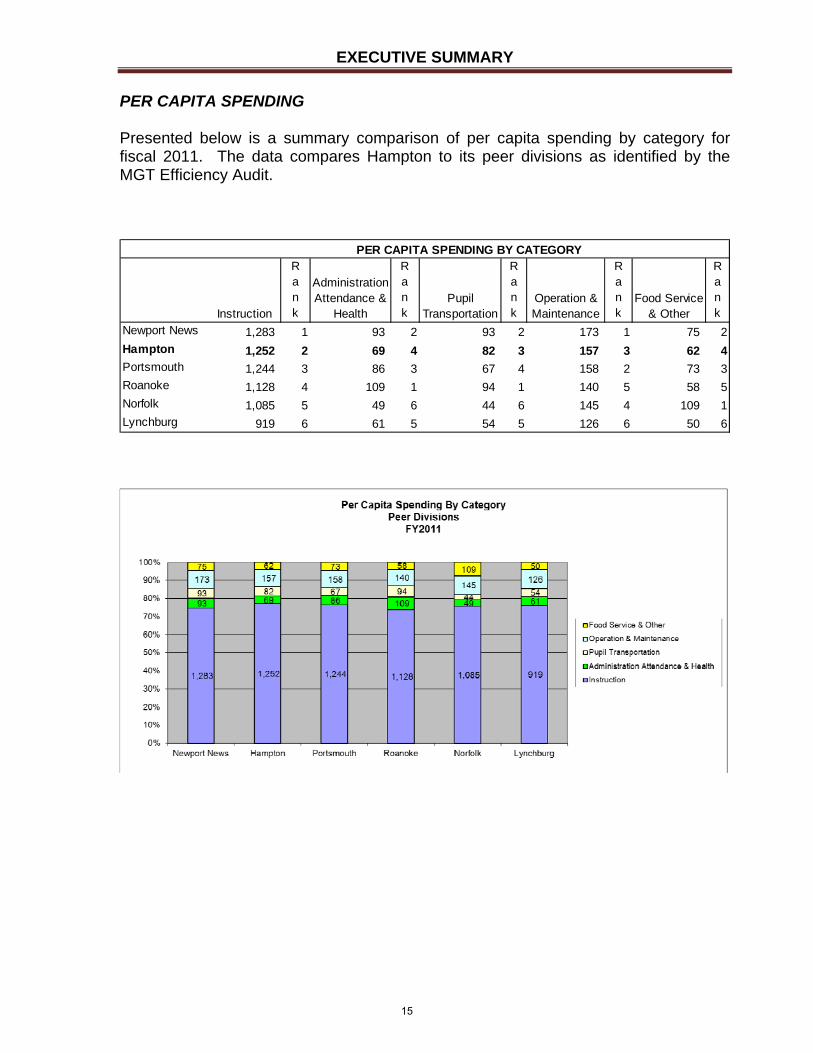
PER CAPITA SPENDING
Presented below is a summary comparison of per capita spending by category for fiscal 2011. The data compares Hampton to its peer divisions as identified by the MGT Efficiency Audit.
Instruction
Rank
Administration Attendance &
Health
Rank
Pupil Transportation
Rank
Operation & Maintenance
Rank
Food Service & Other
Rank
Newport News 1,283 1 93 2 93 2 173 1 75 2
Hampton 1,252 2 69 4 82 3 157 3 62 4Portsmouth 1,244 3 86 3 67 4 158 2 73 3Roanoke 1,128 4 109 1 94 1 140 5 58 5Norfolk 1,085 5 49 6 44 6 145 4 109 1Lynchburg 919 6 61 5 54 5 126 6 50 6
PER CAPITA SPENDING BY CATEGORY
15
EXECUTIVE SUMMARY
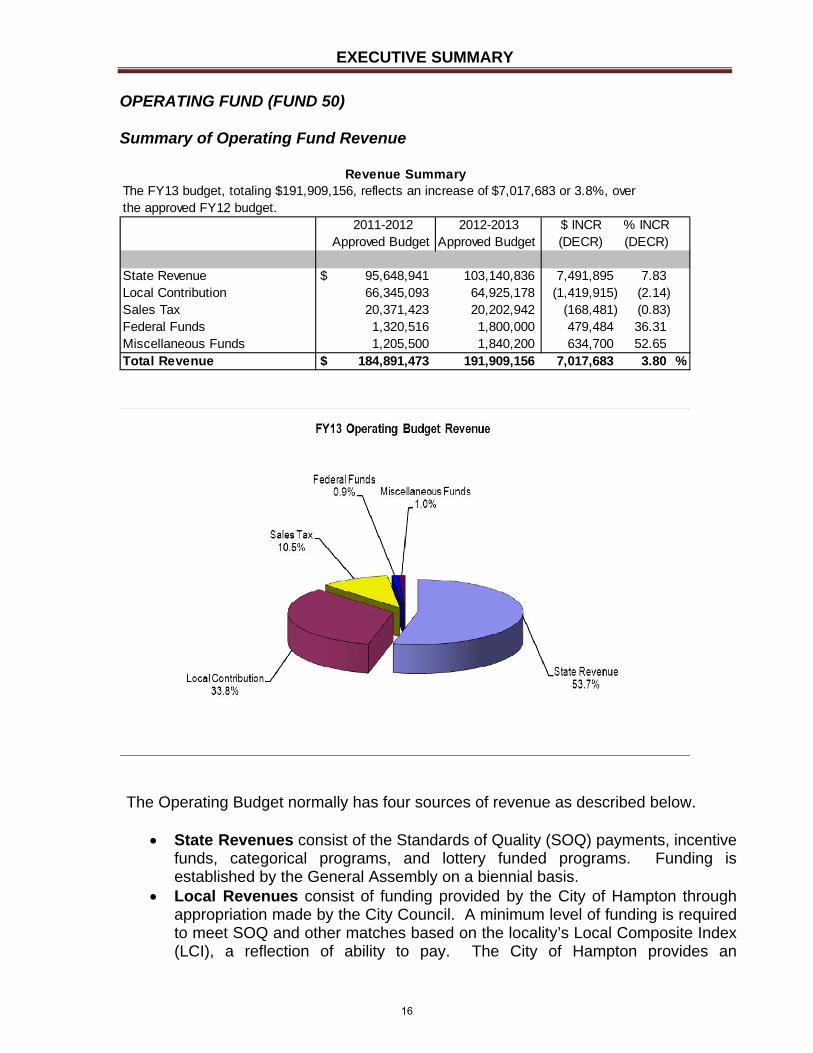
OPERATING FUND (FUND 50)
Summary of Operating Fund Revenue
the approved FY12 budget.2011-2012 2012-2013 $ INCR % INCR
Approved Budget Approved Budget (DECR) (DECR)
State Revenue $ 95,648,941 103,140,836 7,491,895 7.83Local Contribution 66,345,093 64,925,178 (1,419,915) (2.14)Sales Tax 20,371,423 20,202,942 (168,481) (0.83)Federal Funds 1,320,516 1,800,000 479,484 36.31Miscellaneous Funds 1,205,500 1,840,200 634,700 52.65Total Revenue $ 184,891,473 191,909,156 7,017,683 3.80 %
Revenue SummaryThe FY13 budget, totaling $191,909,156, reflects an increase of $7,017,683 or 3.8%, over
The Operating Budget normally has four sources of revenue as described below.
State Revenues consist of the Standards of Quality (SOQ) payments, incentive funds, categorical programs, and lottery funded programs. Funding is established by the General Assembly on a biennial basis.
Local Revenues consist of funding provided by the City of Hampton through appropriation made by the City Council. A minimum level of funding is required to meet SOQ and other matches based on the locality’s Local Composite Index (LCI), a reflection of ability to pay. The City of Hampton provides an
16
EXECUTIVE SUMMARY
appropriation based on a funding formula. Currently, the city provides funding in excess of the minimum required.
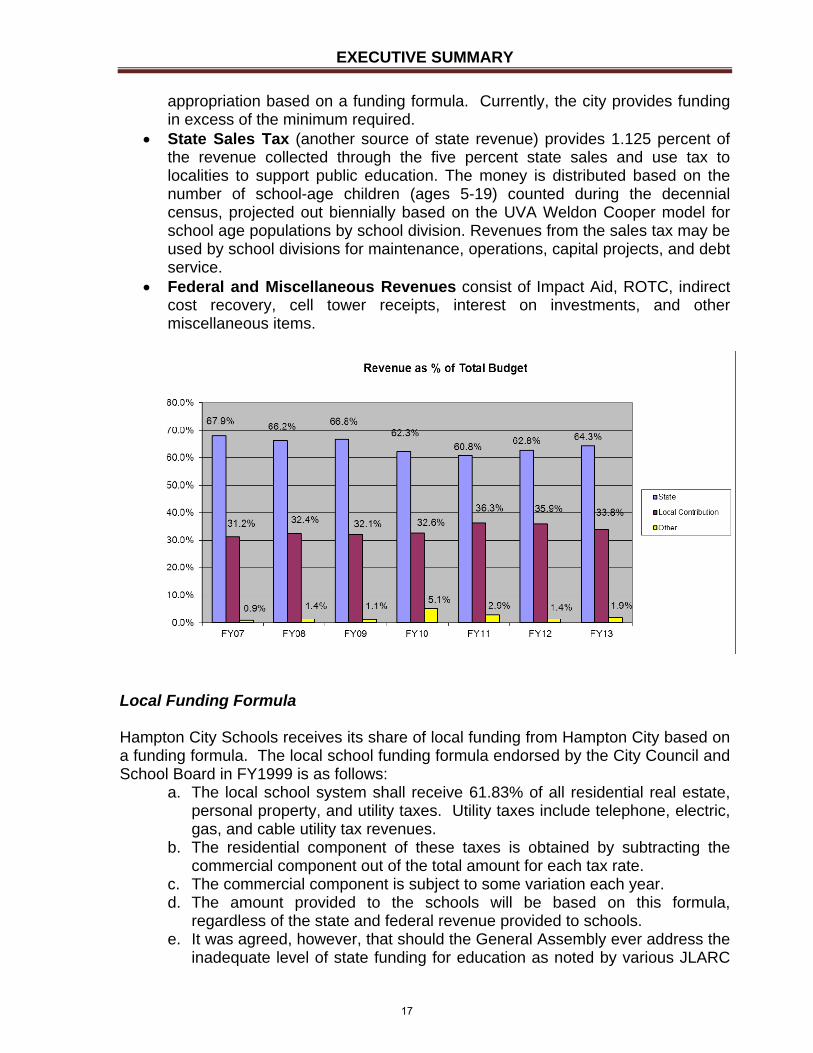
State Sales Tax (another source of state revenue) provides 1.125 percent of the revenue collected through the five percent state sales and use tax to localities to support public education. The money is distributed based on the number of school-age children (ages 5-19) counted during the decennial census, projected out biennially based on the UVA Weldon Cooper model for school age populations by school division. Revenues from the sales tax may be used by school divisions for maintenance, operations, capital projects, and debt service.
Federal and Miscellaneous Revenues consist of Impact Aid, ROTC, indirect cost recovery, cell tower receipts, interest on investments, and other miscellaneous items.
Local Funding Formula Hampton City Schools receives its share of local funding from Hampton City based on a funding formula. The local school funding formula endorsed by the City Council and School Board in FY1999 is as follows:
a. The local school system shall receive 61.83% of all residential real estate, personal property, and utility taxes. Utility taxes include telephone, electric, gas, and cable utility tax revenues.
b. The residential component of these taxes is obtained by subtracting the commercial component out of the total amount for each tax rate.
c. The commercial component is subject to some variation each year. d. The amount provided to the schools will be based on this formula,
regardless of the state and federal revenue provided to schools. e. It was agreed, however, that should the General Assembly ever address the
inadequate level of state funding for education as noted by various JLARC
17
EXECUTIVE SUMMARY
studies as a comprehensive package that negotiations around appropriate local adjustments would be in order.
f. It was also agreed that the local school system could make requests for special funding in the form of dedicated real estate tax increases if the School Board felt additional funding was warranted. This was done to help fund teacher salary adjustments.
g. Dedicated real estate tax increases are not shared according to the local funding formula.
Financial Guidelines In FY2006, a local financial guideline pertaining to real estate growth was adopted by Council as follows effective FY2007:
a. Real estate tax revenue growth, net of new construction, from one fiscal year to the next shall be limited to the equivalent percentage increase in an inflationary growth factor as measured by either the consumer price index for urban dwellers (CPI-U) or resident income growth (RI); whichever is greater in any given year.
b. To the extent that budgetary needs require real estate revenues to grow faster than this factor, the Manager and Council shall explicitly explain the budget driving factors causing this so that residents may have a concise and clear understanding of the need to deviate from this financial guideline.
Historical Notes In essence, the adoption of the financial guideline pertaining to real estate growth has the effect of constraining the real estate component of the local funding formula to no more than percent growth in resident income growth. Dedicated real estate revenues, however, can be assigned to the local school program as they were in FY2008 when the Council dedicated the equivalent of three cents that exceeded the financial guideline to school construction. In addition, for FY13, Council has appropriated an additional $878,570 as a one-time payment.
18
40,000,000
45,000,000
50,000,000
55,000,000
60,000,000
65,000,000
70,000,000
75,000,000
80,000,000
FY09 FY10 FY11 FY12 FY13
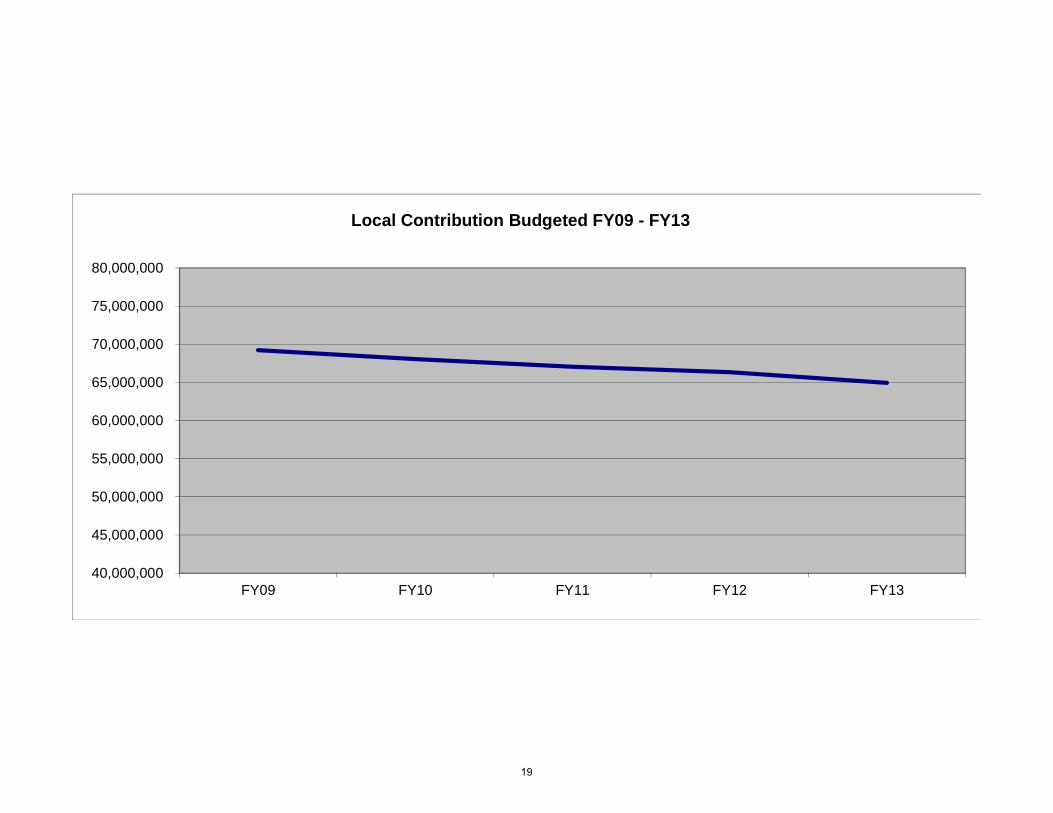
Local Contribution Budgeted FY09 - FY13
19

+4.06% 69,216,564
-1.68% 68,051,707
+5.22% 215,880,242
-3.32% 208,713,038
025,000,00050,000,00075,000,000
100,000,000125,000,000150,000,000175,000,000200,000,000225,000,000250,000,000275,000,000
FY09 FY10 FY11 FY12 FY13
Changes in Local Contribution& Total Budget FY09-FY13
Local Contribution Total Budget
-3.97% 67,051,476
-11.51% 184,685,176
-1.05% 66,345,093
+.011% 184,891,473
+.3.80% 191,909,156
-2.14% 64,925,178
20
EXECUTIVE SUMMARY
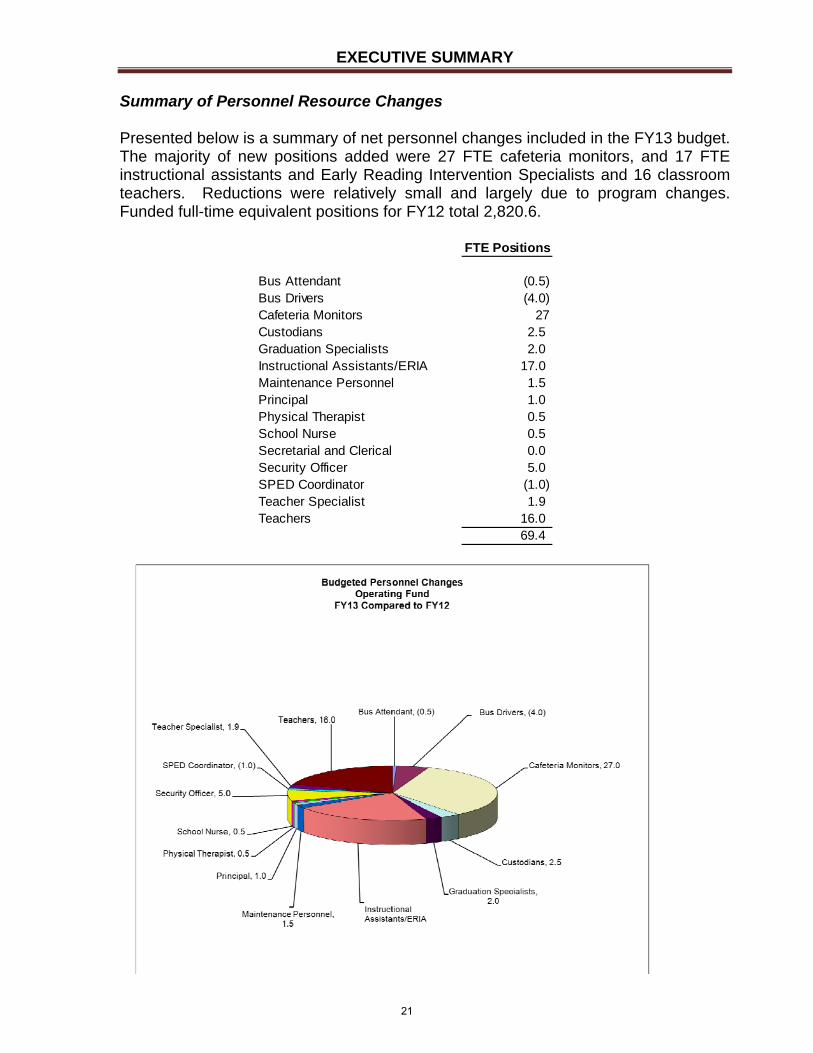
Summary of Personnel Resource Changes
Presented below is a summary of net personnel changes included in the FY13 budget. The majority of new positions added were 27 FTE cafeteria monitors, and 17 FTE instructional assistants and Early Reading Intervention Specialists and 16 classroom teachers. Reductions were relatively small and largely due to program changes. Funded full-time equivalent positions for FY12 total 2,820.6.
FTE Positions
Bus Attendant (0.5) Bus Drivers (4.0) Cafeteria Monitors 27 Custodians 2.5 Graduation Specialists 2.0 Instructional Assistants/ERIA 17.0 Maintenance Personnel 1.5 Principal 1.0 Physical Therapist 0.5 School Nurse 0.5 Secretarial and Clerical 0.0 Security Officer 5.0 SPED Coordinator (1.0) Teacher Specialist 1.9 Teachers 16.0
69.4
21
EXECUTIVE SUMMARY
Financial Overview – Expenditures Expenditures consist of cost estimates for the operation of regular day school, summer school, adult education programs, and other education programs, and are grouped by state-mandated categories. The five categories in the Operating Budget are:
Instruction Administration, Attendance and Health Pupil Transportation Operations and Maintenance Technology
The categories are further broken down into the following expenditure classifications: Personnel Services: All compensation to employees for full-time, part-time, and temporary work, including supplements, allowances, overtime, and similar compensation. Fringe Benefits: Includes job-related benefits provided as part of the employee’s total compensation such as FICA, retirement contributions, health insurance premiums, and other employee benefits. Contract Services: Includes expenditures for services acquired or purchased from outside sources on a fee basis or fixed time contract basis. Examples are regional tuition payments, payments to consultants, payments to HRT, and printing/copier charges. Other Charges: Includes payments made for utilities, postage, telecommunications, insurance, rentals, travel, and other miscellaneous charges. Materials and Supplies: Includes expenditures for articles and commodities such as textbooks, instructional supplies, office supplies, and other miscellaneous expenses. Payments to Other Agencies: Includes payments to New Horizons Regional Education Center for various programs including gifted, vocational training, and special education. Capital: Expenditures for the purchase of durable goods with a useful life greater than one year. Examples include buses, classroom furniture, musical instruments, computers, and other technology items. Transfers to Other Funds: Transfers of funds from one fund (e.g., school operating) to another fund (e.g., student athletics) without recourse.
22
EXECUTIVE SUMMARY
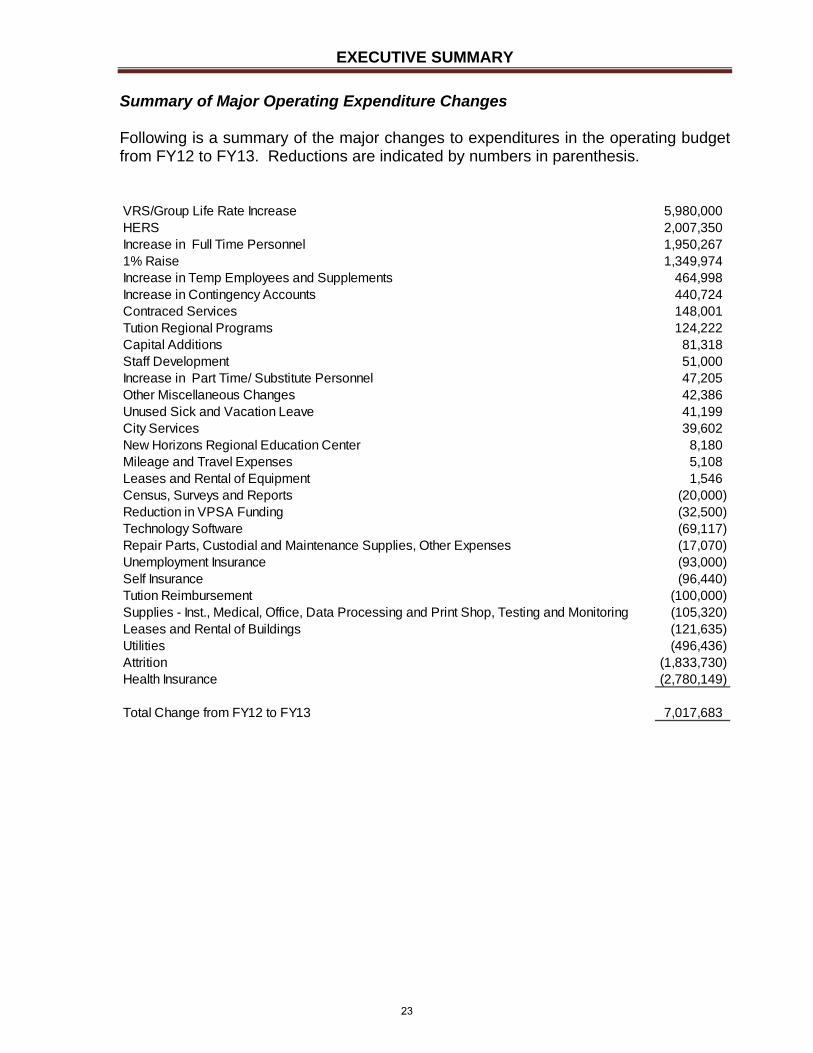
Summary of Major Operating Expenditure Changes Following is a summary of the major changes to expenditures in the operating budget from FY12 to FY13. Reductions are indicated by numbers in parenthesis. VRS/Group Life Rate Increase 5,980,000HERS 2,007,350Increase in Full Time Personnel 1,950,2671% Raise 1,349,974Increase in Temp Employees and Supplements 464,998Increase in Contingency Accounts 440,724Contraced Services 148,001Tution Regional Programs 124,222Capital Additions 81,318Staff Development 51,000Increase in Part Time/ Substitute Personnel 47,205Other Miscellaneous Changes 42,386Unused Sick and Vacation Leave 41,199City Services 39,602New Horizons Regional Education Center 8,180Mileage and Travel Expenses 5,108Leases and Rental of Equipment 1,546Census, Surveys and Reports (20,000)Reduction in VPSA Funding (32,500)Technology Software (69,117)Repair Parts, Custodial and Maintenance Supplies, Other Expenses (17,070)Unemployment Insurance (93,000)Self Insurance (96,440)Tution Reimbursement (100,000)Supplies - Inst., Medical, Office, Data Processing and Print Shop, Testing and Monitoring (105,320)Leases and Rental of Buildings (121,635)Utilities (496,436)Attrition (1,833,730)Health Insurance (2,780,149)
Total Change from FY12 to FY13 7,017,683
23
EXECUTIVE SUMMARY
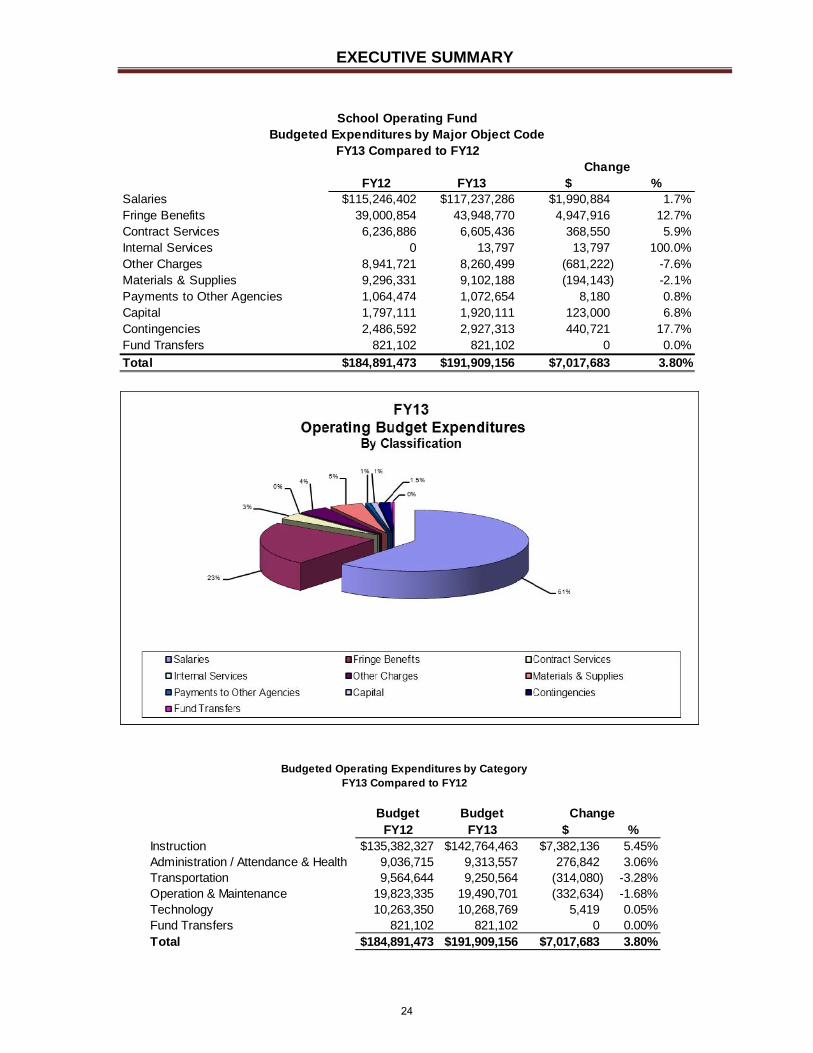
FY12 FY13 $ %Salaries $115,246,402 $117,237,286 $1,990,884 1.7%Fringe Benefits 39,000,854 43,948,770 4,947,916 12.7%Contract Services 6,236,886 6,605,436 368,550 5.9%Internal Services 0 13,797 13,797 100.0%Other Charges 8,941,721 8,260,499 (681,222) -7.6%Materials & Supplies 9,296,331 9,102,188 (194,143) -2.1%Payments to Other Agencies 1,064,474 1,072,654 8,180 0.8%Capital 1,797,111 1,920,111 123,000 6.8%Contingencies 2,486,592 2,927,313 440,721 17.7%Fund Transfers 821,102 821,102 0 0.0%
Total $184,891,473 $191,909,156 $7,017,683 3.80%
Change
School Operating FundBudgeted Expenditures by Major Object Code
FY13 Compared to FY12
Budget BudgetFY12 FY13 $ %
Instruction $135,382,327 $142,764,463 $7,382,136 5.45%Administration / Attendance & Health 9,036,715 9,313,557 276,842 3.06%Transportation 9,564,644 9,250,564 (314,080) -3.28%Operation & Maintenance 19,823,335 19,490,701 (332,634) -1.68%Technology 10,263,350 10,268,769 5,419 0.05%Fund Transfers 821,102 821,102 0 0.00%Total $184,891,473 $191,909,156 $7,017,683 3.80%
Change
Budgeted Operating Expenditures by CategoryFY13 Compared to FY12
24
EXECUTIVE SUMMARY
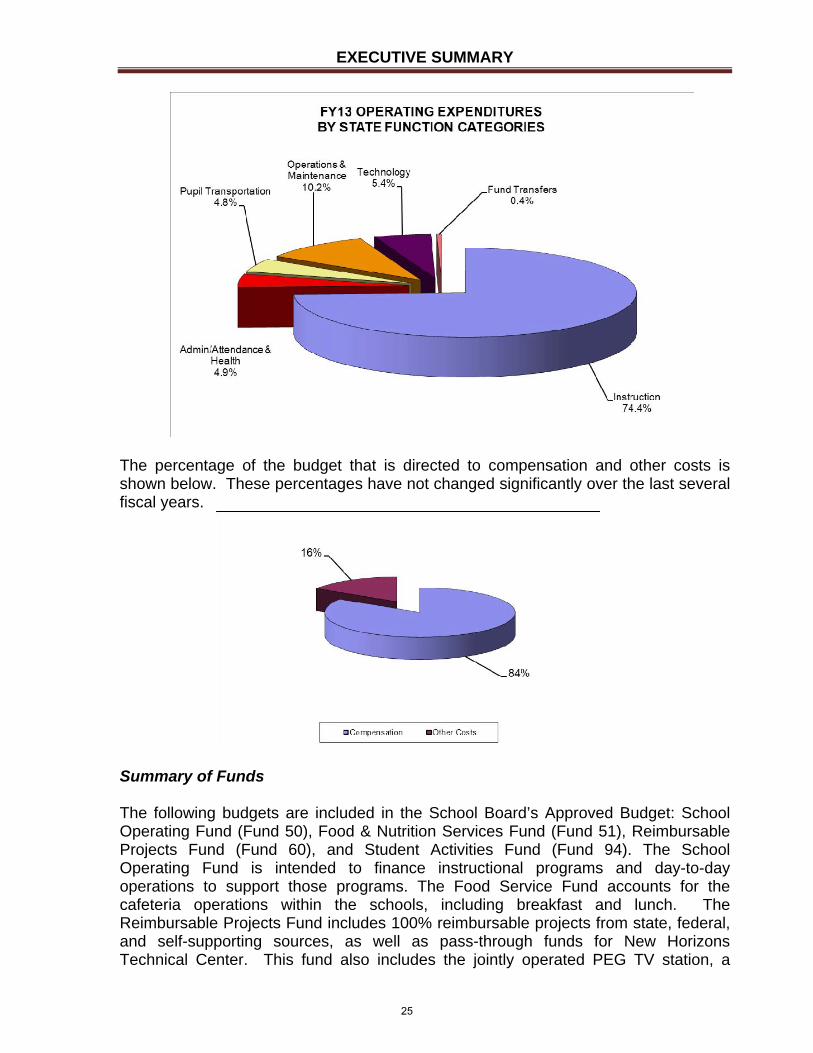
The percentage of the budget that is directed to compensation and other costs is shown below. These percentages have not changed significantly over the last several fiscal years.
Summary of Funds The following budgets are included in the School Board’s Approved Budget: School Operating Fund (Fund 50), Food & Nutrition Services Fund (Fund 51), Reimbursable Projects Fund (Fund 60), and Student Activities Fund (Fund 94). The School Operating Fund is intended to finance instructional programs and day-to-day operations to support those programs. The Food Service Fund accounts for the cafeteria operations within the schools, including breakfast and lunch. The Reimbursable Projects Fund includes 100% reimbursable projects from state, federal, and self-supporting sources, as well as pass-through funds for New Horizons Technical Center. This fund also includes the jointly operated PEG TV station, a
25
EXECUTIVE SUMMARY
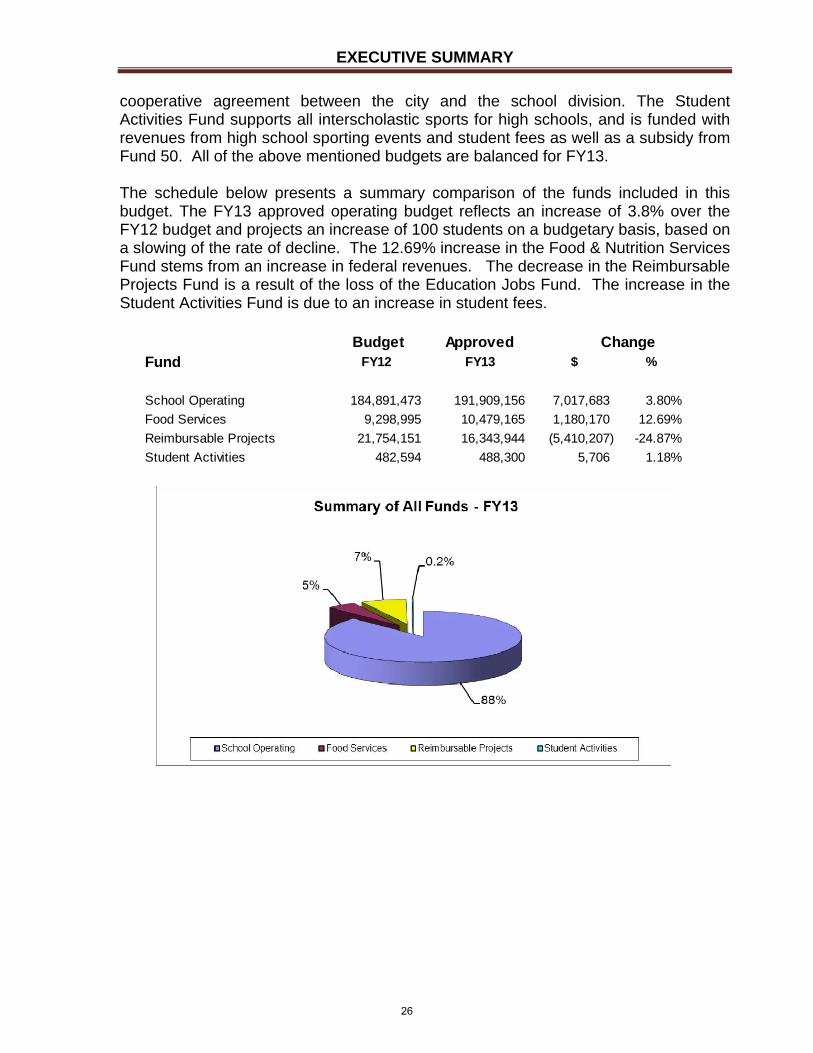
cooperative agreement between the city and the school division. The Student Activities Fund supports all interscholastic sports for high schools, and is funded with revenues from high school sporting events and student fees as well as a subsidy from Fund 50. All of the above mentioned budgets are balanced for FY13. The schedule below presents a summary comparison of the funds included in this budget. The FY13 approved operating budget reflects an increase of 3.8% over the FY12 budget and projects an increase of 100 students on a budgetary basis, based on a slowing of the rate of decline. The 12.69% increase in the Food & Nutrition Services Fund stems from an increase in federal revenues. The decrease in the Reimbursable Projects Fund is a result of the loss of the Education Jobs Fund. The increase in the Student Activities Fund is due to an increase in student fees.
Budget ApprovedFund FY12 FY13 $ %
School Operating 184,891,473 191,909,156 7,017,683 3.80%
Food Services 9,298,995 10,479,165 1,180,170 12.69%
Reimbursable Projects 21,754,151 16,343,944 (5,410,207) -24.87%
Student Activities 482,594 488,300 5,706 1.18%
Change
26
EXECUTIVE SUMMARY
Division Performance Highlights Student Achievement Measures:
94% of schools are fully accredited for 10-11, with all middle and high schools meeting accreditation.
100% of our high schools are accredited by the Southern Association of Colleges and Schools
The 2011 Hampton City Schools SAT College-Bound Senior Mean increased by six points, from 1371 to 1377, when compared to the 2010 SAT College-Bound Senior Mean.
o The critical reading mean score increased three points over last year from 463 to 466.
o The mathematics mean score remained at 462. o The writing mean score increased three points from 446 to 449.
33% of our 2011 graduates earned Advanced Diplomas. 74% of our graduates are accepted to two and four year colleges.
Academic Excellence:
$32.8 million in scholarships awarded to graduates in 2012 Advanced Placement courses offered in a variety of subjects Preschool program offered through the Virginia Preschool Initiative Gifted services include a center at Spratley to serve grades 3-8; resource staff
serve all elementary schools Teaching Staff:
1616 teachers & guidance counselors. 108 National Board Certified Teachers 48% of teachers hold advanced degrees 99.6% of teacher vacancies filled prior to the start of school 88% of all new teachers hired during the 2010-11 school year returned to HCS in
2011-12 Student Demographics:
Enrollment 2011-12 (End of Year ADM): 20,575 o 61.88% African American o 29.82% Caucasian o 4.76% Multi-Ethnic o 3.54% Other
13.73% of students were enrolled in the Special Education Program in 2011-12 10.29% of students were enrolled in the Gifted Education Program in 2011-12 56% of students received free or reduced lunches in 2011-12
27

EXECUTIVE SUMMARY
STUDENT DEMOGRAPHICS CHARTS
28

Association of School Business Officials International®
This Meritorious Budget Award is presented to
Hampton City Schools
For excellence in the preparation and issuance of its school system budget
for the Fiscal Year 2011-2012. The budget is judged to conform
to the principles and standards of the ASBO International® Meritorious Budget Awards
Program.
President Executive Director
29

THIS PAGE INTENTIONALLY LEFT BLANK
30
ORGANIZATIONAL
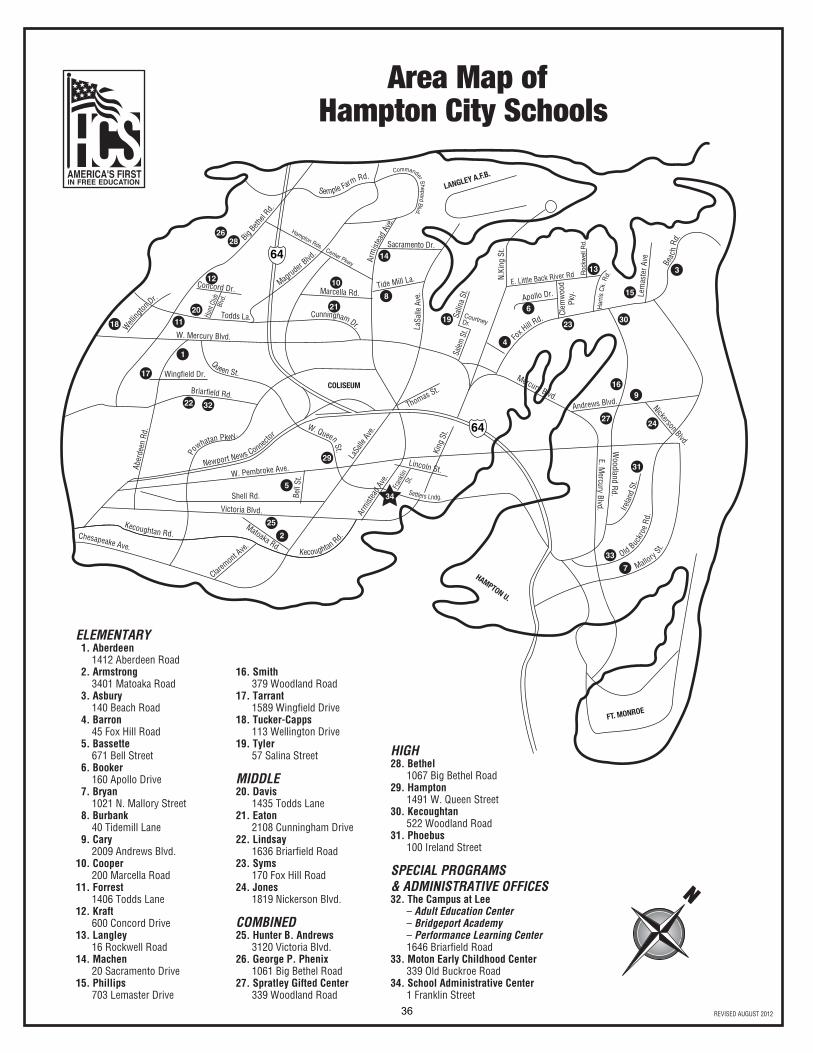
OVERVIEW OF HAMPTON CITY AND HAMPTON CITY SCHOOLS Geographical Area and Location
Hampton is nestled along the beautiful Chesapeake Bay and graced with miles of shoreline and breathtaking water views. Hampton has a distinct small-town feel with little traffic and an abundance of amenities. With an average commute time of 20 minutes, Hampton is literally in the heart of Hampton Roads.
Hampton’s impressive School Division, teaching PK through grade 12, ranks # 1 in Region II for National Board Certified teachers. A 2010 parent survey showed that 81% of our parents gave the Hampton school division an overall grade of “A” or “B”.
The school division prides itself on the individual development of every child with its many progressive programming choices offered to parents and students.
Hampton, at the forefront of economic development, offers exciting nightlife as well as family entertainment providing endless choices on how to spend leisure time. With its prime waterfront location, boating is one of the most popular activities. Hampton offers several public boat ramps and marinas. The city has numerous cultural treasures, a vibrant arts community, distinctive festivals and signature events. Feature parks, nature preserves, community centers, public golf courses, classes or programs available for almost any hobby or interest combine to make Hampton a perfect choice.
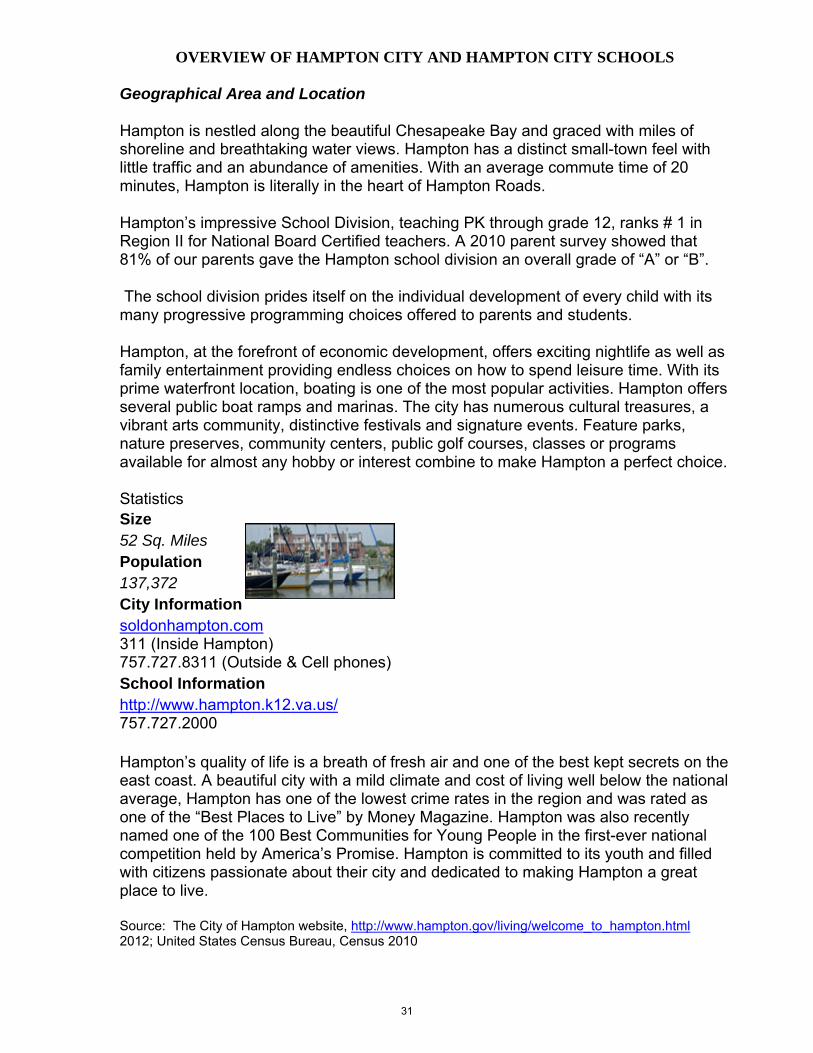
Statistics Size 52 Sq. Miles Population 137,372 City Information soldonhampton.com 311 (Inside Hampton) 757.727.8311 (Outside & Cell phones) School Information http://www.hampton.k12.va.us/ 757.727.2000
Hampton’s quality of life is a breath of fresh air and one of the best kept secrets on the east coast. A beautiful city with a mild climate and cost of living well below the national average, Hampton has one of the lowest crime rates in the region and was rated as one of the “Best Places to Live” by Money Magazine. Hampton was also recently named one of the 100 Best Communities for Young People in the first-ever national competition held by America’s Promise. Hampton is committed to its youth and filled with citizens passionate about their city and dedicated to making Hampton a great place to live.
Source: The City of Hampton website, http://www.hampton.gov/living/welcome_to_hampton.html 2012; United States Census Bureau, Census 2010
31
OVERVIEW OF HAMPTON CITY AND HAMPTON CITY SCHOOLS Hampton History and Facts
Located on the southeastern tip of the Virginia peninsula on the Chesapeake Bay, Hampton is the oldest continuously settled English community in the United States. As an Indian village called Kecoughtan, it had been visited by the first English colonists before they sailed up the James River to settle in Jamestown.
In 1610 the construction of Fort Henry and Fort Charles at the mouth of Hampton Creek marked the beginnings of Hampton. In 1619, the settlers chose an English name for the community, Elizabeth City. The settlement was known as Hampton as early as 1680, and in 1705 Hampton was recognized as a town. The City of Hampton was first incorporated in 1849 and classified as a city of the second class in 1908. In 1952 Hampton, the independent town of Phoebus and Elizabeth City County, encompassing Buckroe and Foxhill, were consolidated under one municipal government and classified as city of the first class.
The first free public schools in the United States were founded in Hampton by Benjamin Syms and Thomas Eaton and are commemorated in the Syms-Eaton Museum. Hampton is the site of Hampton University, established in 1868 to educate freed slaves, and Thomas Nelson Community College. St. John's Episcopal parish was founded in 1610, making it the oldest in the country.
Fort Monroe dates from 1819. For a long period during the American Civil War the fort was the only Union outpost in the Confederacy. The famous battle between the first ironclad battleships, the Monitor and the Merrimac, was fought just offshore.
During the Civil War the city was burned down by its own troops rather than surrender to Federalist troops in 1861. Before the fire, Hampton had 30 businesses and over 100 homes. Fewer than six buildings remained intact after the fire. In 1884 fire again besieged Hampton and almost completely destroyed the downtown business district.
Today Hampton is a thriving city of over 137,000 residents. Major industries are NASA and high-tech firms, seafood processing, military and tourism. In 1992, the Virginia Air and Space Center opened on the downtown waterfront with almost 300,000 visitors a year coming through its doors.
The city's logo and slogan - Hampton, America's First - identifies the city as home to many firsts such as America's first continuous English-speaking settlement; America's first free public education; and America's first training ground for the astronauts and many, many more.
Source: The City of Hampton website, http://www.hampton.gov/rec/history_and_facts.html 2012
32
OVERVIEW OF HAMPTON CITY AND HAMPTON CITY SCHOOLS Hampton City School Division The Hampton City School Board is responsible for preschool, elementary and secondary education within the city. There are seven elected school board members serving four year staggered terms. The city has a population of approximately 137,000 with a budgeted student population of 20,700 for FY13. The school division’s instructional program encompasses preschool through 12th grade. The division includes nineteen elementary schools, five middle schools, two prekindergarten – eighth grade combined schools, four high schools, one 3-8 gifted magnet school, one early childhood center, and three alternative programs co-located at one site, the new Campus at Lee. Hampton City School Division is a fiscally dependent school division pursuant to state law. As a fiscally dependent school division, assessed and market value of taxable property and tax rates do not apply, nor does the school division maintain a debt service fund. State law prohibits the school division from entering into debt that extends beyond the current fiscal year without the approval of the local governing body. The governing body in the City of Hampton is the City Council. STRATEGIC PLAN 2010-2015 Hampton City Schools is committed to continuous improvement. To that end, Stakeholder-Driven Strategic Planning in Education: A Practical Guide for Developing and Deploying Successful Long-Range Plans by Robert W. Ewy (2009) served as the model for developing the 2010-2015 strategic plan. The guide is grounded in research conducted at the Midcontinent Research in Education and Learning (McREL) laboratory and the Strategic Planning Category of the Baldrige Education Criteria for Performance Excellence. To see the full plan, go to http://www.hampton.k12.va.us/schoolinformation/strategicgoals/StrategicPlan2015March%202011.pdf. MISSION, VALUES AND GOALS MISSION In collaboration with our community, Hampton City Schools ensures academic excellence for every child, every day, whatever it takes. CORE VALUES We believe that the developmental needs of children are central to every aspect of the operations of Hampton City Schools and that all interactions with our stakeholders must be governed by our core values—integrity, responsibility, innovation, excellence and professionalism. In Hampton City Schools we will exhibit: Integrity by being honest, sincere, and trustworthy; treating all with fairness
and respect. Responsibility by being accountable and reliable.
33

OVERVIEW OF HAMPTON CITY AND HAMPTON CITY SCHOOLS Innovation by taking risks, being creative, and recognizing that small gains are
important. Excellence by exceeding expectations; committing to quality through a focus
on high standards and continuous improvement. Professionalism by communicating effectively, demonstrating confidence in
our abilities, maintaining competence, working collaboratively and exhibiting leadership.
GOALS GOAL ONE: MAXIMIZE EVERY CHILD’S LEARNING To meet or exceed the performance levels described in the student learning targets, the following strategic objectives will be implemented: � Standards-based teaching and learning—policies, initiatives, curriculum, instruction, assessments and student performance based upon clearly defined rigorous academic standards � Students as critical and creative thinkers—opportunities provided for students to explore new ideas, points of view and possibilities, to frame questions and gather information, use reason to investigate questions, evaluate ideas, advocate positions and resolve conflicts � Students as responsible learners—opportunities provided for students to set goals and monitor progress, both individually and collaboratively, design learning strategies and identify indicators of success � Prevention, not remediation—system that includes both time and support for intervention and enrichment � Relevancy-based teaching and learning—opportunities provided for students to apply core knowledge, concepts and skills to solve real world problems or tasks, connecting concepts to current issues GOAL TWO: CREATE SAFE, NURTURING LEARNING ENVIRONMENTS To meet or exceed the performance levels described in the student learning targets, the following strategic objectives will be implemented: � Relationship building—relationships and safety nets to ensure student success academically, socially, emotionally and physically. � Physical environment—comfortable, welcoming, clean facilities that are in compliance with regulatory guidelines. � Caring environment—psychological, social and emotional safety to increase student connection to school. � Positive culture—students and staff demonstrate Hampton City Schools core values and a sense of community in each classroom. GOAL THREE: ENHANCE PARENT AND COMMUNITY ENGAGEMENT AND SATIS FACTION To meet or exceed the performance levels described in the student learning targets the following strategic objectives will be implemented: � Parent, student and staff alliances—active participation in the division in areas that most interest and affect them with a clear understanding of mutual roles and benefits.
34

OVERVIEW OF HAMPTON CITY AND HAMPTON CITY SCHOOLS � Customer-based culture—superior customer service designed to identify and exceed the expectations of all customers. � Community collaboration—involvement of stakeholders to address district challenges. GOAL FOUR: ATTRACT, DEVELOP AND RETAIN EXCEPTIONAL STAFF KEY INITIATIVES—GOAL 4 To meet or exceed the performance levels described in the student learning targets the following strategic objectives will be implemented: � Build staff capacity—learning systems that develop the knowledge, skills and abilities of all staff. � Talent investment—systems, policies and processes for recruitment, retention, assessment and evaluation, compensation and benefits and succession planning. � Workforce commitment—systems, policies and processes that support collaborative, trusting, respectful relationships, a safe environment, good communication and information flow and satisfaction with work. GOAL FIVE: MAINTAIN EFFECTIVE, EFFICIENT AND INNOVATIVE SUPPORT SYSTEMS To meet or exceed the performance levels described in the student learning targets the following strategic objectives will be implemented: � Management by fact—data and information analyzed to determine trends, projections, and cause ad effect to support planning, improve division operations, and identify best practice benchmarks and compare division performance with comparable districts. � Culture of continuous improvement—the structured problem-solving process of plan-do-study-act (PDSA) followed for all improvement activities. � Process management—organizational knowledge and skills deployed to identify and improve core processes. � Emergency preparedness—procedures focused on prevention, management, continuity of operations and recovery of key work processes. GOAL SIX: MANAGE FISCAL RESOURCES EFFECTIVELY AND EFFICIENTLY To meet or exceed the performance levels described in the student learning targets the following strategic objectives will be implemented: � Transparency—disclosing fiscal information in a timely and systematic manner. � Benchmarking—comparing business processes and performance metrics to best practices. � Financial discipline—systematically collecting, analyzing and using information to align performance expectations with resources.
35
AMERICA'S FIRSTIN FREE EDUCATION
N
REVISED AUGUST 2012
Area Map ofHampton City Schools
ELEMENTARY 1. Aberdeen 1412 Aberdeen Road 2. Armstrong 3401 Matoaka Road 3. Asbury 140 Beach Road 4. Barron 45 Fox Hill Road 5. Bassette 671 Bell Street 6. Booker 160 Apollo Drive 7. Bryan 1021 N. Mallory Street 8. Burbank 40 Tidemill Lane 9. Cary 2009 Andrews Blvd.10. Cooper 200 Marcella Road11. Forrest 1406 Todds Lane12. Kraft 600 Concord Drive13. Langley 16 Rockwell Road14. Machen 20 Sacramento Drive15. Phillips 703 Lemaster Drive
16. Smith 379 Woodland Road17. Tarrant 1589 Wingfield Drive18. Tucker-Capps 113 Wellington Drive19. Tyler 57 Salina Street
MIDDLE20. Davis 1435 Todds Lane21. Eaton 2108 Cunningham Drive22. Lindsay 1636 Briarfield Road23. Syms 170 Fox Hill Road24. Jones 1819 Nickerson Blvd.
COMBINED25. Hunter B. Andrews 3120 Victoria Blvd.26. George P. Phenix 1061 Big Bethel Road27. Spratley Gifted Center 339 Woodland Road
HIGH28. Bethel 1067 Big Bethel Road29. Hampton 1491 W. Queen Street30. Kecoughtan 522 Woodland Road31. Phoebus 100 Ireland Street
SPECIAL PROGRAMS& ADMINISTRATIVE OFFICES32. The Campus at Lee – Adult Education Center – Bridgeport Academy – Performance Learning Center 1646 Briarfield Road33. Moton Early Childhood Center 339 Old Buckroe Road34. School Administrative Center 1 Franklin Street
14
8
9
11
1213 3
4
16
33
20
10
6
7
1
225
5
15
1918
17
2826
23
27
22 32
21
24
31
30
29
Well
ington
Dr.
Cunningham Dr.
Todds La.
W. Mercury Blvd.
Po
whatan Pkwy.
Victoria Blvd.
W. Pembroke Ave.
Briarfield Rd.
Aber
deen
Rd.
King
St.
Chesapeake Ave.
LaSa
lle A
ve.
Bell
St.
Shell Rd.
Marcella Rd.Tide Mill La.
Wingfield Dr.
Sacramento Dr.
Newport News Connector
Apollo Dr.
Fox H
ill Rd.
Bea
ch R
d.
Lem
aste
r Ave
Matoaka Rd.
Clarem
ont Ave.
LaSa
lle A
ve.
Irelan
d St
.
N.K
ing
St.
LANGLEY A.F.B.
HAMPTON U.
FT. MONROE
Andrews Blvd.
Mercury Blvd.
E. Mercury Blvd.
Woodland Rd.
Old Buckr
oe R
d.
Mallory St
.
Salin
a St
.Sa
lem S
t.
COLISEUM
Concord Dr.
Arm
istea
d Av
e.
Nickerson Blvd.
Hunt
Club
Blvd
.
Thomas St.Fr
ankli
nSt
.
Lincoln St.
34
Hampton Rds. Center Pkwy
Magruder Blvd
.
Settlers Lndg.
Big Be
thel R
d.
Clem
woo
dPk
y.Ro
ckwe
ll Rd.
E. Little Back River Rd
Harri
s Ck.
Rd.
CourtneyDr.
Semple Farm Rd.Commander Shepard Blvd.
Queen St. W. Queen St.
Kecoughtan Rd. Kecoughtan Rd.
Arm
istea
d Ave
.
64
64
36

37
TestingMike Burton
Research Eval SpecialistPhyllis Wellbrock
Organizational DevJoan Davis
Assistant Director HRBarbara Warren Jones
Adult EDMary Ellen Dreybus
Student Services & SecurityTim Grimes
Jones MiddleDr. Daniel Bowling
Eaton Middle
Davis Middle
Mark Hudson
Kecoughtan HighRaymond Haynes
Hampton HighMyra Chambers
Perf. Learning CenterKatherine Fox
Psychological ServicesDr. Mariella Zapatero
School Social WorkDr. Ivy Lee
Health ServicesLinda Lawrence
Bridgeport AcademyAngelina Lipford
Phoebus HighRobert Johnson
Bethel HighDr. John Bailey
Lindsay MiddleWilliam Beverley
Syms MiddleSharon Slater
Elizabeth Winebarger
Merrimack ElementaryAndrea Riddick
Tyler Elementary
Aberdeen ElementaryKarla Young
Burbank ElementaryBrenda McIntyre-Odoms
Tarrant ElementaryMichael Stutt
Booker ElementaryTroy Latuch
Barron ElementaryMary Wallen
Smith ElementaryDr. Lawrence Myers
Title I School
Title I TargetedAssistance School
Kraft ElementaryRalph Saunders
Langley ElementaryKathryn Hermann
Machen ElementaryPatricia Clark
Cooper ElementaryChevese Thomas
Early ChildhoodValencia Lewis
Phenix PreK-8Anita Owens
Tucker-Capps Elementary
21st CenturyJeremy Ross
Asbury ElementaryDr. Penny McIntyre
Moton Early ChildhoodJoanne Drew
Armstrong ElementaryLevia Stovall
Spratley Gifted CenterDr. Kenneth Crum
Susan Johnson
School/Dept./Position
2011-2012
SCHOOL BOARD
Superintendent
Carolyn BowersClerk of the Board
Nanci ReavesBoard Attorney/Policies
Ann Stephens-CherryExecutive Director of
Public Relations and Marketing
Sue BarrExecutive Assistant
PEG TVScotty Bowers
Print/Records MgtMarty Wood
AthleticsBeth Mair
GraphicsMatt Houser
Ann BaneDirector of Community &
Legislative Relations
Paula BrownDirector of Instructional
Accountability
Dr. Patricia LearyExecutive Director of
Elementary School Leadership
Dr. John CaggianoExecutive Director of Elementary
School Leadership & Title I
Dr. Donna WoodsExecutive Director of
Secondary School Leadership
Robbin RuthExecutive Director of
Human Resources
Special EducationDr. Elisabeth Powers
Fine ArtsVivian Griese
CTEJesse White
MathematicsCarolyn Holmes
Language Arts
Social StudiesAlma Dietz
ScienceRichard MacDonald
School CounselingPenny Petersen
Information LiteracyCheryl Grobel
Foreign Language/ESLDeborah Sommer
Health & Physical EducationPatricia Thompson
Academic Advancement& EnrichmentRuth Grillo
TransportationDavid Benware
School Food Nutrition ServicesDr. Julia Bryant
Assistant Director BudgetLisa Deanhofer
Assistant Director AccountingVizel Townsend
Information TechnologyJohn Eagle
Maintenance & OperationsTom Sawyer
Business & FinanceSuzanna Scott
Assistant Director SchoolFood Nutrition Services
Linda Irby
Andrews PreK-8Donna Warthan
Forrest ElementaryTracie Albea
Phillips ElementaryHeidi Brezinski
Bryan ElementarySean Holleran
Cary ElementaryRonald Holloman
Bassette ElementaryUrsula Hill
Dr. Victor HellmanDeputy Superintendent for
Facilities & Business Support
Dr. Patricia JohnsonDeputy Superintendent for
Curriculum & Instruction Pre K-12
Division Leadership Team
ORGANIZATIONAL KEY
38

BUDGET DEVELOPMENT PROCESS
A new process was implemented for the FY09 budget development. Previously, the majority of budget line items were developed on an incremental budgeting basis; however, based on recommendations from a curriculum audit for Hampton City Schools, the division determined that a performance based approach was necessary.
What is the difference?
In performance-based (zero-based) budgeting the financial planners start from a zero base. In other words, they assume that no program is necessary and no money need be spent. For a program to be accepted, it will have to be proven worthwhile and financially sound in an evaluation of all elements of revenue and spending.
An incremental budget, on the other hand, treats existing programs and departments as already approved, subject only to increases or decreases in the financial resources allocated. The organization's historical costs are the base from which budget planning starts. The focus of the budgeting process is on the changes anticipated in last year's figures. The planning process has already been completed and the program priorities established.
What does the curriculum audit recommend?
Auditors concluded that budgeting procedures followed by Hampton City Schools do not include formal documented procedures for determining cost-benefit analysis; for linking budget allocations to student performance and program evaluations; or for expansion, reduction, or stabilization of the budget based on changing needs or priorities. Rather, principals and department administrators are allowed to request funds for programs and initiatives without documentation of results or procedures for evaluating the effectiveness of the initiative. In the absence of policies requiring needs-based budgeting, budget procedures maintain the status quo rather than being able to equitably respond to changing student needs. (Finding 5.1, pg 187 of A Curriculum Management Audit of the Hampton City Schools dated April 2006)
What are we doing?
In an effort to implement the recommendations of the curriculum audit committee, the division is following a three year phased in approach. Phase I (creating a program budget reporting format) has been completed. Phase II was creating the 2008-09 budget in a program format and working with departments to detail their operating requirements from the ground up. Phase III was to be the development of the 2009-10 budget through a performance based budgeting process. The division did not have a full year of program data until June 30, 2008; therefore, data for this base year was available as of the Fall 2008 when we began the 2009-10 budget process, and decisions based upon performance could be made. However, no one could have foreseen the downturn in economic conditions that occurred during calendar 2008. As a result, significant budget reduction decisions had to be made which severely impacted our ability to address performance based budgeting in either FY10 or FY11 as we might have hoped. Still, many decisions were made that continued to move us in the direction of full performance based budgeting. We were also able to address
39
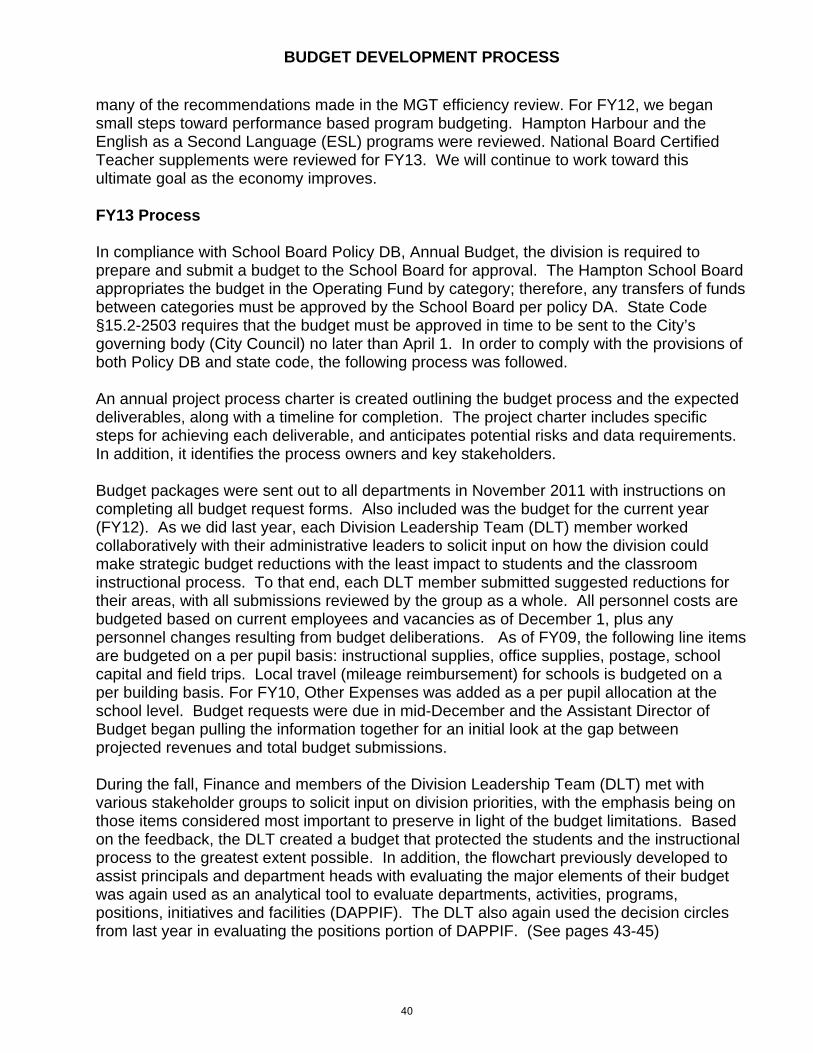
BUDGET DEVELOPMENT PROCESS
many of the recommendations made in the MGT efficiency review. For FY12, we began small steps toward performance based program budgeting. Hampton Harbour and the English as a Second Language (ESL) programs were reviewed. National Board Certified Teacher supplements were reviewed for FY13. We will continue to work toward this ultimate goal as the economy improves.
FY13 Process In compliance with School Board Policy DB, Annual Budget, the division is required to prepare and submit a budget to the School Board for approval. The Hampton School Board appropriates the budget in the Operating Fund by category; therefore, any transfers of funds between categories must be approved by the School Board per policy DA. State Code §15.2-2503 requires that the budget must be approved in time to be sent to the City’s governing body (City Council) no later than April 1. In order to comply with the provisions of both Policy DB and state code, the following process was followed. An annual project process charter is created outlining the budget process and the expected deliverables, along with a timeline for completion. The project charter includes specific steps for achieving each deliverable, and anticipates potential risks and data requirements. In addition, it identifies the process owners and key stakeholders. Budget packages were sent out to all departments in November 2011 with instructions on completing all budget request forms. Also included was the budget for the current year (FY12). As we did last year, each Division Leadership Team (DLT) member worked collaboratively with their administrative leaders to solicit input on how the division could make strategic budget reductions with the least impact to students and the classroom instructional process. To that end, each DLT member submitted suggested reductions for their areas, with all submissions reviewed by the group as a whole. All personnel costs are budgeted based on current employees and vacancies as of December 1, plus any personnel changes resulting from budget deliberations. As of FY09, the following line items are budgeted on a per pupil basis: instructional supplies, office supplies, postage, school capital and field trips. Local travel (mileage reimbursement) for schools is budgeted on a per building basis. For FY10, Other Expenses was added as a per pupil allocation at the school level. Budget requests were due in mid-December and the Assistant Director of Budget began pulling the information together for an initial look at the gap between projected revenues and total budget submissions. During the fall, Finance and members of the Division Leadership Team (DLT) met with various stakeholder groups to solicit input on division priorities, with the emphasis being on those items considered most important to preserve in light of the budget limitations. Based on the feedback, the DLT created a budget that protected the students and the instructional process to the greatest extent possible. In addition, the flowchart previously developed to assist principals and department heads with evaluating the major elements of their budget was again used as an analytical tool to evaluate departments, activities, programs, positions, initiatives and facilities (DAPPIF). The DLT also again used the decision circles from last year in evaluating the positions portion of DAPPIF. (See pages 43-45)
40
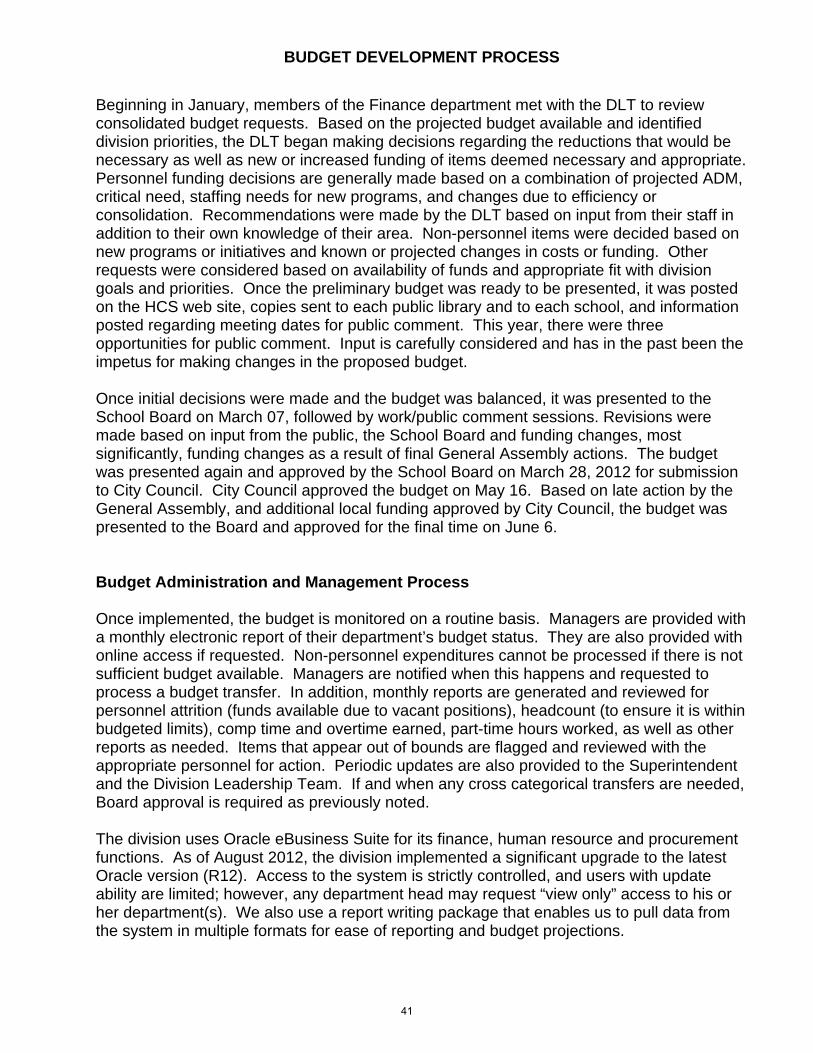
BUDGET DEVELOPMENT PROCESS
Beginning in January, members of the Finance department met with the DLT to review consolidated budget requests. Based on the projected budget available and identified division priorities, the DLT began making decisions regarding the reductions that would be necessary as well as new or increased funding of items deemed necessary and appropriate. Personnel funding decisions are generally made based on a combination of projected ADM, critical need, staffing needs for new programs, and changes due to efficiency or consolidation. Recommendations were made by the DLT based on input from their staff in addition to their own knowledge of their area. Non-personnel items were decided based on new programs or initiatives and known or projected changes in costs or funding. Other requests were considered based on availability of funds and appropriate fit with division goals and priorities. Once the preliminary budget was ready to be presented, it was posted on the HCS web site, copies sent to each public library and to each school, and information posted regarding meeting dates for public comment. This year, there were three opportunities for public comment. Input is carefully considered and has in the past been the impetus for making changes in the proposed budget. Once initial decisions were made and the budget was balanced, it was presented to the School Board on March 07, followed by work/public comment sessions. Revisions were made based on input from the public, the School Board and funding changes, most significantly, funding changes as a result of final General Assembly actions. The budget was presented again and approved by the School Board on March 28, 2012 for submission to City Council. City Council approved the budget on May 16. Based on late action by the General Assembly, and additional local funding approved by City Council, the budget was presented to the Board and approved for the final time on June 6. Budget Administration and Management Process Once implemented, the budget is monitored on a routine basis. Managers are provided with a monthly electronic report of their department’s budget status. They are also provided with online access if requested. Non-personnel expenditures cannot be processed if there is not sufficient budget available. Managers are notified when this happens and requested to process a budget transfer. In addition, monthly reports are generated and reviewed for personnel attrition (funds available due to vacant positions), headcount (to ensure it is within budgeted limits), comp time and overtime earned, part-time hours worked, as well as other reports as needed. Items that appear out of bounds are flagged and reviewed with the appropriate personnel for action. Periodic updates are also provided to the Superintendent and the Division Leadership Team. If and when any cross categorical transfers are needed, Board approval is required as previously noted. The division uses Oracle eBusiness Suite for its finance, human resource and procurement functions. As of August 2012, the division implemented a significant upgrade to the latest Oracle version (R12). Access to the system is strictly controlled, and users with update ability are limited; however, any department head may request “view only” access to his or her department(s). We also use a report writing package that enables us to pull data from the system in multiple formats for ease of reporting and budget projections.
41
BUDGET DEVELOPMENT PROCESS
Internal controls are in place to ensure adequate segregation of duties in the payroll, accounts payable, accounts receivable, general ledger reporting, and other financial functions, both at the district level and at the school level. In addition, the division is audited by independent auditors on an annual basis. The delegated procurement authority for departments (the level at which purchases may be made without going through Procurement) is $4,999.99 or less. Purchases $5,000 and over must be submitted on a requisition to Procurement for appropriate bidding and award. We share a Consolidated Procurement office with the city, reimbursing them for a proportionate share of the cost. We have used this model for many years with great success. The division does not carry a fund balance, except to the extent that outstanding encumbrances exist as of June 30 that must be paid for in the subsequent fiscal year. Any unspent funds at year end are returned to the city.
42
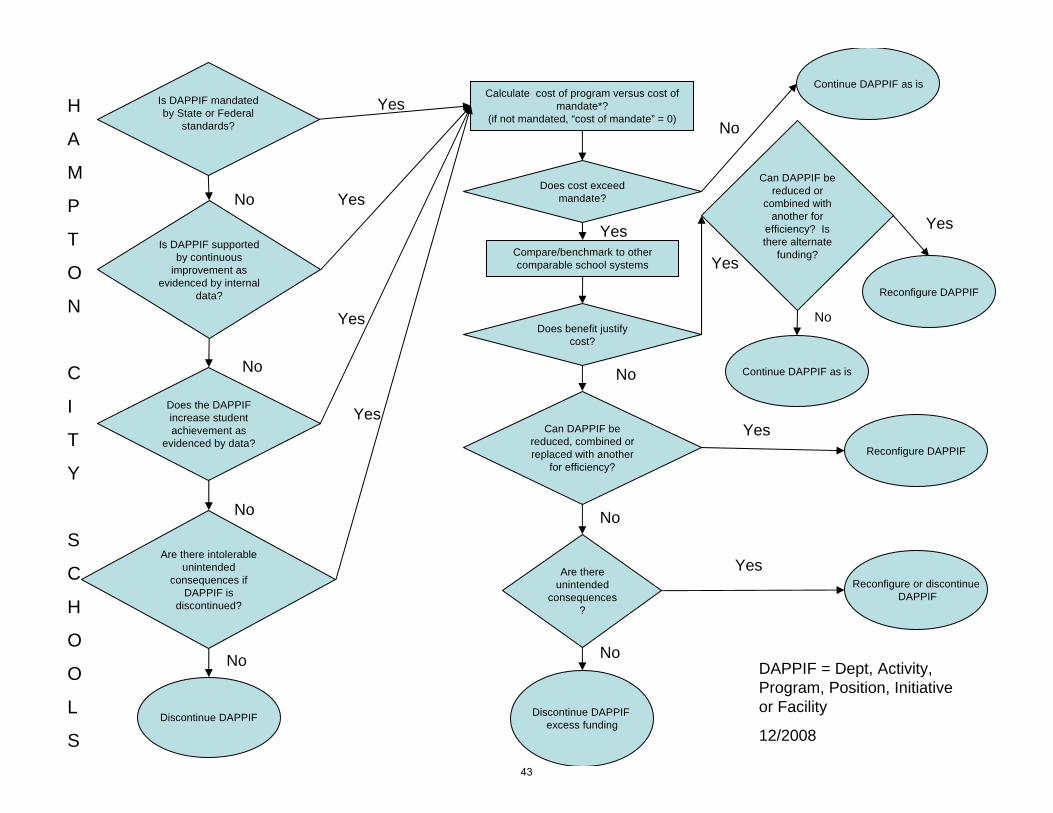
Is DAPPIF mandated by State or Federal
standards?
Is DAPPIF supported by continuous
improvement as evidenced by internal
data?
Calculate cost of program versus cost of mandate*?
(if not mandated, “cost of mandate” = 0)
Yes
Yes
Compare/benchmark to other comparable school systems
Does benefit justify cost?
Can DAPPIF be reduced, combined or replaced with another
for efficiency?
Does the DAPPIF increase student achievement as
evidenced by data?
Yes
Yes
Yes
Yes
No
No
No
Are there unintended
consequences?
No
No
No
Reconfigure DAPPIF
Reconfigure or discontinueDAPPIF
Discontinue DAPPIF excess funding
Discontinue DAPPIF
Are there intolerable unintended
consequences if DAPPIF is
discontinued?
Yes
No
Can DAPPIF be reduced or
combined with another for
efficiency? Is there alternate
funding?
Continue DAPPIF as is
Reconfigure DAPPIF
Yes
DAPPIF = Dept, Activity, Program, Position, Initiative or Facility
12/2008
H
A
M
P
T
O
N
C
I
T
Y
S
C
H
O
O
L
S
No
Does cost exceed mandate?
Continue DAPPIF as is
No
Yes
43
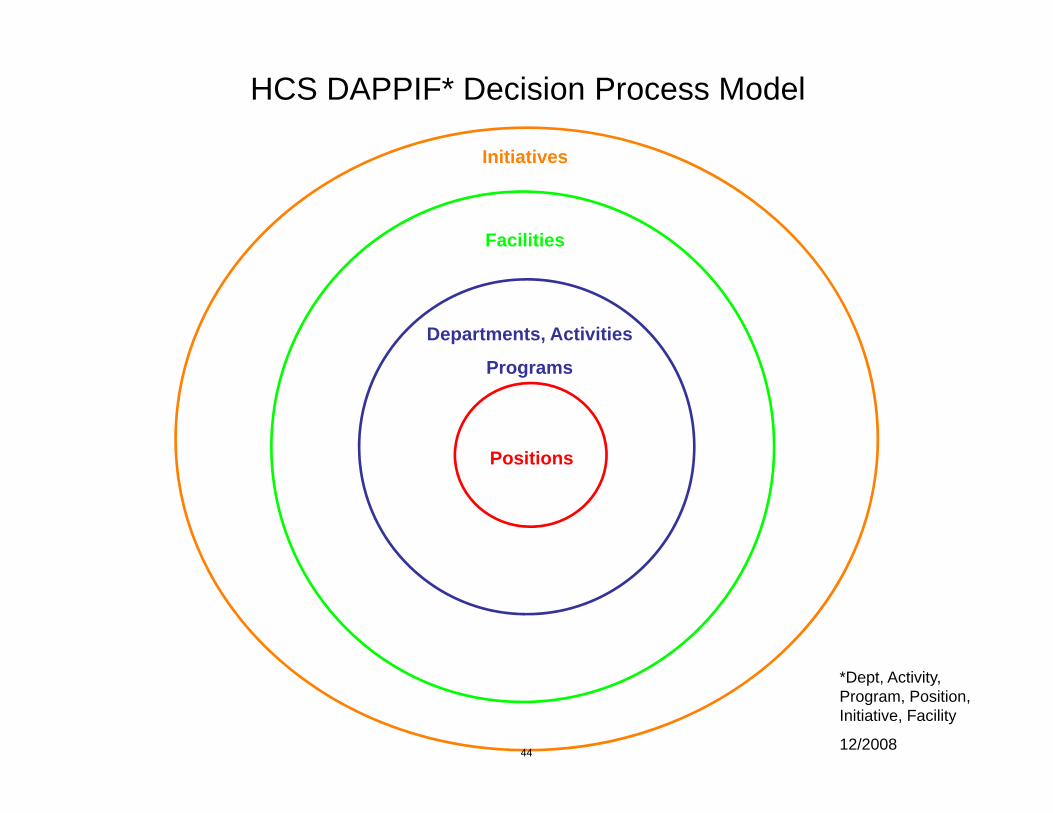
Positions
Initiatives
Facilities
Departments, Activities
Programs
HCS DAPPIF* Decision Process Model
*Dept, Activity, Program, Position, Initiative, Facility
12/200844

12/2008
ClassroomTeachers
Operational Admin
Instructional Support
Principals
School Admin
Operational Support
Clerical
Part-time & Temporary
Contracted
HCS Position Decision Process Model
45
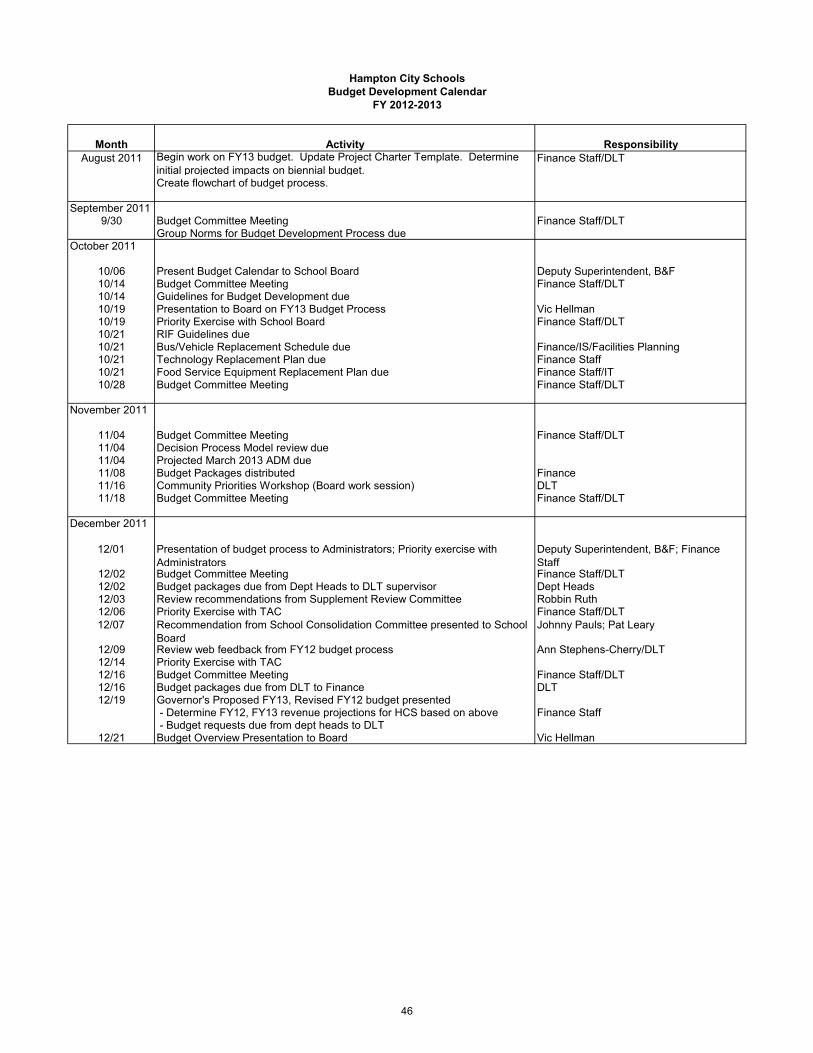
Month Activity ResponsibilityAugust 2011 Begin work on FY13 budget. Update Project Charter Template. Determine
initial projected impacts on biennial budget.Finance Staff/DLT
Create flowchart of budget process.
September 20119/30 Budget Committee Meeting Finance Staff/DLT
Group Norms for Budget Development Process dueOctober 2011
10/06 Present Budget Calendar to School Board Deputy Superintendent, B&F10/14 Budget Committee Meeting Finance Staff/DLT 10/14 Guidelines for Budget Development due10/19 Presentation to Board on FY13 Budget Process Vic Hellman10/19 Priority Exercise with School Board Finance Staff/DLT 10/21 RIF Guidelines due10/21 Bus/Vehicle Replacement Schedule due Finance/IS/Facilities Planning10/21 Technology Replacement Plan due Finance Staff10/21 Food Service Equipment Replacement Plan due Finance Staff/IT10/28 Budget Committee Meeting Finance Staff/DLT
November 2011
11/04 Budget Committee Meeting Finance Staff/DLT11/04 Decision Process Model review due11/04 Projected March 2013 ADM due11/08 Budget Packages distributed Finance11/16 Community Priorities Workshop (Board work session) DLT11/18 Budget Committee Meeting Finance Staff/DLT
December 2011
12/01 Presentation of budget process to Administrators; Priority exercise with Administrators
Deputy Superintendent, B&F; Finance Staff
12/02 Budget Committee Meeting Finance Staff/DLT12/02 Budget packages due from Dept Heads to DLT supervisor Dept Heads12/03 Review recommendations from Supplement Review Committee Robbin Ruth12/06 Priority Exercise with TAC Finance Staff/DLT12/07 Recommendation from School Consolidation Committee presented to School
BoardJohnny Pauls; Pat Leary
12/09 Review web feedback from FY12 budget process Ann Stephens-Cherry/DLT12/14 Priority Exercise with TAC12/16 Budget Committee Meeting Finance Staff/DLT12/16 Budget packages due from DLT to Finance DLT12/19 Governor's Proposed FY13, Revised FY12 budget presented
- Determine FY12, FY13 revenue projections for HCS based on above Finance Staff - Budget requests due from dept heads to DLT
12/21 Budget Overview Presentation to Board Vic Hellman
Hampton City SchoolsBudget Development Calendar
FY 2012-2013
46
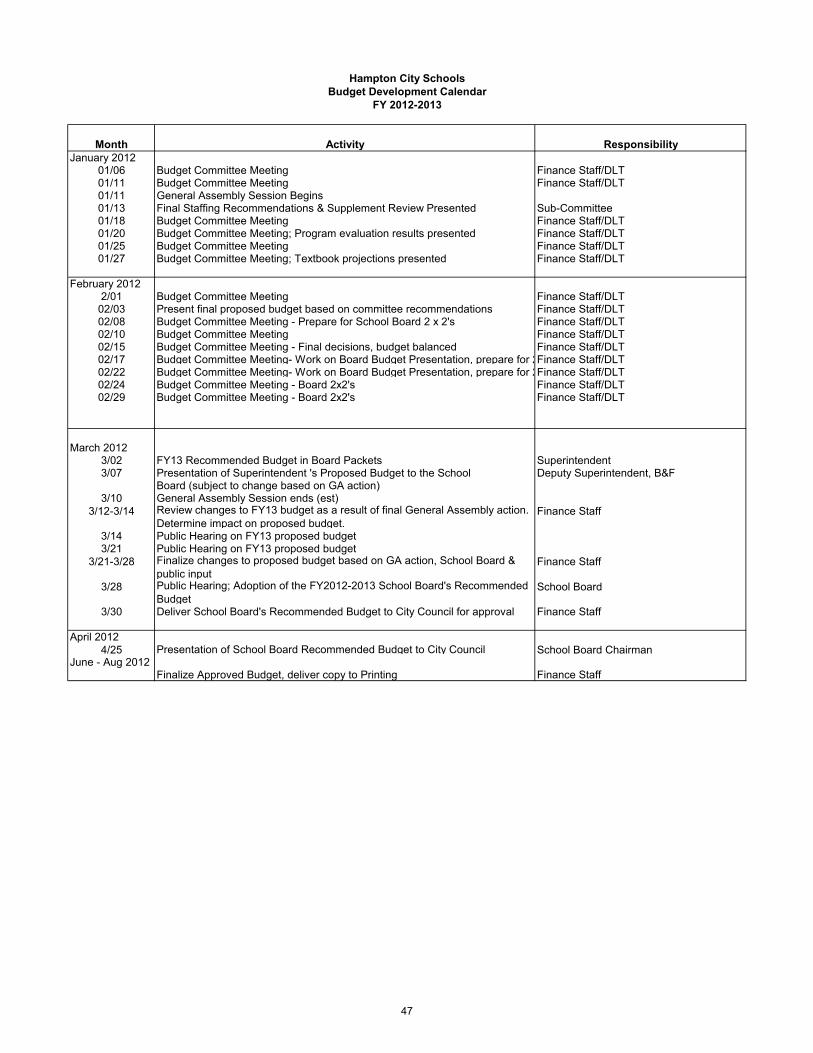
Month Activity Responsibility
Hampton City SchoolsBudget Development Calendar
FY 2012-2013
January 201201/06 Budget Committee Meeting Finance Staff/DLT01/11 Budget Committee Meeting Finance Staff/DLT01/11 General Assembly Session Begins 01/13 Final Staffing Recommendations & Supplement Review Presented Sub-Committee01/18 Budget Committee Meeting Finance Staff/DLT01/20 Budget Committee Meeting; Program evaluation results presented Finance Staff/DLT01/25 Budget Committee Meeting Finance Staff/DLT01/27 Budget Committee Meeting; Textbook projections presented Finance Staff/DLT
February 20122/01 Budget Committee Meeting Finance Staff/DLT
02/03 Present final proposed budget based on committee recommendations Finance Staff/DLT02/08 Budget Committee Meeting - Prepare for School Board 2 x 2's Finance Staff/DLT02/10 Budget Committee Meeting Finance Staff/DLT02/15 Budget Committee Meeting - Final decisions, budget balanced Finance Staff/DLT02/17 Budget Committee Meeting- Work on Board Budget Presentation, prepare for 2x2'sFinance Staff/DLT02/22 Budget Committee Meeting- Work on Board Budget Presentation, prepare for 2x2'sFinance Staff/DLT02/24 Budget Committee Meeting - Board 2x2's Finance Staff/DLT02/29 Budget Committee Meeting - Board 2x2's Finance Staff/DLT
March 20123/02 FY13 Recommended Budget in Board Packets Superintendent3/07 Presentation of Superintendent 's Proposed Budget to the School Deputy Superintendent, B&F
Board (subject to change based on GA action)3/10 General Assembly Session ends (est)
3/12-3/14 Review changes to FY13 budget as a result of final General Assembly action. Determine impact on proposed budget.
Finance Staff
3/14 Public Hearing on FY13 proposed budget3/21 Public Hearing on FY13 proposed budget
3/21-3/28 Finalize changes to proposed budget based on GA action, School Board & public input
Finance Staff
3/28 Public Hearing; Adoption of the FY2012-2013 School Board's Recommended Budget
School Board
3/30 Deliver School Board's Recommended Budget to City Council for approval Finance Staff
April 20124/25 Presentation of School Board Recommended Budget to City Council School Board Chairman
June - Aug 2012Finalize Approved Budget, deliver copy to Printing Finance Staff
47

ORGANIZATION OF FINANCIAL DATA
BASIS OF PRESENTATION – FUND ACCOUNTING The accounts of the Hampton City School Division are organized on the basis of funds, each of which is considered a separate accounting entity. Governmental Fund Types Governmental Funds are those through which most functions of the School Division are financed. The following are the Hampton City School Division’s governmental fund types: General Fund – The General Fund (Fund 50) is the general operating fund of the School Division. It is used to account for all financial resources except those required to be accounted for in another fund. Special Revenue Fund – Special Revenue Funds are used to account for the proceeds of specific revenue sources that are legally restricted to expenditures for specified purposes. School Food Services (Fund 51), Reimbursable Projects (Fund 60) and Student Activities (Fund 94) are accounted for in Special Revenue Funds. Debt Service Fund – The Debt Service Fund is used to account for the accumulation of resources for, and the payment of, general long-term debt principal, interest and related costs. The City of Hampton maintains the Debt Service Fund for the School Division. The School Division does not budget for debt service. According to state law, the School Division cannot issue debt that extends beyond the current fiscal year. Capital Project Fund – The Capital Project Fund (Fund 52) is used to account for financial resources to be used for the acquisition or construction of major capital facilities. The Capital Project Fund accounts for school construction and major renovations to facilities. The City of Hampton approves and funds the capital projects for Hampton City Schools. Basis of Accounting The modified accrual basis of accounting is used by the Governmental Funds. Under this basis, revenues are recorded when they are both measurable and available. Available means collectible within the current period or soon enough thereafter to be used to pay liabilities of the current period. Expenditures are recorded when the fund liability is incurred, if measurable. Encumbrances outstanding at year end are reported as reserved fund balances since they do not constitute expenditures or liabilities. Depreciation expense is not included in the budget. In applying the measurable and available accrual concept to revenues, the legal and contractual requirements of the programs are used as guidance. There are essentially two types of revenues. In one, monies must be expended on the specific purpose or project before any amounts will be paid to the School Division; therefore revenues are recognized based upon the expenditures recorded. In the other, monies are virtually unrestricted as to the purpose of expenditure and are usually revocable only for failure to comply with
48
ORGANIZATION OF FINANCIAL DATA
prescribed compliance requirements. These are reflected as revenues at the time of receipt or earlier if accrual criteria are met. Classification of Revenues and Expenditures Revenues of the School Division are classified by fund and source. There are three primary sources of revenue: state, federal and local. State revenues include funding of the Standards of Quality by the General Assembly, grants, and sales and use tax. Federal revenues include Impact Aid, Title I, Title II and Title VIB. Local revenues include interest on deposits, fees charged, and the local appropriation from the City government. Expenditures in the operating fund are classified by fund, cost center, service code (program), department, category and object. This budget includes summaries by fund, cost center, service code (program), department, category and object. Cash and Temporary Investments The City utilizes the pooled cash investment method. Income from the investment of pooled cash is allocated to the various funds based on the percentage of cash and temporary investments of each fund to the total. The investment of School Division cash on hand for all appropriated funds is the responsibility of the City Treasurer. Fund Balance State law prohibits school divisions from carrying over surplus funds from one fiscal year to the next in the General Fund, except in specific circumstances. Therefore, the School Division does not maintain a fund balance. The Hampton City Council may appropriate surplus funds from a prior fiscal year to the current fiscal year if requested, generally for one time maintenance and capital projects. Debt Service Fund State law prohibits school divisions from entering into debt that extends beyond the current fiscal year without approval from the local governing body. The governing body in Hampton is the Hampton City Council. If Hampton City Council approves a debt issue, it is listed in the name of the Hampton City Council. Hampton City Council also maintains the budget and administers all payments related to the debt service fund for the School Division. Due to this, the budget for the Debt Service Fund is not included in the School Division operating budget.
49

THIS PAGE INTENTIONALLY LEFT BLANK
50

FINANCIAL
REVENUES AND EXPENDITURES SIGNIFICANT TRENDS AND ASSUMPTIONS
REVENUES
The Operating Budget is comprised of four major revenue sources: state, federal, local, and miscellaneous. State State revenue flows to the school division in numerous ways. The most predominant is based on student average daily membership (ADM). Other methods used by the state to fund local education programs are the allocation of state sales tax, grants, and participation in regional educational programs. The state first provided school divisions a distribution of lottery funds for fiscal year 1999 and the state has continued the lottery funds in each fiscal year thereafter through FY09. The school division receives a share of the lottery funds collected by the State. Prior to FY10 at least fifty percent of the total lottery funds received was required to be spent on non-recurring costs. For FY10, the General Assembly approved shifting a majority of lottery proceeds to cover a portion of designated K-12 educational programs. State revenue as a percentage of the total budget has risen steadily over the last several years (see graph below). However, in FY07 the state significantly increased funding to local school divisions in an effort to address the under funded state Standards of Quality. That funding level was maintained in FY08 and FY09. Due to economic conditions in the state, state revenue decreased in FY10 and FY11 by a total of $31,973,939. This represents the largest decrease in state revenue for school divisions across the Commonwealth of Virginia in decades. For FY12, state funding was up slightly, by $3,800,404, much of it based on an increase in the budgeted ADM (Average Daily Membership) from 20,200 to 20,600. Currently, the FY13 budget has increased by $7,017,683 largely based on significant increases in the rates for VRS and Group Life, and funds received for Additional Assistance with Retirement, Inflation and Preschool Costs. The minimum level of state funding and local funding required is determined using the local composite index (LCI) formula. The LCI was recalculated for the current biennium (FY13, FY14), increasing by .0222, meaning that the division will be responsible for a greater proportion of the funding for each area. In addition, the Virginia Retirement System (VRS) and Group Life Insurance employer contribution rates rose significantly, from 12.21% to 17.96%. The next biennium may continue to be difficult as the economy struggles to gain steam and there are few additional resources to be distributed. The state has not funded compensation supplements for several years and is unlikely to do so in the near future.
51

REVENUES AND EXPENDITURES SIGNIFICANT TRENDS AND ASSUMPTIONS
Federal Federal revenue sources in the Operating Budget include Impact Aid and ROTC funding for personnel at the four high schools. Approximately 18% of our total students are connected to the federal government. Because the federal government does not pay property taxes, this Federal Impact Aid is designed to reimburse school districts for the loss of revenue due to the presence of the federal government. Federal Impact Aid comprises 83.3% of the federal revenue line item. Our federal revenue has remained a fairly nominal portion of the total operating budget and is projected to remain so over the next few years, with no significant changes in anticipated revenue. Local City funding has decreased slightly from 35.9% of the budget in FY12 to 33.8% of the budget in FY13. In the past, local contribution was becoming a smaller percentage of the total budget as state funding increases outpaced local increases and based on the effect of the local funding formula. As the state funds decreased significantly, local decreases were less significant. For FY12 and FY13, state funding began to inch back up, while the locality is still feeling the effects of the stalled economy and the downward trend in housing prices. Beginning in FY99, the City’s contribution is based on a formula that gives the school division 61.83% of all residential real estate, personal property and utility taxes. It was modified effective with the FY07 budget to add a financial guideline pertaining to real estate growth. The approved local contribution for FY13 is $64,925,178, including the one-time contribution of $898,570. Our local contribution has trended downward over the last three years, and with the slow economy and declining housing values, it is anticipated to continue either declining slightly or remaining fairly flat.
52
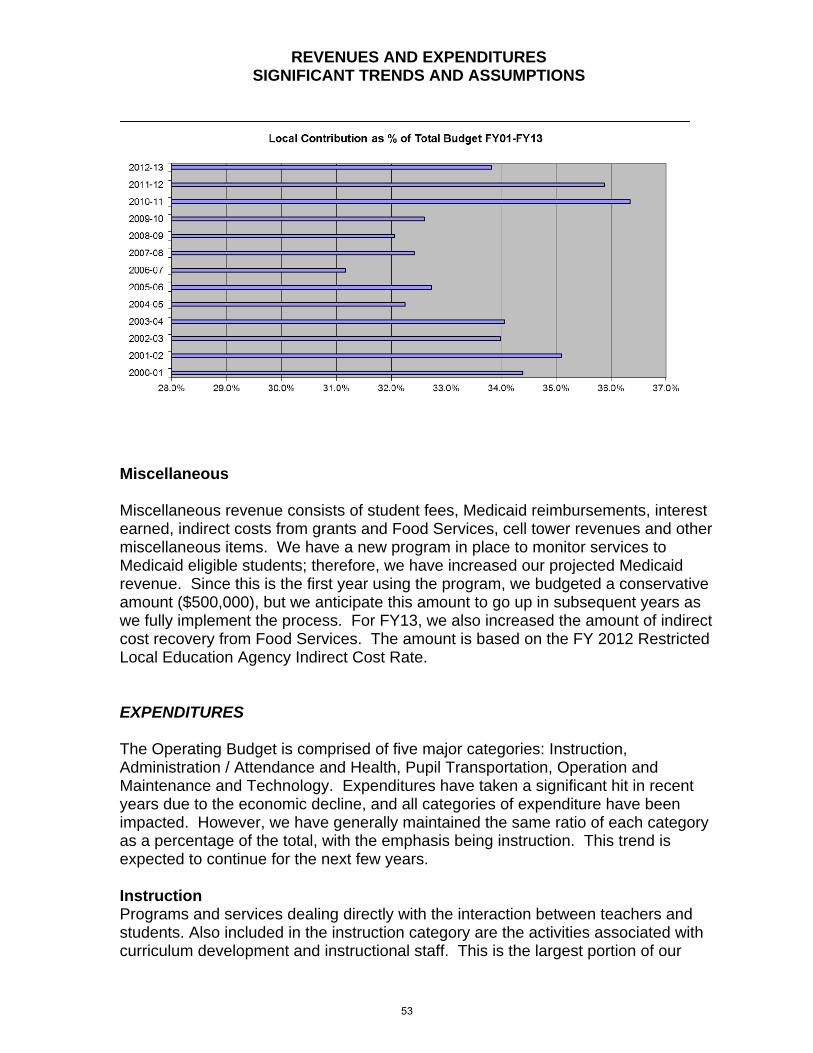
REVENUES AND EXPENDITURES SIGNIFICANT TRENDS AND ASSUMPTIONS
Miscellaneous Miscellaneous revenue consists of student fees, Medicaid reimbursements, interest earned, indirect costs from grants and Food Services, cell tower revenues and other miscellaneous items. We have a new program in place to monitor services to Medicaid eligible students; therefore, we have increased our projected Medicaid revenue. Since this is the first year using the program, we budgeted a conservative amount ($500,000), but we anticipate this amount to go up in subsequent years as we fully implement the process. For FY13, we also increased the amount of indirect cost recovery from Food Services. The amount is based on the FY 2012 Restricted Local Education Agency Indirect Cost Rate. EXPENDITURES The Operating Budget is comprised of five major categories: Instruction, Administration / Attendance and Health, Pupil Transportation, Operation and Maintenance and Technology. Expenditures have taken a significant hit in recent years due to the economic decline, and all categories of expenditure have been impacted. However, we have generally maintained the same ratio of each category as a percentage of the total, with the emphasis being instruction. This trend is expected to continue for the next few years. Instruction Programs and services dealing directly with the interaction between teachers and students. Also included in the instruction category are the activities associated with curriculum development and instructional staff. This is the largest portion of our
53
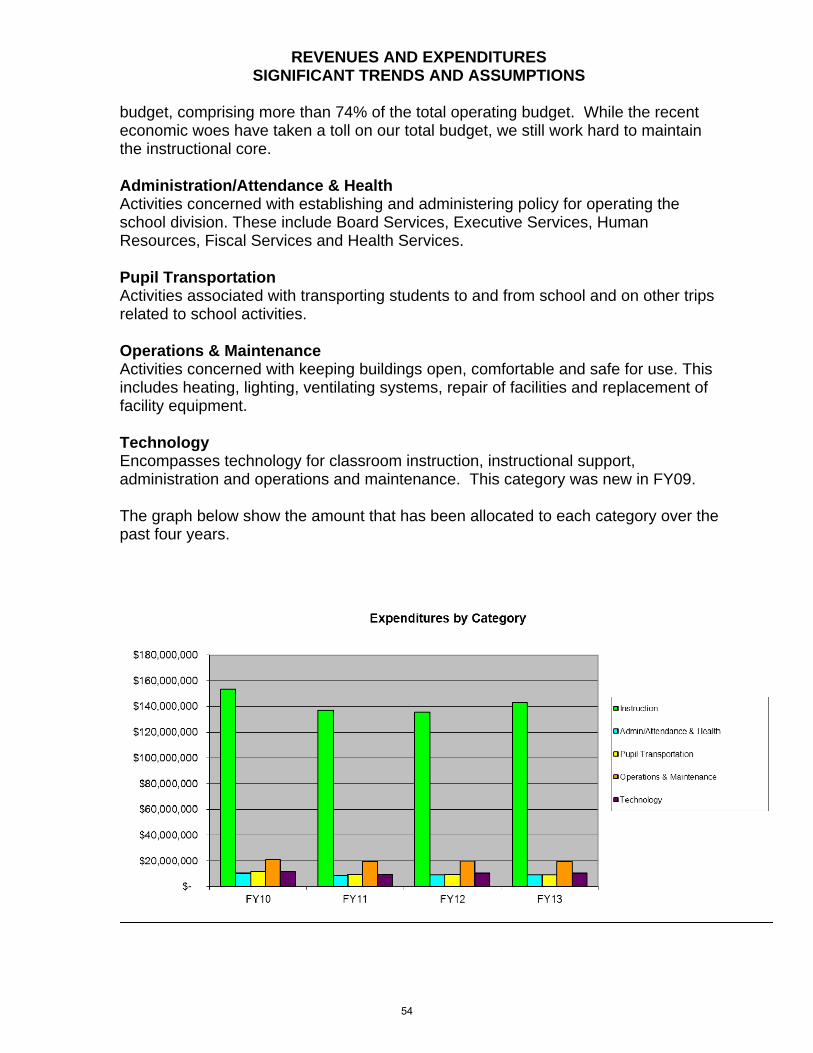
REVENUES AND EXPENDITURES SIGNIFICANT TRENDS AND ASSUMPTIONS
budget, comprising more than 74% of the total operating budget. While the recent economic woes have taken a toll on our total budget, we still work hard to maintain the instructional core. Administration/Attendance & Health Activities concerned with establishing and administering policy for operating the school division. These include Board Services, Executive Services, Human Resources, Fiscal Services and Health Services. Pupil Transportation Activities associated with transporting students to and from school and on other trips related to school activities. Operations & Maintenance Activities concerned with keeping buildings open, comfortable and safe for use. This includes heating, lighting, ventilating systems, repair of facilities and replacement of facility equipment. Technology Encompasses technology for classroom instruction, instructional support, administration and operations and maintenance. This category was new in FY09. The graph below show the amount that has been allocated to each category over the past four years.
54
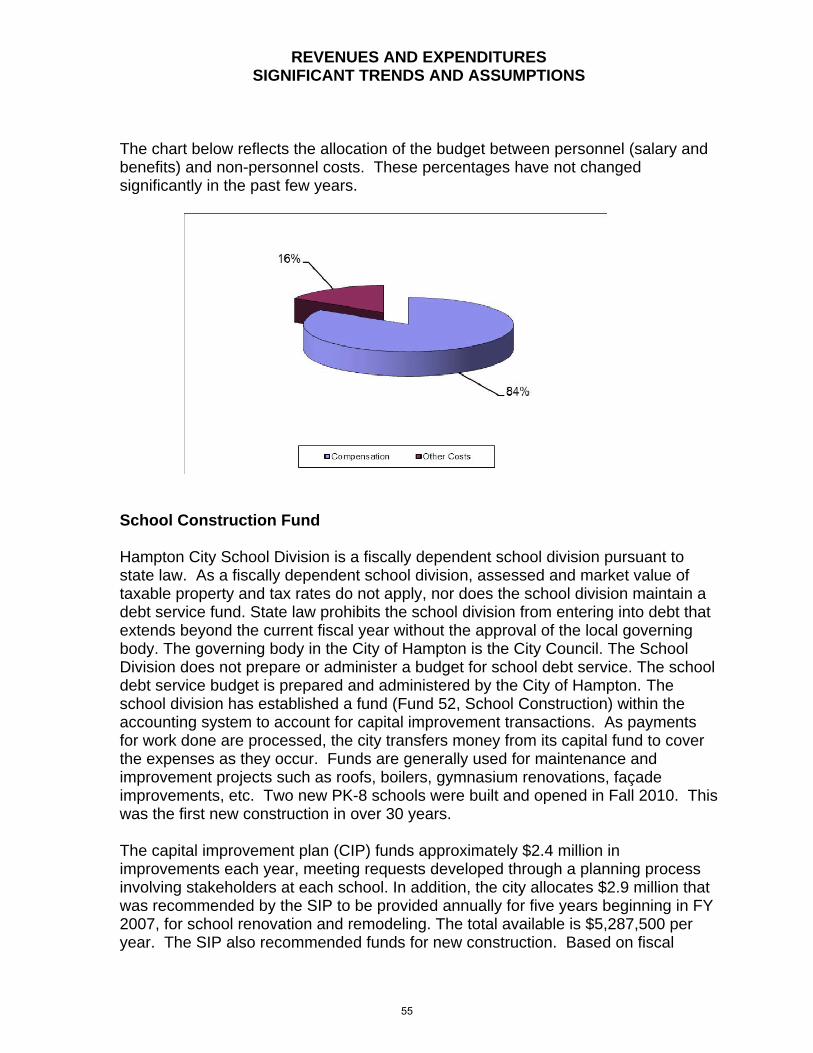
REVENUES AND EXPENDITURES SIGNIFICANT TRENDS AND ASSUMPTIONS
The chart below reflects the allocation of the budget between personnel (salary and benefits) and non-personnel costs. These percentages have not changed significantly in the past few years.
School Construction Fund Hampton City School Division is a fiscally dependent school division pursuant to state law. As a fiscally dependent school division, assessed and market value of taxable property and tax rates do not apply, nor does the school division maintain a debt service fund. State law prohibits the school division from entering into debt that extends beyond the current fiscal year without the approval of the local governing body. The governing body in the City of Hampton is the City Council. The School Division does not prepare or administer a budget for school debt service. The school debt service budget is prepared and administered by the City of Hampton. The school division has established a fund (Fund 52, School Construction) within the accounting system to account for capital improvement transactions. As payments for work done are processed, the city transfers money from its capital fund to cover the expenses as they occur. Funds are generally used for maintenance and improvement projects such as roofs, boilers, gymnasium renovations, façade improvements, etc. Two new PK-8 schools were built and opened in Fall 2010. This was the first new construction in over 30 years. The capital improvement plan (CIP) funds approximately $2.4 million in improvements each year, meeting requests developed through a planning process involving stakeholders at each school. In addition, the city allocates $2.9 million that was recommended by the SIP to be provided annually for five years beginning in FY 2007, for school renovation and remodeling. The total available is $5,287,500 per year. The SIP also recommended funds for new construction. Based on fiscal
55
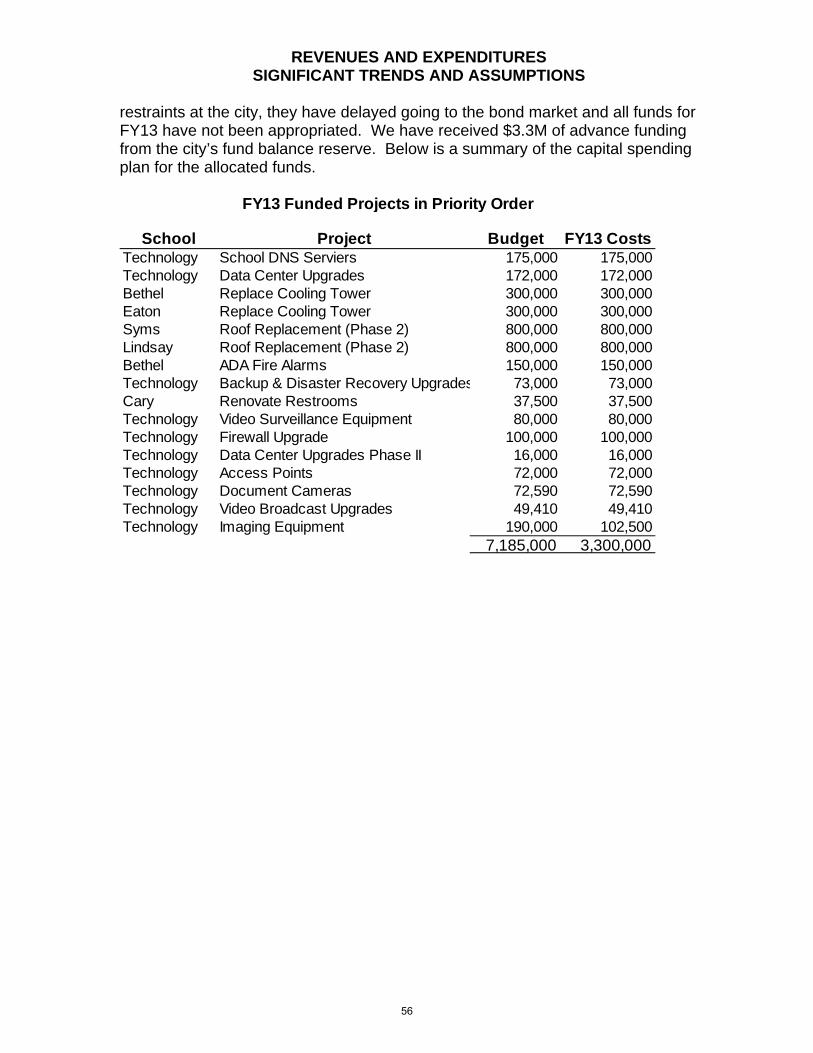
REVENUES AND EXPENDITURES SIGNIFICANT TRENDS AND ASSUMPTIONS
restraints at the city, they have delayed going to the bond market and all funds for FY13 have not been appropriated. We have received $3.3M of advance funding from the city’s fund balance reserve. Below is a summary of the capital spending plan for the allocated funds.
School Project Budget FY13 CostsTechnology School DNS Serviers 175,000 175,000Technology Data Center Upgrades 172,000 172,000Bethel Replace Cooling Tower 300,000 300,000Eaton Replace Cooling Tower 300,000 300,000Syms Roof Replacement (Phase 2) 800,000 800,000Lindsay Roof Replacement (Phase 2) 800,000 800,000Bethel ADA Fire Alarms 150,000 150,000Technology Backup & Disaster Recovery Upgrades 73,000 73,000Cary Renovate Restrooms 37,500 37,500Technology Video Surveillance Equipment 80,000 80,000Technology Firewall Upgrade 100,000 100,000Technology Data Center Upgrades Phase II 16,000 16,000Technology Access Points 72,000 72,000Technology Document Cameras 72,590 72,590Technology Video Broadcast Upgrades 49,410 49,410Technology Imaging Equipment 190,000 102,500
7,185,000 3,300,000
FY13 Funded Projects in Priority Order
56
Composite Index of Local Ability to Pay
(Local Composite Index, or LCI)
The Local Composite Index determines a school division’s ability to pay education costs fundamental to the commonwealth’s Standards of Quality (SOQ). The state recalculates each division’s LCI every two years. The Composite Index is calculated using three indicators of a locality’s ability-to-pay:
True value of real property (weighted 50 percent) Adjusted gross income (weighted 40 percent) Taxable retail sales (weighted 10 percent)
The calculation of LCI for the 2012-2014 biennium is based on the true value of property in Hampton as of 2009. This value dropped by 1.1%, from $12.13B in 2007 to $11.99B in 2009. Out of 136 localities (comprising 132 school divisions), 45 divisions had no change or an increase in true value, while 91 had a decrease in true value. Of the ones that decreased, Hampton’s decrease was the 14th lowest in the state.
Our LCI for the 2012-2014 biennium is .2912, meaning that for every dollar of funding we receive, the state will provide 70.88 cents and the locality must provide 29.12 cents. For FY13, our LCI is 2.22% higher than in FY12, which cost us approximately $3M in state funding.
Each locality’s index is adjusted to maintain an overall statewide local share of 45 percent and an overall state share of 55 percent. The LCI will be recalculated for the 2014-2016 biennium (FY15, FY16).
57

HAMPTON CITY SCHOOLSTOTAL BUDGET SUMMARY FOR ALL FUNDS
OPERATING BUDGET
ACCOUNT FY12 FY13 FY12 FY13 FY12 FY13 FY12 FY13APPROVED APPROVED APPROVED APPROVED APPROVED APPROVED APPROVED APPROVED
REVENUE
Local Revenue 66,345,093$ 64,925,178$ 2,853,814$ 2,972,344$ -$ -$ 195,594$ 201,300$ State Revenue 95,648,941 103,140,836 221,000 128,000 807,582 971,937 - - State Sales Tax 20,371,423 20,202,942 - - - - - - Federal Revenue 1,320,516 1,800,000 5,975,419 6,946,030 19,499,867 13,874,887 - - Fund Balance 0 0 248,762 432,791 - - - - Transfers from Other Funds 0 0 - - - 287,000 287,000 Other Local Revenue 1,205,500 1,840,200 - 1,446,702 1,497,120 - -
Total Revenue 184,891,473$ 191,909,156$ 9,298,995$ 10,479,165$ 21,754,151$ 16,343,944$ 482,594$ 488,300$
EXPENDITURES
Personnel Services 115,246,402$ 117,237,286$ 2,940,239$ 2,885,458$ 10,404,157$ 6,330,489$ 107,586$ 115,816$ Fringe Benefits 39,000,854 43,948,770 612,756 643,360 3,468,052 2,109,952 8,230 - Contract Services 6,236,886 6,605,436 100,000 200,000 3,284,142 3,304,503 88,500 89,500 Internal Services - 13,797 - - - - - - Other Charges 8,941,721 8,260,499 10,000 50,000 985,243 986,000 27,000 27,000 Materials and Supplies 9,296,331 9,102,188 5,076,000 5,434,000 1,806,278 1,807,000 240,048 244,754 Payments to Other Agencies 1,064,474 1,072,654 - - 650,000 650,000 - - Capital 1,797,111 1,920,111 300,000 766,347 1,156,279 1,156,000 - - Contingencies 2,486,592 2,927,313 - - - 11,230 11,230 Fund Transfers 821,102 821,102 260,000 500,000
Total Expenditures 184,891,473$ 191,909,156$ 9,298,995$ 10,479,165$ 21,754,151$ 16,343,944$ 482,594$ 488,300$
FOOD SERVICES REIMBURSABLE PROJECTS STUDENT ACTIVITIES
58

OPERATING FUNDSUMMARY STATEMENT OF REVENUES, EXPENDITURES AND CHANGES IN FUND BALANCE
FY09 FY10 FY11 FY12 FY13 FY14^ FY15^ FY16^REVENUES Actual Actual Actual Actual Budget Projected Projected Projected State Funds 143,302,739$ 126,923,349$ 114,292,214$ 116,325,817$ 123,343,778$ 124,061,981$ 126,200,487$ 128,381,761$ Federal Funds 1,459,481 307,519 2,235,862 1,113,979 1,800,000 1,800,000 1,800,000 1,800,000 Other Funds 1,323,136 1,041,456 1,286,640 1,902,128 1,840,200 1,840,200 1,990,200 2,140,200 State Fiscal Stabilization Funds - 7,732,611 2,710,343 - - - - - Payments from City 69,216,564 68,051,707 67,051,476 66,345,093 64,925,178 65,307,140 65,960,212 66,619,814
Total Revenues 215,301,920 204,056,642 187,576,535 185,687,016 191,909,156 193,009,322 195,950,899 198,941,775
EXPENDITURES Instruction 156,512,377 146,156,099 134,930,406 133,834,157 143,927,043 143,583,799 145,772,102 147,997,079 Administration / Attendance & Health 10,424,055 9,483,747 8,960,123 9,020,669 9,393,452 9,366,045 9,508,789 9,653,926 Transportation 13,754,149 11,101,272 11,045,271 9,477,475 9,288,455 9,303,595 9,445,387 9,589,556 Operation & Maintenance 20,524,627 20,167,835 21,276,415 19,641,803 21,173,869 19,602,436 19,901,189 20,204,949 Subsidies to Other Funds 316,000 316,000 287,000 821,102 821,102 825,809 838,395 851,192 Technology 10,936,428 15,403,051 13,209,205 15,277,093 11,280,721 10,327,637 10,485,037 10,645,074
Total Expenditures 212,467,637 202,628,003 189,708,418 188,072,299 195,884,642 193,009,322 195,950,899 198,941,775
Excess of revenues over expenditures 2,834,283 1,428,639 (2,131,883) (2,385,282) (3,975,486) - - -
Fund Balance July 1 4,229,730 7,064,013 8,492,652 6,360,769 3,975,486 0 0 0
Fund Balance - June 30* 7,064,013$ 8,492,652$ 6,360,769$ 3,975,486$ 0$ 0$ 0$ 0$
*Fund balance reverts to the City of Hampton at June 30. Fund balance for the Operating Fund represents undelivered orders/commitments.
^Assumptions for Projected Years: -2% revenue growth in per pupil funded line items beginning with FY14, and more students each fiscal year. Does not include any new or additional programs or services. -Expenditures are assumed to be distributed in the same proportions as FY13. -Fund balances represent vendor and school obligations that are encumbered as of June 30. -The projected years are not provided for budget planning purposes and represent only an estimate for future outlook. -The projected years are for informational purposes only and not for budget formation.
59
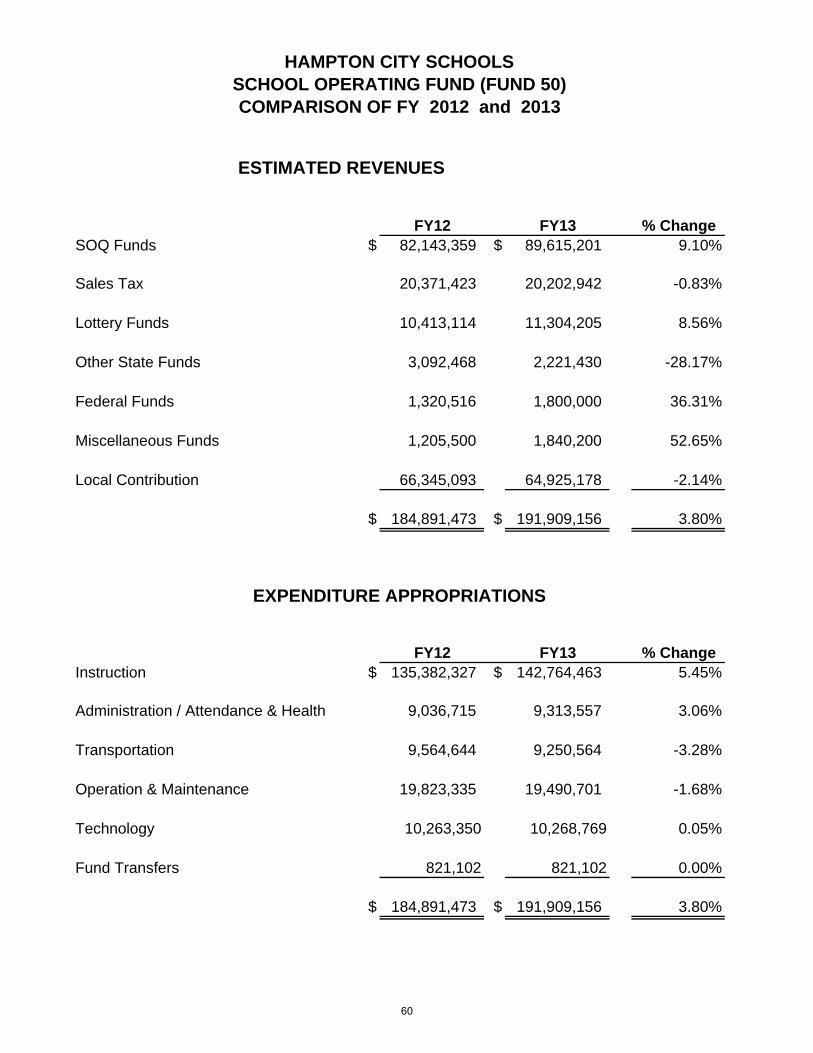
FY12 FY13 % ChangeSOQ Funds $ 82,143,359 $ 89,615,201 9.10%
Sales Tax 20,371,423 20,202,942 -0.83%
Lottery Funds 10,413,114 11,304,205 8.56%
Other State Funds 3,092,468 2,221,430 -28.17%
Federal Funds 1,320,516 1,800,000 36.31%
Miscellaneous Funds 1,205,500 1,840,200 52.65%
Local Contribution 66,345,093 64,925,178 -2.14%
$ 184,891,473 $ 191,909,156 3.80%
FY12 FY13 % ChangeInstruction $ 135,382,327 $ 142,764,463 5.45%
Administration / Attendance & Health 9,036,715 9,313,557 3.06%
Transportation 9,564,644 9,250,564 -3.28%
Operation & Maintenance 19,823,335 19,490,701 -1.68%
Technology 10,263,350 10,268,769 0.05%
Fund Transfers 821,102 821,102 0.00%
$ 184,891,473 $ 191,909,156 3.80%
HAMPTON CITY SCHOOLS
ESTIMATED REVENUES
EXPENDITURE APPROPRIATIONS
SCHOOL OPERATING FUND (FUND 50)COMPARISON OF FY 2012 and 2013
60
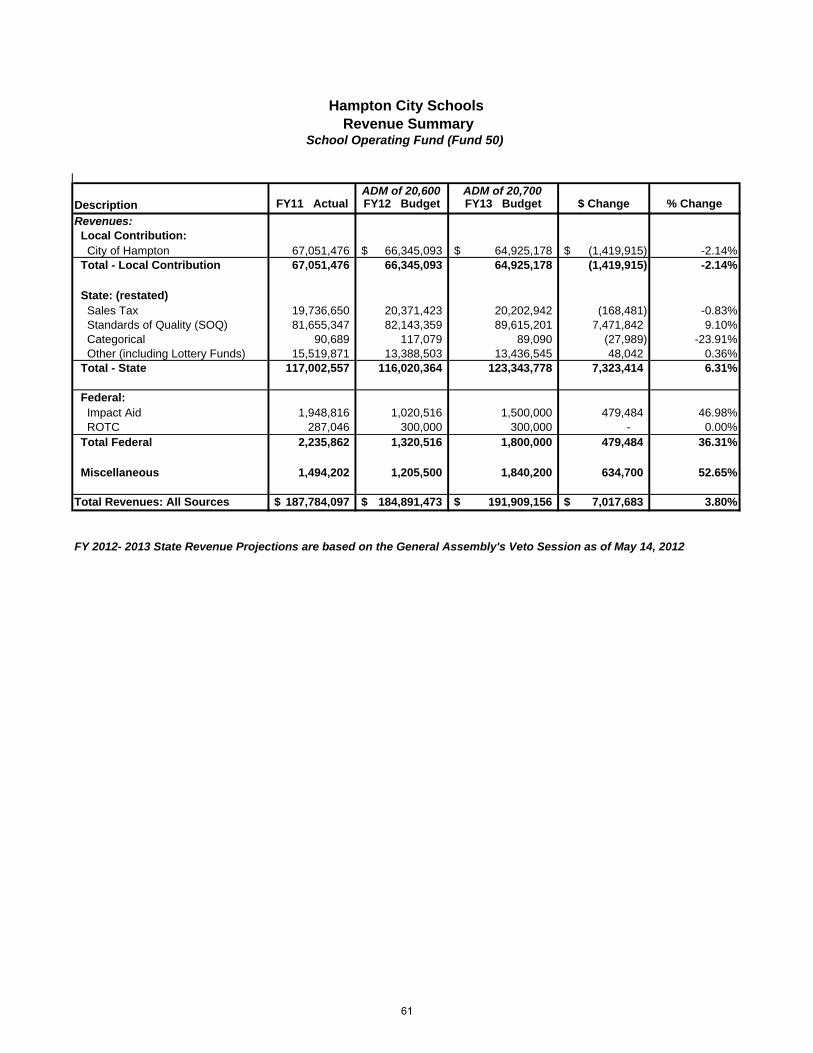
ADM of 20,600 ADM of 20,700Description FY11 Actual FY12 Budget FY13 Budget $ Change % Change
Revenues: Local Contribution: City of Hampton 67,051,476 66,345,093$ 64,925,178$ (1,419,915)$ -2.14% Total - Local Contribution 67,051,476 66,345,093 64,925,178 (1,419,915) -2.14%
State: (restated) Sales Tax 19,736,650 20,371,423 20,202,942 (168,481) -0.83% Standards of Quality (SOQ) 81,655,347 82,143,359 89,615,201 7,471,842 9.10% Categorical 90,689 117,079 89,090 (27,989) -23.91% Other (including Lottery Funds) 15,519,871 13,388,503 13,436,545 48,042 0.36% Total - State 117,002,557 116,020,364 123,343,778 7,323,414 6.31%
Federal: Impact Aid 1,948,816 1,020,516 1,500,000 479,484 46.98% ROTC 287,046 300,000 300,000 - 0.00% Total Federal 2,235,862 1,320,516 1,800,000 479,484 36.31%
Miscellaneous 1,494,202 1,205,500 1,840,200 634,700 52.65%
Total Revenues: All Sources 187,784,097$ 184,891,473$ 191,909,156$ 7,017,683$ 3.80%
Revenue SummaryHampton City Schools
School Operating Fund (Fund 50)
FY 2012- 2013 State Revenue Projections are based on the General Assembly's Veto Session as of May 14, 2012
61
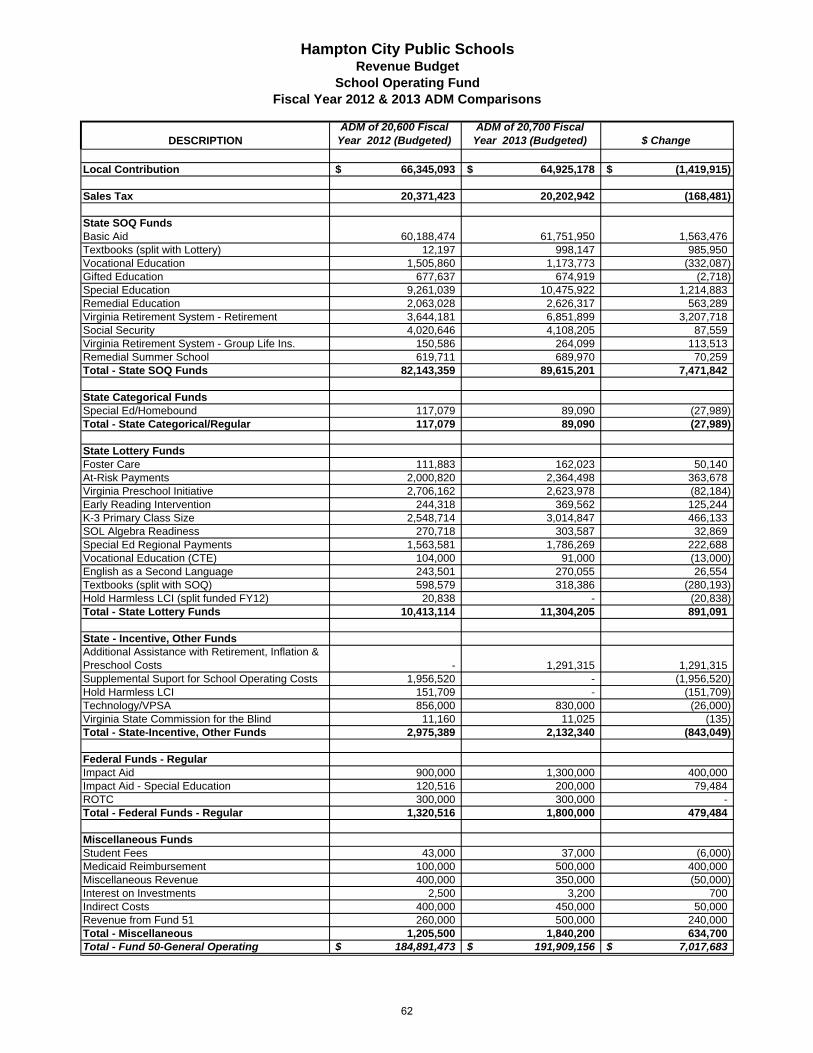
DESCRIPTIONADM of 20,600 Fiscal
Year 2012 (Budgeted)ADM of 20,700 Fiscal
Year 2013 (Budgeted) $ Change
Local Contribution 66,345,093$ 64,925,178$ (1,419,915)$
Sales Tax 20,371,423 20,202,942 (168,481)
State SOQ FundsBasic Aid 60,188,474 61,751,950 1,563,476Textbooks (split with Lottery) 12,197 998,147 985,950Vocational Education 1,505,860 1,173,773 (332,087)Gifted Education 677,637 674,919 (2,718)Special Education 9,261,039 10,475,922 1,214,883Remedial Education 2,063,028 2,626,317 563,289Virginia Retirement System - Retirement 3,644,181 6,851,899 3,207,718Social Security 4,020,646 4,108,205 87,559Virginia Retirement System - Group Life Ins. 150,586 264,099 113,513Remedial Summer School 619,711 689,970 70,259Total - State SOQ Funds 82,143,359 89,615,201 7,471,842
State Categorical FundsSpecial Ed/Homebound 117,079 89,090 (27,989)Total - State Categorical/Regular 117,079 89,090 (27,989)
State Lottery FundsFoster Care 111,883 162,023 50,140At-Risk Payments 2,000,820 2,364,498 363,678Virginia Preschool Initiative 2,706,162 2,623,978 (82,184)Early Reading Intervention 244,318 369,562 125,244K-3 Primary Class Size 2,548,714 3,014,847 466,133SOL Algebra Readiness 270,718 303,587 32,869Special Ed Regional Payments 1,563,581 1,786,269 222,688Vocational Education (CTE) 104,000 91,000 (13,000)English as a Second Language 243,501 270,055 26,554Textbooks (split with SOQ) 598,579 318,386 (280,193)Hold Harmless LCI (split funded FY12) 20,838 - (20,838)Total - State Lottery Funds 10,413,114 11,304,205 891,091
State - Incentive, Other FundsAdditional Assistance with Retirement, Inflation & Preschool Costs - 1,291,315 1,291,315Supplemental Suport for School Operating Costs 1,956,520 - (1,956,520)Hold Harmless LCI 151,709 - (151,709)Technology/VPSA 856,000 830,000 (26,000)Virginia State Commission for the Blind 11,160 11,025 (135)Total - State-Incentive, Other Funds 2,975,389 2,132,340 (843,049)
Federal Funds - RegularImpact Aid 900,000 1,300,000 400,000Impact Aid - Special Education 120,516 200,000 79,484ROTC 300,000 300,000 - Total - Federal Funds - Regular 1,320,516 1,800,000 479,484
Miscellaneous FundsStudent Fees 43,000 37,000 (6,000)Medicaid Reimbursement 100,000 500,000 400,000Miscellaneous Revenue 400,000 350,000 (50,000)Interest on Investments 2,500 3,200 700Indirect Costs 400,000 450,000 50,000Revenue from Fund 51 260,000 500,000 240,000Total - Miscellaneous 1,205,500 1,840,200 634,700Total - Fund 50-General Operating 184,891,473$ 191,909,156$ 7,017,683$
Hampton City Public SchoolsRevenue Budget
School Operating FundFiscal Year 2012 & 2013 ADM Comparisons
62
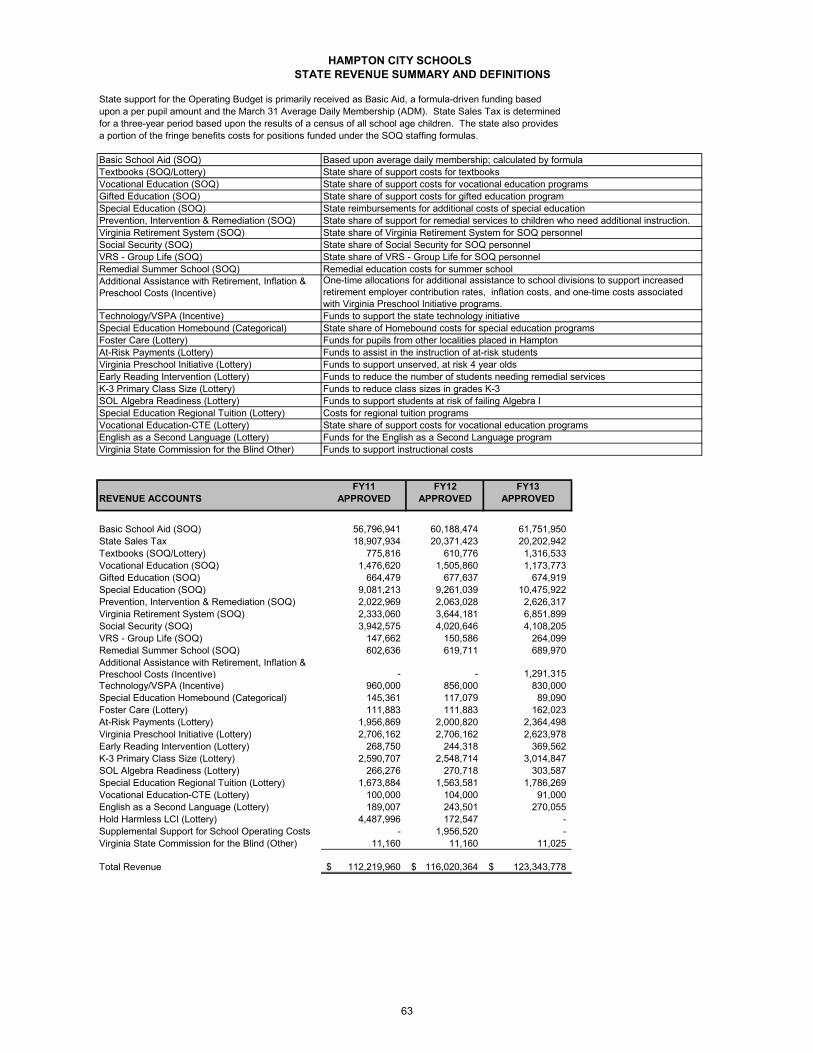
State support for the Operating Budget is primarily received as Basic Aid, a formula-driven funding basedupon a per pupil amount and the March 31 Average Daily Membership (ADM). State Sales Tax is determinedfor a three-year period based upon the results of a census of all school age children. The state also providesa portion of the fringe benefits costs for positions funded under the SOQ staffing formulas.
Basic School Aid (SOQ) Based upon average daily membership; calculated by formulaTextbooks (SOQ/Lottery) State share of support costs for textbooksVocational Education (SOQ) State share of support costs for vocational education programsGifted Education (SOQ) State share of support costs for gifted education programSpecial Education (SOQ) State reimbursements for additional costs of special educationPrevention, Intervention & Remediation (SOQ) State share of support for remedial services to children who need additional instruction.Virginia Retirement System (SOQ)Social Security (SOQ) State share of Social Security for SOQ personnelVRS - Group Life (SOQ) State share of VRS - Group Life for SOQ personnelRemedial Summer School (SOQ) Remedial education costs for summer schoolAdditional Assistance with Retirement, Inflation & Preschool Costs (Incentive)
Technology/VSPA (Incentive) Funds to support the state technology initiativeSpecial Education Homebound (Categorical) State share of Homebound costs for special education programsFoster Care (Lottery) Funds for pupils from other localities placed in HamptonAt-Risk Payments (Lottery) Funds to assist in the instruction of at-risk studentsVirginia Preschool Initiative (Lottery) Funds to support unserved, at risk 4 year oldsEarly Reading Intervention (Lottery) Funds to reduce the number of students needing remedial servicesK-3 Primary Class Size (Lottery) Funds to reduce class sizes in grades K-3SOL Algebra Readiness (Lottery) Funds to support students at risk of failing Algebra ISpecial Education Regional Tuition (Lottery) Costs for regional tuition programsVocational Education-CTE (Lottery) State share of support costs for vocational education programsEnglish as a Second Language (Lottery) Funds for the English as a Second Language programVirginia State Commission for the Blind Other) Funds to support instructional costs
FY11 FY12 FY13REVENUE ACCOUNTS APPROVED APPROVED APPROVED
Basic School Aid (SOQ) 56,796,941 60,188,474 61,751,950State Sales Tax 18,907,934 20,371,423 20,202,942Textbooks (SOQ/Lottery) 775,816 610,776 1,316,533Vocational Education (SOQ) 1,476,620 1,505,860 1,173,773Gifted Education (SOQ) 664,479 677,637 674,919Special Education (SOQ) 9,081,213 9,261,039 10,475,922Prevention, Intervention & Remediation (SOQ) 2,022,969 2,063,028 2,626,317Virginia Retirement System (SOQ) 2,333,060 3,644,181 6,851,899Social Security (SOQ) 3,942,575 4,020,646 4,108,205VRS - Group Life (SOQ) 147,662 150,586 264,099Remedial Summer School (SOQ) 602,636 619,711 689,970Additional Assistance with Retirement, Inflation & Preschool Costs (Incentive) - - 1,291,315Technology/VSPA (Incentive) 960,000 856,000 830,000Special Education Homebound (Categorical) 145,361 117,079 89,090Foster Care (Lottery) 111,883 111,883 162,023At-Risk Payments (Lottery) 1,956,869 2,000,820 2,364,498Virginia Preschool Initiative (Lottery) 2,706,162 2,706,162 2,623,978Early Reading Intervention (Lottery) 268,750 244,318 369,562K-3 Primary Class Size (Lottery) 2,590,707 2,548,714 3,014,847SOL Algebra Readiness (Lottery) 266,276 270,718 303,587Special Education Regional Tuition (Lottery) 1,673,884 1,563,581 1,786,269Vocational Education-CTE (Lottery) 100,000 104,000 91,000English as a Second Language (Lottery) 189,007 243,501 270,055Hold Harmless LCI (Lottery) 4,487,996 172,547 - Supplemental Support for School Operating Costs - 1,956,520 - Virginia State Commission for the Blind (Other) 11,160 11,160 11,025
Total Revenue 112,219,960$ 116,020,364$ 123,343,778$
HAMPTON CITY SCHOOLSSTATE REVENUE SUMMARY AND DEFINITIONS
One-time allocations for additional assistance to school divisions to support increased retirement employer contribution rates, inflation costs, and one-time costs associated with Virginia Preschool Initiative programs.
State share of Virginia Retirement System for SOQ personnel
63
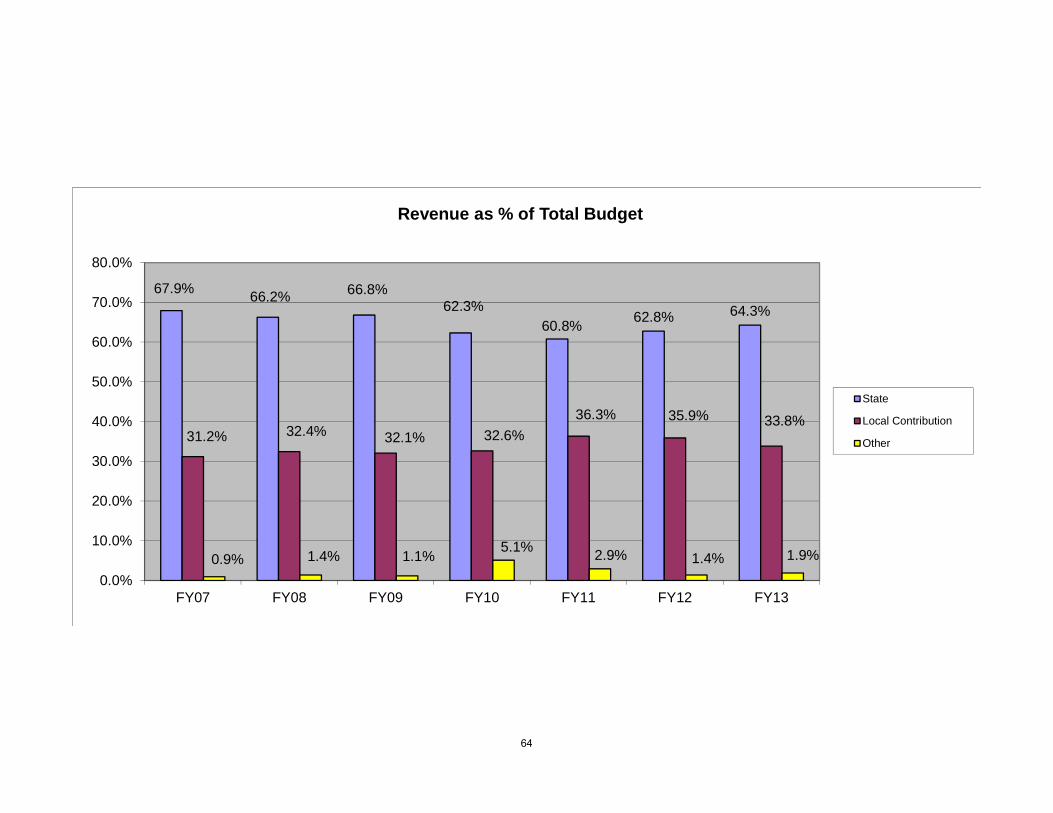
67.9%66.2% 66.8%
62.3%60.8%
62.8% 64.3%
31.2% 32.4% 32.1% 32.6%
36.3% 35.9% 33.8%
0.9% 1.4% 1.1%5.1%
2.9% 1.4% 1.9%
0.0%
10.0%
20.0%
30.0%
40.0%
50.0%
60.0%
70.0%
80.0%
FY07 FY08 FY09 FY10 FY11 FY12 FY13
Revenue as % of Total Budget
State
Local Contribution
Other
64
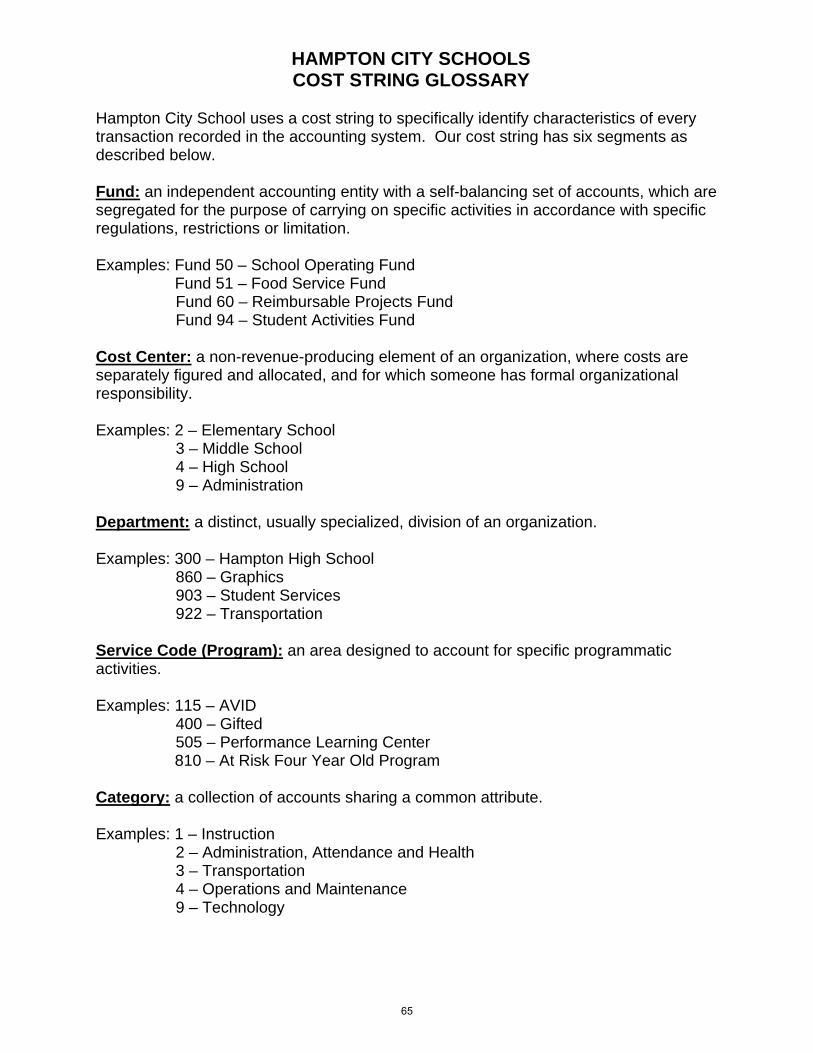
HAMPTON CITY SCHOOLS COST STRING GLOSSARY
Hampton City School uses a cost string to specifically identify characteristics of every transaction recorded in the accounting system. Our cost string has six segments as described below. Fund: an independent accounting entity with a self-balancing set of accounts, which are segregated for the purpose of carrying on specific activities in accordance with specific regulations, restrictions or limitation. Examples: Fund 50 – School Operating Fund Fund 51 – Food Service Fund Fund 60 – Reimbursable Projects Fund Fund 94 – Student Activities Fund Cost Center: a non-revenue-producing element of an organization, where costs are separately figured and allocated, and for which someone has formal organizational responsibility. Examples: 2 – Elementary School 3 – Middle School 4 – High School 9 – Administration Department: a distinct, usually specialized, division of an organization. Examples: 300 – Hampton High School 860 – Graphics 903 – Student Services 922 – Transportation Service Code (Program): an area designed to account for specific programmatic activities. Examples: 115 – AVID 400 – Gifted 505 – Performance Learning Center 810 – At Risk Four Year Old Program Category: a collection of accounts sharing a common attribute. Examples: 1 – Instruction 2 – Administration, Attendance and Health 3 – Transportation 4 – Operations and Maintenance 9 – Technology
65

HAMPTON CITY SCHOOLS COST STRING GLOSSARY
Account (Object Code): describes the type of revenue or expense being recorded. Examples: 1121 – Compensation of Teachers 2300 – Health Insurance Subsidy 3145 – Professional Services 6013 – Instructional Supplies
66

Expenditures By Category and ClassificationFY 2011/12 - FY 2012/13
Instruction Administration Transportation Operations Fund Transfers Technology Total % of Budget
Salaries $92,927,849 $6,116,371 $5,157,643 $6,820,180 $4,224,359 $115,246,402 62.33%Fringe Benefits 31,351,394 1,894,195 1,843,239 2,519,352 1,392,674 39,000,854 21.09%Contract Services 3,029,345 673,528 25,000 1,907,904 601,109 6,236,886 3.37%Other Charges 321,498 102,529 140,700 7,085,034 1,291,960 8,941,721 4.84%Materials & Supplies 3,888,620 243,794 2,281,119 1,287,962 1,594,836 9,296,331 5.03%Payments to Other Agencies 1,064,474 0 0 0 0 1,064,474 0.58%Capital 349,498 6,298 80,000 202,903 1,158,412 1,797,111 0.97%Contingencies 2,449,649 0 36,943 0 2,486,592 1.34%Fund Transfers 0 0 821,102 821,102 0.44%
Total $135,382,327 $9,036,715 $9,564,644 $19,823,335 $821,102 $10,263,350 $184,891,473 100.00%
Instruction Administration Transportation Operations Fund Transfers Technology Total % of Budget
Salaries $94,805,275 $6,282,276 $4,987,577 $6,969,735 $4,192,423 $117,237,286 61.09%Fringe Benefits 36,114,312 2,127,483 1,726,080 2,454,595 1,526,300 43,948,770 22.90%Contract Services 3,200,098 592,216 25,000 2,186,954 601,168 6,605,436 3.44%Internal Services 13,797 0 0 0 0 13,797 0.01%Other Charges 335,881 107,391 140,700 6,384,931 1,291,596 8,260,499 4.30%Materials & Supplies 3,934,726 197,893 2,281,207 1,226,583 1,461,779 9,102,188 4.74%Payments to Other Agencies 1,072,654 0 0 0 0 1,072,654 0.56%Capital 370,407 6,298 80,000 267,903 1,195,503 1,920,111 1.00%Contingencies 2,917,313 0 10,000 0 2,927,313 1.53%Fund Transfers 0 0 821,102 821,102 0.43%
Total $142,764,463 $9,313,557 $9,250,564 $19,490,701 $821,102 $10,268,769 $191,909,156 100.00%
FY 12 Budget
FY 13 Budget
67
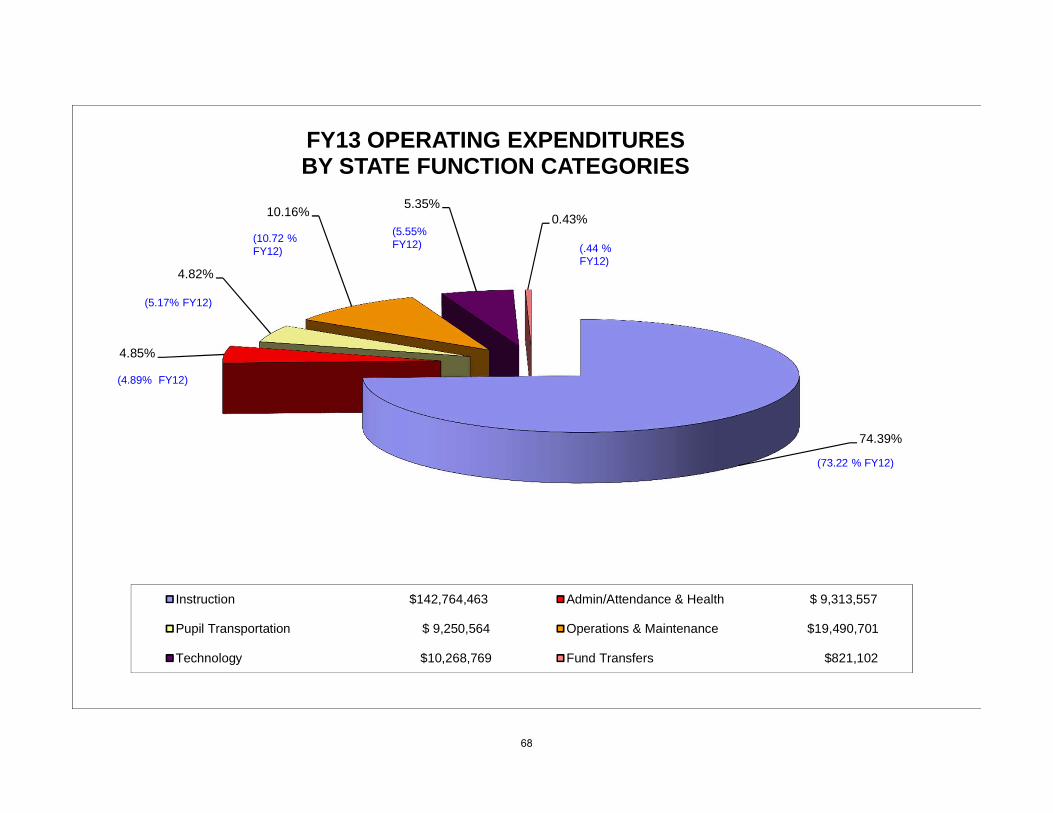
74.39%
4.85%
4.82%
10.16%5.35%
0.43%
FY13 OPERATING EXPENDITURESBY STATE FUNCTION CATEGORIES
Instruction $142,764,463 Admin/Attendance & Health $ 9,313,557
Pupil Transportation $ 9,250,564 Operations & Maintenance $19,490,701
Technology $10,268,769 Fund Transfers $821,102
(73.22 % FY12)
(4.89% FY12)
(5.17% FY12)
(10.72 % FY12) (.44 %
FY12)
(5.55% FY12)
68
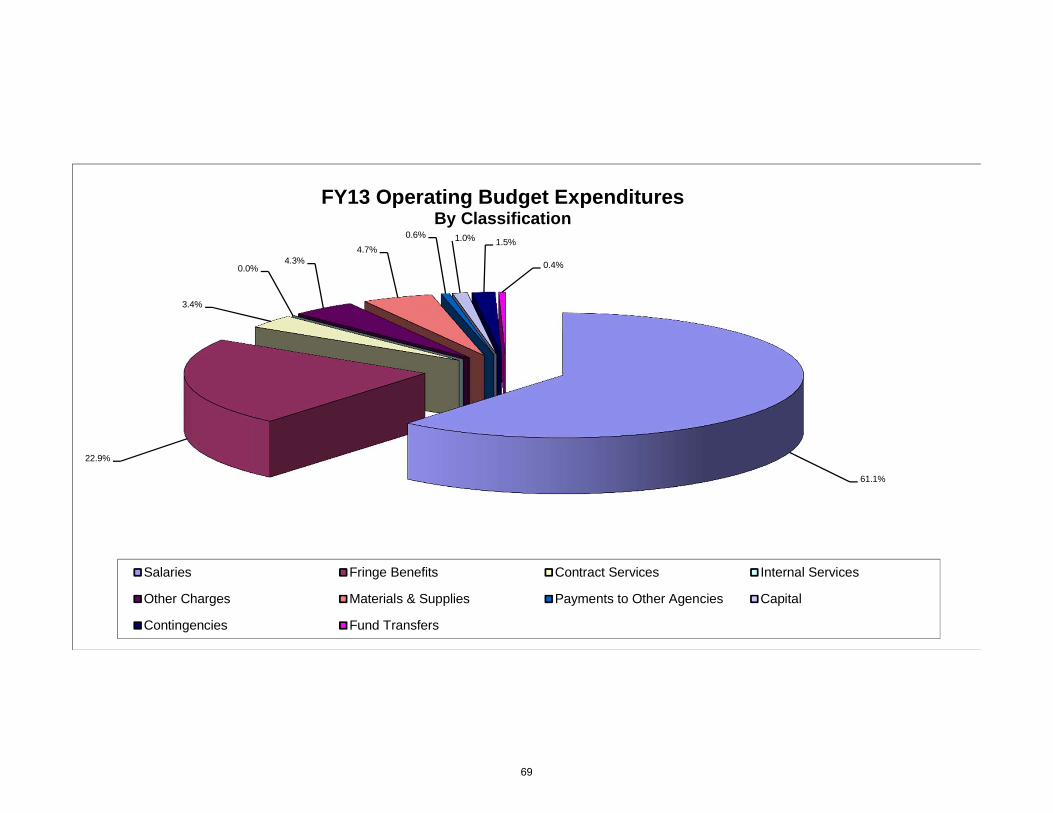
61.1%
22.9%
3.4%
0.0%4.3%
4.7%
0.6% 1.0% 1.5%
0.4%
FY13 Operating Budget ExpendituresBy Classification
Salaries Fringe Benefits Contract Services Internal Services
Other Charges Materials & Supplies Payments to Other Agencies Capital
Contingencies Fund Transfers
69
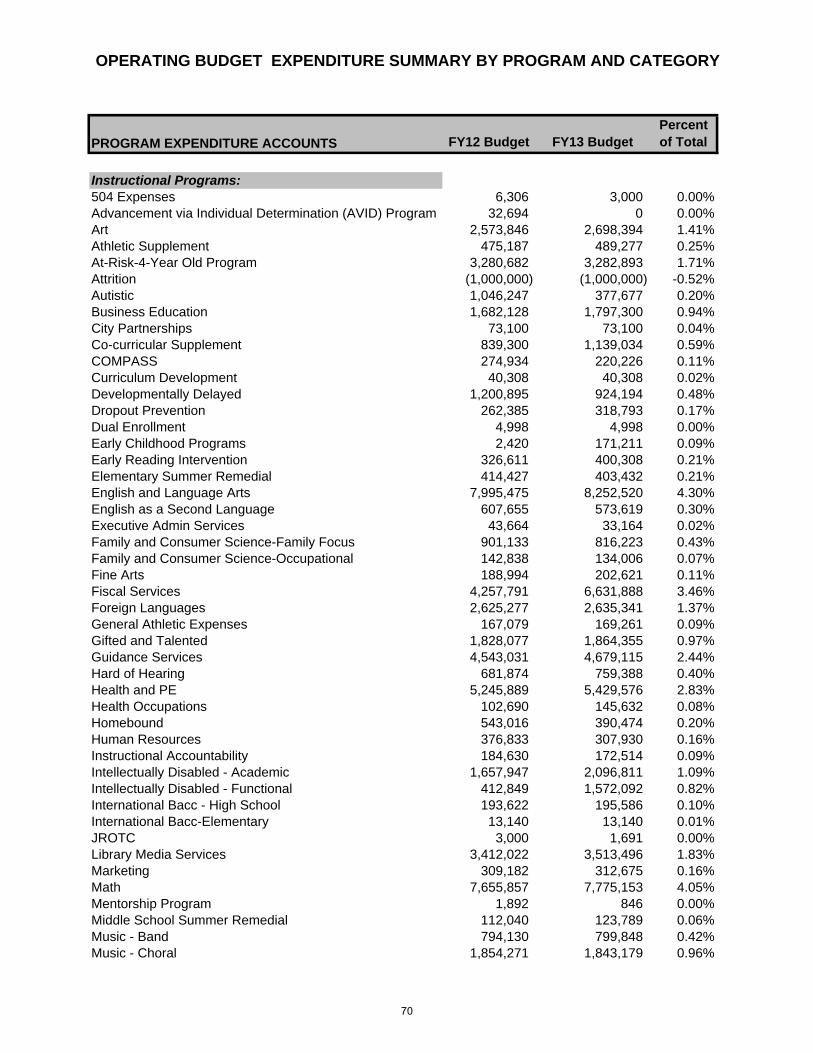
OPERATING BUDGET EXPENDITURE SUMMARY BY PROGRAM AND CATEGORY
PROGRAM EXPENDITURE ACCOUNTS FY12 Budget FY13 BudgetPercent of Total
Instructional Programs:504 Expenses 6,306 3,000 0.00%Advancement via Individual Determination (AVID) Program 32,694 0 0.00%Art 2,573,846 2,698,394 1.41%Athletic Supplement 475,187 489,277 0.25%At-Risk-4-Year Old Program 3,280,682 3,282,893 1.71%Attrition (1,000,000) (1,000,000) -0.52%Autistic 1,046,247 377,677 0.20%Business Education 1,682,128 1,797,300 0.94%City Partnerships 73,100 73,100 0.04%Co-curricular Supplement 839,300 1,139,034 0.59%COMPASS 274,934 220,226 0.11%Curriculum Development 40,308 40,308 0.02%Developmentally Delayed 1,200,895 924,194 0.48%Dropout Prevention 262,385 318,793 0.17%Dual Enrollment 4,998 4,998 0.00%Early Childhood Programs 2,420 171,211 0.09%Early Reading Intervention 326,611 400,308 0.21%Elementary Summer Remedial 414,427 403,432 0.21%English and Language Arts 7,995,475 8,252,520 4.30%English as a Second Language 607,655 573,619 0.30%Executive Admin Services 43,664 33,164 0.02%Family and Consumer Science-Family Focus 901,133 816,223 0.43%Family and Consumer Science-Occupational 142,838 134,006 0.07%Fine Arts 188,994 202,621 0.11%Fiscal Services 4,257,791 6,631,888 3.46%Foreign Languages 2,625,277 2,635,341 1.37%General Athletic Expenses 167,079 169,261 0.09%Gifted and Talented 1,828,077 1,864,355 0.97%Guidance Services 4,543,031 4,679,115 2.44%Hard of Hearing 681,874 759,388 0.40%Health and PE 5,245,889 5,429,576 2.83%Health Occupations 102,690 145,632 0.08%Homebound 543,016 390,474 0.20%Human Resources 376,833 307,930 0.16%Instructional Accountability 184,630 172,514 0.09%Intellectually Disabled - Academic 1,657,947 2,096,811 1.09%Intellectually Disabled - Functional 412,849 1,572,092 0.82%International Bacc - High School 193,622 195,586 0.10%International Bacc-Elementary 13,140 13,140 0.01%JROTC 3,000 1,691 0.00%Library Media Services 3,412,022 3,513,496 1.83%Marketing 309,182 312,675 0.16%Math 7,655,857 7,775,153 4.05%Mentorship Program 1,892 846 0.00%Middle School Summer Remedial 112,040 123,789 0.06%Music - Band 794,130 799,848 0.42%Music - Choral 1,854,271 1,843,179 0.96%
70

OPERATING BUDGET EXPENDITURE SUMMARY BY PROGRAM AND CATEGORY
PROGRAM EXPENDITURE ACCOUNTS FY12 Budget FY13 BudgetPercent of Total
NBCT Supplement 0 204,535 0.11%O&M-Building Services 27,388 27,388 0.01%Orthopedically Impaired 29,822 25,775 0.01%Other Health Impaired 67,908 80,058 0.04%Other Programs 219,652 279,045 0.15%Performance Learning Center 447,194 453,235 0.24%Public Information Services 0 0 0.00%Reading 2,018,734 1,921,852 1.00%Regular Programs 40,593,080 41,477,682 21.61%Reserve for Fall Membership Adj 803,922 807,688 0.42%Safe Schools 5,348 5,500 0.00%School Food Services 0 256,565 0.13%School Social Work 832,297 863,586 0.45%Science 5,564,712 5,987,187 3.12%Seriously Emotionally Disturbed 1,146,870 275,020 0.14%Severely and Prof Handicapped 329,618 425,973 0.22%Social Sciences 5,972,332 6,384,080 3.33%SOL Algebra Readiness 385,208 433,710 0.23%SOL Remediation Elementary 153,490 161,082 0.08%SOL Remediation Secondary 157,587 149,995 0.08%Special - General Curriculum 8,667,064 14,085,417 7.34%Specific Learning Disability 4,845,997 381,257 0.20%Speech or Language Impaired 1,332,853 1,408,724 0.73%Student Services 329,774 343,978 0.18%Substitute Personnel 2,033,220 1,978,443 1.03%Summer Programs 26,809 64,048 0.03%Trade and Industrial 168,252 170,549 0.09%Truancy 2,261 3,000 0.00%Visually Handicapped 199,830 168,566 0.09%Vocational Programs 1,150,134 1,150,448 0.60%Unassigned (521,395) 0 0.00%TOTAL INSTRUCTION 135,382,327 142,764,463 74.39%
Administration, Attendance & Health Programs:Board Services 136,852 136,848 0.07%Elementary Summer Remedial 0 10,092 0.01%Executive Admin Services 1,049,409 1,083,941 0.56%Fiscal Services 1,230,728 1,188,334 0.62%Health Services 2,027,210 2,091,196 1.09%Human Resources 990,831 986,111 0.51%Instructional Accountability 353,015 358,219 0.19%Middle School Summer Remedial 0 3,310 0.00%Other Programs 0 28,561 0.01%Psychological Services 1,062,660 1,050,638 0.55%Public Information Services 456,866 463,210 0.24%Regular Programs 447,647 730,571 0.38%Reprographics 576,402 543,934 0.28%Science 4,542 4,542 0.00%Special - General Curriculum 591,835 628,951 0.33%
71
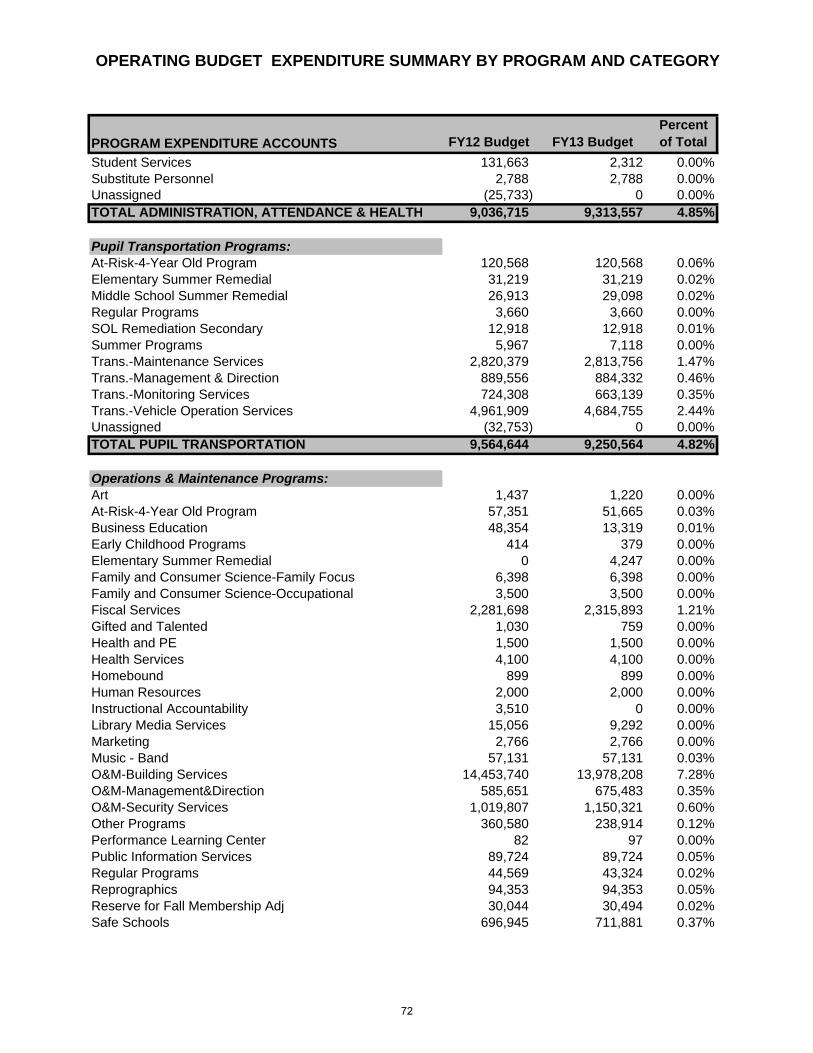
OPERATING BUDGET EXPENDITURE SUMMARY BY PROGRAM AND CATEGORY
PROGRAM EXPENDITURE ACCOUNTS FY12 Budget FY13 BudgetPercent of Total
Student Services 131,663 2,312 0.00%Substitute Personnel 2,788 2,788 0.00%Unassigned (25,733) 0 0.00%TOTAL ADMINISTRATION, ATTENDANCE & HEALTH 9,036,715 9,313,557 4.85%
Pupil Transportation Programs:At-Risk-4-Year Old Program 120,568 120,568 0.06%Elementary Summer Remedial 31,219 31,219 0.02%Middle School Summer Remedial 26,913 29,098 0.02%Regular Programs 3,660 3,660 0.00%SOL Remediation Secondary 12,918 12,918 0.01%Summer Programs 5,967 7,118 0.00%Trans.-Maintenance Services 2,820,379 2,813,756 1.47%Trans.-Management & Direction 889,556 884,332 0.46%Trans.-Monitoring Services 724,308 663,139 0.35%Trans.-Vehicle Operation Services 4,961,909 4,684,755 2.44%Unassigned (32,753) 0 0.00%TOTAL PUPIL TRANSPORTATION 9,564,644 9,250,564 4.82%
Operations & Maintenance Programs:Art 1,437 1,220 0.00%At-Risk-4-Year Old Program 57,351 51,665 0.03%Business Education 48,354 13,319 0.01%Early Childhood Programs 414 379 0.00%Elementary Summer Remedial 0 4,247 0.00%Family and Consumer Science-Family Focus 6,398 6,398 0.00%Family and Consumer Science-Occupational 3,500 3,500 0.00%Fiscal Services 2,281,698 2,315,893 1.21%Gifted and Talented 1,030 759 0.00%Health and PE 1,500 1,500 0.00%Health Services 4,100 4,100 0.00%Homebound 899 899 0.00%Human Resources 2,000 2,000 0.00%Instructional Accountability 3,510 0 0.00%Library Media Services 15,056 9,292 0.00%Marketing 2,766 2,766 0.00%Music - Band 57,131 57,131 0.03%O&M-Building Services 14,453,740 13,978,208 7.28%O&M-Management&Direction 585,651 675,483 0.35%O&M-Security Services 1,019,807 1,150,321 0.60%Other Programs 360,580 238,914 0.12%Performance Learning Center 82 97 0.00%Public Information Services 89,724 89,724 0.05%Regular Programs 44,569 43,324 0.02%Reprographics 94,353 94,353 0.05%Reserve for Fall Membership Adj 30,044 30,494 0.02%Safe Schools 696,945 711,881 0.37%
72
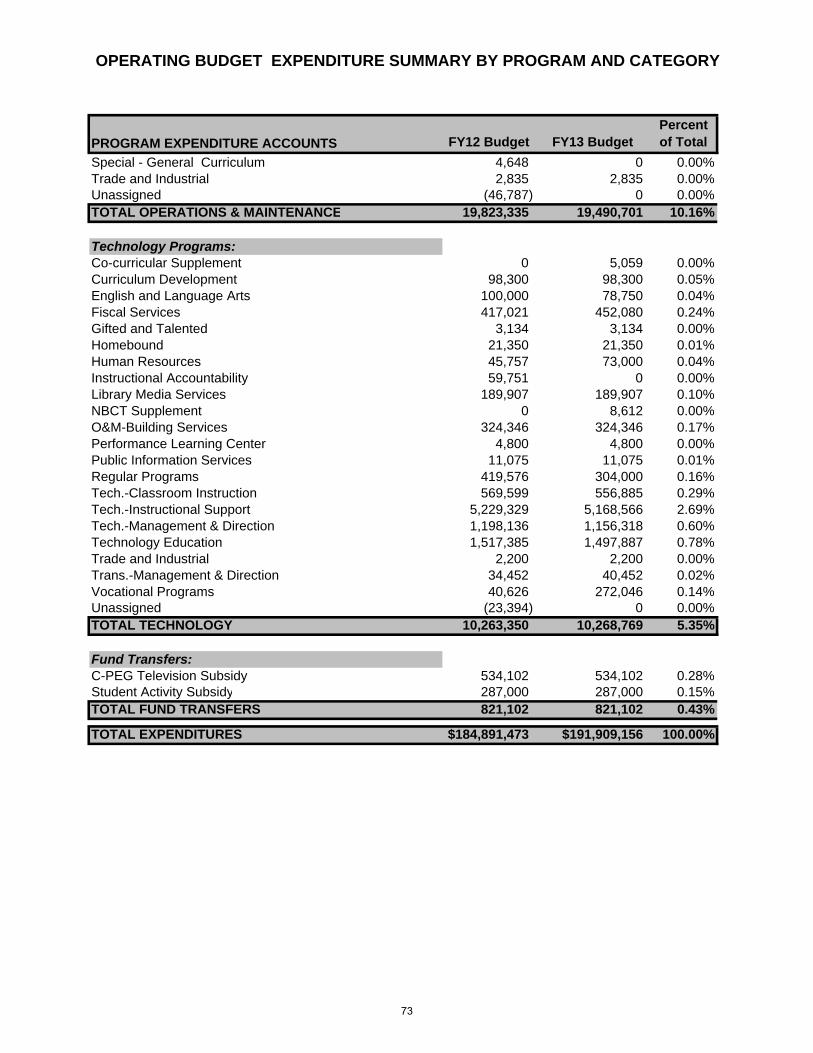
OPERATING BUDGET EXPENDITURE SUMMARY BY PROGRAM AND CATEGORY
PROGRAM EXPENDITURE ACCOUNTS FY12 Budget FY13 BudgetPercent of Total
Special - General Curriculum 4,648 0 0.00%Trade and Industrial 2,835 2,835 0.00%Unassigned (46,787) 0 0.00%TOTAL OPERATIONS & MAINTENANCE 19,823,335 19,490,701 10.16%
Technology Programs:Co-curricular Supplement 0 5,059 0.00%Curriculum Development 98,300 98,300 0.05%English and Language Arts 100,000 78,750 0.04%Fiscal Services 417,021 452,080 0.24%Gifted and Talented 3,134 3,134 0.00%Homebound 21,350 21,350 0.01%Human Resources 45,757 73,000 0.04%Instructional Accountability 59,751 0 0.00%Library Media Services 189,907 189,907 0.10%NBCT Supplement 0 8,612 0.00%O&M-Building Services 324,346 324,346 0.17%Performance Learning Center 4,800 4,800 0.00%Public Information Services 11,075 11,075 0.01%Regular Programs 419,576 304,000 0.16%Tech.-Classroom Instruction 569,599 556,885 0.29%Tech.-Instructional Support 5,229,329 5,168,566 2.69%Tech.-Management & Direction 1,198,136 1,156,318 0.60%Technology Education 1,517,385 1,497,887 0.78%Trade and Industrial 2,200 2,200 0.00%Trans.-Management & Direction 34,452 40,452 0.02%Vocational Programs 40,626 272,046 0.14%Unassigned (23,394) 0 0.00%TOTAL TECHNOLOGY 10,263,350 10,268,769 5.35%
Fund Transfers:C-PEG Television Subsidy 534,102 534,102 0.28%Student Activity Subsidy 287,000 287,000 0.15%TOTAL FUND TRANSFERS 821,102 821,102 0.43%
TOTAL EXPENDITURES $184,891,473 $191,909,156 100.00%
73
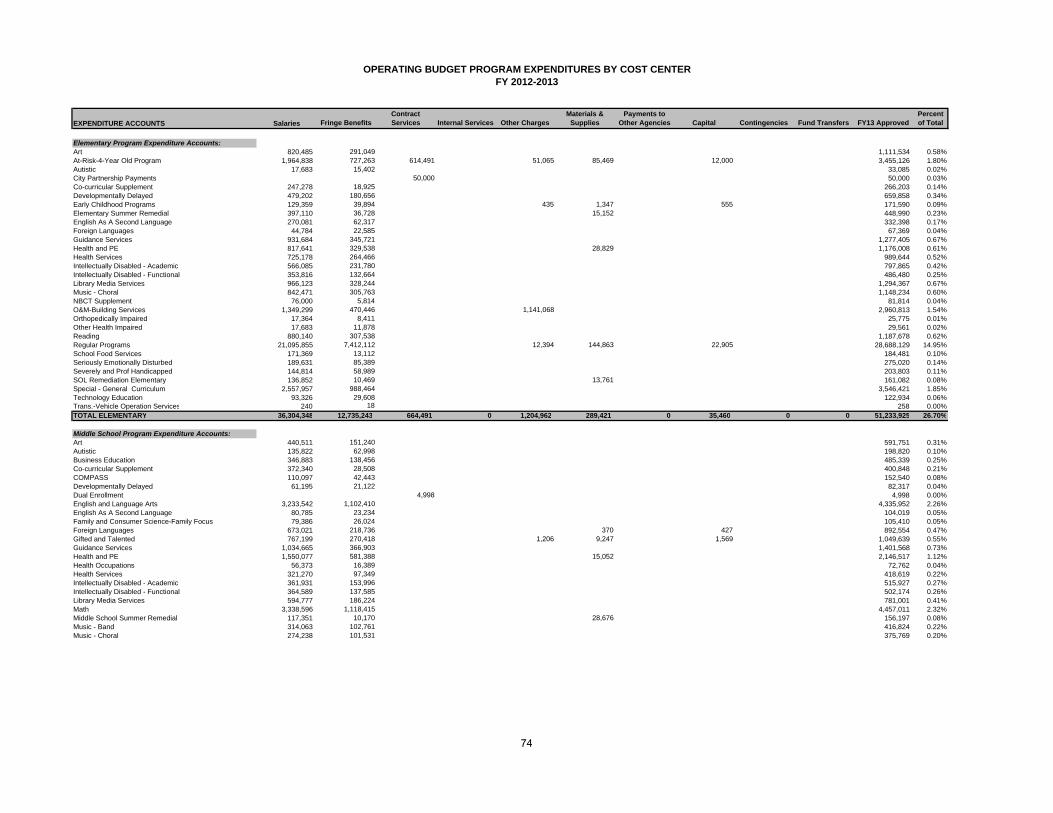
OPERATING BUDGET PROGRAM EXPENDITURES BY COST CENTERFY 2012-2013
EXPENDITURE ACCOUNTS Salaries Fringe BenefitsContract Services Internal Services Other Charges
Materials & Supplies
Payments to Other Agencies Capital Contingencies Fund Transfers FY13 Approved
Percent of Total
Elementary Program Expenditure Accounts:Art 820,485 291,049 1,111,534 0.58%At-Risk-4-Year Old Program 1,964,838 727,263 614,491 51,065 85,469 12,000 3,455,126 1.80%Autistic 17,683 15,402 33,085 0.02%City Partnership Payments 50,000 50,000 0.03%Co-curricular Supplement 247,278 18,925 266,203 0.14%Developmentally Delayed 479,202 180,656 659,858 0.34%Early Childhood Programs 129,359 39,894 435 1,347 555 171,590 0.09%Elementary Summer Remedial 397,110 36,728 15,152 448,990 0.23%English As A Second Language 270,081 62,317 332,398 0.17%Foreign Languages 44,784 22,585 67,369 0.04%Guidance Services 931,684 345,721 1,277,405 0.67%Health and PE 817,641 329,538 28,829 1,176,008 0.61%Health Services 725,178 264,466 989,644 0.52%Intellectually Disabled - Academic 566,085 231,780 797,865 0.42%Intellectually Disabled - Functional 353,816 132,664 486,480 0.25%Library Media Services 966,123 328,244 1,294,367 0.67%Music - Choral 842,471 305,763 1,148,234 0.60%NBCT Supplement 76,000 5,814 81,814 0.04%O&M-Building Services 1,349,299 470,446 1,141,068 2,960,813 1.54%Orthopedically Impaired 17,364 8,411 25,775 0.01%Other Health Impaired 17,683 11,878 29,561 0.02%Reading 880,140 307,538 1,187,678 0.62%Regular Programs 21,095,855 7,412,112 12,394 144,863 22,905 28,688,129 14.95%School Food Services 171,369 13,112 184,481 0.10%Seriously Emotionally Disturbed 189,631 85,389 275,020 0.14%Severely and Prof Handicapped 144,814 58,989 203,803 0.11%SOL Remediation Elementary 136,852 10,469 13,761 161,082 0.08%Special - General Curriculum 2,557,957 988,464 3,546,421 1.85%Technology Education 93,326 29,608 122,934 0.06%Trans.-Vehicle Operation Services 240 18 258 0.00%TOTAL ELEMENTARY 36,304,348 12,735,243 664,491 0 1,204,962 289,421 0 35,460 0 0 51,233,925 26.70%
Middle School Program Expenditure Accounts:Art 440,511 151,240 591,751 0.31%Autistic 135,822 62,998 198,820 0.10%Business Education 346,883 138,456 485,339 0.25%Co-curricular Supplement 372,340 28,508 400,848 0.21%COMPASS 110,097 42,443 152,540 0.08%Developmentally Delayed 61,195 21,122 82,317 0.04%Dual Enrollment 4,998 4,998 0.00%English and Language Arts 3,233,542 1,102,410 4,335,952 2.26%English As A Second Language 80,785 23,234 104,019 0.05%Family and Consumer Science-Family Focus 79,386 26,024 105,410 0.05%Foreign Languages 673,021 218,736 370 427 892,554 0.47%Gifted and Talented 767,199 270,418 1,206 9,247 1,569 1,049,639 0.55%Guidance Services 1,034,665 366,903 1,401,568 0.73%Health and PE 1,550,077 581,388 15,052 2,146,517 1.12%Health Occupations 56,373 16,389 72,762 0.04%Health Services 321,270 97,349 418,619 0.22%Intellectually Disabled - Academic 361,931 153,996 515,927 0.27%Intellectually Disabled - Functional 364,589 137,585 502,174 0.26%Library Media Services 594,777 186,224 781,001 0.41%Math 3,338,596 1,118,415 4,457,011 2.32%Middle School Summer Remedial 117,351 10,170 28,676 156,197 0.08%Music - Band 314,063 102,761 416,824 0.22%Music - Choral 274,238 101,531 375,769 0.20%
74
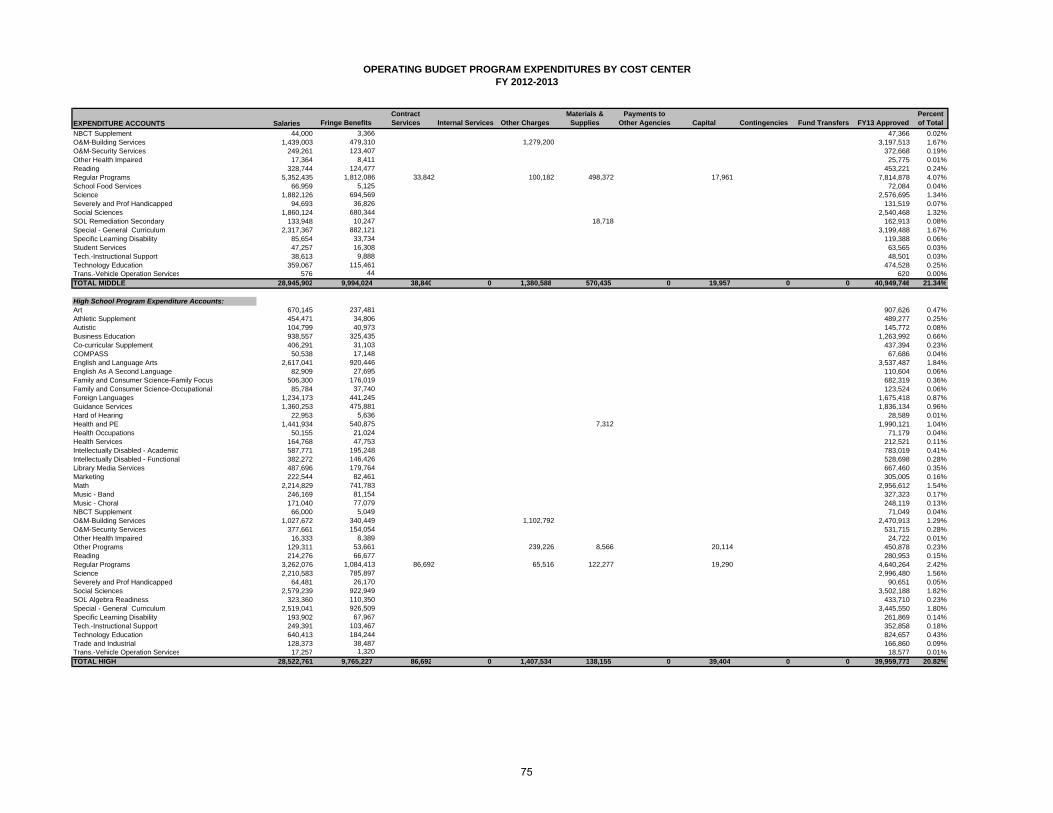
OPERATING BUDGET PROGRAM EXPENDITURES BY COST CENTERFY 2012-2013
EXPENDITURE ACCOUNTS Salaries Fringe BenefitsContract Services Internal Services Other Charges
Materials & Supplies
Payments to Other Agencies Capital Contingencies Fund Transfers FY13 Approved
Percent of Total
NBCT Supplement 44,000 3,366 47,366 0.02%O&M-Building Services 1,439,003 479,310 1,279,200 3,197,513 1.67%O&M-Security Services 249,261 123,407 372,668 0.19%Other Health Impaired 17,364 8,411 25,775 0.01%Reading 328,744 124,477 453,221 0.24%Regular Programs 5,352,435 1,812,086 33,842 100,182 498,372 17,961 7,814,878 4.07%School Food Services 66,959 5,125 72,084 0.04%Science 1,882,126 694,569 2,576,695 1.34%Severely and Prof Handicapped 94,693 36,826 131,519 0.07%Social Sciences 1,860,124 680,344 2,540,468 1.32%SOL Remediation Secondary 133,948 10,247 18,718 162,913 0.08%Special - General Curriculum 2,317,367 882,121 3,199,488 1.67%Specific Learning Disability 85,654 33,734 119,388 0.06%Student Services 47,257 16,308 63,565 0.03%Tech.-Instructional Support 38,613 9,888 48,501 0.03%Technology Education 359,067 115,461 474,528 0.25%Trans.-Vehicle Operation Services 576 44 620 0.00%TOTAL MIDDLE 28,945,902 9,994,024 38,840 0 1,380,588 570,435 0 19,957 0 0 40,949,746 21.34%
High School Program Expenditure Accounts:Art 670,145 237,481 907,626 0.47%Athletic Supplement 454,471 34,806 489,277 0.25%Autistic 104,799 40,973 145,772 0.08%Business Education 938,557 325,435 1,263,992 0.66%Co-curricular Supplement 406,291 31,103 437,394 0.23%COMPASS 50,538 17,148 67,686 0.04%English and Language Arts 2,617,041 920,446 3,537,487 1.84%English As A Second Language 82,909 27,695 110,604 0.06%Family and Consumer Science-Family Focus 506,300 176,019 682,319 0.36%Family and Consumer Science-Occupational 85,784 37,740 123,524 0.06%Foreign Languages 1,234,173 441,245 1,675,418 0.87%Guidance Services 1,360,253 475,881 1,836,134 0.96%Hard of Hearing 22,953 5,636 28,589 0.01%Health and PE 1,441,934 540,875 7,312 1,990,121 1.04%Health Occupations 50,155 21,024 71,179 0.04%Health Services 164,768 47,753 212,521 0.11%Intellectually Disabled - Academic 587,771 195,248 783,019 0.41%Intellectually Disabled - Functional 382,272 146,426 528,698 0.28%Library Media Services 487,696 179,764 667,460 0.35%Marketing 222,544 82,461 305,005 0.16%Math 2,214,829 741,783 2,956,612 1.54%Music - Band 246,169 81,154 327,323 0.17%Music - Choral 171,040 77,079 248,119 0.13%NBCT Supplement 66,000 5,049 71,049 0.04%O&M-Building Services 1,027,672 340,449 1,102,792 2,470,913 1.29%O&M-Security Services 377,661 154,054 531,715 0.28%Other Health Impaired 16,333 8,389 24,722 0.01%Other Programs 129,311 53,661 239,226 8,566 20,114 450,878 0.23%Reading 214,276 66,677 280,953 0.15%Regular Programs 3,262,076 1,084,413 86,692 65,516 122,277 19,290 4,640,264 2.42%Science 2,210,583 785,897 2,996,480 1.56%Severely and Prof Handicapped 64,481 26,170 90,651 0.05%Social Sciences 2,579,239 922,949 3,502,188 1.82%SOL Algebra Readiness 323,360 110,350 433,710 0.23%Special - General Curriculum 2,519,041 926,509 3,445,550 1.80%Specific Learning Disability 193,902 67,967 261,869 0.14%Tech.-Instructional Support 249,391 103,467 352,858 0.18%Technology Education 640,413 184,244 824,657 0.43%Trade and Industrial 128,373 38,487 166,860 0.09%Trans.-Vehicle Operation Services 17,257 1,320 18,577 0.01%TOTAL HIGH 28,522,761 9,765,227 86,692 0 1,407,534 138,155 0 39,404 0 0 39,959,773 20.82%
75

OPERATING BUDGET PROGRAM EXPENDITURES BY COST CENTERFY 2012-2013
EXPENDITURE ACCOUNTS Salaries Fringe BenefitsContract Services Internal Services Other Charges
Materials & Supplies
Payments to Other Agencies Capital Contingencies Fund Transfers FY13 Approved
Percent of Total
Adminstrative Program Expenditure Accounts:504 Expenses 3,000 3,000 0.00%Art 88,703 88,703 0.05%Attrition (1,000,000) (1,000,000) -0.52%Board Services 83,546 6,392 46,910 136,848 0.07%Business Education 5,000 5,873 50,415 61,288 0.03%City Partnerships 23,100 23,100 0.01%Co-curricular Supplement 36,828 2,820 39,648 0.02%Curriculum Development 28,207 2,158 108,243 138,608 0.07%Developmentally Delayed 134,142 47,877 182,019 0.09%Dropout Prevention 211,120 69,979 7,000 30,694 318,793 0.17%Early Reading Intervention 356,081 44,227 400,308 0.21%English and Language Arts 238,833 87,849 1,399 129,750 457,831 0.24%English As A Second Language 12,000 918 1,000 12,680 26,598 0.01%Executive Admin Services 741,661 240,089 45,000 37,822 52,533 1,117,105 0.58%Family and Consumer Science-Family Focus 5,398 29,494 34,892 0.02%Family and Consumer Science-Occupational 2,500 11,482 13,982 0.01%Fine Arts 137,113 43,526 21,982 202,621 0.11%Fiscal Services 595,363 4,011,874 460,099 2,581,570 11,976 10,000 2,917,313 821,102 11,409,297 5.95%General Athletic Expenses 67,775 21,486 80,000 169,261 0.09%Gifted and Talented 471,643 145,050 9,450 1,404 111,842 78,808 412 818,609 0.43%Guidance Services 121,451 39,440 3,117 164,008 0.09%Hard of Hearing 533,678 197,121 730,799 0.38%Health and PE 81,449 21,612 1,200 8,842 5,327 118,430 0.06%Health Occupations 1,691 1,691 0.00%Health Services 330,885 76,746 12,100 50 49,789 4,942 474,512 0.25%Homebound 341,422 45,280 600 10,949 14,472 412,723 0.22%Human Resources Services 776,731 428,628 70,450 77,695 15,537 1,369,041 0.71%Instructional Accountability 260,262 86,648 2,500 576 179,391 1,356 530,733 0.28%Intellectually Disabled - Functional 43,579 11,161 54,740 0.03%International Bacc - High School 62,735 20,273 112,578 195,586 0.10%International Bacc-Elementary 13,140 13,140 0.01%JROTC 1,691 1,691 0.00%Library Media Services 166,134 39,128 6,236 4,000 710,010 44,359 969,867 0.51%Marketing 10,436 10,436 0.01%Math 216,290 74,701 500 70,039 361,530 0.19%Mentorship Program 846 846 0.00%Music - Band 57,131 55,701 112,832 0.06%Music - Choral 56,116 4,288 10,653 71,057 0.04%NBCT Supplement 12,000 918 12,918 0.01%O&M-Building Services 2,222,030 752,539 1,230,891 545,658 949,585 5,700,703 2.97%O&M-Management & Direction 175,872 68,542 173,336 257,733 675,483 0.35%O&M-Security Services 124,993 45,945 75,000 245,938 0.13%Other Programs 76,202 19,440 95,642 0.05%Performance Learning Center 323,776 125,554 5,147 3,364 291 458,132 0.24%Psychological Services 770,940 233,724 19,800 4,212 21,962 1,050,638 0.55%Public Information Services 321,828 102,320 15,951 92,224 31,686 564,009 0.29%Regular Programs 239,893 78,359 1,097,714 1,415,966 0.74%Reprographics 334,906 124,572 54,542 72,397 51,870 638,287 0.33%Safe Schools 685,383 21,828 10,170 717,381 0.37%School Social Work 634,986 200,214 4,934 4,195 19,257 863,586 0.45%Science 250,782 95,128 13,797 4,726 54,121 418,554 0.22%Social Sciences 228,596 73,866 1,000 37,962 341,424 0.18%Special - General Curriculum 1,578,999 508,520 2,378,213 25,045 32,132 4,522,909 2.36%Speech or Language Impaired 1,076,066 332,658 1,408,724 0.73%Student Services 194,984 74,941 11,800 900 100 282,725 0.15%Substitute Personnel 1,911,501 69,730 42,994 677,072 118,116 2,819,413 1.47%Summer Programs 66,109 5,057 71,166 0.04%Tech.-Classroom Instruction 402,971 153,914 556,885 0.29%Tech.-Instructional Support 2,231,011 783,966 519,730 195,000 1,037,500 4,767,207 2.48%Tech.-Management & Direction 164,929 51,781 579,218 16,500 343,890 1,156,318 0.60%Technology Education 4,200 71,568 75,768 0.04%
76
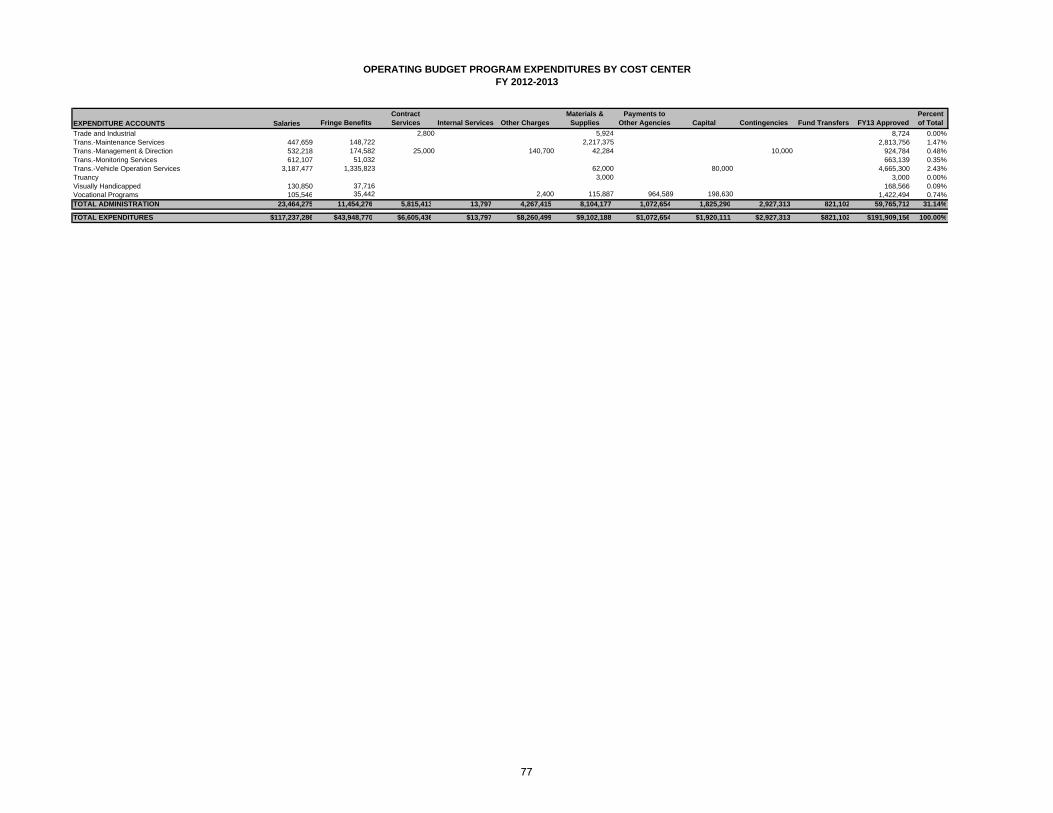
OPERATING BUDGET PROGRAM EXPENDITURES BY COST CENTERFY 2012-2013
EXPENDITURE ACCOUNTS Salaries Fringe BenefitsContract Services Internal Services Other Charges
Materials & Supplies
Payments to Other Agencies Capital Contingencies Fund Transfers FY13 Approved
Percent of Total
Trade and Industrial 2,800 5,924 8,724 0.00%Trans.-Maintenance Services 447,659 148,722 2,217,375 2,813,756 1.47%Trans.-Management & Direction 532,218 174,582 25,000 140,700 42,284 10,000 924,784 0.48%Trans.-Monitoring Services 612,107 51,032 663,139 0.35%Trans.-Vehicle Operation Services 3,187,477 1,335,823 62,000 80,000 4,665,300 2.43%Truancy 3,000 3,000 0.00%Visually Handicapped 130,850 37,716 168,566 0.09%Vocational Programs 105,546 35,442 2,400 115,887 964,589 198,630 1,422,494 0.74%TOTAL ADMINISTRATION 23,464,275 11,454,276 5,815,413 13,797 4,267,415 8,104,177 1,072,654 1,825,290 2,927,313 821,102 59,765,712 31.14%
TOTAL EXPENDITURES $117,237,286 $43,948,770 $6,605,436 $13,797 $8,260,499 $9,102,188 $1,072,654 $1,920,111 $2,927,313 $821,102 $191,909,156 100.00%
77

27%
21%21%
31%
FY13 Operating Expenditures By Cost Center
Elementary Middle High Administration
78
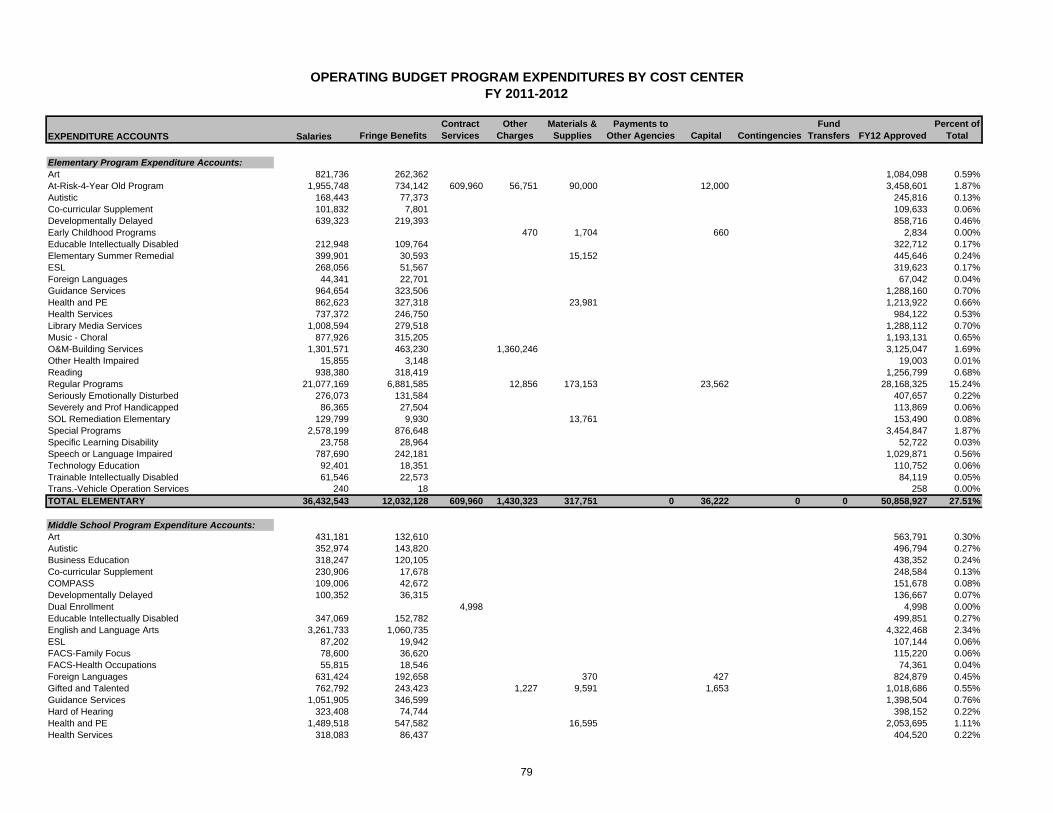
OPERATING BUDGET PROGRAM EXPENDITURES BY COST CENTERFY 2011-2012
EXPENDITURE ACCOUNTS Salaries Fringe BenefitsContract Services
Other Charges
Materials & Supplies
Payments to Other Agencies Capital Contingencies
Fund Transfers FY12 Approved
Percent of Total
Elementary Program Expenditure Accounts:Art 821,736 262,362 1,084,098 0.59%At-Risk-4-Year Old Program 1,955,748 734,142 609,960 56,751 90,000 12,000 3,458,601 1.87%Autistic 168,443 77,373 245,816 0.13%Co-curricular Supplement 101,832 7,801 109,633 0.06%Developmentally Delayed 639,323 219,393 858,716 0.46%Early Childhood Programs 470 1,704 660 2,834 0.00%Educable Intellectually Disabled 212,948 109,764 322,712 0.17%Elementary Summer Remedial 399,901 30,593 15,152 445,646 0.24%ESL 268,056 51,567 319,623 0.17%Foreign Languages 44,341 22,701 67,042 0.04%Guidance Services 964,654 323,506 1,288,160 0.70%Health and PE 862,623 327,318 23,981 1,213,922 0.66%Health Services 737,372 246,750 984,122 0.53%Library Media Services 1,008,594 279,518 1,288,112 0.70%Music - Choral 877,926 315,205 1,193,131 0.65%O&M-Building Services 1,301,571 463,230 1,360,246 3,125,047 1.69%Other Health Impaired 15,855 3,148 19,003 0.01%Reading 938,380 318,419 1,256,799 0.68%Regular Programs 21,077,169 6,881,585 12,856 173,153 23,562 28,168,325 15.24%Seriously Emotionally Disturbed 276,073 131,584 407,657 0.22%Severely and Prof Handicapped 86,365 27,504 113,869 0.06%SOL Remediation Elementary 129,799 9,930 13,761 153,490 0.08%Special Programs 2,578,199 876,648 3,454,847 1.87%Specific Learning Disability 23,758 28,964 52,722 0.03%Speech or Language Impaired 787,690 242,181 1,029,871 0.56%Technology Education 92,401 18,351 110,752 0.06%Trainable Intellectually Disabled 61,546 22,573 84,119 0.05%Trans.-Vehicle Operation Services 240 18 258 0.00%TOTAL ELEMENTARY 36,432,543 12,032,128 609,960 1,430,323 317,751 0 36,222 0 0 50,858,927 27.51%
Middle School Program Expenditure Accounts:Art 431,181 132,610 563,791 0.30%Autistic 352,974 143,820 496,794 0.27%Business Education 318,247 120,105 438,352 0.24%Co-curricular Supplement 230,906 17,678 248,584 0.13%COMPASS 109,006 42,672 151,678 0.08%Developmentally Delayed 100,352 36,315 136,667 0.07%Dual Enrollment 4,998 4,998 0.00%Educable Intellectually Disabled 347,069 152,782 499,851 0.27%English and Language Arts 3,261,733 1,060,735 4,322,468 2.34%ESL 87,202 19,942 107,144 0.06%FACS-Family Focus 78,600 36,620 115,220 0.06%FACS-Health Occupations 55,815 18,546 74,361 0.04%Foreign Languages 631,424 192,658 370 427 824,879 0.45%Gifted and Talented 762,792 243,423 1,227 9,591 1,653 1,018,686 0.55%Guidance Services 1,051,905 346,599 1,398,504 0.76%Hard of Hearing 323,408 74,744 398,152 0.22%Health and PE 1,489,518 547,582 16,595 2,053,695 1.11%Health Services 318,083 86,437 404,520 0.22%
79
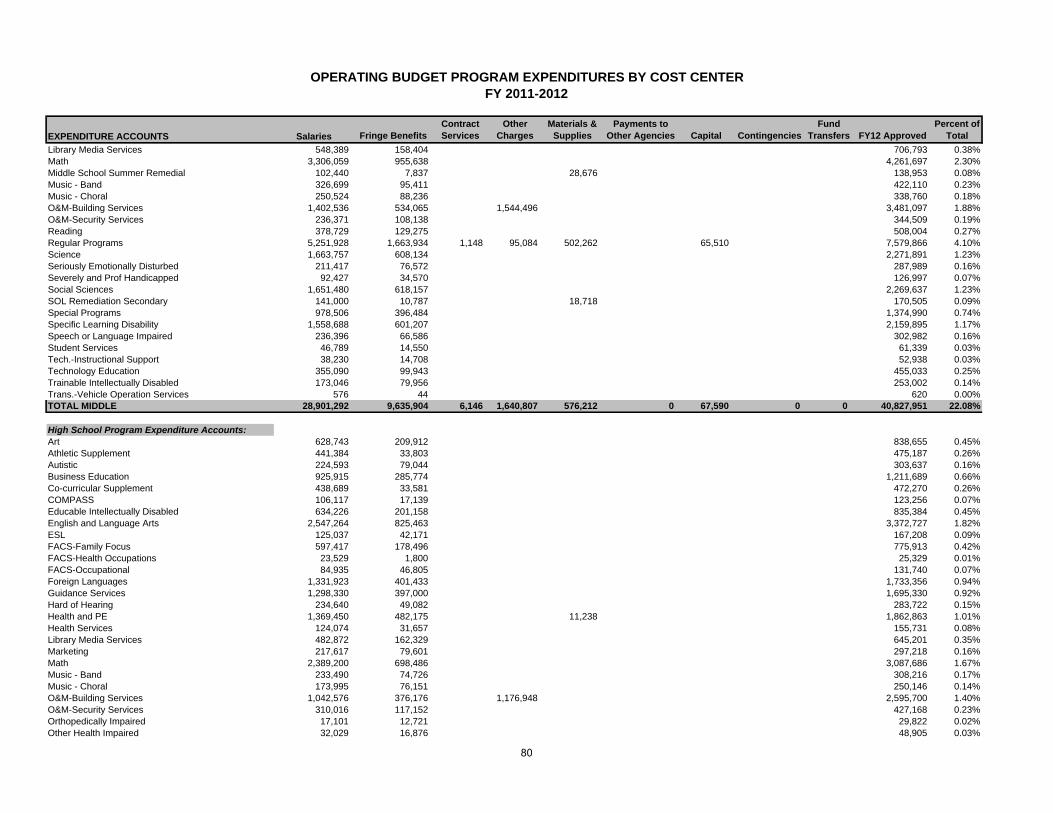
OPERATING BUDGET PROGRAM EXPENDITURES BY COST CENTERFY 2011-2012
EXPENDITURE ACCOUNTS Salaries Fringe BenefitsContract Services
Other Charges
Materials & Supplies
Payments to Other Agencies Capital Contingencies
Fund Transfers FY12 Approved
Percent of Total
Library Media Services 548,389 158,404 706,793 0.38%Math 3,306,059 955,638 4,261,697 2.30%Middle School Summer Remedial 102,440 7,837 28,676 138,953 0.08%Music - Band 326,699 95,411 422,110 0.23%Music - Choral 250,524 88,236 338,760 0.18%O&M-Building Services 1,402,536 534,065 1,544,496 3,481,097 1.88%O&M-Security Services 236,371 108,138 344,509 0.19%Reading 378,729 129,275 508,004 0.27%Regular Programs 5,251,928 1,663,934 1,148 95,084 502,262 65,510 7,579,866 4.10%Science 1,663,757 608,134 2,271,891 1.23%Seriously Emotionally Disturbed 211,417 76,572 287,989 0.16%Severely and Prof Handicapped 92,427 34,570 126,997 0.07%Social Sciences 1,651,480 618,157 2,269,637 1.23%SOL Remediation Secondary 141,000 10,787 18,718 170,505 0.09%Special Programs 978,506 396,484 1,374,990 0.74%Specific Learning Disability 1,558,688 601,207 2,159,895 1.17%Speech or Language Impaired 236,396 66,586 302,982 0.16%Student Services 46,789 14,550 61,339 0.03%Tech.-Instructional Support 38,230 14,708 52,938 0.03%Technology Education 355,090 99,943 455,033 0.25%Trainable Intellectually Disabled 173,046 79,956 253,002 0.14%Trans.-Vehicle Operation Services 576 44 620 0.00%TOTAL MIDDLE 28,901,292 9,635,904 6,146 1,640,807 576,212 0 67,590 0 0 40,827,951 22.08%
High School Program Expenditure Accounts:Art 628,743 209,912 838,655 0.45%Athletic Supplement 441,384 33,803 475,187 0.26%Autistic 224,593 79,044 303,637 0.16%Business Education 925,915 285,774 1,211,689 0.66%Co-curricular Supplement 438,689 33,581 472,270 0.26%COMPASS 106,117 17,139 123,256 0.07%Educable Intellectually Disabled 634,226 201,158 835,384 0.45%English and Language Arts 2,547,264 825,463 3,372,727 1.82%ESL 125,037 42,171 167,208 0.09%FACS-Family Focus 597,417 178,496 775,913 0.42%FACS-Health Occupations 23,529 1,800 25,329 0.01%FACS-Occupational 84,935 46,805 131,740 0.07%Foreign Languages 1,331,923 401,433 1,733,356 0.94%Guidance Services 1,298,330 397,000 1,695,330 0.92%Hard of Hearing 234,640 49,082 283,722 0.15%Health and PE 1,369,450 482,175 11,238 1,862,863 1.01%Health Services 124,074 31,657 155,731 0.08%Library Media Services 482,872 162,329 645,201 0.35%Marketing 217,617 79,601 297,218 0.16%Math 2,389,200 698,486 3,087,686 1.67%Music - Band 233,490 74,726 308,216 0.17%Music - Choral 173,995 76,151 250,146 0.14%O&M-Building Services 1,042,576 376,176 1,176,948 2,595,700 1.40%O&M-Security Services 310,016 117,152 427,168 0.23%Orthopedically Impaired 17,101 12,721 29,822 0.02%Other Health Impaired 32,029 16,876 48,905 0.03%
80
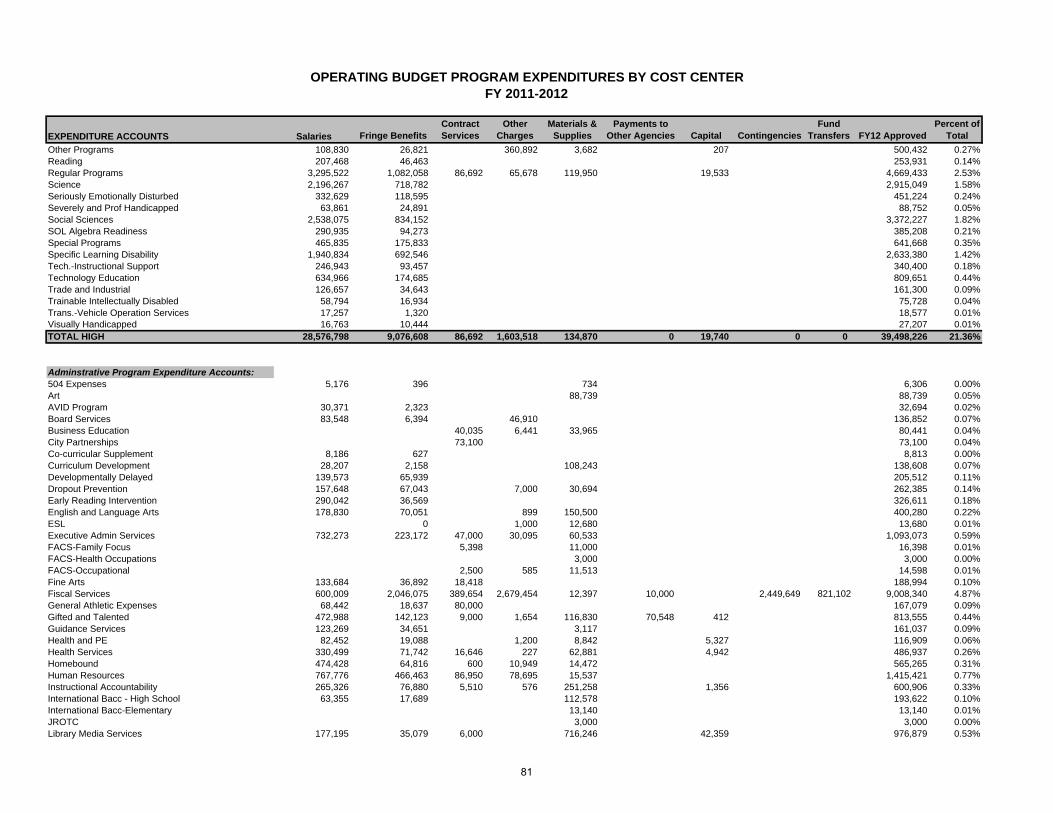
OPERATING BUDGET PROGRAM EXPENDITURES BY COST CENTERFY 2011-2012
EXPENDITURE ACCOUNTS Salaries Fringe BenefitsContract Services
Other Charges
Materials & Supplies
Payments to Other Agencies Capital Contingencies
Fund Transfers FY12 Approved
Percent of Total
Other Programs 108,830 26,821 360,892 3,682 207 500,432 0.27%Reading 207,468 46,463 253,931 0.14%Regular Programs 3,295,522 1,082,058 86,692 65,678 119,950 19,533 4,669,433 2.53%Science 2,196,267 718,782 2,915,049 1.58%Seriously Emotionally Disturbed 332,629 118,595 451,224 0.24%Severely and Prof Handicapped 63,861 24,891 88,752 0.05%Social Sciences 2,538,075 834,152 3,372,227 1.82%SOL Algebra Readiness 290,935 94,273 385,208 0.21%Special Programs 465,835 175,833 641,668 0.35%Specific Learning Disability 1,940,834 692,546 2,633,380 1.42%Tech.-Instructional Support 246,943 93,457 340,400 0.18%Technology Education 634,966 174,685 809,651 0.44%Trade and Industrial 126,657 34,643 161,300 0.09%Trainable Intellectually Disabled 58,794 16,934 75,728 0.04%Trans.-Vehicle Operation Services 17,257 1,320 18,577 0.01%Visually Handicapped 16,763 10,444 27,207 0.01%TOTAL HIGH 28,576,798 9,076,608 86,692 1,603,518 134,870 0 19,740 0 0 39,498,226 21.36%
Adminstrative Program Expenditure Accounts:504 Expenses 5,176 396 734 6,306 0.00%Art 88,739 88,739 0.05%AVID Program 30,371 2,323 32,694 0.02%Board Services 83,548 6,394 46,910 136,852 0.07%Business Education 40,035 6,441 33,965 80,441 0.04%City Partnerships 73,100 73,100 0.04%Co-curricular Supplement 8,186 627 8,813 0.00%Curriculum Development 28,207 2,158 108,243 138,608 0.07%Developmentally Delayed 139,573 65,939 205,512 0.11%Dropout Prevention 157,648 67,043 7,000 30,694 262,385 0.14%Early Reading Intervention 290,042 36,569 326,611 0.18%English and Language Arts 178,830 70,051 899 150,500 400,280 0.22%ESL 0 1,000 12,680 13,680 0.01%Executive Admin Services 732,273 223,172 47,000 30,095 60,533 1,093,073 0.59%FACS-Family Focus 5,398 11,000 16,398 0.01%FACS-Health Occupations 3,000 3,000 0.00%FACS-Occupational 2,500 585 11,513 14,598 0.01%Fine Arts 133,684 36,892 18,418 188,994 0.10%Fiscal Services 600,009 2,046,075 389,654 2,679,454 12,397 10,000 2,449,649 821,102 9,008,340 4.87%General Athletic Expenses 68,442 18,637 80,000 167,079 0.09%Gifted and Talented 472,988 142,123 9,000 1,654 116,830 70,548 412 813,555 0.44%Guidance Services 123,269 34,651 3,117 161,037 0.09%Health and PE 82,452 19,088 1,200 8,842 5,327 116,909 0.06%Health Services 330,499 71,742 16,646 227 62,881 4,942 486,937 0.26%Homebound 474,428 64,816 600 10,949 14,472 565,265 0.31%Human Resources 767,776 466,463 86,950 78,695 15,537 1,415,421 0.77%Instructional Accountability 265,326 76,880 5,510 576 251,258 1,356 600,906 0.33%International Bacc - High School 63,355 17,689 112,578 193,622 0.10%International Bacc-Elementary 13,140 13,140 0.01%JROTC 3,000 3,000 0.00%Library Media Services 177,195 35,079 6,000 716,246 42,359 976,879 0.53%
81
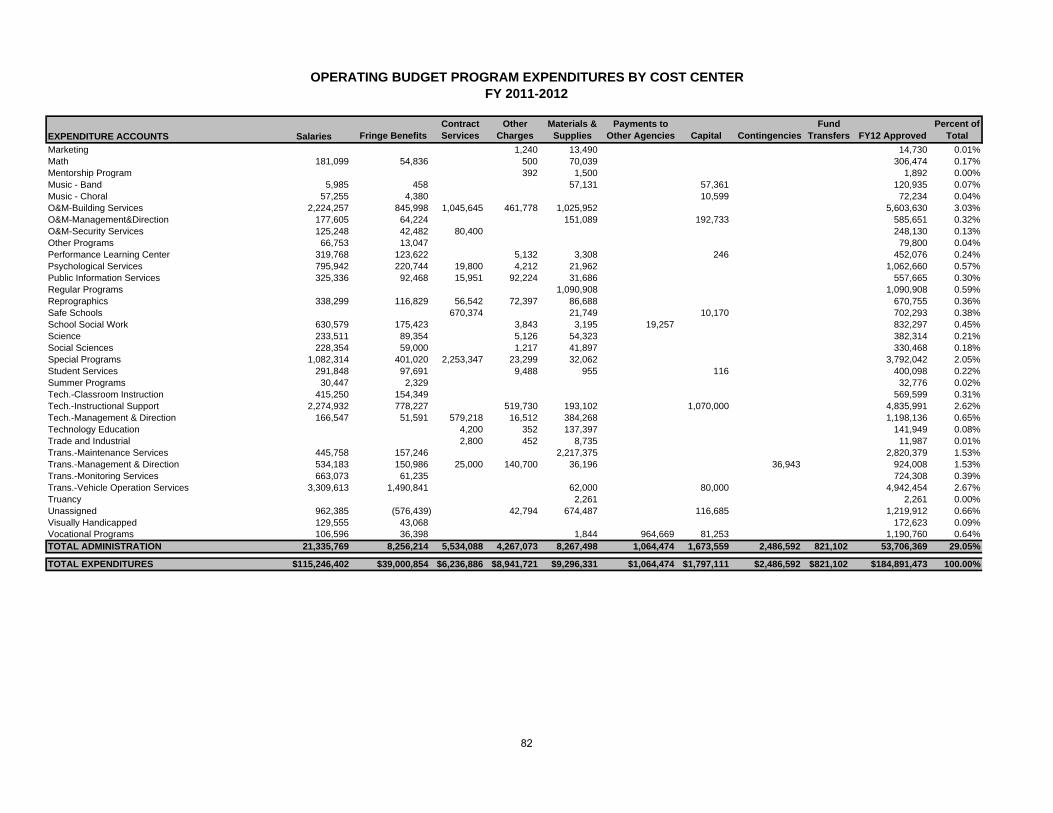
OPERATING BUDGET PROGRAM EXPENDITURES BY COST CENTERFY 2011-2012
EXPENDITURE ACCOUNTS Salaries Fringe BenefitsContract Services
Other Charges
Materials & Supplies
Payments to Other Agencies Capital Contingencies
Fund Transfers FY12 Approved
Percent of Total
Marketing 1,240 13,490 14,730 0.01%Math 181,099 54,836 500 70,039 306,474 0.17%Mentorship Program 392 1,500 1,892 0.00%Music - Band 5,985 458 57,131 57,361 120,935 0.07%Music - Choral 57,255 4,380 10,599 72,234 0.04%O&M-Building Services 2,224,257 845,998 1,045,645 461,778 1,025,952 5,603,630 3.03%O&M-Management&Direction 177,605 64,224 151,089 192,733 585,651 0.32%O&M-Security Services 125,248 42,482 80,400 248,130 0.13%Other Programs 66,753 13,047 79,800 0.04%Performance Learning Center 319,768 123,622 5,132 3,308 246 452,076 0.24%Psychological Services 795,942 220,744 19,800 4,212 21,962 1,062,660 0.57%Public Information Services 325,336 92,468 15,951 92,224 31,686 557,665 0.30%Regular Programs 1,090,908 1,090,908 0.59%Reprographics 338,299 116,829 56,542 72,397 86,688 670,755 0.36%Safe Schools 670,374 21,749 10,170 702,293 0.38%School Social Work 630,579 175,423 3,843 3,195 19,257 832,297 0.45%Science 233,511 89,354 5,126 54,323 382,314 0.21%Social Sciences 228,354 59,000 1,217 41,897 330,468 0.18%Special Programs 1,082,314 401,020 2,253,347 23,299 32,062 3,792,042 2.05%Student Services 291,848 97,691 9,488 955 116 400,098 0.22%Summer Programs 30,447 2,329 32,776 0.02%Tech.-Classroom Instruction 415,250 154,349 569,599 0.31%Tech.-Instructional Support 2,274,932 778,227 519,730 193,102 1,070,000 4,835,991 2.62%Tech.-Management & Direction 166,547 51,591 579,218 16,512 384,268 1,198,136 0.65%Technology Education 4,200 352 137,397 141,949 0.08%Trade and Industrial 2,800 452 8,735 11,987 0.01%Trans.-Maintenance Services 445,758 157,246 2,217,375 2,820,379 1.53%Trans.-Management & Direction 534,183 150,986 25,000 140,700 36,196 36,943 924,008 1.53%Trans.-Monitoring Services 663,073 61,235 724,308 0.39%Trans.-Vehicle Operation Services 3,309,613 1,490,841 62,000 80,000 4,942,454 2.67%Truancy 2,261 2,261 0.00%Unassigned 962,385 (576,439) 42,794 674,487 116,685 1,219,912 0.66%Visually Handicapped 129,555 43,068 172,623 0.09%Vocational Programs 106,596 36,398 1,844 964,669 81,253 1,190,760 0.64%TOTAL ADMINISTRATION 21,335,769 8,256,214 5,534,088 4,267,073 8,267,498 1,064,474 1,673,559 2,486,592 821,102 53,706,369 29.05%
TOTAL EXPENDITURES $115,246,402 $39,000,854 $6,236,886 $8,941,721 $9,296,331 $1,064,474 $1,797,111 $2,486,592 $821,102 $184,891,473 100.00%
82
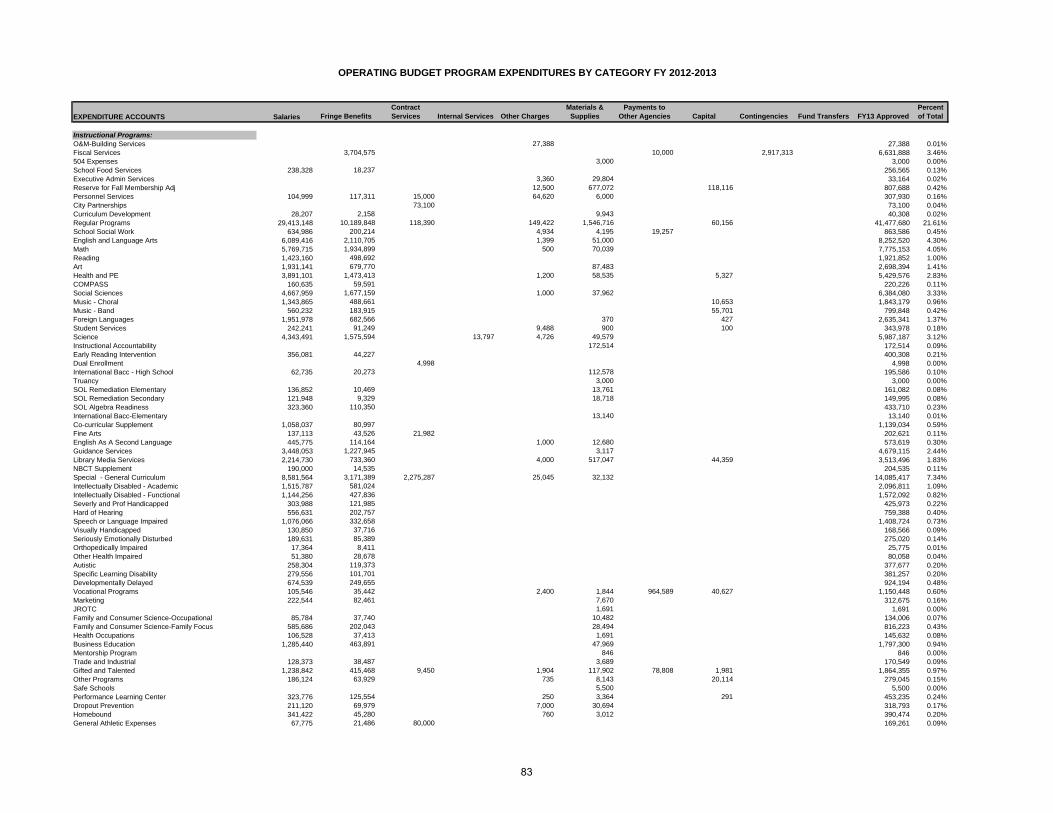
OPERATING BUDGET PROGRAM EXPENDITURES BY CATEGORY FY 2012-2013
EXPENDITURE ACCOUNTS Salaries Fringe BenefitsContract Services Internal Services Other Charges
Materials & Supplies
Payments to Other Agencies Capital Contingencies Fund Transfers FY13 Approved
Percent of Total
Instructional Programs:O&M-Building Services 27,388 27,388 0.01%Fiscal Services 3,704,575 10,000 2,917,313 6,631,888 3.46%504 Expenses 3,000 3,000 0.00%School Food Services 238,328 18,237 256,565 0.13%Executive Admin Services 3,360 29,804 33,164 0.02%Reserve for Fall Membership Adj 12,500 677,072 118,116 807,688 0.42%Personnel Services 104,999 117,311 15,000 64,620 6,000 307,930 0.16%City Partnerships 73,100 73,100 0.04%Curriculum Development 28,207 2,158 9,943 40,308 0.02%Regular Programs 29,413,148 10,189,848 118,390 149,422 1,546,716 60,156 41,477,680 21.61%School Social Work 634,986 200,214 4,934 4,195 19,257 863,586 0.45%English and Language Arts 6,089,416 2,110,705 1,399 51,000 8,252,520 4.30%Math 5,769,715 1,934,899 500 70,039 7,775,153 4.05%Reading 1,423,160 498,692 1,921,852 1.00%Art 1,931,141 679,770 87,483 2,698,394 1.41%Health and PE 3,891,101 1,473,413 1,200 58,535 5,327 5,429,576 2.83%COMPASS 160,635 59,591 220,226 0.11%Social Sciences 4,667,959 1,677,159 1,000 37,962 6,384,080 3.33%Music - Choral 1,343,865 488,661 10,653 1,843,179 0.96%Music - Band 560,232 183,915 55,701 799,848 0.42%Foreign Languages 1,951,978 682,566 370 427 2,635,341 1.37%Student Services 242,241 91,249 9,488 900 100 343,978 0.18%Science 4,343,491 1,575,594 13,797 4,726 49,579 5,987,187 3.12%Instructional Accountability 172,514 172,514 0.09%Early Reading Intervention 356,081 44,227 400,308 0.21%Dual Enrollment 4,998 4,998 0.00%International Bacc - High School 62,735 20,273 112,578 195,586 0.10%Truancy 3,000 3,000 0.00%SOL Remediation Elementary 136,852 10,469 13,761 161,082 0.08%SOL Remediation Secondary 121,948 9,329 18,718 149,995 0.08%SOL Algebra Readiness 323,360 110,350 433,710 0.23%International Bacc-Elementary 13,140 13,140 0.01%Co-curricular Supplement 1,058,037 80,997 1,139,034 0.59%Fine Arts 137,113 43,526 21,982 202,621 0.11%English As A Second Language 445,775 114,164 1,000 12,680 573,619 0.30%Guidance Services 3,448,053 1,227,945 3,117 4,679,115 2.44%Library Media Services 2,214,730 733,360 4,000 517,047 44,359 3,513,496 1.83%NBCT Supplement 190,000 14,535 204,535 0.11%Special - General Curriculum 8,581,564 3,171,389 2,275,287 25,045 32,132 14,085,417 7.34%Intellectually Disabled - Academic 1,515,787 581,024 2,096,811 1.09%Intellectually Disabled - Functional 1,144,256 427,836 1,572,092 0.82%Severly and Prof Handicapped 303,988 121,985 425,973 0.22%Hard of Hearing 556,631 202,757 759,388 0.40%Speech or Language Impaired 1,076,066 332,658 1,408,724 0.73%Visually Handicapped 130,850 37,716 168,566 0.09%Seriously Emotionally Disturbed 189,631 85,389 275,020 0.14%Orthopedically Impaired 17,364 8,411 25,775 0.01%Other Health Impaired 51,380 28,678 80,058 0.04%Autistic 258,304 119,373 377,677 0.20%Specific Learning Disability 279,556 101,701 381,257 0.20%Developmentally Delayed 674,539 249,655 924,194 0.48%Vocational Programs 105,546 35,442 2,400 1,844 964,589 40,627 1,150,448 0.60%Marketing 222,544 82,461 7,670 312,675 0.16%JROTC 1,691 1,691 0.00%Family and Consumer Science-Occupational 85,784 37,740 10,482 134,006 0.07%Family and Consumer Science-Family Focus 585,686 202,043 28,494 816,223 0.43%Health Occupations 106,528 37,413 1,691 145,632 0.08%Business Education 1,285,440 463,891 47,969 1,797,300 0.94%Mentorship Program 846 846 0.00%Trade and Industrial 128,373 38,487 3,689 170,549 0.09%Gifted and Talented 1,238,842 415,468 9,450 1,904 117,902 78,808 1,981 1,864,355 0.97%Other Programs 186,124 63,929 735 8,143 20,114 279,045 0.15%Safe Schools 5,500 5,500 0.00%Performance Learning Center 323,776 125,554 250 3,364 291 453,235 0.24%Dropout Prevention 211,120 69,979 7,000 30,694 318,793 0.17%Homebound 341,422 45,280 760 3,012 390,474 0.20%General Athletic Expenses 67,775 21,486 80,000 169,261 0.09%
83
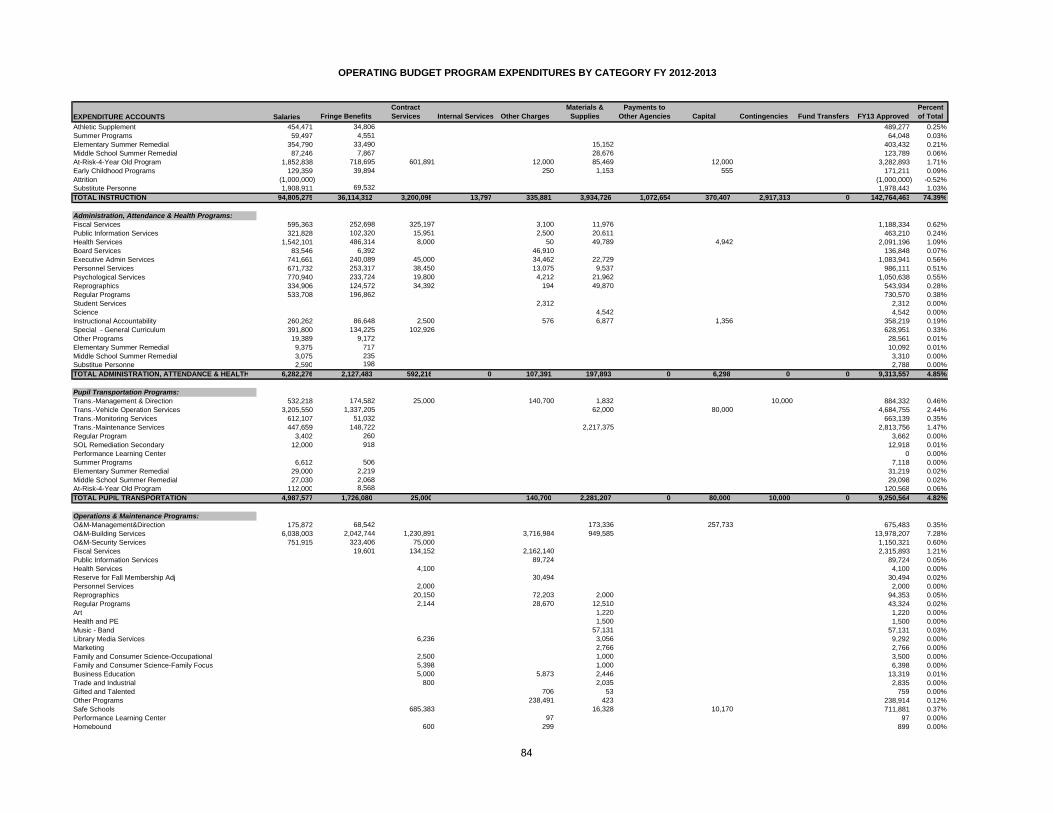
OPERATING BUDGET PROGRAM EXPENDITURES BY CATEGORY FY 2012-2013
EXPENDITURE ACCOUNTS Salaries Fringe BenefitsContract Services Internal Services Other Charges
Materials & Supplies
Payments to Other Agencies Capital Contingencies Fund Transfers FY13 Approved
Percent of Total
Athletic Supplement 454,471 34,806 489,277 0.25%Summer Programs 59,497 4,551 64,048 0.03%Elementary Summer Remedial 354,790 33,490 15,152 403,432 0.21%Middle School Summer Remedial 87,246 7,867 28,676 123,789 0.06%At-Risk-4-Year Old Program 1,852,838 718,695 601,891 12,000 85,469 12,000 3,282,893 1.71%Early Childhood Programs 129,359 39,894 250 1,153 555 171,211 0.09%Attrition (1,000,000) (1,000,000) -0.52%Substitute Personnel 1,908,911 69,532 1,978,443 1.03%TOTAL INSTRUCTION 94,805,275 36,114,312 3,200,098 13,797 335,881 3,934,726 1,072,654 370,407 2,917,313 0 142,764,463 74.39%
Administration, Attendance & Health Programs:Fiscal Services 595,363 252,698 325,197 3,100 11,976 1,188,334 0.62%Public Information Services 321,828 102,320 15,951 2,500 20,611 463,210 0.24%Health Services 1,542,101 486,314 8,000 50 49,789 4,942 2,091,196 1.09%Board Services 83,546 6,392 46,910 136,848 0.07%Executive Admin Services 741,661 240,089 45,000 34,462 22,729 1,083,941 0.56%Personnel Services 671,732 253,317 38,450 13,075 9,537 986,111 0.51%Psychological Services 770,940 233,724 19,800 4,212 21,962 1,050,638 0.55%Reprographics 334,906 124,572 34,392 194 49,870 543,934 0.28%Regular Programs 533,708 196,862 730,570 0.38%Student Services 2,312 2,312 0.00%Science 4,542 4,542 0.00%Instructional Accountability 260,262 86,648 2,500 576 6,877 1,356 358,219 0.19%Special - General Curriculum 391,800 134,225 102,926 628,951 0.33%Other Programs 19,389 9,172 28,561 0.01%Elementary Summer Remedial 9,375 717 10,092 0.01%Middle School Summer Remedial 3,075 235 3,310 0.00%Substitue Personnel 2,590 198 2,788 0.00%TOTAL ADMINISTRATION, ATTENDANCE & HEALTH 6,282,276 2,127,483 592,216 0 107,391 197,893 0 6,298 0 0 9,313,557 4.85%
Pupil Transportation Programs:Trans.-Management & Direction 532,218 174,582 25,000 140,700 1,832 10,000 884,332 0.46%Trans.-Vehicle Operation Services 3,205,550 1,337,205 62,000 80,000 4,684,755 2.44%Trans.-Monitoring Services 612,107 51,032 663,139 0.35%Trans.-Maintenance Services 447,659 148,722 2,217,375 2,813,756 1.47%Regular Program 3,402 260 3,662 0.00%SOL Remediation Secondary 12,000 918 12,918 0.01%Performance Learning Center 0 0.00%Summer Programs 6,612 506 7,118 0.00%Elementary Summer Remedial 29,000 2,219 31,219 0.02%Middle School Summer Remedial 27,030 2,068 29,098 0.02%At-Risk-4-Year Old Program 112,000 8,568 120,568 0.06%TOTAL PUPIL TRANSPORTATION 4,987,577 1,726,080 25,000 140,700 2,281,207 0 80,000 10,000 0 9,250,564 4.82%
Operations & Maintenance Programs:O&M-Management&Direction 175,872 68,542 173,336 257,733 675,483 0.35%O&M-Building Services 6,038,003 2,042,744 1,230,891 3,716,984 949,585 13,978,207 7.28%O&M-Security Services 751,915 323,406 75,000 1,150,321 0.60%Fiscal Services 19,601 134,152 2,162,140 2,315,893 1.21%Public Information Services 89,724 89,724 0.05%Health Services 4,100 4,100 0.00%Reserve for Fall Membership Adj 30,494 30,494 0.02%Personnel Services 2,000 2,000 0.00%Reprographics 20,150 72,203 2,000 94,353 0.05%Regular Programs 2,144 28,670 12,510 43,324 0.02%Art 1,220 1,220 0.00%Health and PE 1,500 1,500 0.00%Music - Band 57,131 57,131 0.03%Library Media Services 6,236 3,056 9,292 0.00%Marketing 2,766 2,766 0.00%Family and Consumer Science-Occupational 2,500 1,000 3,500 0.00%Family and Consumer Science-Family Focus 5,398 1,000 6,398 0.00%Business Education 5,000 5,873 2,446 13,319 0.01%Trade and Industrial 800 2,035 2,835 0.00%Gifted and Talented 706 53 759 0.00%Other Programs 238,491 423 238,914 0.12%Safe Schools 685,383 16,328 10,170 711,881 0.37%Performance Learning Center 97 97 0.00%Homebound 600 299 899 0.00%
84
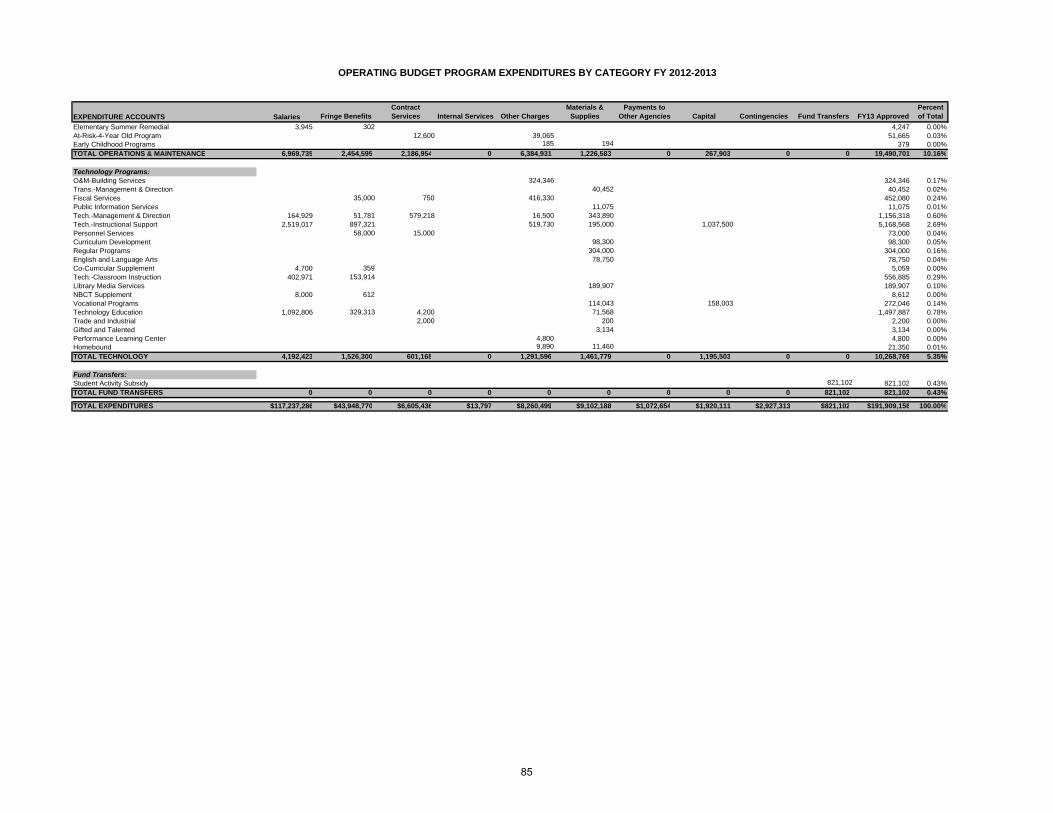
OPERATING BUDGET PROGRAM EXPENDITURES BY CATEGORY FY 2012-2013
EXPENDITURE ACCOUNTS Salaries Fringe BenefitsContract Services Internal Services Other Charges
Materials & Supplies
Payments to Other Agencies Capital Contingencies Fund Transfers FY13 Approved
Percent of Total
Elementary Summer Remedial 3,945 302 4,247 0.00%At-Risk-4-Year Old Program 12,600 39,065 51,665 0.03%Early Childhood Programs 185 194 379 0.00%TOTAL OPERATIONS & MAINTENANCE 6,969,735 2,454,595 2,186,954 0 6,384,931 1,226,583 0 267,903 0 0 19,490,701 10.16%
Technology Programs:O&M-Building Services 324,346 324,346 0.17%Trans.-Management & Direction 40,452 40,452 0.02%Fiscal Services 35,000 750 416,330 452,080 0.24%Public Information Services 11,075 11,075 0.01%Tech.-Management & Direction 164,929 51,781 579,218 16,500 343,890 1,156,318 0.60%Tech.-Instructional Support 2,519,017 897,321 519,730 195,000 1,037,500 5,168,568 2.69%Personnel Services 58,000 15,000 73,000 0.04%Curriculum Development 98,300 98,300 0.05%Regular Programs 304,000 304,000 0.16%English and Language Arts 78,750 78,750 0.04%Co-Curricular Supplement 4,700 359 5,059 0.00%Tech.-Classroom Instruction 402,971 153,914 556,885 0.29%Library Media Services 189,907 189,907 0.10%NBCT Supplement 8,000 612 8,612 0.00%Vocational Programs 114,043 158,003 272,046 0.14%Technology Education 1,092,806 329,313 4,200 71,568 1,497,887 0.78%Trade and Industrial 2,000 200 2,200 0.00%Gifted and Talented 3,134 3,134 0.00%Performance Learning Center 4,800 4,800 0.00%Homebound 9,890 11,460 21,350 0.01%TOTAL TECHNOLOGY 4,192,423 1,526,300 601,168 0 1,291,596 1,461,779 0 1,195,503 0 0 10,268,769 5.35%
Fund Transfers:Student Activity Subsidy 821,102 821,102 0.43%TOTAL FUND TRANSFERS 0 0 0 0 0 0 0 0 0 821,102 821,102 0.43%
TOTAL EXPENDITURES $117,237,286 $43,948,770 $6,605,436 $13,797 $8,260,499 $9,102,188 $1,072,654 $1,920,111 $2,927,313 $821,102 $191,909,156 100.00%
85

OPERATING BUDGET PROGRAM EXPENDITURES BY CATEGORY FY 2011-2012
EXPENDITURE ACCOUNTS Salaries Fringe BenefitsContract Services Other Charges
Materials & Supplies
Payments to Other Agencies Capital Contingencies
Fund Transfers FY12 Approved
Percent of Total
Instructional Programs:504 Expenses 5,176 396 734 6,306 0.00%Advancement via Individual Determination (AVID) Program 30,371 2,323 32,694 0.02%Art 1,881,660 604,884 87,302 2,573,846 1.39%Athletic Supplement 441,384 33,803 475,187 0.26%At-Risk-4-Year Old Program 1,843,748 725,574 597,360 12,000 90,000 12,000 3,280,682 1.77%Attrition (1,000,000) (1,000,000) -0.54%Autistic 746,010 300,237 1,046,247 0.57%Business Education 1,244,162 405,879 568 31,519 1,682,128 0.91%City Partnerships 73,100 73,100 0.04%Co-curricular Supplement 779,613 59,687 839,300 0.45%COMPASS 215,123 59,811 274,934 0.15%Curriculum Development 28,207 2,158 9,943 40,308 0.02%Developmentally Delayed 879,248 321,647 1,200,895 0.65%Dropout Prevention 157,648 67,043 7,000 30,694 262,385 0.14%Dual Enrollment 4,998 4,998 0.00%Early Childhood Programs 250 1,510 660 2,420 0.00%Early Reading Intervention 290,042 36,569 326,611 0.18%Educable Intellectually Disabled 1,194,243 463,704 1,657,947 0.90%Elementary Summer Remedial 370,901 28,374 15,152 414,427 0.22%English and Language Arts 5,987,827 1,956,249 899 50,500 7,995,475 4.32%English as a Second Language 480,295 113,680 1,000 12,680 607,655 0.33%Executive Admin Services 3,360 40,304 43,664 0.02%Family and Consumer Science-Family Focus 676,017 215,116 10,000 901,133 0.49%Family and Consumer Science-Health Occupations 79,344 20,346 3,000 102,690 0.06%Family and Consumer Science-Occupational 84,935 46,805 585 10,513 142,838 0.08%Fine Arts 133,684 36,892 18,418 188,994 0.10%Fiscal Services 1,798,142 10,000 2,449,649 4,257,791 2.30%Foreign Languages 2,007,688 616,792 370 427 2,625,277 1.42%General Athletic Expenses 68,442 18,637 80,000 167,079 0.09%Gifted and Talented 1,235,780 385,546 9,000 1,904 123,234 70,548 2,065 1,828,077 0.99%Guidance Services 3,438,158 1,101,756 3,117 4,543,031 2.46%Hard of Hearing 558,048 123,826 681,874 0.37%Health and PE 3,804,043 1,376,163 1,200 59,156 5,327 5,245,889 2.84%Homebound 474,428 64,816 760 3,012 543,016 0.29%Instructional Accountability 184,630 184,630 0.10%International Bacc - High School 63,355 17,689 112,578 193,622 0.10%International Bacc-Elementary 13,140 13,140 0.01%JROTC 3,000 3,000 0.00%Library Media Services 2,217,050 635,330 517,283 42,359 3,412,022 1.85%Marketing 217,617 79,601 1,240 10,724 309,182 0.17%Math 5,876,358 1,708,960 500 70,039 7,655,857 4.14%Mentorship Program 392 1,500 1,892 0.00%Middle School Summer Remedial 77,440 5,924 28,676 112,040 0.06%Music - Band 566,174 170,595 57,361 794,130 0.43%Music - Choral 1,359,700 483,972 10,599 1,854,271 1.00%O&M-Building Services 27,388 27,388 0.01%Orthopedically Impaired 17,101 12,721 29,822 0.02%Other Health Impaired 47,884 20,024 67,908 0.04%Other Programs 175,583 39,868 735 3,259 207 219,652 0.12%Performance Learning Center 319,768 123,622 250 3,308 246 447,194 0.24%Personnel Services 97,306 197,907 15,000 60,620 6,000 376,833 0.20%Reading 1,524,577 494,157 2,018,734 1.09%Regular Programs 29,299,514 9,501,375 85,696 144,672 1,501,004 60,819 40,593,080 21.96%Reserve for Fall Membership Adj 12,750 674,487 116,685 803,922 0.43%Safe Schools 5,348 5,348 0.00%School Social Work 630,579 175,423 3,843 3,195 19,257 832,297 0.45%Science 4,093,535 1,416,270 5,126 49,781 5,564,712 3.01%Seriously Emotionally Disturbed 820,119 326,751 1,146,870 0.62%Severly and Prof Handicapped 242,653 86,965 329,618 0.18%Social Sciences 4,417,909 1,511,309 1,217 41,897 5,972,332 3.23%SOL Algebra Readiness 290,935 94,273 385,208 0.21%
86

OPERATING BUDGET PROGRAM EXPENDITURES BY CATEGORY FY 2011-2012
EXPENDITURE ACCOUNTS Salaries Fringe BenefitsContract Services Other Charges
Materials & Supplies
Payments to Other Agencies Capital Contingencies
Fund Transfers FY12 Approved
Percent of Total
SOL Remediation Elementary 129,799 9,930 13,761 153,490 0.08%SOL Remediation Secondary 129,000 9,869 18,718 157,587 0.09%Special Programs 4,738,006 1,727,994 2,145,773 23,299 31,992 8,667,064 4.69%Specific Learning Disability 3,523,280 1,322,717 4,845,997 2.62%Speech or Language Impaired 1,024,086 308,767 1,332,853 0.72%Student Services 234,640 84,575 9,488 955 116 329,774 0.18%Substitute Personnel 1,959,795 73,425 2,033,220 1.10%Summer Programs 24,904 1,905 26,809 0.01%Trade and Industrial 126,657 34,643 452 6,500 168,252 0.09%Trainable Intellectually Disabled 293,386 119,463 412,849 0.22%Truancy 2,261 2,261 0.00%Unassigned (521,395) (521,395) -0.28%Visually Handicapped 146,318 53,512 199,830 0.11%Vocational Programs 106,596 36,398 1,844 964,669 40,627 1,150,134 0.62%TOTAL INSTRUCTION 92,927,849 31,351,394 3,029,345 321,498 3,888,620 1,064,474 349,498 2,449,649 0 135,382,327 73.22%
Administration, Attendance & Health Programs:Board Services 83,548 6,394 46,910 136,852 0.07%Executive Admin Services 732,273 223,172 47,000 26,735 20,229 1,049,409 0.57%Fiscal Services 600,009 233,259 381,963 3,100 12,397 1,230,728 0.67%Health Services 1,510,028 436,586 12,546 227 62,881 4,942 2,027,210 1.10%Human Resources 670,470 237,799 54,950 18,075 9,537 990,831 0.54%Instructional Accountability 265,326 76,880 2,000 576 6,877 1,356 353,015 0.19%Psychological Services 795,942 220,744 19,800 4,212 21,962 1,062,660 0.57%Public Information Services 325,336 92,468 15,951 2,500 20,611 456,866 0.25%Regular Programs 321,705 125,942 447,647 0.24%Reprographics 338,299 116,829 36,392 194 84,688 576,402 0.31%Science 4,542 4,542 0.00%Special Programs 366,848 121,991 102,926 70 591,835 0.32%Student Services 103,997 27,666 131,663 0.07%Substitue Personnel 2,590 198 2,788 0.00%Unassigned (25,733) (25,733) -0.01%TOTAL ADMINISTRATION, ATTENDANCE & HEALTH 6,116,371 1,894,195 673,528 102,529 243,794 0 6,298 0 0 9,036,715 4.89%
Pupil Transportation Programs:At-Risk-4-Year Old Program 112,000 8,568 120,568 0.07%Elementary Summer Remedial 29,000 2,219 31,219 0.02%Middle School Summer Remedial 25,000 1,913 26,913 0.01%Regular Programs 3,400 260 3,660 0.00%SOL Remediation Secondary 12,000 918 12,918 0.01%Summer Programs 5,543 424 5,967 0.00%Trans.-Maintenance Services 445,758 157,246 2,217,375 2,820,379 1.53%Trans.-Management & Direction 534,183 150,986 25,000 140,700 1,744 36,943 889,556 0.48%Trans.-Monitoring Services 663,073 61,235 724,308 0.39%Trans.-Vehicle Operation Services 3,327,686 1,492,223 62,000 80,000 4,961,909 2.68%Unassigned (32,753) (32,753) -0.02%TOTAL PUPIL TRANSPORTATION 5,157,643 1,843,239 25,000 140,700 2,281,119 0 80,000 36,943 0 9,564,644 5.17%
Operations & Maintenance Programs:Art 1,437 1,437 0.00%At Risk Four Year Olds 12,600 44,751 57,351 0.03%Business Education 40,035 5,873 2,446 48,354 0.03%Early Childhood Programs 220 194 414 0.00%Family and Consumer Science-Family Focus 5,398 1,000 6,398 0.00%Family and Consumer Science-Occupational 2,500 1,000 3,500 0.00%Fiscal Services 14,674 7,000 2,260,024 2,281,698 1.23%Gifted and Talented 977 53 1,030 0.00%Health and PE 1,500 1,500 0.00%Health Services 4,100 4,100 0.00%Homebound 600 299 899 0.00%Instructional Accountability 3,510 3,510 0.00%Library Media Services 6,000 9,056 15,056 0.01%Marketing 2,766 2,766 0.00%
87
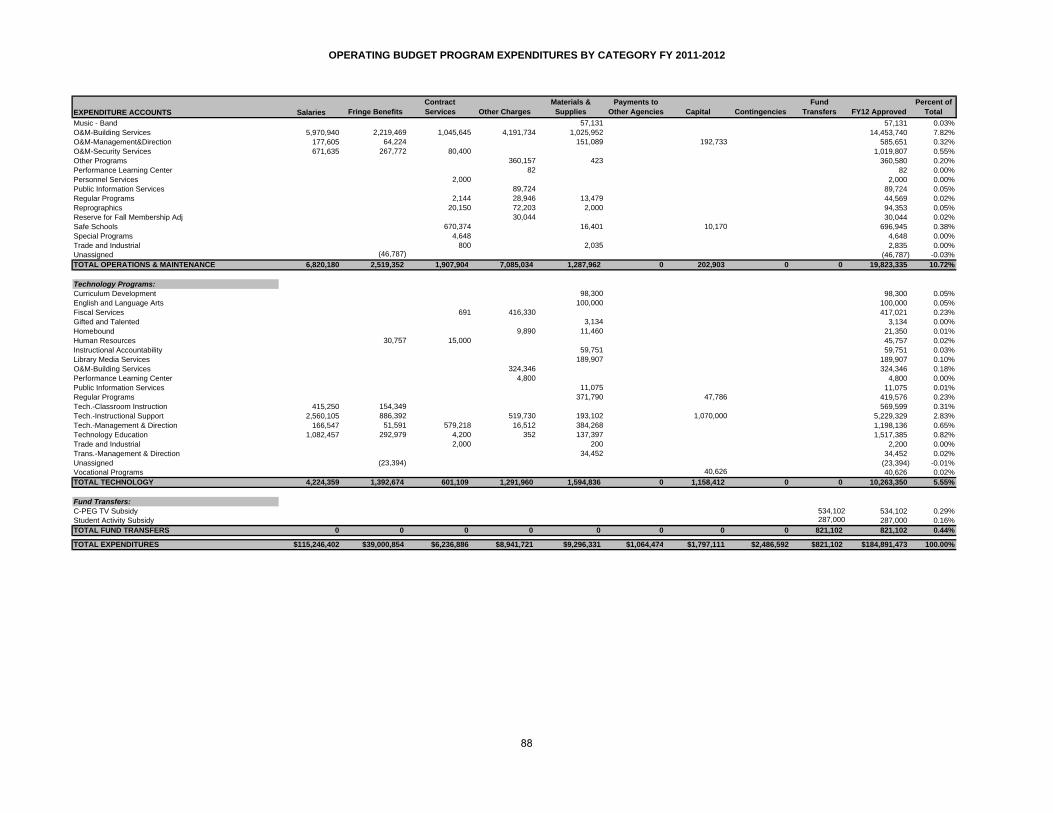
OPERATING BUDGET PROGRAM EXPENDITURES BY CATEGORY FY 2011-2012
EXPENDITURE ACCOUNTS Salaries Fringe BenefitsContract Services Other Charges
Materials & Supplies
Payments to Other Agencies Capital Contingencies
Fund Transfers FY12 Approved
Percent of Total
Music - Band 57,131 57,131 0.03%O&M-Building Services 5,970,940 2,219,469 1,045,645 4,191,734 1,025,952 14,453,740 7.82%O&M-Management&Direction 177,605 64,224 151,089 192,733 585,651 0.32%O&M-Security Services 671,635 267,772 80,400 1,019,807 0.55%Other Programs 360,157 423 360,580 0.20%Performance Learning Center 82 82 0.00%Personnel Services 2,000 2,000 0.00%Public Information Services 89,724 89,724 0.05%Regular Programs 2,144 28,946 13,479 44,569 0.02%Reprographics 20,150 72,203 2,000 94,353 0.05%Reserve for Fall Membership Adj 30,044 30,044 0.02%Safe Schools 670,374 16,401 10,170 696,945 0.38%Special Programs 4,648 4,648 0.00%Trade and Industrial 800 2,035 2,835 0.00%Unassigned (46,787) (46,787) -0.03%TOTAL OPERATIONS & MAINTENANCE 6,820,180 2,519,352 1,907,904 7,085,034 1,287,962 0 202,903 0 0 19,823,335 10.72%
Technology Programs:Curriculum Development 98,300 98,300 0.05%English and Language Arts 100,000 100,000 0.05%Fiscal Services 691 416,330 417,021 0.23%Gifted and Talented 3,134 3,134 0.00%Homebound 9,890 11,460 21,350 0.01%Human Resources 30,757 15,000 45,757 0.02%Instructional Accountability 59,751 59,751 0.03%Library Media Services 189,907 189,907 0.10%O&M-Building Services 324,346 324,346 0.18%Performance Learning Center 4,800 4,800 0.00%Public Information Services 11,075 11,075 0.01%Regular Programs 371,790 47,786 419,576 0.23%Tech.-Classroom Instruction 415,250 154,349 569,599 0.31%Tech.-Instructional Support 2,560,105 886,392 519,730 193,102 1,070,000 5,229,329 2.83%Tech.-Management & Direction 166,547 51,591 579,218 16,512 384,268 1,198,136 0.65%Technology Education 1,082,457 292,979 4,200 352 137,397 1,517,385 0.82%Trade and Industrial 2,000 200 2,200 0.00%Trans.-Management & Direction 34,452 34,452 0.02%Unassigned (23,394) (23,394) -0.01%Vocational Programs 40,626 40,626 0.02%TOTAL TECHNOLOGY 4,224,359 1,392,674 601,109 1,291,960 1,594,836 0 1,158,412 0 0 10,263,350 5.55%
Fund Transfers:C-PEG TV Subsidy 534,102 534,102 0.29%Student Activity Subsidy 287,000 287,000 0.16%TOTAL FUND TRANSFERS 0 0 0 0 0 0 0 0 821,102 821,102 0.44%
TOTAL EXPENDITURES $115,246,402 $39,000,854 $6,236,886 $8,941,721 $9,296,331 $1,064,474 $1,797,111 $2,486,592 $821,102 $184,891,473 100.00%
88

THIS PAGE INTENTIONALLY LEFT BLANK
89
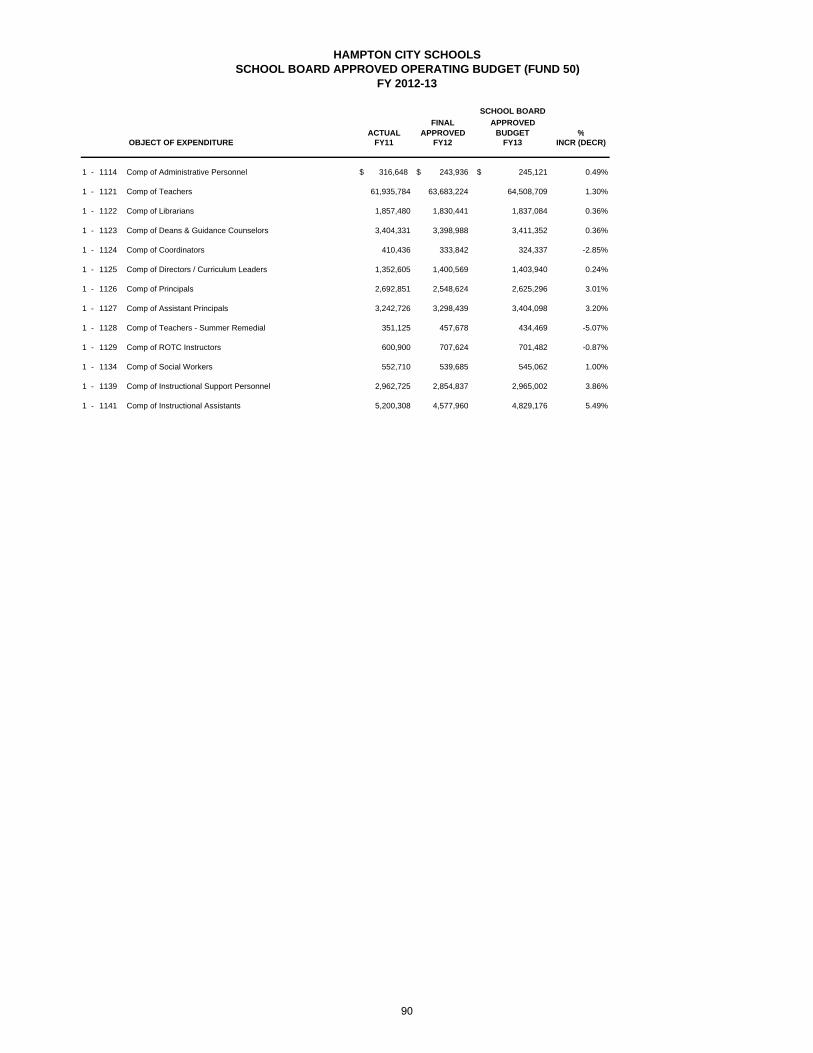
HAMPTON CITY SCHOOLSSCHOOL BOARD APPROVED OPERATING BUDGET (FUND 50)
FY 2012-13
SCHOOL BOARD
FINAL APPROVEDACTUAL APPROVED BUDGET %
OBJECT OF EXPENDITURE FY11 FY12 FY13 INCR (DECR)
1 - 1114 Comp of Administrative Personnel 316,648$ 243,936$ 245,121$ 0.49%
1 - 1121 Comp of Teachers 61,935,784 63,683,224 64,508,709 1.30%
1 - 1122 Comp of Librarians 1,857,480 1,830,441 1,837,084 0.36%
1 - 1123 Comp of Deans & Guidance Counselors 3,404,331 3,398,988 3,411,352 0.36%
1 - 1124 Comp of Coordinators 410,436 333,842 324,337 -2.85%
1 - 1125 Comp of Directors / Curriculum Leaders 1,352,605 1,400,569 1,403,940 0.24%
1 - 1126 Comp of Principals 2,692,851 2,548,624 2,625,296 3.01%
1 - 1127 Comp of Assistant Principals 3,242,726 3,298,439 3,404,098 3.20%
1 - 1128 Comp of Teachers - Summer Remedial 351,125 457,678 434,469 -5.07%
1 - 1129 Comp of ROTC Instructors 600,900 707,624 701,482 -0.87%
1 - 1134 Comp of Social Workers 552,710 539,685 545,062 1.00%
1 - 1139 Comp of Instructional Support Personnel 2,962,725 2,854,837 2,965,002 3.86%
1 - 1141 Comp of Instructional Assistants 5,200,308 4,577,960 4,829,176 5.49%
90

HAMPTON CITY SCHOOLS SCHOOL BOARD APPROVED OPERATING BUDGET (FUND 50)
FY 2012 – 2013
1 – 1114 Comp of Administrative Personnel: The increase in this line item is due to a 1%
salary increase +/- adjusted allocation based on FY12 actual costs. 1 – 1121 Comp of Teachers: The increase in this line item is due to the addition of 17 teaching
positions +/- adjusted allocation based on FY12 actual costs. This line item also includes a 1% salary increase.
1 – 1122 Comp of Librarians: The increase in this line item is due to a 1% salary increase +/-
adjusted allocation based on FY12 actual costs. 1 – 1123 Comp of Deans and Guidance Counselors: The increase in this line item is due to a
1% salary increase +/- adjusted allocation based on FY12 actual costs. 1 – 1124 Comp of Coordinators: The net decrease in this line item is due to +/- adjusted
allocation based on FY12 actual costs. This line item also includes a 1% salary increase.
1 – 1125 Comp of Directors/Curriculum Leaders: The increase in this line item is due to the
redesign of the Alternative Education Services +/- adjusted allocation based on FY12 actual costs. This line item also includes a 1% salary increase.
1 – 1126 Comp of Principals: The increase in this line item is to fund the principal position at
Moton that was funded in the Education Jobs Fund budget for FY12. This line item also includes a 1% salary increase.
1 – 1127 Comp of Assistant Principals: The increase in this line item is due to a 1% salary
increase +/- adjusted allocation based on FY12 actual costs. 1 – 1129 Comp of ROTC Instructors: The net decrease in this line item is due to +/- adjusted
allocation based on FY12 actual costs. This line item also includes a 1% salary increase.
1 – 1134 Comp of Social Workers: The increase in this line item is due to a 1% salary
increase +/- adjusted allocation based on FY12 actual costs. 1 – 1139 Comp of Instructional Support Personnel: The net increase in this line item is due
to the addition of .9 FTE or a 30% share of 3 Teacher Specialist positions (2 Mathematics, and 1 Science). Also included is 1 FTE Teacher Specialist in Language Arts. This line item also reflects the reclassification of 1 SPED Coordinator to Fund 60 +/- adjusted allocation based on FY12 actual costs. This item also includes a 1% salary increase.
1 – 1141 Comp of Instructional Assistants: The increase in this line item is due to the
addition of 14 positions based on staffing formulas and adjustments to special education based on student needs +/- adjusted allocation based on FY12 actual costs. This line item also includes a 1% salary increase.
91
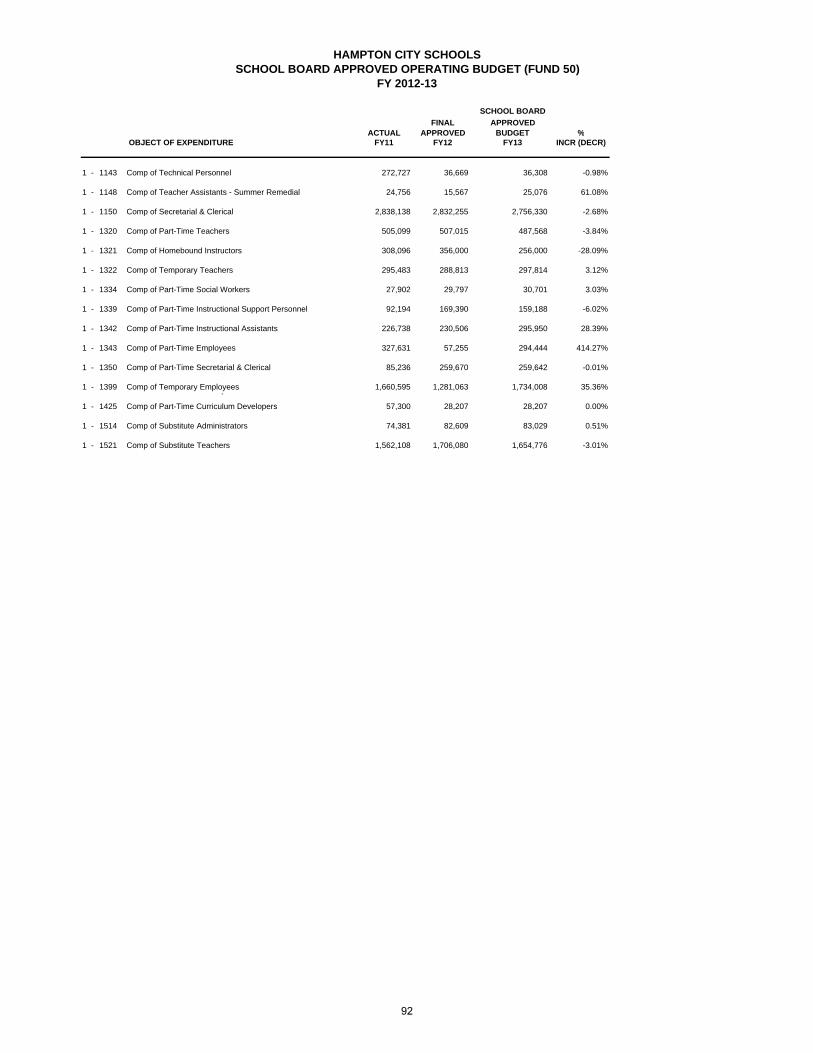
HAMPTON CITY SCHOOLSSCHOOL BOARD APPROVED OPERATING BUDGET (FUND 50)
FY 2012-13
SCHOOL BOARD
FINAL APPROVEDACTUAL APPROVED BUDGET %
OBJECT OF EXPENDITURE FY11 FY12 FY13 INCR (DECR)
1 - 1143 Comp of Technical Personnel 272,727 36,669 36,308 -0.98%
1 - 1148 Comp of Teacher Assistants - Summer Remedial 24,756 15,567 25,076 61.08%
1 - 1150 Comp of Secretarial & Clerical 2,838,138 2,832,255 2,756,330 -2.68%
1 - 1320 Comp of Part-Time Teachers 505,099 507,015 487,568 -3.84%
1 - 1321 Comp of Homebound Instructors 308,096 356,000 256,000 -28.09%
1 - 1322 Comp of Temporary Teachers 295,483 288,813 297,814 3.12%
1 - 1334 Comp of Part-Time Social Workers 27,902 29,797 30,701 3.03%
1 - 1339 Comp of Part-Time Instructional Support Personnel 92,194 169,390 159,188 -6.02%
1 - 1342 Comp of Part-Time Instructional Assistants 226,738 230,506 295,950 28.39%
1 - 1343 Comp of Part-Time Employees 327,631 57,255 294,444 414.27%
1 - 1350 Comp of Part-Time Secretarial & Clerical 85,236 259,670 259,642 -0.01%
1 - 1399 Comp of Temporary Employees 1,660,595 1,281,063 1,734,008 35.36%`
1 - 1425 Comp of Part-Time Curriculum Developers 57,300 28,207 28,207 0.00%
1 - 1514 Comp of Substitute Administrators 74,381 82,609 83,029 0.51%
1 - 1521 Comp of Substitute Teachers 1,562,108 1,706,080 1,654,776 -3.01%
92
HAMPTON CITY SCHOOLS SCHOOL BOARD APPROVED OPERATING BUDGET (FUND 50)
FY 2012 – 2013
1 – 1143 Comp of Technical Personnel: The net decrease in this line item is due to +/- adjusted allocation based on FY12 actual costs. This line item also includes a 1% salary increase.
1 – 1148 Comp of Instructional Assistants – Summer Remedial: The increase in this line
item is due to the addition of funding for the summer remedial program based on prior year actual trends.
1 – 1150 Comp of Secretarial & Clerical: The net decrease in this line item reflects the
reduction of 1 position due to the redesign of Alternative Education Services plus the addition of 1 position at Moton that was funded in the Education Jobs Fund budget for FY12 +/- adjusted allocation based on FY12 actual costs. This line item also includes a 1% salary increase.
1 – 1320 Comp of Part-Time Teachers: The decrease in this line is due to the reduction of a .5
position based on student needs +/- adjusted allocation based on FY12 actual costs. 1 – 1321 Comp of Homebound Instructors: The decrease in this line item is due to the
redesign of Alternative Education Services and the projected FY13 need. 1 – 1342 Comp of Part-Time Instructional Assistants: The increase in this line item is due to
the addition of 6 part time Instructional Assistant (3.0 FTE) for the Early Reading Intervention Program due to available state funding +/- adjusted allocation based on FY12 actual costs.
1 – 1343 Comp of Part-Time Employees: The increase in this line item is due to the addition of
54 Cafeteria Monitor positions (27 FTE) to the Operating Budget for FY13. These positions were previously funded in Education Jobs Fund. Also included in this line are 5 Early Reading Intervention Assistants (2.5 FTE) due to additional state funding provided in the Early Reading Intervention Program.
1 – 1350 Comp of Part-Time Secretarial & Clerical: The decrease in this line item is due to
the reduction of 1 (.5 FTE) Office Assistant due to the closure of Merrimack plus the addition of 1 position (.5 FTE) at Moton that was funded in the Education Jobs Fund budget for FY12+/- adjusted allocation based on FY12 actual costs.
1 – 1399 Comp of Temporary Personnel: The increase in this line item is due to the addition
of National Board Certified Teacher and Elementary and Middle School Instructional Leader Supplements to the Operating Budget for FY13. These supplements were previously funded in Education Jobs Fund.
1 – 1521 Comp of Substitute Teachers: The decrease in this line is based on FY11 and FY12
spending trends and FY13 projections.
93
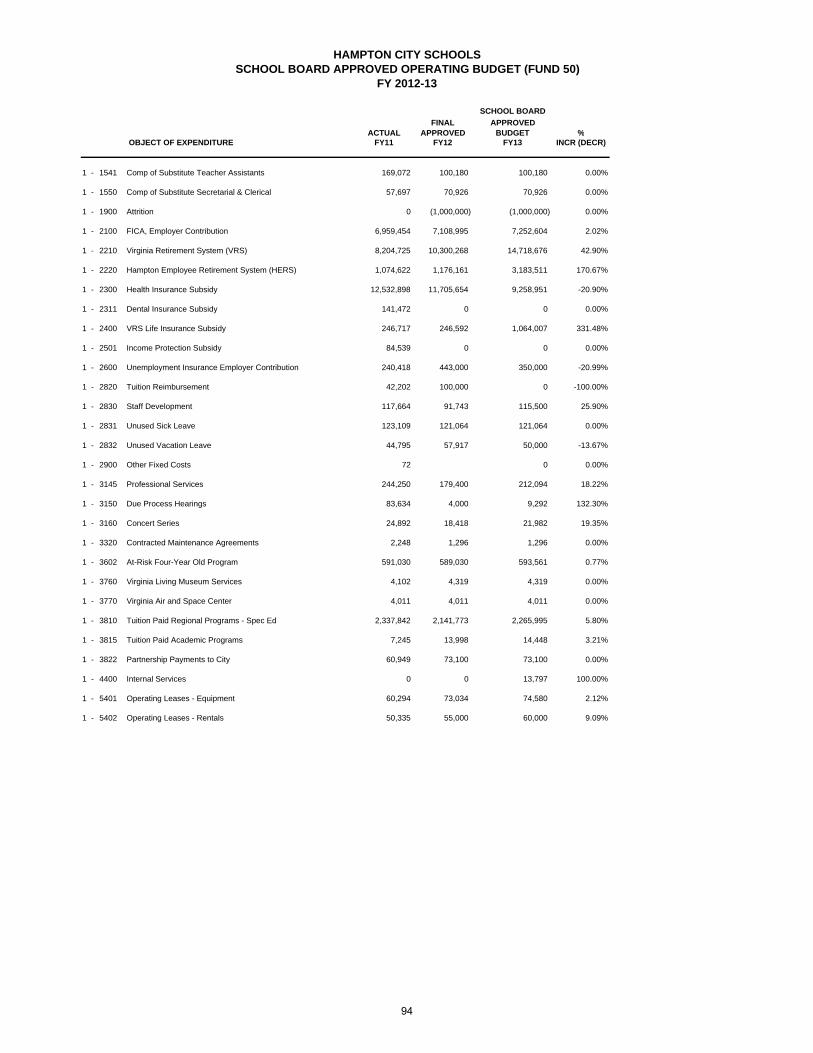
HAMPTON CITY SCHOOLSSCHOOL BOARD APPROVED OPERATING BUDGET (FUND 50)
FY 2012-13
SCHOOL BOARD
FINAL APPROVEDACTUAL APPROVED BUDGET %
OBJECT OF EXPENDITURE FY11 FY12 FY13 INCR (DECR)
1 - 1541 Comp of Substitute Teacher Assistants 169,072 100,180 100,180 0.00%
1 - 1550 Comp of Substitute Secretarial & Clerical 57,697 70,926 70,926 0.00%
1 - 1900 Attrition 0 (1,000,000) (1,000,000) 0.00%
1 - 2100 FICA, Employer Contribution 6,959,454 7,108,995 7,252,604 2.02%
1 - 2210 Virginia Retirement System (VRS) 8,204,725 10,300,268 14,718,676 42.90%
1 - 2220 Hampton Employee Retirement System (HERS) 1,074,622 1,176,161 3,183,511 170.67%
1 - 2300 Health Insurance Subsidy 12,532,898 11,705,654 9,258,951 -20.90%
1 - 2311 Dental Insurance Subsidy 141,472 0 0 0.00%
1 - 2400 VRS Life Insurance Subsidy 246,717 246,592 1,064,007 331.48%
1 - 2501 Income Protection Subsidy 84,539 0 0 0.00%
1 - 2600 Unemployment Insurance Employer Contribution 240,418 443,000 350,000 -20.99%
1 - 2820 Tuition Reimbursement 42,202 100,000 0 -100.00%
1 - 2830 Staff Development 117,664 91,743 115,500 25.90%
1 - 2831 Unused Sick Leave 123,109 121,064 121,064 0.00%
1 - 2832 Unused Vacation Leave 44,795 57,917 50,000 -13.67%
1 - 2900 Other Fixed Costs 72 0 0.00%
1 - 3145 Professional Services 244,250 179,400 212,094 18.22%
1 - 3150 Due Process Hearings 83,634 4,000 9,292 132.30%
1 - 3160 Concert Series 24,892 18,418 21,982 19.35%
1 - 3320 Contracted Maintenance Agreements 2,248 1,296 1,296 0.00%
1 - 3602 At-Risk Four-Year Old Program 591,030 589,030 593,561 0.77%
1 - 3760 Virginia Living Museum Services 4,102 4,319 4,319 0.00%
1 - 3770 Virginia Air and Space Center 4,011 4,011 4,011 0.00%
1 - 3810 Tuition Paid Regional Programs - Spec Ed 2,337,842 2,141,773 2,265,995 5.80%
1 - 3815 Tuition Paid Academic Programs 7,245 13,998 14,448 3.21%
1 - 3822 Partnership Payments to City 60,949 73,100 73,100 0.00%
1 - 4400 Internal Services 0 0 13,797 100.00%
1 - 5401 Operating Leases - Equipment 60,294 73,034 74,580 2.12%
1 - 5402 Operating Leases - Rentals 50,335 55,000 60,000 9.09%
94

HAMPTON CITY SCHOOLS SCHOOL BOARD APPROVED OPERATING BUDGET (FUND 50)
FY 2012 – 2013
1 – 2210 Virginia Retirement System (VRS): The net increase in this line item is due to an increase in the funded VRS rate from 11.93% to 16.77%. In addition, 1% of the VRS employee share has been passed on to the employee that was previously paid by HCS. A minimum of 1% will be passed on each year until 2016 when the employee will be responsible for the entire 5% employee share.
1 – 2220 Hampton Employees Retirement System (HERS): The increase in this line item is
due a new actuarial report and sets funding for a two year period. 1 – 2300 Health Insurance Subsidy: The decrease in this line item is due to a 2 month
premium holiday to be funded with program reserves +/- adjustments for actual employee enrollment under the HCS health insurance program.
1 – 2400 VRS Life Insurance Subsidy: The increase in this line item is due to an increase in
the funded group life employer rate from .28% to 1.19%. 1 – 2600 Unemployment Insurance: The decrease in this line item reflects FY13 anticipated
costs based on trends over the past three years. 1 – 2820 Tuition Reimbursement: The decrease in this line item is due to the elimination of
tuition reimbursement for provisional teachers in Fund 50. 1 – 2830 Staff Development: The increase in this line item reflects funding that has been
included to cover the loss of Title II Part D staff development that was previously included in Fund 60.
1 – 2832 Unused Vacation Leave: The decrease in this line item reflects FY13 anticipated
costs based on trends over the past three years. 1 – 3145 Professional Services: The increase in this line is a reallocation of funds from
Compensation of Temporary Employees 1-1399 to cover the cost of AVID tutors. 1 – 3150 Due Process Hearings: The increase in this line item is a reallocation of funds from
within the Special Ed budget to cover anticipated costs. 1 – 3160 Concert Series: The increase in this line item is due to the reallocation of costs from
Compensation of Temporary Employees (1-1399) in the Fine Arts Department to cover anticipated programs.
1 – 3810 Tuition Paid Regional Programs – Spec Ed: Funding in this line item is based on
projected student enrollment and tuition costs for FY13 as per the proposed NHREC FY13 budget and projected costs for SECEP.
1 – 4400 Internal Services: The increase in this line item is for funding included to cover the
cost of internal printing services in the Science Department. 1 – 5402 Operating Lease – Rentals: The increase in this line item is to cover a projected
increase in the fee for the Hampton Coliseum for graduation exercises.
95
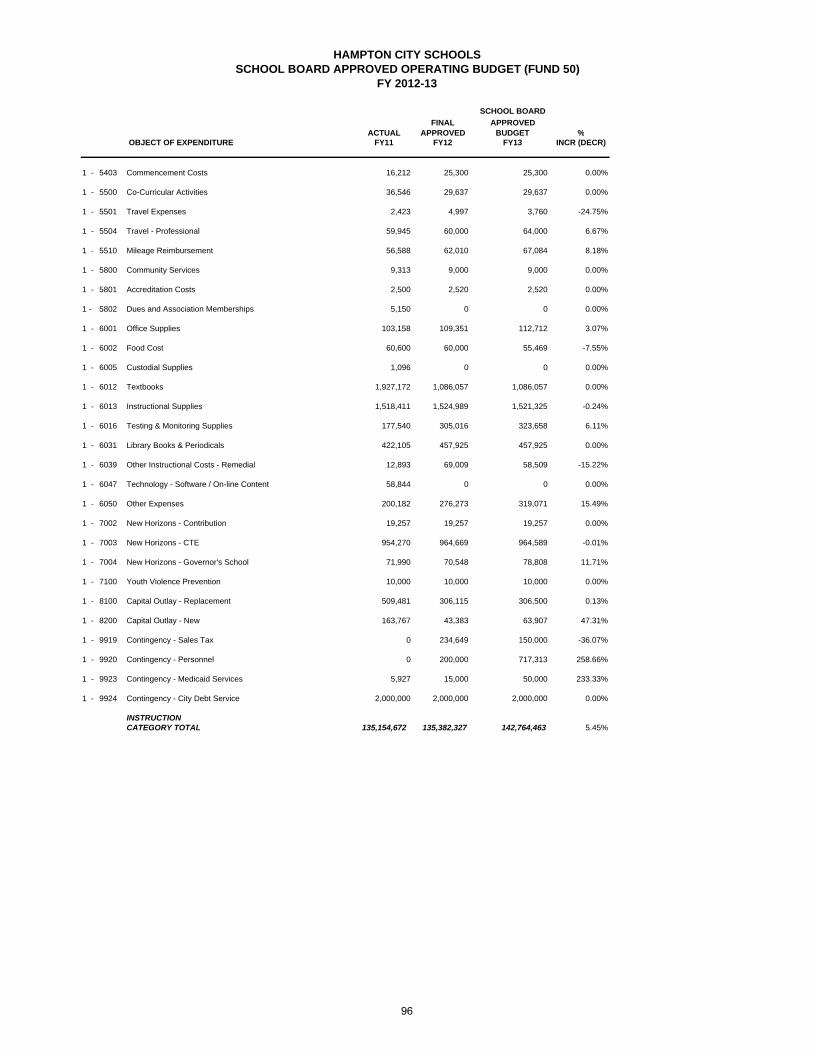
HAMPTON CITY SCHOOLSSCHOOL BOARD APPROVED OPERATING BUDGET (FUND 50)
FY 2012-13
SCHOOL BOARD
FINAL APPROVEDACTUAL APPROVED BUDGET %
OBJECT OF EXPENDITURE FY11 FY12 FY13 INCR (DECR)
1 - 5403 Commencement Costs 16,212 25,300 25,300 0.00%
1 - 5500 Co-Curricular Activities 36,546 29,637 29,637 0.00%
1 - 5501 Travel Expenses 2,423 4,997 3,760 -24.75%
1 - 5504 Travel - Professional 59,945 60,000 64,000 6.67%
1 - 5510 Mileage Reimbursement 56,588 62,010 67,084 8.18%
1 - 5800 Community Services 9,313 9,000 9,000 0.00%
1 - 5801 Accreditation Costs 2,500 2,520 2,520 0.00%
1 - 5802 Dues and Association Memberships 5,150 0 0 0.00%
1 - 6001 Office Supplies 103,158 109,351 112,712 3.07%
1 - 6002 Food Cost 60,600 60,000 55,469 -7.55%
1 - 6005 Custodial Supplies 1,096 0 0 0.00%
1 - 6012 Textbooks 1,927,172 1,086,057 1,086,057 0.00%
1 - 6013 Instructional Supplies 1,518,411 1,524,989 1,521,325 -0.24%
1 - 6016 Testing & Monitoring Supplies 177,540 305,016 323,658 6.11%
1 - 6031 Library Books & Periodicals 422,105 457,925 457,925 0.00%
1 - 6039 Other Instructional Costs - Remedial 12,893 69,009 58,509 -15.22%
1 - 6047 Technology - Software / On-line Content 58,844 0 0 0.00%
1 - 6050 Other Expenses 200,182 276,273 319,071 15.49%
1 - 7002 New Horizons - Contribution 19,257 19,257 19,257 0.00%
1 - 7003 New Horizons - CTE 954,270 964,669 964,589 -0.01%
1 - 7004 New Horizons - Governor's School 71,990 70,548 78,808 11.71%
1 - 7100 Youth Violence Prevention 10,000 10,000 10,000 0.00%
1 - 8100 Capital Outlay - Replacement 509,481 306,115 306,500 0.13%
1 - 8200 Capital Outlay - New 163,767 43,383 63,907 47.31%
1 - 9919 Contingency - Sales Tax 0 234,649 150,000 -36.07%
1 - 9920 Contingency - Personnel 0 200,000 717,313 258.66%
1 - 9923 Contingency - Medicaid Services 5,927 15,000 50,000 233.33%
1 - 9924 Contingency - City Debt Service 2,000,000 2,000,000 2,000,000 0.00%
INSTRUCTIONCATEGORY TOTAL 135,154,672 135,382,327 142,764,463 5.45%
96
HAMPTON CITY SCHOOLS SCHOOL BOARD APPROVED OPERATING BUDGET (FUND 50)
FY 2012 – 2013
1 – 5501 Travel Expenses: The decrease in this line item is due to requested departmental
reductions. 1 – 5510 Mileage Reimbursement: The increase in this line item is to add funding for the CITT
positions. 1 – 6039 Other Instructional Costs – Remedial: The decrease in this line item is due to a
requested departmental reduction. 1 – 6050 Other Expenses: The increase in this line item is due to the addition of funding for
the Summer Bridge Program. 1 – 7004 New Horizons – Governor’s School: The increase in this line item is based on
projected student enrollment and tuition costs for FY13 as per the proposed NHREC budget.
1 – 8200 Capital Outlay – New: The increase in this line item is due to the relocation and
redesign of Alternative Education services. 1 – 9919 Contingency – Sales Tax: This item is included in the budget to safeguard against
fluctuations in sales tax projections due to economic conditions. The reduction is based on fluctuations being less than projected.
1 – 9920 Contingency - Personnel: This item is included in the budget to cover the hiring of
additional teachers and/or IA’s when enrollment is higher than projected, ensuring that we protect our class sizes, especially at the K-3 level.
1 – 9923 Contingency – Medicaid Services: The increase in appropriation reflects fees
associated with projected Medicaid revenue collections. 1 – 9924 Contingency – City Debt Service: This line item represents funds due to the City of
Hampton for FY 12-13 debt service for building construction.
97
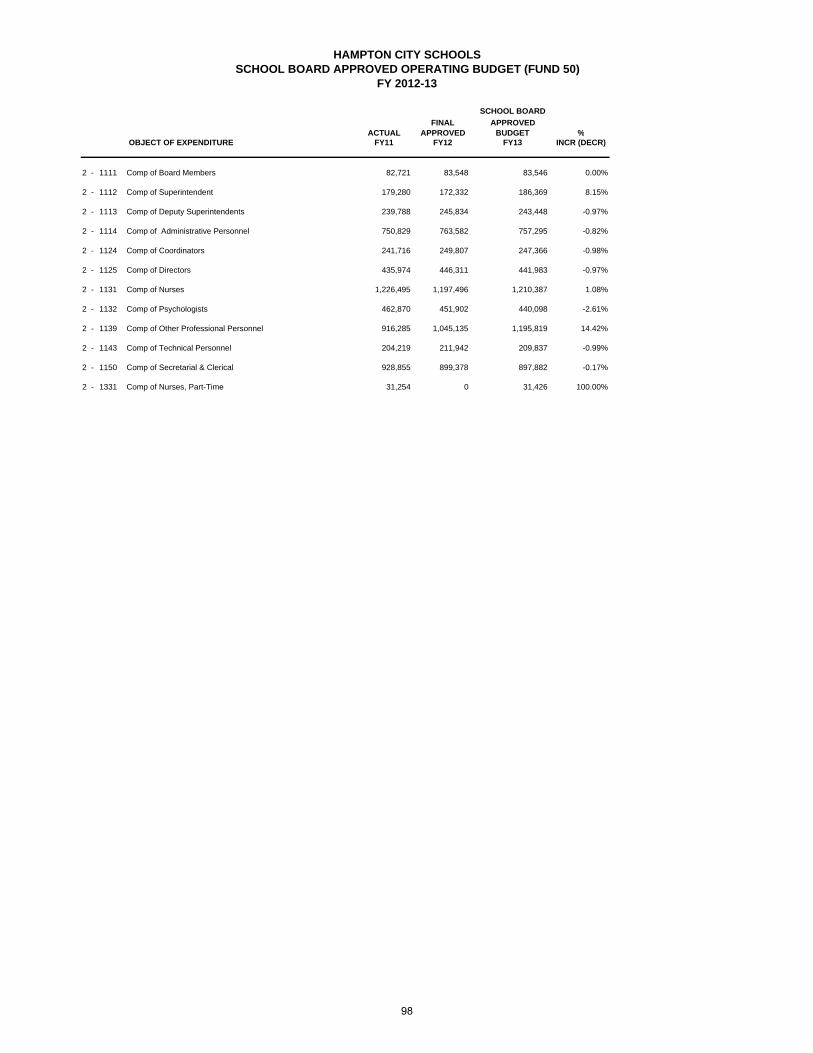
HAMPTON CITY SCHOOLSSCHOOL BOARD APPROVED OPERATING BUDGET (FUND 50)
FY 2012-13
SCHOOL BOARD
FINAL APPROVEDACTUAL APPROVED BUDGET %
OBJECT OF EXPENDITURE FY11 FY12 FY13 INCR (DECR)
2 - 1111 Comp of Board Members 82,721 83,548 83,546 0.00%
2 - 1112 Comp of Superintendent 179,280 172,332 186,369 8.15%
2 - 1113 Comp of Deputy Superintendents 239,788 245,834 243,448 -0.97%
2 - 1114 Comp of Administrative Personnel 750,829 763,582 757,295 -0.82%
2 - 1124 Comp of Coordinators 241,716 249,807 247,366 -0.98%
2 - 1125 Comp of Directors 435,974 446,311 441,983 -0.97%
2 - 1131 Comp of Nurses 1,226,495 1,197,496 1,210,387 1.08%
2 - 1132 Comp of Psychologists 462,870 451,902 440,098 -2.61%
2 - 1139 Comp of Other Professional Personnel 916,285 1,045,135 1,195,819 14.42%
2 - 1143 Comp of Technical Personnel 204,219 211,942 209,837 -0.99%
2 - 1150 Comp of Secretarial & Clerical 928,855 899,378 897,882 -0.17%
2 - 1331 Comp of Nurses, Part-Time 31,254 0 31,426 100.00%
98
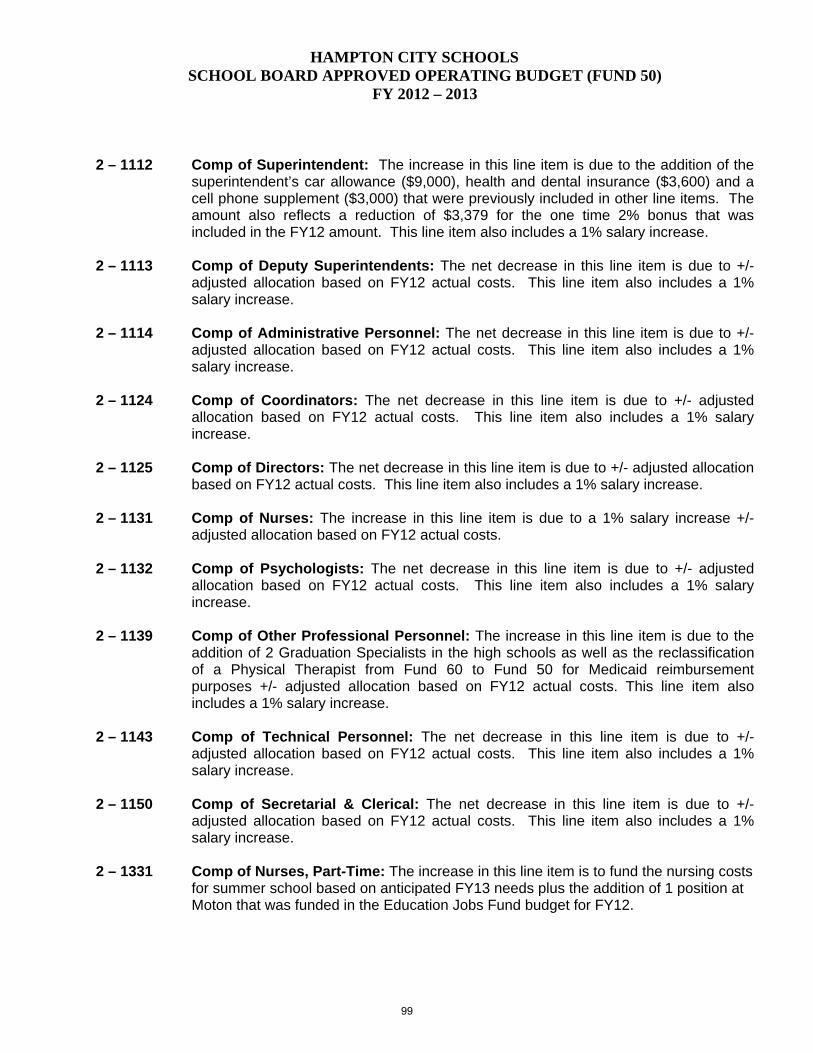
HAMPTON CITY SCHOOLS SCHOOL BOARD APPROVED OPERATING BUDGET (FUND 50)
FY 2012 – 2013
2 – 1112 Comp of Superintendent: The increase in this line item is due to the addition of the
superintendent’s car allowance ($9,000), health and dental insurance ($3,600) and a cell phone supplement ($3,000) that were previously included in other line items. The amount also reflects a reduction of $3,379 for the one time 2% bonus that was included in the FY12 amount. This line item also includes a 1% salary increase.
2 – 1113 Comp of Deputy Superintendents: The net decrease in this line item is due to +/-
adjusted allocation based on FY12 actual costs. This line item also includes a 1% salary increase.
2 – 1114 Comp of Administrative Personnel: The net decrease in this line item is due to +/-
adjusted allocation based on FY12 actual costs. This line item also includes a 1% salary increase.
2 – 1124 Comp of Coordinators: The net decrease in this line item is due to +/- adjusted
allocation based on FY12 actual costs. This line item also includes a 1% salary increase.
2 – 1125 Comp of Directors: The net decrease in this line item is due to +/- adjusted allocation
based on FY12 actual costs. This line item also includes a 1% salary increase. 2 – 1131 Comp of Nurses: The increase in this line item is due to a 1% salary increase +/-
adjusted allocation based on FY12 actual costs. 2 – 1132 Comp of Psychologists: The net decrease in this line item is due to +/- adjusted
allocation based on FY12 actual costs. This line item also includes a 1% salary increase.
2 – 1139 Comp of Other Professional Personnel: The increase in this line item is due to the
addition of 2 Graduation Specialists in the high schools as well as the reclassification of a Physical Therapist from Fund 60 to Fund 50 for Medicaid reimbursement purposes +/- adjusted allocation based on FY12 actual costs. This line item also includes a 1% salary increase.
2 – 1143 Comp of Technical Personnel: The net decrease in this line item is due to +/-
adjusted allocation based on FY12 actual costs. This line item also includes a 1% salary increase.
2 – 1150 Comp of Secretarial & Clerical: The net decrease in this line item is due to +/-
adjusted allocation based on FY12 actual costs. This line item also includes a 1% salary increase.
2 – 1331 Comp of Nurses, Part-Time: The increase in this line item is to fund the nursing costs
for summer school based on anticipated FY13 needs plus the addition of 1 position at Moton that was funded in the Education Jobs Fund budget for FY12.
99

HAMPTON CITY SCHOOLSSCHOOL BOARD APPROVED OPERATING BUDGET (FUND 50)
FY 2012-13
SCHOOL BOARD
FINAL APPROVEDACTUAL APPROVED BUDGET %
OBJECT OF EXPENDITURE FY11 FY12 FY13 INCR (DECR)
2 - 1339 Comp of Other Professional Personnel - Part-Time 108,670 141,950 130,434 -8.11%
2 - 1343 Comp of Part-Time Employees 22,064 29,767 29,180 -1.97%
2 - 1350 Comp of Part-Time Secretarial & Clerical 79,763 91,631 92,097 0.51%
2 - 1399 Comp of Temporary Employees 65,805 52,166 51,519 -1.24%
2 - 1531 Comp of Substitute Nurses 35,053 31,000 31,000 0.00%
2 - 1550 Comp of Substitute Secretarial & Clerical 58 2,590 2,590 0.00%
2 - 2100 FICA, Employer Contribution 437,473 467,901 481,493 2.90%
2 - 2210 Virginia Retirement System (VRS) 504,162 668,535 949,062 41.96%
2 - 2300 Health Insurance Subsidy 665,964 646,222 522,793 -19.10%
2 - 2311 Dental Insurance Subsidy 15,894 0 0 0.00%
2 - 2400 VRS Life Insurance Subsidy 15,913 15,674 69,084 340.76%
2 - 2501 Income Protection Subsidy 4,678 0 0 0.00%
2 - 2831 Unused Sick Leave 18,180 5,811 15,000 158.13%
2 - 2832 Unused Vacation Leave 19,869 15,496 15,496 0.00%
2 - 2834 Employee Assistance Program 33,480 33,600 33,600 0.00%
2 - 2900 Other Fixed Costs 36,925 40,956 40,956 0.00%
2 - 3100 Contracted OSHA Expenses 1,675 12,546 8,000 -36.23%
2 - 3111 Contracted Testing 0 19,800 19,800 0.00%
2 - 3112 Contracted Medical Expenses - Spec Ed 51,947 102,926 102,926 0.00%
2 - 3113 Contracted Background Checks 11,897 15,000 1,000 -93.33%
2 - 3140 Consultant Services 30,187 29,950 29,950 0.00%
2 - 3145 Contracted Professional Services 180,829 209,800 150,830 -28.11%
2 - 3190 Census, Surveys & Reports 0 20,000 0 -100.00%
2 - 3500 Contracted Printing Costs 15,893 36,392 34,392 -5.50%
2 - 3610 Advertisements 10,597 10,000 7,500 -25.00%
2 - 3612 Public Relations 18,785 15,951 15,951 0.00%
2 - 3821 Payment to City for Purchasing 201,414 201,163 221,867 10.29%
2 - 5501 Travel Expenses 15,237 18,916 14,416 -23.79%
2 - 5504 Travel Expenses - Professional 3,993 11,085 11,085 0.00%
2 - 5505 Travel - School Board 13,321 19,264 19,264 0.00%
2 - 5510 Mileage Reimbursement 5,253 5,729 7,864 37.27%

HAMPTON CITY SCHOOLS SCHOOL BOARD APPROVED OPERATING BUDGET (FUND 50)
FY 2012 – 2013
2 – 1339 Comp of Other Professional Personnel, Part-Time: The decrease in this line item is to the elimination of a vacant part time physical therapist position.
2 – 2210 Virginia Retirement System (VRS): Virginia Retirement System (VRS): The net
increase in this line item is due to an increase in the funded VRS rate from 11.93% to 16.77%. In addition, 1% of the VRS employee share has been passed on to the employee that was previously paid by HCS. A minimum of 1% will be passed on each year until 2016 when the employee will be responsible for the entire 5% employee share.
2 – 2300 Health Insurance Subsidy: The decrease in this line item is due to a 2 month
premium holiday to be funded with program reserves +/- adjustments for actual employee enrollment under the HCS health insurance program.
2 – 2400 VRS Life Insurance Subsidy: The increase in this line item is due to an increase in
the funded group life employer rate from .28% to 1.19%. 2 – 2831 Unused Sick Leave: The increase in this line item reflects FY13 anticipated costs
based on trends over the past three years. 2 – 3100 Contracted OSHA Expenses: The decrease in this line item is due to requested
departmental reductions. 2 – 3113 Contracted Background Checks: The decrease in this line item is due to a shift in
funding for background checks. Prospective employees will be required to pay for their own background check. A minimal amount has been left in the account to cover applicants who are not hired.
2 – 3145 Professional Services: The decrease in this line item is due to a change in Student
Activity Fund accounting software. This software will be implemented for the FY13 school year. Additional costs savings were achieved due to a change in our flexible benefits administrator for FY13.
2 – 3190 Census, Surveys & Reports: The triennial census is no longer required and these
funds are therefore no longer necessary. 2 – 3610 Advertisements: The decrease in this line item is due to a requested departmental
reduction based on an increase in online advertising in place of print advertising. 2 – 3821 Payment to City for Purchasing: Funds in this line item pay for Procurement
Services which are shared with the City of Hampton. This information is provided by the City.
2 – 5510 Travel Expenses: The increase in this line item is to add funding for the Graduation
Specialist positions. 2 – 5802 Membership and Association Dues: The increase in this line item reflects projected
spending for FY12 and anticipated costs for FY13.

HAMPTON CITY SCHOOLSSCHOOL BOARD APPROVED OPERATING BUDGET (FUND 50)
FY 2012-13
SCHOOL BOARD
FINAL APPROVEDACTUAL APPROVED BUDGET %
OBJECT OF EXPENDITURE FY11 FY12 FY13 INCR (DECR)
2 - 5802 Membership & Association Dues 52,366 47,535 54,762 15.20%
2 - 6001 Office Supplies 15,473 29,620 29,620 0.00%
2 - 6004 Medical Supplies 42,251 53,514 40,922 -23.53%
2 - 6010 OSHA Supplies 23,661 29,131 29,131 0.00%
2 - 6011 Other Operating Supplies 7,369 8,232 8,232 0.00%
2 - 6014 Books, Subscriptions & Microfilm 0 1,000 1,000 0.00%
2 - 6040 Print Shop Supplies 65,757 76,456 41,638 -45.54%
2 - 6047 Technology - Software / On-line Content 4,775 0 0 0.00%
2 - 6050 Other Expenses 37,990 45,841 47,350 3.29%
2 - 8100 Capital Outlay - Replacement 10,750 4,942 4,942 0.00%
2 - 8200 Capital Outlay - New 5,779 1,356 1,356 0.00%
ADMINISTRATION / ATTENDANCE & HEALTHCATEGORY TOTAL 8,591,435 9,036,715 9,313,557 3.06%
HAMPTON CITY SCHOOLS SCHOOL BOARD APPROVED OPERATING BUDGET (FUND 50)
FY 2012 – 2013
2 – 5802 Membership and Association Dues: The increase in this line item reflects projected spending for FY12 and anticipated costs for FY13.
2 – 6004 Medical Supplies: The decrease in this line item is due to a requested departmental
reduction. 2 – 6040 Print Shop Supplies: The decrease in this line item is due to a requested
departmental reduction based on the addition of online benchmarks which will require less printing.
103
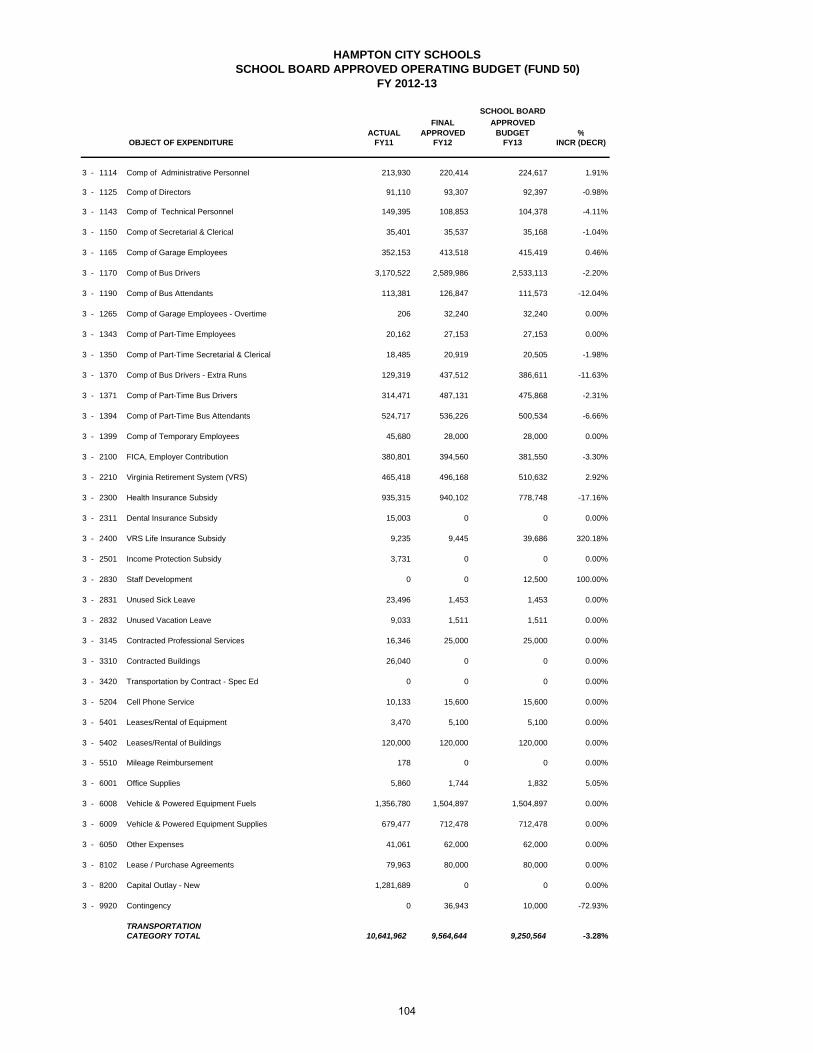
HAMPTON CITY SCHOOLSSCHOOL BOARD APPROVED OPERATING BUDGET (FUND 50)
FY 2012-13
SCHOOL BOARD
FINAL APPROVEDACTUAL APPROVED BUDGET %
OBJECT OF EXPENDITURE FY11 FY12 FY13 INCR (DECR)
3 - 1114 Comp of Administrative Personnel 213,930 220,414 224,617 1.91%
3 - 1125 Comp of Directors 91,110 93,307 92,397 -0.98%
3 - 1143 Comp of Technical Personnel 149,395 108,853 104,378 -4.11%
3 - 1150 Comp of Secretarial & Clerical 35,401 35,537 35,168 -1.04%
3 - 1165 Comp of Garage Employees 352,153 413,518 415,419 0.46%
3 - 1170 Comp of Bus Drivers 3,170,522 2,589,986 2,533,113 -2.20%
3 - 1190 Comp of Bus Attendants 113,381 126,847 111,573 -12.04%
3 - 1265 Comp of Garage Employees - Overtime 206 32,240 32,240 0.00%
3 - 1343 Comp of Part-Time Employees 20,162 27,153 27,153 0.00%
3 - 1350 Comp of Part-Time Secretarial & Clerical 18,485 20,919 20,505 -1.98%
3 - 1370 Comp of Bus Drivers - Extra Runs 129,319 437,512 386,611 -11.63%
3 - 1371 Comp of Part-Time Bus Drivers 314,471 487,131 475,868 -2.31%
3 - 1394 Comp of Part-Time Bus Attendants 524,717 536,226 500,534 -6.66%
3 - 1399 Comp of Temporary Employees 45,680 28,000 28,000 0.00%
3 - 2100 FICA, Employer Contribution 380,801 394,560 381,550 -3.30%
3 - 2210 Virginia Retirement System (VRS) 465,418 496,168 510,632 2.92%
3 - 2300 Health Insurance Subsidy 935,315 940,102 778,748 -17.16%
3 - 2311 Dental Insurance Subsidy 15,003 0 0 0.00%
3 - 2400 VRS Life Insurance Subsidy 9,235 9,445 39,686 320.18%
3 - 2501 Income Protection Subsidy 3,731 0 0 0.00%
3 - 2830 Staff Development 0 0 12,500 100.00%
3 - 2831 Unused Sick Leave 23,496 1,453 1,453 0.00%
3 - 2832 Unused Vacation Leave 9,033 1,511 1,511 0.00%
3 - 3145 Contracted Professional Services 16,346 25,000 25,000 0.00%
3 - 3310 Contracted Buildings 26,040 0 0 0.00%
3 - 3420 Transportation by Contract - Spec Ed 0 0 0 0.00%
3 - 5204 Cell Phone Service 10,133 15,600 15,600 0.00%
3 - 5401 Leases/Rental of Equipment 3,470 5,100 5,100 0.00%
3 - 5402 Leases/Rental of Buildings 120,000 120,000 120,000 0.00%
3 - 5510 Mileage Reimbursement 178 0 0 0.00%
3 - 6001 Office Supplies 5,860 1,744 1,832 5.05%
3 - 6008 Vehicle & Powered Equipment Fuels 1,356,780 1,504,897 1,504,897 0.00%
3 - 6009 Vehicle & Powered Equipment Supplies 679,477 712,478 712,478 0.00%
3 - 6050 Other Expenses 41,061 62,000 62,000 0.00%
3 - 8102 Lease / Purchase Agreements 79,963 80,000 80,000 0.00%
3 - 8200 Capital Outlay - New 1,281,689 0 0 0.00%
3 - 9920 Contingency 0 36,943 10,000 -72.93%
TRANSPORTATIONCATEGORY TOTAL 10,641,962 9,564,644 9,250,564 -3.28%
104
HAMPTON CITY SCHOOLS SCHOOL BOARD APPROVED OPERATING BUDGET (FUND 50)
FY 2012 – 2013
3 – 1114 Comp of Administrative Personnel: The increase in this line item is due to a 1% salary increase +/- adjusted allocation based on FY12 actual costs.
3 – 1125 Comp of Directors: The net decrease in this line item is due to +/- adjusted allocation
based on FY12 actual costs. This line item also includes a 1% salary increase. 3 – 1143 Comp of Technical Personnel: The net decrease in this line item is due to +/-
adjusted allocation based on FY12 actual costs. This line item also includes a 1% salary increase.
3 – 1150 Comp of Secretarial & Clerical: The net decrease in this line item is due to +/-
adjusted allocation based on FY12 actual costs. This line item also includes a 1% salary increase.
3 – 1165 Comp of Garage Employees: The increase in this line item is due to a 1% salary
increase +/- adjusted allocation based on FY12 actual costs. 3 – 1170 Comp of Bus Drivers: The net decrease in this line item is due to the elimination of 4
vacant Bus Driver positions +/- adjusted allocation based on FY12 actual costs. This line item also includes a 1% salary increase.
3 – 1190 Comp of Bus Attendants: The net decrease in this line item is based on projected
spending for FY12. This line item also includes a 1% salary increase. 3 – 1370 Comp of Bus Drivers – Extra Runs: The decrease in this line item is based on the
reallocation of funds to Professional Development. 3 – 1394 Comp of Part Time Bus Attendants: The decrease in this line item is due to the
reduction of 1 (.5 FTE) part time bus attendant based on projected FY13 needs. 3 – 2210 Virginia Retirement System (VRS): The net increase in this line item is due to an
increase in the funded VRS rate from 11.93% to 16.77%. In addition, 1% of the VRS employee share has been passed on to the employee that was previously paid by HCS. A minimum of 1% will be passed on each year until 2016 when the employee will be responsible for the entire 5% employee share.
3 – 2300 Health Insurance Subsidy: The decrease in this line item is due to a 2 month
premium holiday to be funded with program reserves +/- adjustments for actual employee enrollment under the HCS health insurance program.
3 – 2400 VRS Life Insurance Subsidy: The increase in this line item is due to an increase in
the funded group life employer rate from .28% to 1.19%. 3 – 2830 Staff Development: The increase in this line item is due to funding added for NAPT
and VAPT conferences as well as Edulog training updates. 3 – 9920 Contingency: This item is included in the budget to safeguard against unexpected
expenditure pressures.
105
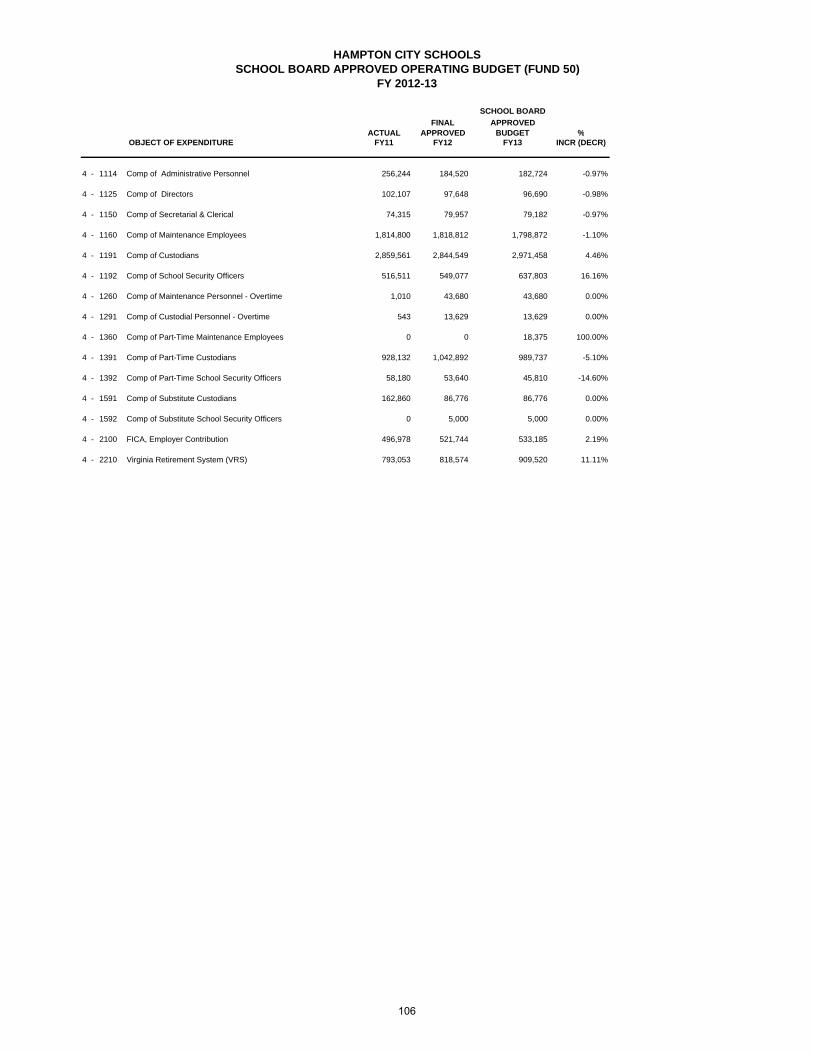
HAMPTON CITY SCHOOLSSCHOOL BOARD APPROVED OPERATING BUDGET (FUND 50)
FY 2012-13
SCHOOL BOARD
FINAL APPROVEDACTUAL APPROVED BUDGET %
OBJECT OF EXPENDITURE FY11 FY12 FY13 INCR (DECR)
4 - 1114 Comp of Administrative Personnel 256,244 184,520 182,724 -0.97%
4 - 1125 Comp of Directors 102,107 97,648 96,690 -0.98%
4 - 1150 Comp of Secretarial & Clerical 74,315 79,957 79,182 -0.97%
4 - 1160 Comp of Maintenance Employees 1,814,800 1,818,812 1,798,872 -1.10%
4 - 1191 Comp of Custodians 2,859,561 2,844,549 2,971,458 4.46%
4 - 1192 Comp of School Security Officers 516,511 549,077 637,803 16.16%
4 - 1260 Comp of Maintenance Personnel - Overtime 1,010 43,680 43,680 0.00%
4 - 1291 Comp of Custodial Personnel - Overtime 543 13,629 13,629 0.00%
4 - 1360 Comp of Part-Time Maintenance Employees 0 0 18,375 100.00%
4 - 1391 Comp of Part-Time Custodians 928,132 1,042,892 989,737 -5.10%
4 - 1392 Comp of Part-Time School Security Officers 58,180 53,640 45,810 -14.60%
4 - 1591 Comp of Substitute Custodians 162,860 86,776 86,776 0.00%
4 - 1592 Comp of Substitute School Security Officers 0 5,000 5,000 0.00%
4 - 2100 FICA, Employer Contribution 496,978 521,744 533,185 2.19%
4 - 2210 Virginia Retirement System (VRS) 793,053 818,574 909,520 11.11%
106
HAMPTON CITY SCHOOLS SCHOOL BOARD APPROVED OPERATING BUDGET (FUND 50)
FY 2012 – 2013
4 - 1114 Comp of Administrative Personnel: The net decrease in this line item is due to +/-
adjusted allocation based on FY12 actual costs. This line item also includes a 1% salary increase.
4 – 1125 Comp of Directors: The net decrease in this line item is due to +/- adjusted allocation
based on FY12 actual costs. This line item also includes a 1% salary increase. 4 – 1150 Comp of Secretarial & Clerical: The net decrease in this line item is due to +/-
adjusted allocation based on FY12 actual costs. This line item also includes a 1% salary increase.
4 – 1160 Comp of Maintenance Employees: The net decrease in this line item is due to the
elimination of a Laborer position and the addition of 2 Energy Specialists +/- adjusted allocation based on FY12 actual costs. There are no costs associated with the Energy Specialist positions as they are to be reimbursed per the proposed HCS agreement with Energy Education, Inc. This line item also includes a 1% salary increase.
4 – 1191 Comp of Custodians: The increase in this line item is to fund the 2 custodian
positions at Moton that were funded in the Education Jobs Fund budget for FY12. This line item also reflects the addition of 2 custodian positions for the relocation and redesign of Alternative Education Services +/- adjusted allocation based on FY12 actual costs. This line item also includes a 1% salary increase.
4 – 1192 Comp of School Security Officers: The increase in this line item reflects the addition
of 5 School Security Officer positions which were funded in Ed Jobs during FY12 +/- adjusted allocation based on FY12 actual costs. This line item also includes a 1% salary increase.
4 – 1360 Comp of Part-Time Maintenance Employees: The increase in this line item is due to
the addition of a part time (.5 FTE) Lead Groundskeeper position per the HCS cooperative agreement with the City of Hampton to maintain school grounds and athletic fields.
4 – 1391 Comp of Part Time Custodians: The decrease in this line item is due to the
reclassification of 1.5 part time FTE into 1 full time FTE Lead Custodian I (see 4-1191) for the relocation and redesign of Alternative Education services +/- adjusted allocation based on FY12 actual costs.
4 – 1392 Comp of Part Time School Security Officers: The decrease in this line item is
due to the +/- adjusted allocation based on FY12 actual costs. 4 – 2210 Virginia Retirement System (VRS): The net increase in this line item is due to an
increase in the funded VRS rate from 11.93% to 16.77%. In addition, 1% of the VRS employee share has been passed on to the employee that was previously paid by HCS. A minimum of 1% will be passed on each year until 2016 when the employee will be responsible for the entire 5% employee share.
107
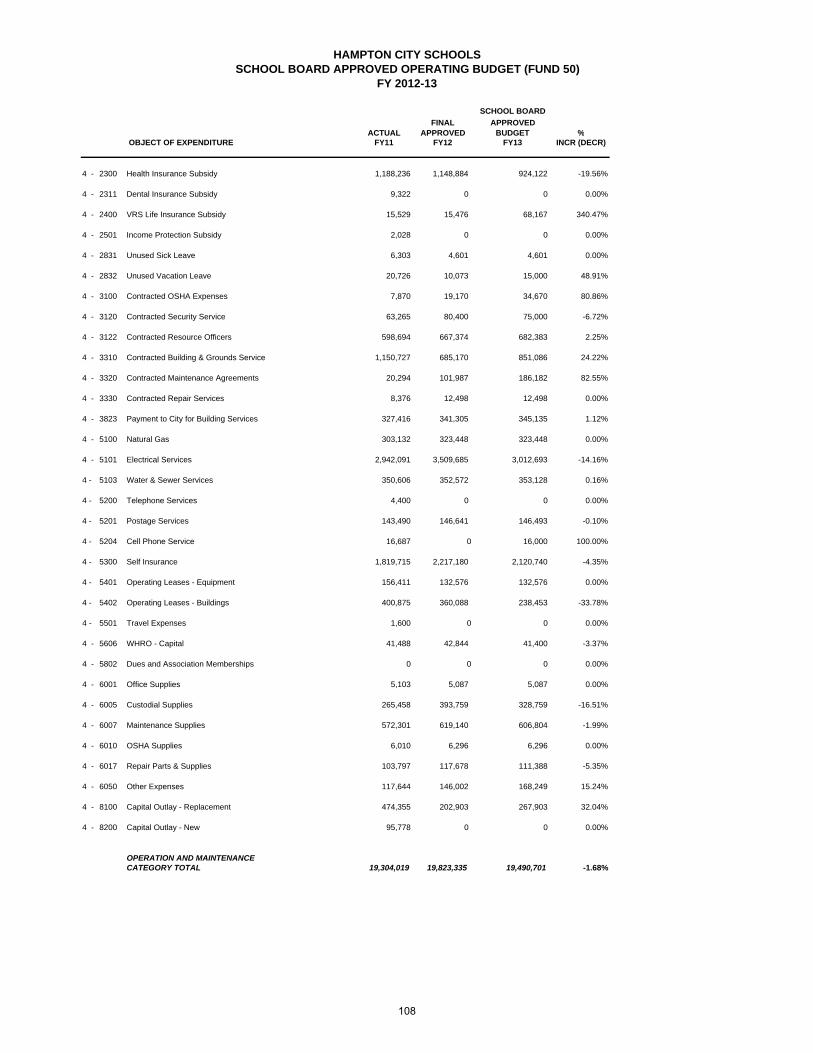
HAMPTON CITY SCHOOLSSCHOOL BOARD APPROVED OPERATING BUDGET (FUND 50)
FY 2012-13
SCHOOL BOARD
FINAL APPROVEDACTUAL APPROVED BUDGET %
OBJECT OF EXPENDITURE FY11 FY12 FY13 INCR (DECR)
4 - 2300 Health Insurance Subsidy 1,188,236 1,148,884 924,122 -19.56%
4 - 2311 Dental Insurance Subsidy 9,322 0 0 0.00%
4 - 2400 VRS Life Insurance Subsidy 15,529 15,476 68,167 340.47%
4 - 2501 Income Protection Subsidy 2,028 0 0 0.00%
4 - 2831 Unused Sick Leave 6,303 4,601 4,601 0.00%
4 - 2832 Unused Vacation Leave 20,726 10,073 15,000 48.91%
4 - 3100 Contracted OSHA Expenses 7,870 19,170 34,670 80.86%
4 - 3120 Contracted Security Service 63,265 80,400 75,000 -6.72%
4 - 3122 Contracted Resource Officers 598,694 667,374 682,383 2.25%
4 - 3310 Contracted Building & Grounds Service 1,150,727 685,170 851,086 24.22%
4 - 3320 Contracted Maintenance Agreements 20,294 101,987 186,182 82.55%
4 - 3330 Contracted Repair Services 8,376 12,498 12,498 0.00%
4 - 3823 Payment to City for Building Services 327,416 341,305 345,135 1.12%
4 - 5100 Natural Gas 303,132 323,448 323,448 0.00%
4 - 5101 Electrical Services 2,942,091 3,509,685 3,012,693 -14.16%
4 - 5103 Water & Sewer Services 350,606 352,572 353,128 0.16%
4 - 5200 Telephone Services 4,400 0 0 0.00%
4 - 5201 Postage Services 143,490 146,641 146,493 -0.10%
4 - 5204 Cell Phone Service 16,687 0 16,000 100.00%
4 - 5300 Self Insurance 1,819,715 2,217,180 2,120,740 -4.35%
4 - 5401 Operating Leases - Equipment 156,411 132,576 132,576 0.00%
4 - 5402 Operating Leases - Buildings 400,875 360,088 238,453 -33.78%
4 - 5501 Travel Expenses 1,600 0 0 0.00%
4 - 5606 WHRO - Capital 41,488 42,844 41,400 -3.37%
4 - 5802 Dues and Association Memberships 0 0 0 0.00%
4 - 6001 Office Supplies 5,103 5,087 5,087 0.00%
4 - 6005 Custodial Supplies 265,458 393,759 328,759 -16.51%
4 - 6007 Maintenance Supplies 572,301 619,140 606,804 -1.99%
4 - 6010 OSHA Supplies 6,010 6,296 6,296 0.00%
4 - 6017 Repair Parts & Supplies 103,797 117,678 111,388 -5.35%
4 - 6050 Other Expenses 117,644 146,002 168,249 15.24%
4 - 8100 Capital Outlay - Replacement 474,355 202,903 267,903 32.04%
4 - 8200 Capital Outlay - New 95,778 0 0 0.00%
OPERATION AND MAINTENANCECATEGORY TOTAL 19,304,019 19,823,335 19,490,701 -1.68%
108

HAMPTON CITY SCHOOLS SCHOOL BOARD APPROVED OPERATING BUDGET (FUND 50)
FY 2012 – 2013
4 – 2300 Health Insurance Subsidy: The decrease in this line item is due to a 2 month premium holiday to be funded with program reserves +/- adjustments for actual employee enrollment under the HCS health insurance program.
4 – 2400 VRS Life Insurance Subsidy: The increase in this line item is due to an increase in
the funded group life employer rate from .28% to 1.19%. 4 – 2832 Unused Vacation Leave: The increase in this line item reflects FY13 anticipated costs
based on trends over the past three years. 4 – 3100 Contracted OSHA Expenses: The increase in this line item reflects a reallocation of
costs from 4 - 3310 – Contracted Building and Grounds Services for environmental testing.
4 – 3310 Contracted Building and Grounds Service: The net increase in this line is due to
funding included per the HCS cooperative agreement with the City of Hampton to maintain our grounds and athletic fields as well as a reallocation of costs to 4-3100 – Contracted OSHA Expenses. This line item also includes funds reallocated from 4-5402 – Operating Leases-Buildings for the termination of a lease as well as costs to support the relocation and redesign of Alternative Education Services.
4 – 3320 Contracted Maintenance Agreements: The net increase in this line item is due to
savings on contracted maintenance by moving benchmark testing online, as well as the schools’ cost share to reimburse the city for the annual maintenance agreement on hand held radios.
4 – 5101 Electrical Services: The decrease in this line item is due to lower than expected
trends in cost as well as a projected savings by implementing a proposed energy conservation program.
4 – 5204 Cell Phone Services: The increase in this line item represents a reallocation of funds
from 4-6007 – Maintenance Supplies to cover the cost of phones used by maintenance personnel.
4 – 5402 Operating Leases - Buildings: This line item reflects the elimination of a lease. 4 – 6005 Custodial Supplies: The decrease in this line item reflects a reallocation of funds to
4-8100 – Capital Outlay Replacement. 4 – 6050 Other Expenses: This line item pays for contractual dumpster and recycling services. 4 – 8100 Capital Outlay - Replacement: The increase in this line item reflects a reallocation of
funds from 4-6005 – Custodial Supplies.
109
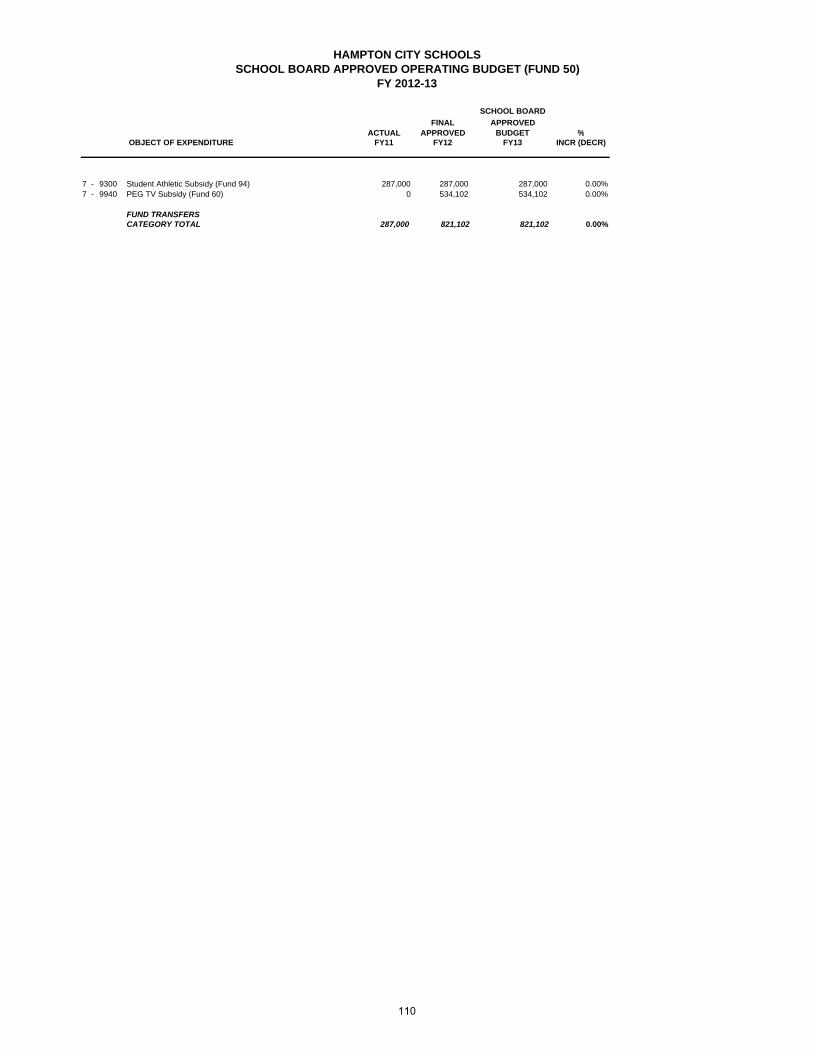
HAMPTON CITY SCHOOLSSCHOOL BOARD APPROVED OPERATING BUDGET (FUND 50)
FY 2012-13
SCHOOL BOARD
FINAL APPROVEDACTUAL APPROVED BUDGET %
OBJECT OF EXPENDITURE FY11 FY12 FY13 INCR (DECR)
7 - 9300 Student Athletic Subsidy (Fund 94) 287,000 287,000 287,000 0.00%7 - 9940 PEG TV Subsidy (Fund 60) 0 534,102 534,102 0.00%
FUND TRANSFERSCATEGORY TOTAL 287,000 821,102 821,102 0.00%
110

HAMPTON CITY SCHOOLS SCHOOL BOARD APPROVED OPERATING BUDGET (FUND 50)
FY 2012 – 2013
7 – 9300 Student Athletic Subsidy (Fund 94): This line item provides support for student athletics in all middle and high schools.
7 – 9940 PEG TV Subsidy (Fund 60): This line item represents the HCS portion of the subsidy
to fund the joint project with the City of Hampton for Community Television Services.
111
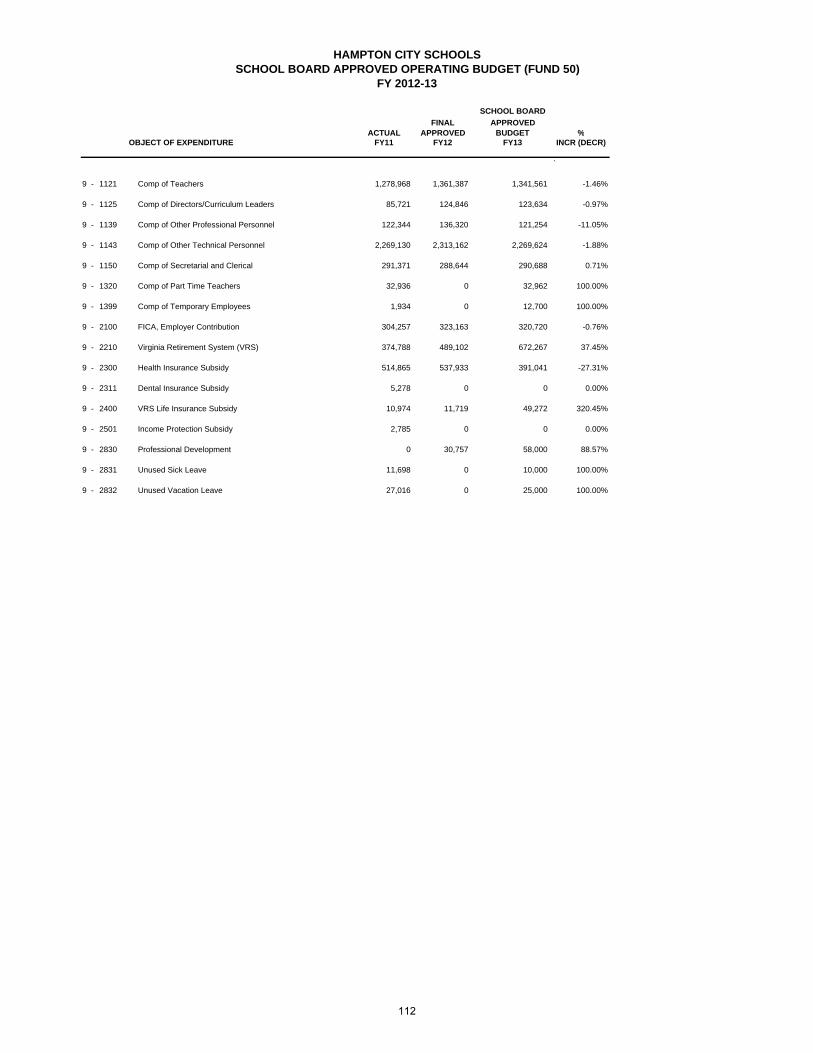
HAMPTON CITY SCHOOLSSCHOOL BOARD APPROVED OPERATING BUDGET (FUND 50)
FY 2012-13
SCHOOL BOARD
FINAL APPROVEDACTUAL APPROVED BUDGET %
OBJECT OF EXPENDITURE FY11 FY12 FY13 INCR (DECR)
`
9 - 1121 Comp of Teachers 1,278,968 1,361,387 1,341,561 -1.46%
9 - 1125 Comp of Directors/Curriculum Leaders 85,721 124,846 123,634 -0.97%
9 - 1139 Comp of Other Professional Personnel 122,344 136,320 121,254 -11.05%
9 - 1143 Comp of Other Technical Personnel 2,269,130 2,313,162 2,269,624 -1.88%
9 - 1150 Comp of Secretarial and Clerical 291,371 288,644 290,688 0.71%
9 - 1320 Comp of Part Time Teachers 32,936 0 32,962 100.00%
9 - 1399 Comp of Temporary Employees 1,934 0 12,700 100.00%
9 - 2100 FICA, Employer Contribution 304,257 323,163 320,720 -0.76%
9 - 2210 Virginia Retirement System (VRS) 374,788 489,102 672,267 37.45%
9 - 2300 Health Insurance Subsidy 514,865 537,933 391,041 -27.31%
9 - 2311 Dental Insurance Subsidy 5,278 0 0 0.00%
9 - 2400 VRS Life Insurance Subsidy 10,974 11,719 49,272 320.45%
9 - 2501 Income Protection Subsidy 2,785 0 0 0.00%
9 - 2830 Professional Development 0 30,757 58,000 88.57%
9 - 2831 Unused Sick Leave 11,698 0 10,000 100.00%
9 - 2832 Unused Vacation Leave 27,016 0 25,000 100.00%
112

HAMPTON CITY SCHOOLS SCHOOL BOARD APPROVED OPERATING BUDGET (FUND 50)
FY 2012 – 2013
9 – 1121 Comp of Teachers: The net decrease in this line item is due to the reduction of 1 teaching position +/- adjusted allocation based on FY12 actual costs. This line item also includes a 1% salary increase.
9 – 1125 Comp of Directors/Curriculum Leaders: The net decrease in this line item is due to
the reduction of 1 teaching position +/- adjusted allocation based on FY12 actual costs. This line item also includes a 1% salary increase.
9 – 1139 Comp of Other Professional Personnel: The net decrease in this line item is due
primarily to adjusted allocations based on FY12 actual costs. This line item also includes a 1% salary increase.
9 – 1143 Comp of Other Technical Personnel: The net decrease in this line item is due
primarily to adjusted allocations based on FY12 actual costs. This line item also includes a 1% salary increase.
9 – 1150 Comp of Secretarial & Clerical: The increase in this line item is due to a 1% salary
increase +/- adjusted allocation based on FY12 actual costs. 9 – 1320 Comp of Part-Time Teachers: The increase in this line item reflects the addition of 1
(.5 FTE) teacher position. 9 – 1399 Comp of Temporary Personnel: The increase in this line item is due to the addition
of National Board Certified Teacher and Elementary and Middle School Instructional Leader Supplements to the Operating Budget for FY13. These supplements were previously funded in Education Jobs Fund.
9 – 2210 Virginia Retirement System (VRS): The net increase in this line item is due to an
increase in the funded VRS rate from 11.93% to 16.77%. In addition, 1% of the VRS employee share has been passed on to the employee that was previously paid by HCS. A minimum of 1% will be passed on each year until 2016 when the employee will be responsible for the entire 5% employee share.
9 – 2300 Health Insurance Subsidy: The decrease in this line item is due to a 2 month
premium holiday to be funded with program reserves +/- adjustments for actual employee enrollment under the HCS health insurance program.
9 – 2400 VRS Life Insurance Subsidy: The increase in this line item is due to an increase in
the funded group life employer rate from .28% to 1.19%. 9 – 2830 Professional Development: This line item reflects funding to provide professional
development for technology staff. Funds were reallocated from 3-1370 – Extra Runs. 9 – 2831 Unused Sick Leave: The increase in this line item reflects FY13 anticipated costs
based on trends over the past three years. 9 – 2832 Unused Vacation Leave: The increase in this line item reflects FY13 anticipated costs
based on trends over the past three years.
113

HAMPTON CITY SCHOOLSSCHOOL BOARD APPROVED OPERATING BUDGET (FUND 50)
FY 2012-13
SCHOOL BOARD
FINAL APPROVEDACTUAL APPROVED BUDGET %
OBJECT OF EXPENDITURE FY11 FY12 FY13 INCR (DECR)
9 - 3145 Professional Services 335,992 579,218 579,218 0.00%
9 - 3320 Contracted Maintenance Agreements 14,355 15,000 15,000 0.00%
9 - 3330 Contracted Repair Service 779 6,200 6,200 0.00%
9 - 3820 Data Processing Payments to City 0 691 750 8.54%
9 - 5200 Telephone Service 259,672 324,346 324,346 0.00%
9 - 5204 Cell Phone Service 5,252 0 0 0.00%
9 - 5205 Communication Technology 379,241 420,420 420,420 0.00%
9 - 5401 Leases/Rental of Equipment 519,816 530,330 530,330 0.00%
9 - 5501 Travel Expenses 347 352 0 -100.00%
9 - 5510 Mileage Reimbursement 3,142 5,012 5,000 -0.24%
9 - 5604 Contribution - WHRO 11,500 11,500 11,500 0.00%
9 - 6001 Office Supplies 2,506 5,758 5,750 -0.14%
9 - 6013 Instructional Supplies 52,572 117,029 38,642 -66.98%
9 - 6016 Testing and Monitoring Supplies 17,112 18,622 31,180 67.44%
9 - 6017 Repair Parts and Supplies 243,550 195,048 196,946 0.97%
9 - 6047 Technology - Software/On-Line Content 1,024,944 1,255,003 1,185,886 -5.51%
9 - 6049 Data Processing Supplies 2,245 1,633 1,630 -0.18%
9 - 6050 Other Expenses 1,250 1,743 1,745 0.11%
9 - 8000 Equipment - Instructional 4,330,720 1,070,000 1,037,500 -3.04%
9 - 8100 Capital Outlay - Replacement 82,917 40,626 40,626 0.00%
9 - 8200 Capital Outlay - New 1,183,034 47,786 117,377 145.63%
TECHNOLOGYCATEGORY TOTAL 13,805,008 10,263,350 10,268,769 0.05%
ALL CATEGORIESGRAND TOTALS 187,784,097 184,891,473 191,909,156 3.80%
114
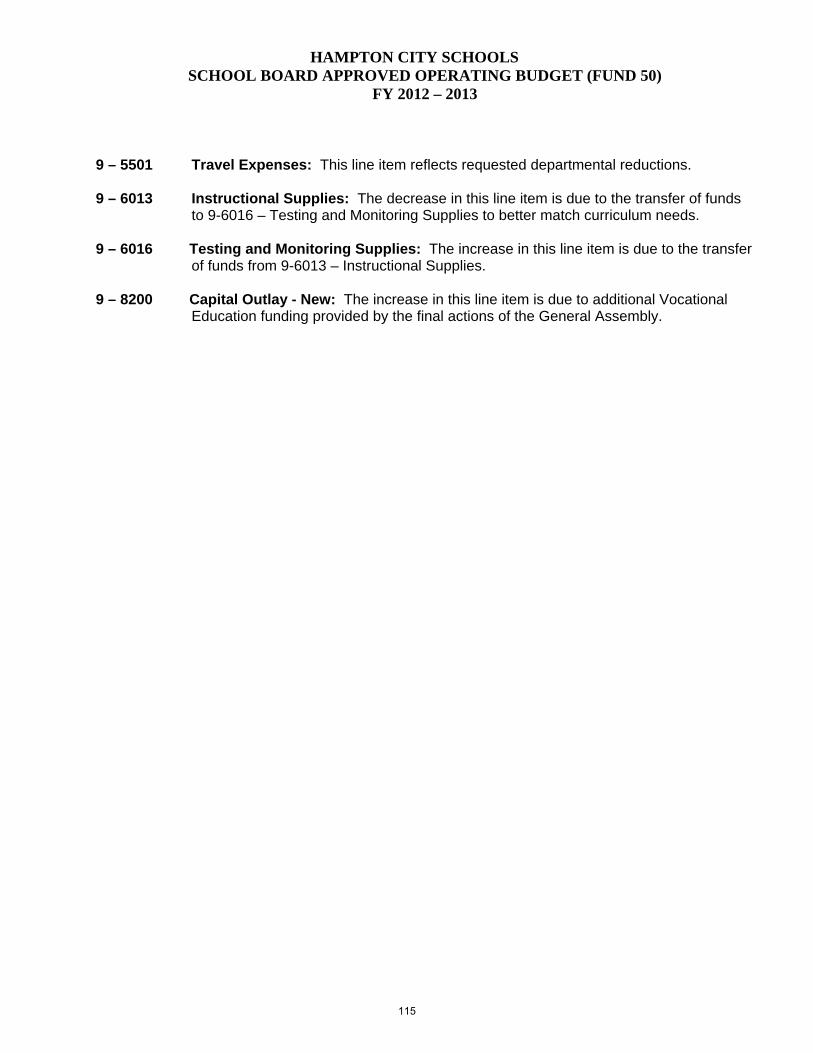
HAMPTON CITY SCHOOLS SCHOOL BOARD APPROVED OPERATING BUDGET (FUND 50)
FY 2012 – 2013
9 – 5501 Travel Expenses: This line item reflects requested departmental reductions. 9 – 6013 Instructional Supplies: The decrease in this line item is due to the transfer of funds
to 9-6016 – Testing and Monitoring Supplies to better match curriculum needs. 9 – 6016 Testing and Monitoring Supplies: The increase in this line item is due to the transfer
of funds from 9-6013 – Instructional Supplies. 9 – 8200 Capital Outlay - New: The increase in this line item is due to additional Vocational
Education funding provided by the final actions of the General Assembly.
115

THIS PAGE INTENTIONALLY LEFT BLANK
116
OPERATING BUDGET
EXPENSES BY PROGRAM
2012 - 2013
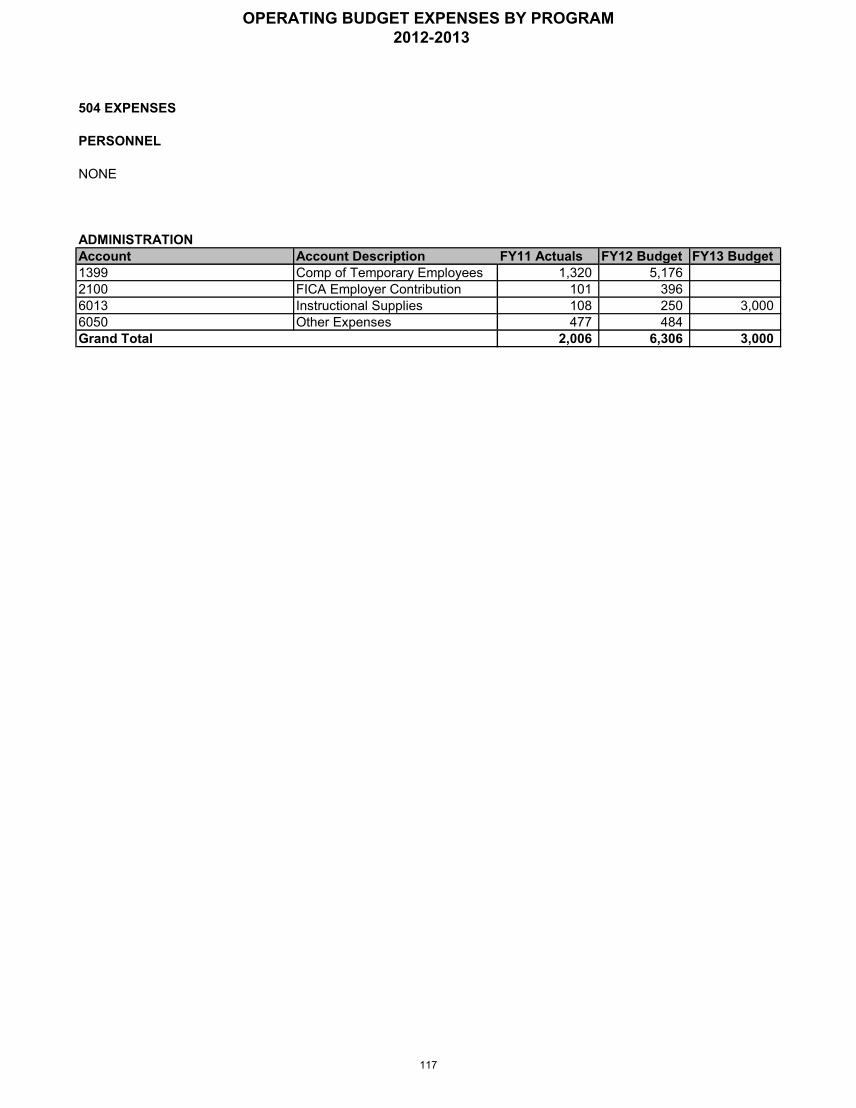
504 EXPENSES
PERSONNEL
NONE
ADMINISTRATIONAccount Account Description FY11 Actuals FY12 Budget FY13 Budget1399 Comp of Temporary Employees 1,320 5,1762100 FICA Employer Contribution 101 3966013 Instructional Supplies 108 250 3,0006050 Other Expenses 477 484Grand Total 2,006 6,306 3,000
OPERATING BUDGET EXPENSES BY PROGRAM 2012-2013
117

ART
PERSONNEL FY12 Actual FY13 Budget Change
Teacher - Elementary 19.00 19.00 0.00Teacher - Secondary 24.50 25.50 1.00
Total 43.50 44.50 1.00
ELEMENTARYAccount Account Description FY11 Actuals FY12 Budget FY13 Budget1121 Comp of Teachers 856,775 821,736 820,4852100 FICA Employer Contribution 63,086 62,865 62,7652210 Virginia Retirement System 81,099 97,977 135,9502300 Health Insurance Subsidy 99,460 99,220 82,5782311 Dental Insurance Subsidy 1,9532400 Virginia Retirement System Life Insurance Subsidy 2,395 2,300 9,7562501 Income Protection Subsidy 742Grand Total 1,105,510 1,084,098 1,111,534
MIDDLEAccount Account Description FY11 Actuals FY12 Budget FY13 Budget1121 Comp of Teachers 388,190 431,181 421,2611320 Comp of Part Time Teachers 19,2502100 FICA Employer Contribution 28,933 32,986 33,6982210 Virginia Retirement System 36,692 51,387 69,0922300 Health Insurance Subsidy 47,772 47,030 43,4392311 Dental Insurance Subsidy 5052400 Virginia Retirement System Life Insurance Subsidy 1,089 1,207 5,011Grand Total 503,180 563,791 591,751
HIGHAccount Account Description FY11 Actuals FY12 Budget FY13 Budget1121 Comp of Teachers 595,158 608,945 670,1451320 Comp of Part Time Teachers 19786 19,7982100 FICA Employer Contribution 45,406 48,099 51,2642210 Virginia Retirement System 58,437 72,647 107,7182300 Health Insurance Subsidy 78,074 87,463 70,5242400 Virginia Retirement System Life Insurance Subsidy 1,717 1,703 7,9752501 Income Protection Subsidy 712Grand Total 799,290 838,655 907,626
ADMINISTRATIONAccount Account Description FY11 Actuals FY12 Budget FY13 Budget6013 Instructional Supplies 108,120 84,788 85,2206017 Repair Parts and Supplies 1,437 1,2206047 Technology - Software / On-Line Content 2,514 2,2636050 Other Expenses 1,3418100 Capital Outlay - Replacement 9,0008200 Capital Outlay - New 12,302Grand Total 130,763 88,739 88,703
GRAND TOTAL ART 2,538,743 2,575,283 2,699,614
OPERATING BUDGET EXPENSES BY PROGRAM 2012-2013
118
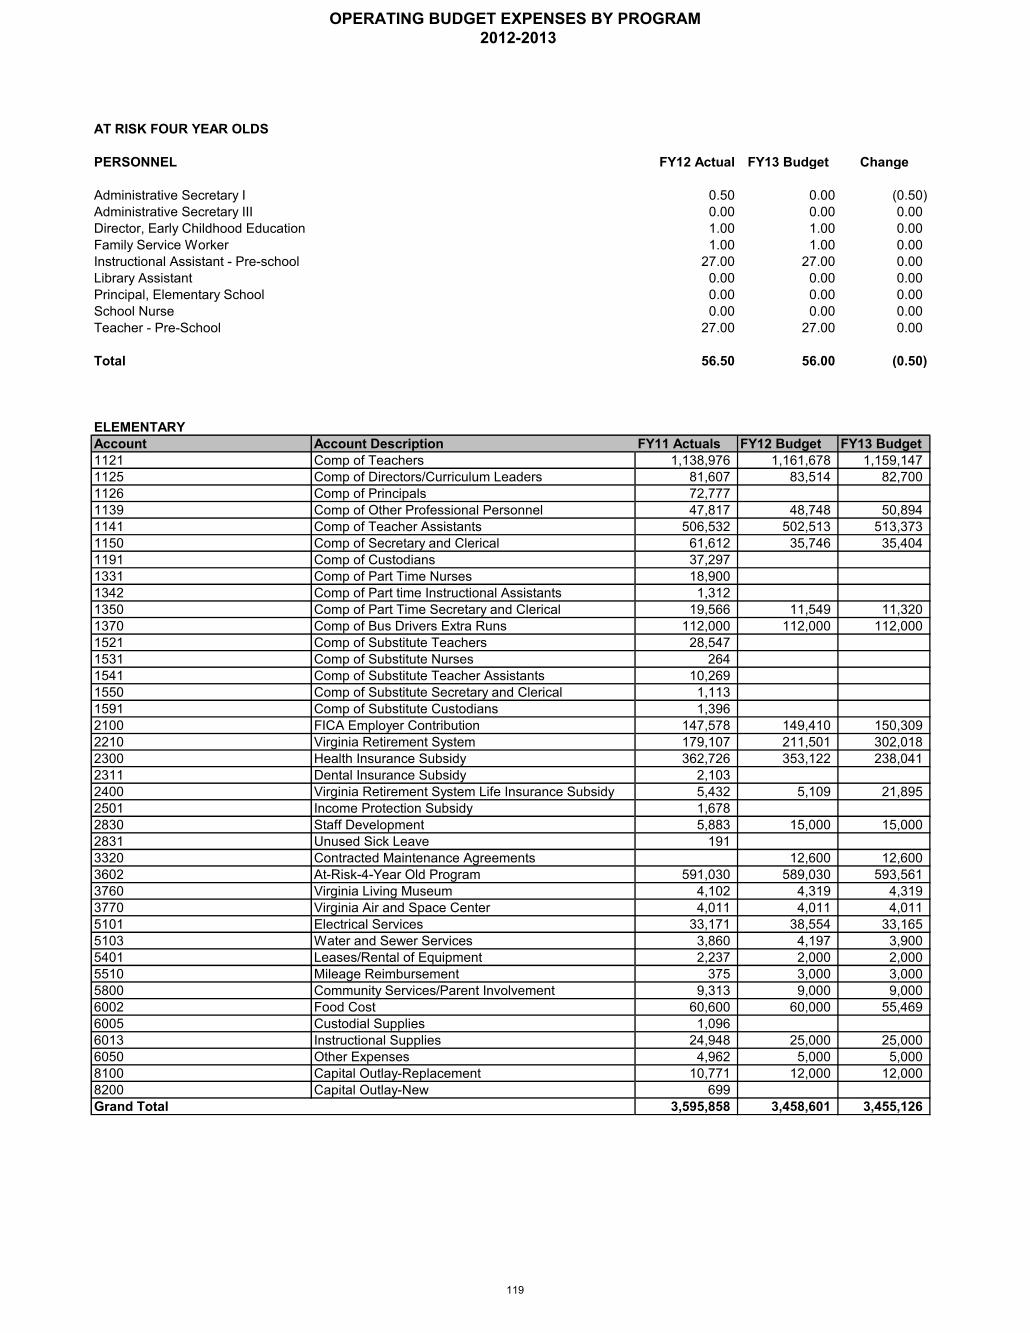
AT RISK FOUR YEAR OLDS
PERSONNEL FY12 Actual FY13 Budget Change
Administrative Secretary I 0.50 0.00 (0.50)Administrative Secretary III 0.00 0.00 0.00Director, Early Childhood Education 1.00 1.00 0.00Family Service Worker 1.00 1.00 0.00Instructional Assistant - Pre-school 27.00 27.00 0.00Library Assistant 0.00 0.00 0.00Principal, Elementary School 0.00 0.00 0.00School Nurse 0.00 0.00 0.00Teacher - Pre-School 27.00 27.00 0.00
Total 56.50 56.00 (0.50)
ELEMENTARYAccount Account Description FY11 Actuals FY12 Budget FY13 Budget1121 Comp of Teachers 1,138,976 1,161,678 1,159,1471125 Comp of Directors/Curriculum Leaders 81,607 83,514 82,7001126 Comp of Principals 72,7771139 Comp of Other Professional Personnel 47,817 48,748 50,8941141 Comp of Teacher Assistants 506,532 502,513 513,3731150 Comp of Secretary and Clerical 61,612 35,746 35,4041191 Comp of Custodians 37,2971331 Comp of Part Time Nurses 18,9001342 Comp of Part time Instructional Assistants 1,3121350 Comp of Part Time Secretary and Clerical 19,566 11,549 11,3201370 Comp of Bus Drivers Extra Runs 112,000 112,000 112,0001521 Comp of Substitute Teachers 28,5471531 Comp of Substitute Nurses 2641541 Comp of Substitute Teacher Assistants 10,2691550 Comp of Substitute Secretary and Clerical 1,1131591 Comp of Substitute Custodians 1,3962100 FICA Employer Contribution 147,578 149,410 150,3092210 Virginia Retirement System 179,107 211,501 302,0182300 Health Insurance Subsidy 362,726 353,122 238,0412311 Dental Insurance Subsidy 2,1032400 Virginia Retirement System Life Insurance Subsidy 5,432 5,109 21,8952501 Income Protection Subsidy 1,6782830 Staff Development 5,883 15,000 15,0002831 Unused Sick Leave 1913320 Contracted Maintenance Agreements 12,600 12,6003602 At-Risk-4-Year Old Program 591,030 589,030 593,5613760 Virginia Living Museum 4,102 4,319 4,3193770 Virginia Air and Space Center 4,011 4,011 4,0115101 Electrical Services 33,171 38,554 33,1655103 Water and Sewer Services 3,860 4,197 3,9005401 Leases/Rental of Equipment 2,237 2,000 2,0005510 Mileage Reimbursement 375 3,000 3,0005800 Community Services/Parent Involvement 9,313 9,000 9,0006002 Food Cost 60,600 60,000 55,4696005 Custodial Supplies 1,0966013 Instructional Supplies 24,948 25,000 25,0006050 Other Expenses 4,962 5,000 5,0008100 Capital Outlay-Replacement 10,771 12,000 12,0008200 Capital Outlay-New 699Grand Total 3,595,858 3,458,601 3,455,126
OPERATING BUDGET EXPENSES BY PROGRAM 2012-2013
119

ATHLETIC SUPPLEMENTS
PERSONNEL
NONE
HIGHAccount Account Description FY11 Actuals FY12 Budget FY13 Budget1399 Comp of Temporary Employees 455,929 441,384 454,4712100 FICA Employer Contribution 34,879 33,803 34,806Grand Total 490,808 475,187 489,277
OPERATING BUDGET EXPENSES BY PROGRAM 2012-2013
120
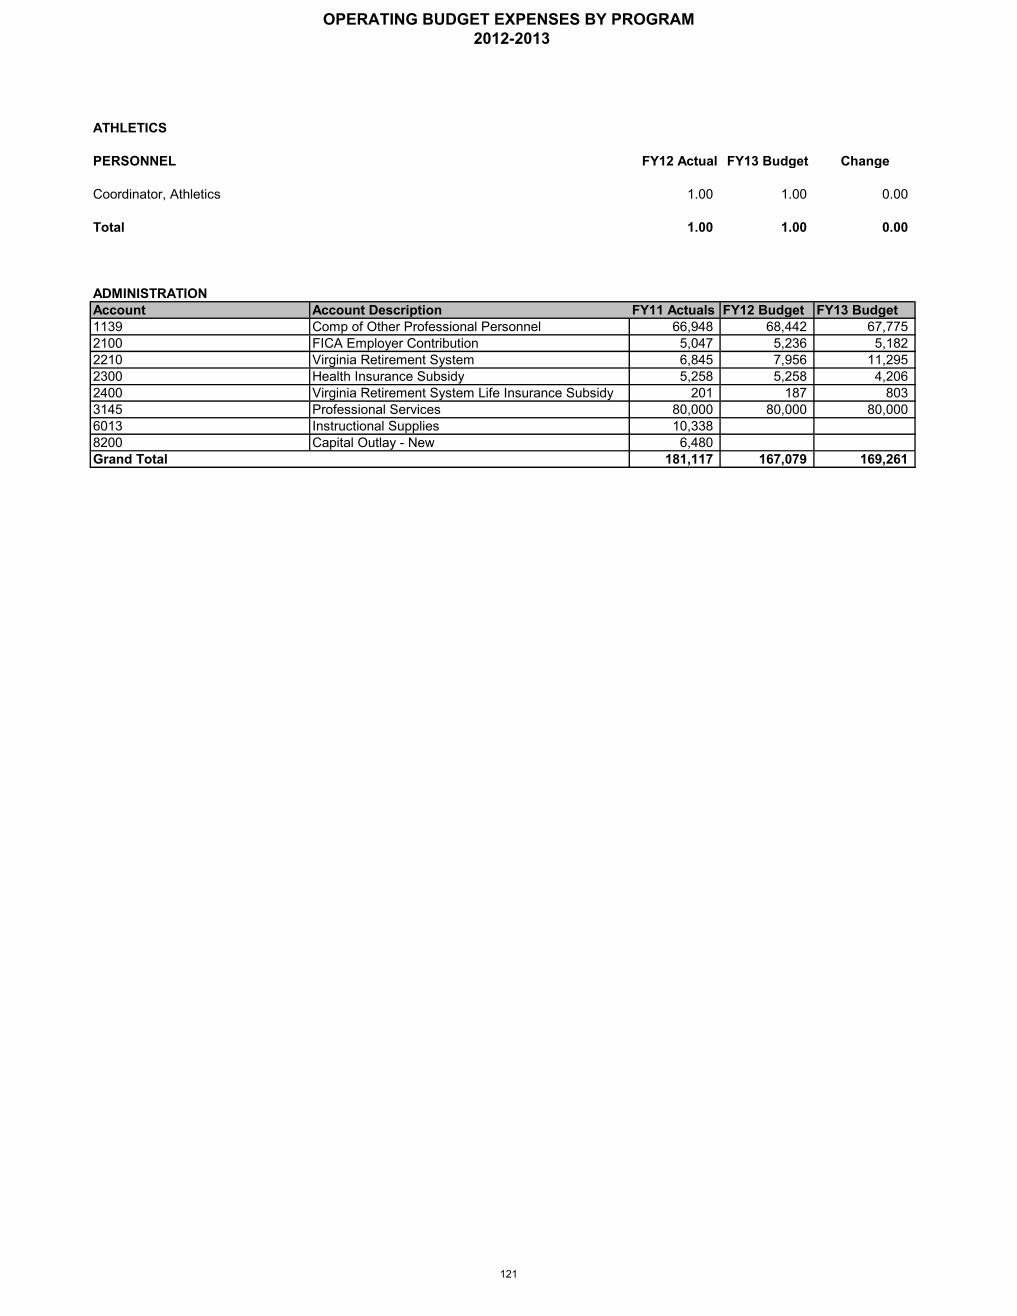
ATHLETICS
PERSONNEL FY12 Actual FY13 Budget Change
Coordinator, Athletics 1.00 1.00 0.00
Total 1.00 1.00 0.00
ADMINISTRATIONAccount Account Description FY11 Actuals FY12 Budget FY13 Budget1139 Comp of Other Professional Personnel 66,948 68,442 67,7752100 FICA Employer Contribution 5,047 5,236 5,1822210 Virginia Retirement System 6,845 7,956 11,2952300 Health Insurance Subsidy 5,258 5,258 4,2062400 Virginia Retirement System Life Insurance Subsidy 201 187 8033145 Professional Services 80,000 80,000 80,0006013 Instructional Supplies 10,3388200 Capital Outlay - New 6,480Grand Total 181,117 167,079 169,261
OPERATING BUDGET EXPENSES BY PROGRAM 2012-2013
121
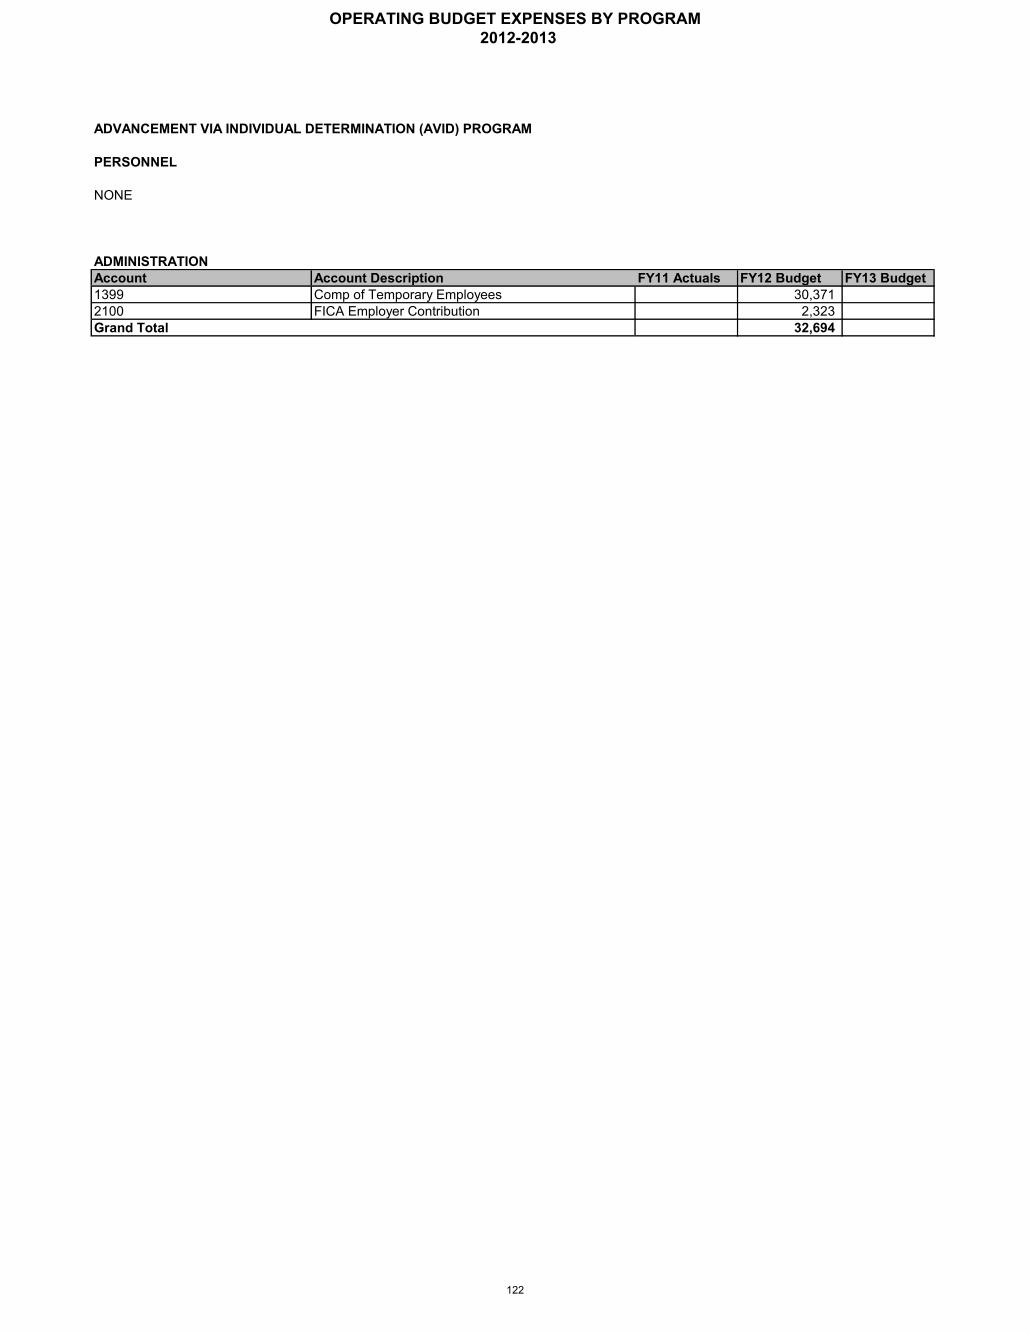
PERSONNEL
NONE
ADMINISTRATIONAccount Account Description FY11 Actuals FY12 Budget FY13 Budget1399 Comp of Temporary Employees 30,3712100 FICA Employer Contribution 2,323Grand Total 32,694
ADVANCEMENT VIA INDIVIDUAL DETERMINATION (AVID) PROGRAM
OPERATING BUDGET EXPENSES BY PROGRAM 2012-2013
122
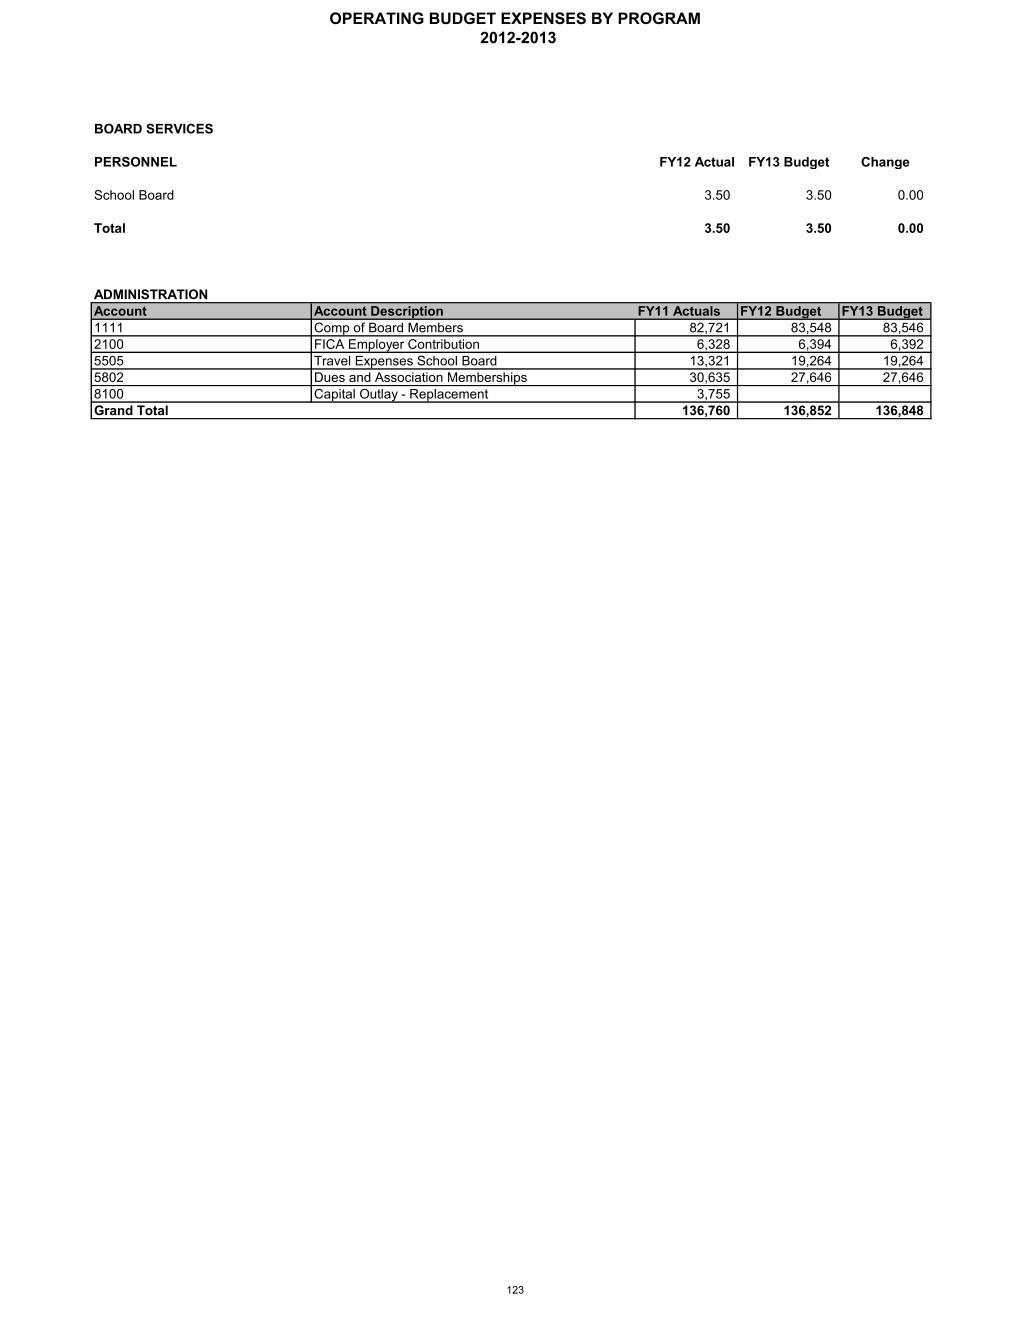
BOARD SERVICES
PERSONNEL FY12 Actual FY13 Budget Change
School Board 3.50 3.50 0.00
Total 3.50 3.50 0.00
ADMINISTRATIONAccount Account Description FY11 Actuals FY12 Budget FY13 Budget1111 Comp of Board Members 82,721 83,548 83,5462100 FICA Employer Contribution 6,328 6,394 6,3925505 Travel Expenses School Board 13,321 19,264 19,2645802 Dues and Association Memberships 30,635 27,646 27,6468100 Capital Outlay - Replacement 3,755Grand Total 136,760 136,852 136,848
OPERATING BUDGET EXPENSES BY PROGRAM 2012-2013
123
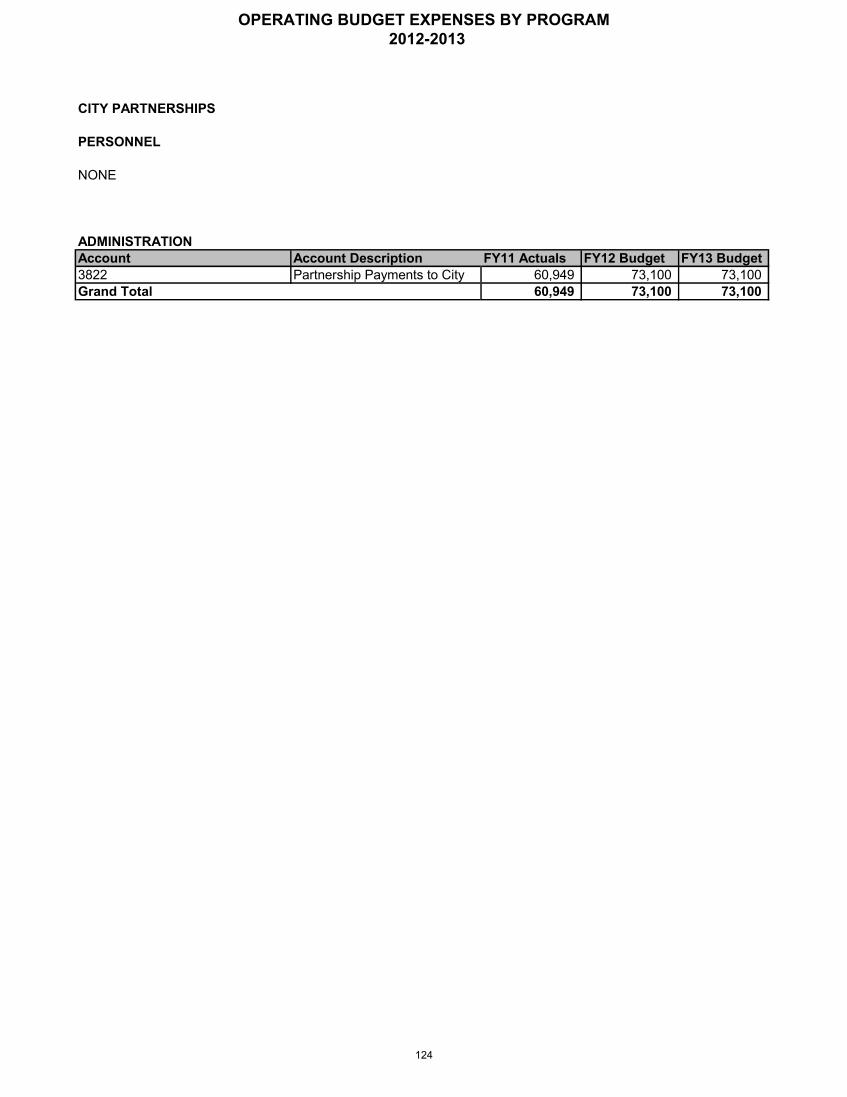
CITY PARTNERSHIPS
PERSONNEL
NONE
ADMINISTRATIONAccount Account Description FY11 Actuals FY12 Budget FY13 Budget3822 Partnership Payments to City 60,949 73,100 73,100Grand Total 60,949 73,100 73,100
OPERATING BUDGET EXPENSES BY PROGRAM 2012-2013
124
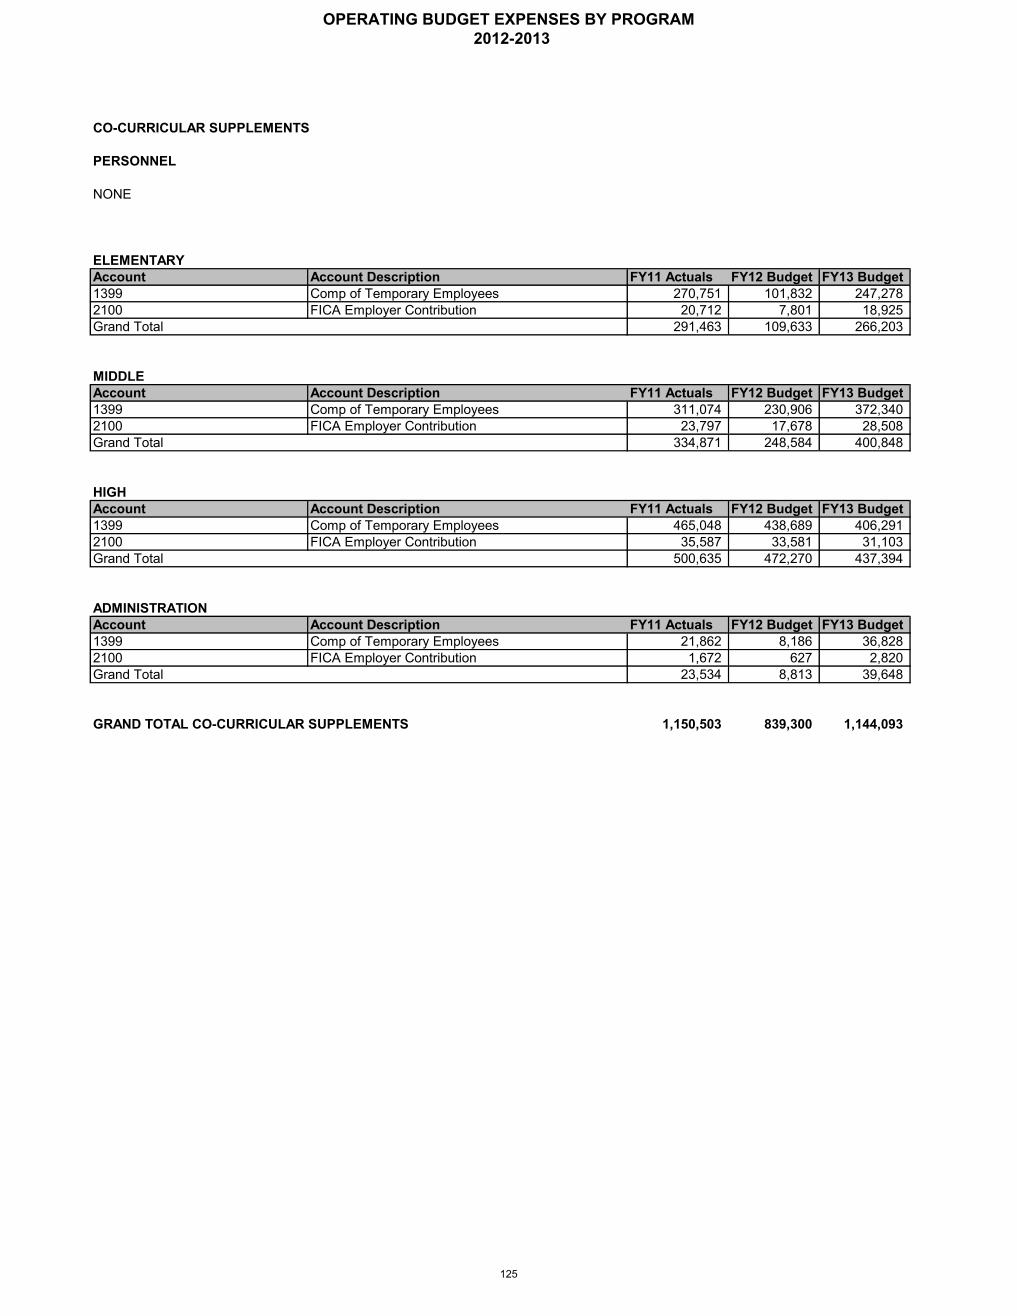
CO-CURRICULAR SUPPLEMENTS
PERSONNEL
NONE
ELEMENTARYAccount Account Description FY11 Actuals FY12 Budget FY13 Budget1399 Comp of Temporary Employees 270,751 101,832 247,2782100 FICA Employer Contribution 20,712 7,801 18,925Grand Total 291,463 109,633 266,203
MIDDLEAccount Account Description FY11 Actuals FY12 Budget FY13 Budget1399 Comp of Temporary Employees 311,074 230,906 372,3402100 FICA Employer Contribution 23,797 17,678 28,508Grand Total 334,871 248,584 400,848
HIGHAccount Account Description FY11 Actuals FY12 Budget FY13 Budget1399 Comp of Temporary Employees 465,048 438,689 406,2912100 FICA Employer Contribution 35,587 33,581 31,103Grand Total 500,635 472,270 437,394
ADMINISTRATIONAccount Account Description FY11 Actuals FY12 Budget FY13 Budget1399 Comp of Temporary Employees 21,862 8,186 36,8282100 FICA Employer Contribution 1,672 627 2,820Grand Total 23,534 8,813 39,648
1,150,503 839,300 1,144,093GRAND TOTAL CO-CURRICULAR SUPPLEMENTS
OPERATING BUDGET EXPENSES BY PROGRAM 2012-2013
125
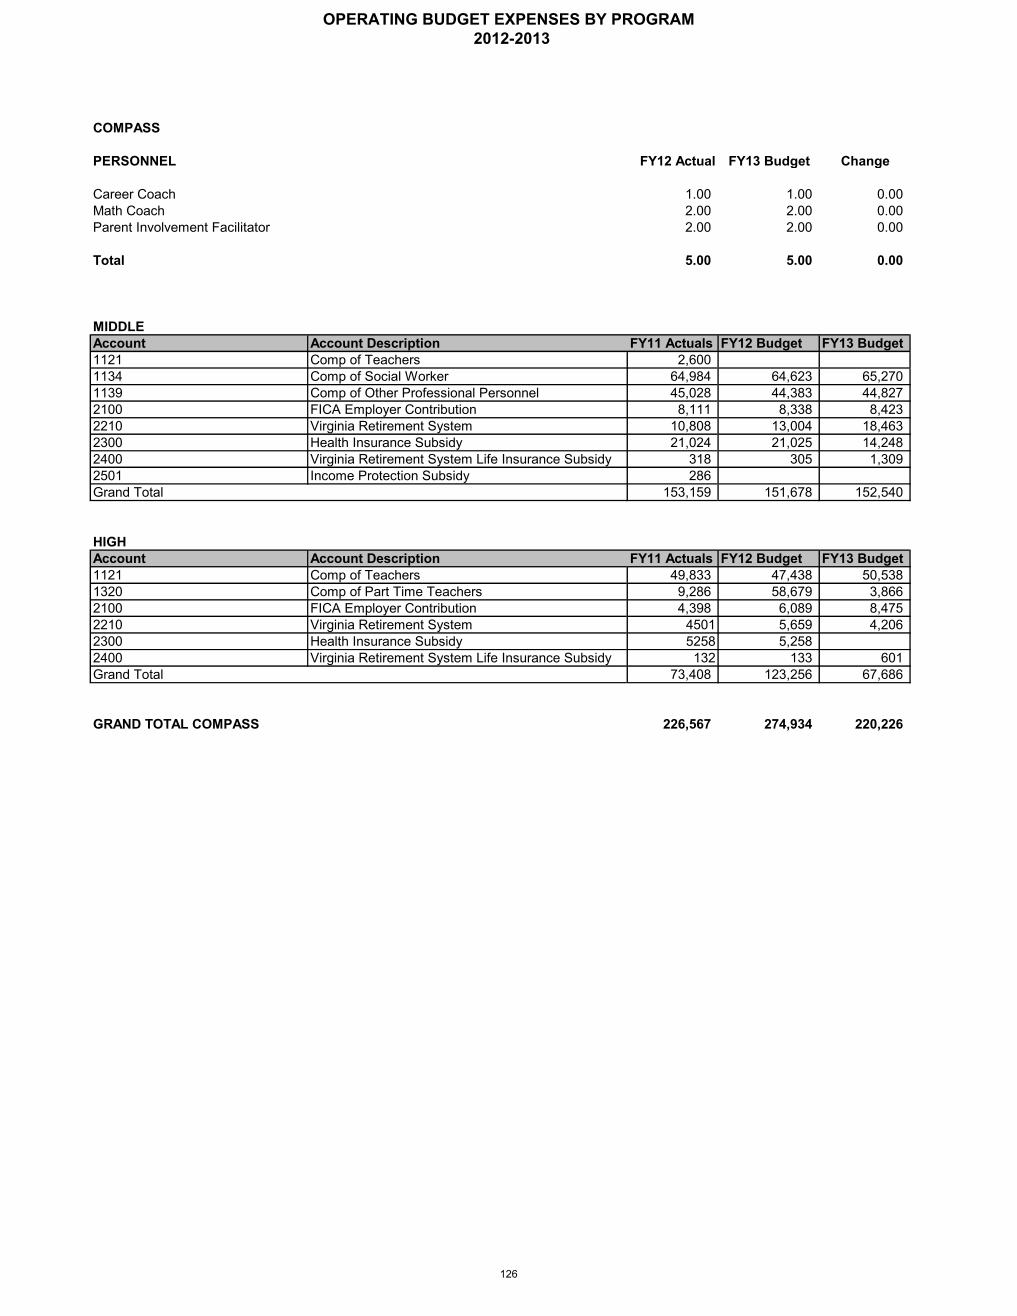
COMPASS
PERSONNEL FY12 Actual FY13 Budget Change
Career Coach 1.00 1.00 0.00Math Coach 2.00 2.00 0.00Parent Involvement Facilitator 2.00 2.00 0.00
Total 5.00 5.00 0.00
MIDDLEAccount Account Description FY11 Actuals FY12 Budget FY13 Budget1121 Comp of Teachers 2,6001134 Comp of Social Worker 64,984 64,623 65,2701139 Comp of Other Professional Personnel 45,028 44,383 44,8272100 FICA Employer Contribution 8,111 8,338 8,4232210 Virginia Retirement System 10,808 13,004 18,4632300 Health Insurance Subsidy 21,024 21,025 14,2482400 Virginia Retirement System Life Insurance Subsidy 318 305 1,3092501 Income Protection Subsidy 286Grand Total 153,159 151,678 152,540
HIGHAccount Account Description FY11 Actuals FY12 Budget FY13 Budget1121 Comp of Teachers 49,833 47,438 50,5381320 Comp of Part Time Teachers 9,286 58,679 3,8662100 FICA Employer Contribution 4,398 6,089 8,4752210 Virginia Retirement System 4501 5,659 4,2062300 Health Insurance Subsidy 5258 5,2582400 Virginia Retirement System Life Insurance Subsidy 132 133 601Grand Total 73,408 123,256 67,686
GRAND TOTAL COMPASS 226,567 274,934 220,226
OPERATING BUDGET EXPENSES BY PROGRAM 2012-2013
126
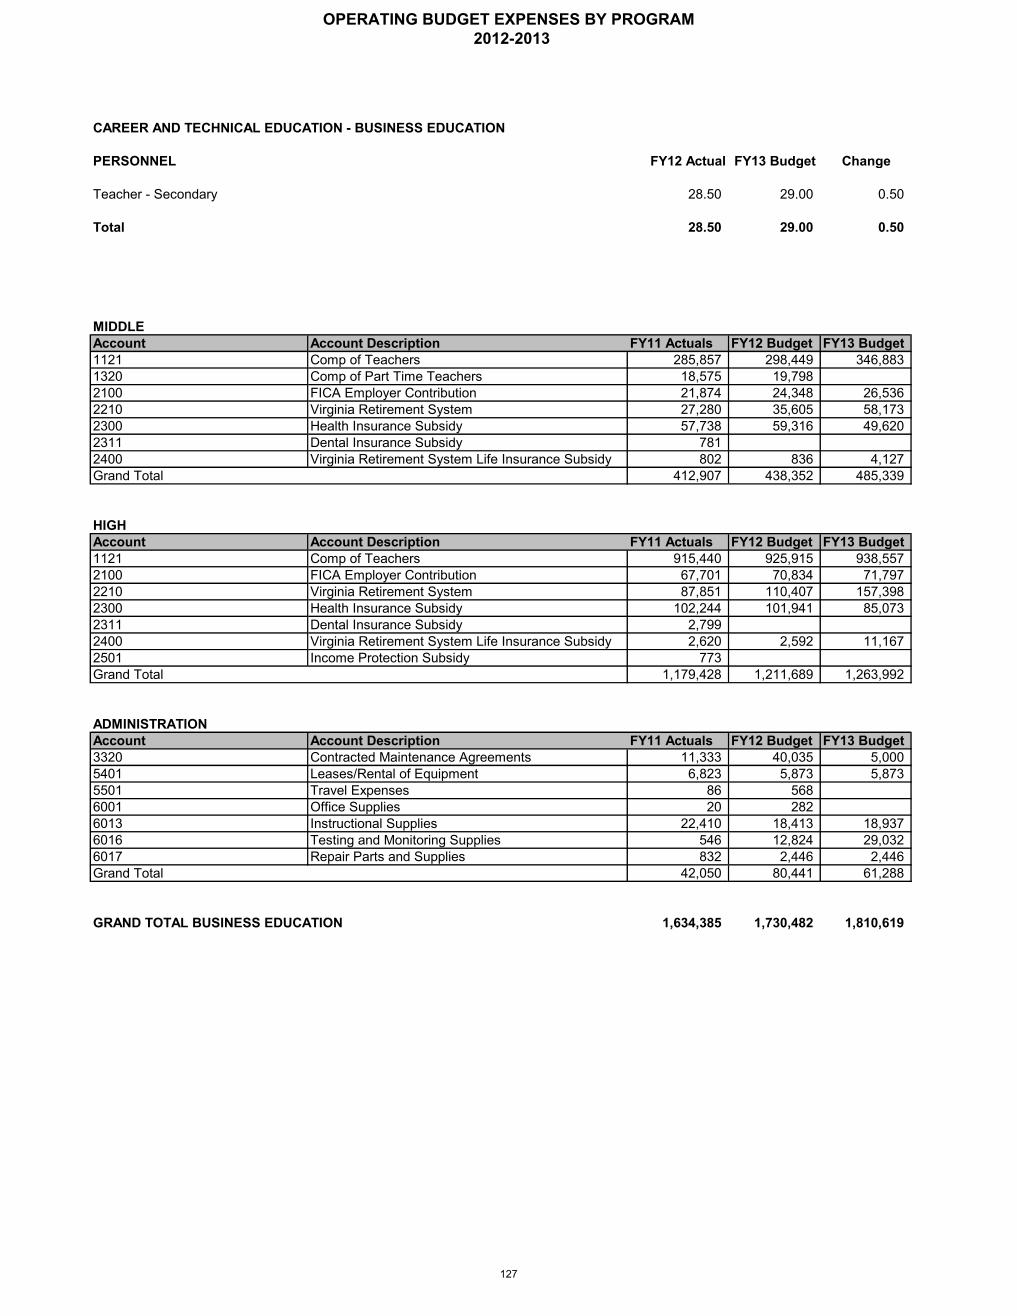
PERSONNEL FY12 Actual FY13 Budget Change
Teacher - Secondary 28.50 29.00 0.50
Total 28.50 29.00 0.50
MIDDLEAccount Account Description FY11 Actuals FY12 Budget FY13 Budget1121 Comp of Teachers 285,857 298,449 346,8831320 Comp of Part Time Teachers 18,575 19,7982100 FICA Employer Contribution 21,874 24,348 26,5362210 Virginia Retirement System 27,280 35,605 58,1732300 Health Insurance Subsidy 57,738 59,316 49,6202311 Dental Insurance Subsidy 7812400 Virginia Retirement System Life Insurance Subsidy 802 836 4,127Grand Total 412,907 438,352 485,339
HIGHAccount Account Description FY11 Actuals FY12 Budget FY13 Budget1121 Comp of Teachers 915,440 925,915 938,5572100 FICA Employer Contribution 67,701 70,834 71,7972210 Virginia Retirement System 87,851 110,407 157,3982300 Health Insurance Subsidy 102,244 101,941 85,0732311 Dental Insurance Subsidy 2,7992400 Virginia Retirement System Life Insurance Subsidy 2,620 2,592 11,1672501 Income Protection Subsidy 773Grand Total 1,179,428 1,211,689 1,263,992
ADMINISTRATIONAccount Account Description FY11 Actuals FY12 Budget FY13 Budget3320 Contracted Maintenance Agreements 11,333 40,035 5,0005401 Leases/Rental of Equipment 6,823 5,873 5,8735501 Travel Expenses 86 5686001 Office Supplies 20 2826013 Instructional Supplies 22,410 18,413 18,9376016 Testing and Monitoring Supplies 546 12,824 29,0326017 Repair Parts and Supplies 832 2,446 2,446Grand Total 42,050 80,441 61,288
1,634,385 1,730,482 1,810,619
CAREER AND TECHNICAL EDUCATION - BUSINESS EDUCATION
GRAND TOTAL BUSINESS EDUCATION
OPERATING BUDGET EXPENSES BY PROGRAM 2012-2013
127
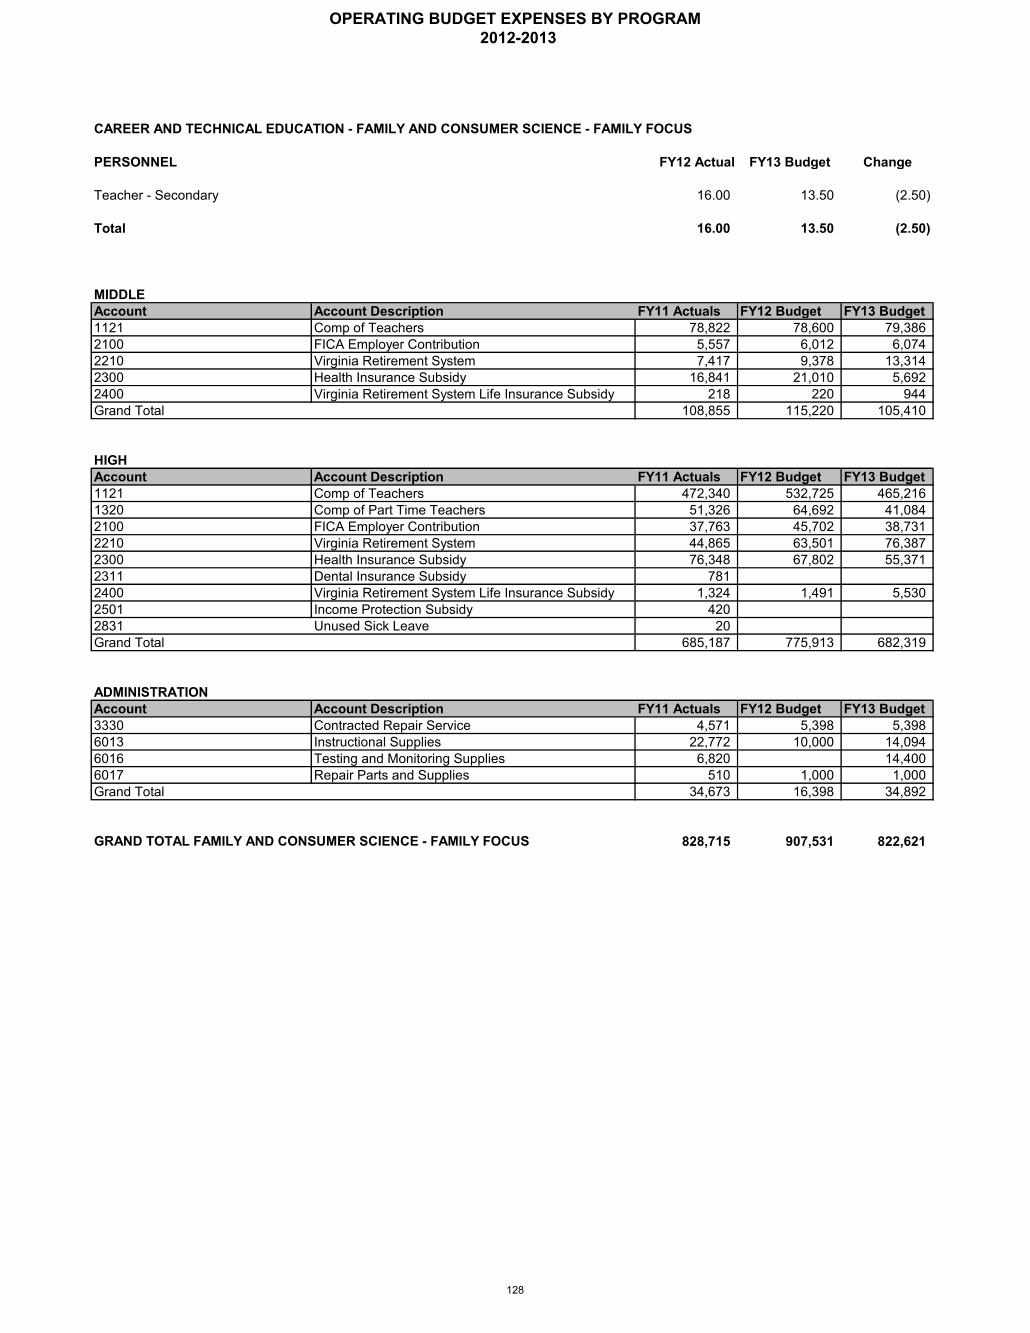
PERSONNEL FY12 Actual FY13 Budget Change
Teacher - Secondary 16.00 13.50 (2.50)
Total 16.00 13.50 (2.50)
MIDDLEAccount Account Description FY11 Actuals FY12 Budget FY13 Budget1121 Comp of Teachers 78,822 78,600 79,3862100 FICA Employer Contribution 5,557 6,012 6,0742210 Virginia Retirement System 7,417 9,378 13,3142300 Health Insurance Subsidy 16,841 21,010 5,6922400 Virginia Retirement System Life Insurance Subsidy 218 220 944Grand Total 108,855 115,220 105,410
HIGHAccount Account Description FY11 Actuals FY12 Budget FY13 Budget1121 Comp of Teachers 472,340 532,725 465,2161320 Comp of Part Time Teachers 51,326 64,692 41,0842100 FICA Employer Contribution 37,763 45,702 38,7312210 Virginia Retirement System 44,865 63,501 76,3872300 Health Insurance Subsidy 76,348 67,802 55,3712311 Dental Insurance Subsidy 7812400 Virginia Retirement System Life Insurance Subsidy 1,324 1,491 5,5302501 Income Protection Subsidy 4202831 Unused Sick Leave 20Grand Total 685,187 775,913 682,319
ADMINISTRATIONAccount Account Description FY11 Actuals FY12 Budget FY13 Budget3330 Contracted Repair Service 4,571 5,398 5,3986013 Instructional Supplies 22,772 10,000 14,0946016 Testing and Monitoring Supplies 6,820 14,4006017 Repair Parts and Supplies 510 1,000 1,000Grand Total 34,673 16,398 34,892
828,715 907,531 822,621
CAREER AND TECHNICAL EDUCATION - FAMILY AND CONSUMER SCIENCE - FAMILY FOCUS
GRAND TOTAL FAMILY AND CONSUMER SCIENCE - FAMILY FOCUS
OPERATING BUDGET EXPENSES BY PROGRAM 2012-2013
128
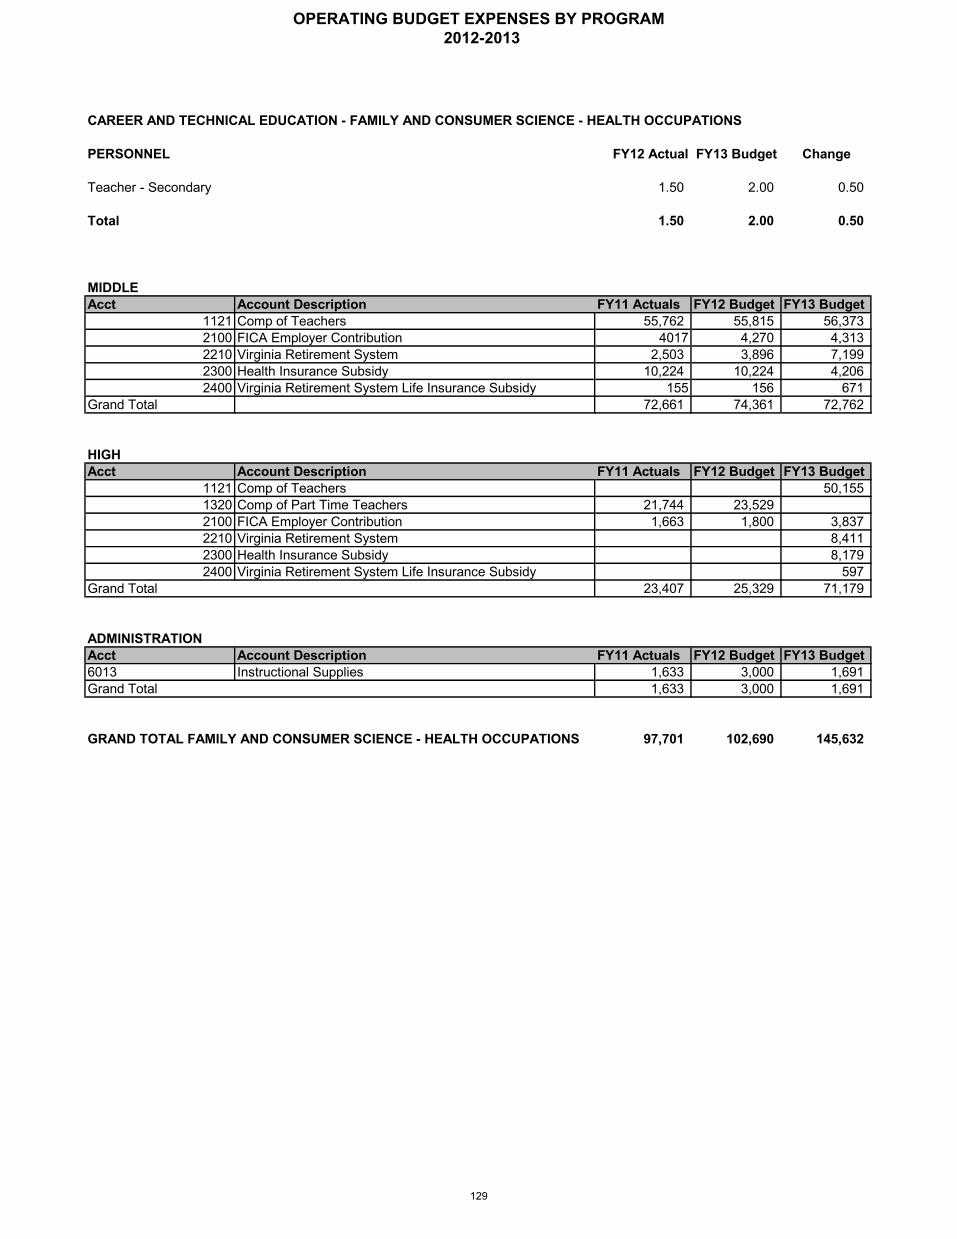
CAREER AND TECHNICAL EDUCATION - FAMILY AND CONSUMER SCIENCE - HEALTH OCCUPATIONS
PERSONNEL FY12 Actual FY13 Budget Change
Teacher - Secondary 1.50 2.00 0.50
Total 1.50 2.00 0.50
MIDDLEAcct Account Description FY11 Actuals FY12 Budget FY13 Budget
1121 Comp of Teachers 55,762 55,815 56,3732100 FICA Employer Contribution 4017 4,270 4,3132210 Virginia Retirement System 2,503 3,896 7,1992300 Health Insurance Subsidy 10,224 10,224 4,2062400 Virginia Retirement System Life Insurance Subsidy 155 156 671
Grand Total 72,661 74,361 72,762
HIGHAcct Account Description FY11 Actuals FY12 Budget FY13 Budget
1121 Comp of Teachers 50,1551320 Comp of Part Time Teachers 21,744 23,5292100 FICA Employer Contribution 1,663 1,800 3,8372210 Virginia Retirement System 8,4112300 Health Insurance Subsidy 8,1792400 Virginia Retirement System Life Insurance Subsidy 597
Grand Total 23,407 25,329 71,179
ADMINISTRATIONAcct Account Description FY11 Actuals FY12 Budget FY13 Budget6013 Instructional Supplies 1,633 3,000 1,691Grand Total 1,633 3,000 1,691
GRAND TOTAL FAMILY AND CONSUMER SCIENCE - HEALTH OCCUPATIONS 97,701 102,690 145,632
OPERATING BUDGET EXPENSES BY PROGRAM 2012-2013
129
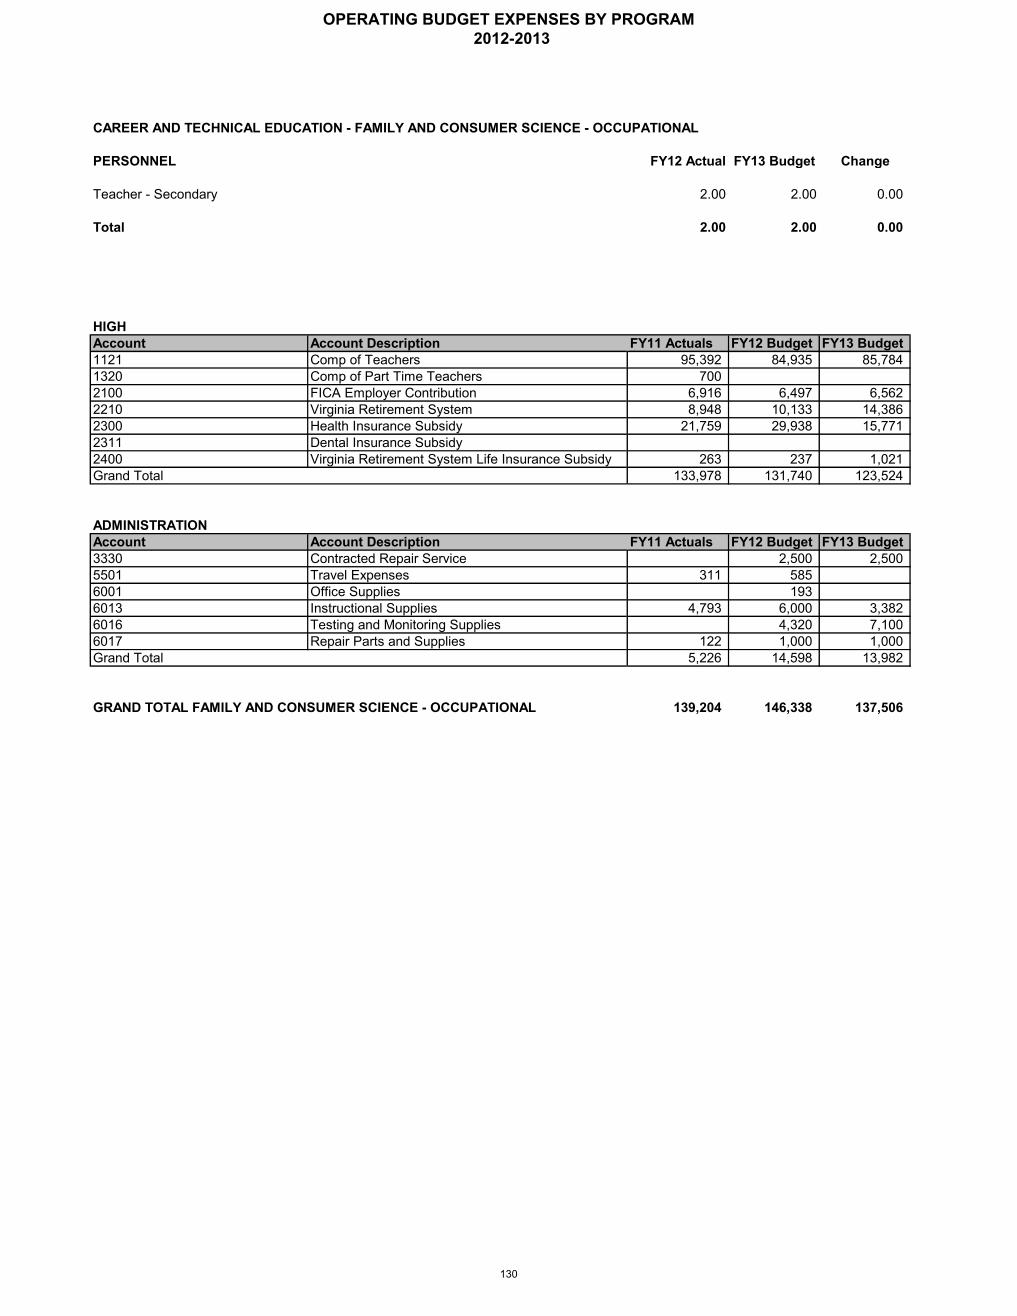
PERSONNEL FY12 Actual FY13 Budget Change
Teacher - Secondary 2.00 2.00 0.00
Total 2.00 2.00 0.00
HIGHAccount Account Description FY11 Actuals FY12 Budget FY13 Budget1121 Comp of Teachers 95,392 84,935 85,7841320 Comp of Part Time Teachers 7002100 FICA Employer Contribution 6,916 6,497 6,5622210 Virginia Retirement System 8,948 10,133 14,3862300 Health Insurance Subsidy 21,759 29,938 15,7712311 Dental Insurance Subsidy2400 Virginia Retirement System Life Insurance Subsidy 263 237 1,021Grand Total 133,978 131,740 123,524
ADMINISTRATIONAccount Account Description FY11 Actuals FY12 Budget FY13 Budget3330 Contracted Repair Service 2,500 2,5005501 Travel Expenses 311 5856001 Office Supplies 1936013 Instructional Supplies 4,793 6,000 3,3826016 Testing and Monitoring Supplies 4,320 7,1006017 Repair Parts and Supplies 122 1,000 1,000Grand Total 5,226 14,598 13,982
139,204 146,338 137,506
CAREER AND TECHNICAL EDUCATION - FAMILY AND CONSUMER SCIENCE - OCCUPATIONAL
GRAND TOTAL FAMILY AND CONSUMER SCIENCE - OCCUPATIONAL
OPERATING BUDGET EXPENSES BY PROGRAM 2012-2013
130
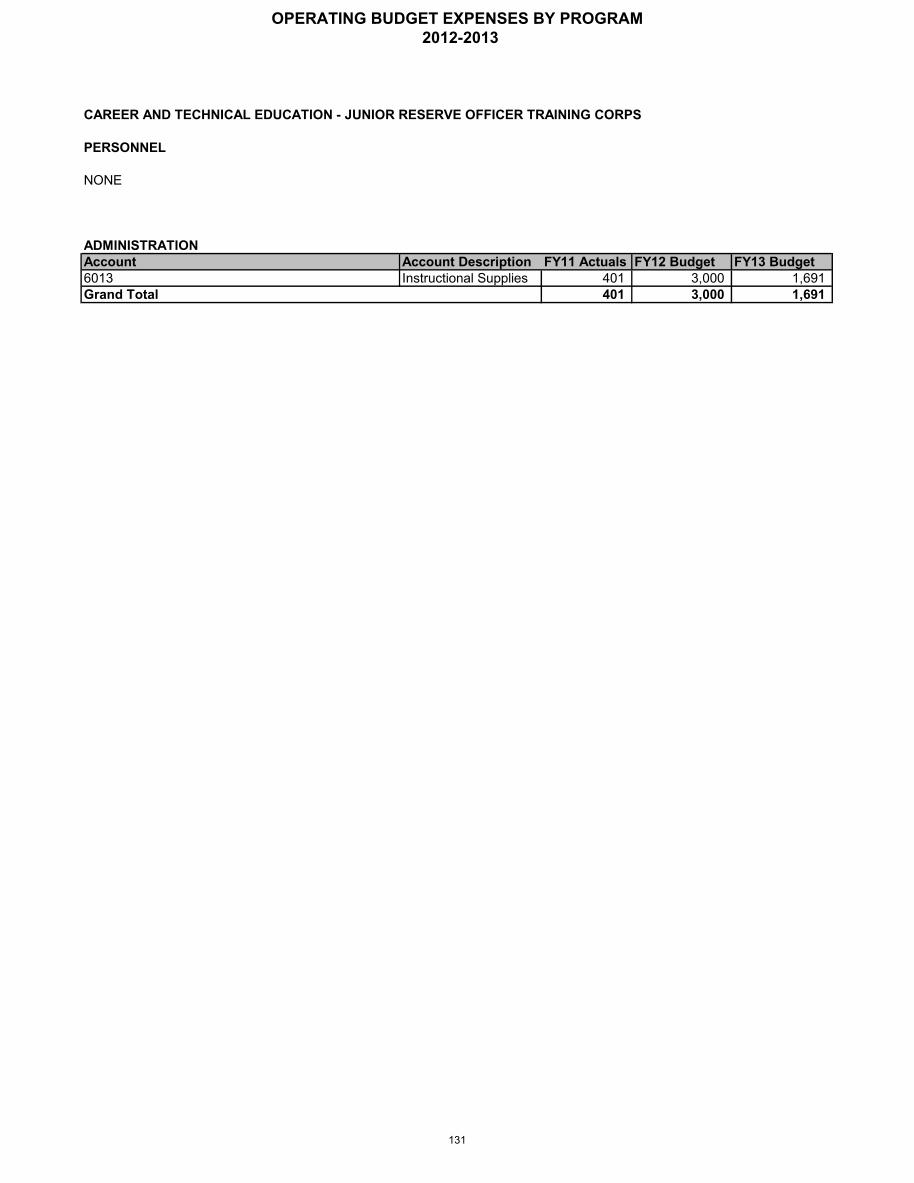
PERSONNEL
NONE
ADMINISTRATIONAccount Account Description FY11 Actuals FY12 Budget FY13 Budget6013 Instructional Supplies 401 3,000 1,691Grand Total 401 3,000 1,691
CAREER AND TECHNICAL EDUCATION - JUNIOR RESERVE OFFICER TRAINING CORPS
OPERATING BUDGET EXPENSES BY PROGRAM 2012-2013
131
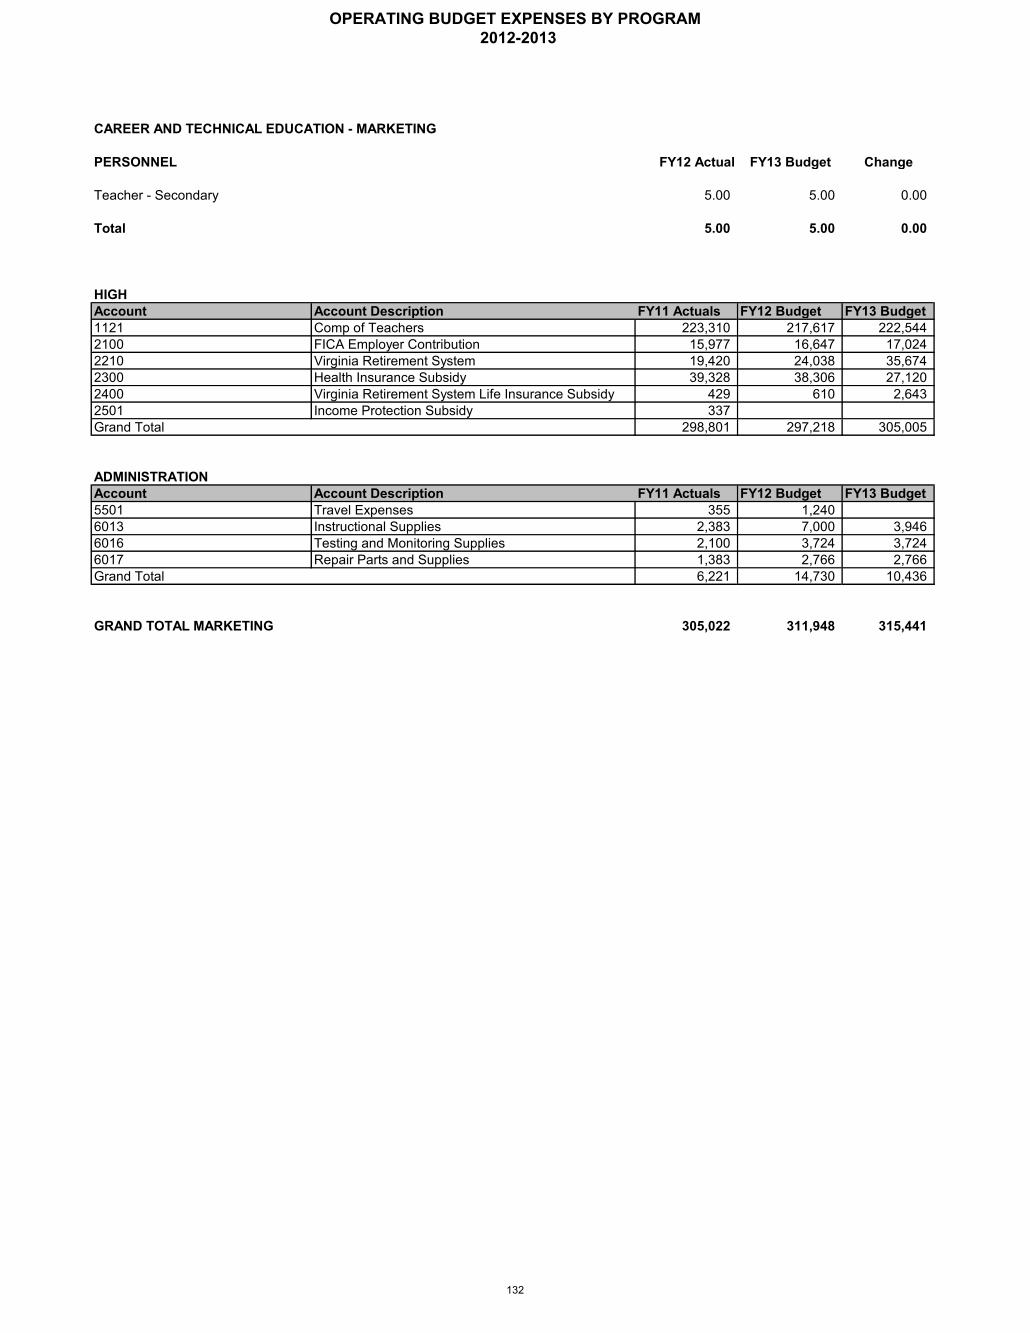
PERSONNEL FY12 Actual FY13 Budget Change
Teacher - Secondary 5.00 5.00 0.00
Total 5.00 5.00 0.00
HIGHAccount Account Description FY11 Actuals FY12 Budget FY13 Budget1121 Comp of Teachers 223,310 217,617 222,5442100 FICA Employer Contribution 15,977 16,647 17,0242210 Virginia Retirement System 19,420 24,038 35,6742300 Health Insurance Subsidy 39,328 38,306 27,1202400 Virginia Retirement System Life Insurance Subsidy 429 610 2,6432501 Income Protection Subsidy 337Grand Total 298,801 297,218 305,005
ADMINISTRATIONAccount Account Description FY11 Actuals FY12 Budget FY13 Budget5501 Travel Expenses 355 1,2406013 Instructional Supplies 2,383 7,000 3,9466016 Testing and Monitoring Supplies 2,100 3,724 3,7246017 Repair Parts and Supplies 1,383 2,766 2,766Grand Total 6,221 14,730 10,436
GRAND TOTAL MARKETING 305,022 311,948 315,441
CAREER AND TECHNICAL EDUCATION - MARKETING
OPERATING BUDGET EXPENSES BY PROGRAM 2012-2013
132
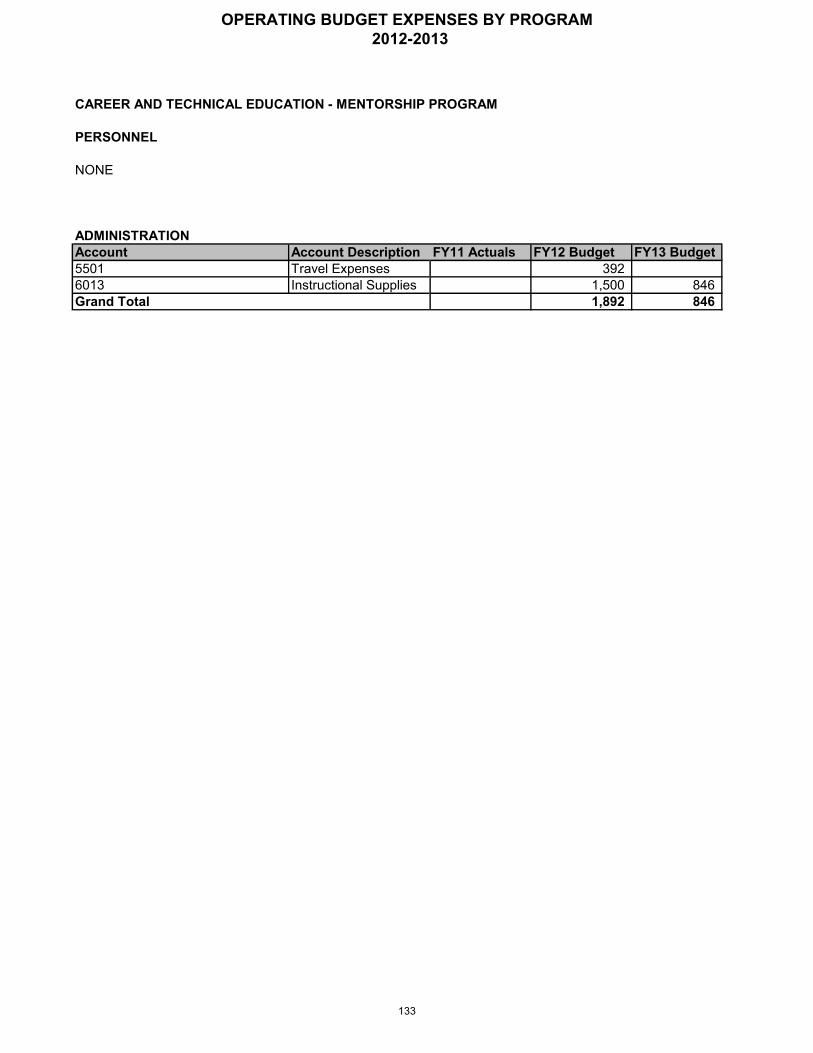
CAREER AND TECHNICAL EDUCATION - MENTORSHIP PROGRAM
PERSONNEL
NONE
ADMINISTRATIONAccount Account Description FY11 Actuals FY12 Budget FY13 Budget5501 Travel Expenses 3926013 Instructional Supplies 1,500 846Grand Total 1,892 846
OPERATING BUDGET EXPENSES BY PROGRAM 2012-2013
133
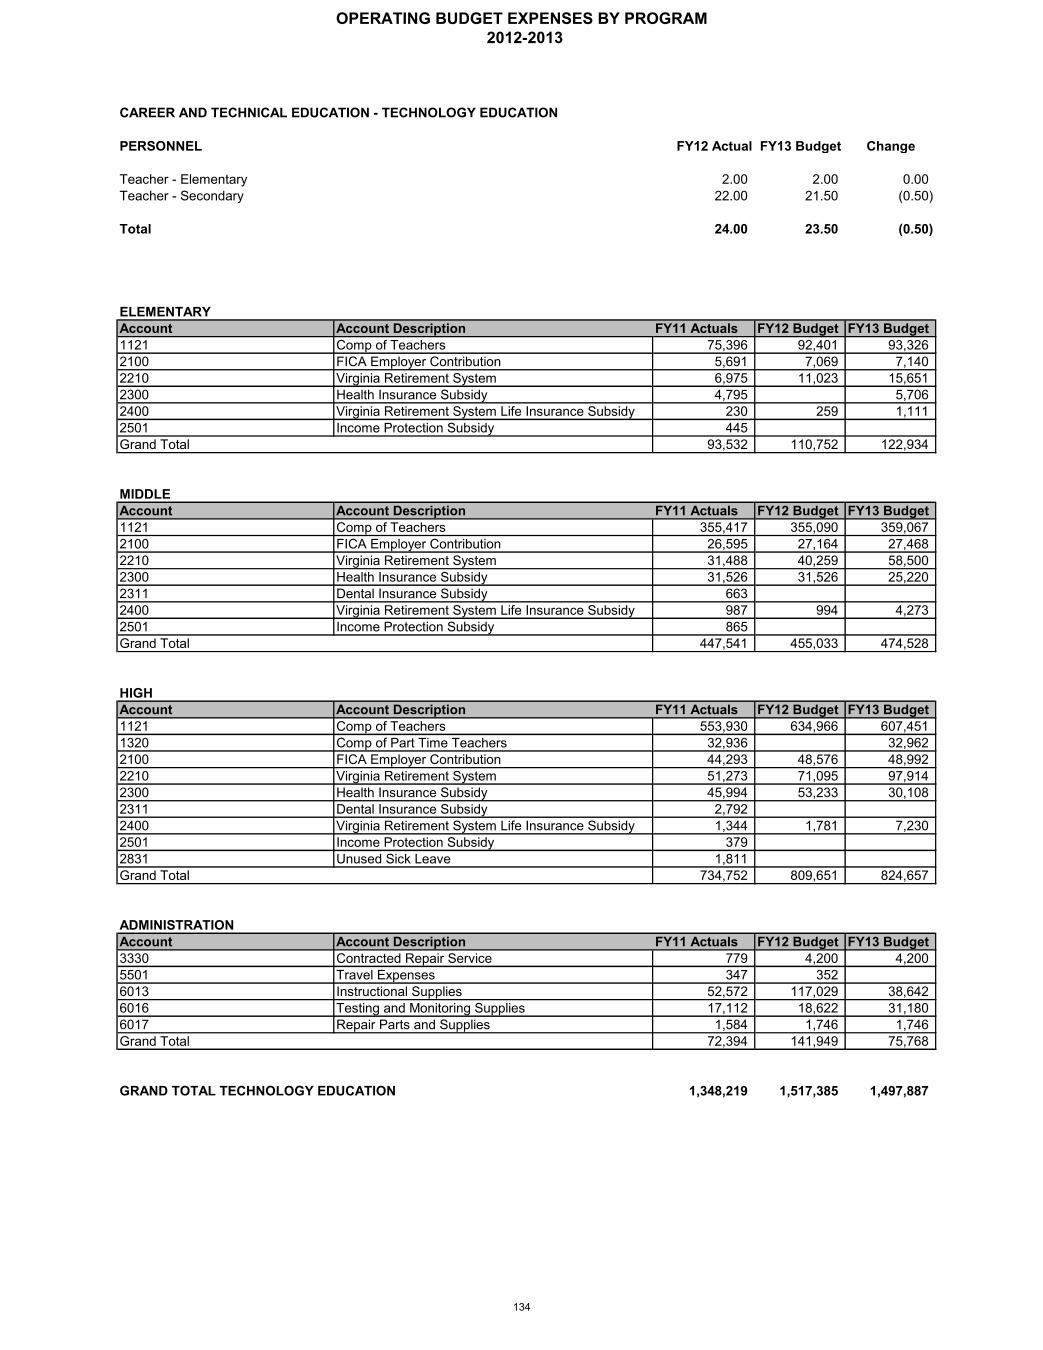
PERSONNEL FY12 Actual FY13 Budget Change
Teacher - Elementary 2.00 2.00 0.00Teacher - Secondary 22.00 21.50 (0.50)
Total 24.00 23.50 (0.50)
ELEMENTARYAccount Account Description FY11 Actuals FY12 Budget FY13 Budget1121 Comp of Teachers 75,396 92,401 93,3262100 FICA Employer Contribution 5,691 7,069 7,1402210 Virginia Retirement System 6,975 11,023 15,6512300 Health Insurance Subsidy 4,795 5,7062400 Virginia Retirement System Life Insurance Subsidy 230 259 1,1112501 Income Protection Subsidy 445Grand Total 93,532 110,752 122,934
MIDDLEAccount Account Description FY11 Actuals FY12 Budget FY13 Budget1121 Comp of Teachers 355,417 355,090 359,0672100 FICA Employer Contribution 26,595 27,164 27,4682210 Virginia Retirement System 31,488 40,259 58,5002300 Health Insurance Subsidy 31,526 31,526 25,2202311 Dental Insurance Subsidy 6632400 Virginia Retirement System Life Insurance Subsidy 987 994 4,2732501 Income Protection Subsidy 865Grand Total 447,541 455,033 474,528
HIGHAccount Account Description FY11 Actuals FY12 Budget FY13 Budget1121 Comp of Teachers 553,930 634,966 607,4511320 Comp of Part Time Teachers 32,936 32,9622100 FICA Employer Contribution 44,293 48,576 48,9922210 Virginia Retirement System 51,273 71,095 97,9142300 Health Insurance Subsidy 45,994 53,233 30,1082311 Dental Insurance Subsidy 2,7922400 Virginia Retirement System Life Insurance Subsidy 1,344 1,781 7,2302501 Income Protection Subsidy 3792831 Unused Sick Leave 1,811Grand Total 734,752 809,651 824,657
ADMINISTRATIONAccount Account Description FY11 Actuals FY12 Budget FY13 Budget3330 Contracted Repair Service 779 4,200 4,2005501 Travel Expenses 347 3526013 Instructional Supplies 52,572 117,029 38,6426016 Testing and Monitoring Supplies 17,112 18,622 31,1806017 Repair Parts and Supplies 1,584 1,746 1,746Grand Total 72,394 141,949 75,768
GRAND TOTAL TECHNOLOGY EDUCATION 1,348,219 1,517,385 1,497,887
CAREER AND TECHNICAL EDUCATION - TECHNOLOGY EDUCATION
OPERATING BUDGET EXPENSES BY PROGRAM 2012-2013
134
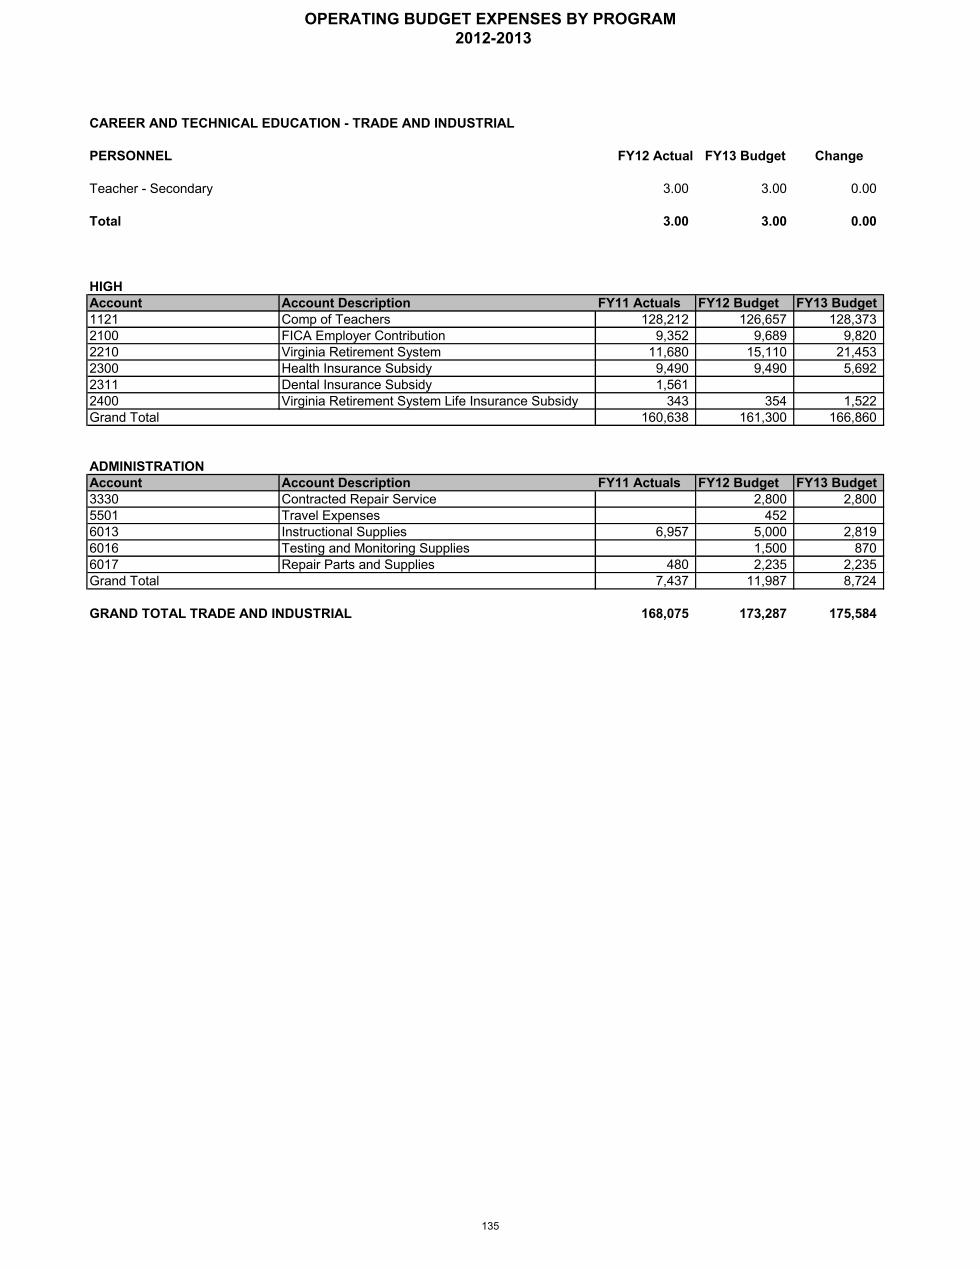
CAREER AND TECHNICAL EDUCATION - TRADE AND INDUSTRIAL
PERSONNEL FY12 Actual FY13 Budget Change
Teacher - Secondary 3.00 3.00 0.00
Total 3.00 3.00 0.00
HIGHAccount Account Description FY11 Actuals FY12 Budget FY13 Budget1121 Comp of Teachers 128,212 126,657 128,3732100 FICA Employer Contribution 9,352 9,689 9,8202210 Virginia Retirement System 11,680 15,110 21,4532300 Health Insurance Subsidy 9,490 9,490 5,6922311 Dental Insurance Subsidy 1,5612400 Virginia Retirement System Life Insurance Subsidy 343 354 1,522Grand Total 160,638 161,300 166,860
ADMINISTRATIONAccount Account Description FY11 Actuals FY12 Budget FY13 Budget3330 Contracted Repair Service 2,800 2,8005501 Travel Expenses 4526013 Instructional Supplies 6,957 5,000 2,8196016 Testing and Monitoring Supplies 1,500 8706017 Repair Parts and Supplies 480 2,235 2,235Grand Total 7,437 11,987 8,724
GRAND TOTAL TRADE AND INDUSTRIAL 168,075 173,287 175,584
OPERATING BUDGET EXPENSES BY PROGRAM 2012-2013
135
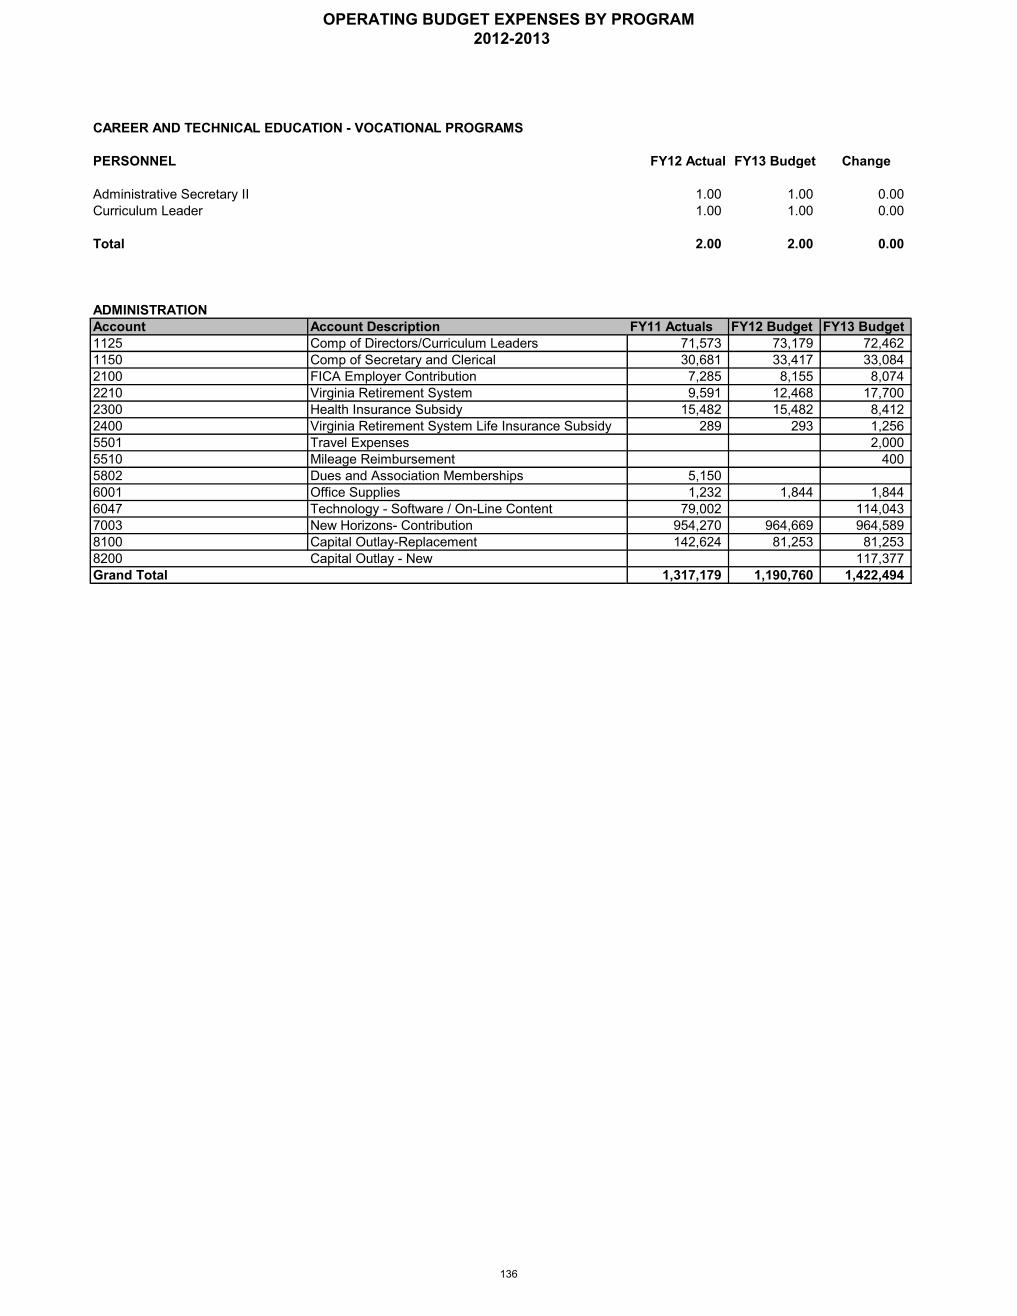
PERSONNEL FY12 Actual FY13 Budget Change
Administrative Secretary II 1.00 1.00 0.00Curriculum Leader 1.00 1.00 0.00
Total 2.00 2.00 0.00
ADMINISTRATIONAccount Account Description FY11 Actuals FY12 Budget FY13 Budget1125 Comp of Directors/Curriculum Leaders 71,573 73,179 72,4621150 Comp of Secretary and Clerical 30,681 33,417 33,0842100 FICA Employer Contribution 7,285 8,155 8,0742210 Virginia Retirement System 9,591 12,468 17,7002300 Health Insurance Subsidy 15,482 15,482 8,4122400 Virginia Retirement System Life Insurance Subsidy 289 293 1,2565501 Travel Expenses 2,0005510 Mileage Reimbursement 4005802 Dues and Association Memberships 5,1506001 Office Supplies 1,232 1,844 1,8446047 Technology - Software / On-Line Content 79,002 114,0437003 New Horizons- Contribution 954,270 964,669 964,5898100 Capital Outlay-Replacement 142,624 81,253 81,2538200 Capital Outlay - New 117,377Grand Total 1,317,179 1,190,760 1,422,494
CAREER AND TECHNICAL EDUCATION - VOCATIONAL PROGRAMS
OPERATING BUDGET EXPENSES BY PROGRAM 2012-2013
136
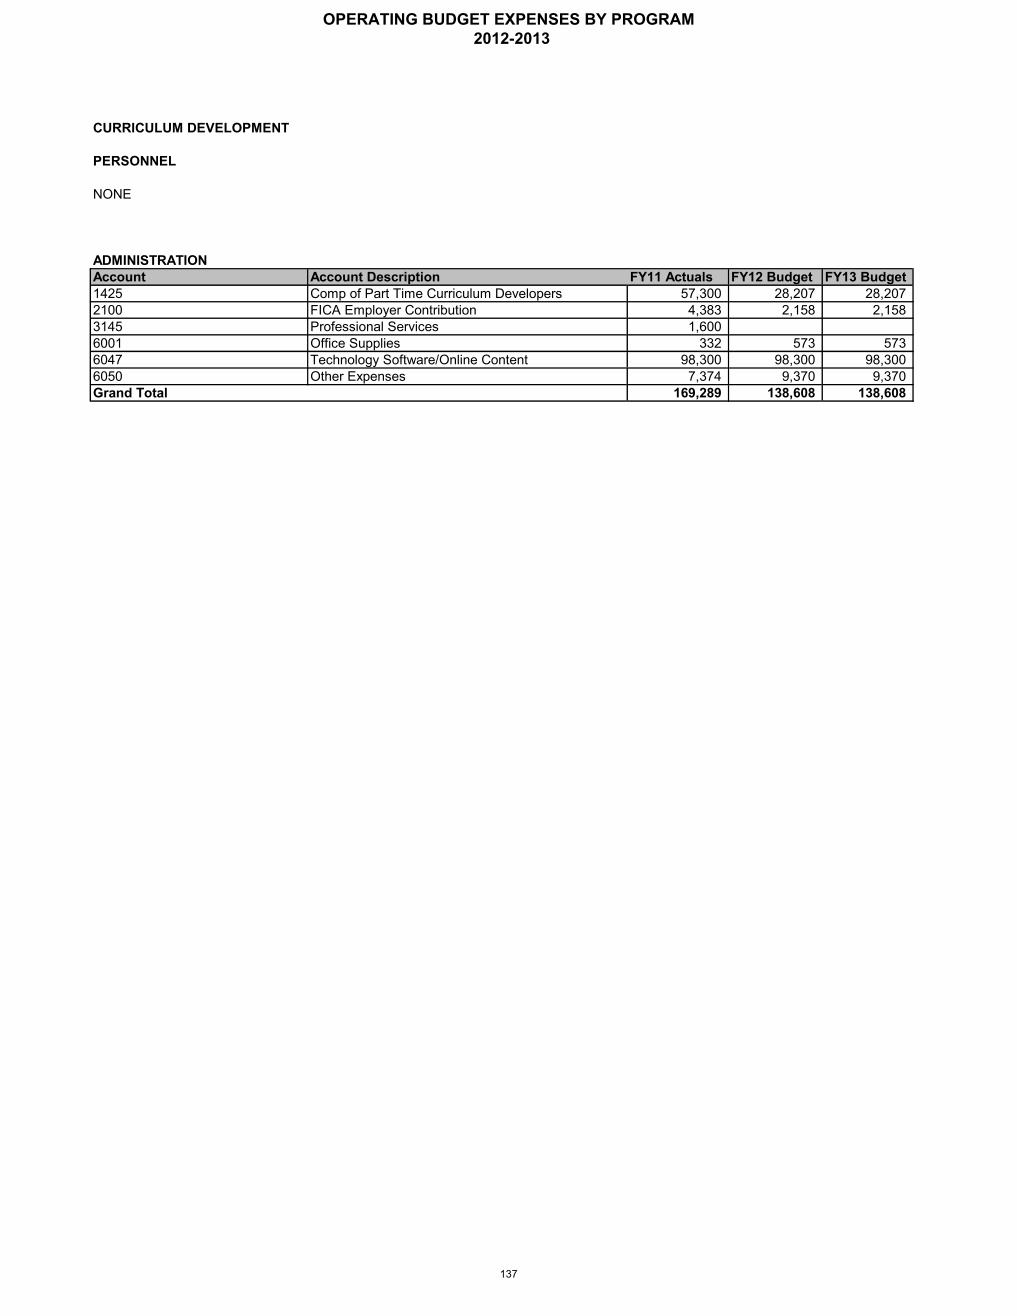
CURRICULUM DEVELOPMENT
PERSONNEL
NONE
ADMINISTRATIONAccount Account Description FY11 Actuals FY12 Budget FY13 Budget1425 Comp of Part Time Curriculum Developers 57,300 28,207 28,2072100 FICA Employer Contribution 4,383 2,158 2,1583145 Professional Services 1,6006001 Office Supplies 332 573 5736047 Technology Software/Online Content 98,300 98,300 98,3006050 Other Expenses 7,374 9,370 9,370Grand Total 169,289 138,608 138,608
OPERATING BUDGET EXPENSES BY PROGRAM 2012-2013
137
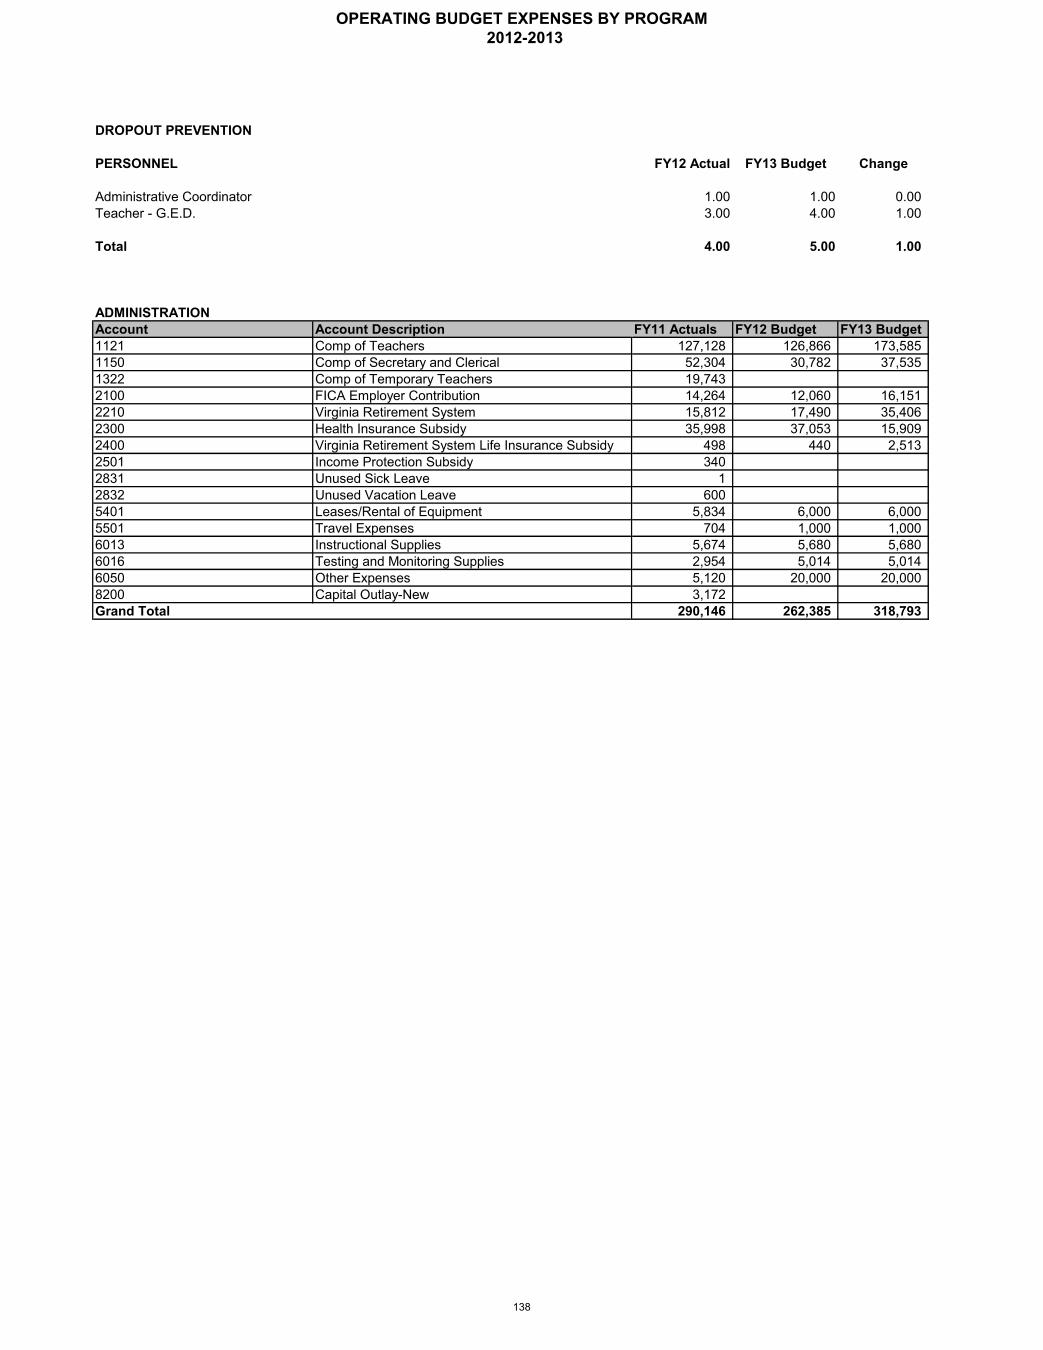
DROPOUT PREVENTION
PERSONNEL FY12 Actual FY13 Budget Change
Administrative Coordinator 1.00 1.00 0.00Teacher - G.E.D. 3.00 4.00 1.00
Total 4.00 5.00 1.00
ADMINISTRATIONAccount Account Description FY11 Actuals FY12 Budget FY13 Budget1121 Comp of Teachers 127,128 126,866 173,5851150 Comp of Secretary and Clerical 52,304 30,782 37,5351322 Comp of Temporary Teachers 19,7432100 FICA Employer Contribution 14,264 12,060 16,1512210 Virginia Retirement System 15,812 17,490 35,4062300 Health Insurance Subsidy 35,998 37,053 15,9092400 Virginia Retirement System Life Insurance Subsidy 498 440 2,5132501 Income Protection Subsidy 3402831 Unused Sick Leave 12832 Unused Vacation Leave 6005401 Leases/Rental of Equipment 5,834 6,000 6,0005501 Travel Expenses 704 1,000 1,0006013 Instructional Supplies 5,674 5,680 5,6806016 Testing and Monitoring Supplies 2,954 5,014 5,0146050 Other Expenses 5,120 20,000 20,0008200 Capital Outlay-New 3,172Grand Total 290,146 262,385 318,793
OPERATING BUDGET EXPENSES BY PROGRAM 2012-2013
138
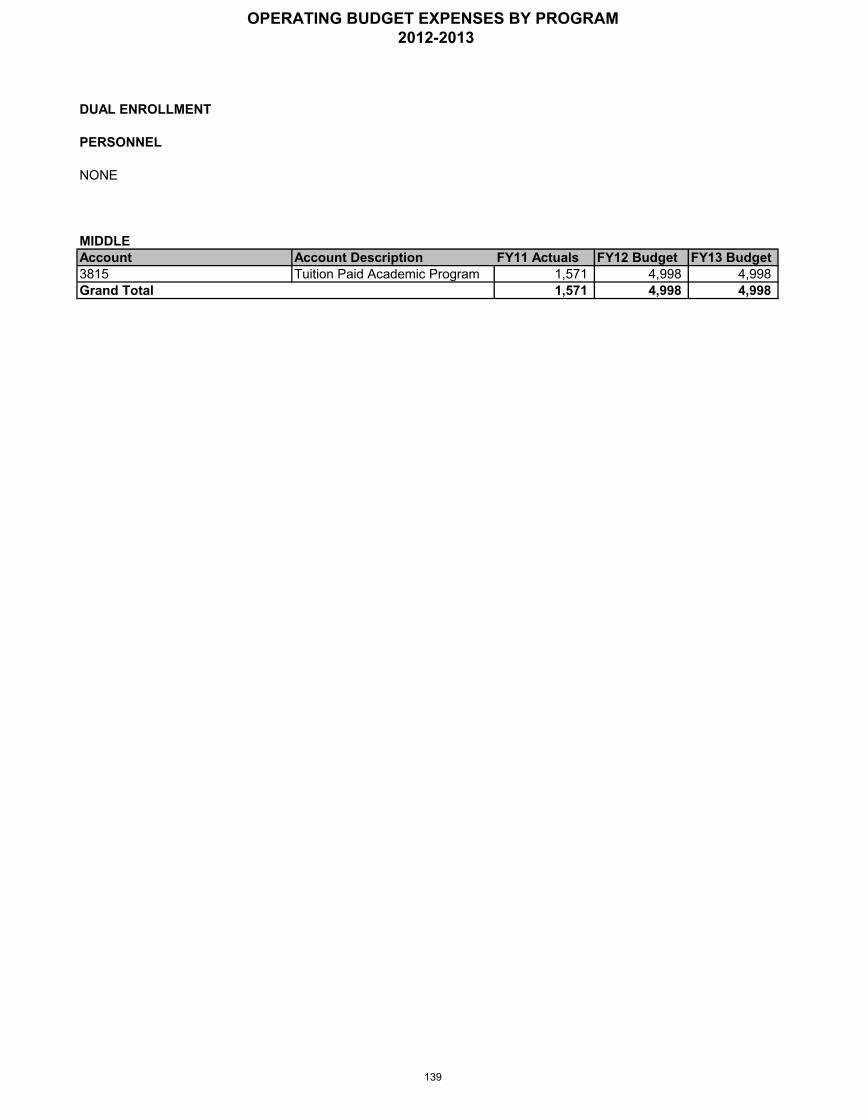
DUAL ENROLLMENT
PERSONNEL
NONE
MIDDLEAccount Account Description FY11 Actuals FY12 Budget FY13 Budget3815 Tuition Paid Academic Program 1,571 4,998 4,998Grand Total 1,571 4,998 4,998
OPERATING BUDGET EXPENSES BY PROGRAM 2012-2013
139

PERSONNEL
PERSONNEL FY12 Actual FY13 Budget Change
Administrative Secretary I 0.00 0.50 0.50Administrative Secretary III 0.00 1.00 1.00Principal 0.00 1.00 1.00
Total 0.00 2.50 2.50
ELEMENTARYAccount Account Description FY11 Actuals FY12 Budget FY13 Budget1126 Comp of Principals 14,455 88,4611141 Comp of Teacher Assistants1150 Comp of Secretary and Clerical 5,182 31,7251350 Comp of Part Time Secretary and Clerical 9,1732100 FICA Employer Contribution 1,507 9,8962210 Virginia Retirement System 1,868 20,1552300 Health Insurance Subsidy 8,4122311 Dental Insurance Subsidy 1,4312400 Virginia Retirement System Life Insurance Subsidy 555201 Postage Services 450 220 1855510 Mileage Reimbursement 250 2506001 Office Supplies 484 440 3706013 Instructional Supplies 2,099 685 4596017 Repair Parts and Supplies 194 1946050 Other Expenses 385 3258100 Capital Outlay-Replacement 703 660 555Grand Total 26,803 2,834 171,590
EARLY CHILDHOOD PROGRAMS
OPERATING BUDGET EXPENSES BY PROGRAM 2012-2013
140
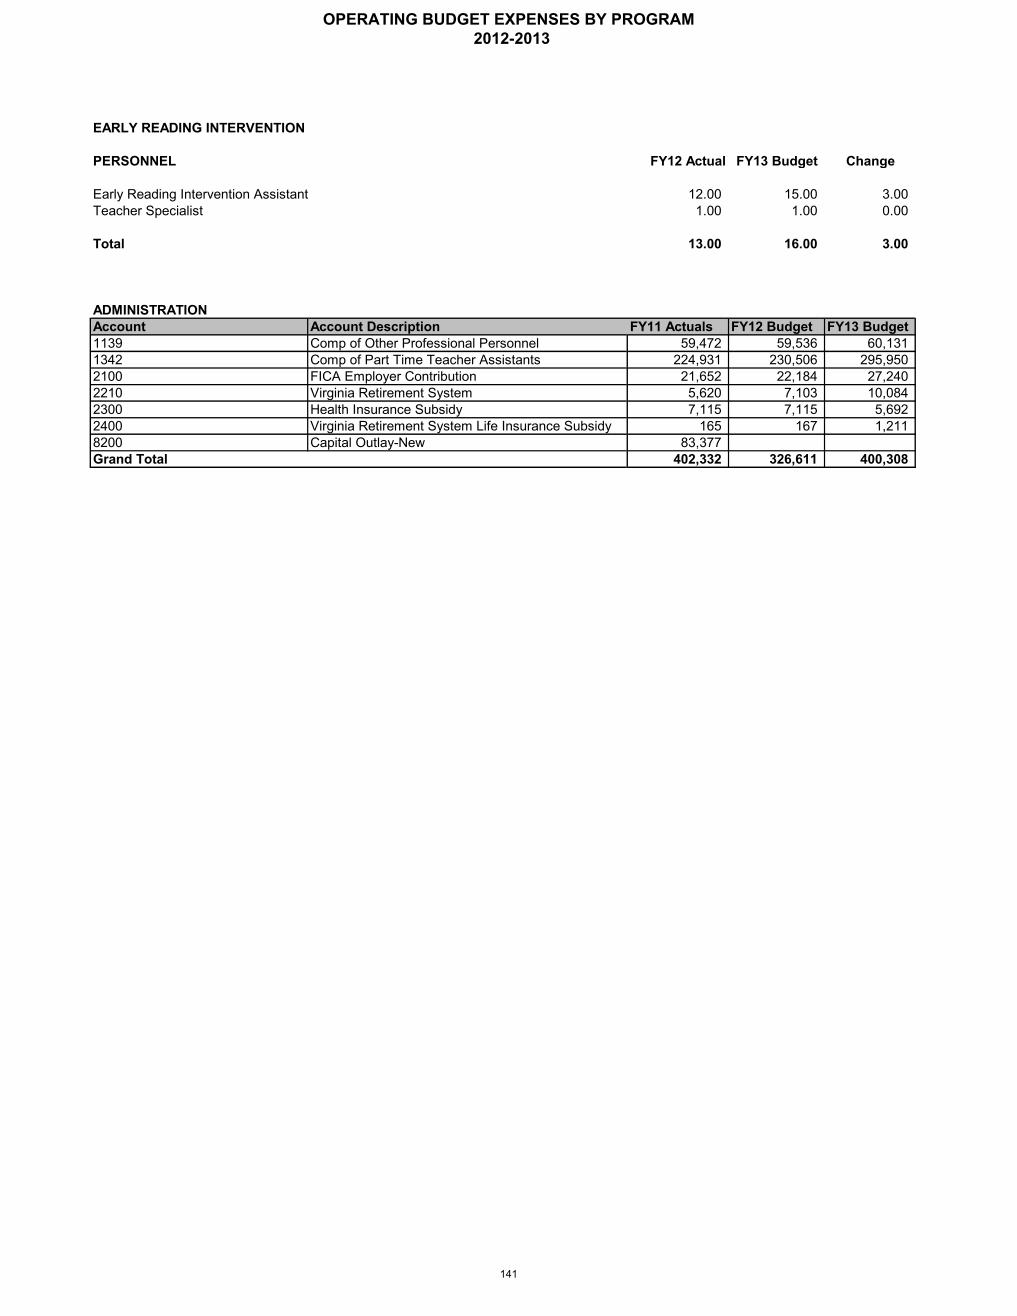
PERSONNEL FY12 Actual FY13 Budget Change
Early Reading Intervention Assistant 12.00 15.00 3.00Teacher Specialist 1.00 1.00 0.00
Total 13.00 16.00 3.00
ADMINISTRATIONAccount Account Description FY11 Actuals FY12 Budget FY13 Budget1139 Comp of Other Professional Personnel 59,472 59,536 60,1311342 Comp of Part Time Teacher Assistants 224,931 230,506 295,9502100 FICA Employer Contribution 21,652 22,184 27,2402210 Virginia Retirement System 5,620 7,103 10,0842300 Health Insurance Subsidy 7,115 7,115 5,6922400 Virginia Retirement System Life Insurance Subsidy 165 167 1,2118200 Capital Outlay-New 83,377Grand Total 402,332 326,611 400,308
EARLY READING INTERVENTION
OPERATING BUDGET EXPENSES BY PROGRAM 2012-2013
141
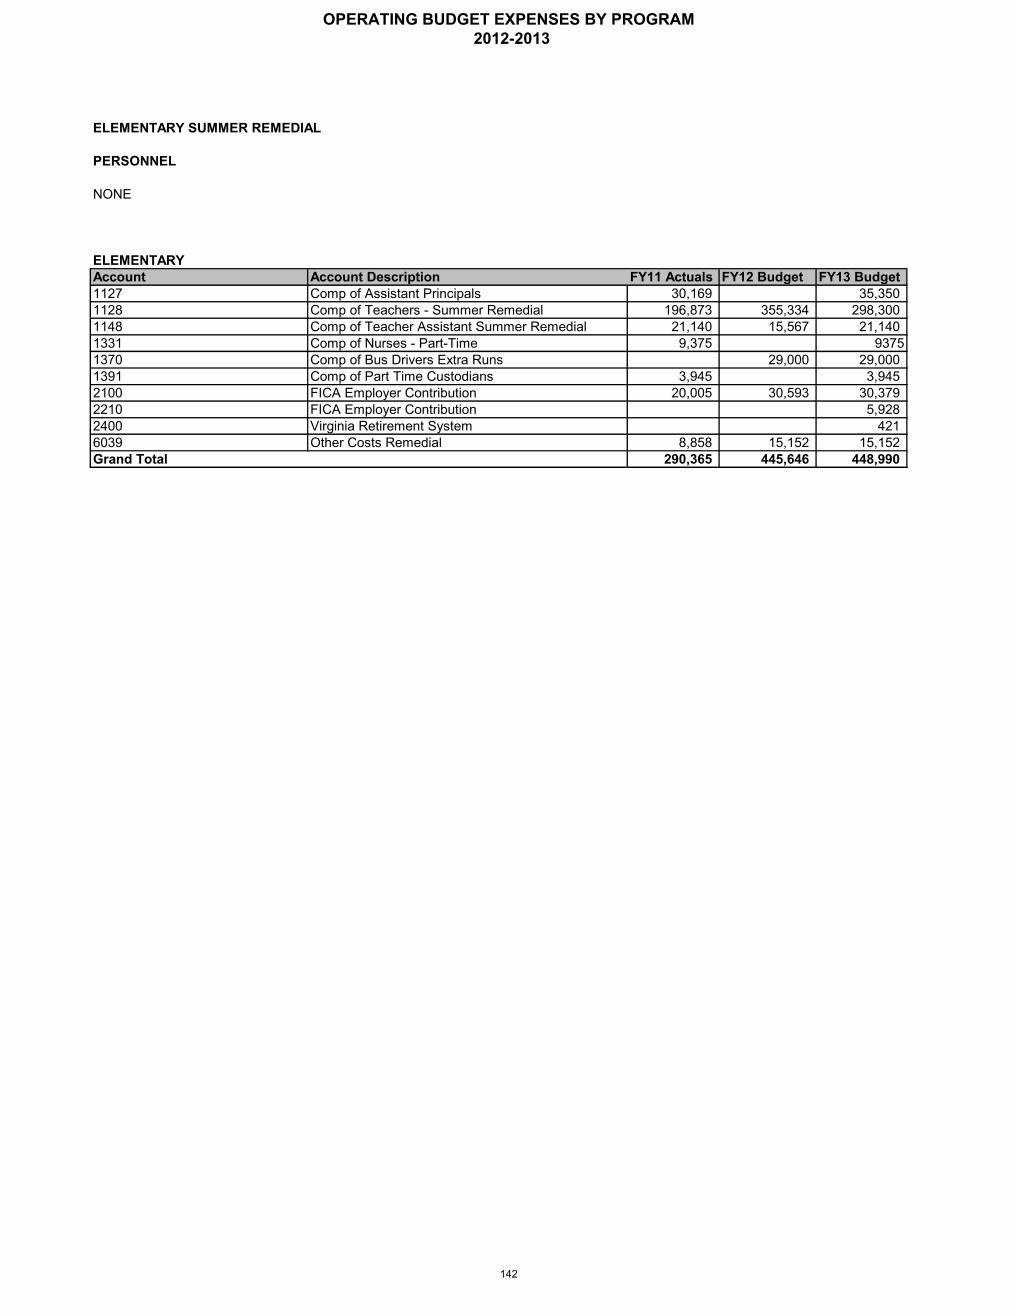
ELEMENTARY SUMMER REMEDIAL
PERSONNEL
NONE
ELEMENTARYAccount Account Description FY11 Actuals FY12 Budget FY13 Budget1127 Comp of Assistant Principals 30,169 35,3501128 Comp of Teachers - Summer Remedial 196,873 355,334 298,3001148 Comp of Teacher Assistant Summer Remedial 21,140 15,567 21,1401331 Comp of Nurses - Part-Time 9,375 93751370 Comp of Bus Drivers Extra Runs 29,000 29,0001391 Comp of Part Time Custodians 3,945 3,9452100 FICA Employer Contribution 20,005 30,593 30,3792210 FICA Employer Contribution 5,9282400 Virginia Retirement System 4216039 Other Costs Remedial 8,858 15,152 15,152Grand Total 290,365 445,646 448,990
OPERATING BUDGET EXPENSES BY PROGRAM 2012-2013
142

PERSONNEL FY12 Actual FY13 Budget Change
Administrative Support Specialist 1.00 1.00 0.00Curriculum Leader 1.00 1.00 0.00Teacher - Secondary 131.00 131.00 0.00Teacher Specialist 1.00 2.00 1.00
Total 134.00 135.00 1.00
MIDDLEAccount Account Description FY11 Actuals FY12 Budget FY13 Budget1121 Comp of Teachers 2,622,914 3,261,733 3,233,5422100 FICA Employer Contribution 193,173 249,525 247,3642210 Virginia Retirement System 247,045 385,062 526,2562300 Health Insurance Subsidy 364,218 417,014 290,3132311 Dental Insurance Subsidy 2,0422400 Virginia Retirement System Life Insurance Subsidy 7,415 9,134 38,4772501 Income Protection Subsidy 2,709Grand Total 3,439,516 4,322,468 4,335,952
HIGHAccount Account Description FY11 Actuals FY12 Budget FY13 Budget1121 Comp of Teachers 2,518,697 2,547,264 2,617,0412100 FICA Employer Contribution 185,725 194,868 200,2022210 Virginia Retirement System 235,142 291,490 425,9672300 Health Insurance Subsidy 354,705 331,972 263,1392311 Dental Insurance Subsidy 7812400 Virginia Retirement System Life Insurance Subsidy 7,263 7,133 31,1382501 Income Protection Subsidy 2,384Grand Total 3,304,697 3,372,727 3,537,487
ADMINISTRATIONAccount Account Description FY11 Actuals FY12 Budget FY13 Budget1125 Comp of Directors/Curriculum Leaders 57,891 70,516 69,8231139 Comp of Other Professional Personnel 93,778 64,226 124,3371150 Comp of Secretary and Clerical 43,360 44,088 43,6731399 Comp of Temporary Employees 1,0002100 FICA Employer Contribution 14,109 13,680 18,2712210 Virginia Retirement System 18,312 20,973 39,7512300 Health Insurance Subsidy 33,927 34,905 27,5022400 Virginia Retirement System Life Insurance Subsidy 538 493 2,3255510 Mileage Reimbursement 1197 899 1,3996001 Office Supplies 2,467 2,500 3,5006013 Instructional Supplies 45,470 46,500 46,5006047 Technology - Software / On-Line Content 99,957 100,000 78,7506050 Other Expenses 472 1,500 1,000Grand Total 411,478 400,280 457,831
7,155,691 8,095,475 8,331,270
ENGLISH AND LANGUAGE ARTS
GRAND TOTAL ENGLISH AND LANGUAGE ARTS
OPERATING BUDGET EXPENSES BY PROGRAM 2012-2013
143
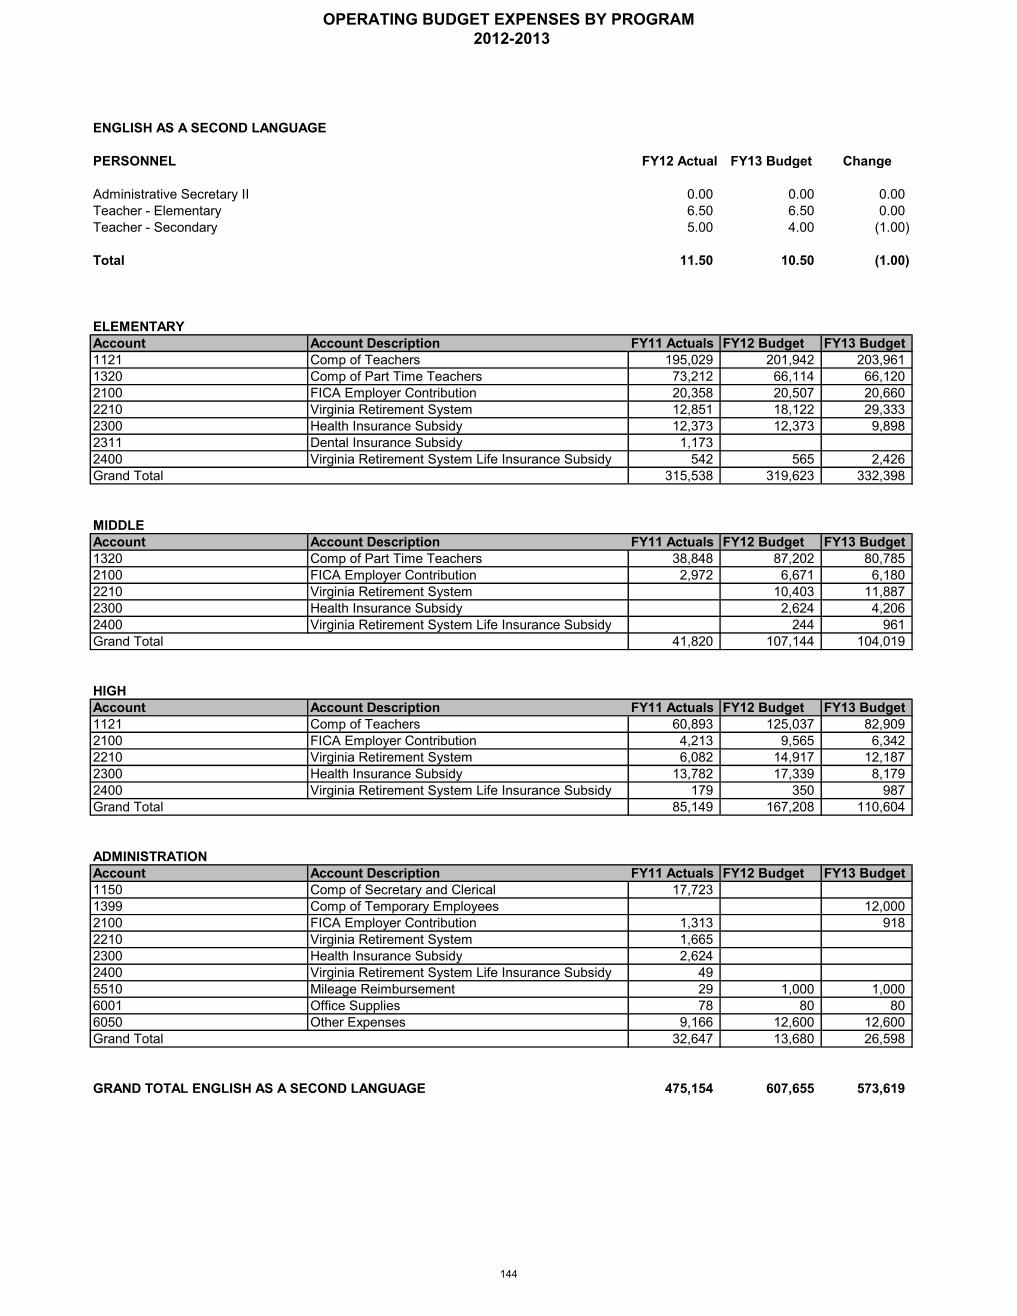
ENGLISH AS A SECOND LANGUAGE
PERSONNEL FY12 Actual FY13 Budget Change
Administrative Secretary II 0.00 0.00 0.00Teacher - Elementary 6.50 6.50 0.00Teacher - Secondary 5.00 4.00 (1.00)
Total 11.50 10.50 (1.00)
ELEMENTARYAccount Account Description FY11 Actuals FY12 Budget FY13 Budget1121 Comp of Teachers 195,029 201,942 203,9611320 Comp of Part Time Teachers 73,212 66,114 66,1202100 FICA Employer Contribution 20,358 20,507 20,6602210 Virginia Retirement System 12,851 18,122 29,3332300 Health Insurance Subsidy 12,373 12,373 9,8982311 Dental Insurance Subsidy 1,1732400 Virginia Retirement System Life Insurance Subsidy 542 565 2,426Grand Total 315,538 319,623 332,398
MIDDLEAccount Account Description FY11 Actuals FY12 Budget FY13 Budget1320 Comp of Part Time Teachers 38,848 87,202 80,7852100 FICA Employer Contribution 2,972 6,671 6,1802210 Virginia Retirement System 10,403 11,8872300 Health Insurance Subsidy 2,624 4,2062400 Virginia Retirement System Life Insurance Subsidy 244 961Grand Total 41,820 107,144 104,019
HIGHAccount Account Description FY11 Actuals FY12 Budget FY13 Budget1121 Comp of Teachers 60,893 125,037 82,9092100 FICA Employer Contribution 4,213 9,565 6,3422210 Virginia Retirement System 6,082 14,917 12,1872300 Health Insurance Subsidy 13,782 17,339 8,1792400 Virginia Retirement System Life Insurance Subsidy 179 350 987Grand Total 85,149 167,208 110,604
ADMINISTRATIONAccount Account Description FY11 Actuals FY12 Budget FY13 Budget1150 Comp of Secretary and Clerical 17,7231399 Comp of Temporary Employees 12,0002100 FICA Employer Contribution 1,313 9182210 Virginia Retirement System 1,6652300 Health Insurance Subsidy 2,6242400 Virginia Retirement System Life Insurance Subsidy 495510 Mileage Reimbursement 29 1,000 1,0006001 Office Supplies 78 80 806050 Other Expenses 9,166 12,600 12,600Grand Total 32,647 13,680 26,598
475,154 607,655 573,619GRAND TOTAL ENGLISH AS A SECOND LANGUAGE
OPERATING BUDGET EXPENSES BY PROGRAM 2012-2013
144

EXECUTIVE ADMINISTRATION SERVICES
PERSONNEL FY12 Actual FY13 Budget Change
Deputy Superintendent, Curriculum & Instruction 1.00 1.00 0.00Deputy Superintendent, Facilities & Business Support 1.00 1.00 0.00Director, Community & Legislative Relations 1.00 1.00 0.00Executive Assistant 1.00 1.00 0.00Executive Secretary 1.00 1.00 0.00Legal Assistant 1.00 1.00 0.00School Board Attorney 1.00 1.00 0.00Superintendent 1.00 1.00 0.00
Change 8.00 8.00 0.00
ADMINISTRATIONAccount Account Description FY11 Actuals FY12 Budget FY13 Budget1112 Comp of Superintendent 179,280 172,332 186,3691113 Comp of Deputy Superintendents 239,788 245,834 243,4481125 Comp of Directors/Curriculum Leaders 68,179 69,686 69,0151139 Comp of Other Professional Personnel 106,362 108,987 108,7331150 Comp of Secretary and Clerical 132,991 135,434 134,0961399 Comp of Temporary Employees 2,8042100 FICA Employer Contribution 46,231 56,018 56,7372210 Virginia Retirement System 72,274 96,989 122,9352300 Health Insurance Subsidy 68,170 68,170 51,6932311 Dental Insurance Subsidy 5052400 Virginia Retirement System Life Insurance Subsidy 2,128 1,995 8,7242832 Unused Vacation Leave 9,7423145 Professional Services 75,169 47,000 45,0005401 Leases/Rental of Equipment 3,360 3,3605501 Travel Expenses 7,393 10,416 10,9165510 Mileage Reimbursement 1,046 1,0465802 Dues and Association Memberships 17,959 15,273 22,5006001 Office Supplies 2,089 2,209 2,2096013 Instructional Supplies 236,740 10,000 10,0006039 Other Costs Remedial 25,181 14,6816047 Technology - Software / On-Line Content 4,7756050 Other Expenses 14,008 23,143 25,6438200 Capital Outlay-New 1,077Grand Total 1,287,663 1,093,073 1,117,105
OPERATING BUDGET EXPENSES BY PROGRAM 2012-2013
145
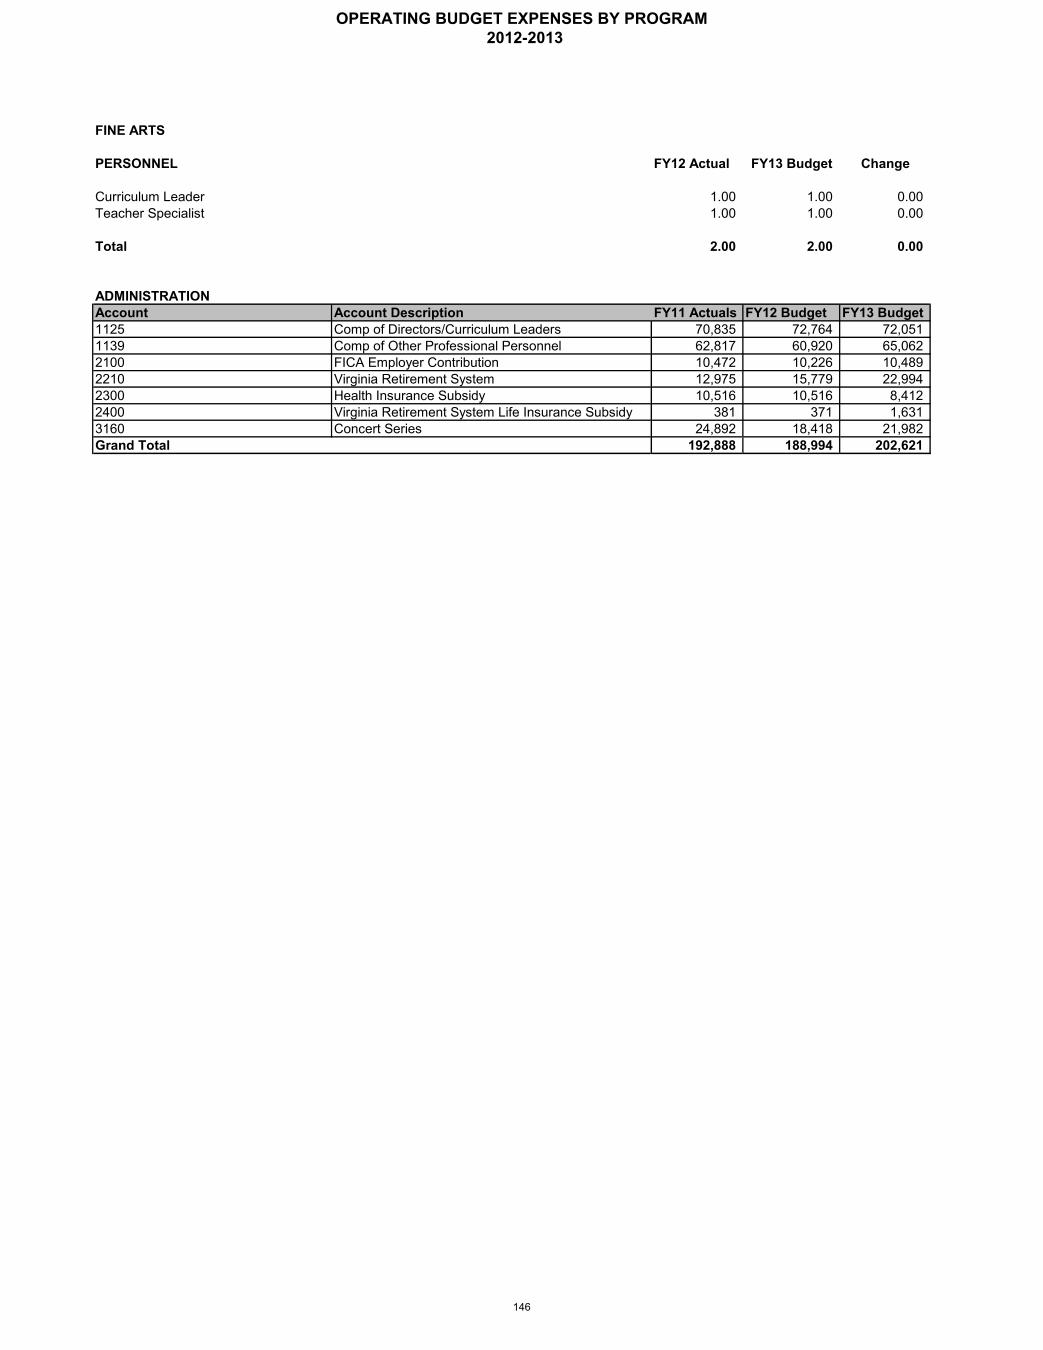
FINE ARTS
PERSONNEL FY12 Actual FY13 Budget Change
Curriculum Leader 1.00 1.00 0.00Teacher Specialist 1.00 1.00 0.00
Total 2.00 2.00 0.00
ADMINISTRATIONAccount Account Description FY11 Actuals FY12 Budget FY13 Budget1125 Comp of Directors/Curriculum Leaders 70,835 72,764 72,0511139 Comp of Other Professional Personnel 62,817 60,920 65,0622100 FICA Employer Contribution 10,472 10,226 10,4892210 Virginia Retirement System 12,975 15,779 22,9942300 Health Insurance Subsidy 10,516 10,516 8,4122400 Virginia Retirement System Life Insurance Subsidy 381 371 1,6313160 Concert Series 24,892 18,418 21,982Grand Total 192,888 188,994 202,621
OPERATING BUDGET EXPENSES BY PROGRAM 2012-2013
146
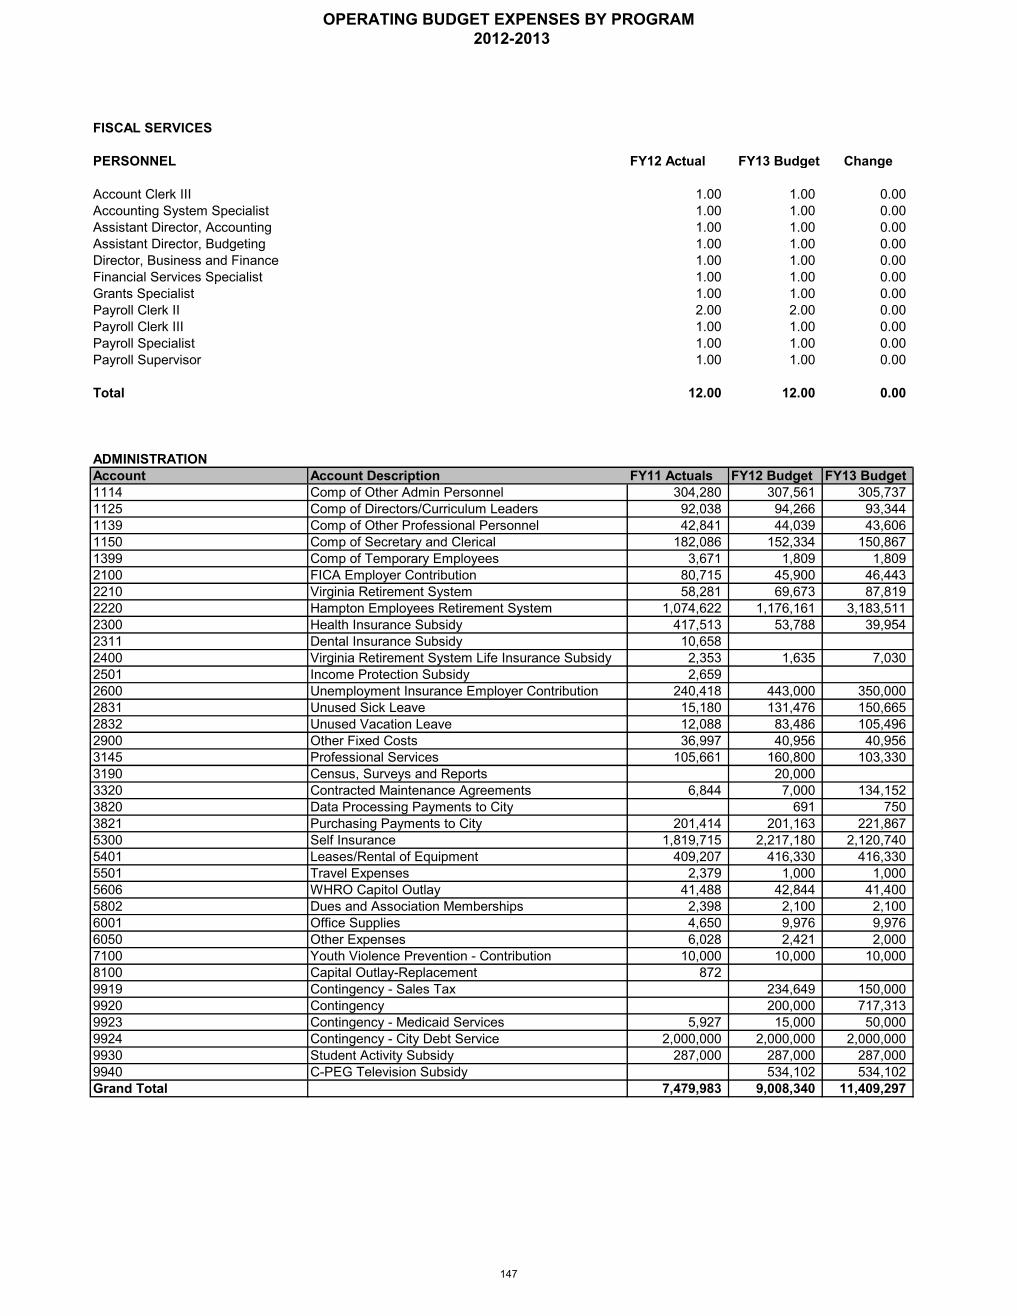
FISCAL SERVICES
PERSONNEL FY12 Actual FY13 Budget Change
Account Clerk III 1.00 1.00 0.00Accounting System Specialist 1.00 1.00 0.00Assistant Director, Accounting 1.00 1.00 0.00Assistant Director, Budgeting 1.00 1.00 0.00Director, Business and Finance 1.00 1.00 0.00Financial Services Specialist 1.00 1.00 0.00Grants Specialist 1.00 1.00 0.00Payroll Clerk II 2.00 2.00 0.00Payroll Clerk III 1.00 1.00 0.00Payroll Specialist 1.00 1.00 0.00Payroll Supervisor 1.00 1.00 0.00
Total 12.00 12.00 0.00
ADMINISTRATIONAccount Account Description FY11 Actuals FY12 Budget FY13 Budget1114 Comp of Other Admin Personnel 304,280 307,561 305,7371125 Comp of Directors/Curriculum Leaders 92,038 94,266 93,3441139 Comp of Other Professional Personnel 42,841 44,039 43,6061150 Comp of Secretary and Clerical 182,086 152,334 150,8671399 Comp of Temporary Employees 3,671 1,809 1,8092100 FICA Employer Contribution 80,715 45,900 46,4432210 Virginia Retirement System 58,281 69,673 87,8192220 Hampton Employees Retirement System 1,074,622 1,176,161 3,183,5112300 Health Insurance Subsidy 417,513 53,788 39,9542311 Dental Insurance Subsidy 10,6582400 Virginia Retirement System Life Insurance Subsidy 2,353 1,635 7,0302501 Income Protection Subsidy 2,6592600 Unemployment Insurance Employer Contribution 240,418 443,000 350,0002831 Unused Sick Leave 15,180 131,476 150,6652832 Unused Vacation Leave 12,088 83,486 105,4962900 Other Fixed Costs 36,997 40,956 40,9563145 Professional Services 105,661 160,800 103,3303190 Census, Surveys and Reports 20,0003320 Contracted Maintenance Agreements 6,844 7,000 134,1523820 Data Processing Payments to City 691 7503821 Purchasing Payments to City 201,414 201,163 221,8675300 Self Insurance 1,819,715 2,217,180 2,120,7405401 Leases/Rental of Equipment 409,207 416,330 416,3305501 Travel Expenses 2,379 1,000 1,0005606 WHRO Capitol Outlay 41,488 42,844 41,4005802 Dues and Association Memberships 2,398 2,100 2,1006001 Office Supplies 4,650 9,976 9,9766050 Other Expenses 6,028 2,421 2,0007100 Youth Violence Prevention - Contribution 10,000 10,000 10,0008100 Capital Outlay-Replacement 8729919 Contingency - Sales Tax 234,649 150,0009920 Contingency 200,000 717,3139923 Contingency - Medicaid Services 5,927 15,000 50,0009924 Contingency - City Debt Service 2,000,000 2,000,000 2,000,0009930 Student Activity Subsidy 287,000 287,000 287,0009940 C-PEG Television Subsidy 534,102 534,102Grand Total 7,479,983 9,008,340 11,409,297
OPERATING BUDGET EXPENSES BY PROGRAM 2012-2013
147
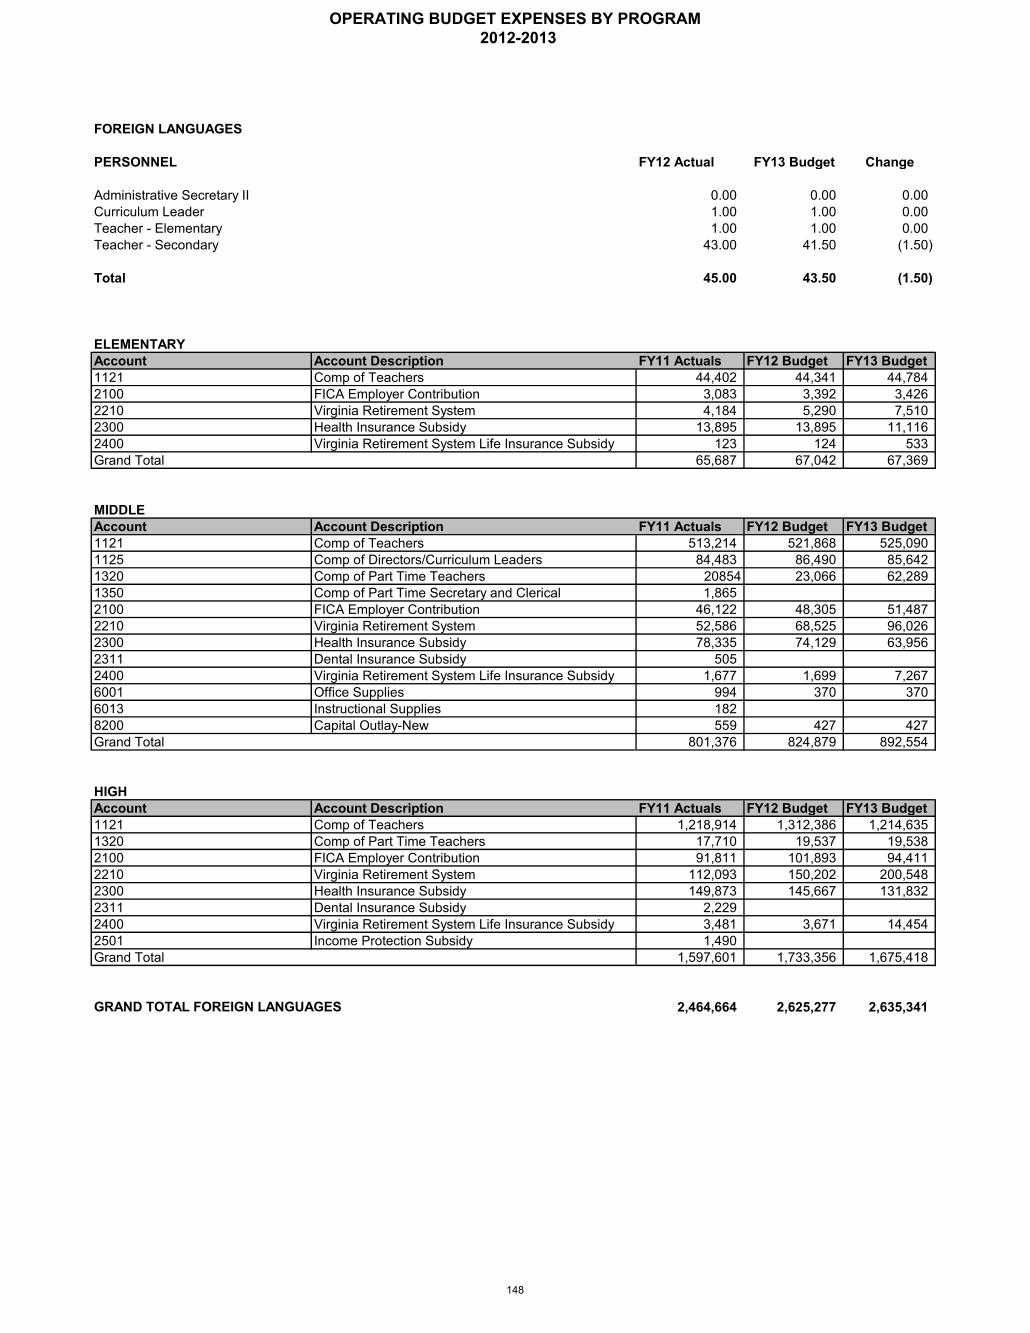
FOREIGN LANGUAGES
PERSONNEL FY12 Actual FY13 Budget Change
Administrative Secretary II 0.00 0.00 0.00Curriculum Leader 1.00 1.00 0.00Teacher - Elementary 1.00 1.00 0.00Teacher - Secondary 43.00 41.50 (1.50)
Total 45.00 43.50 (1.50)
ELEMENTARYAccount Account Description FY11 Actuals FY12 Budget FY13 Budget1121 Comp of Teachers 44,402 44,341 44,7842100 FICA Employer Contribution 3,083 3,392 3,4262210 Virginia Retirement System 4,184 5,290 7,5102300 Health Insurance Subsidy 13,895 13,895 11,1162400 Virginia Retirement System Life Insurance Subsidy 123 124 533Grand Total 65,687 67,042 67,369
MIDDLEAccount Account Description FY11 Actuals FY12 Budget FY13 Budget1121 Comp of Teachers 513,214 521,868 525,0901125 Comp of Directors/Curriculum Leaders 84,483 86,490 85,6421320 Comp of Part Time Teachers 20854 23,066 62,2891350 Comp of Part Time Secretary and Clerical 1,8652100 FICA Employer Contribution 46,122 48,305 51,4872210 Virginia Retirement System 52,586 68,525 96,0262300 Health Insurance Subsidy 78,335 74,129 63,9562311 Dental Insurance Subsidy 5052400 Virginia Retirement System Life Insurance Subsidy 1,677 1,699 7,2676001 Office Supplies 994 370 3706013 Instructional Supplies 1828200 Capital Outlay-New 559 427 427Grand Total 801,376 824,879 892,554
HIGHAccount Account Description FY11 Actuals FY12 Budget FY13 Budget1121 Comp of Teachers 1,218,914 1,312,386 1,214,6351320 Comp of Part Time Teachers 17,710 19,537 19,5382100 FICA Employer Contribution 91,811 101,893 94,4112210 Virginia Retirement System 112,093 150,202 200,5482300 Health Insurance Subsidy 149,873 145,667 131,8322311 Dental Insurance Subsidy 2,2292400 Virginia Retirement System Life Insurance Subsidy 3,481 3,671 14,4542501 Income Protection Subsidy 1,490Grand Total 1,597,601 1,733,356 1,675,418
2,464,664 2,625,277 2,635,341GRAND TOTAL FOREIGN LANGUAGES
OPERATING BUDGET EXPENSES BY PROGRAM 2012-2013
148
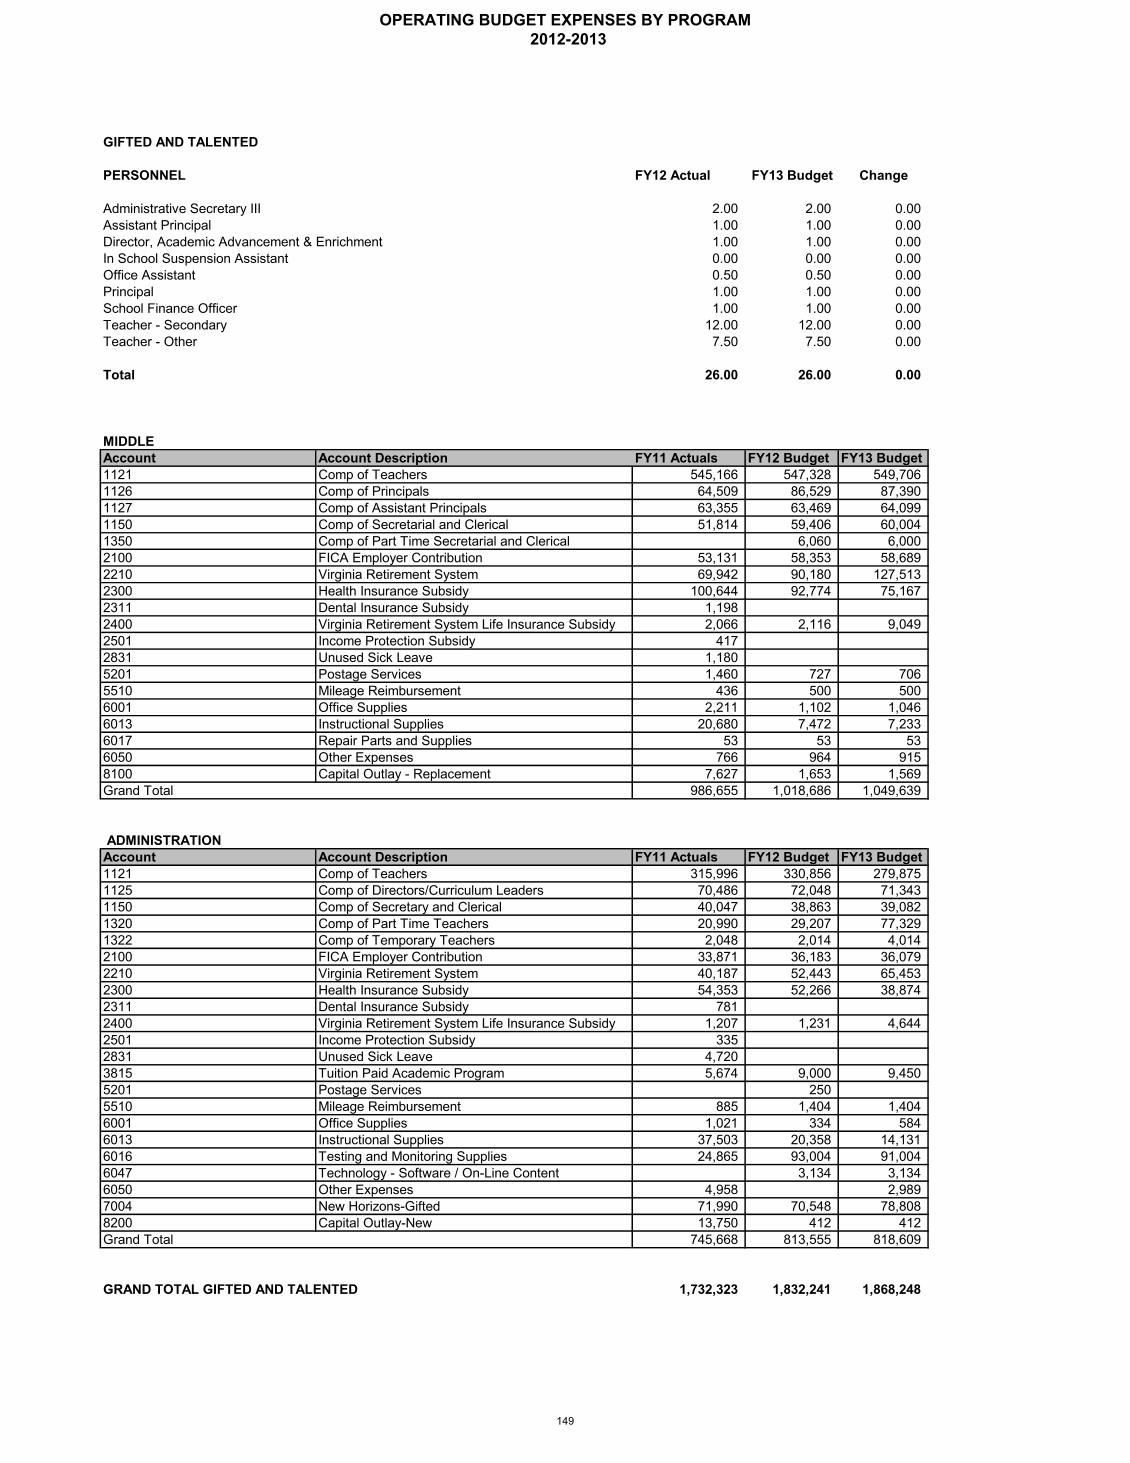
PERSONNEL FY12 Actual FY13 Budget Change
Administrative Secretary III 2.00 2.00 0.00Assistant Principal 1.00 1.00 0.00Director, Academic Advancement & Enrichment 1.00 1.00 0.00In School Suspension Assistant 0.00 0.00 0.00Office Assistant 0.50 0.50 0.00Principal 1.00 1.00 0.00School Finance Officer 1.00 1.00 0.00Teacher - Secondary 12.00 12.00 0.00Teacher - Other 7.50 7.50 0.00
Total 26.00 26.00 0.00
MIDDLEAccount Account Description FY11 Actuals FY12 Budget FY13 Budget1121 Comp of Teachers 545,166 547,328 549,7061126 Comp of Principals 64,509 86,529 87,3901127 Comp of Assistant Principals 63,355 63,469 64,0991150 Comp of Secretarial and Clerical 51,814 59,406 60,0041350 Comp of Part Time Secretarial and Clerical 6,060 6,0002100 FICA Employer Contribution 53,131 58,353 58,6892210 Virginia Retirement System 69,942 90,180 127,5132300 Health Insurance Subsidy 100,644 92,774 75,1672311 Dental Insurance Subsidy 1,1982400 Virginia Retirement System Life Insurance Subsidy 2,066 2,116 9,0492501 Income Protection Subsidy 4172831 Unused Sick Leave 1,1805201 Postage Services 1,460 727 7065510 Mileage Reimbursement 436 500 5006001 Office Supplies 2,211 1,102 1,0466013 Instructional Supplies 20,680 7,472 7,2336017 Repair Parts and Supplies 53 53 536050 Other Expenses 766 964 9158100 Capital Outlay - Replacement 7,627 1,653 1,569Grand Total 986,655 1,018,686 1,049,639
ADMINISTRATIONAccount Account Description FY11 Actuals FY12 Budget FY13 Budget1121 Comp of Teachers 315,996 330,856 279,8751125 Comp of Directors/Curriculum Leaders 70,486 72,048 71,3431150 Comp of Secretary and Clerical 40,047 38,863 39,0821320 Comp of Part Time Teachers 20,990 29,207 77,3291322 Comp of Temporary Teachers 2,048 2,014 4,0142100 FICA Employer Contribution 33,871 36,183 36,0792210 Virginia Retirement System 40,187 52,443 65,4532300 Health Insurance Subsidy 54,353 52,266 38,8742311 Dental Insurance Subsidy 7812400 Virginia Retirement System Life Insurance Subsidy 1,207 1,231 4,6442501 Income Protection Subsidy 3352831 Unused Sick Leave 4,7203815 Tuition Paid Academic Program 5,674 9,000 9,4505201 Postage Services 2505510 Mileage Reimbursement 885 1,404 1,4046001 Office Supplies 1,021 334 5846013 Instructional Supplies 37,503 20,358 14,1316016 Testing and Monitoring Supplies 24,865 93,004 91,0046047 Technology - Software / On-Line Content 3,134 3,1346050 Other Expenses 4,958 2,9897004 New Horizons-Gifted 71,990 70,548 78,8088200 Capital Outlay-New 13,750 412 412Grand Total 745,668 813,555 818,609
1,732,323 1,832,241 1,868,248
GIFTED AND TALENTED
GRAND TOTAL GIFTED AND TALENTED
OPERATING BUDGET EXPENSES BY PROGRAM 2012-2013
149

GUIDANCE SERVICES
PERSONNEL FY12 Actual FY13 Budget Change
Administrative Secretary II 12.00 12.00 0.00Administrative Secretary III 1.00 1.00 0.00Director, School Counseling 1.00 1.00 0.00Guidance Counselor - Elementary 19.00 19.00 0.00Guidance Counselor - Secondary 37.00 37.00 0.00School Counseling Coordinator 4.00 4.00 0.00Teacher - SAT Prep 0.00 0.00 0.00
Total 74.00 74.00 0.00
ELEMENTARYAccount Account Description FY11 Actuals FY12 Budget FY13 Budget1123 Comp of Deans and Guidance Counselors 957,839 964,654 931,6842100 FICA Employer Contribution 70,367 73,798 71,2732210 Virginia Retirement System 91,941 115,084 156,2442300 Health Insurance Subsidy 134,125 131,923 107,1162311 Dental Insurance Subsidy 5052400 Virginia Retirement System Life Insurance Subsidy 2,714 2,701 11,0882501 Income Protection Subsidy 795Grand Total 1,258,286 1,288,160 1,277,405
MIDDLEAccount Account Description FY11 Actuals FY12 Budget FY13 Budget1123 Comp of Deans and Guidance Counselors 728,925 769,419 768,8851150 Comp of Secretary and Clerical 241,578 241,491 245,2301339 Comp of Part Time Professional Personnel 16,966 40,995 20,5502100 FICA Employer Contribution 72,730 80,471 79,1532210 Virginia Retirement System 90,621 120,507 169,9322300 Health Insurance Subsidy 136,944 142,792 105,7602311 Dental Insurance Subsidy 1,2252400 Virginia Retirement System Life Insurance Subsidy 2,704 2,829 12,0582501 Income Protection Subsidy 8572831 Unused Sick Leave 2272832 Unused Vacation Leave 887Grand Total 1,293,664 1,398,504 1,401,568
HIGHAccount Account Description FY11 Actuals FY12 Budget FY13 Budget1123 Comp of Deans and Guidance Counselors 1,220,841 1,183,352 1,236,0671150 Comp of Secretary and Clerical 112,536 114,978 124,1862100 FICA Employer Contribution 99,504 99,323 104,0612210 Virginia Retirement System 122,103 154,891 226,9502300 Health Insurance Subsidy 147,115 139,149 128,6822311 Dental Insurance Subsidy 35072400 Virginia Retirement System Life Insurance Subsidy 3,636 3,637 16,1882501 Income Protection Subsidy 3792831 Unused Sick Leave 482832 Unused Vacation Leave 2,701Grand Total 1,712,370 1,695,330 1,836,134
OPERATING BUDGET EXPENSES BY PROGRAM 2012-2013
150

GUIDANCE SERVICES
ADMINISTRATIONAccount Account Description FY11 Actuals FY12 Budget FY13 Budget1125 Comp of Directors/Curriculum Leaders 75,903 77,638 76,8811150 Comp of Secretary and Clerical 44,201 45,631 44,5702100 FICA Employer Contribution 9,091 9,430 9,2912210 Virginia Retirement System 11,347 14,368 20,2972300 Health Insurance Subsidy 10,513 10,516 8,4122400 Virginia Retirement System Life Insurance Subsidy 333 337 1,4406001 Office Supplies 344 350 3506013 Instructional Supplies 2,890 2,767 2,7678200 Capital Outlay - New 538Grand Total 155,160 161,037 164,008
GRAND TOTAL GUIDANCE SERVICES 4,419,480 4,543,031 4,679,115
OPERATING BUDGET EXPENSES BY PROGRAM 2012-2013
151
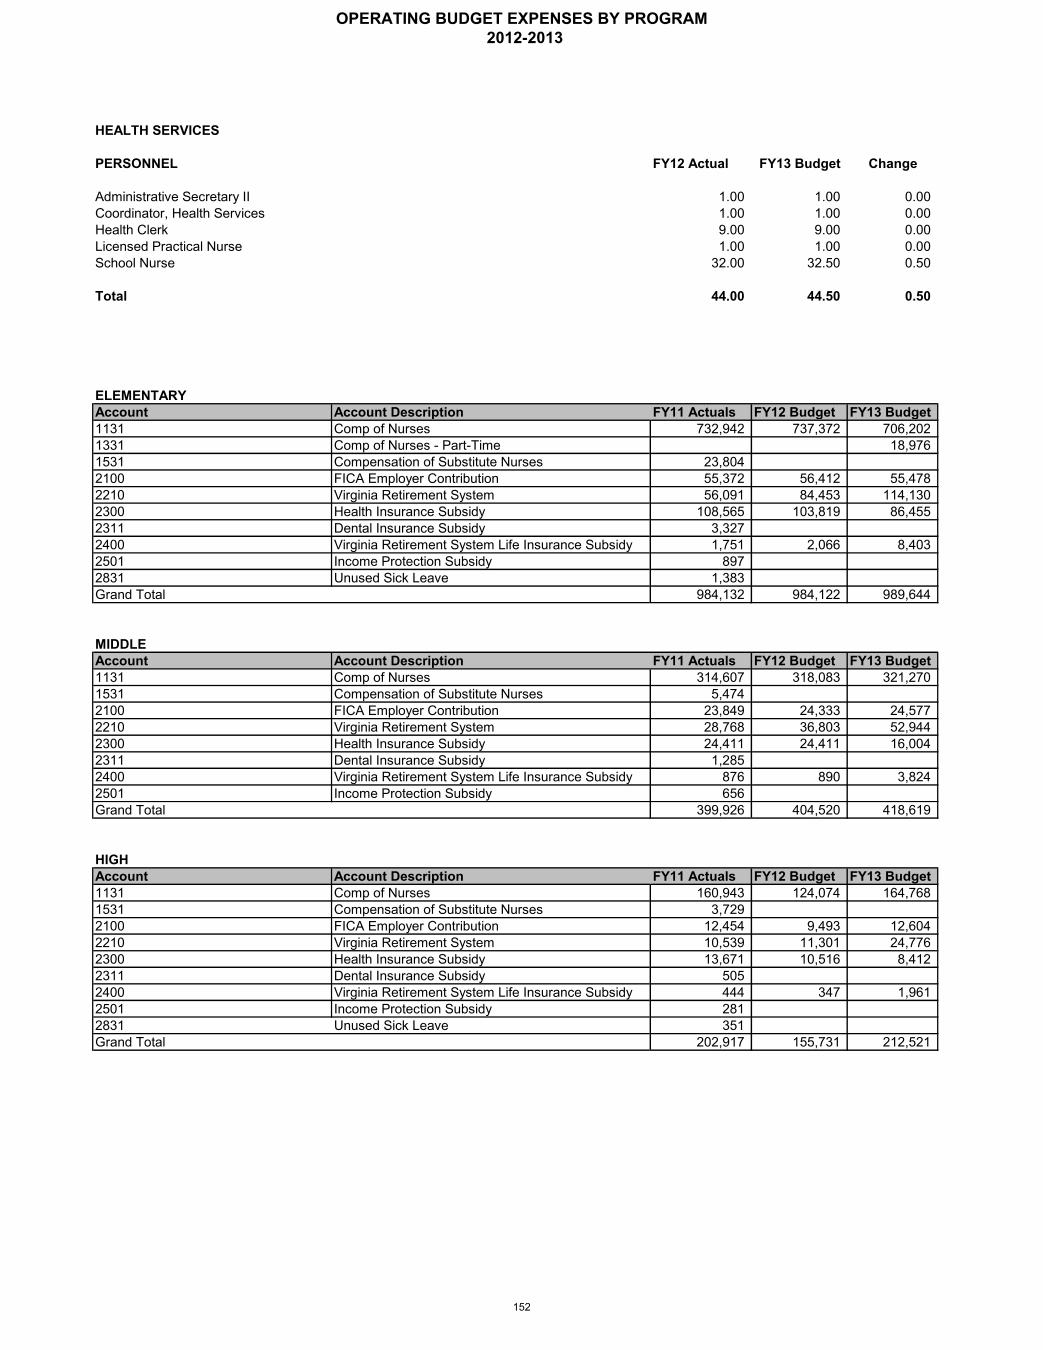
HEALTH SERVICES
PERSONNEL FY12 Actual FY13 Budget Change
Administrative Secretary II 1.00 1.00 0.00Coordinator, Health Services 1.00 1.00 0.00Health Clerk 9.00 9.00 0.00Licensed Practical Nurse 1.00 1.00 0.00School Nurse 32.00 32.50 0.50
Total 44.00 44.50 0.50
ELEMENTARYAccount Account Description FY11 Actuals FY12 Budget FY13 Budget1131 Comp of Nurses 732,942 737,372 706,2021331 Comp of Nurses - Part-Time 18,9761531 Compensation of Substitute Nurses 23,8042100 FICA Employer Contribution 55,372 56,412 55,4782210 Virginia Retirement System 56,091 84,453 114,1302300 Health Insurance Subsidy 108,565 103,819 86,4552311 Dental Insurance Subsidy 3,3272400 Virginia Retirement System Life Insurance Subsidy 1,751 2,066 8,4032501 Income Protection Subsidy 8972831 Unused Sick Leave 1,383Grand Total 984,132 984,122 989,644
MIDDLEAccount Account Description FY11 Actuals FY12 Budget FY13 Budget1131 Comp of Nurses 314,607 318,083 321,2701531 Compensation of Substitute Nurses 5,4742100 FICA Employer Contribution 23,849 24,333 24,5772210 Virginia Retirement System 28,768 36,803 52,9442300 Health Insurance Subsidy 24,411 24,411 16,0042311 Dental Insurance Subsidy 1,2852400 Virginia Retirement System Life Insurance Subsidy 876 890 3,8242501 Income Protection Subsidy 656Grand Total 399,926 404,520 418,619
HIGHAccount Account Description FY11 Actuals FY12 Budget FY13 Budget1131 Comp of Nurses 160,943 124,074 164,7681531 Compensation of Substitute Nurses 3,7292100 FICA Employer Contribution 12,454 9,493 12,6042210 Virginia Retirement System 10,539 11,301 24,7762300 Health Insurance Subsidy 13,671 10,516 8,4122311 Dental Insurance Subsidy 5052400 Virginia Retirement System Life Insurance Subsidy 444 347 1,9612501 Income Protection Subsidy 2812831 Unused Sick Leave 351Grand Total 202,917 155,731 212,521
OPERATING BUDGET EXPENSES BY PROGRAM 2012-2013
152
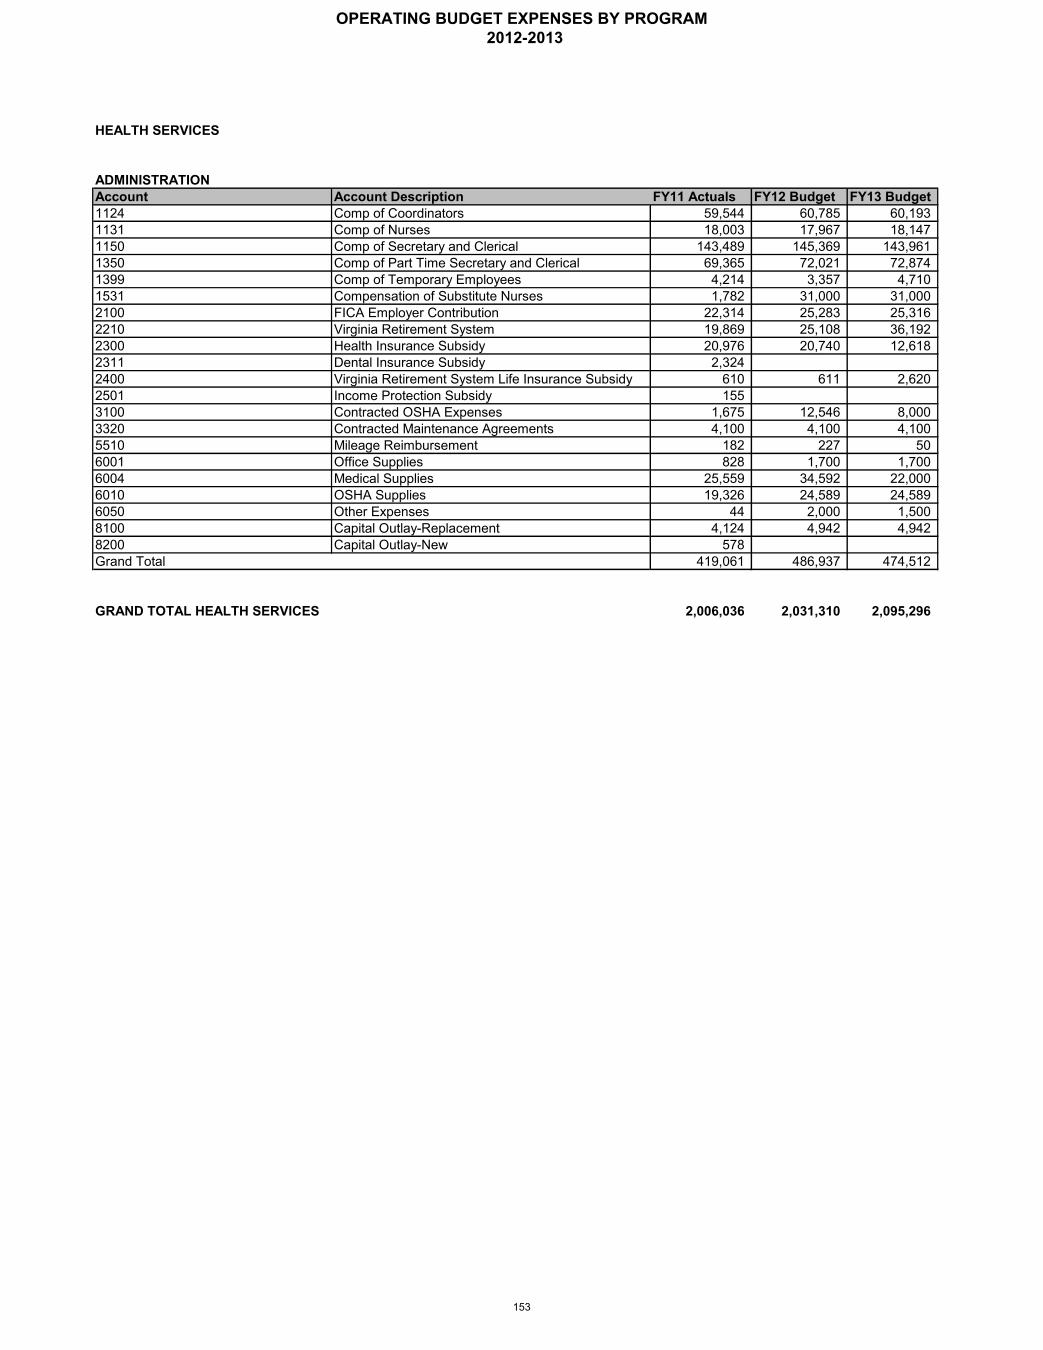
HEALTH SERVICES
ADMINISTRATIONAccount Account Description FY11 Actuals FY12 Budget FY13 Budget1124 Comp of Coordinators 59,544 60,785 60,1931131 Comp of Nurses 18,003 17,967 18,1471150 Comp of Secretary and Clerical 143,489 145,369 143,9611350 Comp of Part Time Secretary and Clerical 69,365 72,021 72,8741399 Comp of Temporary Employees 4,214 3,357 4,7101531 Compensation of Substitute Nurses 1,782 31,000 31,0002100 FICA Employer Contribution 22,314 25,283 25,3162210 Virginia Retirement System 19,869 25,108 36,1922300 Health Insurance Subsidy 20,976 20,740 12,6182311 Dental Insurance Subsidy 2,3242400 Virginia Retirement System Life Insurance Subsidy 610 611 2,6202501 Income Protection Subsidy 1553100 Contracted OSHA Expenses 1,675 12,546 8,0003320 Contracted Maintenance Agreements 4,100 4,100 4,1005510 Mileage Reimbursement 182 227 506001 Office Supplies 828 1,700 1,7006004 Medical Supplies 25,559 34,592 22,0006010 OSHA Supplies 19,326 24,589 24,5896050 Other Expenses 44 2,000 1,5008100 Capital Outlay-Replacement 4,124 4,942 4,9428200 Capital Outlay-New 578Grand Total 419,061 486,937 474,512
GRAND TOTAL HEALTH SERVICES 2,006,036 2,031,310 2,095,296
OPERATING BUDGET EXPENSES BY PROGRAM 2012-2013
153
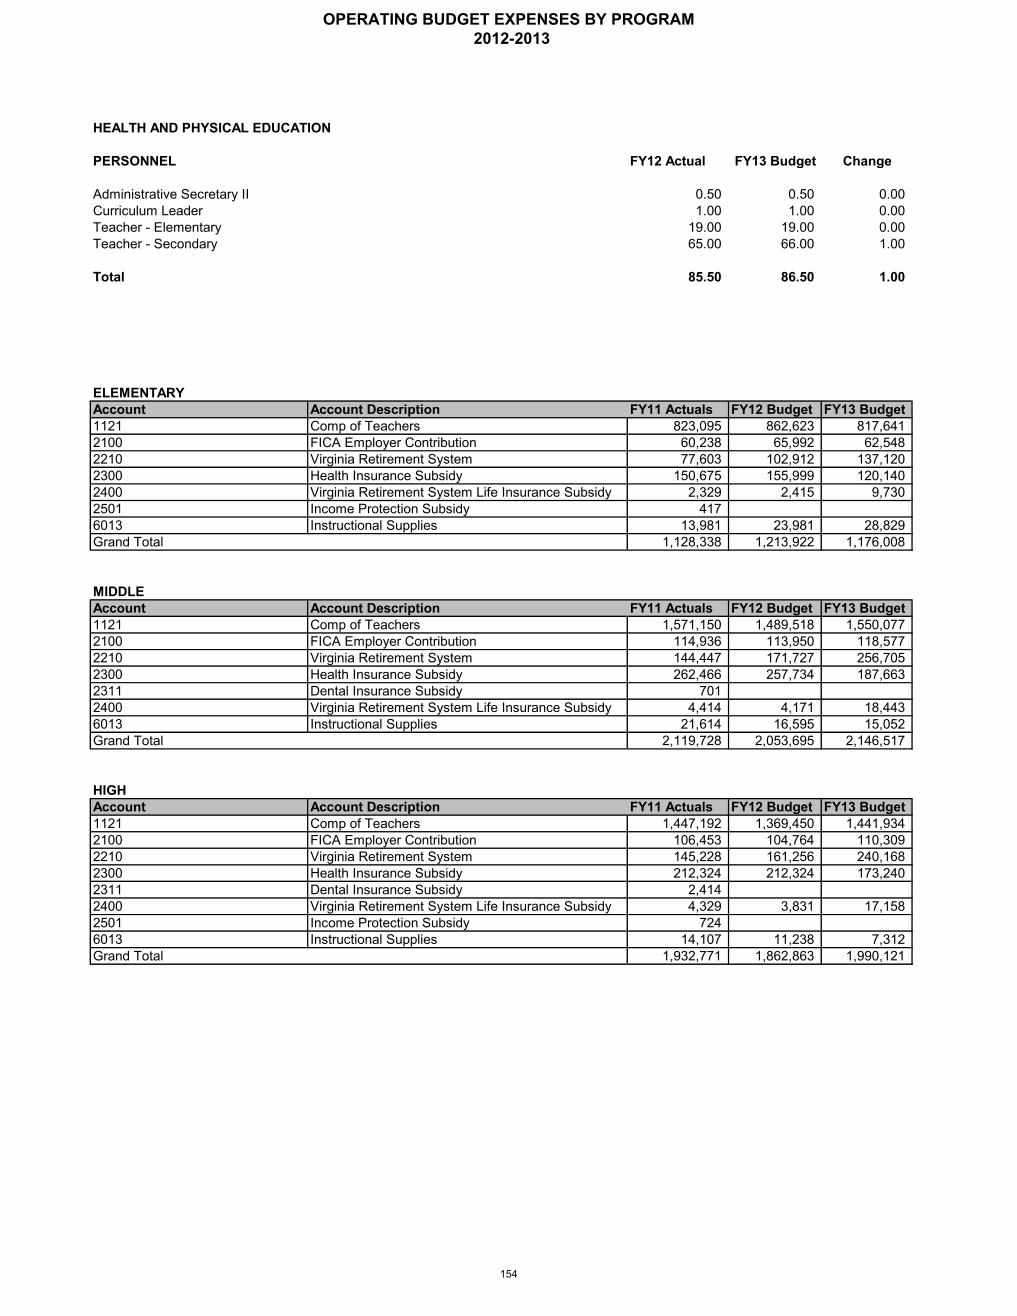
PERSONNEL FY12 Actual FY13 Budget Change
Administrative Secretary II 0.50 0.50 0.00Curriculum Leader 1.00 1.00 0.00Teacher - Elementary 19.00 19.00 0.00Teacher - Secondary 65.00 66.00 1.00
Total 85.50 86.50 1.00
ELEMENTARYAccount Account Description FY11 Actuals FY12 Budget FY13 Budget1121 Comp of Teachers 823,095 862,623 817,6412100 FICA Employer Contribution 60,238 65,992 62,5482210 Virginia Retirement System 77,603 102,912 137,1202300 Health Insurance Subsidy 150,675 155,999 120,1402400 Virginia Retirement System Life Insurance Subsidy 2,329 2,415 9,7302501 Income Protection Subsidy 4176013 Instructional Supplies 13,981 23,981 28,829Grand Total 1,128,338 1,213,922 1,176,008
MIDDLEAccount Account Description FY11 Actuals FY12 Budget FY13 Budget1121 Comp of Teachers 1,571,150 1,489,518 1,550,0772100 FICA Employer Contribution 114,936 113,950 118,5772210 Virginia Retirement System 144,447 171,727 256,7052300 Health Insurance Subsidy 262,466 257,734 187,6632311 Dental Insurance Subsidy 7012400 Virginia Retirement System Life Insurance Subsidy 4,414 4,171 18,4436013 Instructional Supplies 21,614 16,595 15,052Grand Total 2,119,728 2,053,695 2,146,517
HIGHAccount Account Description FY11 Actuals FY12 Budget FY13 Budget1121 Comp of Teachers 1,447,192 1,369,450 1,441,9342100 FICA Employer Contribution 106,453 104,764 110,3092210 Virginia Retirement System 145,228 161,256 240,1682300 Health Insurance Subsidy 212,324 212,324 173,2402311 Dental Insurance Subsidy 2,4142400 Virginia Retirement System Life Insurance Subsidy 4,329 3,831 17,1582501 Income Protection Subsidy 7246013 Instructional Supplies 14,107 11,238 7,312Grand Total 1,932,771 1,862,863 1,990,121
HEALTH AND PHYSICAL EDUCATION
OPERATING BUDGET EXPENSES BY PROGRAM 2012-2013
154
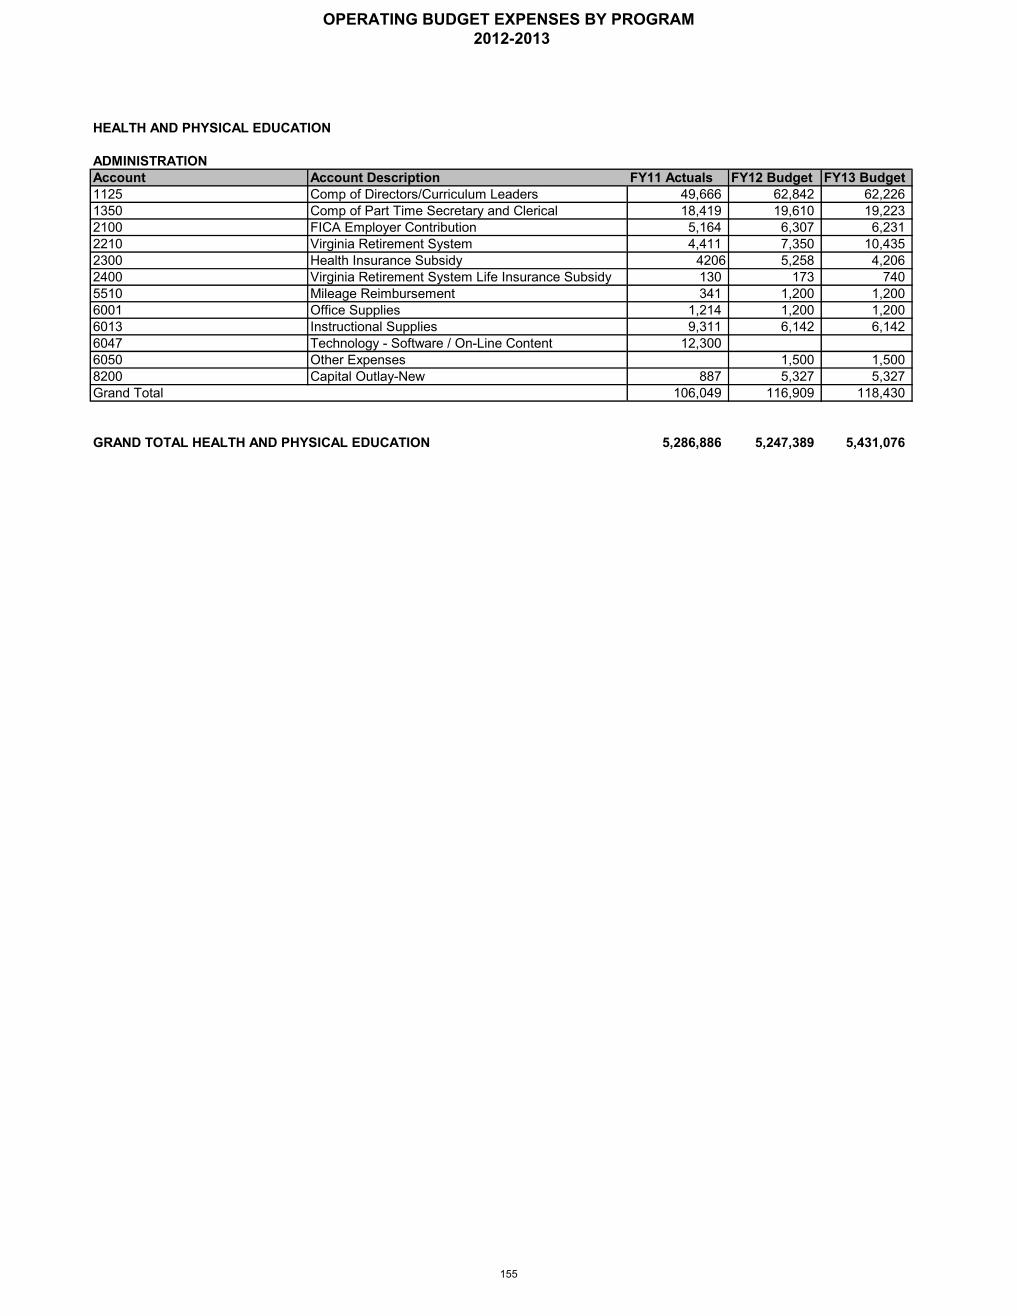
HEALTH AND PHYSICAL EDUCATION
ADMINISTRATIONAccount Account Description FY11 Actuals FY12 Budget FY13 Budget1125 Comp of Directors/Curriculum Leaders 49,666 62,842 62,2261350 Comp of Part Time Secretary and Clerical 18,419 19,610 19,2232100 FICA Employer Contribution 5,164 6,307 6,2312210 Virginia Retirement System 4,411 7,350 10,4352300 Health Insurance Subsidy 4206 5,258 4,2062400 Virginia Retirement System Life Insurance Subsidy 130 173 7405510 Mileage Reimbursement 341 1,200 1,2006001 Office Supplies 1,214 1,200 1,2006013 Instructional Supplies 9,311 6,142 6,1426047 Technology - Software / On-Line Content 12,3006050 Other Expenses 1,500 1,5008200 Capital Outlay-New 887 5,327 5,327Grand Total 106,049 116,909 118,430
5,286,886 5,247,389 5,431,076GRAND TOTAL HEALTH AND PHYSICAL EDUCATION
OPERATING BUDGET EXPENSES BY PROGRAM 2012-2013
155
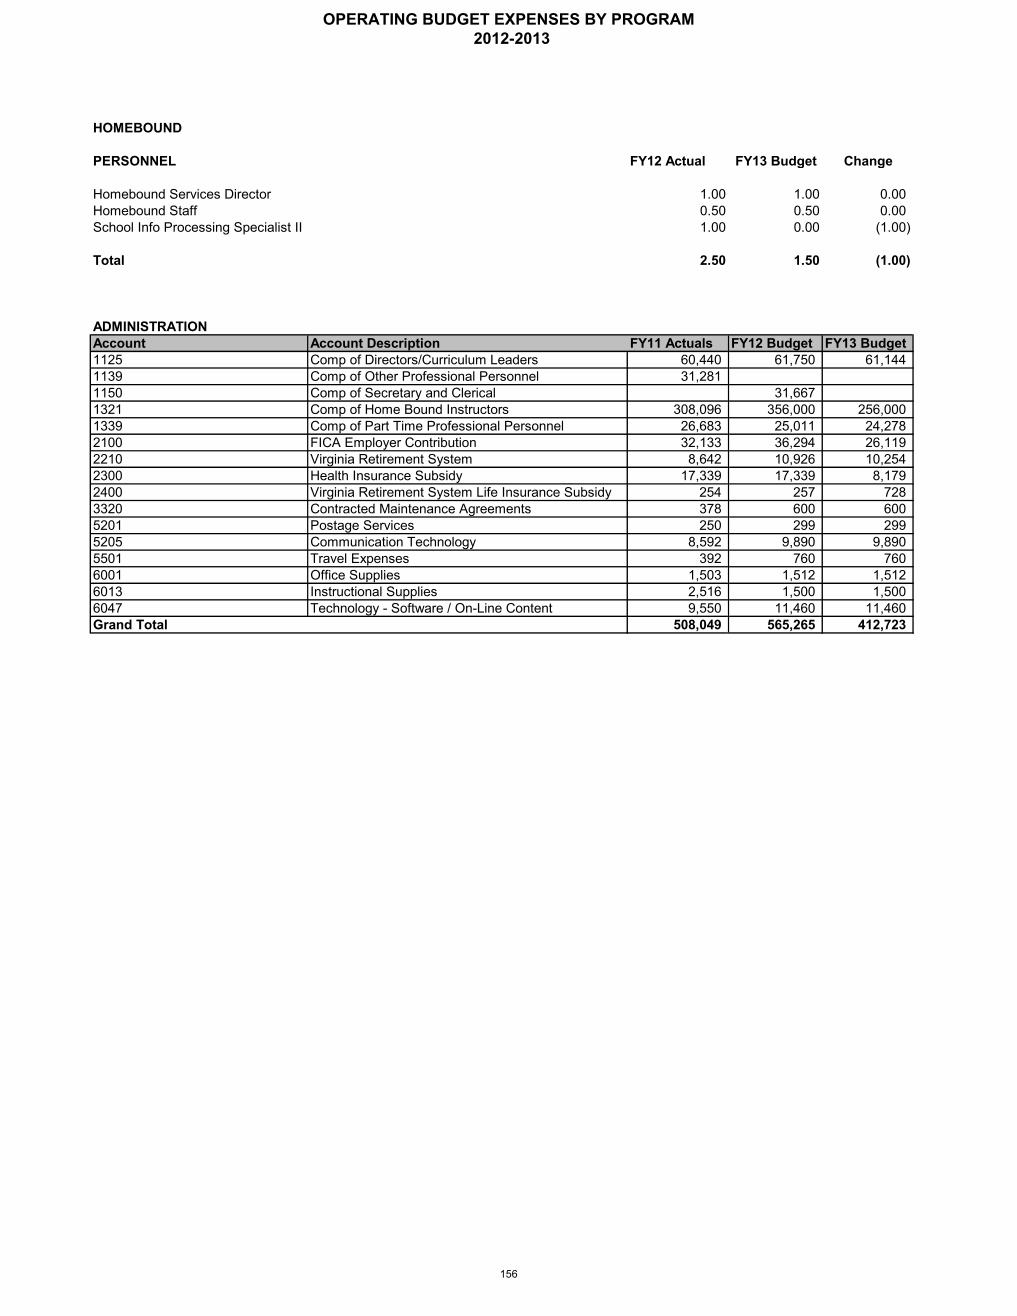
HOMEBOUND
PERSONNEL FY12 Actual FY13 Budget Change
Homebound Services Director 1.00 1.00 0.00Homebound Staff 0.50 0.50 0.00School Info Processing Specialist II 1.00 0.00 (1.00)
Total 2.50 1.50 (1.00)
ADMINISTRATIONAccount Account Description FY11 Actuals FY12 Budget FY13 Budget1125 Comp of Directors/Curriculum Leaders 60,440 61,750 61,1441139 Comp of Other Professional Personnel 31,2811150 Comp of Secretary and Clerical 31,6671321 Comp of Home Bound Instructors 308,096 356,000 256,0001339 Comp of Part Time Professional Personnel 26,683 25,011 24,2782100 FICA Employer Contribution 32,133 36,294 26,1192210 Virginia Retirement System 8,642 10,926 10,2542300 Health Insurance Subsidy 17,339 17,339 8,1792400 Virginia Retirement System Life Insurance Subsidy 254 257 7283320 Contracted Maintenance Agreements 378 600 6005201 Postage Services 250 299 2995205 Communication Technology 8,592 9,890 9,8905501 Travel Expenses 392 760 7606001 Office Supplies 1,503 1,512 1,5126013 Instructional Supplies 2,516 1,500 1,5006047 Technology - Software / On-Line Content 9,550 11,460 11,460Grand Total 508,049 565,265 412,723
OPERATING BUDGET EXPENSES BY PROGRAM 2012-2013
156

HUMAN RESOURCES
PERSONNEL FY12 Actual FY13 Budget Change
Assistant Director, Recruit and Staffing 1.00 1.00 0.00Compensation Analyst 1.00 1.00 0.00Executive Director, Human Resources 1.00 1.00 0.00HR Information Systems Administrator 1.00 1.00 0.00Human Resources Assistant 1.00 1.00 0.00Human Resources Coordinator 1.00 1.00 0.00Human Resources Specialist 4.00 4.00 0.00Office Assistant 1.00 1.00 0.00Professional Development Coordinator 1.00 1.00 0.00Teacher Specialist 1.00 1.00 0.00
Total 13.00 13.00 0.00
ADMINISTRATIONAccount Account Description FY11 Actuals FY12 Budget FY13 Budget1114 Comp of Other Admin Personnel 340,465 347,794 344,3901125 Comp of Directors/Curriculum Leaders 97,896 100,265 99,2931139 Comp of Other Professional Personnel 71,146 69,306 69,9991150 Comp of Secretary and Clerical 214,588 217,911 223,0491322 Comp of Temporary Teachers 34,708 28,000 35,0001399 Comp of Temporary Employees 4,661 4,500 5,0002100 FICA Employer Contribution 56,724 58,736 59,4212210 Virginia Retirement System 68,357 85,746 122,9532300 Health Insurance Subsidy 75,889 78,869 53,4282311 Dental Insurance Subsidy 7812400 Virginia Retirement System Life Insurance Subsidy 2,009 2,012 8,7262501 Income Protection Subsidy 5612820 Tuition Reimbursement 42,202 100,0002830 Staff Development 111,781 107,500 150,5002834 Employee Assistance Program 33,480 33,600 33,6003113 Contracted Background Checks 11,897 15,000 1,0003140 Consultant Services 30,187 29,950 29,9503145 Professional Services 14,735 15,000 15,0003320 Contracted Maintenance Agreements 14,800 17,000 17,0003610 Advertising 10,597 10,000 7,5005501 Travel Expenses 2,986 5,0005504 Travel Expenses Professional 63,938 71,085 75,0855510 Mileage Reimbursement 898 774 7745802 Dues and Association Memberships 1,139 1,836 1,8366001 Office Supplies 4,967 6,000 6,0006050 Other Expenses 7,314 9,537 9,5378200 Capital Outlay-New 638Grand Total 1,319,344 1,415,421 1,369,041
OPERATING BUDGET EXPENSES BY PROGRAM 2012-2013
157

INSTRUCTIONAL ACCOUNTABILITY
PERSONNEL FY12 Actual FY13 Budget Change
Administrative Secretary III 1.00 1.00 0.00Director of Instructional Accountability 1.00 1.00 0.00Division Director of Testing 1.00 1.00 0.00Research & Evaluation Specialist 1.00 1.00 0.00Testing Services Coordinator 1.00 1.00 0.00
Total 5.00 5.00 0.00
ADMINISTRATIONAccount Account Description FY11 Actuals FY12 Budget FY13 Budget1114 Comp of Other Admin Personnel 68,587 70,113 69,4261125 Comp of Directors/Curriculum Leaders 71,131 72,728 72,0261139 Comp of Other Professional Personnel 44,303 45,126 44,6831150 Comp of Secretary and Clerical 75,017 74,859 74,1271399 Comp of Temporary Employees 2,438 2,5002100 FICA Employer Contribution 19,591 20,298 19,9102210 Virginia Retirement System 24,310 30,601 43,4452300 Health Insurance Subsidy 25,264 25,264 20,2102400 Virginia Retirement System Life Insurance Subsidy 714 717 3,0832501 Income Protection Subsidy 3833145 Professional Services 2,000 2,5003320 Contracted Maintenance Agreements 3,907 3,5105510 Mileage Reimbursement 141 1415802 Dues and Association Memberships 45 435 4356001 Office Supplies 4,104 5,589 5,5896016 Testing and Monitoring Supplies 140,255 184,630 172,5146047 Technology - Software / On-Line Content 54,714 59,7516050 Other Expenses 939 1,288 1,2888200 Capital Outlay-New 3,280 1,356 1,356Grand Total 538,982 600,906 530,733
OPERATING BUDGET EXPENSES BY PROGRAM 2012-2013
158
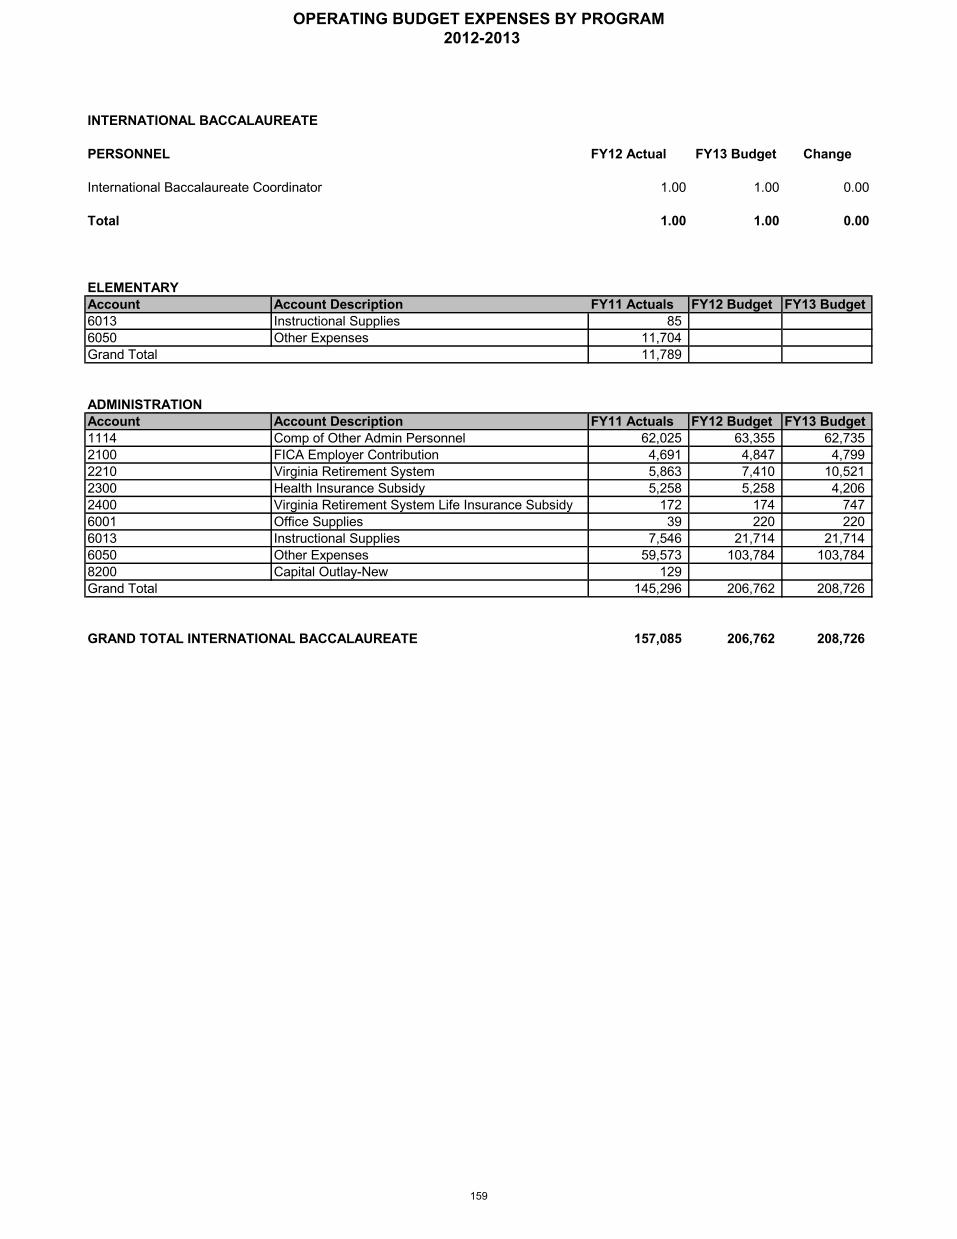
PERSONNEL FY12 Actual FY13 Budget Change
International Baccalaureate Coordinator 1.00 1.00 0.00
Total 1.00 1.00 0.00
ELEMENTARYAccount Account Description FY11 Actuals FY12 Budget FY13 Budget6013 Instructional Supplies 856050 Other Expenses 11,704Grand Total 11,789
ADMINISTRATIONAccount Account Description FY11 Actuals FY12 Budget FY13 Budget1114 Comp of Other Admin Personnel 62,025 63,355 62,7352100 FICA Employer Contribution 4,691 4,847 4,7992210 Virginia Retirement System 5,863 7,410 10,5212300 Health Insurance Subsidy 5,258 5,258 4,2062400 Virginia Retirement System Life Insurance Subsidy 172 174 7476001 Office Supplies 39 220 2206013 Instructional Supplies 7,546 21,714 21,7146050 Other Expenses 59,573 103,784 103,7848200 Capital Outlay-New 129Grand Total 145,296 206,762 208,726
157,085 206,762 208,726
INTERNATIONAL BACCALAUREATE
GRAND TOTAL INTERNATIONAL BACCALAUREATE
OPERATING BUDGET EXPENSES BY PROGRAM 2012-2013
159
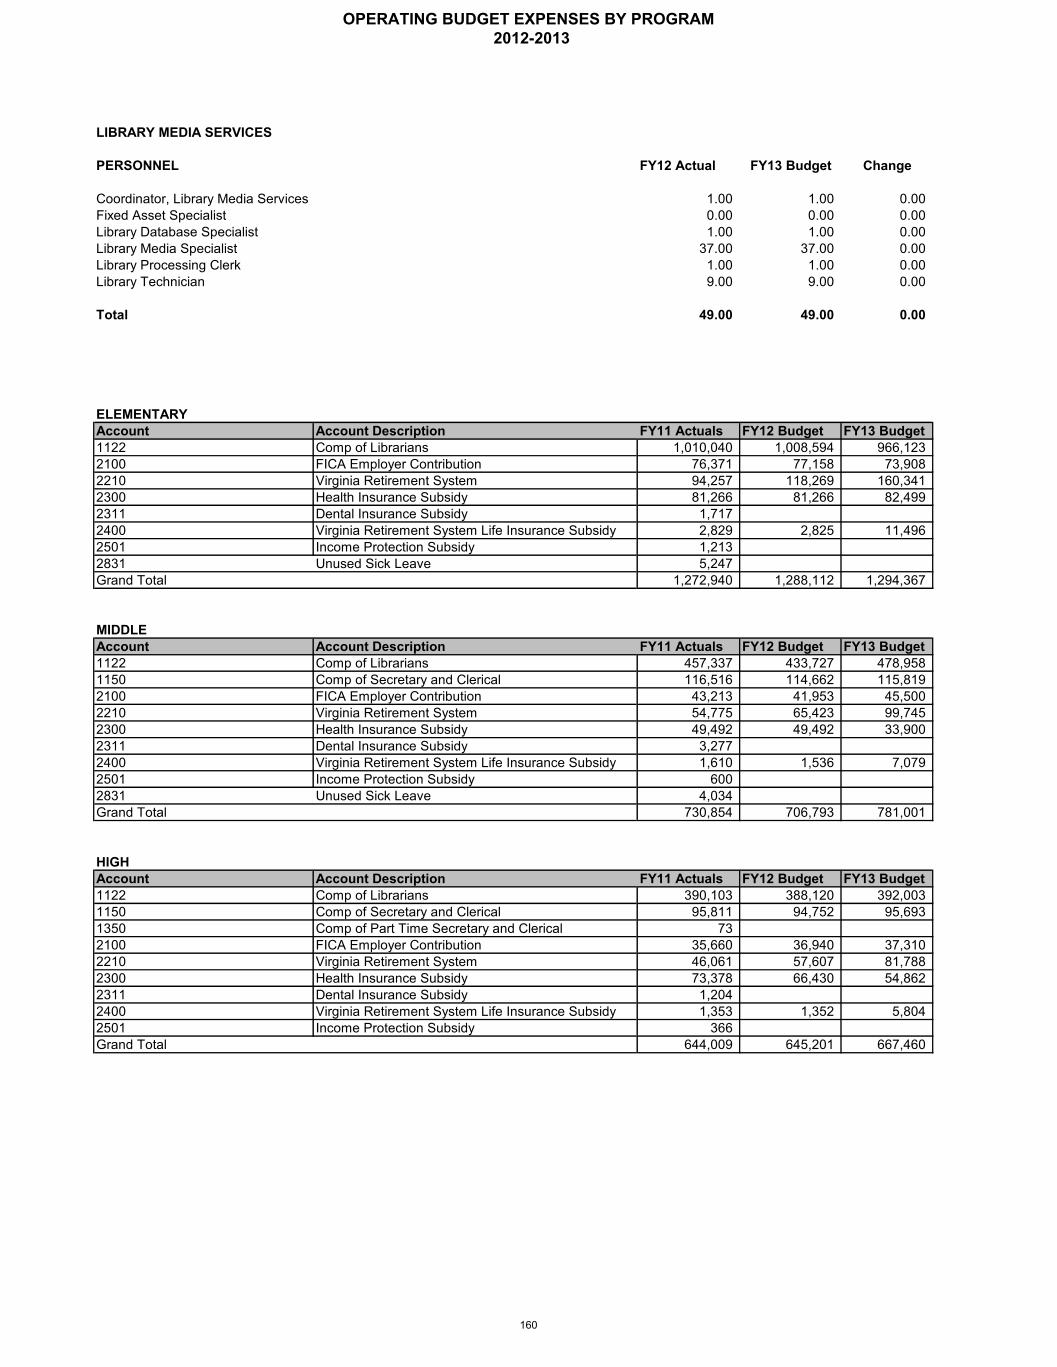
LIBRARY MEDIA SERVICES
PERSONNEL FY12 Actual FY13 Budget Change
Coordinator, Library Media Services 1.00 1.00 0.00Fixed Asset Specialist 0.00 0.00 0.00Library Database Specialist 1.00 1.00 0.00Library Media Specialist 37.00 37.00 0.00Library Processing Clerk 1.00 1.00 0.00Library Technician 9.00 9.00 0.00
Total 49.00 49.00 0.00
ELEMENTARYAccount Account Description FY11 Actuals FY12 Budget FY13 Budget1122 Comp of Librarians 1,010,040 1,008,594 966,1232100 FICA Employer Contribution 76,371 77,158 73,9082210 Virginia Retirement System 94,257 118,269 160,3412300 Health Insurance Subsidy 81,266 81,266 82,4992311 Dental Insurance Subsidy 1,7172400 Virginia Retirement System Life Insurance Subsidy 2,829 2,825 11,4962501 Income Protection Subsidy 1,2132831 Unused Sick Leave 5,247Grand Total 1,272,940 1,288,112 1,294,367
MIDDLEAccount Account Description FY11 Actuals FY12 Budget FY13 Budget1122 Comp of Librarians 457,337 433,727 478,9581150 Comp of Secretary and Clerical 116,516 114,662 115,8192100 FICA Employer Contribution 43,213 41,953 45,5002210 Virginia Retirement System 54,775 65,423 99,7452300 Health Insurance Subsidy 49,492 49,492 33,9002311 Dental Insurance Subsidy 3,2772400 Virginia Retirement System Life Insurance Subsidy 1,610 1,536 7,0792501 Income Protection Subsidy 6002831 Unused Sick Leave 4,034Grand Total 730,854 706,793 781,001
HIGHAccount Account Description FY11 Actuals FY12 Budget FY13 Budget1122 Comp of Librarians 390,103 388,120 392,0031150 Comp of Secretary and Clerical 95,811 94,752 95,6931350 Comp of Part Time Secretary and Clerical 732100 FICA Employer Contribution 35,660 36,940 37,3102210 Virginia Retirement System 46,061 57,607 81,7882300 Health Insurance Subsidy 73,378 66,430 54,8622311 Dental Insurance Subsidy 1,2042400 Virginia Retirement System Life Insurance Subsidy 1,353 1,352 5,8042501 Income Protection Subsidy 366Grand Total 644,009 645,201 667,460
OPERATING BUDGET EXPENSES BY PROGRAM 2012-2013
160

LIBRARY MEDIA SERVICES
ADMINISTRATIONAccount Account Description FY11 Actuals FY12 Budget FY13 Budget1124 Comp of Coordinators 97,922 87,9001143 Comp of Other Technical Personnel 36,105 36,669 36,3081350 Comp of Part Time Secretary and Clerical 34,875 34,604 33,9261399 Comp of Temporary Employees 38,970 8,000 8,0002100 FICA Employer Contribution 8,303 13,759 12,6142210 Virginia Retirement System 3,392 15,693 20,8302300 Health Insurance Subsidy 5,258 4,2062311 Dental Insurance Subsidy 7812400 Virginia Retirement System Life Insurance Subsidy 100 369 1,4783320 Contracted Maintenance Agreements 5,830 6,000 6,2365510 Mileage Reimbursement 4,0006001 Office Supplies 2,138 2,1386013 Instructional Supplies 38,150 53,063 53,0636017 Repair Parts and Supplies 461 9,056 3,0566031 Library Books and Periodicals 422,105 457,925 457,9256047 Technology - Software / On-Line Content 208,937 189,907 189,9076050 Other Expenses 1,533 4,157 3,9218100 Capital Outlay-Replacement 20,000 20,0008200 Capital Outlay-New 69,966 22,359 24,359Grand Total 869,508 976,879 969,867
GRAND TOTAL LIBRARY MEDIA SERVICES 3,517,311 3,616,985 3,712,695
OPERATING BUDGET EXPENSES BY PROGRAM 2012-2013
161
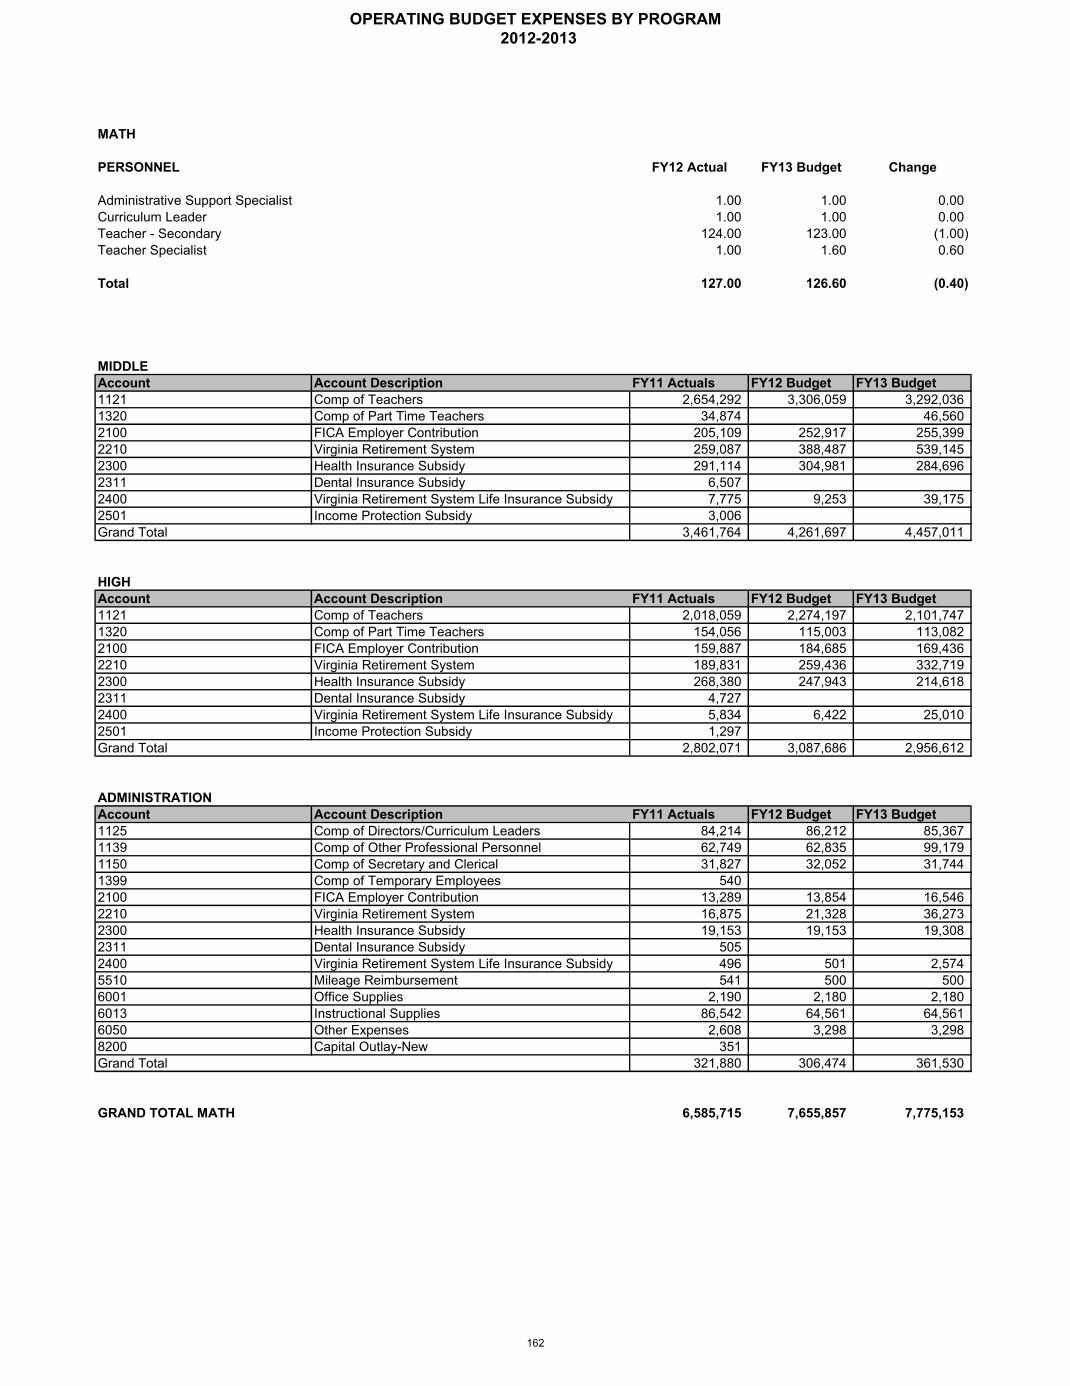
MATH
PERSONNEL FY12 Actual FY13 Budget Change
Administrative Support Specialist 1.00 1.00 0.00Curriculum Leader 1.00 1.00 0.00Teacher - Secondary 124.00 123.00 (1.00)Teacher Specialist 1.00 1.60 0.60
Total 127.00 126.60 (0.40)
MIDDLEAccount Account Description FY11 Actuals FY12 Budget FY13 Budget1121 Comp of Teachers 2,654,292 3,306,059 3,292,0361320 Comp of Part Time Teachers 34,874 46,5602100 FICA Employer Contribution 205,109 252,917 255,3992210 Virginia Retirement System 259,087 388,487 539,1452300 Health Insurance Subsidy 291,114 304,981 284,6962311 Dental Insurance Subsidy 6,5072400 Virginia Retirement System Life Insurance Subsidy 7,775 9,253 39,1752501 Income Protection Subsidy 3,006Grand Total 3,461,764 4,261,697 4,457,011
HIGHAccount Account Description FY11 Actuals FY12 Budget FY13 Budget1121 Comp of Teachers 2,018,059 2,274,197 2,101,7471320 Comp of Part Time Teachers 154,056 115,003 113,0822100 FICA Employer Contribution 159,887 184,685 169,4362210 Virginia Retirement System 189,831 259,436 332,7192300 Health Insurance Subsidy 268,380 247,943 214,6182311 Dental Insurance Subsidy 4,7272400 Virginia Retirement System Life Insurance Subsidy 5,834 6,422 25,0102501 Income Protection Subsidy 1,297Grand Total 2,802,071 3,087,686 2,956,612
ADMINISTRATIONAccount Account Description FY11 Actuals FY12 Budget FY13 Budget1125 Comp of Directors/Curriculum Leaders 84,214 86,212 85,3671139 Comp of Other Professional Personnel 62,749 62,835 99,1791150 Comp of Secretary and Clerical 31,827 32,052 31,7441399 Comp of Temporary Employees 5402100 FICA Employer Contribution 13,289 13,854 16,5462210 Virginia Retirement System 16,875 21,328 36,2732300 Health Insurance Subsidy 19,153 19,153 19,3082311 Dental Insurance Subsidy 5052400 Virginia Retirement System Life Insurance Subsidy 496 501 2,5745510 Mileage Reimbursement 541 500 5006001 Office Supplies 2,190 2,180 2,1806013 Instructional Supplies 86,542 64,561 64,5616050 Other Expenses 2,608 3,298 3,2988200 Capital Outlay-New 351Grand Total 321,880 306,474 361,530
GRAND TOTAL MATH 6,585,715 7,655,857 7,775,153
OPERATING BUDGET EXPENSES BY PROGRAM 2012-2013
162
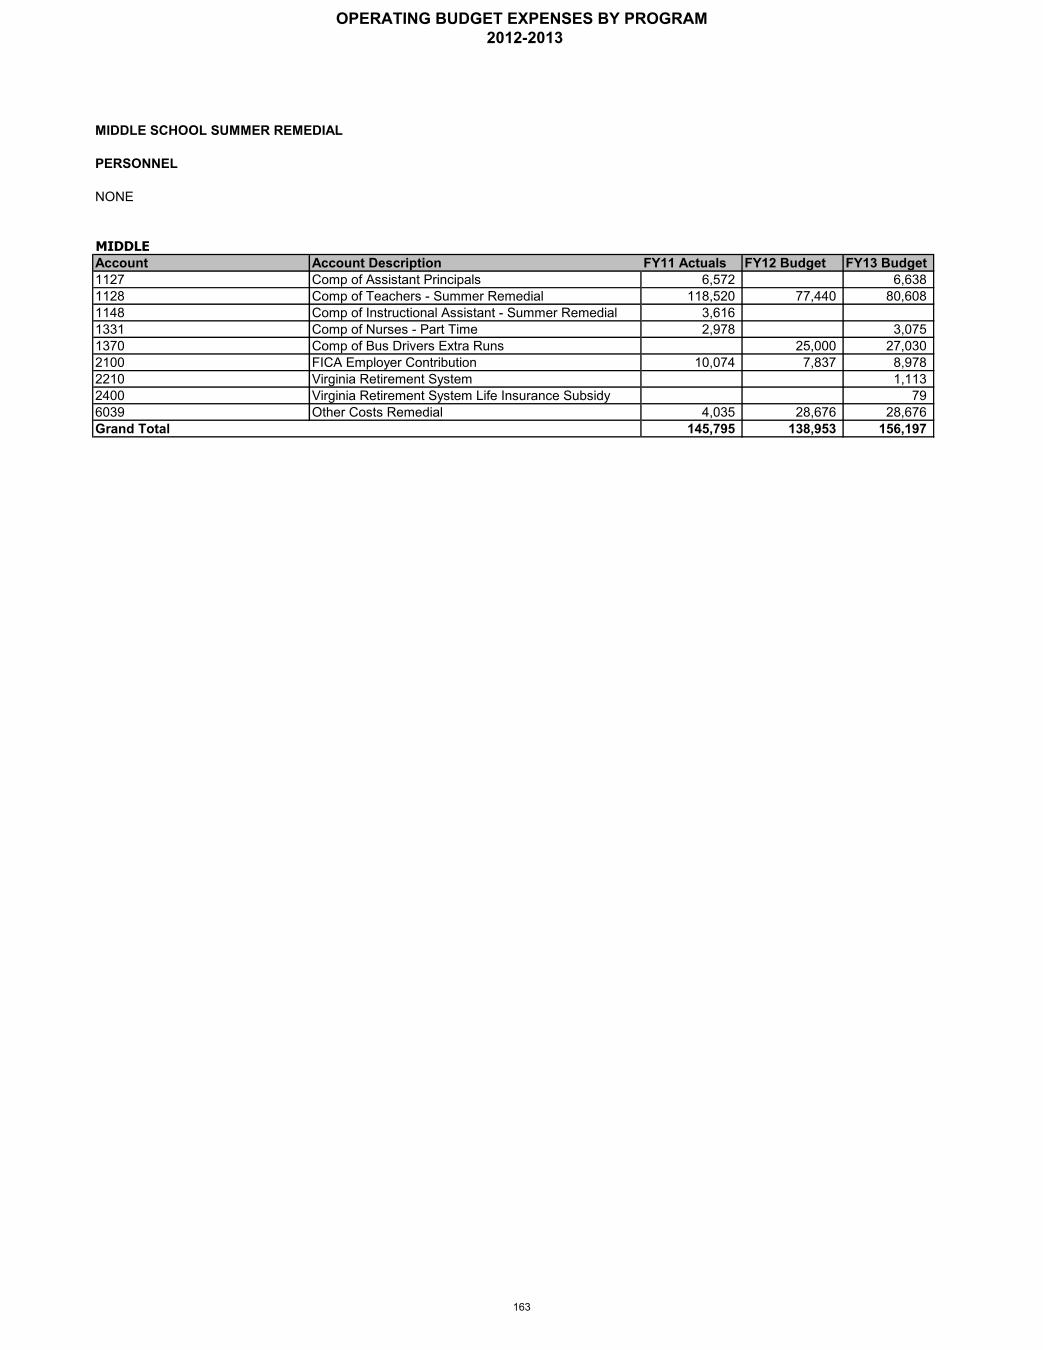
MIDDLE SCHOOL SUMMER REMEDIAL
PERSONNEL
NONE
MIDDLE
Account Account Description FY11 Actuals FY12 Budget FY13 Budget1127 Comp of Assistant Principals 6,572 6,6381128 Comp of Teachers - Summer Remedial 118,520 77,440 80,6081148 Comp of Instructional Assistant - Summer Remedial 3,6161331 Comp of Nurses - Part Time 2,978 3,0751370 Comp of Bus Drivers Extra Runs 25,000 27,0302100 FICA Employer Contribution 10,074 7,837 8,9782210 Virginia Retirement System 1,1132400 Virginia Retirement System Life Insurance Subsidy 796039 Other Costs Remedial 4,035 28,676 28,676Grand Total 145,795 138,953 156,197
OPERATING BUDGET EXPENSES BY PROGRAM 2012-2013
163

MUSIC - BAND
PERSONNEL FY12 Actual FY13 Budget Change
Teacher - Secondary 13.00 13.00 0.00
Total 13.00 13.00 0.00
MIDDLEAccount Account Description FY11 Actuals FY12 Budget FY13 Budget1121 Comp of Teachers 321,718 326,699 314,0632100 FICA Employer Contribution 23,891 24,993 24,0262210 Virginia Retirement System 30,767 36,644 47,6682300 Health Insurance Subsidy 39,325 32,863 27,3352400 Virginia Retirement System Life Insurance Subsidy 956 911 3,7322501 Income Protection Subsidy 456013 Instructional Supplies 7,987Grand Total 424,689 422,110 416,824
HIGHAccount Account Description FY11 Actuals FY12 Budget FY13 Budget1121 Comp of Teachers 188,303 233,490 246,1692100 FICA Employer Contribution 13,933 17,863 18,8312210 Virginia Retirement System 19,636 27,855 41,2822300 Health Insurance Subsidy 27,569 28,354 18,1112400 Virginia Retirement System Life Insurance Subsidy 577 654 2,9302501 Income Protection Subsidy 4006013 Instructional Supplies 2,805Grand Total 253,223 308,216 327,323
ADMINISTRATIONAccount Account Description FY11 Actuals FY12 Budget FY13 Budget1399 Comp of Temporary Employees 2,674 5,9852100 FICA Employer Contribution 205 4586013 Instructional Supplies 32,5936017 Repair Parts and Supplies 57,745 57,131 57,1316050 Other Expenses 3658100 Capital Outlay-Replacement 233,067 42,503 42,3198200 Capital Outlay-New 13,149 14,858 13,382Grand Total 339,798 120,935 112,832
1,017,710 851,261 856,979GRAND TOTAL MUSIC - BAND
OPERATING BUDGET EXPENSES BY PROGRAM 2012-2013
164
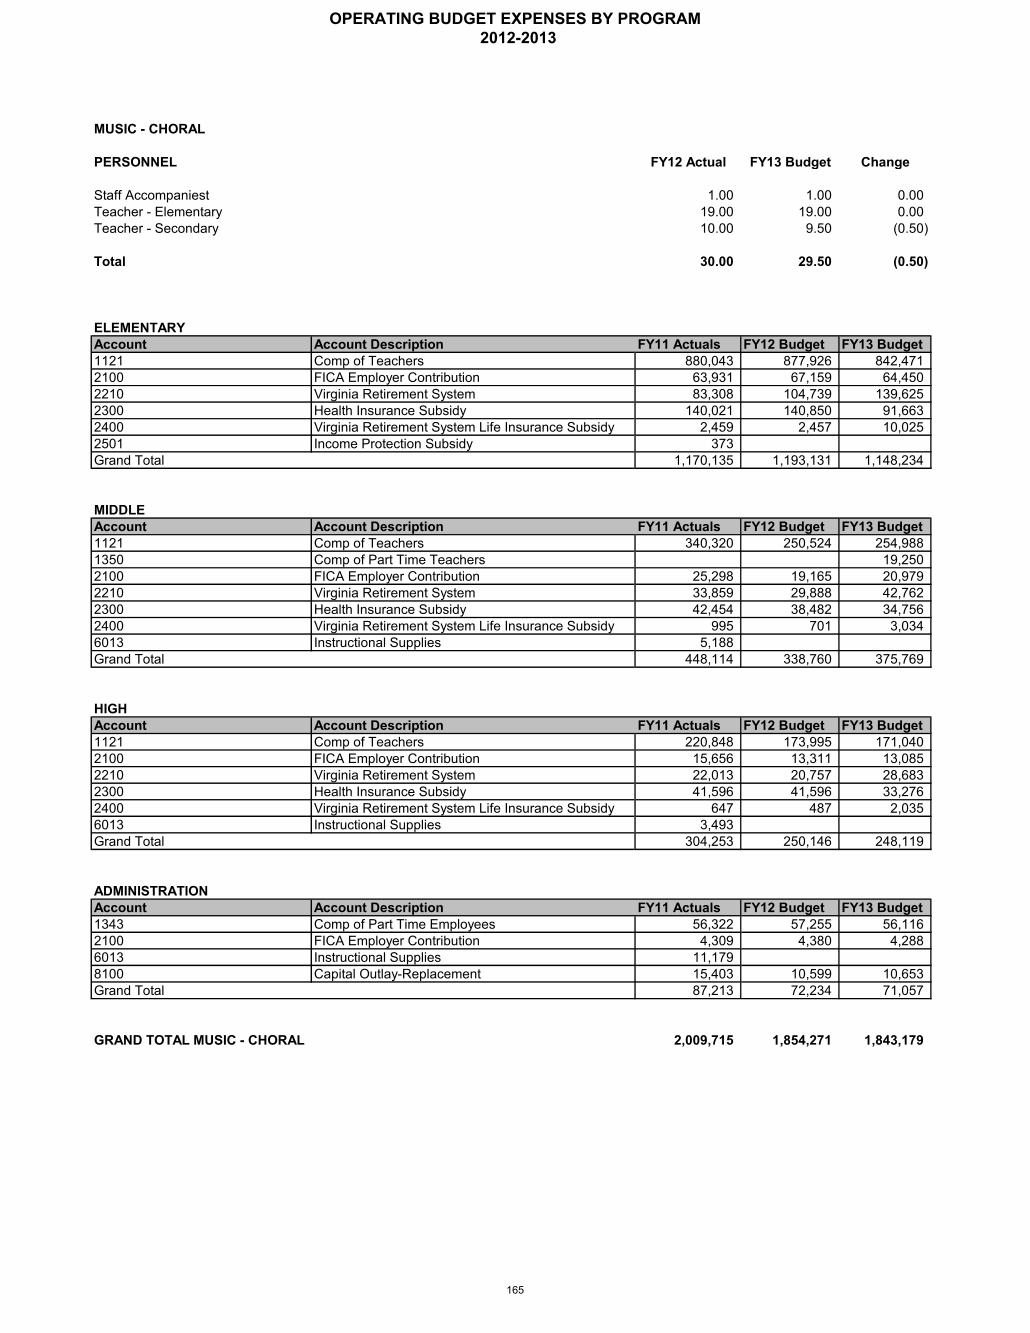
MUSIC - CHORAL
PERSONNEL FY12 Actual FY13 Budget Change
Staff Accompaniest 1.00 1.00 0.00Teacher - Elementary 19.00 19.00 0.00Teacher - Secondary 10.00 9.50 (0.50)
Total 30.00 29.50 (0.50)
ELEMENTARYAccount Account Description FY11 Actuals FY12 Budget FY13 Budget1121 Comp of Teachers 880,043 877,926 842,4712100 FICA Employer Contribution 63,931 67,159 64,4502210 Virginia Retirement System 83,308 104,739 139,6252300 Health Insurance Subsidy 140,021 140,850 91,6632400 Virginia Retirement System Life Insurance Subsidy 2,459 2,457 10,0252501 Income Protection Subsidy 373Grand Total 1,170,135 1,193,131 1,148,234
MIDDLEAccount Account Description FY11 Actuals FY12 Budget FY13 Budget1121 Comp of Teachers 340,320 250,524 254,9881350 Comp of Part Time Teachers 19,2502100 FICA Employer Contribution 25,298 19,165 20,9792210 Virginia Retirement System 33,859 29,888 42,7622300 Health Insurance Subsidy 42,454 38,482 34,7562400 Virginia Retirement System Life Insurance Subsidy 995 701 3,0346013 Instructional Supplies 5,188Grand Total 448,114 338,760 375,769
HIGHAccount Account Description FY11 Actuals FY12 Budget FY13 Budget1121 Comp of Teachers 220,848 173,995 171,0402100 FICA Employer Contribution 15,656 13,311 13,0852210 Virginia Retirement System 22,013 20,757 28,6832300 Health Insurance Subsidy 41,596 41,596 33,2762400 Virginia Retirement System Life Insurance Subsidy 647 487 2,0356013 Instructional Supplies 3,493Grand Total 304,253 250,146 248,119
ADMINISTRATIONAccount Account Description FY11 Actuals FY12 Budget FY13 Budget1343 Comp of Part Time Employees 56,322 57,255 56,1162100 FICA Employer Contribution 4,309 4,380 4,2886013 Instructional Supplies 11,1798100 Capital Outlay-Replacement 15,403 10,599 10,653Grand Total 87,213 72,234 71,057
GRAND TOTAL MUSIC - CHORAL 2,009,715 1,854,271 1,843,179
OPERATING BUDGET EXPENSES BY PROGRAM 2012-2013
165
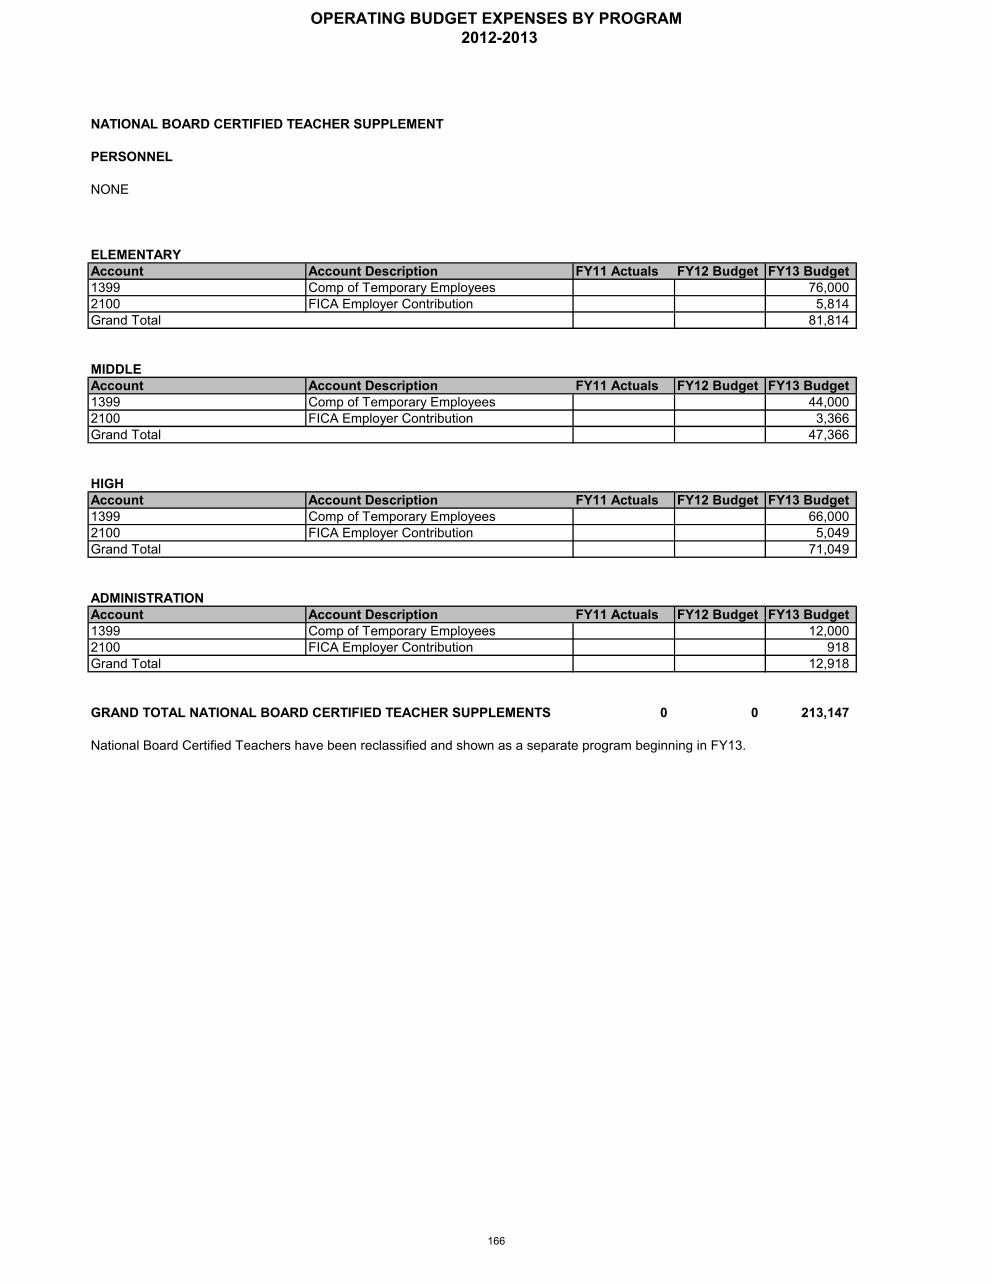
NATIONAL BOARD CERTIFIED TEACHER SUPPLEMENT
PERSONNEL
NONE
ELEMENTARYAccount Account Description FY11 Actuals FY12 Budget FY13 Budget1399 Comp of Temporary Employees 76,0002100 FICA Employer Contribution 5,814Grand Total 81,814
MIDDLEAccount Account Description FY11 Actuals FY12 Budget FY13 Budget1399 Comp of Temporary Employees 44,0002100 FICA Employer Contribution 3,366Grand Total 47,366
HIGHAccount Account Description FY11 Actuals FY12 Budget FY13 Budget1399 Comp of Temporary Employees 66,0002100 FICA Employer Contribution 5,049Grand Total 71,049
ADMINISTRATIONAccount Account Description FY11 Actuals FY12 Budget FY13 Budget1399 Comp of Temporary Employees 12,0002100 FICA Employer Contribution 918Grand Total 12,918
0 0 213,147
National Board Certified Teachers have been reclassified and shown as a separate program beginning in FY13.
GRAND TOTAL NATIONAL BOARD CERTIFIED TEACHER SUPPLEMENTS
OPERATING BUDGET EXPENSES BY PROGRAM 2012-2013
166
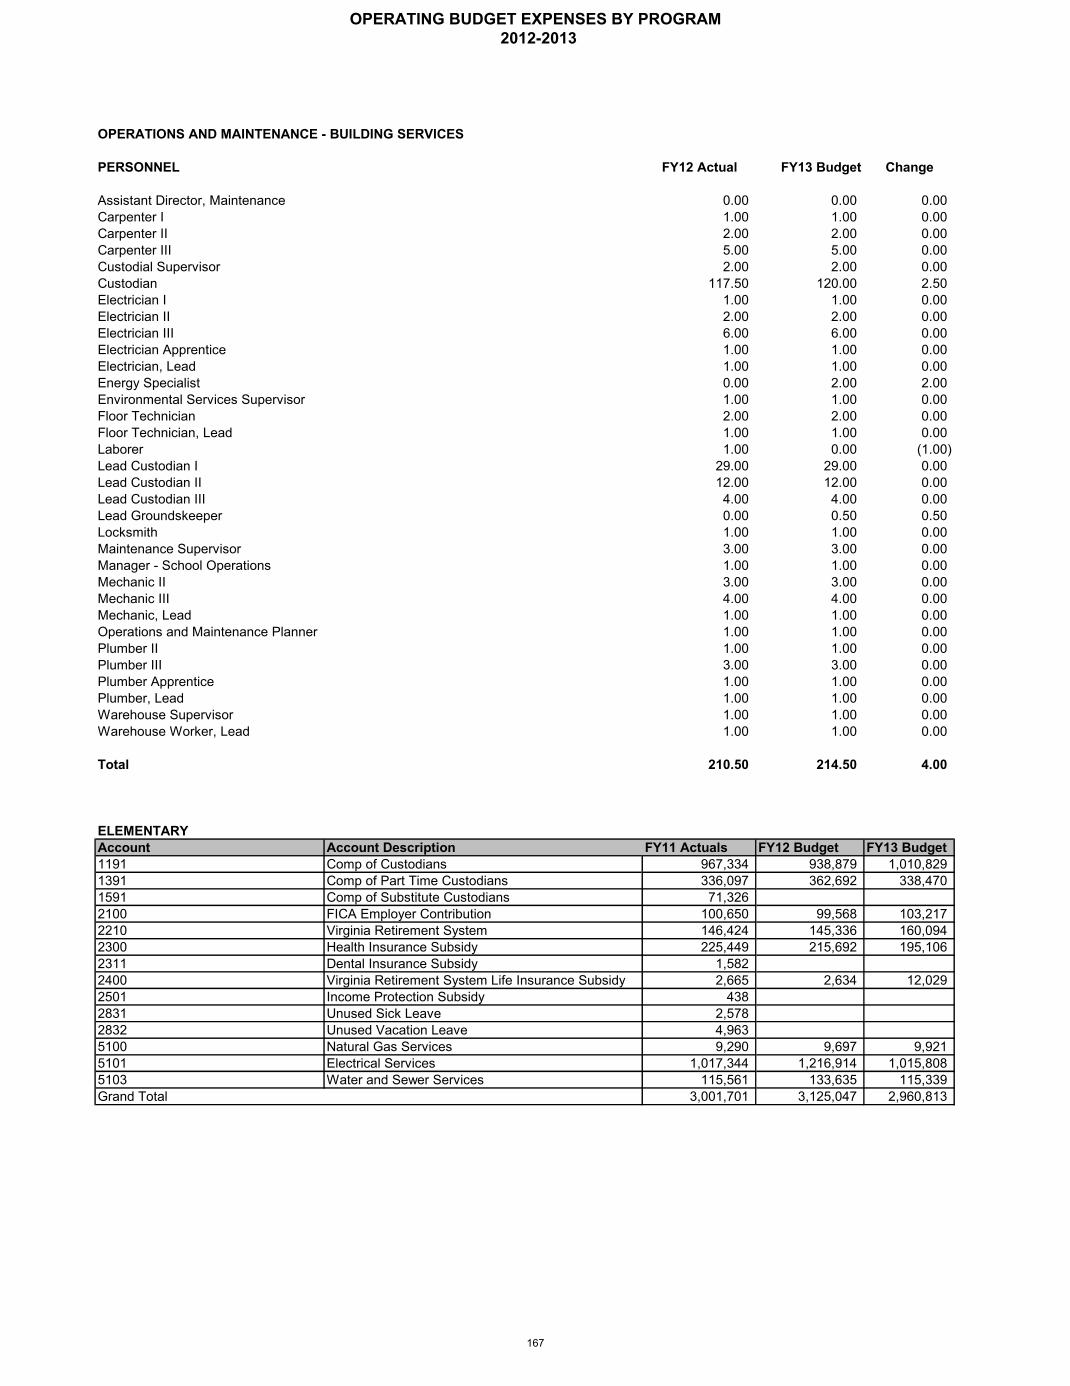
OPERATIONS AND MAINTENANCE - BUILDING SERVICES
PERSONNEL FY12 Actual FY13 Budget Change
Assistant Director, Maintenance 0.00 0.00 0.00Carpenter I 1.00 1.00 0.00Carpenter II 2.00 2.00 0.00Carpenter III 5.00 5.00 0.00Custodial Supervisor 2.00 2.00 0.00Custodian 117.50 120.00 2.50Electrician I 1.00 1.00 0.00Electrician II 2.00 2.00 0.00Electrician III 6.00 6.00 0.00Electrician Apprentice 1.00 1.00 0.00Electrician, Lead 1.00 1.00 0.00Energy Specialist 0.00 2.00 2.00Environmental Services Supervisor 1.00 1.00 0.00Floor Technician 2.00 2.00 0.00Floor Technician, Lead 1.00 1.00 0.00Laborer 1.00 0.00 (1.00)Lead Custodian I 29.00 29.00 0.00Lead Custodian II 12.00 12.00 0.00Lead Custodian III 4.00 4.00 0.00Lead Groundskeeper 0.00 0.50 0.50Locksmith 1.00 1.00 0.00Maintenance Supervisor 3.00 3.00 0.00Manager - School Operations 1.00 1.00 0.00Mechanic II 3.00 3.00 0.00Mechanic III 4.00 4.00 0.00Mechanic, Lead 1.00 1.00 0.00Operations and Maintenance Planner 1.00 1.00 0.00Plumber II 1.00 1.00 0.00Plumber III 3.00 3.00 0.00Plumber Apprentice 1.00 1.00 0.00Plumber, Lead 1.00 1.00 0.00Warehouse Supervisor 1.00 1.00 0.00Warehouse Worker, Lead 1.00 1.00 0.00
Total 210.50 214.50 4.00
ELEMENTARYAccount Account Description FY11 Actuals FY12 Budget FY13 Budget1191 Comp of Custodians 967,334 938,879 1,010,8291391 Comp of Part Time Custodians 336,097 362,692 338,4701591 Comp of Substitute Custodians 71,3262100 FICA Employer Contribution 100,650 99,568 103,2172210 Virginia Retirement System 146,424 145,336 160,0942300 Health Insurance Subsidy 225,449 215,692 195,1062311 Dental Insurance Subsidy 1,5822400 Virginia Retirement System Life Insurance Subsidy 2,665 2,634 12,0292501 Income Protection Subsidy 4382831 Unused Sick Leave 2,5782832 Unused Vacation Leave 4,9635100 Natural Gas Services 9,290 9,697 9,9215101 Electrical Services 1,017,344 1,216,914 1,015,8085103 Water and Sewer Services 115,561 133,635 115,339Grand Total 3,001,701 3,125,047 2,960,813
OPERATING BUDGET EXPENSES BY PROGRAM 2012-2013
167
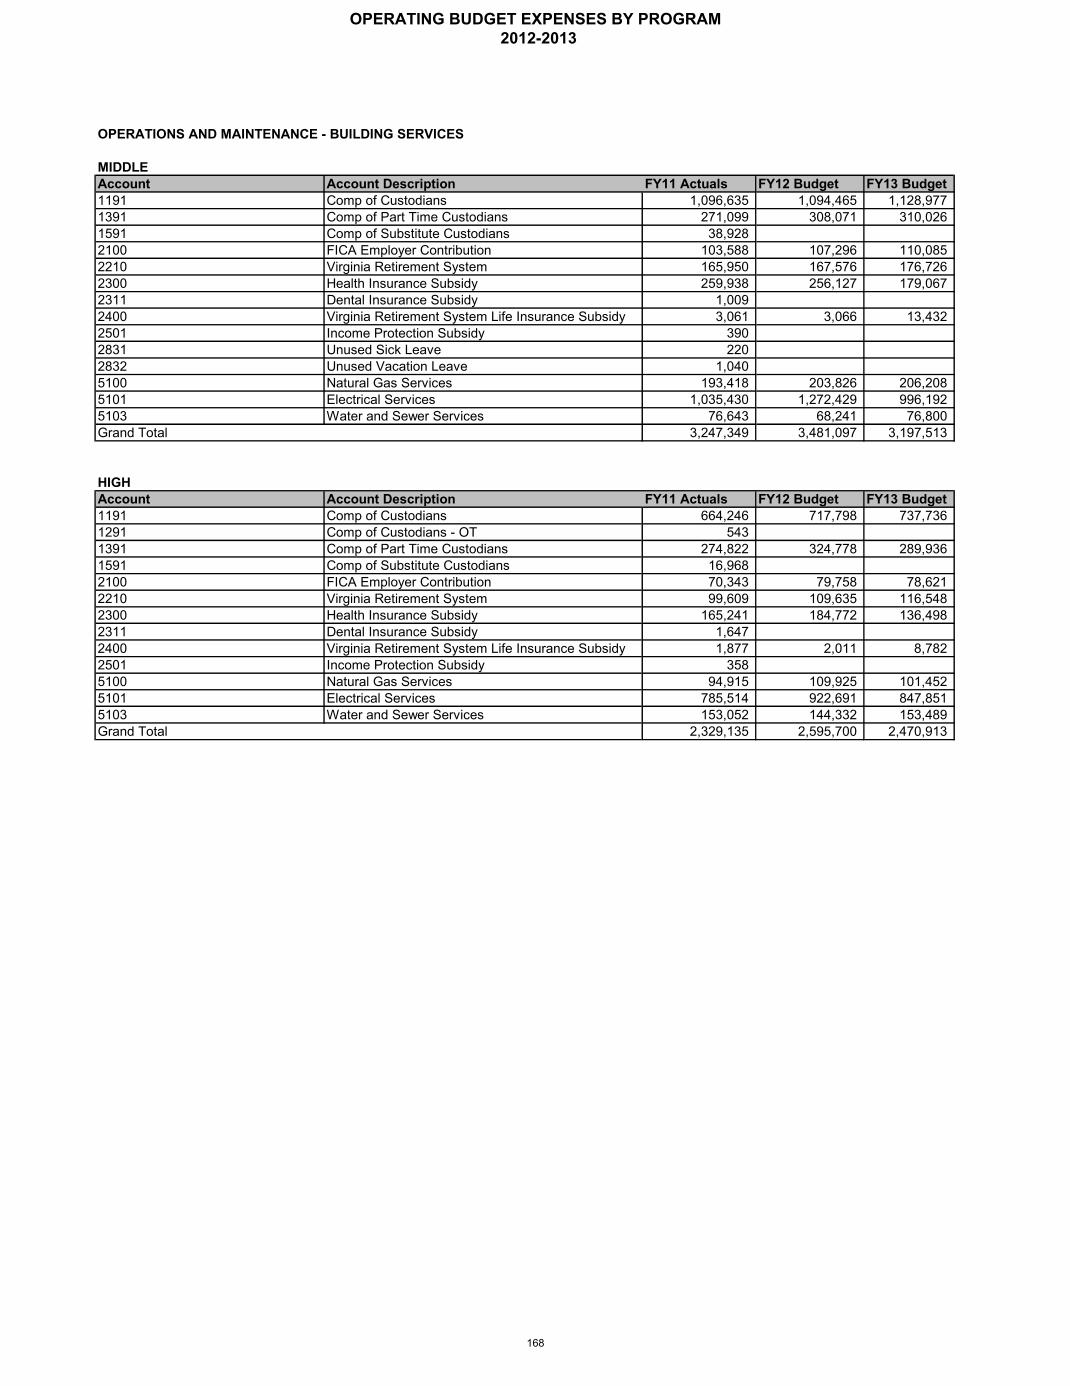
OPERATIONS AND MAINTENANCE - BUILDING SERVICES
MIDDLEAccount Account Description FY11 Actuals FY12 Budget FY13 Budget1191 Comp of Custodians 1,096,635 1,094,465 1,128,9771391 Comp of Part Time Custodians 271,099 308,071 310,0261591 Comp of Substitute Custodians 38,9282100 FICA Employer Contribution 103,588 107,296 110,0852210 Virginia Retirement System 165,950 167,576 176,7262300 Health Insurance Subsidy 259,938 256,127 179,0672311 Dental Insurance Subsidy 1,0092400 Virginia Retirement System Life Insurance Subsidy 3,061 3,066 13,4322501 Income Protection Subsidy 3902831 Unused Sick Leave 2202832 Unused Vacation Leave 1,0405100 Natural Gas Services 193,418 203,826 206,2085101 Electrical Services 1,035,430 1,272,429 996,1925103 Water and Sewer Services 76,643 68,241 76,800Grand Total 3,247,349 3,481,097 3,197,513
HIGHAccount Account Description FY11 Actuals FY12 Budget FY13 Budget1191 Comp of Custodians 664,246 717,798 737,7361291 Comp of Custodians - OT 5431391 Comp of Part Time Custodians 274,822 324,778 289,9361591 Comp of Substitute Custodians 16,9682100 FICA Employer Contribution 70,343 79,758 78,6212210 Virginia Retirement System 99,609 109,635 116,5482300 Health Insurance Subsidy 165,241 184,772 136,4982311 Dental Insurance Subsidy 1,6472400 Virginia Retirement System Life Insurance Subsidy 1,877 2,011 8,7822501 Income Protection Subsidy 3585100 Natural Gas Services 94,915 109,925 101,4525101 Electrical Services 785,514 922,691 847,8515103 Water and Sewer Services 153,052 144,332 153,489Grand Total 2,329,135 2,595,700 2,470,913
OPERATING BUDGET EXPENSES BY PROGRAM 2012-2013
168

OPERATIONS AND MAINTENANCE - BUILDING SERVICES
ADMINISTRATIONAccount Account Description FY11 Actuals FY12 Budget FY13 Budget1114 Comp of Other Admin Personnel 193,640 120,602 119,4221160 Comp of Maintenance Employees 1,814,800 1,818,812 1,798,8721191 Comp of Custodians 94,050 93,407 93,9161260 Comp of Maintenance Employees OT 1,010 43,680 43,6801291 Comp of Custodians OT 13,629 13,6291360 Comp of Part Time Maintenance Employees 18,3751391 Comp of Part Time Custodians 42,170 47,351 47,3601591 Comp of Substitute Custodians 34,242 86,776 86,7762100 FICA Employer Contribution 160,049 170,154 169,9842210 Virginia Retirement System 304,706 303,380 311,9532300 Health Insurance Subsidy 362,531 366,886 247,0942311 Dental Insurance Subsidy 2,8292400 Virginia Retirement System Life Insurance Subsidy 5,733 5,578 23,5082501 Income Protection Subsidy 3622831 Unused Sick Leave 1,8342832 Unused Vacation Leave 10,3123100 Contracted OSHA Expenses 7,870 19,170 34,6703310 Contracted Buildings and Grounds 1,150,727 685,170 851,0863823 Payment To City For Building Services 327,416 341,305 345,1355100 Natural Gas Services 5,509 5,8675101 Electrical Services 70,632 59,097 116,1775103 Water and Sewer Services 1,491 2,167 7,1005200 Telephone Service 259,672 324,346 324,3465204 Cell Phone Service 16,687 16,0005401 Leases/Rental of Equipment 71,285 76,168 76,1685501 Travel Expenses 1,6006001 Office Supplies 13276005 Custodial Supplies 265,458 393,759 328,7596007 Maintenance Supplies 572,301 619,140 606,8046010 OSHA Supplies 6,010 6,296 6,2966017 Repair Parts and Supplies 1,277 6,757 7,7268100 Capital Outlay - Replacement 176,3998200 Capital Outlay-New 89,620Grand Total 6,053,549 5,603,630 5,700,703
GRAND TOTAL OPERATION AND MAINTENANCE - BUILDING SERVICES 14,631,734 14,805,474 14,329,942
OPERATING BUDGET EXPENSES BY PROGRAM 2012-2013
169
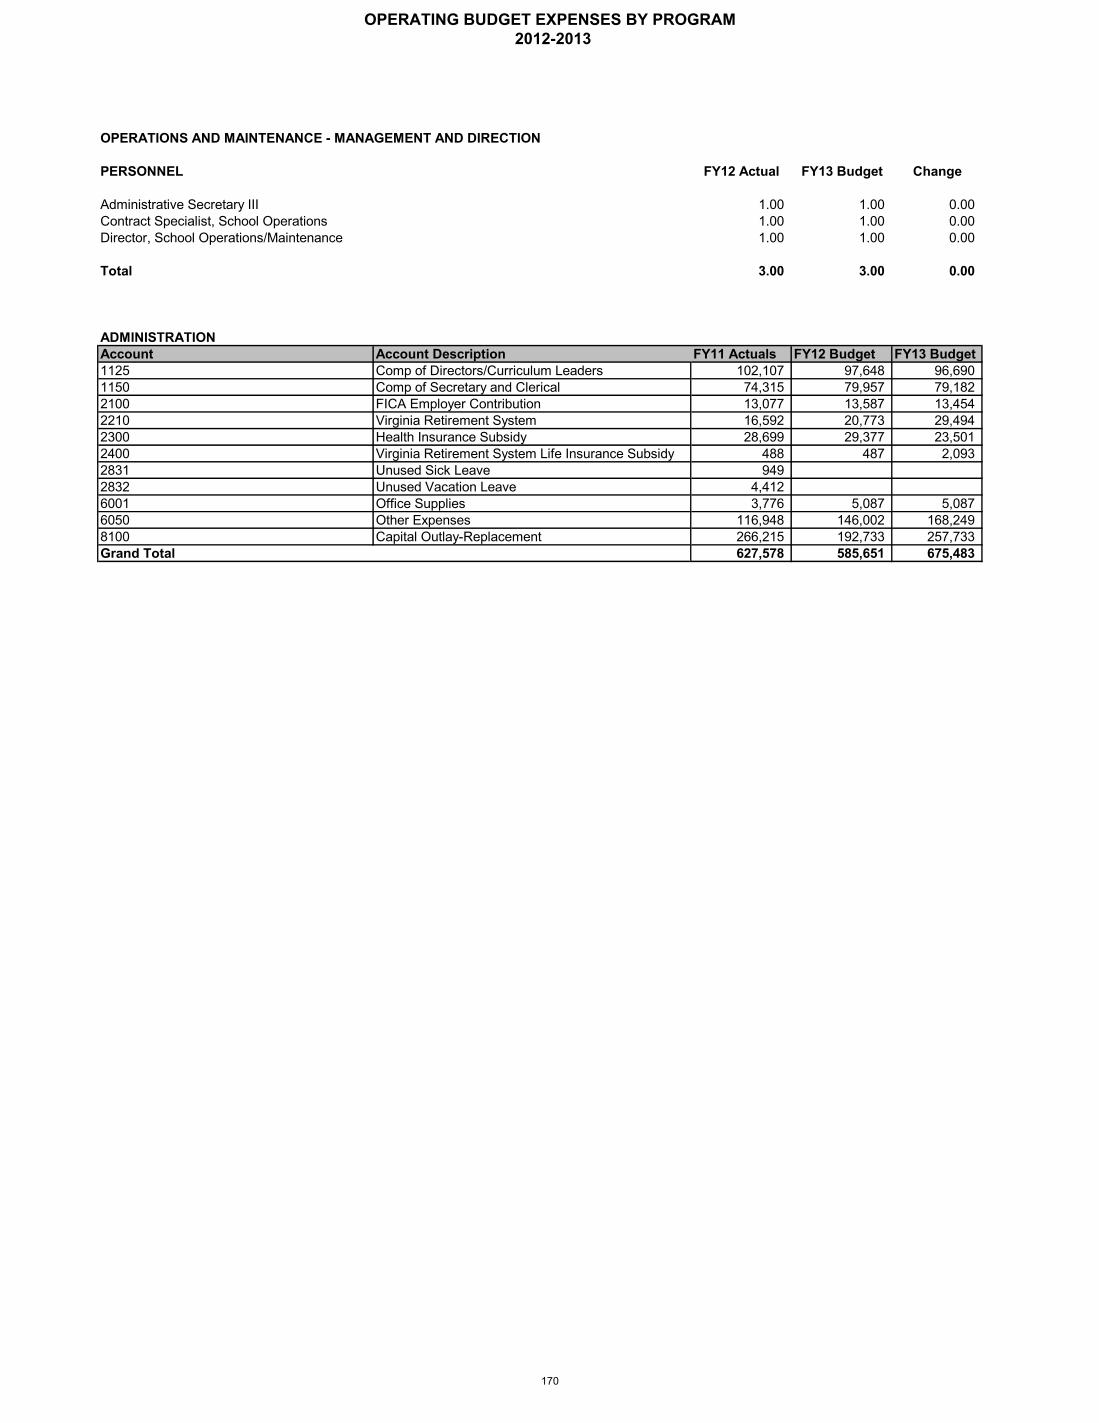
OPERATIONS AND MAINTENANCE - MANAGEMENT AND DIRECTION
PERSONNEL FY12 Actual FY13 Budget Change
Administrative Secretary III 1.00 1.00 0.00Contract Specialist, School Operations 1.00 1.00 0.00Director, School Operations/Maintenance 1.00 1.00 0.00
Total 3.00 3.00 0.00
ADMINISTRATIONAccount Account Description FY11 Actuals FY12 Budget FY13 Budget1125 Comp of Directors/Curriculum Leaders 102,107 97,648 96,6901150 Comp of Secretary and Clerical 74,315 79,957 79,1822100 FICA Employer Contribution 13,077 13,587 13,4542210 Virginia Retirement System 16,592 20,773 29,4942300 Health Insurance Subsidy 28,699 29,377 23,5012400 Virginia Retirement System Life Insurance Subsidy 488 487 2,0932831 Unused Sick Leave 9492832 Unused Vacation Leave 4,4126001 Office Supplies 3,776 5,087 5,0876050 Other Expenses 116,948 146,002 168,2498100 Capital Outlay-Replacement 266,215 192,733 257,733Grand Total 627,578 585,651 675,483
OPERATING BUDGET EXPENSES BY PROGRAM 2012-2013
170
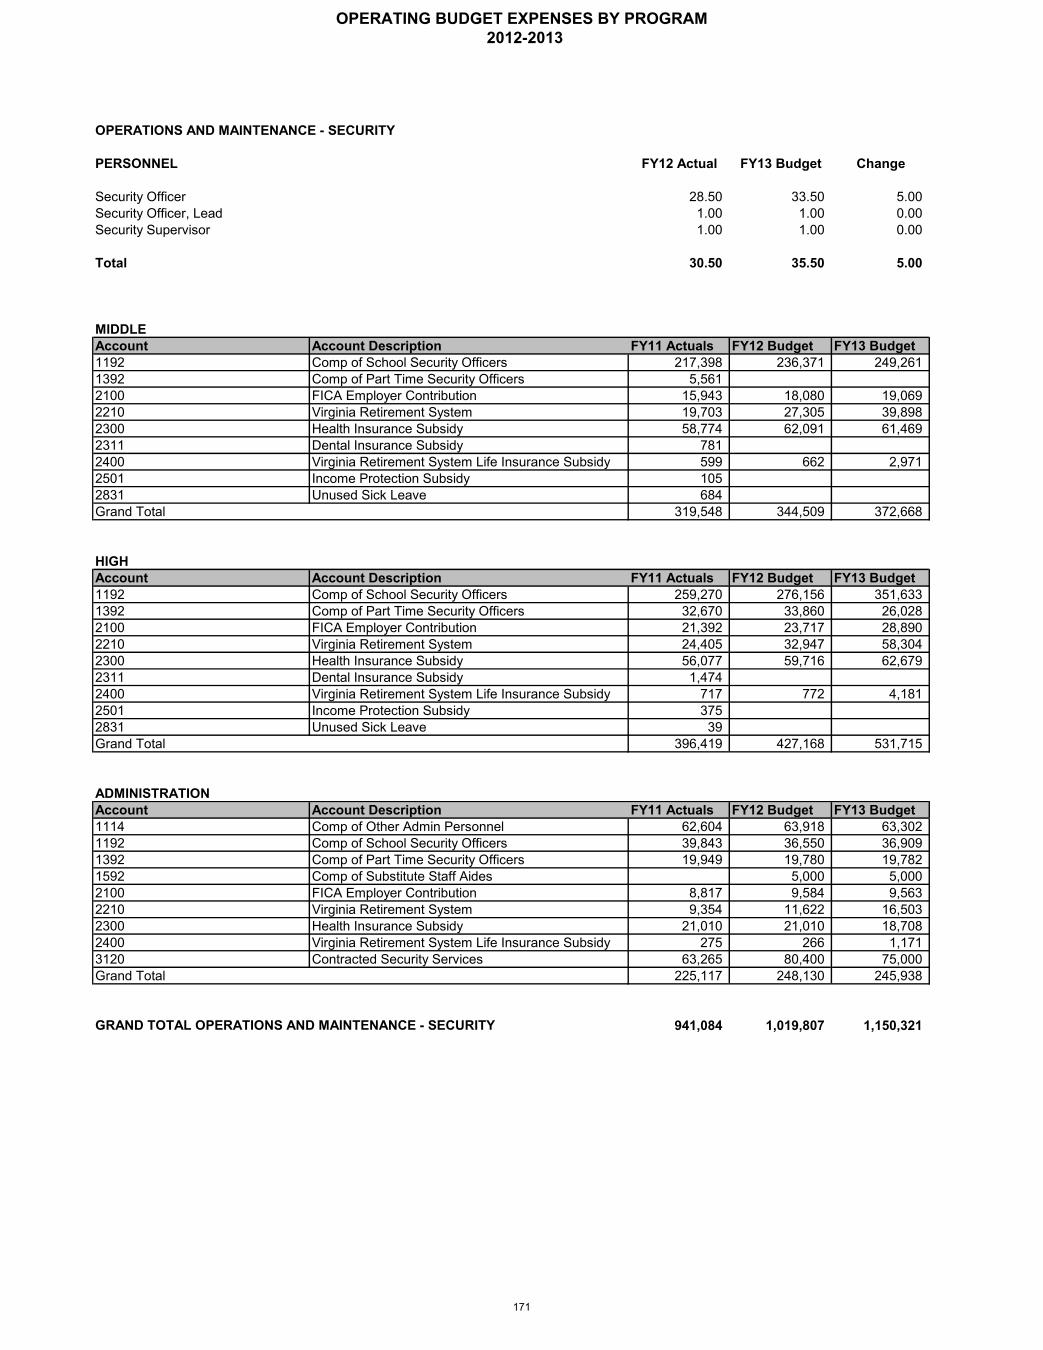
OPERATIONS AND MAINTENANCE - SECURITY
PERSONNEL FY12 Actual FY13 Budget Change
Security Officer 28.50 33.50 5.00Security Officer, Lead 1.00 1.00 0.00Security Supervisor 1.00 1.00 0.00
Total 30.50 35.50 5.00
MIDDLEAccount Account Description FY11 Actuals FY12 Budget FY13 Budget1192 Comp of School Security Officers 217,398 236,371 249,2611392 Comp of Part Time Security Officers 5,5612100 FICA Employer Contribution 15,943 18,080 19,0692210 Virginia Retirement System 19,703 27,305 39,8982300 Health Insurance Subsidy 58,774 62,091 61,4692311 Dental Insurance Subsidy 7812400 Virginia Retirement System Life Insurance Subsidy 599 662 2,9712501 Income Protection Subsidy 1052831 Unused Sick Leave 684Grand Total 319,548 344,509 372,668
HIGHAccount Account Description FY11 Actuals FY12 Budget FY13 Budget1192 Comp of School Security Officers 259,270 276,156 351,6331392 Comp of Part Time Security Officers 32,670 33,860 26,0282100 FICA Employer Contribution 21,392 23,717 28,8902210 Virginia Retirement System 24,405 32,947 58,3042300 Health Insurance Subsidy 56,077 59,716 62,6792311 Dental Insurance Subsidy 1,4742400 Virginia Retirement System Life Insurance Subsidy 717 772 4,1812501 Income Protection Subsidy 3752831 Unused Sick Leave 39Grand Total 396,419 427,168 531,715
ADMINISTRATIONAccount Account Description FY11 Actuals FY12 Budget FY13 Budget1114 Comp of Other Admin Personnel 62,604 63,918 63,3021192 Comp of School Security Officers 39,843 36,550 36,9091392 Comp of Part Time Security Officers 19,949 19,780 19,7821592 Comp of Substitute Staff Aides 5,000 5,0002100 FICA Employer Contribution 8,817 9,584 9,5632210 Virginia Retirement System 9,354 11,622 16,5032300 Health Insurance Subsidy 21,010 21,010 18,7082400 Virginia Retirement System Life Insurance Subsidy 275 266 1,1713120 Contracted Security Services 63,265 80,400 75,000Grand Total 225,117 248,130 245,938
941,084 1,019,807 1,150,321GRAND TOTAL OPERATIONS AND MAINTENANCE - SECURITY
OPERATING BUDGET EXPENSES BY PROGRAM 2012-2013
171
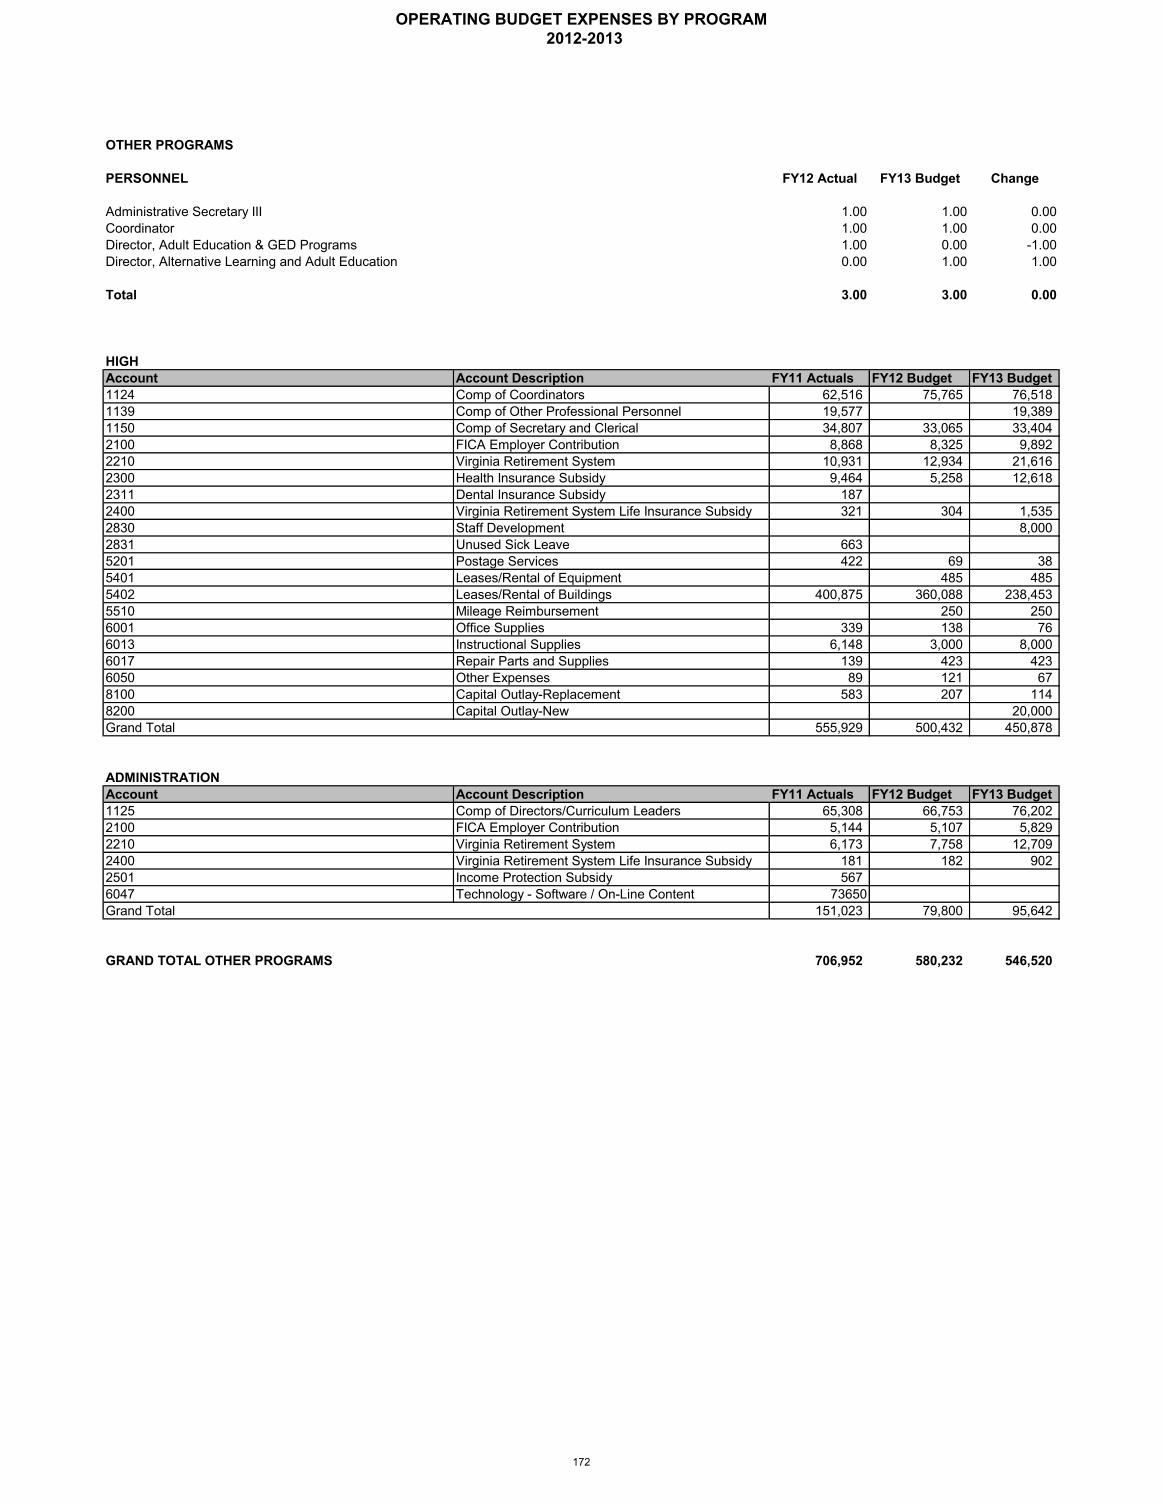
OTHER PROGRAMS
PERSONNEL FY12 Actual FY13 Budget Change
Administrative Secretary III 1.00 1.00 0.00Coordinator 1.00 1.00 0.00Director, Adult Education & GED Programs 1.00 0.00 -1.00Director, Alternative Learning and Adult Education 0.00 1.00 1.00
Total 3.00 3.00 0.00
HIGHAccount Account Description FY11 Actuals FY12 Budget FY13 Budget1124 Comp of Coordinators 62,516 75,765 76,5181139 Comp of Other Professional Personnel 19,577 19,3891150 Comp of Secretary and Clerical 34,807 33,065 33,4042100 FICA Employer Contribution 8,868 8,325 9,8922210 Virginia Retirement System 10,931 12,934 21,6162300 Health Insurance Subsidy 9,464 5,258 12,6182311 Dental Insurance Subsidy 1872400 Virginia Retirement System Life Insurance Subsidy 321 304 1,5352830 Staff Development 8,0002831 Unused Sick Leave 6635201 Postage Services 422 69 385401 Leases/Rental of Equipment 485 4855402 Leases/Rental of Buildings 400,875 360,088 238,4535510 Mileage Reimbursement 250 2506001 Office Supplies 339 138 766013 Instructional Supplies 6,148 3,000 8,0006017 Repair Parts and Supplies 139 423 4236050 Other Expenses 89 121 678100 Capital Outlay-Replacement 583 207 1148200 Capital Outlay-New 20,000Grand Total 555,929 500,432 450,878
ADMINISTRATIONAccount Account Description FY11 Actuals FY12 Budget FY13 Budget1125 Comp of Directors/Curriculum Leaders 65,308 66,753 76,2022100 FICA Employer Contribution 5,144 5,107 5,8292210 Virginia Retirement System 6,173 7,758 12,7092400 Virginia Retirement System Life Insurance Subsidy 181 182 9022501 Income Protection Subsidy 5676047 Technology - Software / On-Line Content 73650Grand Total 151,023 79,800 95,642
GRAND TOTAL OTHER PROGRAMS 706,952 580,232 546,520
OPERATING BUDGET EXPENSES BY PROGRAM 2012-2013
172
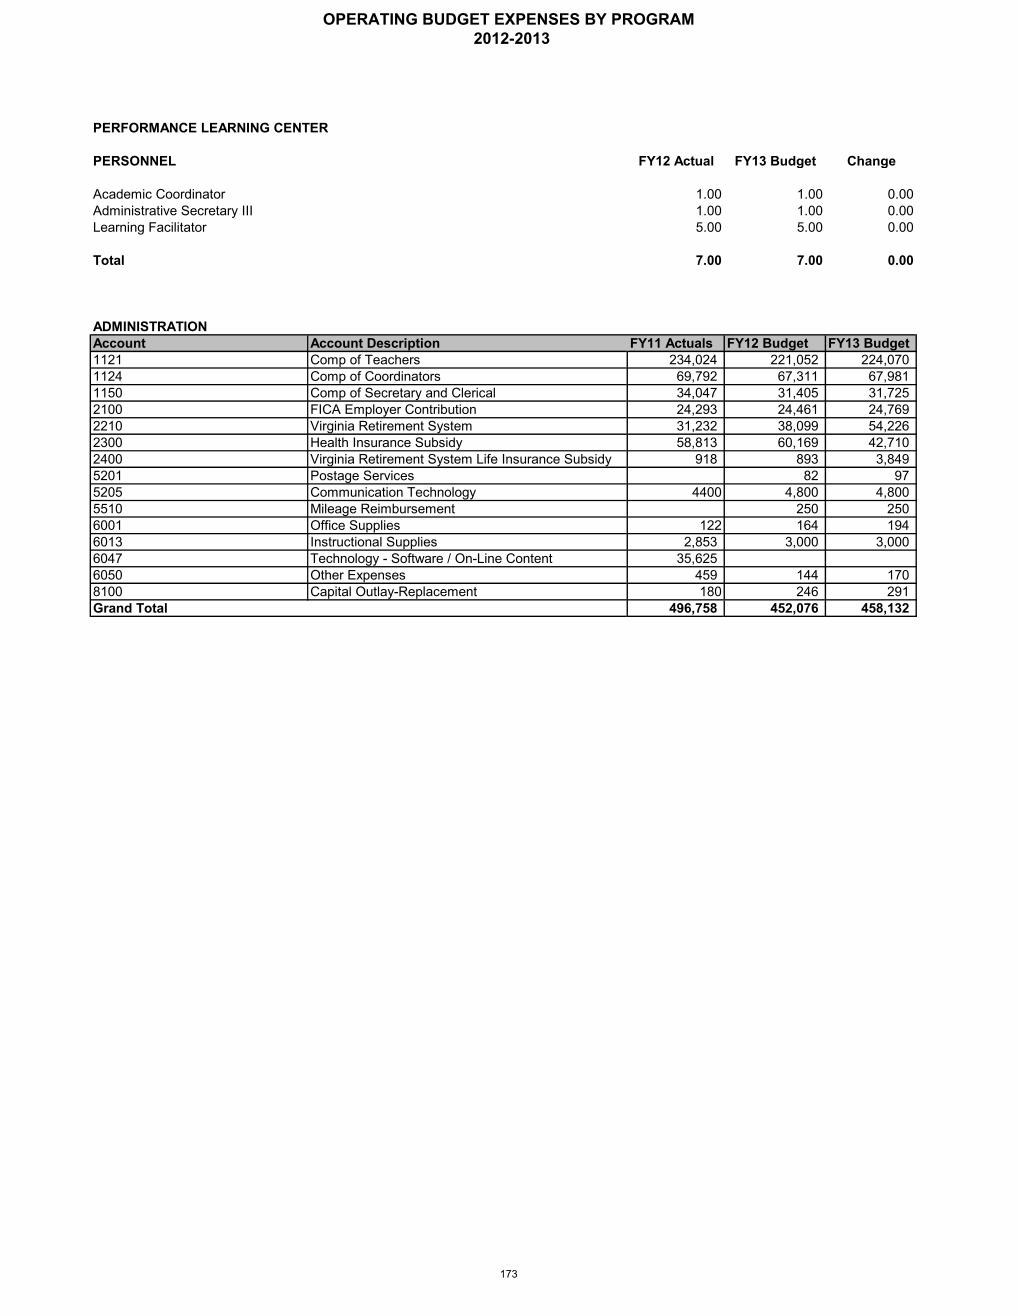
PERFORMANCE LEARNING CENTER
PERSONNEL FY12 Actual FY13 Budget Change
Academic Coordinator 1.00 1.00 0.00Administrative Secretary III 1.00 1.00 0.00Learning Facilitator 5.00 5.00 0.00
Total 7.00 7.00 0.00
ADMINISTRATIONAccount Account Description FY11 Actuals FY12 Budget FY13 Budget1121 Comp of Teachers 234,024 221,052 224,0701124 Comp of Coordinators 69,792 67,311 67,9811150 Comp of Secretary and Clerical 34,047 31,405 31,7252100 FICA Employer Contribution 24,293 24,461 24,7692210 Virginia Retirement System 31,232 38,099 54,2262300 Health Insurance Subsidy 58,813 60,169 42,7102400 Virginia Retirement System Life Insurance Subsidy 918 893 3,8495201 Postage Services 82 975205 Communication Technology 4400 4,800 4,8005510 Mileage Reimbursement 250 2506001 Office Supplies 122 164 1946013 Instructional Supplies 2,853 3,000 3,0006047 Technology - Software / On-Line Content 35,6256050 Other Expenses 459 144 1708100 Capital Outlay-Replacement 180 246 291Grand Total 496,758 452,076 458,132
OPERATING BUDGET EXPENSES BY PROGRAM 2012-2013
173
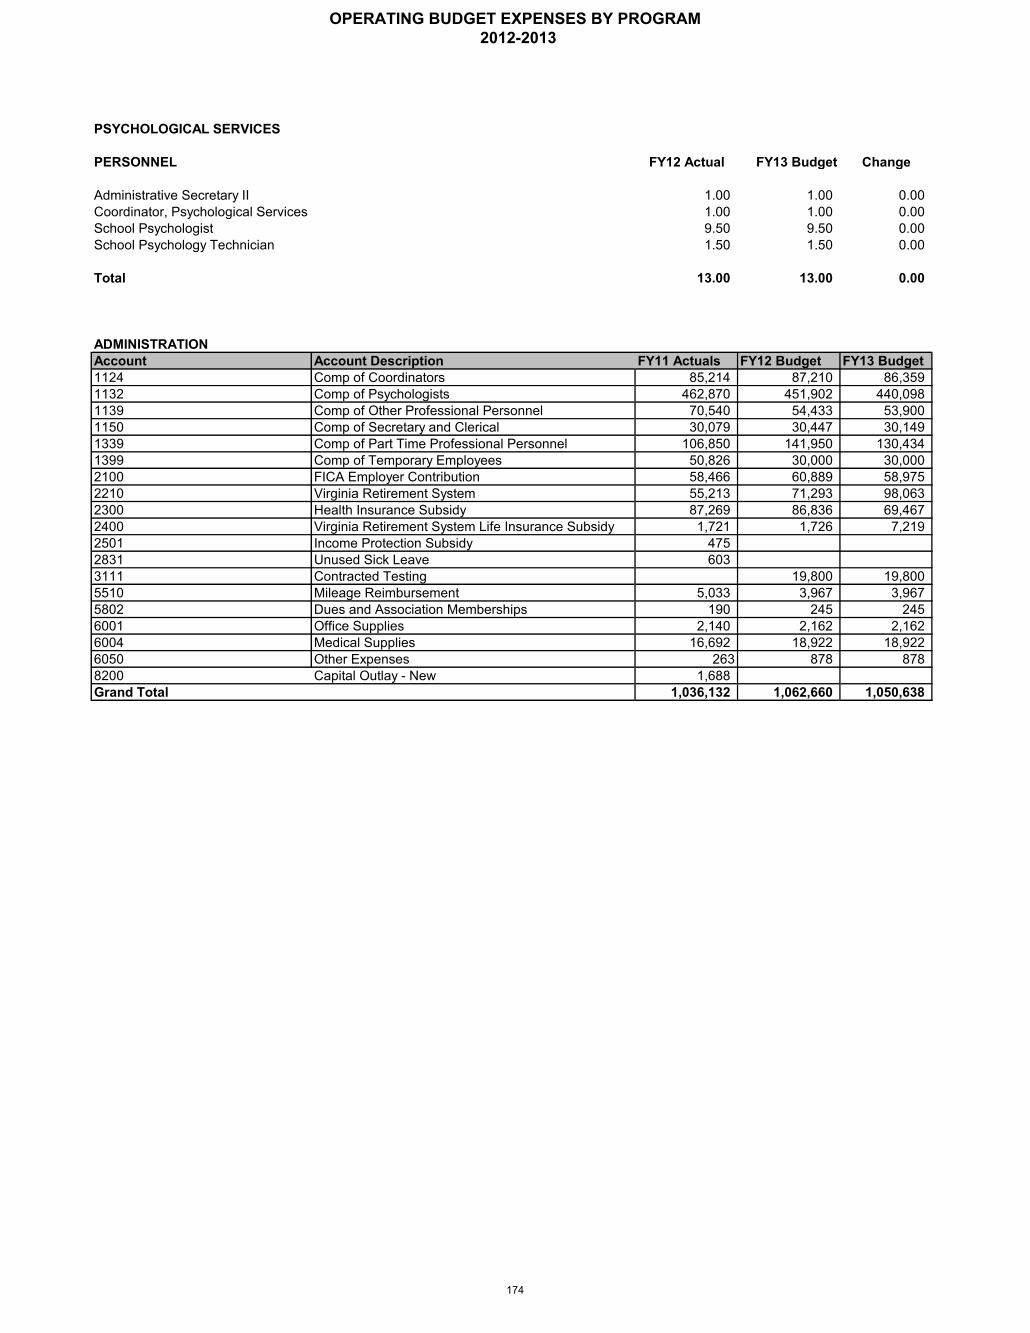
PSYCHOLOGICAL SERVICES
PERSONNEL FY12 Actual FY13 Budget Change
Administrative Secretary II 1.00 1.00 0.00Coordinator, Psychological Services 1.00 1.00 0.00School Psychologist 9.50 9.50 0.00School Psychology Technician 1.50 1.50 0.00
Total 13.00 13.00 0.00
ADMINISTRATIONAccount Account Description FY11 Actuals FY12 Budget FY13 Budget1124 Comp of Coordinators 85,214 87,210 86,3591132 Comp of Psychologists 462,870 451,902 440,0981139 Comp of Other Professional Personnel 70,540 54,433 53,9001150 Comp of Secretary and Clerical 30,079 30,447 30,1491339 Comp of Part Time Professional Personnel 106,850 141,950 130,4341399 Comp of Temporary Employees 50,826 30,000 30,0002100 FICA Employer Contribution 58,466 60,889 58,9752210 Virginia Retirement System 55,213 71,293 98,0632300 Health Insurance Subsidy 87,269 86,836 69,4672400 Virginia Retirement System Life Insurance Subsidy 1,721 1,726 7,2192501 Income Protection Subsidy 4752831 Unused Sick Leave 6033111 Contracted Testing 19,800 19,8005510 Mileage Reimbursement 5,033 3,967 3,9675802 Dues and Association Memberships 190 245 2456001 Office Supplies 2,140 2,162 2,1626004 Medical Supplies 16,692 18,922 18,9226050 Other Expenses 263 878 8788200 Capital Outlay - New 1,688Grand Total 1,036,132 1,062,660 1,050,638
OPERATING BUDGET EXPENSES BY PROGRAM 2012-2013
174
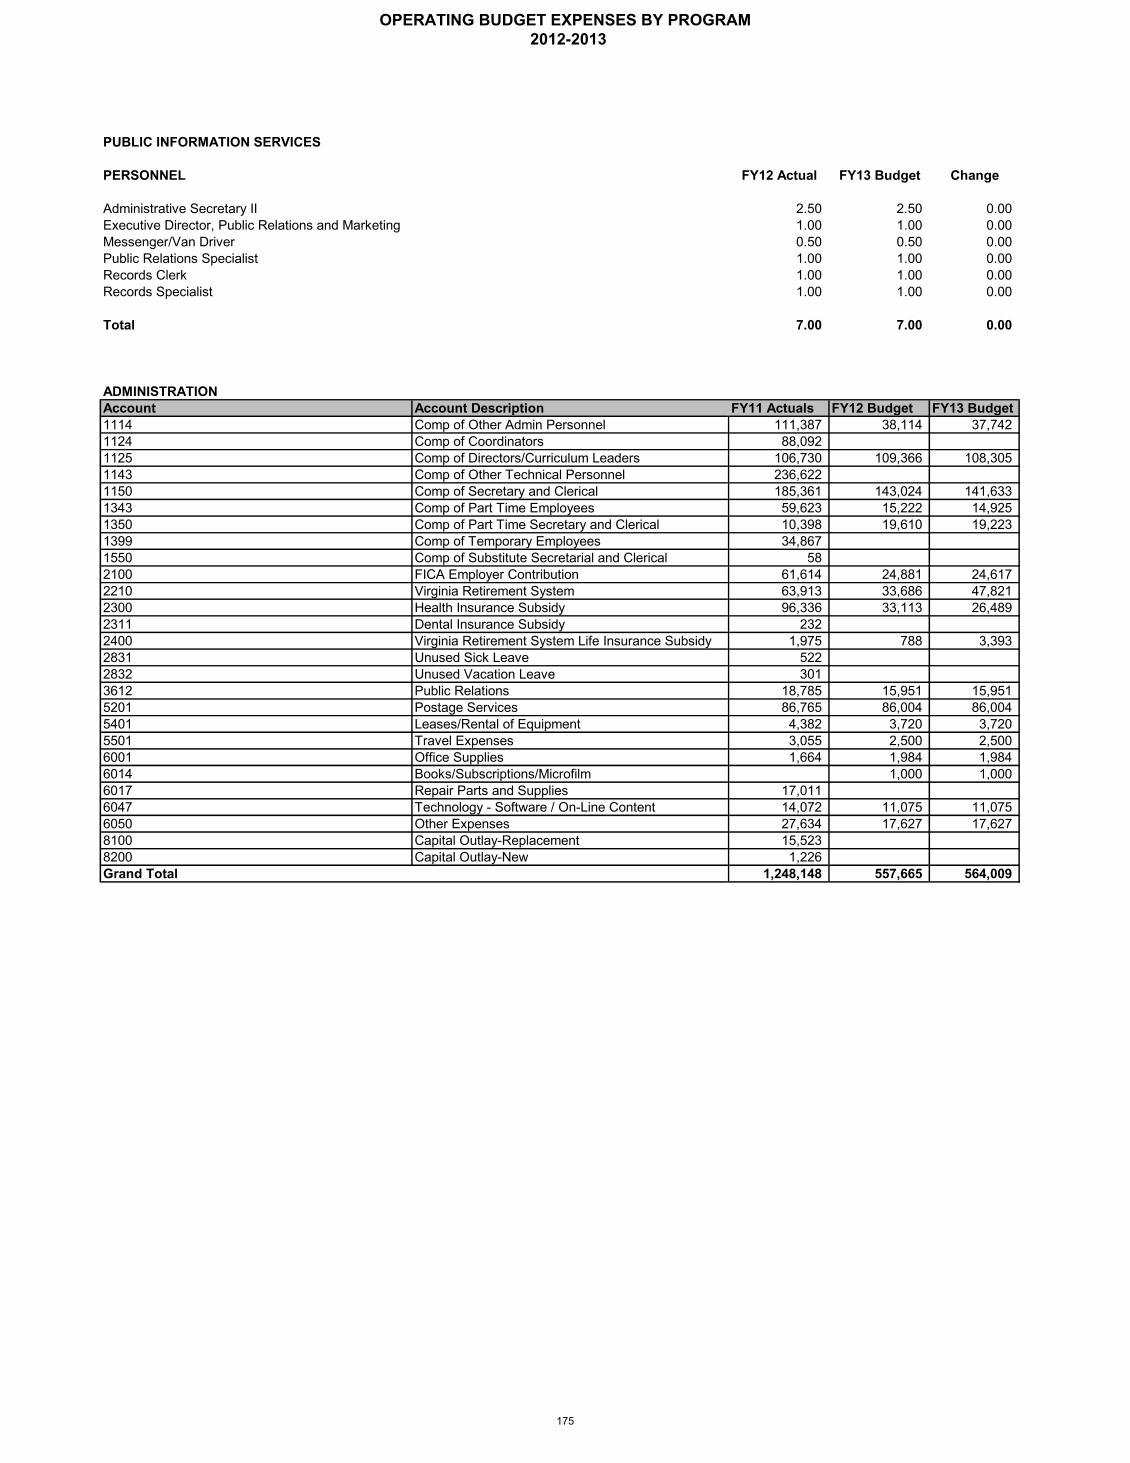
PUBLIC INFORMATION SERVICES
PERSONNEL FY12 Actual FY13 Budget Change
Administrative Secretary II 2.50 2.50 0.00Executive Director, Public Relations and Marketing 1.00 1.00 0.00Messenger/Van Driver 0.50 0.50 0.00Public Relations Specialist 1.00 1.00 0.00Records Clerk 1.00 1.00 0.00Records Specialist 1.00 1.00 0.00
Total 7.00 7.00 0.00
ADMINISTRATIONAccount Account Description FY11 Actuals FY12 Budget FY13 Budget1114 Comp of Other Admin Personnel 111,387 38,114 37,7421124 Comp of Coordinators 88,0921125 Comp of Directors/Curriculum Leaders 106,730 109,366 108,3051143 Comp of Other Technical Personnel 236,6221150 Comp of Secretary and Clerical 185,361 143,024 141,6331343 Comp of Part Time Employees 59,623 15,222 14,9251350 Comp of Part Time Secretary and Clerical 10,398 19,610 19,2231399 Comp of Temporary Employees 34,8671550 Comp of Substitute Secretarial and Clerical 582100 FICA Employer Contribution 61,614 24,881 24,6172210 Virginia Retirement System 63,913 33,686 47,8212300 Health Insurance Subsidy 96,336 33,113 26,4892311 Dental Insurance Subsidy 2322400 Virginia Retirement System Life Insurance Subsidy 1,975 788 3,3932831 Unused Sick Leave 5222832 Unused Vacation Leave 3013612 Public Relations 18,785 15,951 15,9515201 Postage Services 86,765 86,004 86,0045401 Leases/Rental of Equipment 4,382 3,720 3,7205501 Travel Expenses 3,055 2,500 2,5006001 Office Supplies 1,664 1,984 1,9846014 Books/Subscriptions/Microfilm 1,000 1,0006017 Repair Parts and Supplies 17,0116047 Technology - Software / On-Line Content 14,072 11,075 11,0756050 Other Expenses 27,634 17,627 17,6278100 Capital Outlay-Replacement 15,5238200 Capital Outlay-New 1,226Grand Total 1,248,148 557,665 564,009
OPERATING BUDGET EXPENSES BY PROGRAM 2012-2013
175

READING
PERSONNEL FY12 Actual FY13 Budget Change
Reading Coach - Elementary 5.00 5.00 0.00Reading Coach - Secondary 6.00 5.00 (1.00)Teacher - Elementary 13.00 12.00 (1.00)Teacher - Secondary 6.00 6.00 0.00
Total 30.00 28.00 (2.00)
ELEMENTARYAccount Account Description FY11 Actuals FY12 Budget FY13 Budget1121 Comp of Teachers 970,321 938,380 880,1402100 FICA Employer Contribution 71,971 71,787 67,3312210 Virginia Retirement System 92,371 111,951 147,5992300 Health Insurance Subsidy 131,309 132,052 82,1362311 Dental Insurance Subsidy 6682400 Virginia Retirement System Life Insurance Subsidy 2,752 2,629 10,4722501 Income Protection Subsidy 510Grand Total 1,269,902 1,256,799 1,187,678
MIDDLEAccount Account Description FY11 Actuals FY12 Budget FY13 Budget1121 Comp of Teachers 202,599 378,729 328,7442100 FICA Employer Contribution 13,882 28,974 25,1482210 Virginia Retirement System 19,727 45,183 53,5282300 Health Insurance Subsidy 48,800 54,058 41,8902400 Virginia Retirement System Life Insurance Subsidy 580 1,060 3,911Grand Total 285,588 508,004 453,221
HIGHAccount Account Description FY11 Actuals FY12 Budget FY13 Budget1121 Comp of Teachers 143,091 207,468 214,2762100 FICA Employer Contribution 10,646 15,872 16,3942210 Virginia Retirement System 14,455 24,752 35,9352300 Health Insurance Subsidy 10,516 5,258 11,7982400 Virginia Retirement System Life Insurance Subsidy 405 581 2,5502501 Income Protection Subsidy 419Grand Total 179,532 253,931 280,953
1,735,022 2,018,734 1,921,852GRAND TOTAL READING
OPERATING BUDGET EXPENSES BY PROGRAM 2012-2013
176

REGULAR PROGRAMS
PERSONNEL FY12 Actual FY13 Budget Change
Administrative Secretary II 6.00 6.00 0.00Administrative Secretary III 33.30 33.30 0.00Assistant Principal 51.00 51.00 0.00Coordinator 0.00 0.00 0.00Dean of Students 9.00 9.00 0.00Educational Interpreter 1.00 1.00 0.00Executive Director 2.30 2.30 0.00Graduation Specialists 0.00 4.00 4.00In-School Suspension Assistant 11.00 11.00 0.00Instructional Assistant - General Ed 69.00 74.00 5.00Library Assistant 0.00 0.50 0.50Office Assistant 15.50 15.00 (0.50)Principal 30.00 30.00 0.00School Accountant 4.00 4.00 0.00School Finance Officer 7.00 7.00 0.00Study Hall Monitor 1.00 1.00 0.00Teacher - Elementary 427.00 427.00 0.00Teacher - Other 10.00 10.00 0.00Testing Specialist 4.00 4.00 0.00
Total 681.10 690.10 9.00
ELEMENTARYAccount Account Description FY11 Actuals FY12 Budget FY13 Budget1121 Comp of Teachers 15,614,016 16,295,745 16,242,7231125 Comp of Directors/Curriculum Leaders 136,503 139,832 138,2941126 Comp of Principals 1,563,805 1,506,932 1,510,5551127 Comp of Assistant Principals 1,143,493 1,103,588 1,146,3031141 Comp of Teacher Assistants 1,134,239 1,123,628 1,197,1301150 Comp of Secretary and Clerical 734,201 786,244 701,4001342 Comp of Part Time Teacher Assistants 4961350 Comp of Part Time Secretary and Clerical 9,185 121,200 114,0001514 Comp of Substitute Admin Personnel 20,5131521 Comp of Substitute Teachers 455,1691541 Comp of Substitute Teacher Assistants 36,5031550 Comp of Substitute Secretary and Clerical 20,1562100 FICA Employer Contribution 1,535,507 1,612,421 1,610,3982210 Virginia Retirement System 1,886,080 2,465,973 3,433,0902300 Health Insurance Subsidy 2,757,376 2,744,636 2,102,5532311 Dental Insurance Subsidy 33,7972400 Virginia Retirement System Life Insurance Subsidy 56,881 58,555 248,8542501 Income Protection Subsidy 21,8522831 Unused Sick Leave 22,8162832 Unused Vacation Leave 10,8945201 Postage Services 15,337 7,856 7,6445510 Mileage Reimbursement 6,014 5,000 4,7506001 Office Supplies 31,811 16,336 15,8946013 Instructional Supplies 245,168 116,819 108,3286017 Repair Parts and Supplies 195 3,246 2,2776047 Technology - Software / On-Line Content 1,319 22,000 4,0006050 Other Expenses 12,301 14,752 14,3648100 Capital Outlay-Replacement 60,522 23,562 22,9058200 Capital Outlay - New 14,406Grand Total 27,580,555 28,168,325 28,625,462
OPERATING BUDGET EXPENSES BY PROGRAM 2012-2013
177

REGULAR PROGRAMS
MIDDLEAccount Account Description FY11 Actuals FY12 Budget FY13 Budget1121 Comp of Teachers 2,317,577 2,579,464 2,671,7261123 Comp of Deans and Guidance Counselors 9,1571125 Comp of Directors/Curriculum Leaders 101,506 103,963 102,9551126 Comp of Principals 621,222 597,596 572,4011127 Comp of Assistant Principals 971,980 1,078,739 1,093,8291139 Comp of Other Professional Personnel 153,579 212,852 212,2611141 Comp of Teacher Assistants 141,310 143,246 164,7091150 Comp of Secretary and Clerical 494,902 480,248 479,1541350 Comp of Part Time Secretary and Clerical 493 42,420 42,0001370 Comp of Bus Drivers Extra Runs 3,400 3,4001399 Comp of Temporary Employees 14,460 10,000 10,0001514 Comp of Substitute Admin Personnel 45,7541521 Comp of Substitute Teachers 407,2421541 Comp of Substitute Teacher Assistants 6,1431550 Comp of Substitute Secretary and Clerical 15,7652100 FICA Employer Contribution 395,344 401,775 409,4652210 Virginia Retirement System 448,840 615,214 872,5182300 Health Insurance Subsidy 615,934 632,440 467,2292311 Dental Insurance Subsidy 6,3542400 Virginia Retirement System Life Insurance Subsidy 13,360 14,505 62,8742501 Income Protection Subsidy 6,2752831 Unused Sick Leave 26,9612832 Unused Vacation Leave 9,0593145 Professional Services 67,320 32,6943320 Contracted Maintenance Agreements 169 1,148 1,1485201 Postage Services 15,095 8,068 8,1665401 Leases/Rental of Equipment 906 696 6965402 Leases/Rental of Buildings 50,335 55,000 60,0005403 Commencement Costs 16,212 25,300 25,3005510 Mileage Reimbursement 4,178 3,500 3,5005801 Accreditation Costs 2,500 2,520 2,5206001 Office Supplies 28,622 12,203 12,3616013 Instructional Supplies 158,535 101,283 103,8876017 Repair Parts and Supplies 4,332 7,637 7,6376047 Technology - Software / On-Line Content 239,680 349,790 300,0006050 Other Expenses 34,654 31,349 74,4878100 Capital Outlay-Replacement 33,228 17,724 17,9618200 Capital Outlay-New 50,515 47,786Grand Total 7,529,498 7,579,866 7,814,878
OPERATING BUDGET EXPENSES BY PROGRAM 2012-2013
178
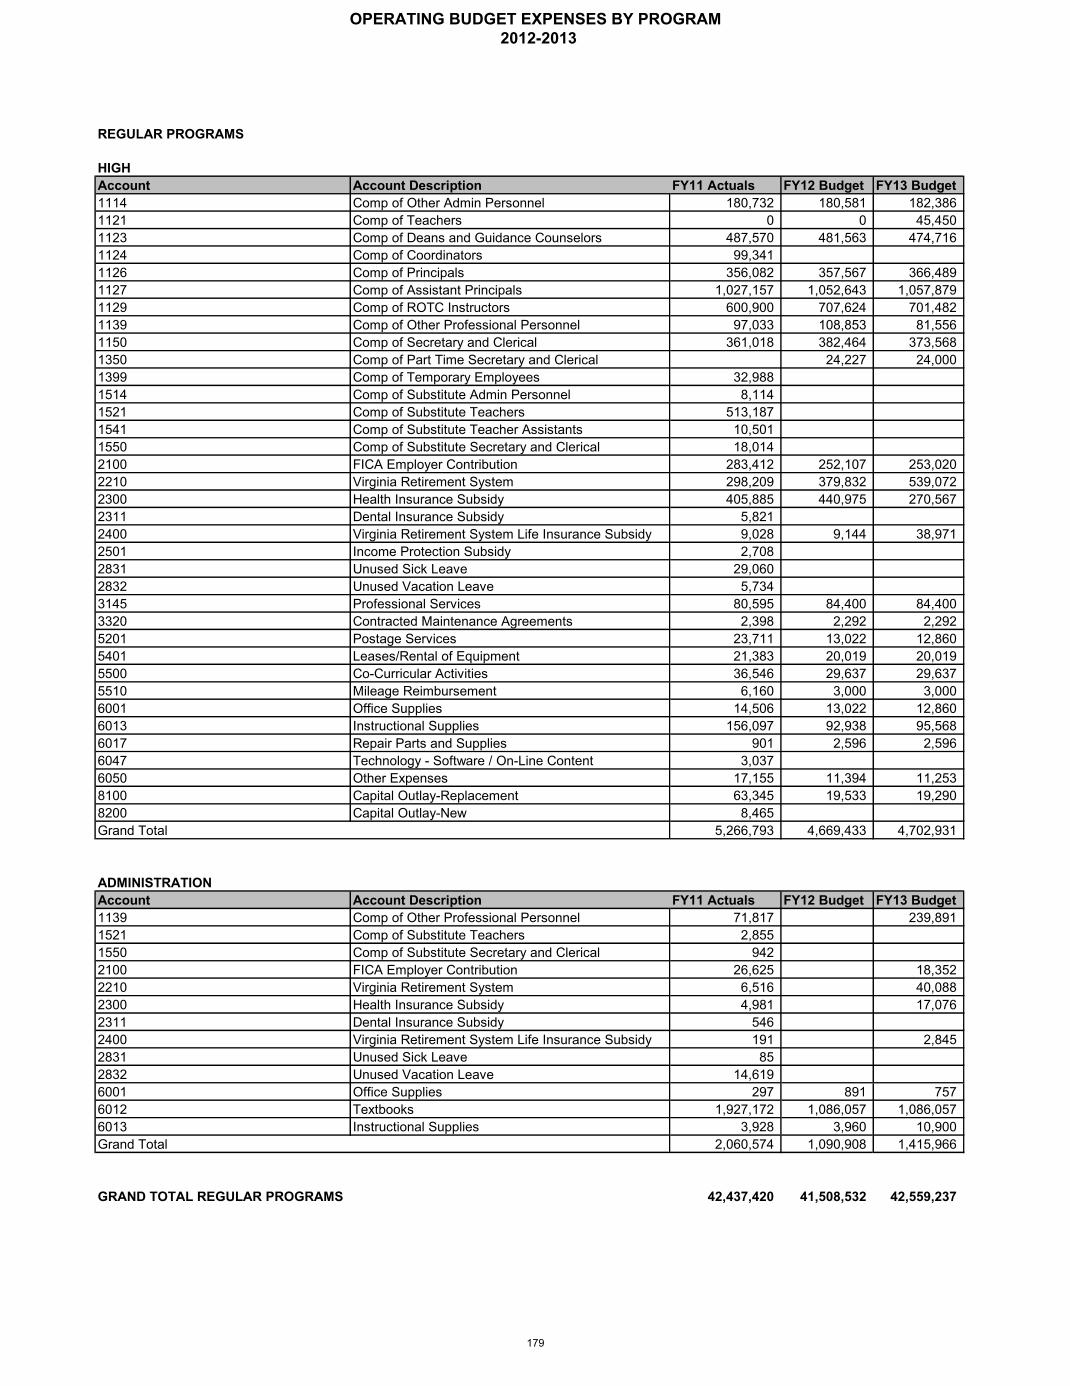
REGULAR PROGRAMS
HIGHAccount Account Description FY11 Actuals FY12 Budget FY13 Budget1114 Comp of Other Admin Personnel 180,732 180,581 182,3861121 Comp of Teachers 0 0 45,4501123 Comp of Deans and Guidance Counselors 487,570 481,563 474,7161124 Comp of Coordinators 99,3411126 Comp of Principals 356,082 357,567 366,4891127 Comp of Assistant Principals 1,027,157 1,052,643 1,057,8791129 Comp of ROTC Instructors 600,900 707,624 701,4821139 Comp of Other Professional Personnel 97,033 108,853 81,5561150 Comp of Secretary and Clerical 361,018 382,464 373,5681350 Comp of Part Time Secretary and Clerical 24,227 24,0001399 Comp of Temporary Employees 32,9881514 Comp of Substitute Admin Personnel 8,1141521 Comp of Substitute Teachers 513,1871541 Comp of Substitute Teacher Assistants 10,5011550 Comp of Substitute Secretary and Clerical 18,0142100 FICA Employer Contribution 283,412 252,107 253,0202210 Virginia Retirement System 298,209 379,832 539,0722300 Health Insurance Subsidy 405,885 440,975 270,5672311 Dental Insurance Subsidy 5,8212400 Virginia Retirement System Life Insurance Subsidy 9,028 9,144 38,9712501 Income Protection Subsidy 2,7082831 Unused Sick Leave 29,0602832 Unused Vacation Leave 5,7343145 Professional Services 80,595 84,400 84,4003320 Contracted Maintenance Agreements 2,398 2,292 2,2925201 Postage Services 23,711 13,022 12,8605401 Leases/Rental of Equipment 21,383 20,019 20,0195500 Co-Curricular Activities 36,546 29,637 29,6375510 Mileage Reimbursement 6,160 3,000 3,0006001 Office Supplies 14,506 13,022 12,8606013 Instructional Supplies 156,097 92,938 95,5686017 Repair Parts and Supplies 901 2,596 2,5966047 Technology - Software / On-Line Content 3,0376050 Other Expenses 17,155 11,394 11,2538100 Capital Outlay-Replacement 63,345 19,533 19,2908200 Capital Outlay-New 8,465Grand Total 5,266,793 4,669,433 4,702,931
ADMINISTRATIONAccount Account Description FY11 Actuals FY12 Budget FY13 Budget1139 Comp of Other Professional Personnel 71,817 239,8911521 Comp of Substitute Teachers 2,8551550 Comp of Substitute Secretary and Clerical 9422100 FICA Employer Contribution 26,625 18,3522210 Virginia Retirement System 6,516 40,0882300 Health Insurance Subsidy 4,981 17,0762311 Dental Insurance Subsidy 5462400 Virginia Retirement System Life Insurance Subsidy 191 2,8452831 Unused Sick Leave 852832 Unused Vacation Leave 14,6196001 Office Supplies 297 891 7576012 Textbooks 1,927,172 1,086,057 1,086,0576013 Instructional Supplies 3,928 3,960 10,900Grand Total 2,060,574 1,090,908 1,415,966
GRAND TOTAL REGULAR PROGRAMS 42,437,420 41,508,532 42,559,237
OPERATING BUDGET EXPENSES BY PROGRAM 2012-2013
179

REPROGRAPHICS
PERSONNEL FY12 Actual FY13 Budget Change
Coordinator, Graphics 1.00 1.00 0.00Coordinator, Printing Services 1.00 1.00 0.00Graphic Artist 2.00 2.00 0.00Printer I 1.50 1.50 0.00Printer II 1.00 1.00 0.00Printer, Senior 1.00 1.00 0.00Webmaster 1.00 1.00 0.00
Total 8.50 8.50 0.00
ADMINISTRATIONAccount Account Description FY11 Actuals FY12 Budget FY13 Budget1124 Comp of Coordinators 96,958 101,812 100,8141143 Comp of Other Technical Personnel 204,219 211,942 209,8371343 Comp of Part Time Employees 14,153 14,545 14,2551399 Comp of Temporary Employees 10,000 10,0002100 FICA Employer Contribution 23,164 25,881 25,6212210 Virginia Retirement System 29,028 36,697 52,0962300 Health Insurance Subsidy 53,389 53,389 43,1592311 Dental Insurance Subsidy 6682400 Virginia Retirement System Life Insurance Subsidy 864 862 3,6963320 Contracted Maintenance Agreements 19,350 19,3503330 Contracted Repair Service 3,805 800 8003500 Contracted Printing Cost 15,893 36,392 34,3925401 Leases/Rental of Equipment 84,000 72,203 72,2035510 Mileage Reimbursement 194 1946011 Other Operating Supplies 7,369 8,232 8,2326017 Repair Parts and Supplies 317 2,000 2,0006040 Print Shop Supplies 65,757 76,456 41,6388100 Capital Outlay-Replacement 21,9728200 Capital Outlay-New 6,157Grand Total 627,713 670,755 638,287
OPERATING BUDGET EXPENSES BY PROGRAM 2012-2013
180
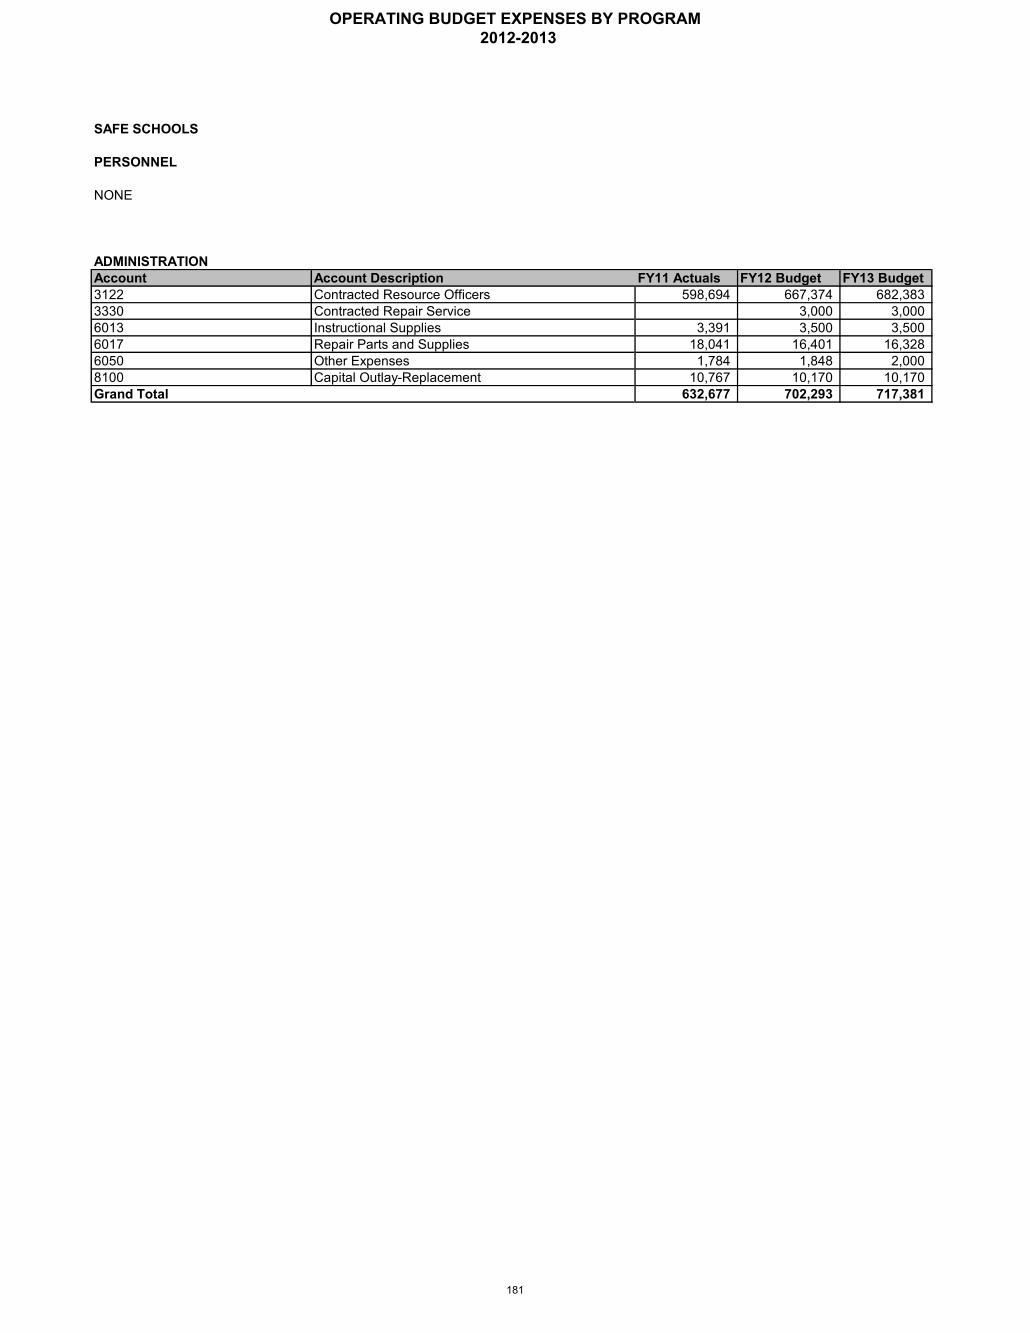
SAFE SCHOOLS
PERSONNEL
NONE
ADMINISTRATIONAccount Account Description FY11 Actuals FY12 Budget FY13 Budget3122 Contracted Resource Officers 598,694 667,374 682,3833330 Contracted Repair Service 3,000 3,0006013 Instructional Supplies 3,391 3,500 3,5006017 Repair Parts and Supplies 18,041 16,401 16,3286050 Other Expenses 1,784 1,848 2,0008100 Capital Outlay-Replacement 10,767 10,170 10,170Grand Total 632,677 702,293 717,381
OPERATING BUDGET EXPENSES BY PROGRAM 2012-2013
181

SCHOOL FOOD SERVICE
PERSONNEL FY12 Actual FY13 Budget Change
Cafeteria Monitor 0.00 27.00 27.00
Total 0.00 27.00 27.00
ELEMENTARYAccount Account Description FY11 Actuals FY12 Budget FY13 Budget1343 Comp of Part Time Employees 161,976 171,3692100 FICA Employer Contribution 12,391 13,112Grand Total 174,367 184,481
MIDDLEAccount Account Description FY11 Actuals FY12 Budget FY13 Budget1343 Comp of Part Time Employees 57,620 66,9592100 FICA Employer Contribution 4,408 5,125Grand Total 62,028 72,084
GRAND TOTAL SCHOOL FOOD SERVICE 236,395 256,565
This program reflects expenses for cafeteria monitors in our schools. These employees were paid from the Education Jobs Fund in FY12.
OPERATING BUDGET EXPENSES BY PROGRAM 2012-2013
182

SCHOOL SOCIAL WORK
PERSONNEL FY12 Actual FY13 Budget Change
Administrative Secretary II 1.00 1.00 0.00Coordinator, School Social Work Services 1.00 1.00 0.00School Social Worker 8.50 8.50 0.00
Total 10.50 10.50 0.00
ADMINISTRATIONAccount Account Description FY11 Actuals FY12 Budget FY13 Budget1124 Comp of Coordinators 90,695 92,844 91,9381134 Comp of Social Worker 487,726 475,062 479,7921150 Comp of Secretary and Clerical 32,636 32,876 32,5551334 Comp of Part-Time Social Workers 27,902 29,797 30,7012100 FICA Employer Contribution 47,735 48,239 48,5752210 Virginia Retirement System 55,634 71,101 100,9462300 Health Insurance Subsidy 54,414 54,415 43,5302311 Dental Insurance Subsidy 4322400 Virginia Retirement System Life Insurance Subsidy 1,660 1,668 7,1632501 Income Protection Subsidy 2305510 Mileage Reimbursement 3,840 3,843 4,9346001 Office Supplies 911 1,160 1,1606013 Instructional Supplies 1,577 2,035 3,0356050 Other Expenses 2,7077002 New Horizons- Special Ed 19,257 19,257 19,2578200 Capital Outlay - New 604Grand Total 827,960 832,297 863,586
OPERATING BUDGET EXPENSES BY PROGRAM 2012-2013
183
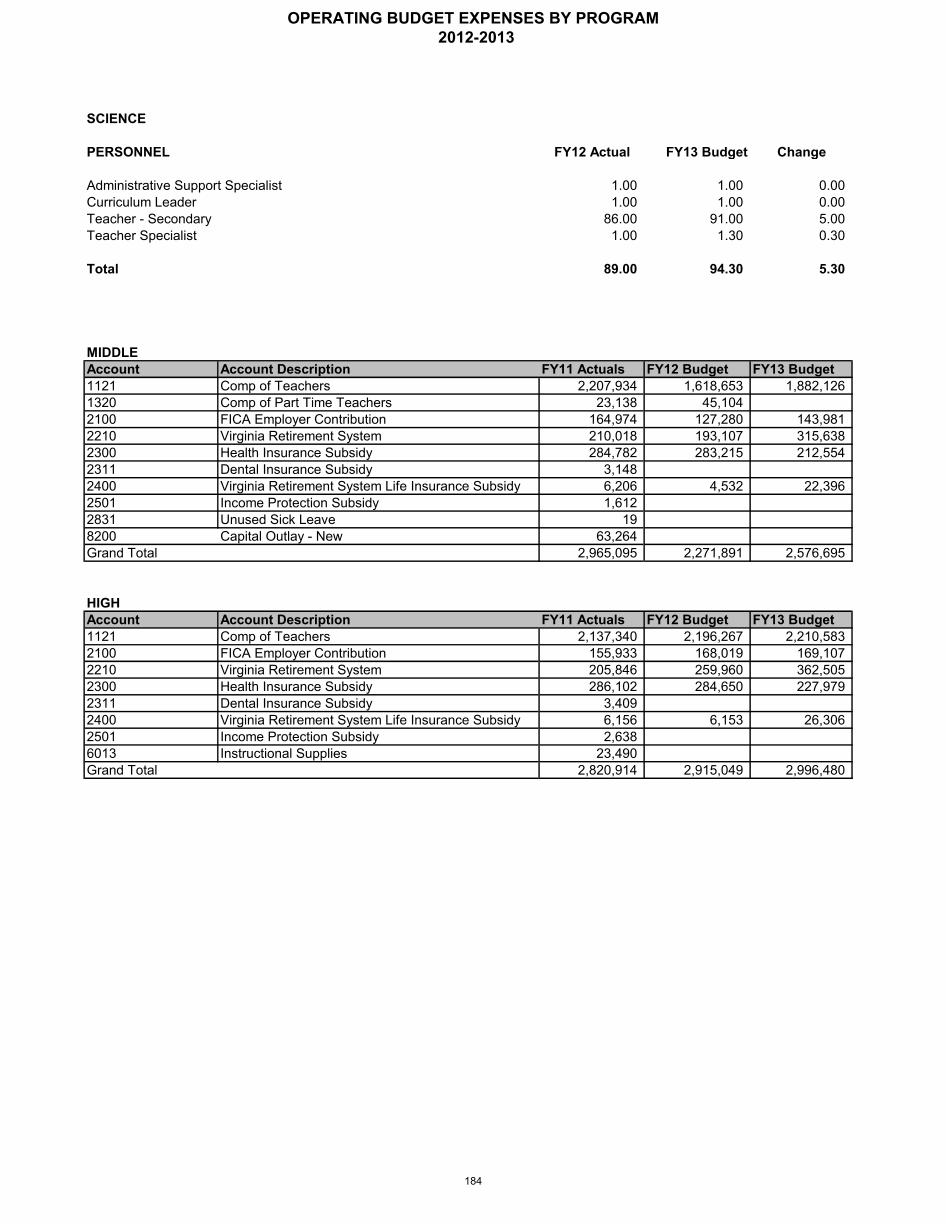
SCIENCE
PERSONNEL FY12 Actual FY13 Budget Change
Administrative Support Specialist 1.00 1.00 0.00Curriculum Leader 1.00 1.00 0.00Teacher - Secondary 86.00 91.00 5.00Teacher Specialist 1.00 1.30 0.30
Total 89.00 94.30 5.30
MIDDLEAccount Account Description FY11 Actuals FY12 Budget FY13 Budget1121 Comp of Teachers 2,207,934 1,618,653 1,882,1261320 Comp of Part Time Teachers 23,138 45,1042100 FICA Employer Contribution 164,974 127,280 143,9812210 Virginia Retirement System 210,018 193,107 315,6382300 Health Insurance Subsidy 284,782 283,215 212,5542311 Dental Insurance Subsidy 3,1482400 Virginia Retirement System Life Insurance Subsidy 6,206 4,532 22,3962501 Income Protection Subsidy 1,6122831 Unused Sick Leave 198200 Capital Outlay - New 63,264Grand Total 2,965,095 2,271,891 2,576,695
HIGHAccount Account Description FY11 Actuals FY12 Budget FY13 Budget1121 Comp of Teachers 2,137,340 2,196,267 2,210,5832100 FICA Employer Contribution 155,933 168,019 169,1072210 Virginia Retirement System 205,846 259,960 362,5052300 Health Insurance Subsidy 286,102 284,650 227,9792311 Dental Insurance Subsidy 3,4092400 Virginia Retirement System Life Insurance Subsidy 6,156 6,153 26,3062501 Income Protection Subsidy 2,6386013 Instructional Supplies 23,490Grand Total 2,820,914 2,915,049 2,996,480
OPERATING BUDGET EXPENSES BY PROGRAM 2012-2013
184

SCIENCE
ADMINISTRATIONAccount Account Description FY11 Actuals FY12 Budget FY13 Budget1121 Comp of Teachers 26,479 46,611 47,0761125 Comp of Directors/Curriculum Leaders 85,413 87,448 86,5901139 Comp of Other Professional Personnel 66,275 64,379 82,3921150 Comp of Secretary and Clerical 34,546 35,073 34,7242100 FICA Employer Contribution 15,117 17,864 19,1842210 Virginia Retirement System 19,908 27,571 42,0562300 Health Insurance Subsidy 38,014 43,272 30,9042400 Virginia Retirement System Life Insurance Subsidy 585 647 2,9844400 Printing Services 13,7975401 Leases/Rental of Equipment 2,447 2,832 2,6325510 Mileage Reimbursement 1,469 2,294 2,0946001 Office Supplies 2,076 1,113 1,1136010 OSHA Supplies 4,335 4,542 4,5426013 Instructional Supplies 61,768 46,753 46,5516050 Other Expenses 916 1,915 1,9158200 Capital Outlay-New 6,672Grand Total 366,020 382,314 418,554
GRAND TOTAL SCIENCE 6,152,029 5,569,254 5,991,729
OPERATING BUDGET EXPENSES BY PROGRAM 2012-2013
185

SOCIAL SCIENCES
PERSONNEL FY12 Actual FY13 Budget Change
Administrative Support Specialist 1.00 1.00 0.00Curriculum Leader 1.00 1.00 0.00Teacher - Secondary 92.50 98.00 5.50Teacher Specialist 2.00 2.00 0.00
Total 96.50 102.00 5.50
MIDDLEAccount Account Description FY11 Actuals FY12 Budget FY13 Budget1121 Comp of Teachers 2,177,903 1,628,992 1,860,1241320 Comp of Part Time Teachers 160,004 22,4882100 FICA Employer Contribution 205,727 126,341 142,2972210 Virginia Retirement System 293,567 192,220 311,9452300 Health Insurance Subsidy 295,036 203,9722311 Dental Insurance Subsidy 2,9982400 Virginia Retirement System Life Insurance Subsidy 6,141 4,560 22,1302501 Income Protection Subsidy 2,328Grand Total 2,848,668 2,269,637 2,540,468
HIGHAccount Account Description FY11 Actuals FY12 Budget FY13 Budget1121 Comp of Teachers 2,568,114 2,538,075 2,579,2392100 FICA Employer Contribution 189,714 194,165 197,3072210 Virginia Retirement System 243,305 296,903 424,2612300 Health Insurance Subsidy 341,605 335,977 270,6892311 Dental Insurance Subsidy 2,4562400 Virginia Retirement System Life Insurance Subsidy 7,315 7,107 30,6922501 Income Protection Subsidy 1,860Grand Total 3,354,369 3,372,227 3,502,188
ADMINISTRATIONAccount Account Description FY11 Actuals FY12 Budget FY13 Budget1125 Comp of Directors/Curriculum Leaders 68,351 69,870 69,1851139 Comp of Other Professional Personnel 125,298 125,470 126,7241150 Comp of Secretary and Clerical 33,117 33,014 32,6871521 Comp of Substitute Teachers 3182100 FICA Employer Contribution 17,011 17,470 17,4882210 Virginia Retirement System 21,366 27,001 38,3362300 Health Insurance Subsidy 13,895 13,895 15,3222400 Virginia Retirement System Life Insurance Subsidy 628 634 2,7202501 Income Protection Subsidy 1,4185510 Mileage Reimbursement 818 1,217 1,0006001 Office Supplies 296 297 5006013 Instructional Supplies 40,597 41,381 37,2436050 Other Expenses 215 219 219Grand Total 323,328 330,468 341,424
6,526,365 5,972,332 6,384,080GRAND TOTAL SOCIAL SCIENCES
OPERATING BUDGET EXPENSES BY PROGRAM 2012-2013
186
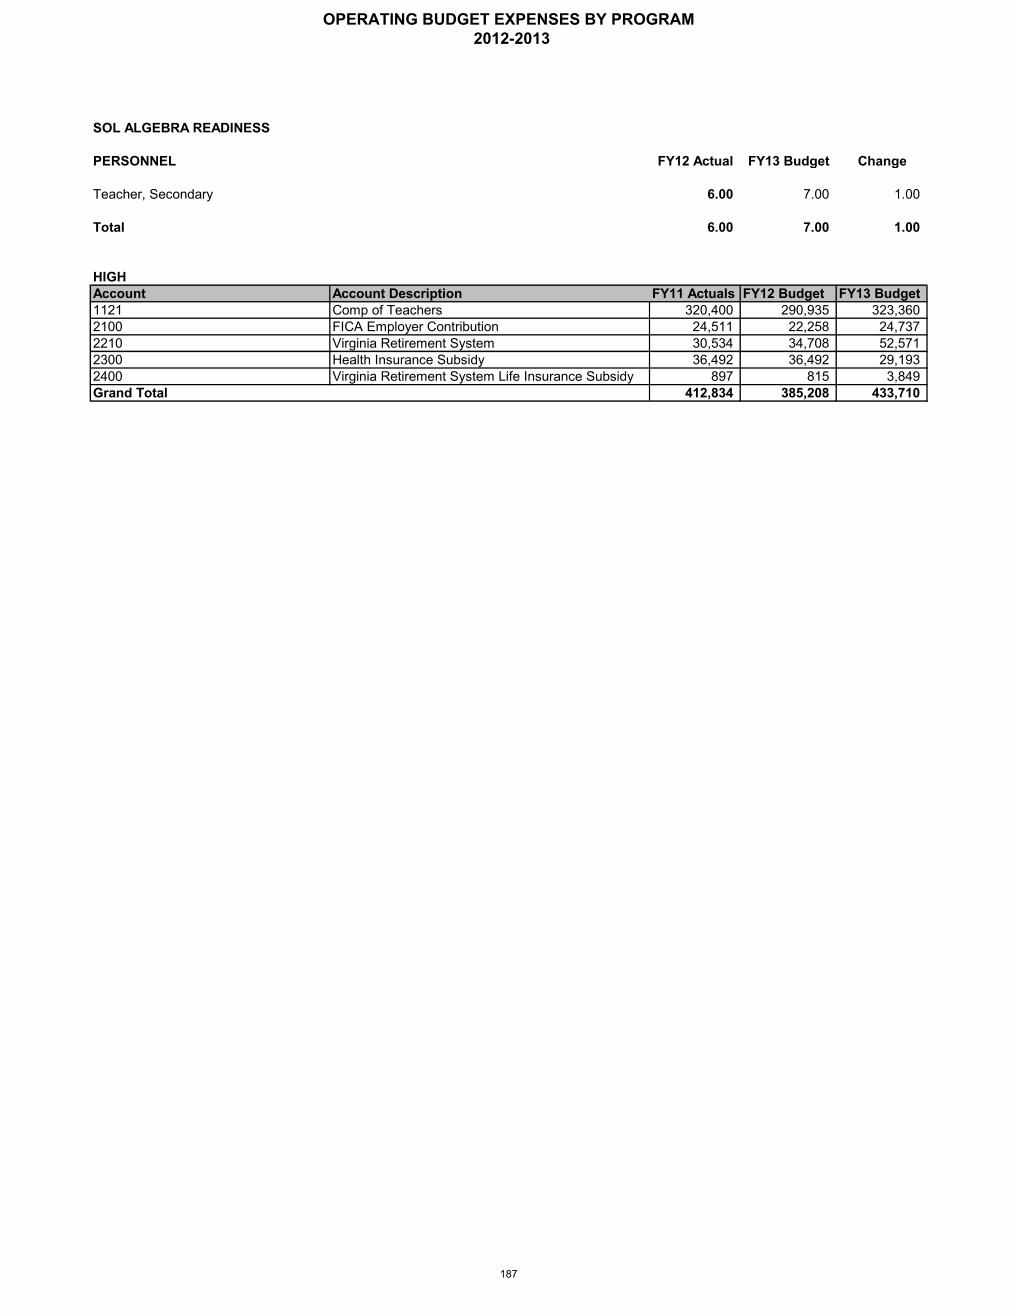
PERSONNEL FY12 Actual FY13 Budget Change
Teacher, Secondary 6.00 7.00 1.00
Total 6.00 7.00 1.00
HIGHAccount Account Description FY11 Actuals FY12 Budget FY13 Budget1121 Comp of Teachers 320,400 290,935 323,3602100 FICA Employer Contribution 24,511 22,258 24,7372210 Virginia Retirement System 30,534 34,708 52,5712300 Health Insurance Subsidy 36,492 36,492 29,1932400 Virginia Retirement System Life Insurance Subsidy 897 815 3,849Grand Total 412,834 385,208 433,710
SOL ALGEBRA READINESS
OPERATING BUDGET EXPENSES BY PROGRAM 2012-2013
187
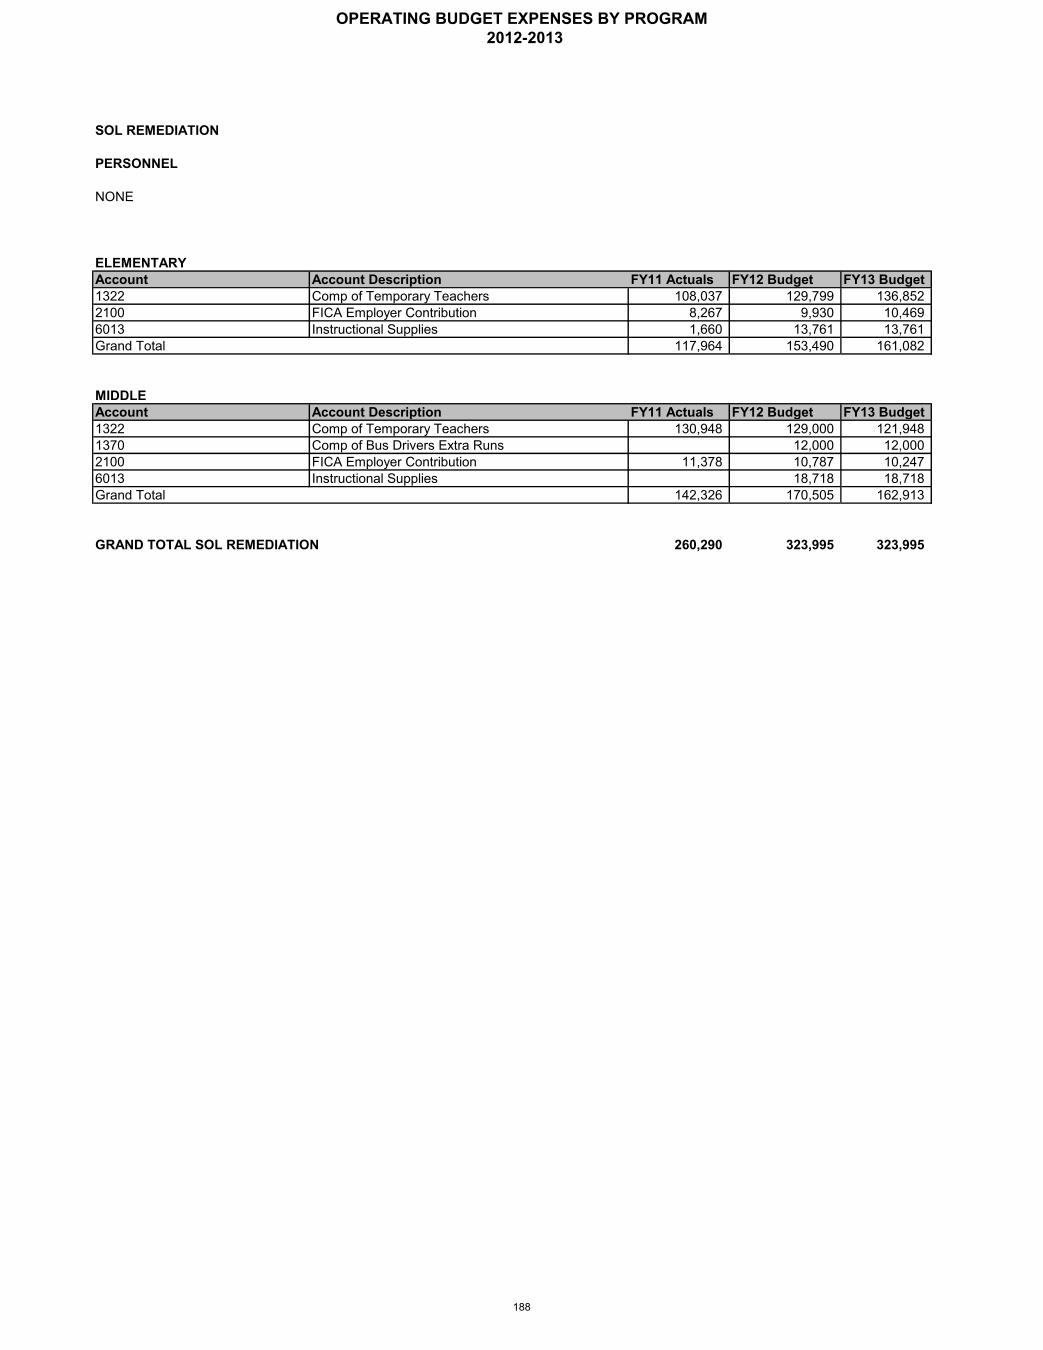
SOL REMEDIATION
PERSONNEL
NONE
ELEMENTARYAccount Account Description FY11 Actuals FY12 Budget FY13 Budget1322 Comp of Temporary Teachers 108,037 129,799 136,8522100 FICA Employer Contribution 8,267 9,930 10,4696013 Instructional Supplies 1,660 13,761 13,761Grand Total 117,964 153,490 161,082
MIDDLEAccount Account Description FY11 Actuals FY12 Budget FY13 Budget1322 Comp of Temporary Teachers 130,948 129,000 121,9481370 Comp of Bus Drivers Extra Runs 12,000 12,0002100 FICA Employer Contribution 11,378 10,787 10,2476013 Instructional Supplies 18,718 18,718Grand Total 142,326 170,505 162,913
GRAND TOTAL SOL REMEDIATION 260,290 323,995 323,995
OPERATING BUDGET EXPENSES BY PROGRAM 2012-2013
188
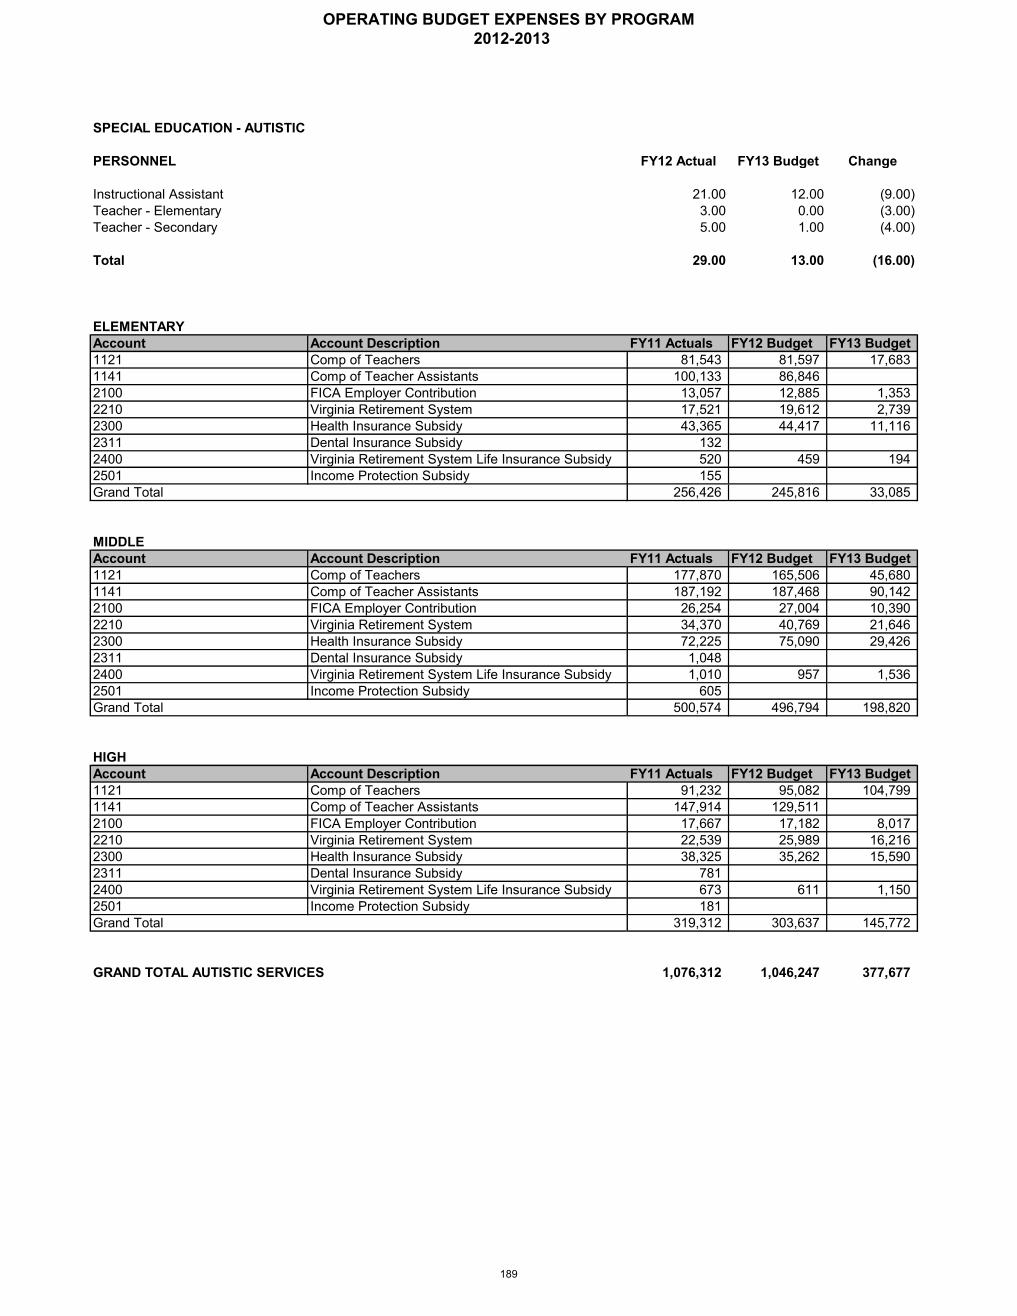
PERSONNEL FY12 Actual FY13 Budget Change
Instructional Assistant 21.00 12.00 (9.00)Teacher - Elementary 3.00 0.00 (3.00)Teacher - Secondary 5.00 1.00 (4.00)
Total 29.00 13.00 (16.00)
ELEMENTARYAccount Account Description FY11 Actuals FY12 Budget FY13 Budget1121 Comp of Teachers 81,543 81,597 17,6831141 Comp of Teacher Assistants 100,133 86,8462100 FICA Employer Contribution 13,057 12,885 1,3532210 Virginia Retirement System 17,521 19,612 2,7392300 Health Insurance Subsidy 43,365 44,417 11,1162311 Dental Insurance Subsidy 1322400 Virginia Retirement System Life Insurance Subsidy 520 459 1942501 Income Protection Subsidy 155Grand Total 256,426 245,816 33,085
MIDDLEAccount Account Description FY11 Actuals FY12 Budget FY13 Budget1121 Comp of Teachers 177,870 165,506 45,6801141 Comp of Teacher Assistants 187,192 187,468 90,1422100 FICA Employer Contribution 26,254 27,004 10,3902210 Virginia Retirement System 34,370 40,769 21,6462300 Health Insurance Subsidy 72,225 75,090 29,4262311 Dental Insurance Subsidy 1,0482400 Virginia Retirement System Life Insurance Subsidy 1,010 957 1,5362501 Income Protection Subsidy 605Grand Total 500,574 496,794 198,820
HIGHAccount Account Description FY11 Actuals FY12 Budget FY13 Budget1121 Comp of Teachers 91,232 95,082 104,7991141 Comp of Teacher Assistants 147,914 129,5112100 FICA Employer Contribution 17,667 17,182 8,0172210 Virginia Retirement System 22,539 25,989 16,2162300 Health Insurance Subsidy 38,325 35,262 15,5902311 Dental Insurance Subsidy 7812400 Virginia Retirement System Life Insurance Subsidy 673 611 1,1502501 Income Protection Subsidy 181Grand Total 319,312 303,637 145,772
1,076,312 1,046,247 377,677
SPECIAL EDUCATION - AUTISTIC
GRAND TOTAL AUTISTIC SERVICES
OPERATING BUDGET EXPENSES BY PROGRAM 2012-2013
189
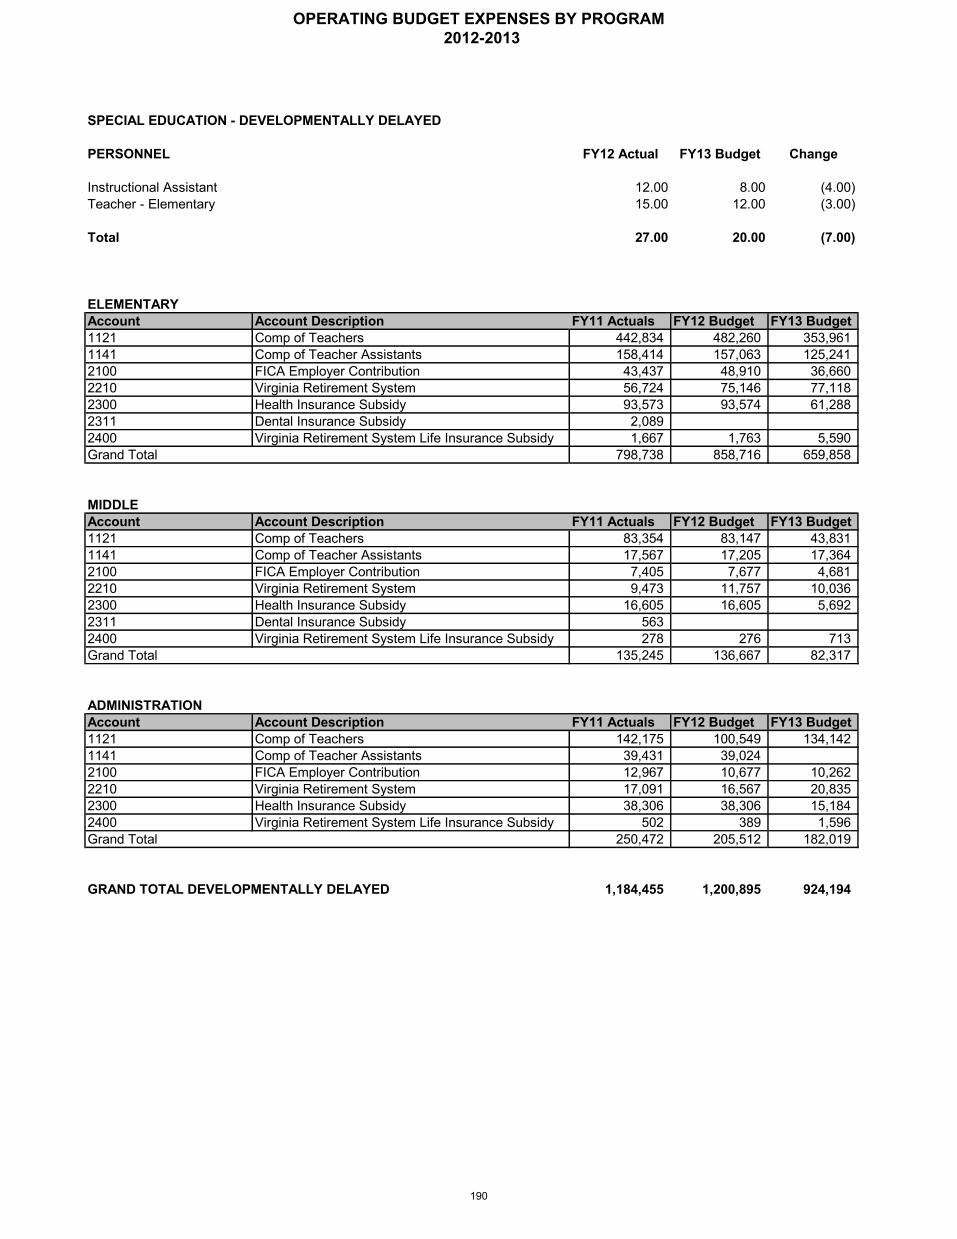
PERSONNEL FY12 Actual FY13 Budget Change
Instructional Assistant 12.00 8.00 (4.00)Teacher - Elementary 15.00 12.00 (3.00)
Total 27.00 20.00 (7.00)
ELEMENTARYAccount Account Description FY11 Actuals FY12 Budget FY13 Budget1121 Comp of Teachers 442,834 482,260 353,9611141 Comp of Teacher Assistants 158,414 157,063 125,2412100 FICA Employer Contribution 43,437 48,910 36,6602210 Virginia Retirement System 56,724 75,146 77,1182300 Health Insurance Subsidy 93,573 93,574 61,2882311 Dental Insurance Subsidy 2,0892400 Virginia Retirement System Life Insurance Subsidy 1,667 1,763 5,590Grand Total 798,738 858,716 659,858
MIDDLEAccount Account Description FY11 Actuals FY12 Budget FY13 Budget1121 Comp of Teachers 83,354 83,147 43,8311141 Comp of Teacher Assistants 17,567 17,205 17,3642100 FICA Employer Contribution 7,405 7,677 4,6812210 Virginia Retirement System 9,473 11,757 10,0362300 Health Insurance Subsidy 16,605 16,605 5,6922311 Dental Insurance Subsidy 5632400 Virginia Retirement System Life Insurance Subsidy 278 276 713Grand Total 135,245 136,667 82,317
ADMINISTRATIONAccount Account Description FY11 Actuals FY12 Budget FY13 Budget1121 Comp of Teachers 142,175 100,549 134,1421141 Comp of Teacher Assistants 39,431 39,0242100 FICA Employer Contribution 12,967 10,677 10,2622210 Virginia Retirement System 17,091 16,567 20,8352300 Health Insurance Subsidy 38,306 38,306 15,1842400 Virginia Retirement System Life Insurance Subsidy 502 389 1,596Grand Total 250,472 205,512 182,019
1,184,455 1,200,895 924,194
SPECIAL EDUCATION - DEVELOPMENTALLY DELAYED
GRAND TOTAL DEVELOPMENTALLY DELAYED
OPERATING BUDGET EXPENSES BY PROGRAM 2012-2013
190
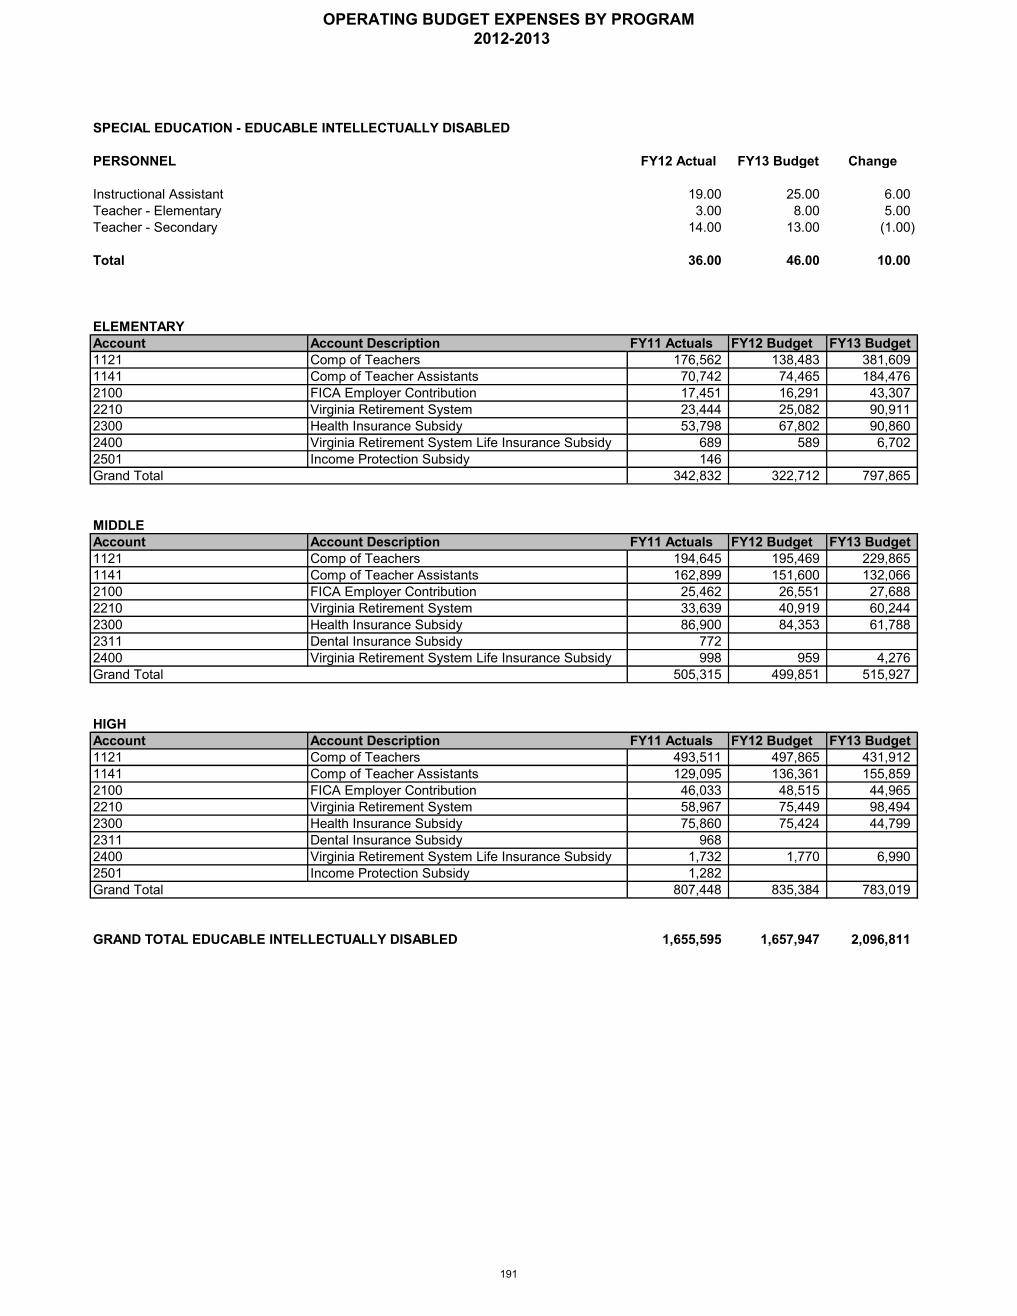
PERSONNEL FY12 Actual FY13 Budget Change
Instructional Assistant 19.00 25.00 6.00Teacher - Elementary 3.00 8.00 5.00Teacher - Secondary 14.00 13.00 (1.00)
Total 36.00 46.00 10.00
ELEMENTARYAccount Account Description FY11 Actuals FY12 Budget FY13 Budget1121 Comp of Teachers 176,562 138,483 381,6091141 Comp of Teacher Assistants 70,742 74,465 184,4762100 FICA Employer Contribution 17,451 16,291 43,3072210 Virginia Retirement System 23,444 25,082 90,9112300 Health Insurance Subsidy 53,798 67,802 90,8602400 Virginia Retirement System Life Insurance Subsidy 689 589 6,7022501 Income Protection Subsidy 146Grand Total 342,832 322,712 797,865
MIDDLEAccount Account Description FY11 Actuals FY12 Budget FY13 Budget1121 Comp of Teachers 194,645 195,469 229,8651141 Comp of Teacher Assistants 162,899 151,600 132,0662100 FICA Employer Contribution 25,462 26,551 27,6882210 Virginia Retirement System 33,639 40,919 60,2442300 Health Insurance Subsidy 86,900 84,353 61,7882311 Dental Insurance Subsidy 7722400 Virginia Retirement System Life Insurance Subsidy 998 959 4,276Grand Total 505,315 499,851 515,927
HIGHAccount Account Description FY11 Actuals FY12 Budget FY13 Budget1121 Comp of Teachers 493,511 497,865 431,9121141 Comp of Teacher Assistants 129,095 136,361 155,8592100 FICA Employer Contribution 46,033 48,515 44,9652210 Virginia Retirement System 58,967 75,449 98,4942300 Health Insurance Subsidy 75,860 75,424 44,7992311 Dental Insurance Subsidy 9682400 Virginia Retirement System Life Insurance Subsidy 1,732 1,770 6,9902501 Income Protection Subsidy 1,282Grand Total 807,448 835,384 783,019
1,655,595 1,657,947 2,096,811
SPECIAL EDUCATION - EDUCABLE INTELLECTUALLY DISABLED
GRAND TOTAL EDUCABLE INTELLECTUALLY DISABLED
OPERATING BUDGET EXPENSES BY PROGRAM 2012-2013
191

PERSONNEL FY12 Actual FY13 Budget Change
Educational Interpreter 8.00 8.00 0.00Hearing Impairment Specialist 3.00 3.00 0.00Instructional Assistant 1.00 1.00 0.00
Total 12.00 12.00 0.00
MIDDLEAccount Account Description FY11 Actuals FY12 Budget FY13 Budget1139 Comp of Other Professional Personnel 7,394 323,4082100 FICA Employer Contribution 567 24,7402210 Virginia Retirement System 700 38,5822300 Health Insurance Subsidy 10,5162311 Dental Insurance Subsidy 782400 Virginia Retirement System Life Insurance Subsidy 21 906Grand Total 8,760 398,152
HIGHAccount Account Description FY11 Actuals FY12 Budget FY13 Budget1139 Comp of Other Professional Personnel 22,637 211,8981141 Comp of Teacher Assistants 22,742 22,9532100 FICA Employer Contribution 1,732 17,951 1,7562210 Virginia Retirement System 2,105 25,220 3,6232300 Health Insurance Subsidy 5,2582400 Virginia Retirement System Life Insurance Subsidy 62 653 2572501 Income Protection Subsidy 193Grand Total 26,729 283,722 28,589
ADMINISTRATIONAccount Account Description FY11 Actuals FY12 Budget FY13 Budget1139 Comp of Other Professional Personnel 453,796 533,6782100 FICA Employer Contribution 33,115 40,8262210 Virginia Retirement System 40,858 87,2662300 Health Insurance Subsidy 78,472 62,6872400 Virginia Retirement System Life Insurance Subsidy 1,254 6,342Grand Total 607,495 0 730,799
642,984 681,874 759,388
SPECIAL EDUCATION - HARD OF HEARING
GRAND TOTAL HARD OF HEARING
OPERATING BUDGET EXPENSES BY PROGRAM 2012-2013
192
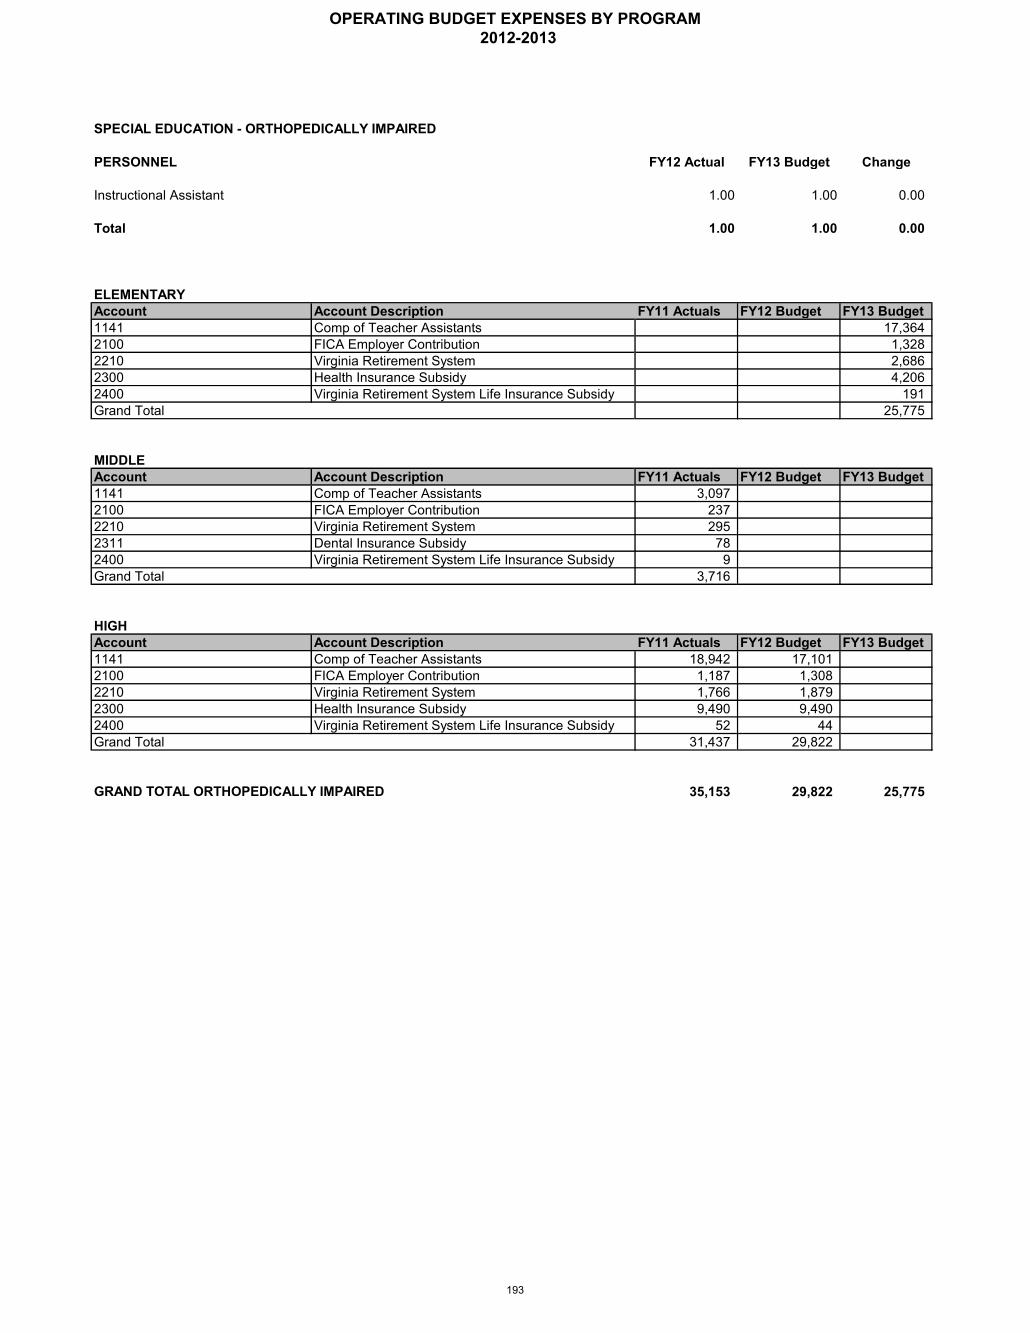
PERSONNEL FY12 Actual FY13 Budget Change
Instructional Assistant 1.00 1.00 0.00
Total 1.00 1.00 0.00
ELEMENTARYAccount Account Description FY11 Actuals FY12 Budget FY13 Budget1141 Comp of Teacher Assistants 17,3642100 FICA Employer Contribution 1,3282210 Virginia Retirement System 2,6862300 Health Insurance Subsidy 4,2062400 Virginia Retirement System Life Insurance Subsidy 191Grand Total 25,775
MIDDLEAccount Account Description FY11 Actuals FY12 Budget FY13 Budget1141 Comp of Teacher Assistants 3,0972100 FICA Employer Contribution 2372210 Virginia Retirement System 2952311 Dental Insurance Subsidy 782400 Virginia Retirement System Life Insurance Subsidy 9Grand Total 3,716
HIGHAccount Account Description FY11 Actuals FY12 Budget FY13 Budget1141 Comp of Teacher Assistants 18,942 17,1012100 FICA Employer Contribution 1,187 1,3082210 Virginia Retirement System 1,766 1,8792300 Health Insurance Subsidy 9,490 9,4902400 Virginia Retirement System Life Insurance Subsidy 52 44Grand Total 31,437 29,822
35,153 29,822 25,775
SPECIAL EDUCATION - ORTHOPEDICALLY IMPAIRED
GRAND TOTAL ORTHOPEDICALLY IMPAIRED
OPERATING BUDGET EXPENSES BY PROGRAM 2012-2013
193
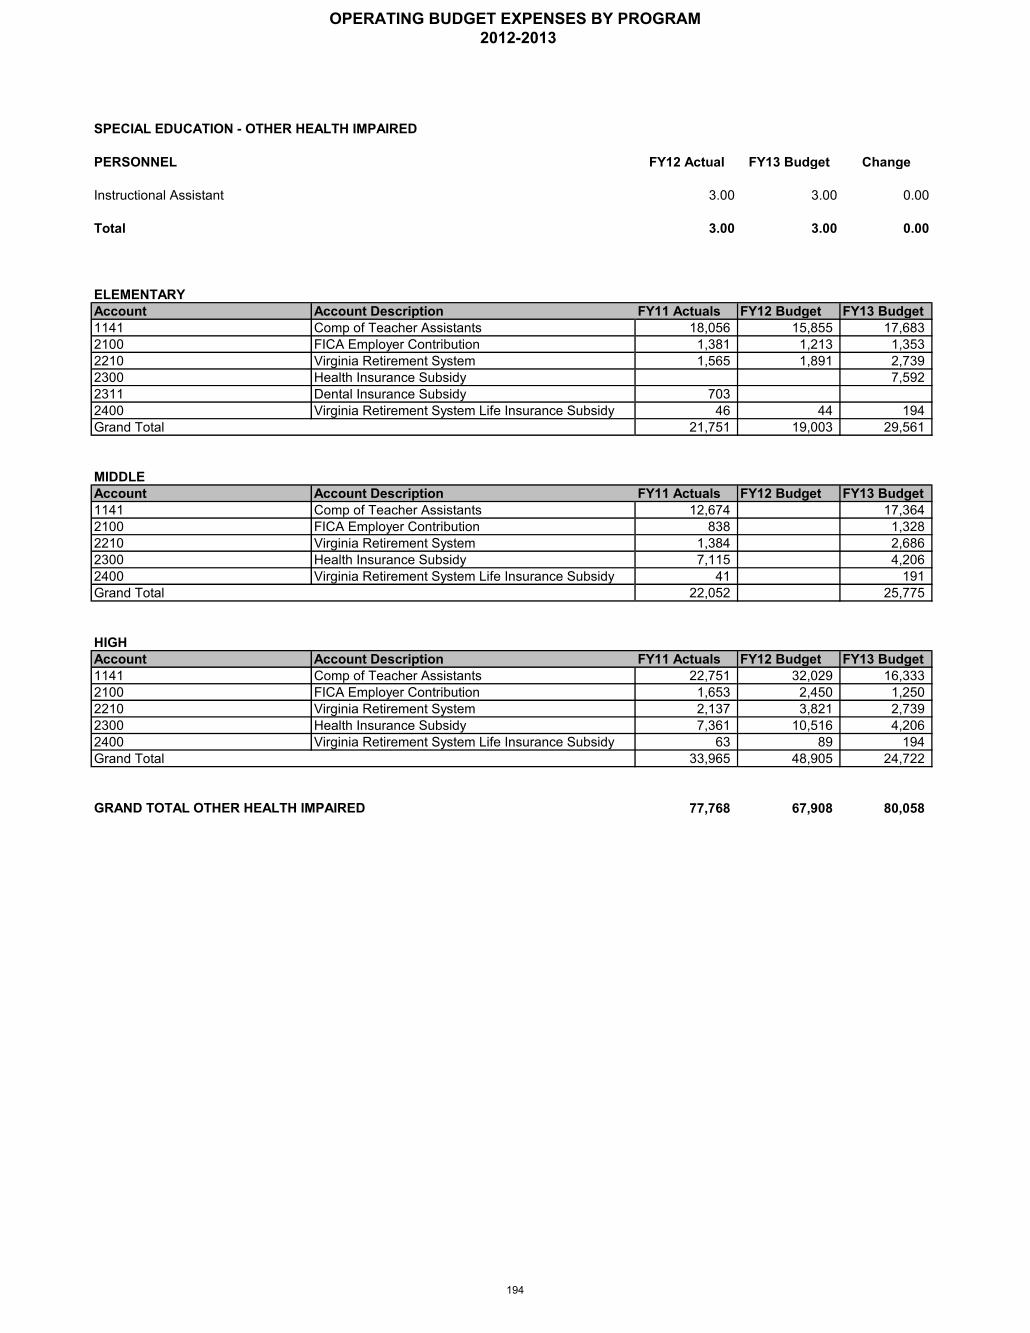
PERSONNEL FY12 Actual FY13 Budget Change
Instructional Assistant 3.00 3.00 0.00
Total 3.00 3.00 0.00
ELEMENTARYAccount Account Description FY11 Actuals FY12 Budget FY13 Budget1141 Comp of Teacher Assistants 18,056 15,855 17,6832100 FICA Employer Contribution 1,381 1,213 1,3532210 Virginia Retirement System 1,565 1,891 2,7392300 Health Insurance Subsidy 7,5922311 Dental Insurance Subsidy 7032400 Virginia Retirement System Life Insurance Subsidy 46 44 194Grand Total 21,751 19,003 29,561
MIDDLEAccount Account Description FY11 Actuals FY12 Budget FY13 Budget1141 Comp of Teacher Assistants 12,674 17,364 2100 FICA Employer Contribution 838 1,328 2210 Virginia Retirement System 1,384 2,686 2300 Health Insurance Subsidy 7,115 4,206 2400 Virginia Retirement System Life Insurance Subsidy 41 191 Grand Total 22,052 25,775
HIGHAccount Account Description FY11 Actuals FY12 Budget FY13 Budget1141 Comp of Teacher Assistants 22,751 32,029 16,3332100 FICA Employer Contribution 1,653 2,450 1,2502210 Virginia Retirement System 2,137 3,821 2,7392300 Health Insurance Subsidy 7,361 10,516 4,2062400 Virginia Retirement System Life Insurance Subsidy 63 89 194Grand Total 33,965 48,905 24,722
77,768 67,908 80,058
SPECIAL EDUCATION - OTHER HEALTH IMPAIRED
GRAND TOTAL OTHER HEALTH IMPAIRED
OPERATING BUDGET EXPENSES BY PROGRAM 2012-2013
194
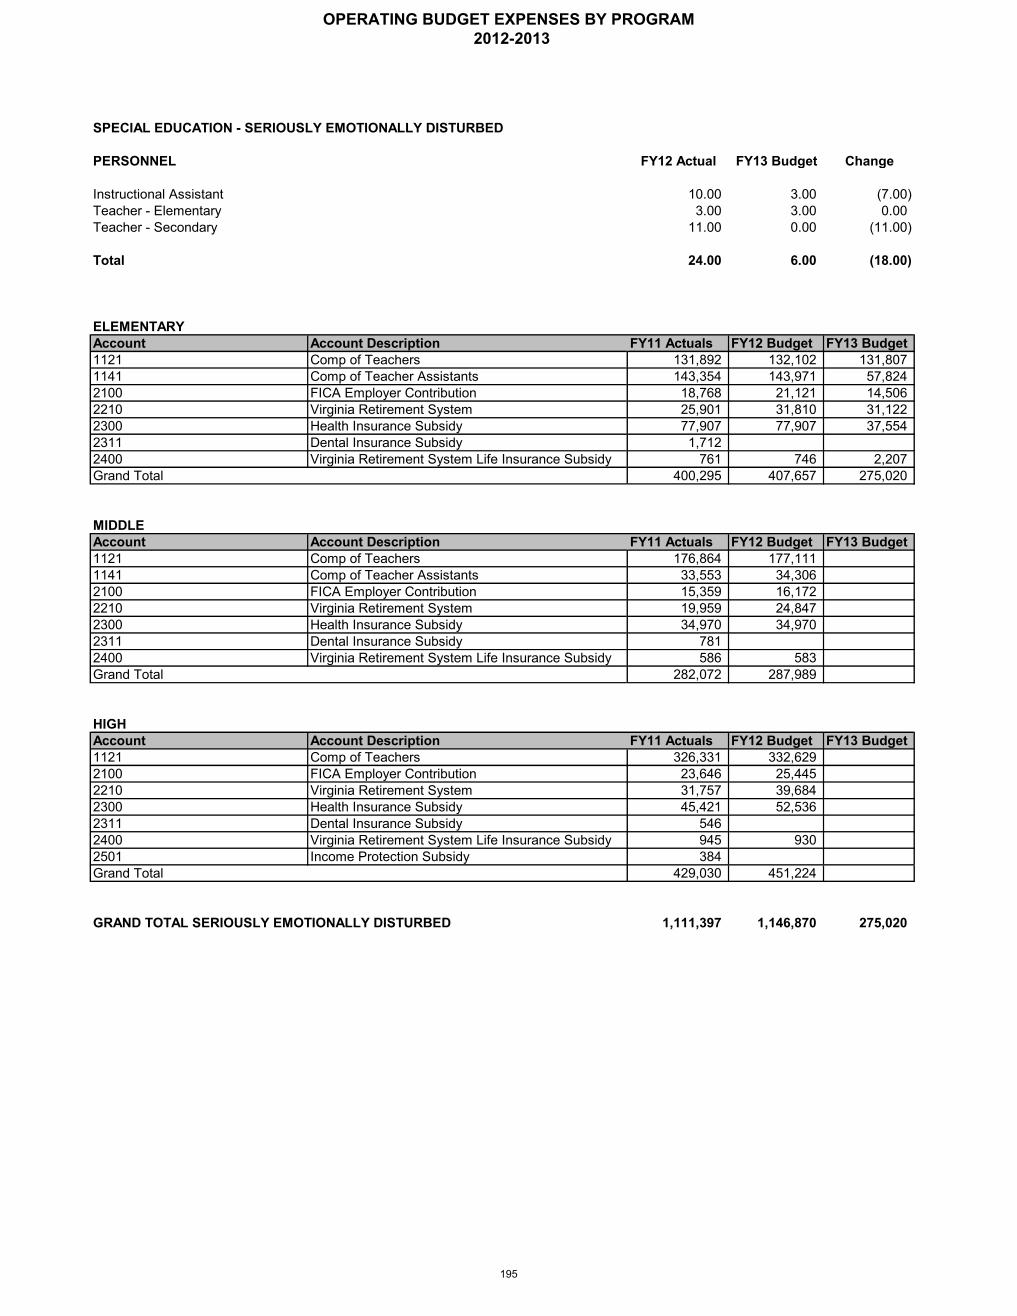
PERSONNEL FY12 Actual FY13 Budget Change
Instructional Assistant 10.00 3.00 (7.00)Teacher - Elementary 3.00 3.00 0.00Teacher - Secondary 11.00 0.00 (11.00)
Total 24.00 6.00 (18.00)
ELEMENTARYAccount Account Description FY11 Actuals FY12 Budget FY13 Budget1121 Comp of Teachers 131,892 132,102 131,8071141 Comp of Teacher Assistants 143,354 143,971 57,8242100 FICA Employer Contribution 18,768 21,121 14,5062210 Virginia Retirement System 25,901 31,810 31,1222300 Health Insurance Subsidy 77,907 77,907 37,5542311 Dental Insurance Subsidy 1,7122400 Virginia Retirement System Life Insurance Subsidy 761 746 2,207Grand Total 400,295 407,657 275,020
MIDDLEAccount Account Description FY11 Actuals FY12 Budget FY13 Budget1121 Comp of Teachers 176,864 177,1111141 Comp of Teacher Assistants 33,553 34,3062100 FICA Employer Contribution 15,359 16,1722210 Virginia Retirement System 19,959 24,8472300 Health Insurance Subsidy 34,970 34,9702311 Dental Insurance Subsidy 7812400 Virginia Retirement System Life Insurance Subsidy 586 583Grand Total 282,072 287,989
HIGHAccount Account Description FY11 Actuals FY12 Budget FY13 Budget1121 Comp of Teachers 326,331 332,6292100 FICA Employer Contribution 23,646 25,4452210 Virginia Retirement System 31,757 39,6842300 Health Insurance Subsidy 45,421 52,5362311 Dental Insurance Subsidy 5462400 Virginia Retirement System Life Insurance Subsidy 945 9302501 Income Protection Subsidy 384Grand Total 429,030 451,224
1,111,397 1,146,870 275,020
SPECIAL EDUCATION - SERIOUSLY EMOTIONALLY DISTURBED
GRAND TOTAL SERIOUSLY EMOTIONALLY DISTURBED
OPERATING BUDGET EXPENSES BY PROGRAM 2012-2013
195
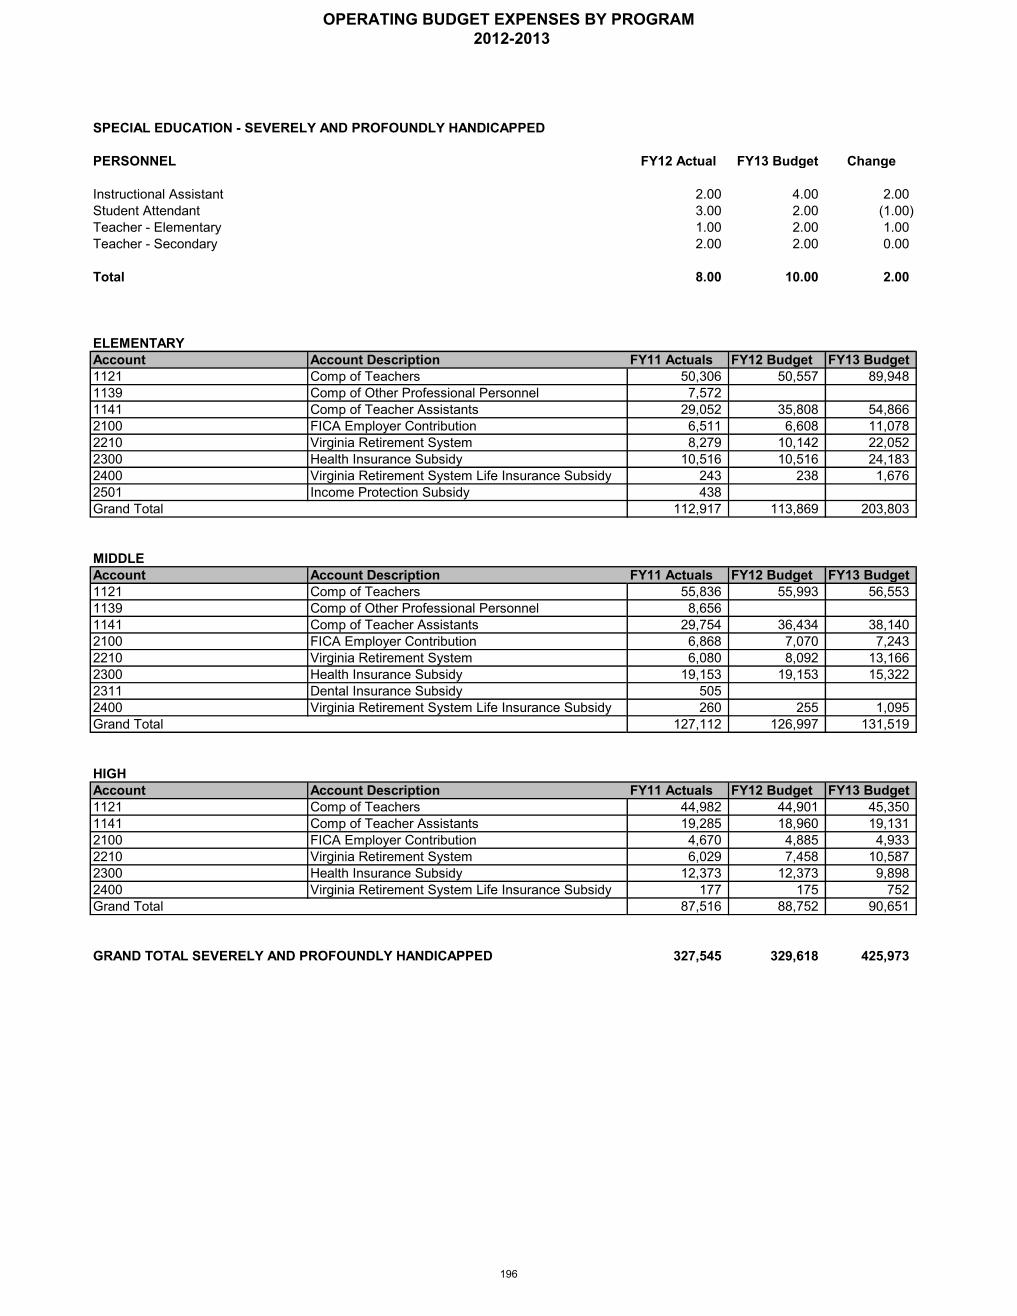
PERSONNEL FY12 Actual FY13 Budget Change
Instructional Assistant 2.00 4.00 2.00Student Attendant 3.00 2.00 (1.00)Teacher - Elementary 1.00 2.00 1.00Teacher - Secondary 2.00 2.00 0.00
Total 8.00 10.00 2.00
ELEMENTARYAccount Account Description FY11 Actuals FY12 Budget FY13 Budget1121 Comp of Teachers 50,306 50,557 89,9481139 Comp of Other Professional Personnel 7,5721141 Comp of Teacher Assistants 29,052 35,808 54,8662100 FICA Employer Contribution 6,511 6,608 11,0782210 Virginia Retirement System 8,279 10,142 22,0522300 Health Insurance Subsidy 10,516 10,516 24,1832400 Virginia Retirement System Life Insurance Subsidy 243 238 1,6762501 Income Protection Subsidy 438Grand Total 112,917 113,869 203,803
MIDDLEAccount Account Description FY11 Actuals FY12 Budget FY13 Budget1121 Comp of Teachers 55,836 55,993 56,5531139 Comp of Other Professional Personnel 8,6561141 Comp of Teacher Assistants 29,754 36,434 38,1402100 FICA Employer Contribution 6,868 7,070 7,2432210 Virginia Retirement System 6,080 8,092 13,1662300 Health Insurance Subsidy 19,153 19,153 15,3222311 Dental Insurance Subsidy 5052400 Virginia Retirement System Life Insurance Subsidy 260 255 1,095Grand Total 127,112 126,997 131,519
HIGHAccount Account Description FY11 Actuals FY12 Budget FY13 Budget1121 Comp of Teachers 44,982 44,901 45,3501141 Comp of Teacher Assistants 19,285 18,960 19,1312100 FICA Employer Contribution 4,670 4,885 4,9332210 Virginia Retirement System 6,029 7,458 10,5872300 Health Insurance Subsidy 12,373 12,373 9,8982400 Virginia Retirement System Life Insurance Subsidy 177 175 752Grand Total 87,516 88,752 90,651
327,545 329,618 425,973
SPECIAL EDUCATION - SEVERELY AND PROFOUNDLY HANDICAPPED
GRAND TOTAL SEVERELY AND PROFOUNDLY HANDICAPPED
OPERATING BUDGET EXPENSES BY PROGRAM 2012-2013
196
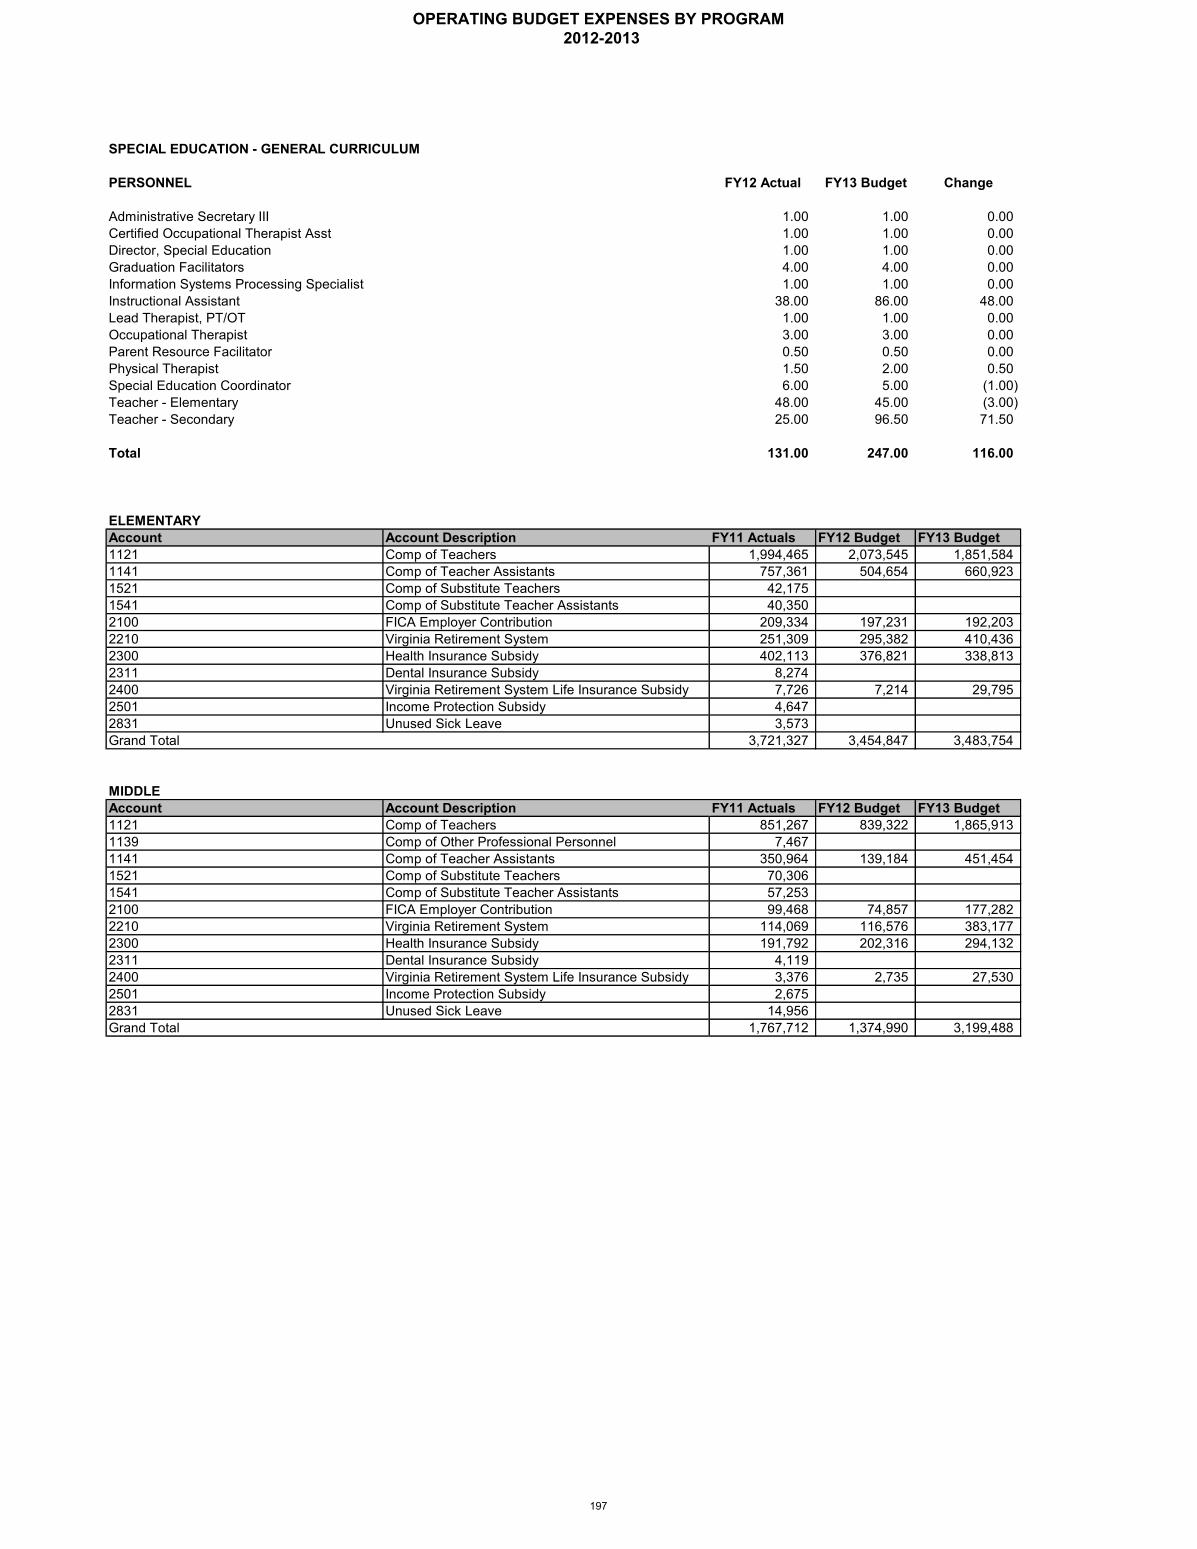
PERSONNEL FY12 Actual FY13 Budget Change
Administrative Secretary III 1.00 1.00 0.00Certified Occupational Therapist Asst 1.00 1.00 0.00Director, Special Education 1.00 1.00 0.00Graduation Facilitators 4.00 4.00 0.00Information Systems Processing Specialist 1.00 1.00 0.00Instructional Assistant 38.00 86.00 48.00Lead Therapist, PT/OT 1.00 1.00 0.00Occupational Therapist 3.00 3.00 0.00Parent Resource Facilitator 0.50 0.50 0.00Physical Therapist 1.50 2.00 0.50Special Education Coordinator 6.00 5.00 (1.00)Teacher - Elementary 48.00 45.00 (3.00)Teacher - Secondary 25.00 96.50 71.50
Total 131.00 247.00 116.00
ELEMENTARYAccount Account Description FY11 Actuals FY12 Budget FY13 Budget1121 Comp of Teachers 1,994,465 2,073,545 1,851,5841141 Comp of Teacher Assistants 757,361 504,654 660,9231521 Comp of Substitute Teachers 42,1751541 Comp of Substitute Teacher Assistants 40,3502100 FICA Employer Contribution 209,334 197,231 192,2032210 Virginia Retirement System 251,309 295,382 410,4362300 Health Insurance Subsidy 402,113 376,821 338,8132311 Dental Insurance Subsidy 8,2742400 Virginia Retirement System Life Insurance Subsidy 7,726 7,214 29,7952501 Income Protection Subsidy 4,6472831 Unused Sick Leave 3,573Grand Total 3,721,327 3,454,847 3,483,754
MIDDLEAccount Account Description FY11 Actuals FY12 Budget FY13 Budget1121 Comp of Teachers 851,267 839,322 1,865,9131139 Comp of Other Professional Personnel 7,4671141 Comp of Teacher Assistants 350,964 139,184 451,4541521 Comp of Substitute Teachers 70,3061541 Comp of Substitute Teacher Assistants 57,2532100 FICA Employer Contribution 99,468 74,857 177,2822210 Virginia Retirement System 114,069 116,576 383,1772300 Health Insurance Subsidy 191,792 202,316 294,1322311 Dental Insurance Subsidy 4,1192400 Virginia Retirement System Life Insurance Subsidy 3,376 2,735 27,5302501 Income Protection Subsidy 2,6752831 Unused Sick Leave 14,956Grand Total 1,767,712 1,374,990 3,199,488
SPECIAL EDUCATION - GENERAL CURRICULUM
OPERATING BUDGET EXPENSES BY PROGRAM 2012-2013
197
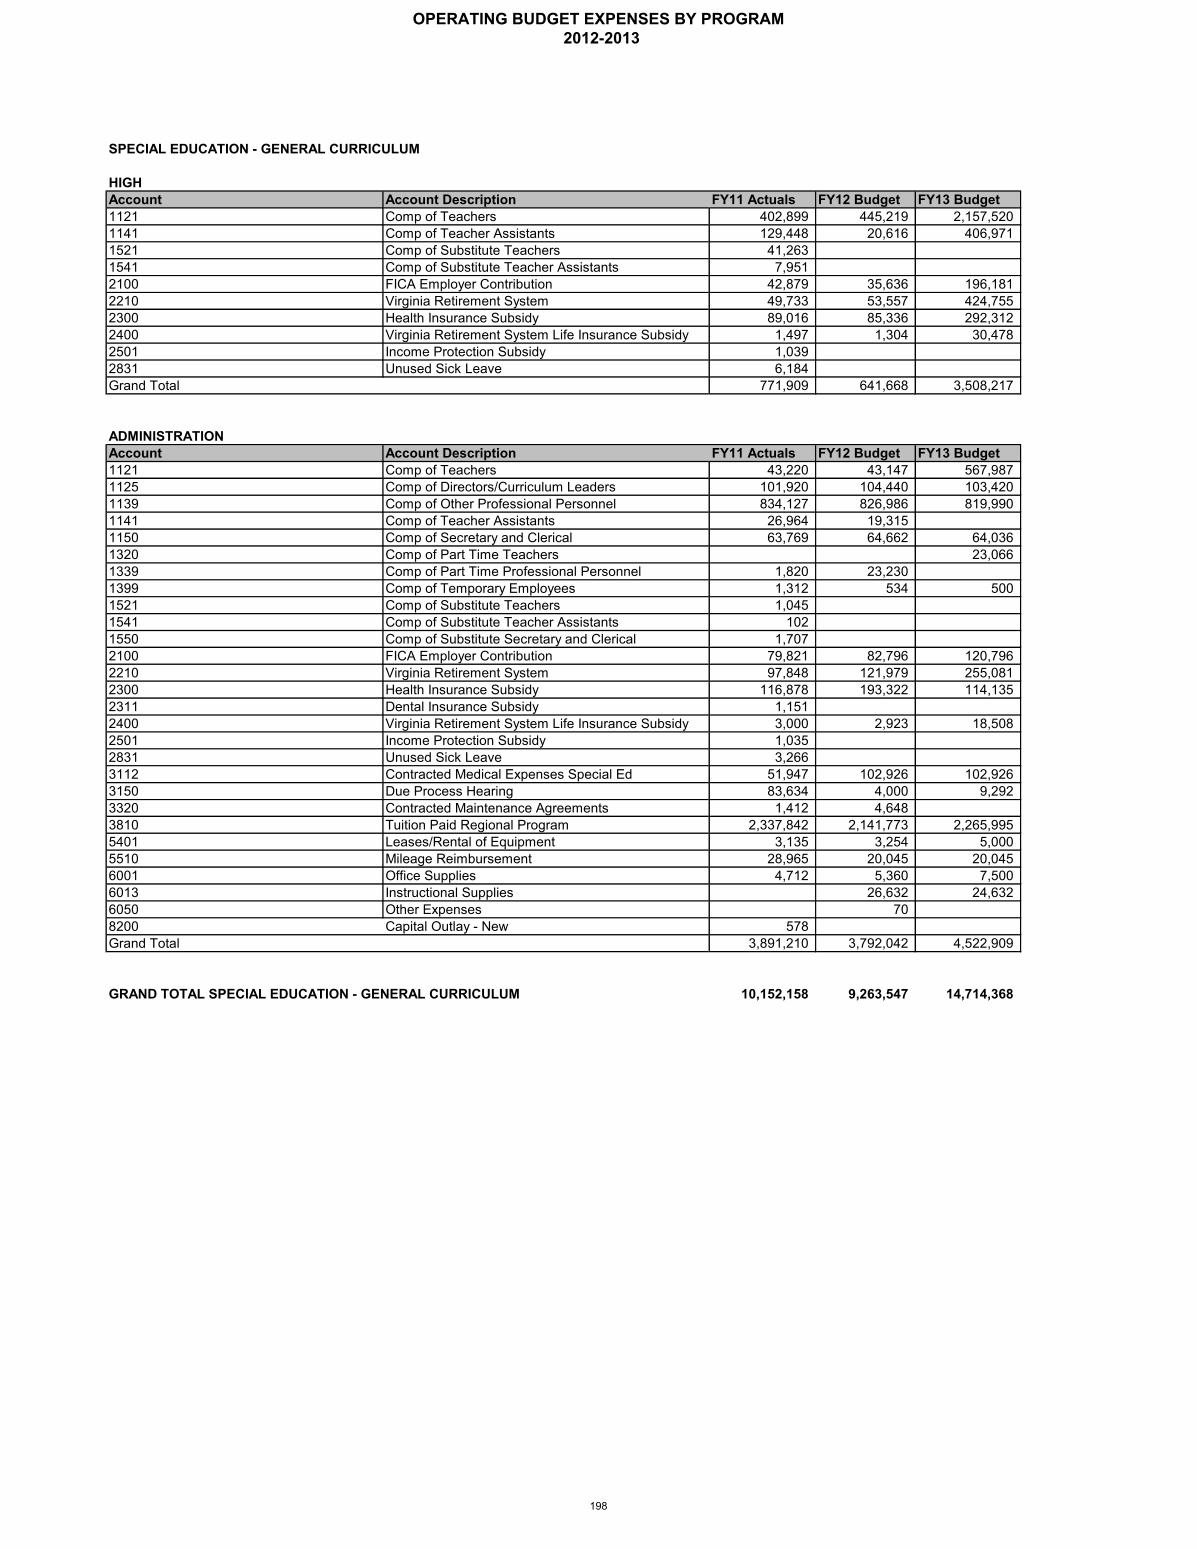
SPECIAL EDUCATION - GENERAL CURRICULUM
HIGHAccount Account Description FY11 Actuals FY12 Budget FY13 Budget1121 Comp of Teachers 402,899 445,219 2,157,5201141 Comp of Teacher Assistants 129,448 20,616 406,9711521 Comp of Substitute Teachers 41,2631541 Comp of Substitute Teacher Assistants 7,9512100 FICA Employer Contribution 42,879 35,636 196,1812210 Virginia Retirement System 49,733 53,557 424,7552300 Health Insurance Subsidy 89,016 85,336 292,3122400 Virginia Retirement System Life Insurance Subsidy 1,497 1,304 30,4782501 Income Protection Subsidy 1,0392831 Unused Sick Leave 6,184Grand Total 771,909 641,668 3,508,217
ADMINISTRATIONAccount Account Description FY11 Actuals FY12 Budget FY13 Budget1121 Comp of Teachers 43,220 43,147 567,9871125 Comp of Directors/Curriculum Leaders 101,920 104,440 103,4201139 Comp of Other Professional Personnel 834,127 826,986 819,9901141 Comp of Teacher Assistants 26,964 19,3151150 Comp of Secretary and Clerical 63,769 64,662 64,0361320 Comp of Part Time Teachers 23,0661339 Comp of Part Time Professional Personnel 1,820 23,2301399 Comp of Temporary Employees 1,312 534 5001521 Comp of Substitute Teachers 1,0451541 Comp of Substitute Teacher Assistants 1021550 Comp of Substitute Secretary and Clerical 1,7072100 FICA Employer Contribution 79,821 82,796 120,7962210 Virginia Retirement System 97,848 121,979 255,0812300 Health Insurance Subsidy 116,878 193,322 114,1352311 Dental Insurance Subsidy 1,1512400 Virginia Retirement System Life Insurance Subsidy 3,000 2,923 18,5082501 Income Protection Subsidy 1,0352831 Unused Sick Leave 3,2663112 Contracted Medical Expenses Special Ed 51,947 102,926 102,9263150 Due Process Hearing 83,634 4,000 9,2923320 Contracted Maintenance Agreements 1,412 4,6483810 Tuition Paid Regional Program 2,337,842 2,141,773 2,265,9955401 Leases/Rental of Equipment 3,135 3,254 5,0005510 Mileage Reimbursement 28,965 20,045 20,0456001 Office Supplies 4,712 5,360 7,5006013 Instructional Supplies 26,632 24,6326050 Other Expenses 708200 Capital Outlay - New 578Grand Total 3,891,210 3,792,042 4,522,909
GRAND TOTAL SPECIAL EDUCATION - GENERAL CURRICULUM 10,152,158 9,263,547 14,714,368
OPERATING BUDGET EXPENSES BY PROGRAM 2012-2013
198

PERSONNEL FY12 Actual FY13 Budget Change
Instructional Assistant 38.00 0.00 (38.00)Instructional Leader 6.00 6.00 0.00Teacher - Secondary 56.00 0.00 (56.00)
Total 100.00 6.00 (94.00)
ELEMENTARYAccount Account Description FY11 Actuals FY12 Budget FY13 Budget1121 Comp of Teachers 37,7971141 Comp of Teacher Assistants 29,795 23,7582100 FICA Employer Contribution 4,941 1,8172210 Virginia Retirement System 5,711 2,6732300 Health Insurance Subsidy 10,478 24,4112311 Dental Insurance Subsidy 1512400 Virginia Retirement System Life Insurance Subsidy 185 632501 Income Protection Subsidy 198Grand Total 89,256 52,722
MIDDLEAccount Account Description FY11 Actuals FY12 Budget FY13 Budget1121 Comp of Teachers 1,224,315 1,207,559 85,6541141 Comp of Teacher Assistants 335,221 351,1292100 FICA Employer Contribution 113,895 119,236 6,5532210 Virginia Retirement System 149,266 185,582 14,3642300 Health Insurance Subsidy 290,883 292,036 11,7982311 Dental Insurance Subsidy 3,3822400 Virginia Retirement System Life Insurance Subsidy 4,450 4,353 1,0192501 Income Protection Subsidy 571Grand Total 2,121,983 2,159,895 119,388
HIGHAccount Account Description FY11 Actuals FY12 Budget FY13 Budget1121 Comp of Teachers 1,665,015 1,628,809 193,9021141 Comp of Teacher Assistants 319,653 312,0252100 FICA Employer Contribution 145,923 148,473 14,8332210 Virginia Retirement System 188,890 229,510 32,5172300 Health Insurance Subsidy 301,997 309,138 18,3102311 Dental Insurance Subsidy 2,3932400 Virginia Retirement System Life Insurance Subsidy 5,616 5,425 2,3072501 Income Protection Subsidy 2,533Grand Total 2,632,020 2,633,380 261,869
4,843,259 4,845,997 381,257
SPECIAL EDUCATION - SPECIFIC LEARNING DISABILITY
GRAND TOTAL SPECIFIC LEARNING DISABILITY
OPERATING BUDGET EXPENSES BY PROGRAM 2012-2013
199
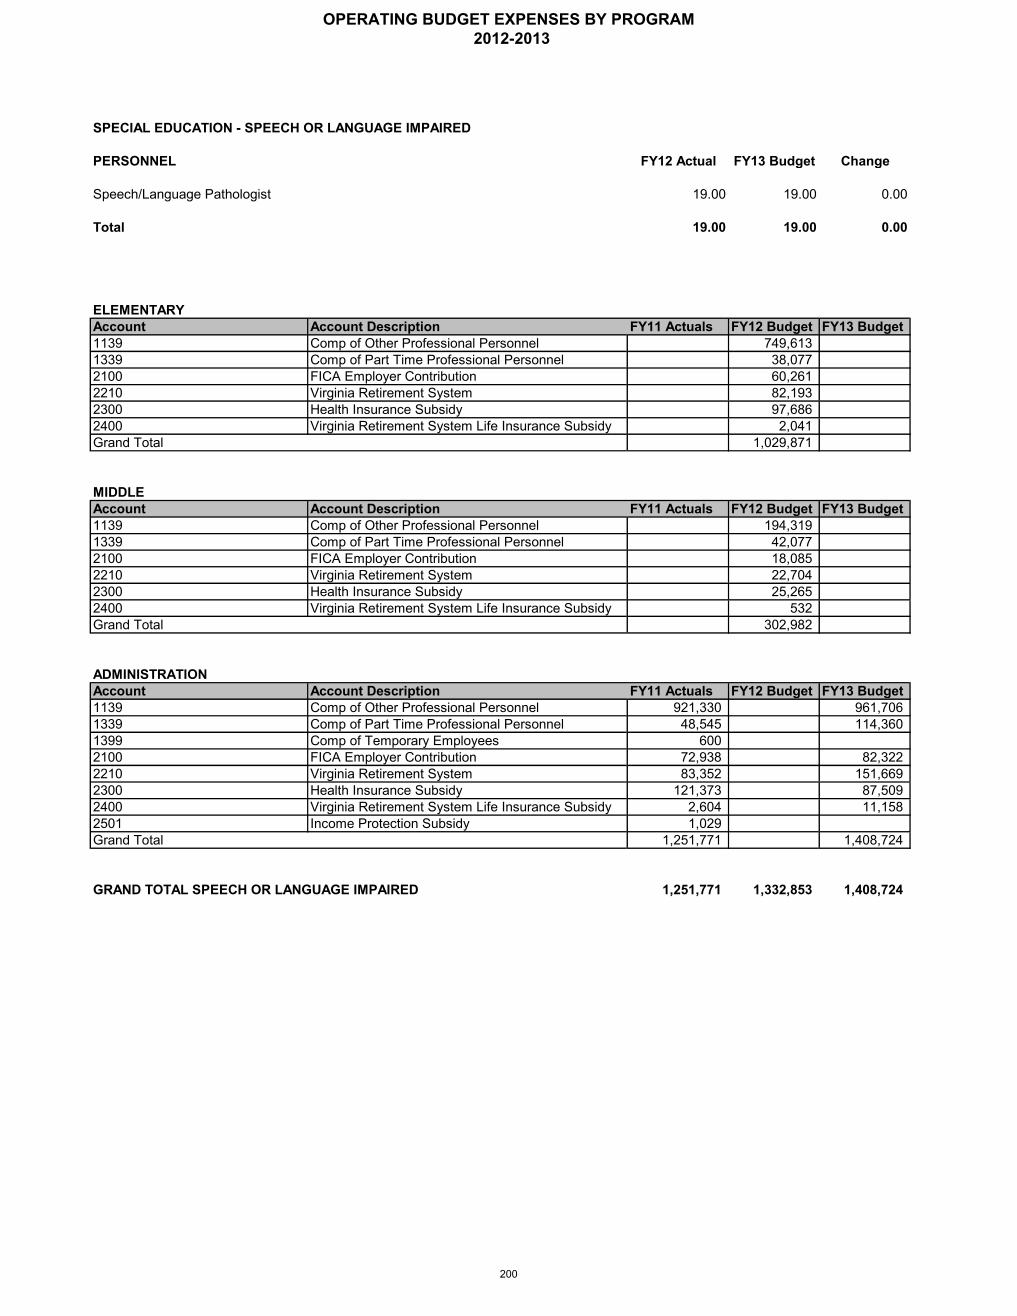
PERSONNEL FY12 Actual FY13 Budget Change
Speech/Language Pathologist 19.00 19.00 0.00
Total 19.00 19.00 0.00
ELEMENTARYAccount Account Description FY11 Actuals FY12 Budget FY13 Budget1139 Comp of Other Professional Personnel 749,6131339 Comp of Part Time Professional Personnel 38,0772100 FICA Employer Contribution 60,2612210 Virginia Retirement System 82,1932300 Health Insurance Subsidy 97,6862400 Virginia Retirement System Life Insurance Subsidy 2,041Grand Total 1,029,871
MIDDLEAccount Account Description FY11 Actuals FY12 Budget FY13 Budget1139 Comp of Other Professional Personnel 194,3191339 Comp of Part Time Professional Personnel 42,0772100 FICA Employer Contribution 18,0852210 Virginia Retirement System 22,7042300 Health Insurance Subsidy 25,2652400 Virginia Retirement System Life Insurance Subsidy 532Grand Total 302,982
ADMINISTRATIONAccount Account Description FY11 Actuals FY12 Budget FY13 Budget1139 Comp of Other Professional Personnel 921,330 961,7061339 Comp of Part Time Professional Personnel 48,545 114,3601399 Comp of Temporary Employees 6002100 FICA Employer Contribution 72,938 82,3222210 Virginia Retirement System 83,352 151,6692300 Health Insurance Subsidy 121,373 87,5092400 Virginia Retirement System Life Insurance Subsidy 2,604 11,1582501 Income Protection Subsidy 1,029Grand Total 1,251,771 1,408,724
1,251,771 1,332,853 1,408,724
SPECIAL EDUCATION - SPEECH OR LANGUAGE IMPAIRED
GRAND TOTAL SPEECH OR LANGUAGE IMPAIRED
OPERATING BUDGET EXPENSES BY PROGRAM 2012-2013
200
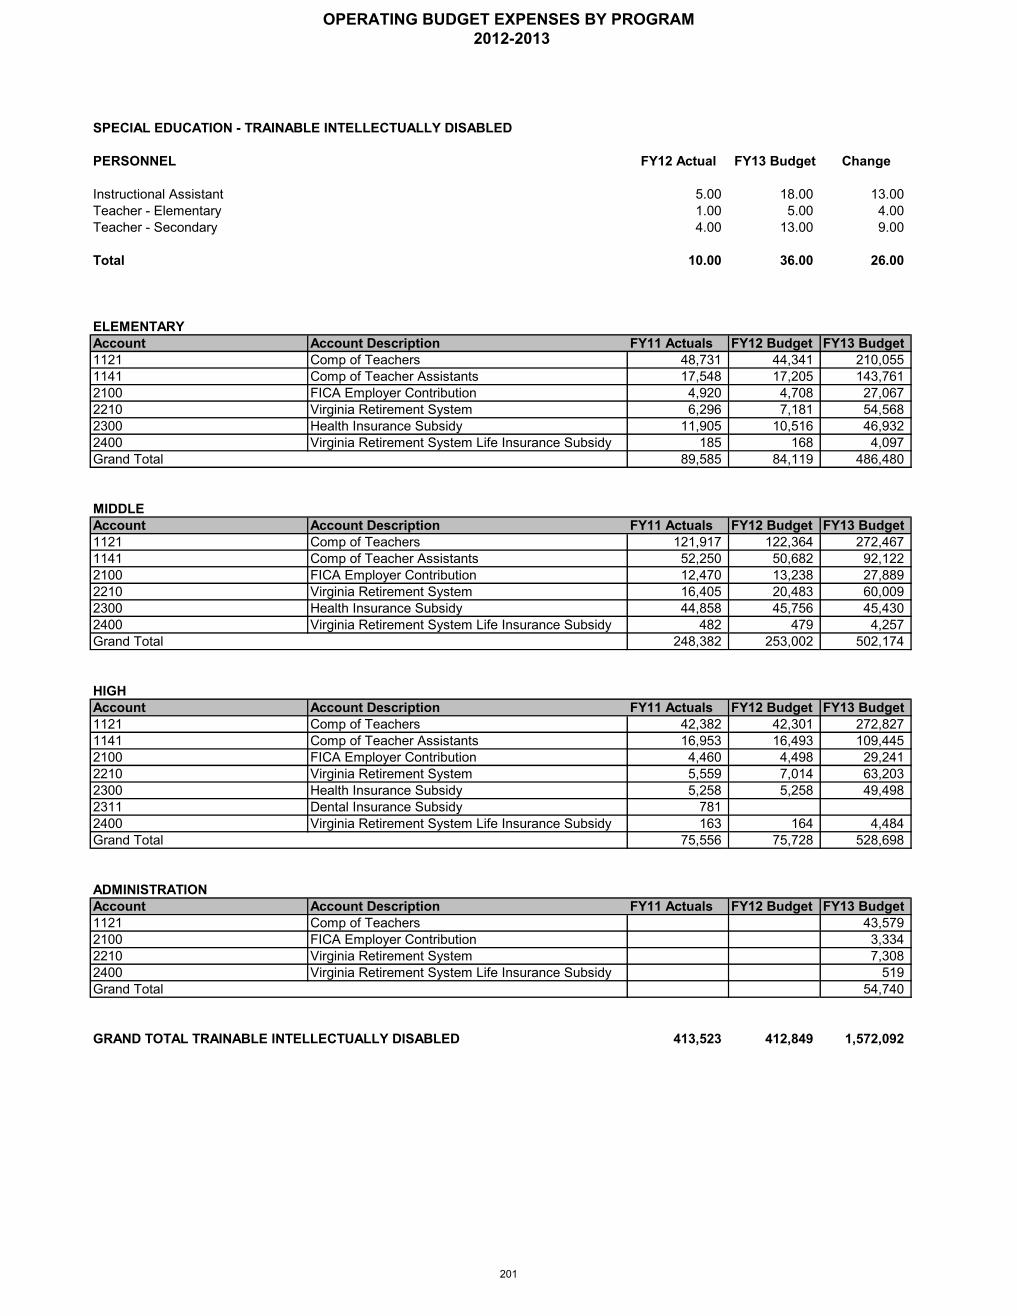
PERSONNEL FY12 Actual FY13 Budget Change
Instructional Assistant 5.00 18.00 13.00Teacher - Elementary 1.00 5.00 4.00Teacher - Secondary 4.00 13.00 9.00
Total 10.00 36.00 26.00
ELEMENTARYAccount Account Description FY11 Actuals FY12 Budget FY13 Budget1121 Comp of Teachers 48,731 44,341 210,0551141 Comp of Teacher Assistants 17,548 17,205 143,7612100 FICA Employer Contribution 4,920 4,708 27,0672210 Virginia Retirement System 6,296 7,181 54,5682300 Health Insurance Subsidy 11,905 10,516 46,9322400 Virginia Retirement System Life Insurance Subsidy 185 168 4,097Grand Total 89,585 84,119 486,480
MIDDLEAccount Account Description FY11 Actuals FY12 Budget FY13 Budget1121 Comp of Teachers 121,917 122,364 272,4671141 Comp of Teacher Assistants 52,250 50,682 92,1222100 FICA Employer Contribution 12,470 13,238 27,8892210 Virginia Retirement System 16,405 20,483 60,0092300 Health Insurance Subsidy 44,858 45,756 45,4302400 Virginia Retirement System Life Insurance Subsidy 482 479 4,257Grand Total 248,382 253,002 502,174
HIGHAccount Account Description FY11 Actuals FY12 Budget FY13 Budget1121 Comp of Teachers 42,382 42,301 272,8271141 Comp of Teacher Assistants 16,953 16,493 109,4452100 FICA Employer Contribution 4,460 4,498 29,2412210 Virginia Retirement System 5,559 7,014 63,2032300 Health Insurance Subsidy 5,258 5,258 49,4982311 Dental Insurance Subsidy 7812400 Virginia Retirement System Life Insurance Subsidy 163 164 4,484Grand Total 75,556 75,728 528,698
ADMINISTRATIONAccount Account Description FY11 Actuals FY12 Budget FY13 Budget1121 Comp of Teachers 43,5792100 FICA Employer Contribution 3,3342210 Virginia Retirement System 7,3082400 Virginia Retirement System Life Insurance Subsidy 519Grand Total 54,740
413,523 412,849 1,572,092
SPECIAL EDUCATION - TRAINABLE INTELLECTUALLY DISABLED
GRAND TOTAL TRAINABLE INTELLECTUALLY DISABLED
OPERATING BUDGET EXPENSES BY PROGRAM 2012-2013
201

PERSONNEL FY12 Actual FY13 Budget Change
Instructional Assistant 1.00 0.00 (1.00)Orientation and Mobility Specialist 1.00 1.00 0.00Visual Impairment Specialist 1.00 1.00 0.00
Total 3.00 2.00 (1.00)
Account Account Description FY11 Actuals FY12 Budget FY13 Budget1141 Comp of Teacher Assistants 15,528 16,7632100 FICA Employer Contribution 1,071 1,2822210 Virginia Retirement System 1,448 2,0002300 Health Insurance Subsidy 6,929 7,1152400 Virginia Retirement System Life Insurance Subsidy 43 47Grand Total 25,019 27,207
ADMINISTRATIONAccount Account Description FY11 Actuals FY12 Budget FY13 Budget1139 Comp of Other Professional Personnel 182,635 129,555 130,8502100 FICA Employer Contribution 13,559 9,911 10,0102210 Virginia Retirement System 17,254 15,456 21,9432300 Health Insurance Subsidy 16,596 17,339 4,2062400 Virginia Retirement System Life Insurance Subsidy 507 362 1,5572501 Income Protection Subsidy 527Grand Total 231,078 172,623 168,566
256,097 199,830 168,566
SPECIAL EDUCATION - VISUALLY HANDICAPPED
GRAND TOTAL VISUALLY HANDICAPPED
OPERATING BUDGET EXPENSES BY PROGRAM 2012-2013
202

STUDENT SERVICES
PERSONNEL FY12 Actual FY13 Budget Change
Administrative Secretary III 1.00 1.00 0.00Behavior Specialist 1.00 1.00 0.00Director, Student Services 1.00 1.00 0.00Graduation Specialist 2.00 0.00 (2.00)School Court Liaison 1.00 1.00 0.00
Total 6.00 4.00 (2.00)
MIDDLEAccount Account Description FY11 Actuals FY12 Budget FY13 Budget1139 Comp of Other Professional Personnel 46,679 46,789 47,2572100 FICA Employer Contribution 3,490 3,579 3,6152210 Virginia Retirement System 4,415 5,582 7,9252300 Health Insurance Subsidy 5,258 5,258 4,2062400 Virginia Retirement System Life Insurance Subsidy 130 131 562Grand Total 59,972 61,339 63,565
ADMINISTRATIONAccount Account Description FY11 Actuals FY12 Budget FY13 Budget1125 Comp of Directors/Curriculum Leaders 86,506 81,310 87,6551139 Comp of Other Professional Personnel 70,696 174,869 72,0011150 Comp of Secretary and Clerical 35,150 35,669 35,3281350 Comp of Part Time Secretary and Clerical 7612100 FICA Employer Contribution 13,906 22,326 14,9172210 Virginia Retirement System 18,070 34,395 31,3612300 Health Insurance Subsidy 34,501 40,163 26,4382400 Virginia Retirement System Life Insurance Subsidy 531 807 2,2255401 Leases/Rental of Equipment 9,000 9,0005510 Mileage Reimbursement 479 488 2,8006001 Office Supplies 588 955 9008100 Capital Outlay-Replacement 822 116 100Grand Total 262,010 400,098 282,725
321,982 461,437 346,290GRAND TOTAL STUDENT SERVICES
OPERATING BUDGET EXPENSES BY PROGRAM 2012-2013
203
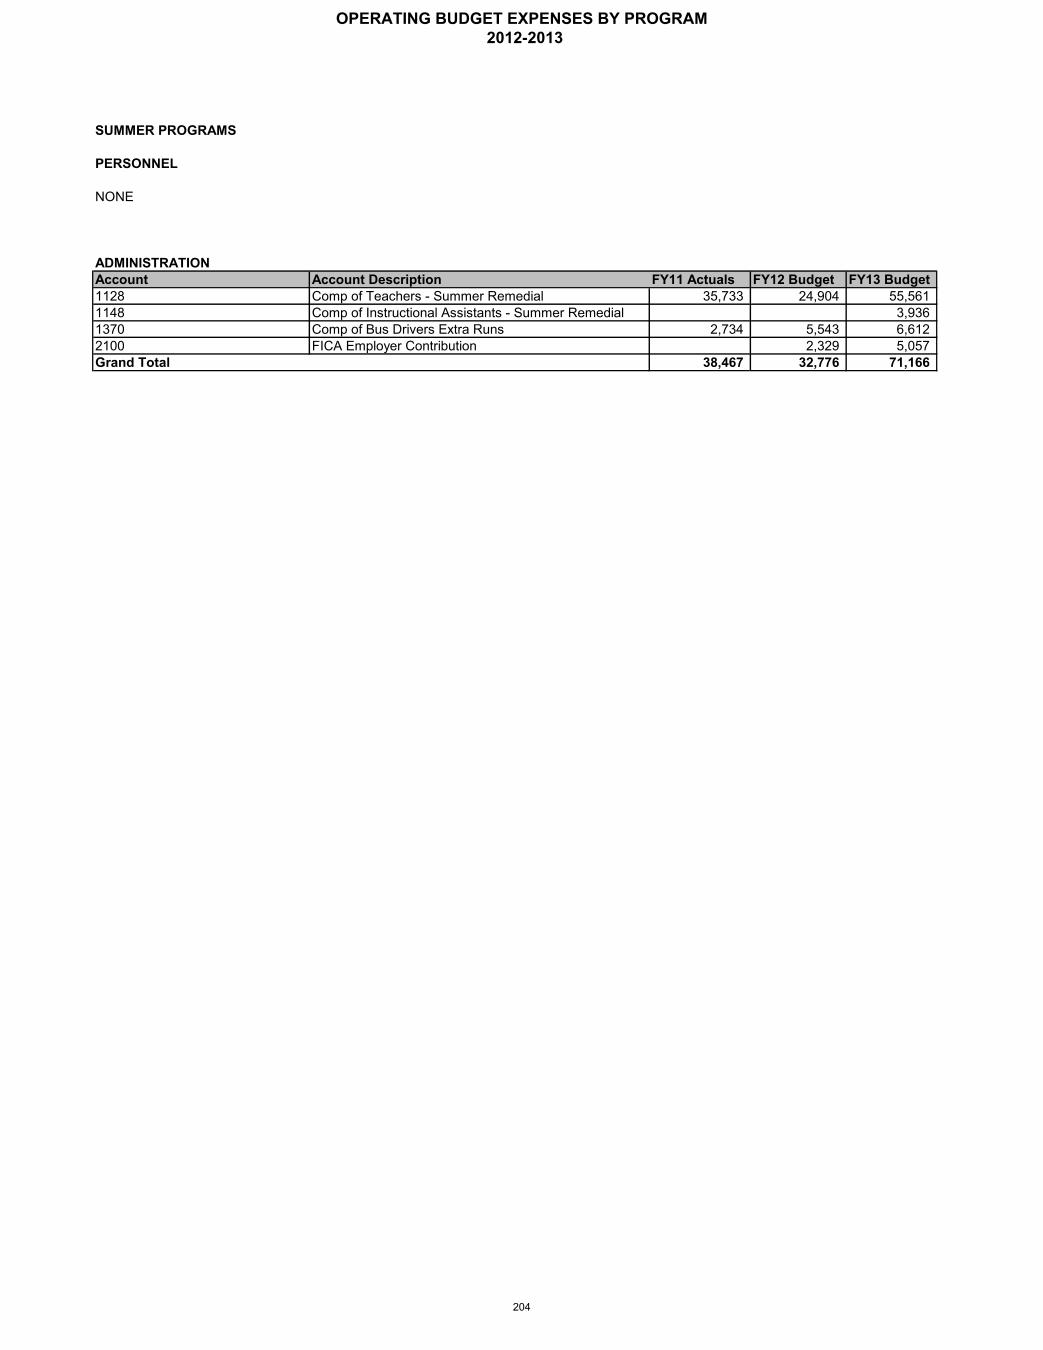
SUMMER PROGRAMS
PERSONNEL
NONE
ADMINISTRATIONAccount Account Description FY11 Actuals FY12 Budget FY13 Budget1128 Comp of Teachers - Summer Remedial 35,733 24,904 55,5611148 Comp of Instructional Assistants - Summer Remedial 3,9361370 Comp of Bus Drivers Extra Runs 2,734 5,543 6,6122100 FICA Employer Contribution 2,329 5,057Grand Total 38,467 32,776 71,166
OPERATING BUDGET EXPENSES BY PROGRAM 2012-2013
204
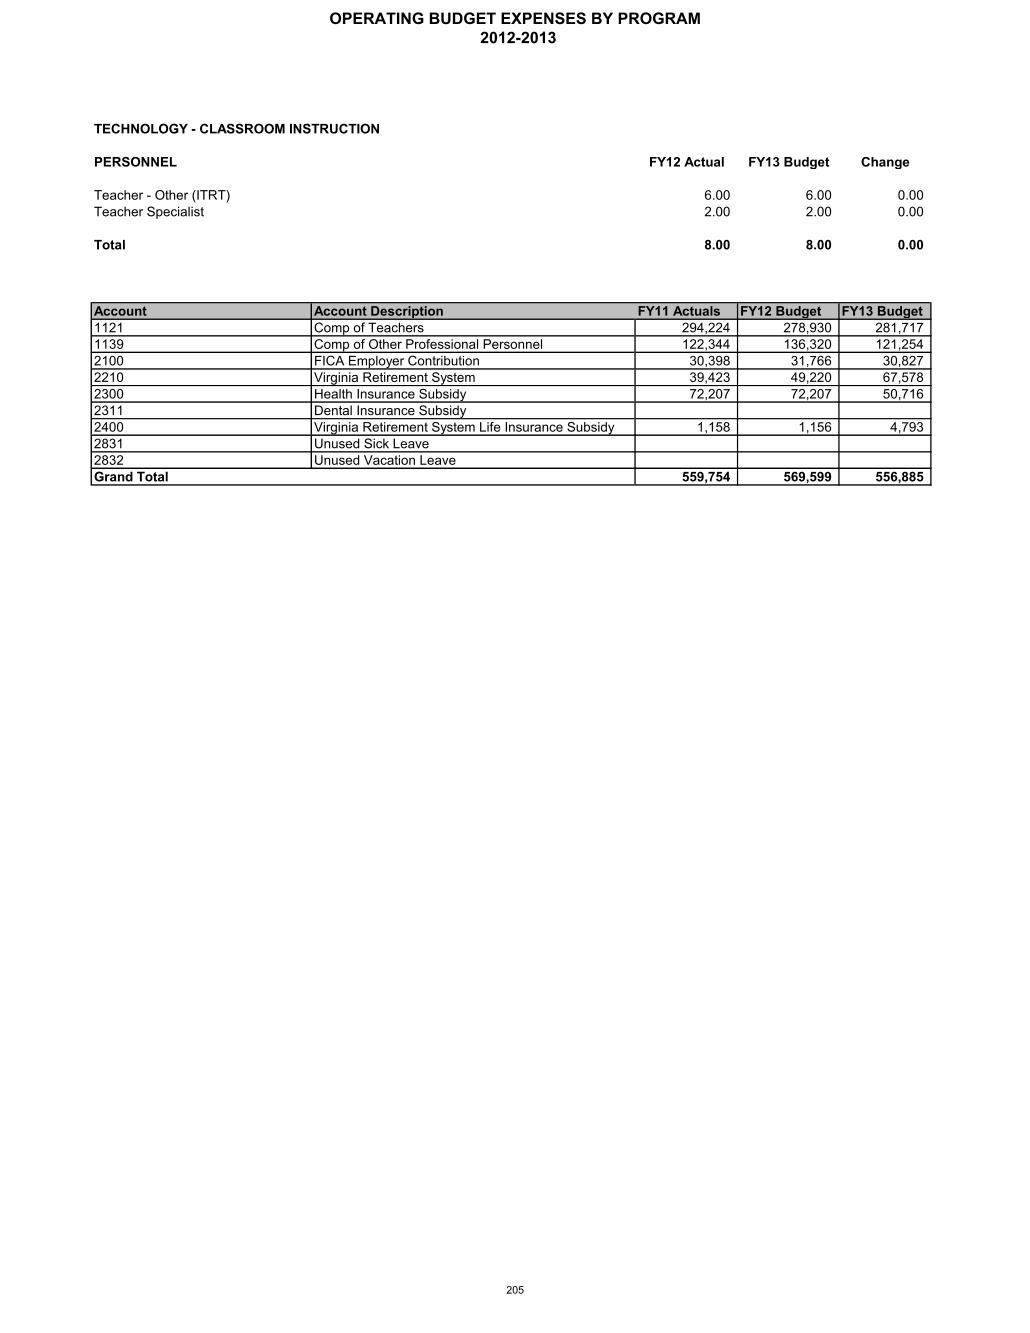
TECHNOLOGY - CLASSROOM INSTRUCTION
PERSONNEL FY12 Actual FY13 Budget Change
Teacher - Other (ITRT) 6.00 6.00 0.00Teacher Specialist 2.00 2.00 0.00
Total 8.00 8.00 0.00
Account Account Description FY11 Actuals FY12 Budget FY13 Budget1121 Comp of Teachers 294,224 278,930 281,7171139 Comp of Other Professional Personnel 122,344 136,320 121,2542100 FICA Employer Contribution 30,398 31,766 30,8272210 Virginia Retirement System 39,423 49,220 67,5782300 Health Insurance Subsidy 72,207 72,207 50,7162311 Dental Insurance Subsidy2400 Virginia Retirement System Life Insurance Subsidy 1,158 1,156 4,7932831 Unused Sick Leave2832 Unused Vacation LeaveGrand Total 559,754 569,599 556,885
OPERATING BUDGET EXPENSES BY PROGRAM 2012-2013
205

TECHNOLOGY - INSTRUCTIONAL SUPPORT
PERSONNEL FY12 Actual FY13 Budget Change
Applications Database Administrator 1.00 1.00 0.00Assistant Network Administrator 1.00 1.00 0.00Assistant System Administrator 1.00 1.00 0.00Communication Network Specialist 1.00 1.00 0.00Database Manager 1.00 1.00 0.00Fixed Asset Specialist 1.00 1.00 0.00Information Systems Support Specialist II 1.00 1.00 0.00Information Systems Support Specialist Sr 2.00 2.00 0.00Local Database Manager 1.00 1.00 0.00MAC School Technology Specialist 1.00 1.00 0.00Network Support Specialist II 1.00 1.00 0.00Network Support Specialist Sr. 1.00 1.00 0.00Network Support Supervisor 1.00 1.00 0.00Network System Administrator 1.00 1.00 0.00Programmer Analyst II 1.00 1.00 0.00Programmer Analyst, Senior 3.00 3.00 0.00School Info Processing Specialist II 8.00 8.00 0.00School Technology Specialist I 1.00 1.00 0.00School Technology Specialist II 13.00 13.00 0.00Senior System Administrator 1.00 1.00 0.00Technical Analyst 1.00 1.00 0.00Technology Repair Specialist II 1.00 1.00 0.00Technology Repair Specialist, Senior 3.00 3.00 0.00Technology Support Manager 1.00 1.00 0.00Technology Support Specialist II 3.00 3.00 0.00Technology Support Specialist, Senior 3.00 3.00 0.00
Total 54.00 54.00 0.00
MIDDLEAccount Account Description FY11 Actuals FY12 Budget FY13 Budget1143 Comp of Other Technical Personnel 37,775 38,230 38,6132100 FICA Employer Contribution 2,746 2,925 2,9542210 Virginia Retirement System 3,608 4,561 6,4752300 Health Insurance Subsidy 6,744 7,1152400 Virginia Retirement System Life Insurance Subsidy 106 107 459Grand Total 50,979 52,938 48,501
HIGHAccount Account Description FY11 Actuals FY12 Budget FY13 Budget1150 Comp of Secretary and Clerical 250,324 246,943 249,3912100 FICA Employer Contribution 18,262 18,890 19,0782210 Virginia Retirement System 23,302 29,459 41,8232300 Health Insurance Subsidy 44,417 44,417 39,6002311 Dental Insurance Subsidy 7812400 Virginia Retirement System Life Insurance Subsidy 685 691 2,9662501 Income Protection Subsidy 249Grand Total 338,020 340,400 352,858
ADMINISTRATIONAccount Account Description FY11 Actuals FY12 Budget FY13 Budget1143 Comp of Other Technical Personnel 2,231,355 2,274,932 2,231,0111399 Comp of Temporary Employees 7,3282100 FICA Employer Contribution 166,920 174,032 170,6722210 Virginia Retirement System 207,155 264,239 357,0022300 Health Insurance Subsidy 291,420 333,676 229,7932311 Dental Insurance Subsidy 1,0422400 Virginia Retirement System Life Insurance Subsidy 6,124 6,280 26,4992501 Income Protection Subsidy 8472831 Unused Sick Leave 9,8872832 Unused Vacation Leave 25,0555205 Communication Technology 370,649 405,730 405,7305401 Leases/Rental of Equipment 110,609 114,000 114,0006017 Repair Parts and Supplies 241,966 193,102 195,0008000 Capital Outlay-Control 4,330,720 1,070,000 1,037,5008200 Capital Outlay-NewGrand Total 8,001,077 4,835,991 4,767,207
8,390,076 5,229,329 5,168,566GRAND TOTAL TECHNOLOGY - INSTRUCTIONAL SUPPORT
OPERATING BUDGET EXPENSES BY PROGRAM 2012-2013
206
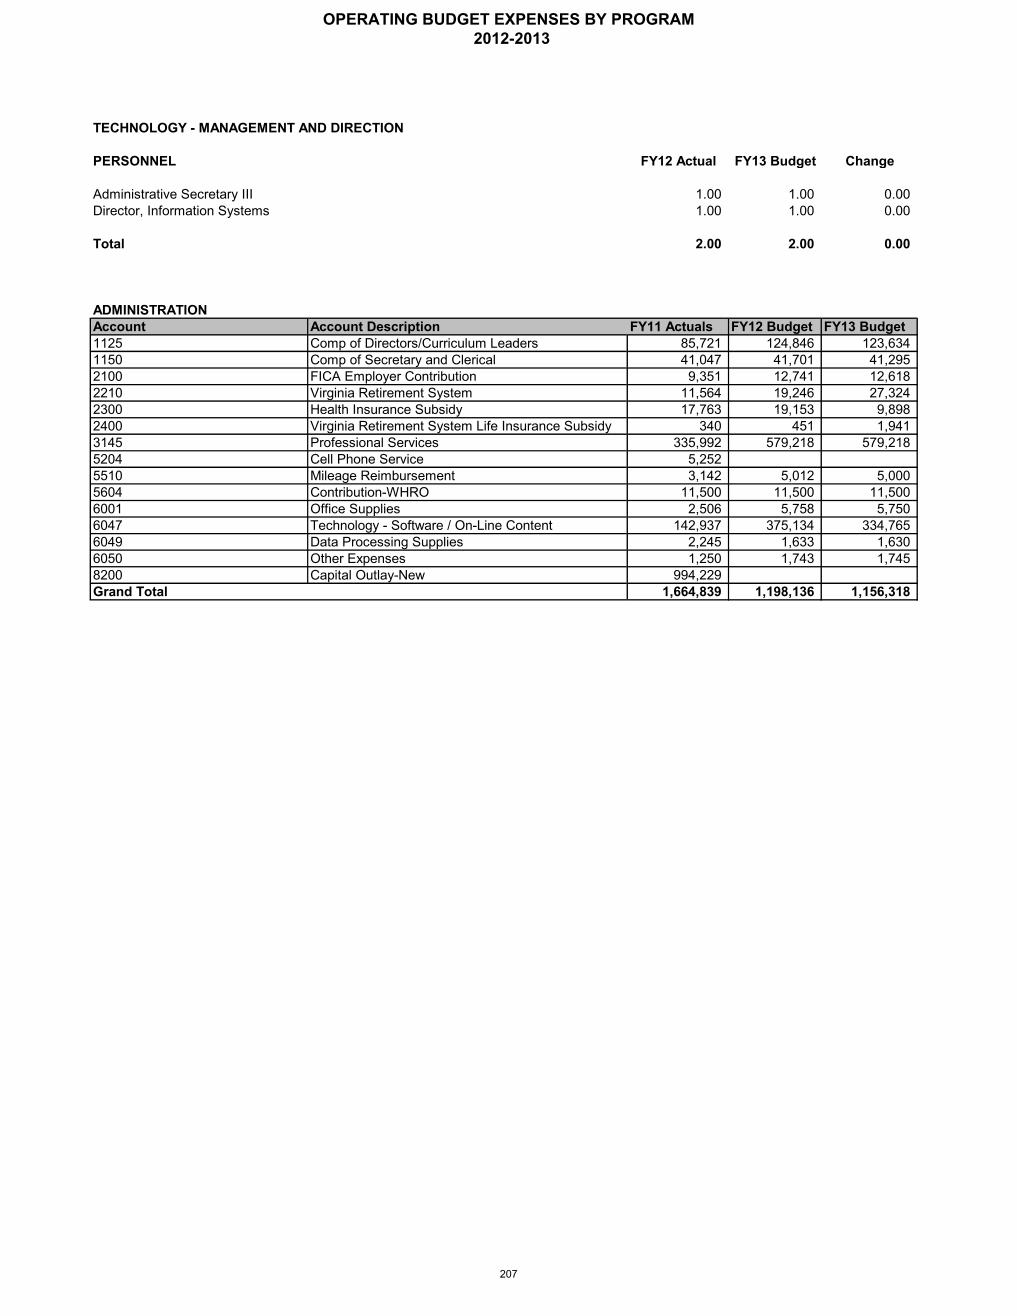
PERSONNEL FY12 Actual FY13 Budget Change
Administrative Secretary III 1.00 1.00 0.00Director, Information Systems 1.00 1.00 0.00
Total 2.00 2.00 0.00
ADMINISTRATIONAccount Account Description FY11 Actuals FY12 Budget FY13 Budget1125 Comp of Directors/Curriculum Leaders 85,721 124,846 123,6341150 Comp of Secretary and Clerical 41,047 41,701 41,2952100 FICA Employer Contribution 9,351 12,741 12,6182210 Virginia Retirement System 11,564 19,246 27,3242300 Health Insurance Subsidy 17,763 19,153 9,8982400 Virginia Retirement System Life Insurance Subsidy 340 451 1,9413145 Professional Services 335,992 579,218 579,2185204 Cell Phone Service 5,2525510 Mileage Reimbursement 3,142 5,012 5,0005604 Contribution-WHRO 11,500 11,500 11,5006001 Office Supplies 2,506 5,758 5,7506047 Technology - Software / On-Line Content 142,937 375,134 334,7656049 Data Processing Supplies 2,245 1,633 1,6306050 Other Expenses 1,250 1,743 1,7458200 Capital Outlay-New 994,229Grand Total 1,664,839 1,198,136 1,156,318
TECHNOLOGY - MANAGEMENT AND DIRECTION
OPERATING BUDGET EXPENSES BY PROGRAM 2012-2013
207

TRANSPORTATION - MAINTENANCE SERVICES
PERSONNEL FY12 Actual FY13 Budget Change
Automotive Mechanic 5.00 5.00 0.00Automotive Shop Supervisor 1.00 1.00 0.00Automotive Shop Supervisor, Assistant 1.00 1.00 0.00Lot Attendant 2.00 2.00 0.00Transportation Shop Attendant 1.00 1.00 0.00
Total 10.00 10.00 0.00
ADMINISTRATIONAccount Account Description FY11 Actuals FY12 Budget FY13 Budget1165 Comp of Garage Employees 352,153 413,518 415,4191265 Comp of Garage Employees OT 206 32,240 32,2401399 Comp of Temporary Employees 7,6802100 FICA Employer Contribution 27,115 34,100 34,2462210 Virginia Retirement System 45,681 62,302 66,2622300 Health Insurance Subsidy 38,371 59,716 43,3132311 Dental Insurance Subsidy 2672400 Virginia Retirement System Life Insurance Subsidy 952 1,128 4,9012831 Unused Sick Leave 726008 Vehicle and Power Equipment Fuels 1,356,780 1,504,897 1,504,8976009 Vehicle and Power Equipment Supplies 679,477 712,478 712,478Grand Total 2,508,754 2,820,379 2,813,756
OPERATING BUDGET EXPENSES BY PROGRAM 2012-2013
208
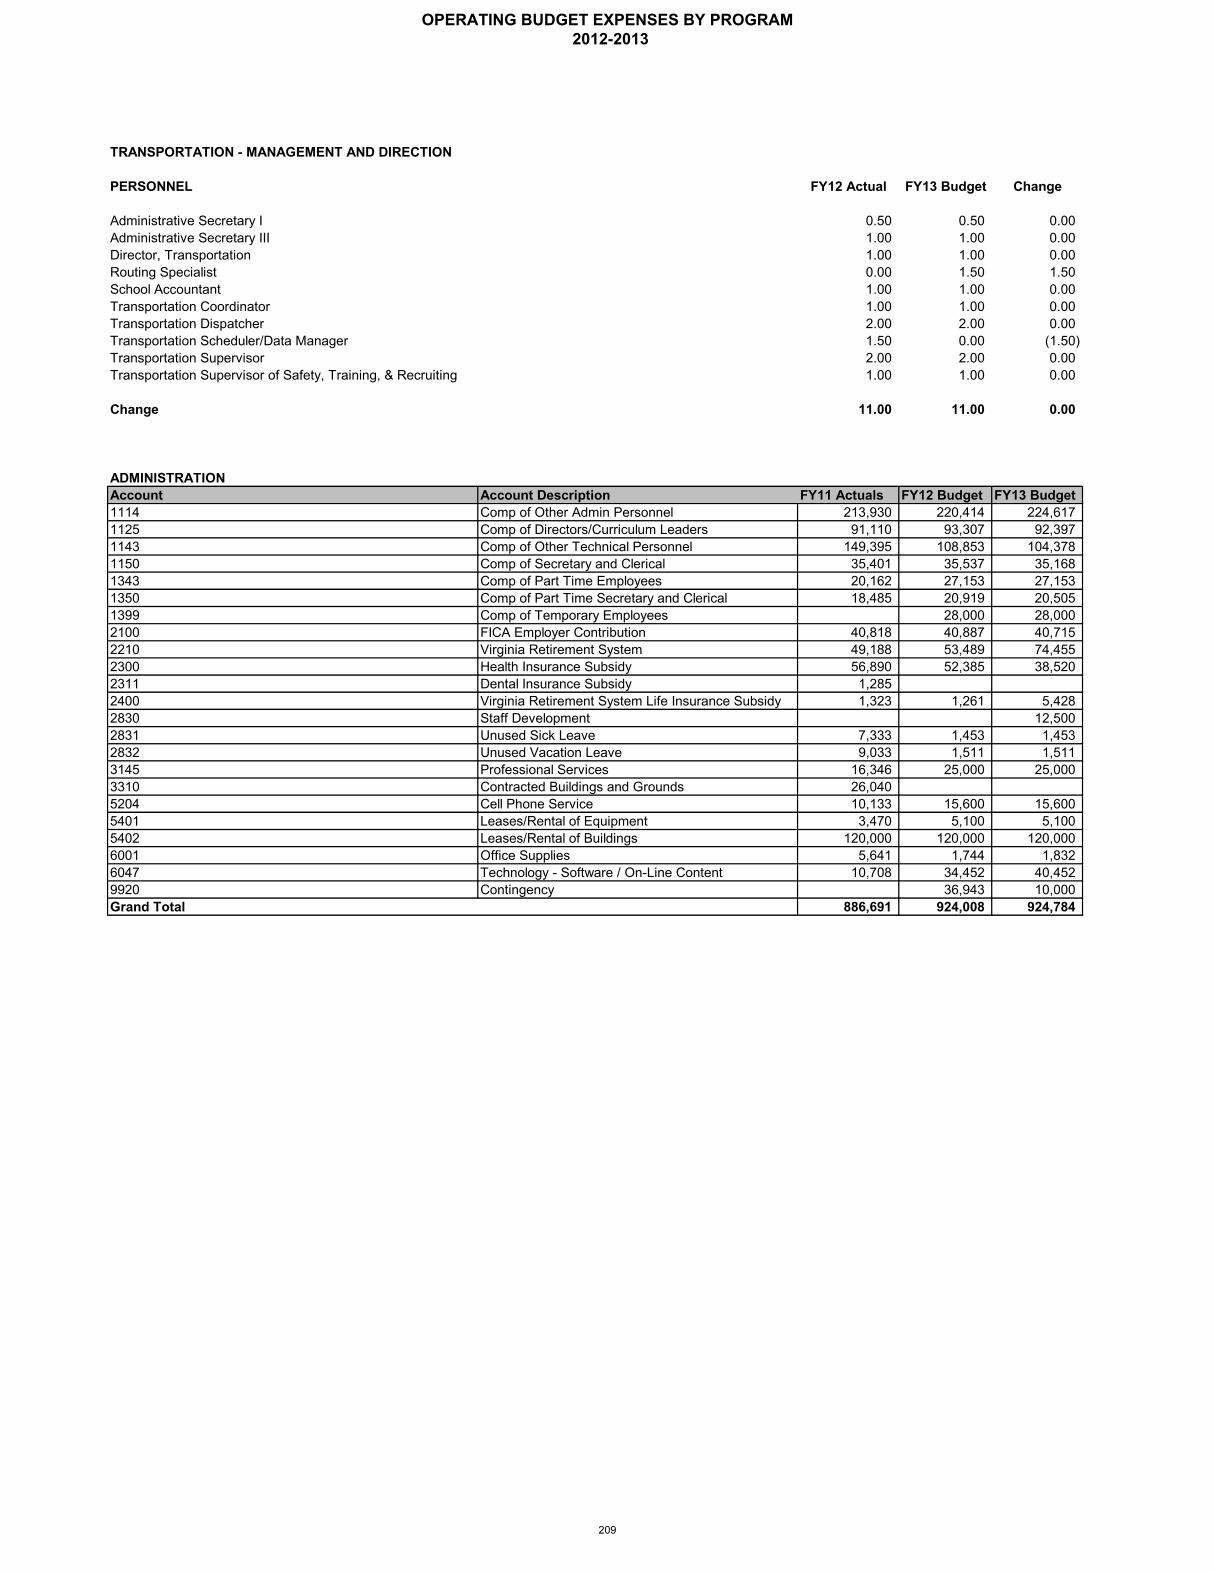
TRANSPORTATION - MANAGEMENT AND DIRECTION
PERSONNEL FY12 Actual FY13 Budget Change
Administrative Secretary I 0.50 0.50 0.00Administrative Secretary III 1.00 1.00 0.00Director, Transportation 1.00 1.00 0.00Routing Specialist 0.00 1.50 1.50School Accountant 1.00 1.00 0.00Transportation Coordinator 1.00 1.00 0.00Transportation Dispatcher 2.00 2.00 0.00Transportation Scheduler/Data Manager 1.50 0.00 (1.50)Transportation Supervisor 2.00 2.00 0.00Transportation Supervisor of Safety, Training, & Recruiting 1.00 1.00 0.00
Change 11.00 11.00 0.00
ADMINISTRATIONAccount Account Description FY11 Actuals FY12 Budget FY13 Budget1114 Comp of Other Admin Personnel 213,930 220,414 224,6171125 Comp of Directors/Curriculum Leaders 91,110 93,307 92,3971143 Comp of Other Technical Personnel 149,395 108,853 104,3781150 Comp of Secretary and Clerical 35,401 35,537 35,1681343 Comp of Part Time Employees 20,162 27,153 27,1531350 Comp of Part Time Secretary and Clerical 18,485 20,919 20,5051399 Comp of Temporary Employees 28,000 28,0002100 FICA Employer Contribution 40,818 40,887 40,7152210 Virginia Retirement System 49,188 53,489 74,4552300 Health Insurance Subsidy 56,890 52,385 38,5202311 Dental Insurance Subsidy 1,2852400 Virginia Retirement System Life Insurance Subsidy 1,323 1,261 5,4282830 Staff Development 12,5002831 Unused Sick Leave 7,333 1,453 1,4532832 Unused Vacation Leave 9,033 1,511 1,5113145 Professional Services 16,346 25,000 25,0003310 Contracted Buildings and Grounds 26,0405204 Cell Phone Service 10,133 15,600 15,6005401 Leases/Rental of Equipment 3,470 5,100 5,1005402 Leases/Rental of Buildings 120,000 120,000 120,0006001 Office Supplies 5,641 1,744 1,8326047 Technology - Software / On-Line Content 10,708 34,452 40,4529920 Contingency 36,943 10,000Grand Total 886,691 924,008 924,784
OPERATING BUDGET EXPENSES BY PROGRAM 2012-2013
209
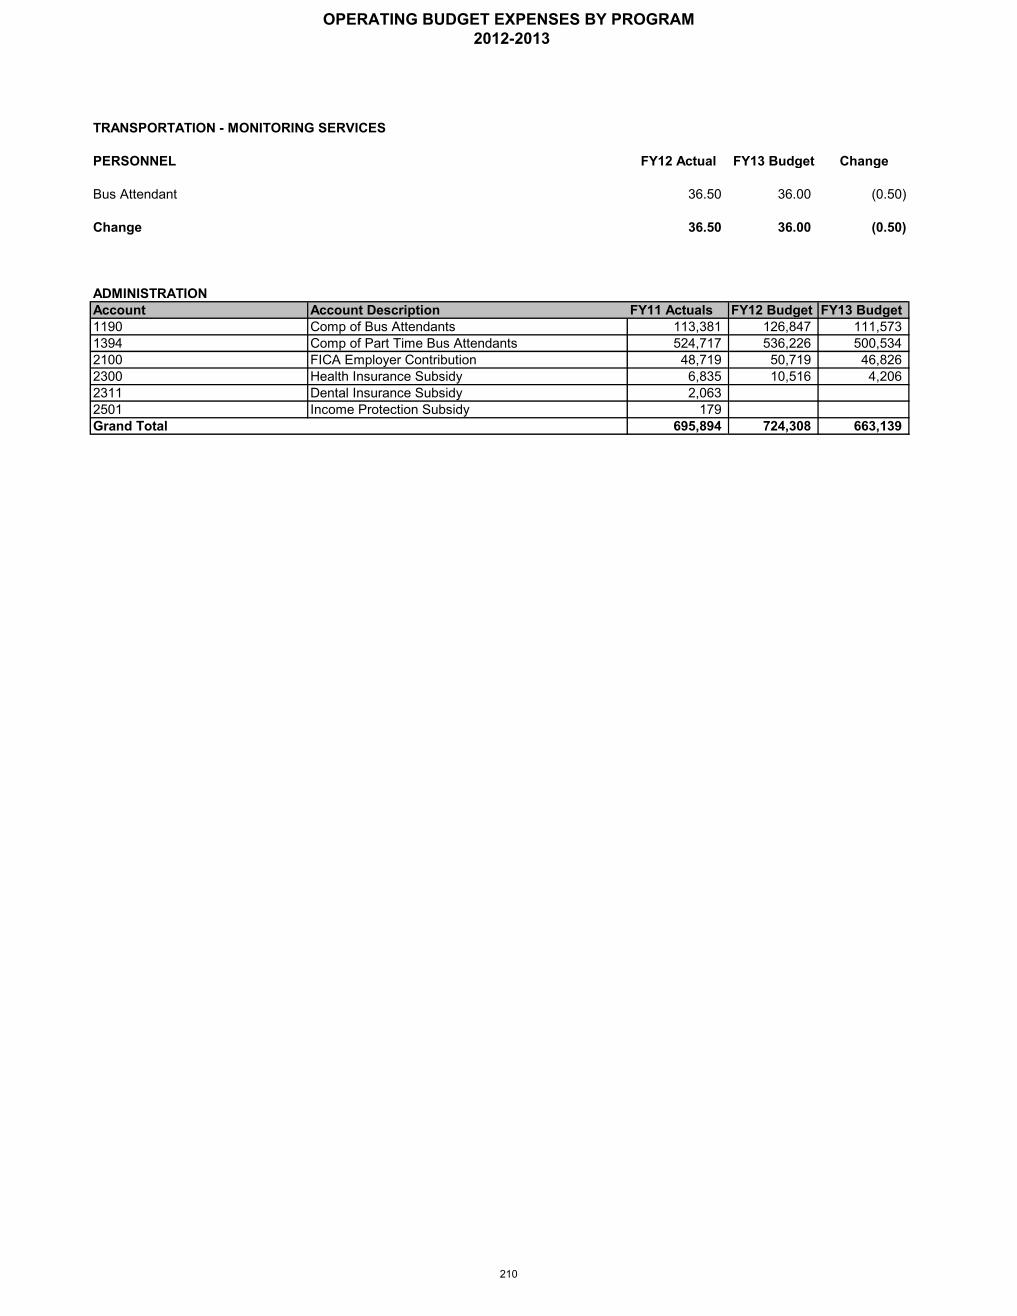
PERSONNEL FY12 Actual FY13 Budget Change
Bus Attendant 36.50 36.00 (0.50)
Change 36.50 36.00 (0.50)
ADMINISTRATIONAccount Account Description FY11 Actuals FY12 Budget FY13 Budget1190 Comp of Bus Attendants 113,381 126,847 111,5731394 Comp of Part Time Bus Attendants 524,717 536,226 500,5342100 FICA Employer Contribution 48,719 50,719 46,8262300 Health Insurance Subsidy 6,835 10,516 4,2062311 Dental Insurance Subsidy 2,0632501 Income Protection Subsidy 179Grand Total 695,894 724,308 663,139
TRANSPORTATION - MONITORING SERVICES
OPERATING BUDGET EXPENSES BY PROGRAM 2012-2013
210
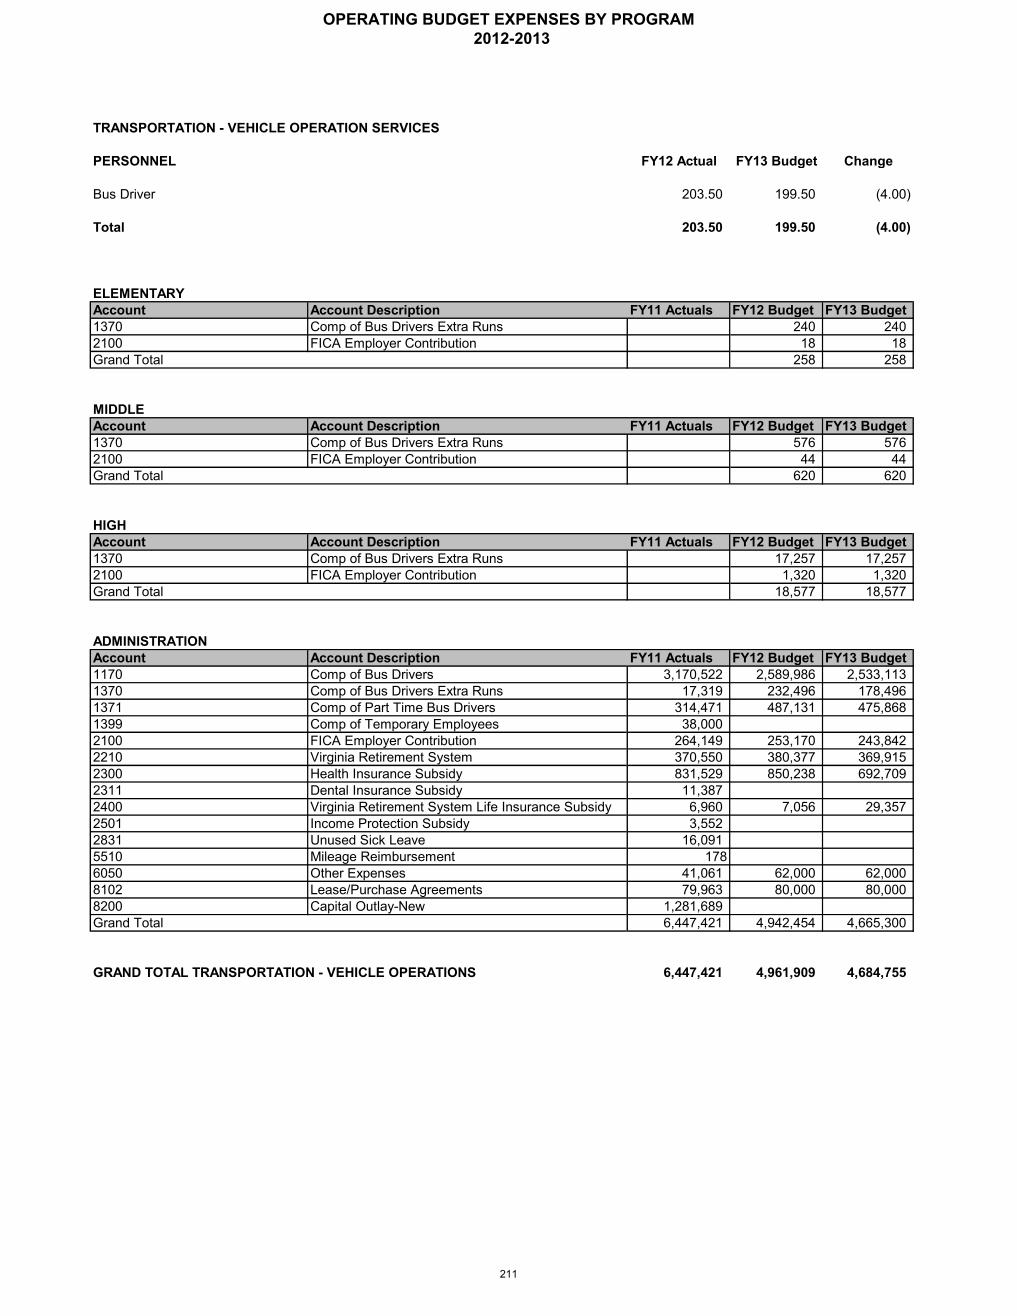
PERSONNEL FY12 Actual FY13 Budget Change
Bus Driver 203.50 199.50 (4.00)
Total 203.50 199.50 (4.00)
ELEMENTARYAccount Account Description FY11 Actuals FY12 Budget FY13 Budget1370 Comp of Bus Drivers Extra Runs 240 2402100 FICA Employer Contribution 18 18Grand Total 258 258
MIDDLEAccount Account Description FY11 Actuals FY12 Budget FY13 Budget1370 Comp of Bus Drivers Extra Runs 576 5762100 FICA Employer Contribution 44 44Grand Total 620 620
HIGHAccount Account Description FY11 Actuals FY12 Budget FY13 Budget1370 Comp of Bus Drivers Extra Runs 17,257 17,2572100 FICA Employer Contribution 1,320 1,320Grand Total 18,577 18,577
ADMINISTRATIONAccount Account Description FY11 Actuals FY12 Budget FY13 Budget1170 Comp of Bus Drivers 3,170,522 2,589,986 2,533,1131370 Comp of Bus Drivers Extra Runs 17,319 232,496 178,4961371 Comp of Part Time Bus Drivers 314,471 487,131 475,8681399 Comp of Temporary Employees 38,000 2100 FICA Employer Contribution 264,149 253,170 243,8422210 Virginia Retirement System 370,550 380,377 369,9152300 Health Insurance Subsidy 831,529 850,238 692,7092311 Dental Insurance Subsidy 11,3872400 Virginia Retirement System Life Insurance Subsidy 6,960 7,056 29,3572501 Income Protection Subsidy 3,5522831 Unused Sick Leave 16,0915510 Mileage Reimbursement 1786050 Other Expenses 41,061 62,000 62,0008102 Lease/Purchase Agreements 79,963 80,000 80,0008200 Capital Outlay-New 1,281,689Grand Total 6,447,421 4,942,454 4,665,300
6,447,421 4,961,909 4,684,755
TRANSPORTATION - VEHICLE OPERATION SERVICES
GRAND TOTAL TRANSPORTATION - VEHICLE OPERATIONS
OPERATING BUDGET EXPENSES BY PROGRAM 2012-2013
211
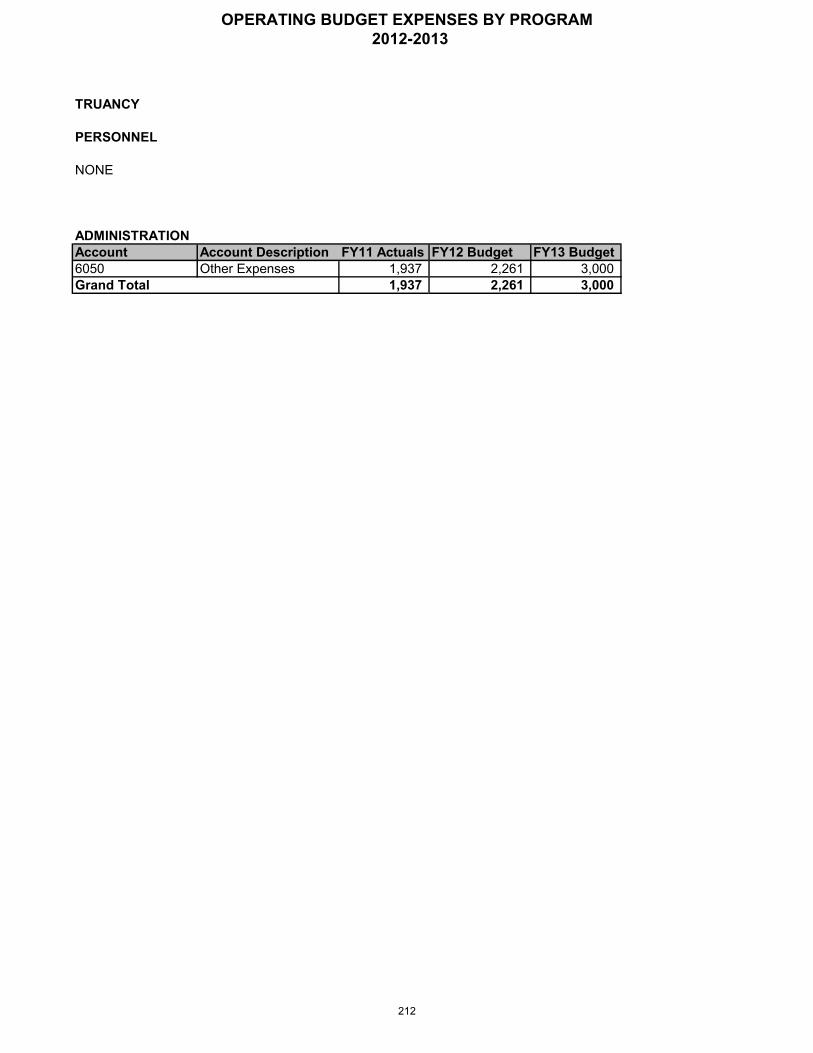
TRUANCY
PERSONNEL
NONE
ADMINISTRATIONAccount Account Description FY11 Actuals FY12 Budget FY13 Budget6050 Other Expenses 1,937 2,261 3,000Grand Total 1,937 2,261 3,000
OPERATING BUDGET EXPENSES BY PROGRAM 2012-2013
212
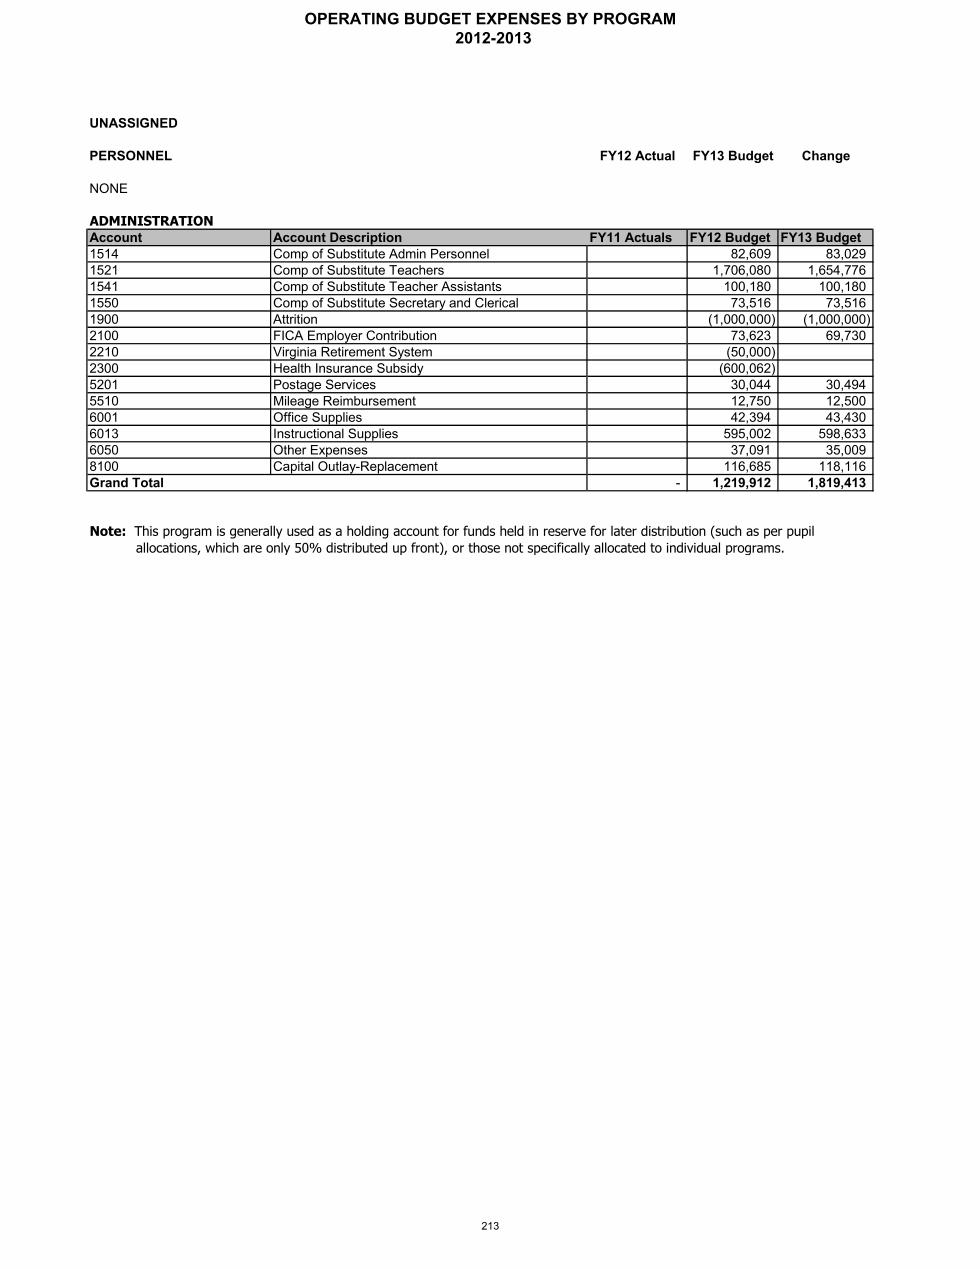
UNASSIGNED
PERSONNEL FY12 Actual FY13 Budget Change
NONE
ADMINISTRATION
Account Account Description FY11 Actuals FY12 Budget FY13 Budget1514 Comp of Substitute Admin Personnel 82,609 83,0291521 Comp of Substitute Teachers 1,706,080 1,654,7761541 Comp of Substitute Teacher Assistants 100,180 100,1801550 Comp of Substitute Secretary and Clerical 73,516 73,5161900 Attrition (1,000,000) (1,000,000)2100 FICA Employer Contribution 73,623 69,7302210 Virginia Retirement System (50,000)2300 Health Insurance Subsidy (600,062)5201 Postage Services 30,044 30,4945510 Mileage Reimbursement 12,750 12,5006001 Office Supplies 42,394 43,4306013 Instructional Supplies 595,002 598,6336050 Other Expenses 37,091 35,0098100 Capital Outlay-Replacement 116,685 118,116Grand Total - 1,219,912 1,819,413
Note: This program is generally used as a holding account for funds held in reserve for later distribution (such as per pupil
allocations, which are only 50% distributed up front), or those not specifically allocated to individual programs.
OPERATING BUDGET EXPENSES BY PROGRAM 2012-2013
213

THIS PAGE INTENTIONALLY LEFT BLANK
214
OPERATING BUDGET
BUDGET BY DEPARTMENT
2012 - 2013

Hampton City SchoolsBudget Book by Department
2012-2013
Period Name: Jul-FY13
Department Description Department Account Account Description BudgetAberdeen Elementary 020 1121 Comp of Teachers $1,464,480.00
1122 Comp of Librarians $41,901.001123 Comp of Deans and Guidance Counselors $43,525.001126 Comp of Principals $69,477.001127 Comp of Assistant Principals $50,598.001131 Comp of Nurses $39,353.001141 Comp of Teacher Assistants $159,576.001150 Comp of Secretary and Clerical $31,141.001191 Comp of Custodians $46,555.001343 Comp of Part Time Employees $8,937.001350 Comp of Part Time Secretary and Clerical $6,000.001391 Comp of Part Time Custodians $20,970.001399 Comp of Temporary Employees $10,091.00
Sub-total: $1,992,604.00
2100 FICA Employer Contribution $152,491.002210 Virginia Retirement System $312,025.002300 Health Insurance Subsidy $198,187.002400 Virginia Retirement System Life Insurance $23,127.00
Sub-total: $685,830.00
5101 Electrical Services $55,141.005103 Water and Sewer Services $5,700.005201 Postage Services $448.005510 Mileage Reimbursement $250.00
Sub-total: $61,539.00
6001 Office Supplies $896.006013 Instructional Supplies $7,840.006050 Other Expenses $784.00
Sub-total: $9,520.00
8100 Capital Outlay-Replacement $1,344.00
Sub-total: $1,344.00
Total for Dept. 020: $2,750,837.00
215

Hampton City SchoolsBudget Book by Department
2012-2013
Period Name: Jul-FY13
Department Description Department Account Account Description BudgetAdult Education 844 1121 Comp of Teachers $173,585.00
1125 Comp of Directors/Curriculum Leaders $137,346.001150 Comp of Secretary and Clerical $37,535.001321 Comp of Home Bound Instructors $256,000.001339 Comp of Part Time Professional Personnel $24,278.001391 Comp of Part Time Custodians $32,390.001392 Comp of Part Time Hall Monitors $19,782.00
Sub-total: $680,916.00
2100 FICA Employer Contribution $52,090.002210 Virginia Retirement System $58,369.002300 Health Insurance Subsidy $24,088.002400 Virginia Retirement System Life Insurance $4,143.00
Sub-total: $138,690.00
3320 Contracted Maintenance Agreements $600.00
Sub-total: $600.00
5201 Postage Services $299.005205 Communication Technology $9,890.005401 Leases/Rental of Equipment $6,000.005501 Travel Expenses $1,760.00
Sub-total: $17,949.00
6001 Office Supplies $1,512.006013 Instructional Supplies $7,180.006016 Testing and Monitoring Supplies $5,014.006047 Technology - Software / On-Line Content $11,460.006050 Other Expenses $20,000.00
Sub-total: $45,166.00
Total for Dept. 844: $883,321.00
216

Hampton City SchoolsBudget Book by Department
2012-2013
Period Name: Jul-FY13
Department Description Department Account Account Description BudgetAndrews PK-8 030 1121 Comp of Teachers $3,013,491.00
1122 Comp of Librarians $97,044.001123 Comp of Deans and Guidance Counselors $90,630.001126 Comp of Principals $89,467.001127 Comp of Assistant Principals $183,301.001131 Comp of Nurses $59,121.001139 Comp of Other Professional Personnel $92,306.001141 Comp of Teacher Assistants $216,053.001150 Comp of Secretary and Clerical $128,708.001191 Comp of Custodians $210,125.001192 Comp of Staff Aides $30,813.001343 Comp of Part Time Employees $8,689.001350 Comp of Part Time Secretary and Clerical $6,000.001391 Comp of Part Time Custodians $36,984.001399 Comp of Temporary Employees $41,268.00
Sub-total: $4,304,000.00
2100 FICA Employer Contribution $329,258.002210 Virginia Retirement System $686,806.002300 Health Insurance Subsidy $392,199.002400 Virginia Retirement System Life Insurance $50,027.00
Sub-total: $1,458,290.00
5100 Natural Gas Services $46,191.005101 Electrical Services $219,965.005103 Water and Sewer Services $8,900.005201 Postage Services $1,393.005510 Mileage Reimbursement $500.00
Sub-total: $276,949.00
6001 Office Supplies $2,390.006013 Instructional Supplies $20,319.006050 Other Expenses $2,091.00
Sub-total: $24,800.00
8100 Capital Outlay-Replacement $3,585.00
Sub-total: $3,585.00
Total for Dept. 030: $6,067,624.00
217

Hampton City SchoolsBudget Book by Department
2012-2013
Period Name: Jul-FY13
Department Description Department Account Account Description BudgetArmstrong Elementary 040 1121 Comp of Teachers $862,759.00
1122 Comp of Librarians $47,410.001123 Comp of Deans and Guidance Counselors $42,917.001126 Comp of Principals $88,255.001127 Comp of Assistant Principals $67,891.001131 Comp of Nurses $35,987.001141 Comp of Teacher Assistants $53,381.001150 Comp of Secretary and Clerical $33,536.001191 Comp of Custodians $48,809.001343 Comp of Part Time Employees $9,256.001350 Comp of Part Time Secretary and Clerical $6,000.001391 Comp of Part Time Custodians $9,450.001399 Comp of Temporary Employees $20,720.00
Sub-total: $1,326,371.00
2100 FICA Employer Contribution $101,469.002210 Virginia Retirement System $212,553.002300 Health Insurance Subsidy $139,676.002400 Virginia Retirement System Life Insurance $15,218.00
Sub-total: $468,916.00
5100 Natural Gas Services $6,401.005101 Electrical Services $36,960.005103 Water and Sewer Services $5,500.005201 Postage Services $315.005510 Mileage Reimbursement $250.00
Sub-total: $49,426.00
6001 Office Supplies $630.006013 Instructional Supplies $5,513.006050 Other Expenses $551.00
Sub-total: $6,694.00
8100 Capital Outlay-Replacement $945.00
Sub-total: $945.00
Total for Dept. 040: $1,852,352.00
218
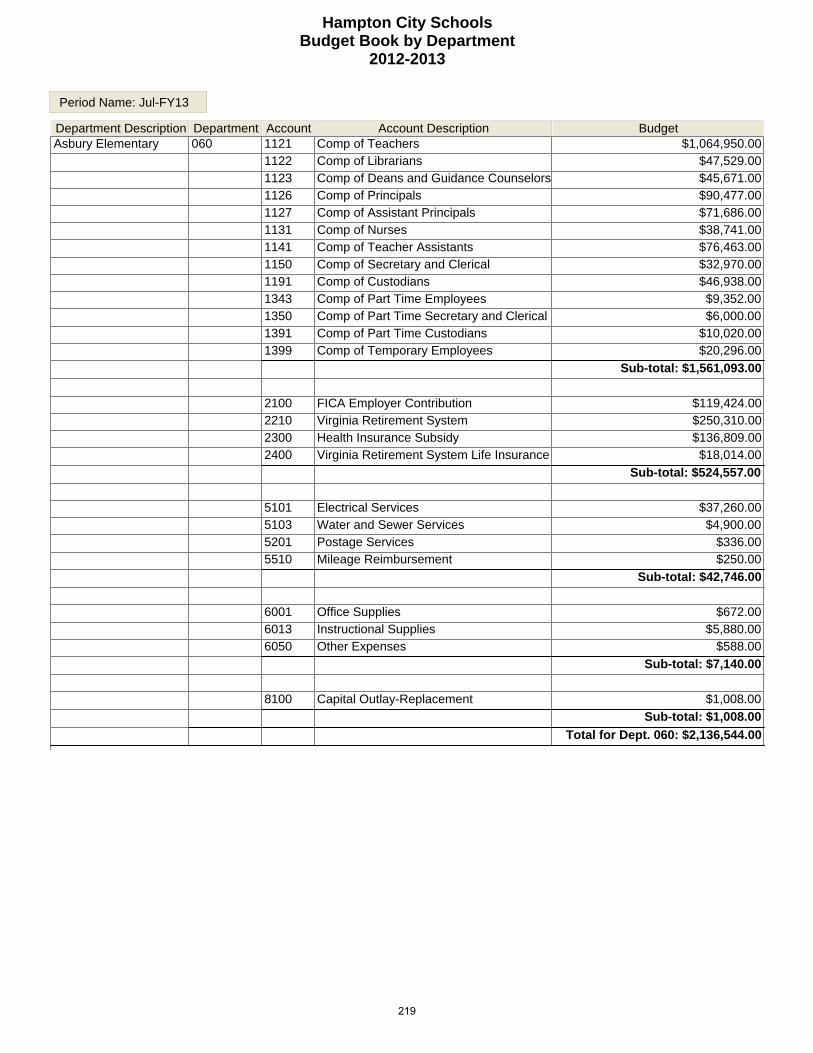
Hampton City SchoolsBudget Book by Department
2012-2013
Period Name: Jul-FY13
Department Description Department Account Account Description BudgetAsbury Elementary 060 1121 Comp of Teachers $1,064,950.00
1122 Comp of Librarians $47,529.001123 Comp of Deans and Guidance Counselors $45,671.001126 Comp of Principals $90,477.001127 Comp of Assistant Principals $71,686.001131 Comp of Nurses $38,741.001141 Comp of Teacher Assistants $76,463.001150 Comp of Secretary and Clerical $32,970.001191 Comp of Custodians $46,938.001343 Comp of Part Time Employees $9,352.001350 Comp of Part Time Secretary and Clerical $6,000.001391 Comp of Part Time Custodians $10,020.001399 Comp of Temporary Employees $20,296.00
Sub-total: $1,561,093.00
2100 FICA Employer Contribution $119,424.002210 Virginia Retirement System $250,310.002300 Health Insurance Subsidy $136,809.002400 Virginia Retirement System Life Insurance $18,014.00
Sub-total: $524,557.00
5101 Electrical Services $37,260.005103 Water and Sewer Services $4,900.005201 Postage Services $336.005510 Mileage Reimbursement $250.00
Sub-total: $42,746.00
6001 Office Supplies $672.006013 Instructional Supplies $5,880.006050 Other Expenses $588.00
Sub-total: $7,140.00
8100 Capital Outlay-Replacement $1,008.00
Sub-total: $1,008.00
Total for Dept. 060: $2,136,544.00
219
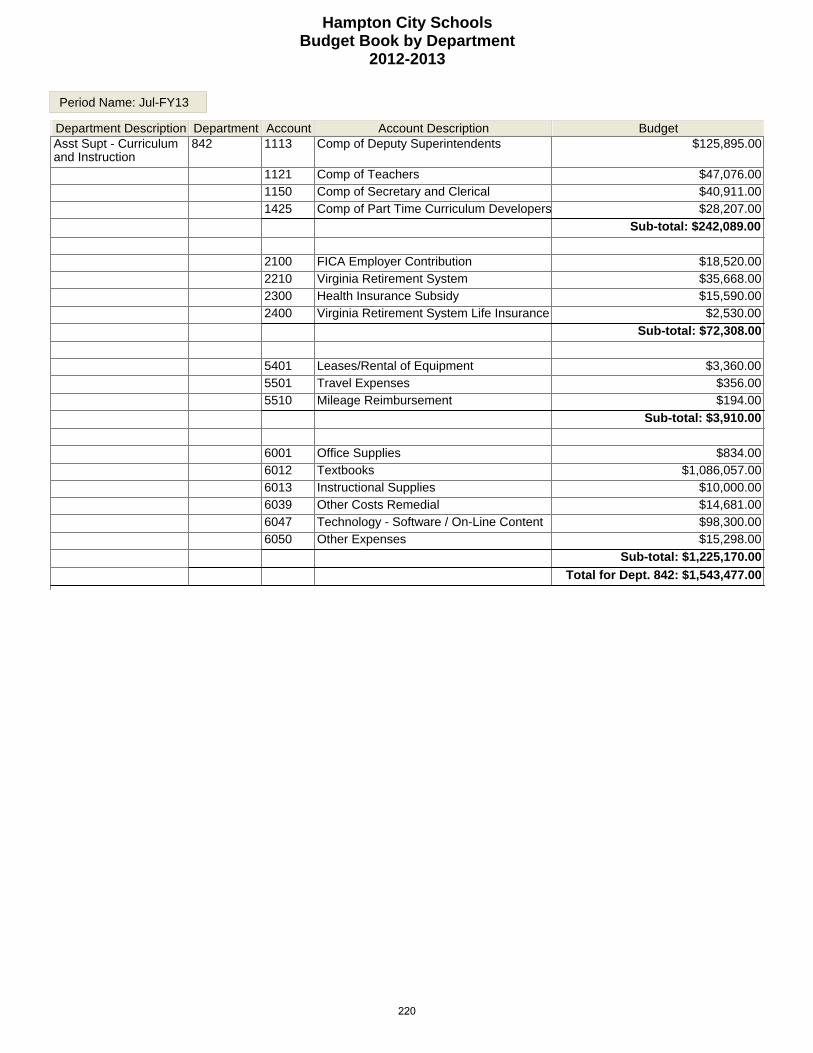
Hampton City SchoolsBudget Book by Department
2012-2013
Period Name: Jul-FY13
Department Description Department Account Account Description BudgetAsst Supt - Curriculum and Instruction
842 1113 Comp of Deputy Superintendents $125,895.00
1121 Comp of Teachers $47,076.001150 Comp of Secretary and Clerical $40,911.001425 Comp of Part Time Curriculum Developers $28,207.00
Sub-total: $242,089.00
2100 FICA Employer Contribution $18,520.002210 Virginia Retirement System $35,668.002300 Health Insurance Subsidy $15,590.002400 Virginia Retirement System Life Insurance $2,530.00
Sub-total: $72,308.00
5401 Leases/Rental of Equipment $3,360.005501 Travel Expenses $356.005510 Mileage Reimbursement $194.00
Sub-total: $3,910.00
6001 Office Supplies $834.006012 Textbooks $1,086,057.006013 Instructional Supplies $10,000.006039 Other Costs Remedial $14,681.006047 Technology - Software / On-Line Content $98,300.006050 Other Expenses $15,298.00
Sub-total: $1,225,170.00
Total for Dept. 842: $1,543,477.00
220

Hampton City SchoolsBudget Book by Department
2012-2013
Period Name: Jul-FY13
Department Description Department Account Account Description BudgetAt-Risk-4-Year Olds 868 1121 Comp of Teachers $1,159,147.00
1125 Comp of Directors/Curriculum Leaders $82,700.001139 Comp of Other Professional Personnel $50,894.001141 Comp of Teacher Assistants $513,373.001150 Comp of Secretary and Clerical $35,404.001350 Comp of Part Time Secretary and Clerical $11,320.001370 Comp of Bus Drivers Extra Runs $112,000.001399 Comp of Temporary Employees $4,400.00
Sub-total: $1,969,238.00
2100 FICA Employer Contribution $150,646.002210 Virginia Retirement System $302,018.002300 Health Insurance Subsidy $238,041.002400 Virginia Retirement System Life Insurance $21,895.002830 Staff Development $15,000.00
Sub-total: $727,600.00
3320 Contracted Maintenance Agreements $12,600.003602 At-Risk-4-Year Old Program $593,561.003760 Virginia Living Museum $4,319.003770 Virginia Air and Space Center $4,011.00
Sub-total: $614,491.00
5101 Electrical Services $33,165.005103 Water and Sewer Services $3,900.005401 Leases/Rental of Equipment $2,000.005510 Mileage Reimbursement $3,000.005800 Community Services/Parent Involvement $9,000.00
Sub-total: $51,065.00
6002 Food Cost $55,469.006013 Instructional Supplies $25,000.006050 Other Expenses $5,000.00
Sub-total: $85,469.00
8100 Capital Outlay-Replacement $12,000.00
Sub-total: $12,000.00
Total for Dept. 868: $3,459,863.00
221
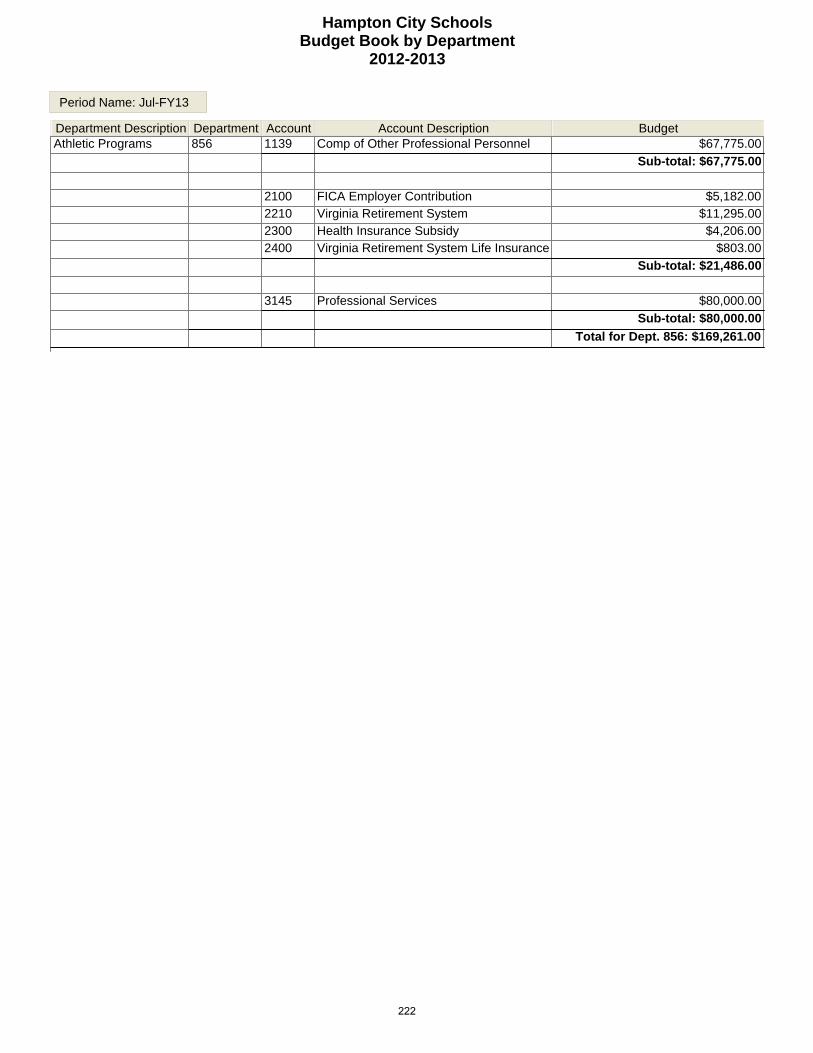
Hampton City SchoolsBudget Book by Department
2012-2013
Period Name: Jul-FY13
Department Description Department Account Account Description BudgetAthletic Programs 856 1139 Comp of Other Professional Personnel $67,775.00
Sub-total: $67,775.00
2100 FICA Employer Contribution $5,182.002210 Virginia Retirement System $11,295.002300 Health Insurance Subsidy $4,206.002400 Virginia Retirement System Life Insurance $803.00
Sub-total: $21,486.00
3145 Professional Services $80,000.00
Sub-total: $80,000.00
Total for Dept. 856: $169,261.00
222

Hampton City SchoolsBudget Book by Department
2012-2013
Period Name: Jul-FY13
Department Description Department Account Account Description BudgetBarron Elementary 080 1121 Comp of Teachers $1,112,142.00
1122 Comp of Librarians $46,246.001123 Comp of Deans and Guidance Counselors $45,350.001126 Comp of Principals $97,254.001127 Comp of Assistant Principals $70,905.001131 Comp of Nurses $35,765.001141 Comp of Teacher Assistants $108,170.001150 Comp of Secretary and Clerical $31,725.001191 Comp of Custodians $50,057.001343 Comp of Part Time Employees $9,520.001350 Comp of Part Time Secretary and Clerical $6,000.001391 Comp of Part Time Custodians $10,740.001399 Comp of Temporary Employees $15,941.00
Sub-total: $1,639,815.00
2100 FICA Employer Contribution $125,449.002210 Virginia Retirement System $266,093.002300 Health Insurance Subsidy $192,957.002400 Virginia Retirement System Life Insurance $18,968.00
Sub-total: $603,467.00
5101 Electrical Services $37,959.005103 Water and Sewer Services $6,200.005201 Postage Services $406.005510 Mileage Reimbursement $250.00
Sub-total: $44,815.00
6001 Office Supplies $812.006013 Instructional Supplies $7,105.006050 Other Expenses $711.00
Sub-total: $8,628.00
8100 Capital Outlay-Replacement $1,218.00
Sub-total: $1,218.00
Total for Dept. 080: $2,297,943.00
223

Hampton City SchoolsBudget Book by Department
2012-2013
Period Name: Jul-FY13
Department Description Department Account Account Description BudgetBassette Elementary 090 1121 Comp of Teachers $1,261,772.00
1122 Comp of Librarians $68,678.001123 Comp of Deans and Guidance Counselors $43,220.001126 Comp of Principals $92,727.001127 Comp of Assistant Principals $56,903.001131 Comp of Nurses $39,909.001141 Comp of Teacher Assistants $107,412.001150 Comp of Secretary and Clerical $35,460.001191 Comp of Custodians $46,978.001343 Comp of Part Time Employees $9,352.001350 Comp of Part Time Secretary and Clerical $6,000.001391 Comp of Part Time Custodians $23,980.001399 Comp of Temporary Employees $10,618.00
Sub-total: $1,803,009.00
2100 FICA Employer Contribution $137,934.002210 Virginia Retirement System $283,624.002300 Health Insurance Subsidy $190,013.002400 Virginia Retirement System Life Insurance $20,758.00
Sub-total: $632,329.00
5101 Electrical Services $49,747.005103 Water and Sewer Services $4,800.005201 Postage Services $317.005510 Mileage Reimbursement $250.00
Sub-total: $55,114.00
6001 Office Supplies $634.006013 Instructional Supplies $5,548.006017 Repair Parts and Supplies $254.006050 Other Expenses $555.00
Sub-total: $6,991.00
8100 Capital Outlay-Replacement $951.00
Sub-total: $951.00
Total for Dept. 090: $2,498,394.00
224
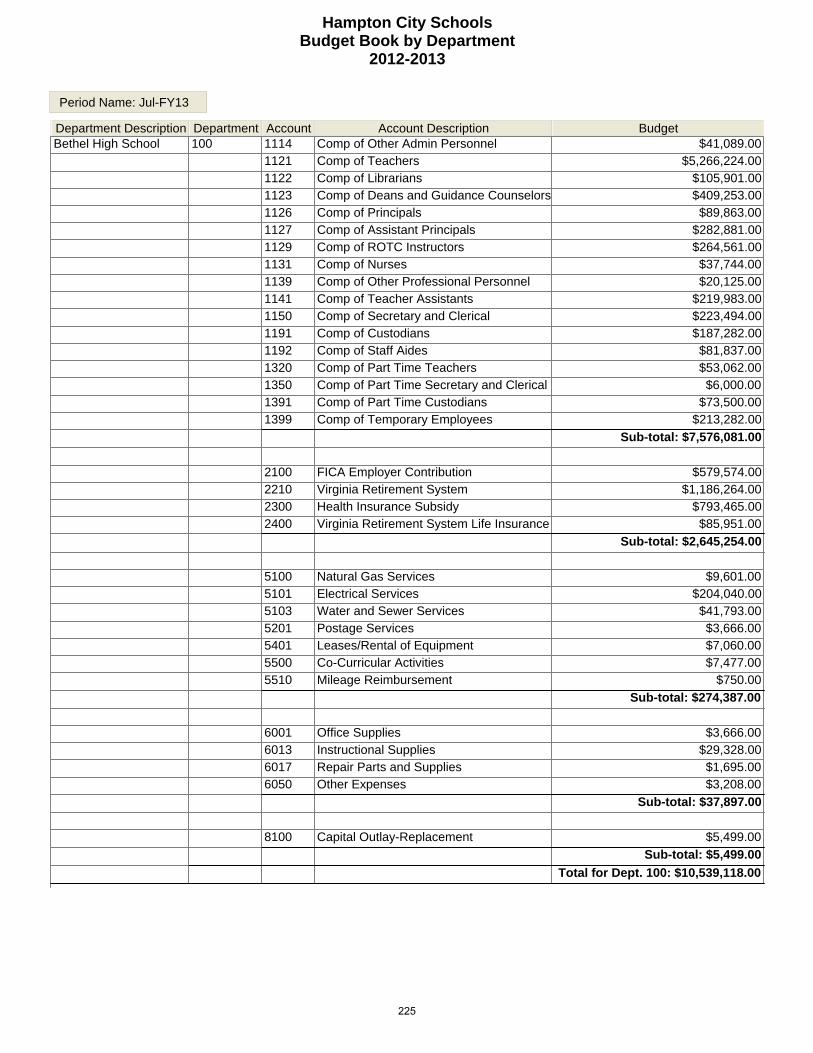
Hampton City SchoolsBudget Book by Department
2012-2013
Period Name: Jul-FY13
Department Description Department Account Account Description BudgetBethel High School 100 1114 Comp of Other Admin Personnel $41,089.00
1121 Comp of Teachers $5,266,224.001122 Comp of Librarians $105,901.001123 Comp of Deans and Guidance Counselors $409,253.001126 Comp of Principals $89,863.001127 Comp of Assistant Principals $282,881.001129 Comp of ROTC Instructors $264,561.001131 Comp of Nurses $37,744.001139 Comp of Other Professional Personnel $20,125.001141 Comp of Teacher Assistants $219,983.001150 Comp of Secretary and Clerical $223,494.001191 Comp of Custodians $187,282.001192 Comp of Staff Aides $81,837.001320 Comp of Part Time Teachers $53,062.001350 Comp of Part Time Secretary and Clerical $6,000.001391 Comp of Part Time Custodians $73,500.001399 Comp of Temporary Employees $213,282.00
Sub-total: $7,576,081.00
2100 FICA Employer Contribution $579,574.002210 Virginia Retirement System $1,186,264.002300 Health Insurance Subsidy $793,465.002400 Virginia Retirement System Life Insurance $85,951.00
Sub-total: $2,645,254.00
5100 Natural Gas Services $9,601.005101 Electrical Services $204,040.005103 Water and Sewer Services $41,793.005201 Postage Services $3,666.005401 Leases/Rental of Equipment $7,060.005500 Co-Curricular Activities $7,477.005510 Mileage Reimbursement $750.00
Sub-total: $274,387.00
6001 Office Supplies $3,666.006013 Instructional Supplies $29,328.006017 Repair Parts and Supplies $1,695.006050 Other Expenses $3,208.00
Sub-total: $37,897.00
8100 Capital Outlay-Replacement $5,499.00
Sub-total: $5,499.00
Total for Dept. 100: $10,539,118.00
225

Hampton City SchoolsBudget Book by Department
2012-2013
Period Name: Jul-FY13
Department Description Department Account Account Description BudgetBooker Elementary 120 1121 Comp of Teachers $1,102,314.00
1122 Comp of Librarians $49,801.001123 Comp of Deans and Guidance Counselors $43,525.001126 Comp of Principals $70,837.001127 Comp of Assistant Principals $56,042.001131 Comp of Nurses $36,293.001141 Comp of Teacher Assistants $130,027.001150 Comp of Secretary and Clerical $35,875.001191 Comp of Custodians $46,717.001343 Comp of Part Time Employees $8,306.001350 Comp of Part Time Secretary and Clerical $6,000.001391 Comp of Part Time Custodians $19,160.001399 Comp of Temporary Employees $10,720.00
Sub-total: $1,615,617.00
2100 FICA Employer Contribution $123,596.002210 Virginia Retirement System $261,176.002300 Health Insurance Subsidy $232,068.002400 Virginia Retirement System Life Insurance $18,675.00
Sub-total: $635,515.00
5101 Electrical Services $40,956.005103 Water and Sewer Services $5,200.005201 Postage Services $350.005510 Mileage Reimbursement $250.00
Sub-total: $46,756.00
6001 Office Supplies $700.006013 Instructional Supplies $6,125.006050 Other Expenses $613.00
Sub-total: $7,438.00
8100 Capital Outlay-Replacement $1,050.00
Sub-total: $1,050.00
Total for Dept. 120: $2,306,376.00
226
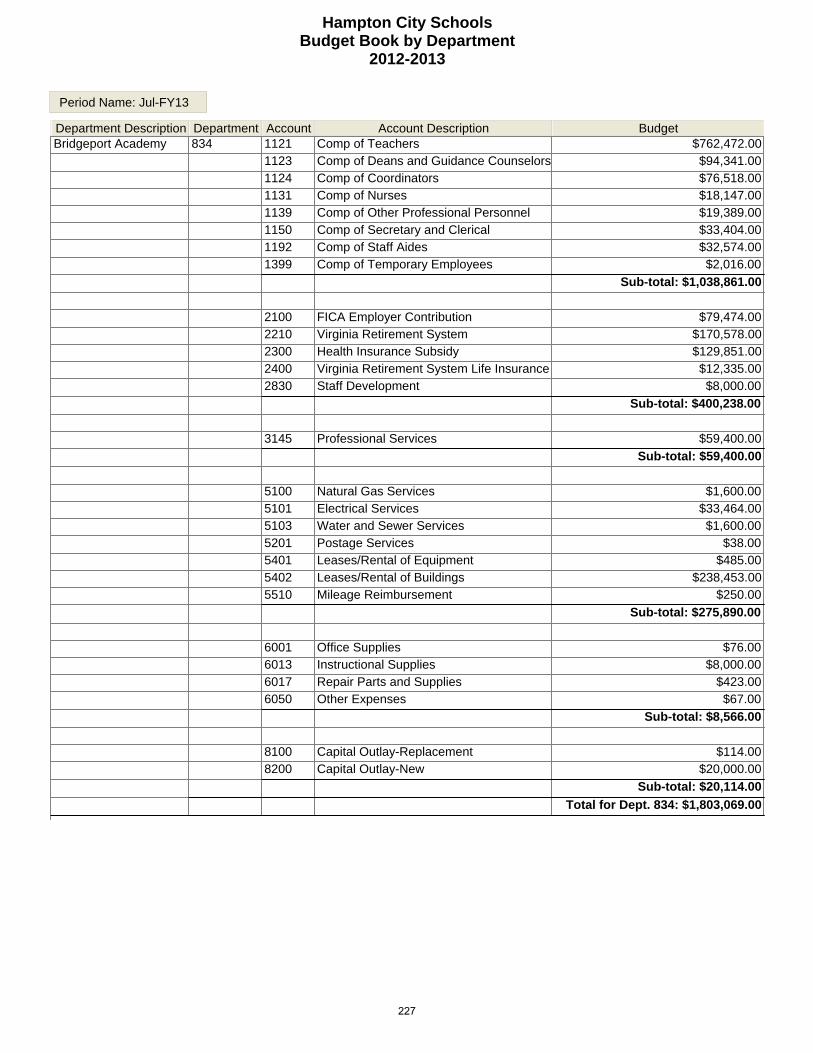
Hampton City SchoolsBudget Book by Department
2012-2013
Period Name: Jul-FY13
Department Description Department Account Account Description BudgetBridgeport Academy 834 1121 Comp of Teachers $762,472.00
1123 Comp of Deans and Guidance Counselors $94,341.001124 Comp of Coordinators $76,518.001131 Comp of Nurses $18,147.001139 Comp of Other Professional Personnel $19,389.001150 Comp of Secretary and Clerical $33,404.001192 Comp of Staff Aides $32,574.001399 Comp of Temporary Employees $2,016.00
Sub-total: $1,038,861.00
2100 FICA Employer Contribution $79,474.002210 Virginia Retirement System $170,578.002300 Health Insurance Subsidy $129,851.002400 Virginia Retirement System Life Insurance $12,335.002830 Staff Development $8,000.00
Sub-total: $400,238.00
3145 Professional Services $59,400.00
Sub-total: $59,400.00
5100 Natural Gas Services $1,600.005101 Electrical Services $33,464.005103 Water and Sewer Services $1,600.005201 Postage Services $38.005401 Leases/Rental of Equipment $485.005402 Leases/Rental of Buildings $238,453.005510 Mileage Reimbursement $250.00
Sub-total: $275,890.00
6001 Office Supplies $76.006013 Instructional Supplies $8,000.006017 Repair Parts and Supplies $423.006050 Other Expenses $67.00
Sub-total: $8,566.00
8100 Capital Outlay-Replacement $114.008200 Capital Outlay-New $20,000.00
Sub-total: $20,114.00
Total for Dept. 834: $1,803,069.00
227

Hampton City SchoolsBudget Book by Department
2012-2013
Period Name: Jul-FY13
Department Description Department Account Account Description BudgetBryan Elementary 140 1121 Comp of Teachers $1,261,057.00
1122 Comp of Librarians $43,220.001123 Comp of Deans and Guidance Counselors $64,866.001126 Comp of Principals $69,586.001127 Comp of Assistant Principals $56,457.001131 Comp of Nurses $35,769.001141 Comp of Teacher Assistants $158,755.001150 Comp of Secretary and Clerical $39,836.001191 Comp of Custodians $42,593.001343 Comp of Part Time Employees $9,520.001350 Comp of Part Time Secretary and Clerical $6,000.001391 Comp of Part Time Custodians $23,050.001399 Comp of Temporary Employees $11,228.00
Sub-total: $1,821,937.00
2100 FICA Employer Contribution $139,379.002210 Virginia Retirement System $287,540.002300 Health Insurance Subsidy $215,027.002400 Virginia Retirement System Life Insurance $21,039.00
Sub-total: $662,985.00
5101 Electrical Services $42,255.005103 Water and Sewer Services $9,500.005201 Postage Services $396.005510 Mileage Reimbursement $250.00
Sub-total: $52,401.00
6001 Office Supplies $792.006013 Instructional Supplies $6,930.006017 Repair Parts and Supplies $446.006050 Other Expenses $693.00
Sub-total: $8,861.00
8100 Capital Outlay-Replacement $1,188.00
Sub-total: $1,188.00
Total for Dept. 140: $2,547,372.00
228

Hampton City SchoolsBudget Book by Department
2012-2013
Period Name: Jul-FY13
Department Description Department Account Account Description BudgetBurbank Elementary 180 1121 Comp of Teachers $1,249,547.00
1122 Comp of Librarians $42,319.001123 Comp of Deans and Guidance Counselors $45,545.001126 Comp of Principals $80,948.001127 Comp of Assistant Principals $57,294.001131 Comp of Nurses $35,722.001141 Comp of Teacher Assistants $156,221.001150 Comp of Secretary and Clerical $36,064.001191 Comp of Custodians $48,467.001343 Comp of Part Time Employees $8,538.001350 Comp of Part Time Secretary and Clerical $6,000.001391 Comp of Part Time Custodians $20,820.001399 Comp of Temporary Employees $14,222.00
Sub-total: $1,801,707.00
2100 FICA Employer Contribution $137,830.002210 Virginia Retirement System $279,385.002300 Health Insurance Subsidy $225,587.002400 Virginia Retirement System Life Insurance $20,804.00
Sub-total: $663,606.00
5100 Natural Gas Services $3,520.005101 Electrical Services $46,950.005103 Water and Sewer Services $5,100.005201 Postage Services $449.005510 Mileage Reimbursement $250.00
Sub-total: $56,269.00
6001 Office Supplies $898.006013 Instructional Supplies $7,858.006050 Other Expenses $786.00
Sub-total: $9,542.00
8100 Capital Outlay-Replacement $1,347.00
Sub-total: $1,347.00
Total for Dept. 180: $2,532,471.00
229
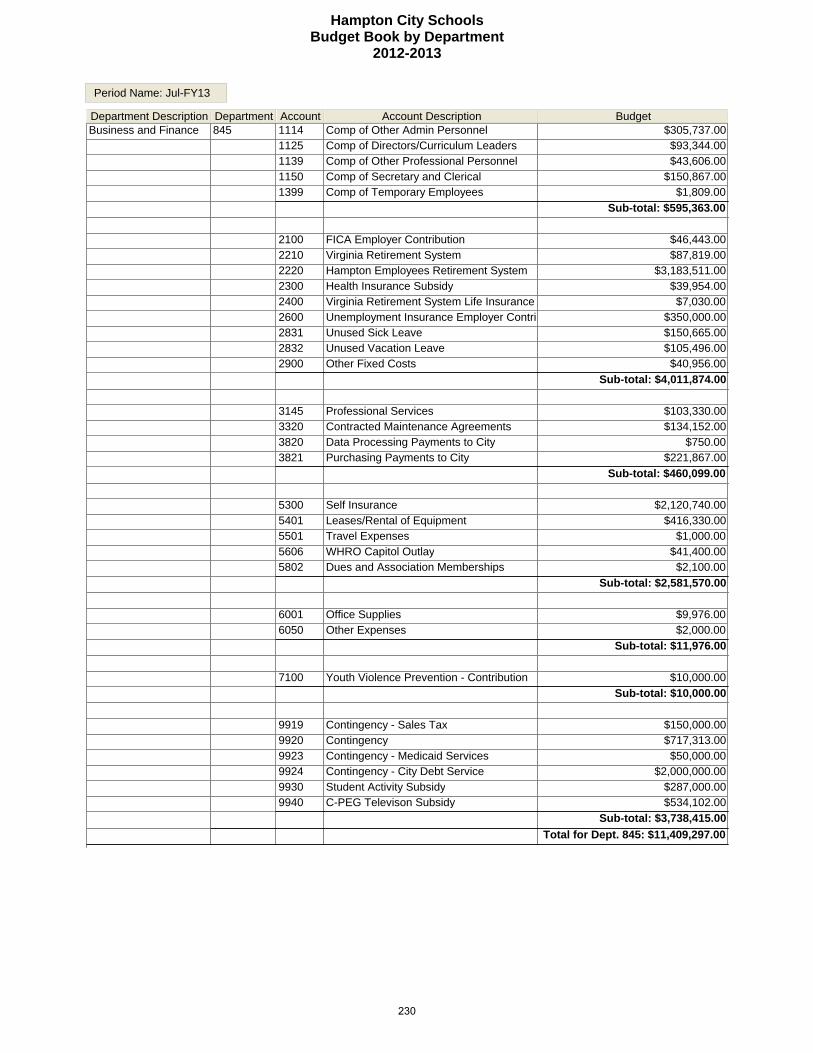
Hampton City SchoolsBudget Book by Department
2012-2013
Period Name: Jul-FY13
Department Description Department Account Account Description BudgetBusiness and Finance 845 1114 Comp of Other Admin Personnel $305,737.00
1125 Comp of Directors/Curriculum Leaders $93,344.001139 Comp of Other Professional Personnel $43,606.001150 Comp of Secretary and Clerical $150,867.001399 Comp of Temporary Employees $1,809.00
Sub-total: $595,363.00
2100 FICA Employer Contribution $46,443.002210 Virginia Retirement System $87,819.002220 Hampton Employees Retirement System $3,183,511.002300 Health Insurance Subsidy $39,954.002400 Virginia Retirement System Life Insurance $7,030.002600 Unemployment Insurance Employer Contrib $350,000.002831 Unused Sick Leave $150,665.002832 Unused Vacation Leave $105,496.002900 Other Fixed Costs $40,956.00
Sub-total: $4,011,874.00
3145 Professional Services $103,330.003320 Contracted Maintenance Agreements $134,152.003820 Data Processing Payments to City $750.003821 Purchasing Payments to City $221,867.00
Sub-total: $460,099.00
5300 Self Insurance $2,120,740.005401 Leases/Rental of Equipment $416,330.005501 Travel Expenses $1,000.005606 WHRO Capitol Outlay $41,400.005802 Dues and Association Memberships $2,100.00
Sub-total: $2,581,570.00
6001 Office Supplies $9,976.006050 Other Expenses $2,000.00
Sub-total: $11,976.00
7100 Youth Violence Prevention - Contribution $10,000.00
Sub-total: $10,000.00
9919 Contingency - Sales Tax $150,000.009920 Contingency $717,313.009923 Contingency - Medicaid Services $50,000.009924 Contingency - City Debt Service $2,000,000.009930 Student Activity Subsidy $287,000.009940 C-PEG Televison Subsidy $534,102.00
Sub-total: $3,738,415.00
Total for Dept. 845: $11,409,297.00
230
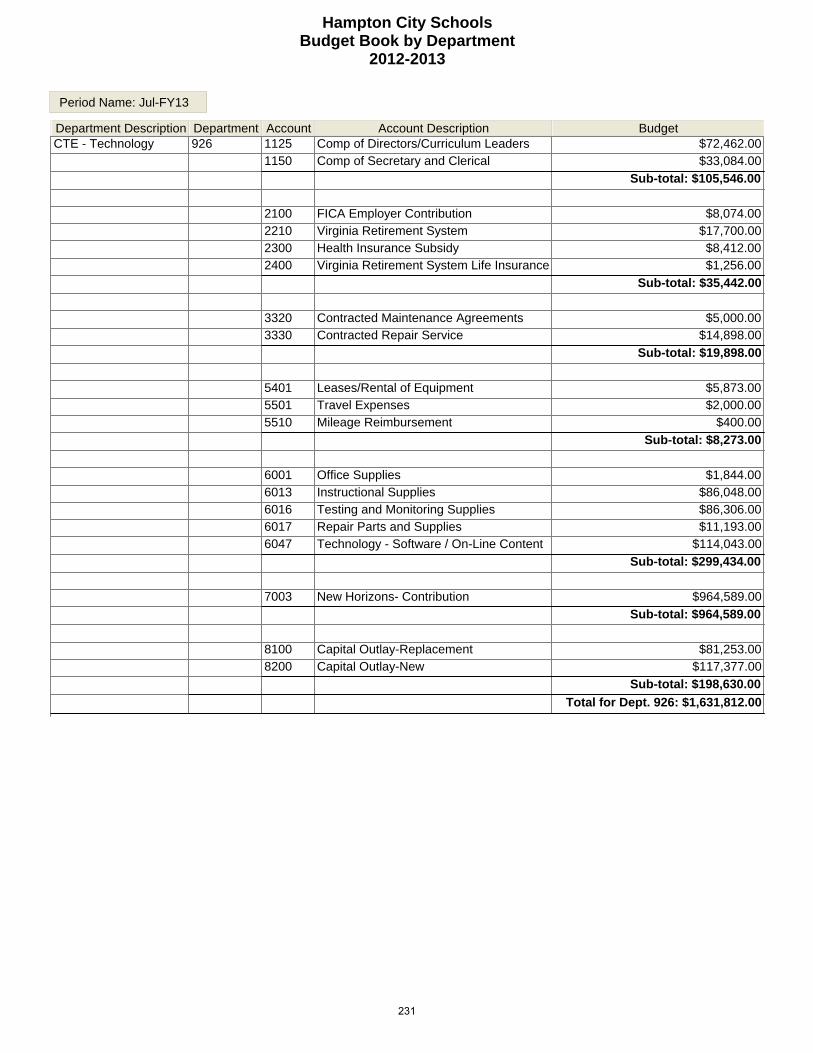
Hampton City SchoolsBudget Book by Department
2012-2013
Period Name: Jul-FY13
Department Description Department Account Account Description BudgetCTE - Technology 926 1125 Comp of Directors/Curriculum Leaders $72,462.00
1150 Comp of Secretary and Clerical $33,084.00
Sub-total: $105,546.00
2100 FICA Employer Contribution $8,074.002210 Virginia Retirement System $17,700.002300 Health Insurance Subsidy $8,412.002400 Virginia Retirement System Life Insurance $1,256.00
Sub-total: $35,442.00
3320 Contracted Maintenance Agreements $5,000.003330 Contracted Repair Service $14,898.00
Sub-total: $19,898.00
5401 Leases/Rental of Equipment $5,873.005501 Travel Expenses $2,000.005510 Mileage Reimbursement $400.00
Sub-total: $8,273.00
6001 Office Supplies $1,844.006013 Instructional Supplies $86,048.006016 Testing and Monitoring Supplies $86,306.006017 Repair Parts and Supplies $11,193.006047 Technology - Software / On-Line Content $114,043.00
Sub-total: $299,434.00
7003 New Horizons- Contribution $964,589.00
Sub-total: $964,589.00
8100 Capital Outlay-Replacement $81,253.008200 Capital Outlay-New $117,377.00
Sub-total: $198,630.00
Total for Dept. 926: $1,631,812.00
231

Hampton City SchoolsBudget Book by Department
2012-2013
Period Name: Jul-FY13
Department Description Department Account Account Description BudgetCary Elementary 200 1121 Comp of Teachers $1,349,211.00
1122 Comp of Librarians $41,205.001123 Comp of Deans and Guidance Counselors $44,535.001126 Comp of Principals $78,370.001127 Comp of Assistant Principals $59,946.001131 Comp of Nurses $36,118.001141 Comp of Teacher Assistants $157,135.001150 Comp of Secretary and Clerical $32,914.001191 Comp of Custodians $48,266.001343 Comp of Part Time Employees $8,802.001350 Comp of Part Time Secretary and Clerical $6,000.001391 Comp of Part Time Custodians $11,160.001399 Comp of Temporary Employees $18,091.00
Sub-total: $1,891,753.00
2100 FICA Employer Contribution $144,719.002210 Virginia Retirement System $302,462.002300 Health Insurance Subsidy $217,677.002400 Virginia Retirement System Life Insurance $21,965.00
Sub-total: $686,823.00
5101 Electrical Services $41,755.005103 Water and Sewer Services $4,300.005201 Postage Services $303.005510 Mileage Reimbursement $250.00
Sub-total: $46,608.00
6001 Office Supplies $606.006013 Instructional Supplies $5,303.006050 Other Expenses $530.00
Sub-total: $6,439.00
8100 Capital Outlay-Replacement $909.00
Sub-total: $909.00
Total for Dept. 200: $2,632,532.00
232

Hampton City SchoolsBudget Book by Department
2012-2013
Period Name: Jul-FY13
Department Description Department Account Account Description BudgetCommunity - LegislativeRelations
896 1125 Comp of Directors/Curriculum Leaders $69,015.00
Sub-total: $69,015.00
2100 FICA Employer Contribution $5,280.002210 Virginia Retirement System $11,373.002300 Health Insurance Subsidy $11,116.002400 Virginia Retirement System Life Insurance $807.00
Sub-total: $28,576.00
3822 Partnership Payments to City $23,100.00
Sub-total: $23,100.00
5501 Travel Expenses $3,499.005510 Mileage Reimbursement $852.005802 Dues and Association Memberships $8,000.00
Sub-total: $12,351.00
6050 Other Expenses $815.00
Sub-total: $815.00
Total for Dept. 896: $133,857.00
233

Hampton City SchoolsBudget Book by Department
2012-2013
Period Name: Jul-FY13
Department Description Department Account Account Description BudgetCooper Elementary 210 1121 Comp of Teachers $1,163,105.00
1122 Comp of Librarians $53,689.001123 Comp of Deans and Guidance Counselors $58,999.001126 Comp of Principals $71,034.001127 Comp of Assistant Principals $49,173.001131 Comp of Nurses $39,567.001141 Comp of Teacher Assistants $112,275.001150 Comp of Secretary and Clerical $33,393.001191 Comp of Custodians $54,865.001343 Comp of Part Time Employees $9,283.001350 Comp of Part Time Secretary and Clerical $6,000.001391 Comp of Part Time Custodians $20,760.001399 Comp of Temporary Employees $17,520.00
Sub-total: $1,689,663.00
2100 FICA Employer Contribution $129,257.002210 Virginia Retirement System $266,908.002300 Health Insurance Subsidy $111,527.002400 Virginia Retirement System Life Insurance $19,436.00
Sub-total: $527,128.00
5101 Electrical Services $54,142.005103 Water and Sewer Services $4,900.005201 Postage Services $419.005510 Mileage Reimbursement $250.00
Sub-total: $59,711.00
6001 Office Supplies $838.006013 Instructional Supplies $7,333.006050 Other Expenses $733.00
Sub-total: $8,904.00
8100 Capital Outlay-Replacement $1,257.00
Sub-total: $1,257.00
Total for Dept. 210: $2,286,663.00
234
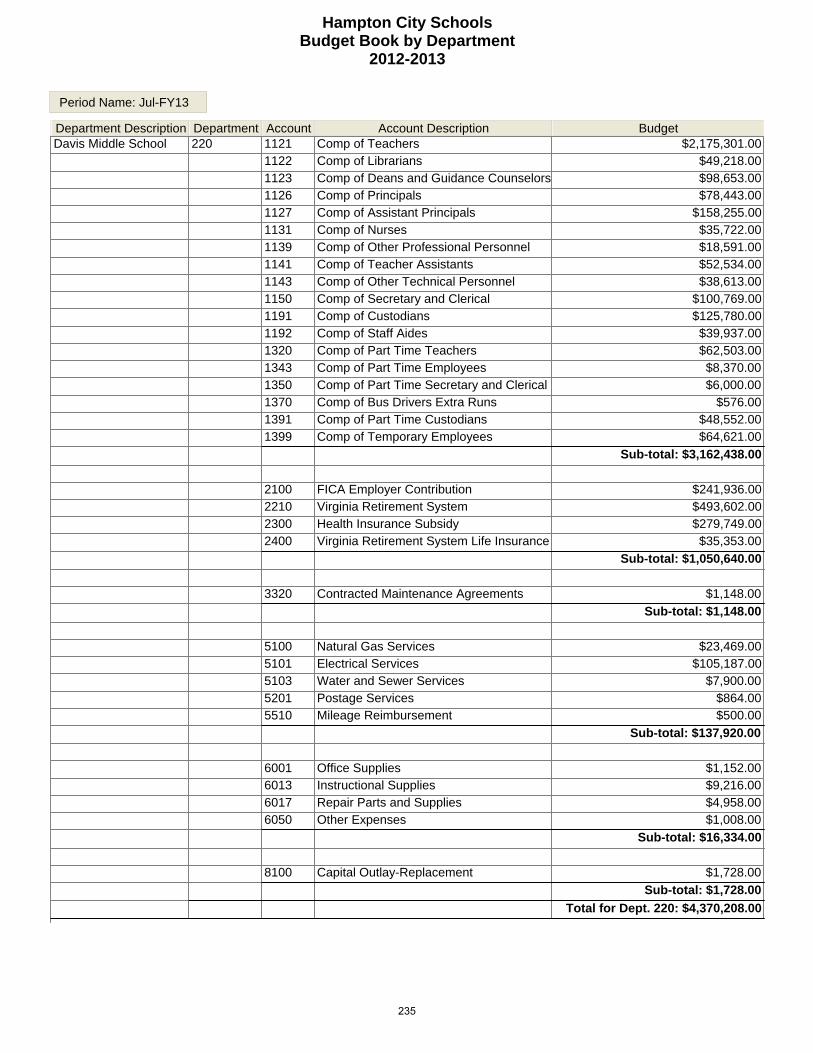
Hampton City SchoolsBudget Book by Department
2012-2013
Period Name: Jul-FY13
Department Description Department Account Account Description BudgetDavis Middle School 220 1121 Comp of Teachers $2,175,301.00
1122 Comp of Librarians $49,218.001123 Comp of Deans and Guidance Counselors $98,653.001126 Comp of Principals $78,443.001127 Comp of Assistant Principals $158,255.001131 Comp of Nurses $35,722.001139 Comp of Other Professional Personnel $18,591.001141 Comp of Teacher Assistants $52,534.001143 Comp of Other Technical Personnel $38,613.001150 Comp of Secretary and Clerical $100,769.001191 Comp of Custodians $125,780.001192 Comp of Staff Aides $39,937.001320 Comp of Part Time Teachers $62,503.001343 Comp of Part Time Employees $8,370.001350 Comp of Part Time Secretary and Clerical $6,000.001370 Comp of Bus Drivers Extra Runs $576.001391 Comp of Part Time Custodians $48,552.001399 Comp of Temporary Employees $64,621.00
Sub-total: $3,162,438.00
2100 FICA Employer Contribution $241,936.002210 Virginia Retirement System $493,602.002300 Health Insurance Subsidy $279,749.002400 Virginia Retirement System Life Insurance $35,353.00
Sub-total: $1,050,640.00
3320 Contracted Maintenance Agreements $1,148.00
Sub-total: $1,148.00
5100 Natural Gas Services $23,469.005101 Electrical Services $105,187.005103 Water and Sewer Services $7,900.005201 Postage Services $864.005510 Mileage Reimbursement $500.00
Sub-total: $137,920.00
6001 Office Supplies $1,152.006013 Instructional Supplies $9,216.006017 Repair Parts and Supplies $4,958.006050 Other Expenses $1,008.00
Sub-total: $16,334.00
8100 Capital Outlay-Replacement $1,728.00
Sub-total: $1,728.00
Total for Dept. 220: $4,370,208.00
235
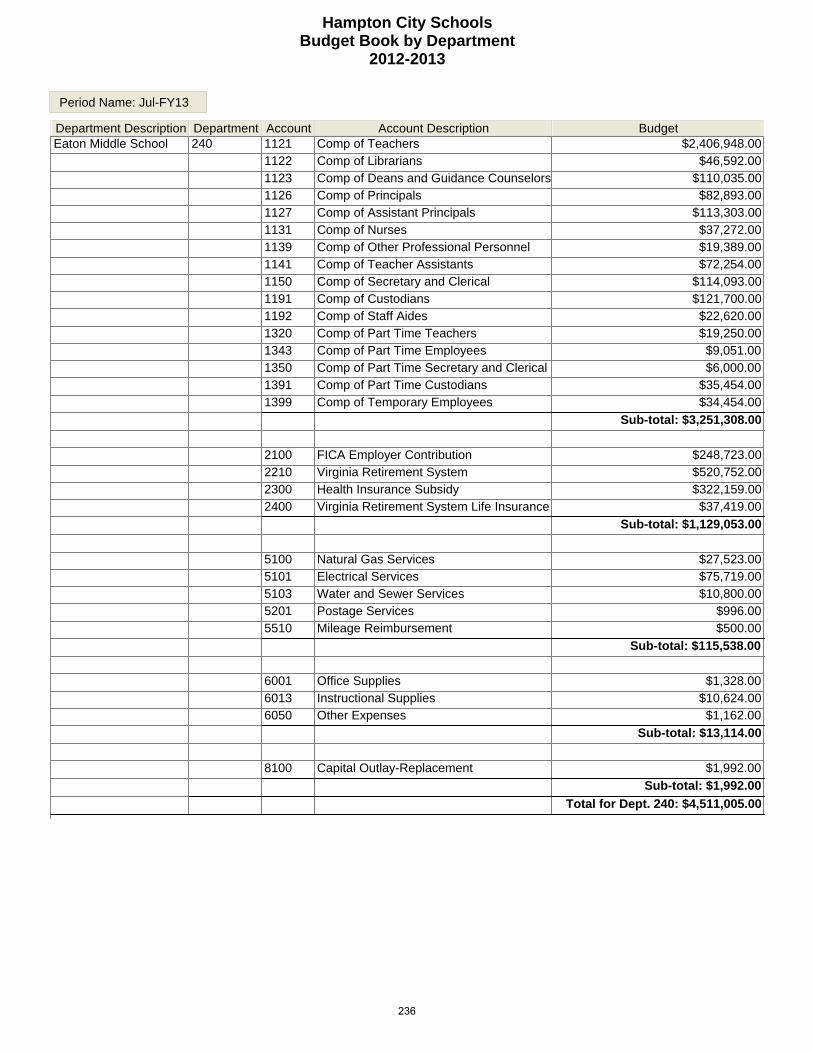
Hampton City SchoolsBudget Book by Department
2012-2013
Period Name: Jul-FY13
Department Description Department Account Account Description BudgetEaton Middle School 240 1121 Comp of Teachers $2,406,948.00
1122 Comp of Librarians $46,592.001123 Comp of Deans and Guidance Counselors $110,035.001126 Comp of Principals $82,893.001127 Comp of Assistant Principals $113,303.001131 Comp of Nurses $37,272.001139 Comp of Other Professional Personnel $19,389.001141 Comp of Teacher Assistants $72,254.001150 Comp of Secretary and Clerical $114,093.001191 Comp of Custodians $121,700.001192 Comp of Staff Aides $22,620.001320 Comp of Part Time Teachers $19,250.001343 Comp of Part Time Employees $9,051.001350 Comp of Part Time Secretary and Clerical $6,000.001391 Comp of Part Time Custodians $35,454.001399 Comp of Temporary Employees $34,454.00
Sub-total: $3,251,308.00
2100 FICA Employer Contribution $248,723.002210 Virginia Retirement System $520,752.002300 Health Insurance Subsidy $322,159.002400 Virginia Retirement System Life Insurance $37,419.00
Sub-total: $1,129,053.00
5100 Natural Gas Services $27,523.005101 Electrical Services $75,719.005103 Water and Sewer Services $10,800.005201 Postage Services $996.005510 Mileage Reimbursement $500.00
Sub-total: $115,538.00
6001 Office Supplies $1,328.006013 Instructional Supplies $10,624.006050 Other Expenses $1,162.00
Sub-total: $13,114.00
8100 Capital Outlay-Replacement $1,992.00
Sub-total: $1,992.00
Total for Dept. 240: $4,511,005.00
236

Hampton City SchoolsBudget Book by Department
2012-2013
Period Name: Jul-FY13
Department Description Department Account Account Description BudgetElementary & Title I 920 1125 Comp of Directors/Curriculum Leaders $33,857.00
1150 Comp of Secretary and Clerical $10,575.00
Sub-total: $44,432.00
2100 FICA Employer Contribution $3,399.002210 Virginia Retirement System $7,250.002300 Health Insurance Subsidy $1,262.002400 Virginia Retirement System Life Insurance $515.00
Sub-total: $12,426.00
Total for Dept. 920: $56,858.00
237
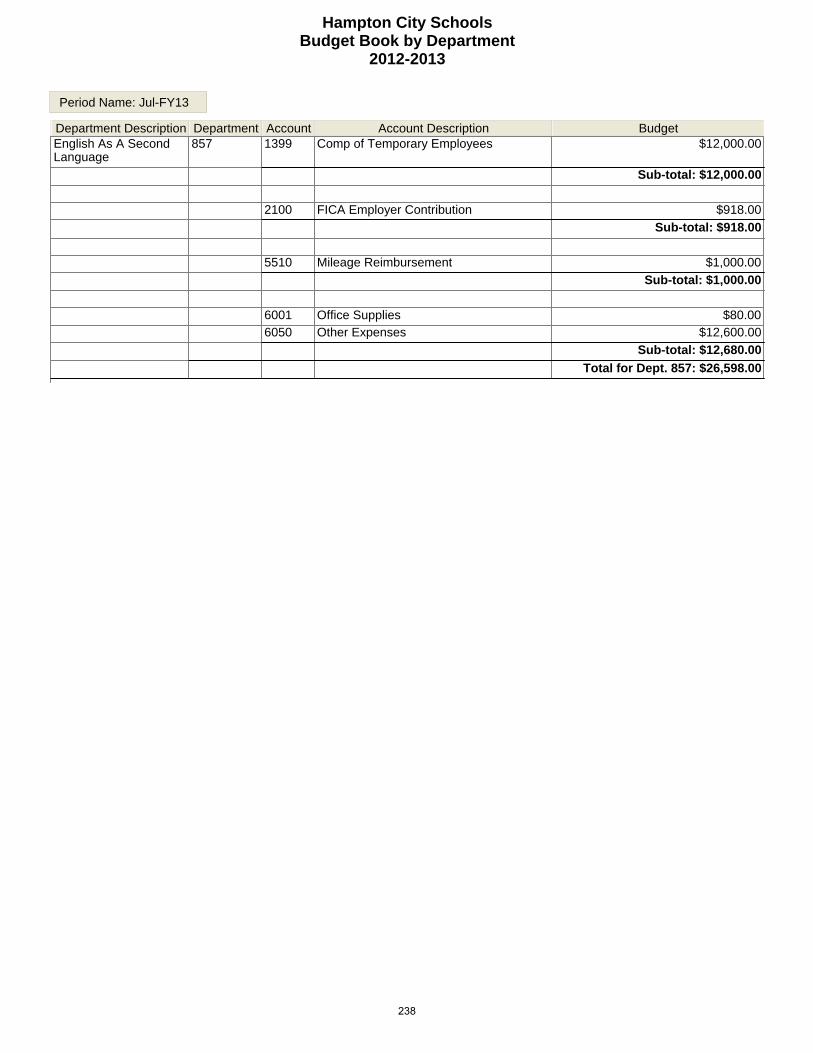
Hampton City SchoolsBudget Book by Department
2012-2013
Period Name: Jul-FY13
Department Description Department Account Account Description BudgetEnglish As A Second Language
857 1399 Comp of Temporary Employees $12,000.00
Sub-total: $12,000.00
2100 FICA Employer Contribution $918.00
Sub-total: $918.00
5510 Mileage Reimbursement $1,000.00
Sub-total: $1,000.00
6001 Office Supplies $80.006050 Other Expenses $12,600.00
Sub-total: $12,680.00
Total for Dept. 857: $26,598.00
238

Hampton City SchoolsBudget Book by Department
2012-2013
Period Name: Jul-FY13
Department Description Department Account Account Description BudgetEnglish/Language Arts 852 1125 Comp of Directors/Curriculum Leaders $69,823.00
1139 Comp of Other Professional Personnel $184,468.001150 Comp of Secretary and Clerical $43,673.001342 Comp of Part Time Teacher Assistants $295,950.001399 Comp of Temporary Employees $1,000.00
Sub-total: $594,914.00
2100 FICA Employer Contribution $45,511.002210 Virginia Retirement System $49,835.002300 Health Insurance Subsidy $33,194.002400 Virginia Retirement System Life Insurance $3,536.00
Sub-total: $132,076.00
5510 Mileage Reimbursement $1,399.00
Sub-total: $1,399.00
6001 Office Supplies $3,500.006013 Instructional Supplies $46,500.006047 Technology - Software / On-Line Content $78,750.006050 Other Expenses $1,000.00
Sub-total: $129,750.00
Total for Dept. 852: $858,139.00
239
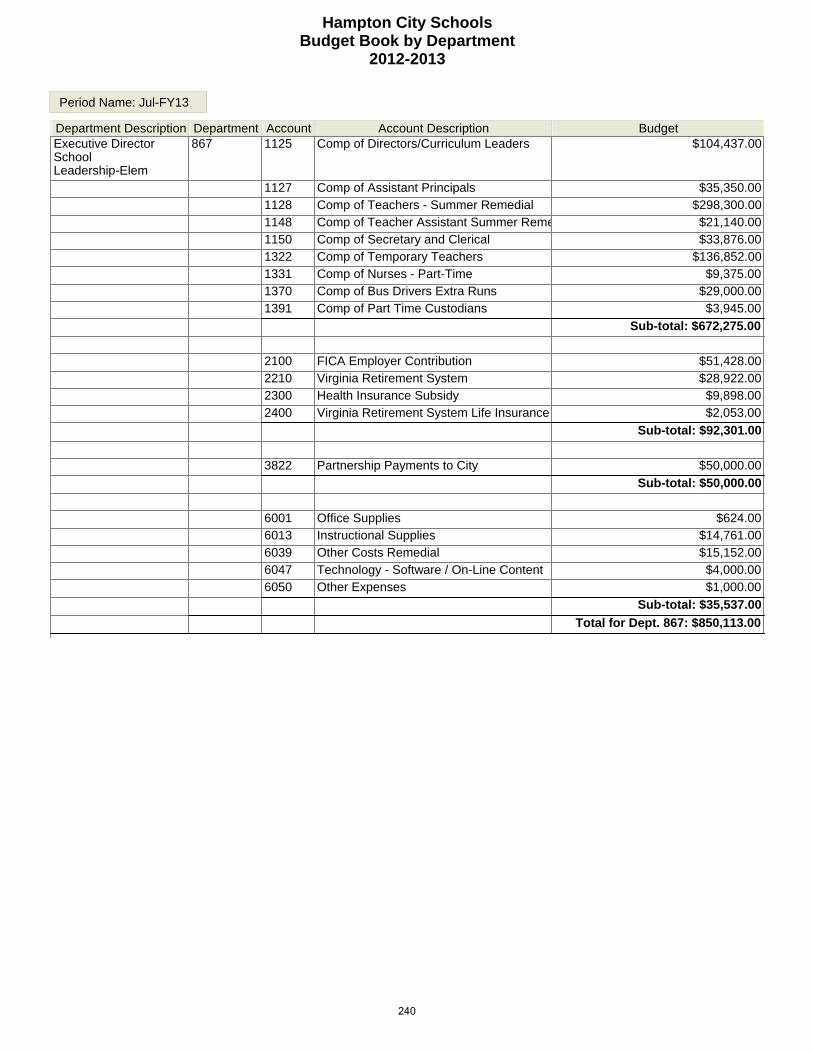
Hampton City SchoolsBudget Book by Department
2012-2013
Period Name: Jul-FY13
Department Description Department Account Account Description BudgetExecutive Director School Leadership-Elem
867 1125 Comp of Directors/Curriculum Leaders $104,437.00
1127 Comp of Assistant Principals $35,350.001128 Comp of Teachers - Summer Remedial $298,300.001148 Comp of Teacher Assistant Summer Reme $21,140.001150 Comp of Secretary and Clerical $33,876.001322 Comp of Temporary Teachers $136,852.001331 Comp of Nurses - Part-Time $9,375.001370 Comp of Bus Drivers Extra Runs $29,000.001391 Comp of Part Time Custodians $3,945.00
Sub-total: $672,275.00
2100 FICA Employer Contribution $51,428.002210 Virginia Retirement System $28,922.002300 Health Insurance Subsidy $9,898.002400 Virginia Retirement System Life Insurance $2,053.00
Sub-total: $92,301.00
3822 Partnership Payments to City $50,000.00
Sub-total: $50,000.00
6001 Office Supplies $624.006013 Instructional Supplies $14,761.006039 Other Costs Remedial $15,152.006047 Technology - Software / On-Line Content $4,000.006050 Other Expenses $1,000.00
Sub-total: $35,537.00
Total for Dept. 867: $850,113.00
240
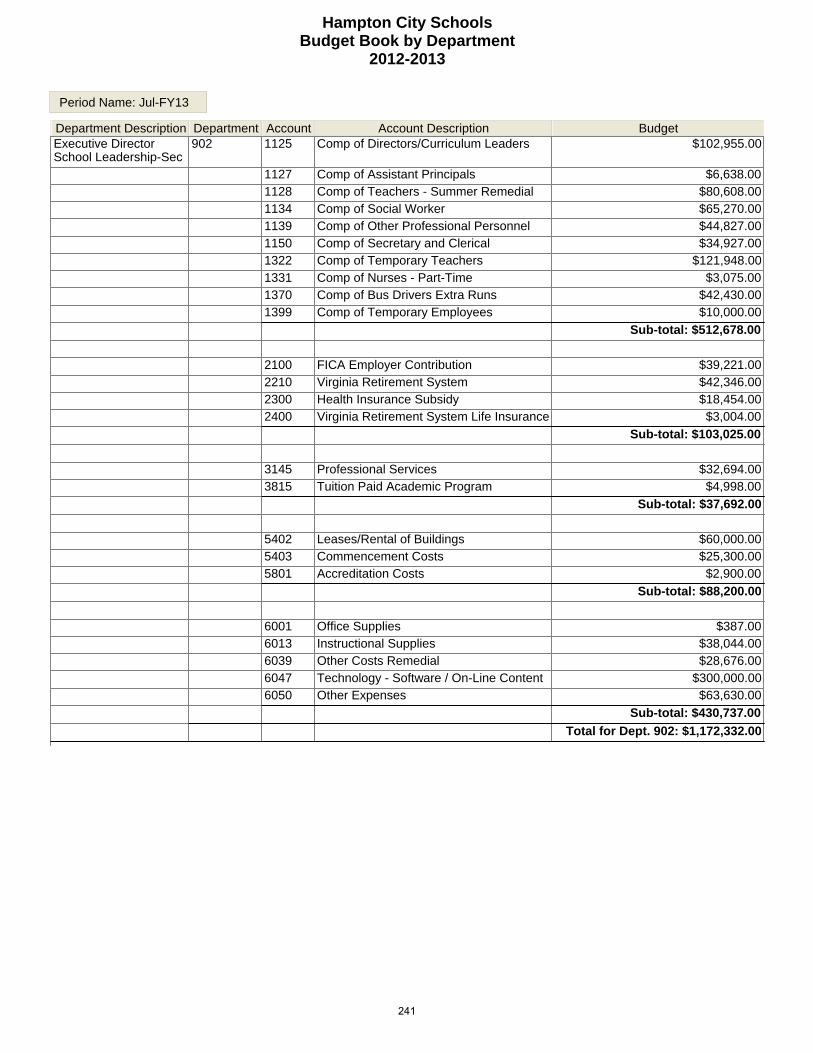
Hampton City SchoolsBudget Book by Department
2012-2013
Period Name: Jul-FY13
Department Description Department Account Account Description BudgetExecutive Director School Leadership-Sec
902 1125 Comp of Directors/Curriculum Leaders $102,955.00
1127 Comp of Assistant Principals $6,638.001128 Comp of Teachers - Summer Remedial $80,608.001134 Comp of Social Worker $65,270.001139 Comp of Other Professional Personnel $44,827.001150 Comp of Secretary and Clerical $34,927.001322 Comp of Temporary Teachers $121,948.001331 Comp of Nurses - Part-Time $3,075.001370 Comp of Bus Drivers Extra Runs $42,430.001399 Comp of Temporary Employees $10,000.00
Sub-total: $512,678.00
2100 FICA Employer Contribution $39,221.002210 Virginia Retirement System $42,346.002300 Health Insurance Subsidy $18,454.002400 Virginia Retirement System Life Insurance $3,004.00
Sub-total: $103,025.00
3145 Professional Services $32,694.003815 Tuition Paid Academic Program $4,998.00
Sub-total: $37,692.00
5402 Leases/Rental of Buildings $60,000.005403 Commencement Costs $25,300.005801 Accreditation Costs $2,900.00
Sub-total: $88,200.00
6001 Office Supplies $387.006013 Instructional Supplies $38,044.006039 Other Costs Remedial $28,676.006047 Technology - Software / On-Line Content $300,000.006050 Other Expenses $63,630.00
Sub-total: $430,737.00
Total for Dept. 902: $1,172,332.00
241

Hampton City SchoolsBudget Book by Department
2012-2013
Period Name: Jul-FY13
Department Description Department Account Account Description BudgetFamily Life Education 854 6013 Instructional Supplies $10,900.00
Sub-total: $10,900.00
Total for Dept. 854: $10,900.00
242
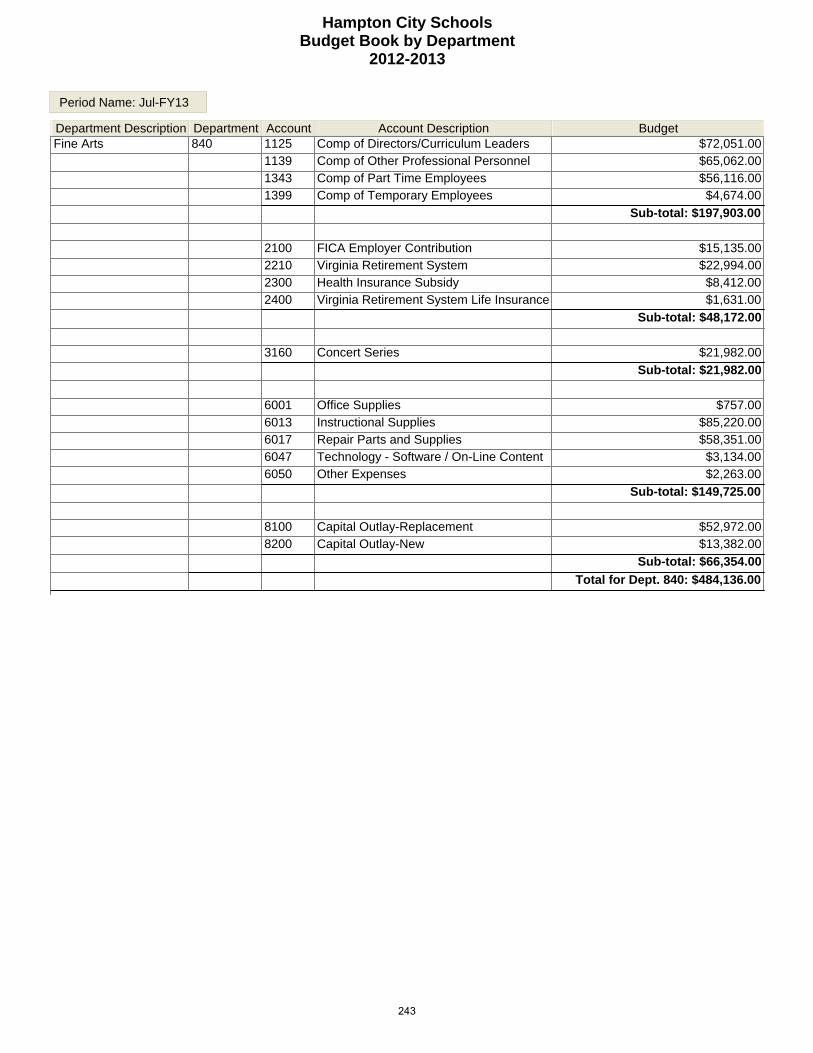
Hampton City SchoolsBudget Book by Department
2012-2013
Period Name: Jul-FY13
Department Description Department Account Account Description BudgetFine Arts 840 1125 Comp of Directors/Curriculum Leaders $72,051.00
1139 Comp of Other Professional Personnel $65,062.001343 Comp of Part Time Employees $56,116.001399 Comp of Temporary Employees $4,674.00
Sub-total: $197,903.00
2100 FICA Employer Contribution $15,135.002210 Virginia Retirement System $22,994.002300 Health Insurance Subsidy $8,412.002400 Virginia Retirement System Life Insurance $1,631.00
Sub-total: $48,172.00
3160 Concert Series $21,982.00
Sub-total: $21,982.00
6001 Office Supplies $757.006013 Instructional Supplies $85,220.006017 Repair Parts and Supplies $58,351.006047 Technology - Software / On-Line Content $3,134.006050 Other Expenses $2,263.00
Sub-total: $149,725.00
8100 Capital Outlay-Replacement $52,972.008200 Capital Outlay-New $13,382.00
Sub-total: $66,354.00
Total for Dept. 840: $484,136.00
243
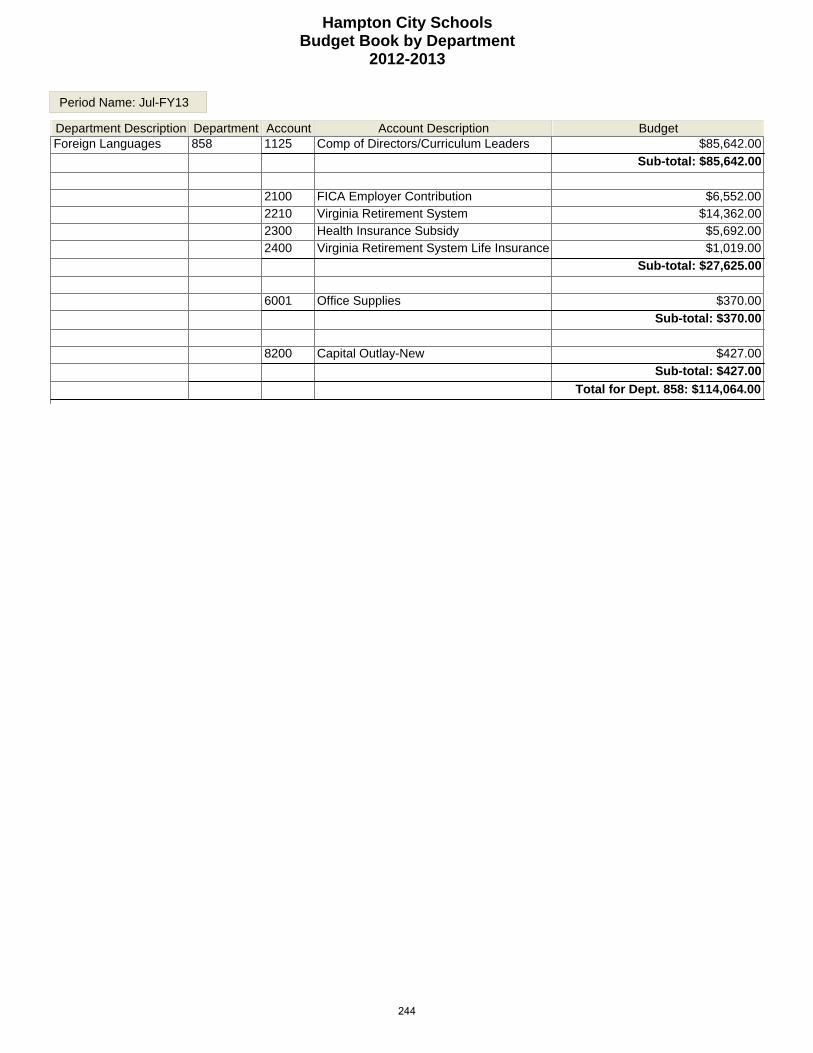
Hampton City SchoolsBudget Book by Department
2012-2013
Period Name: Jul-FY13
Department Description Department Account Account Description BudgetForeign Languages 858 1125 Comp of Directors/Curriculum Leaders $85,642.00
Sub-total: $85,642.00
2100 FICA Employer Contribution $6,552.002210 Virginia Retirement System $14,362.002300 Health Insurance Subsidy $5,692.002400 Virginia Retirement System Life Insurance $1,019.00
Sub-total: $27,625.00
6001 Office Supplies $370.00
Sub-total: $370.00
8200 Capital Outlay-New $427.00
Sub-total: $427.00
Total for Dept. 858: $114,064.00
244
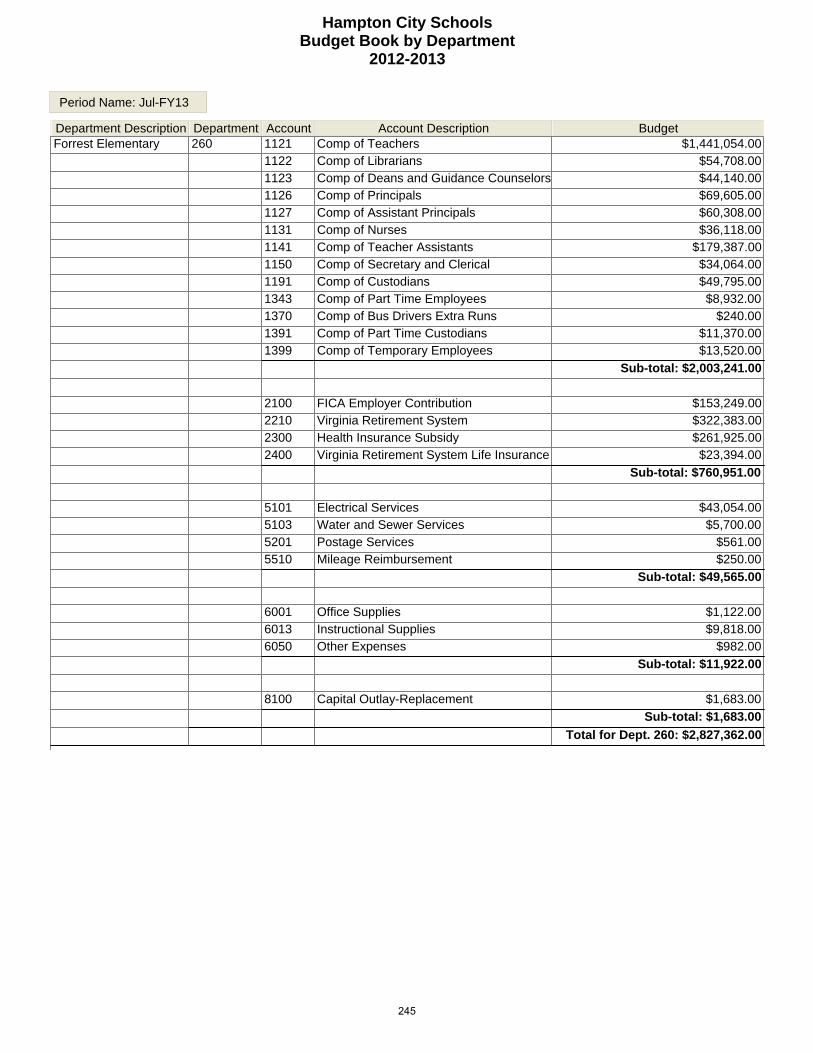
Hampton City SchoolsBudget Book by Department
2012-2013
Period Name: Jul-FY13
Department Description Department Account Account Description BudgetForrest Elementary 260 1121 Comp of Teachers $1,441,054.00
1122 Comp of Librarians $54,708.001123 Comp of Deans and Guidance Counselors $44,140.001126 Comp of Principals $69,605.001127 Comp of Assistant Principals $60,308.001131 Comp of Nurses $36,118.001141 Comp of Teacher Assistants $179,387.001150 Comp of Secretary and Clerical $34,064.001191 Comp of Custodians $49,795.001343 Comp of Part Time Employees $8,932.001370 Comp of Bus Drivers Extra Runs $240.001391 Comp of Part Time Custodians $11,370.001399 Comp of Temporary Employees $13,520.00
Sub-total: $2,003,241.00
2100 FICA Employer Contribution $153,249.002210 Virginia Retirement System $322,383.002300 Health Insurance Subsidy $261,925.002400 Virginia Retirement System Life Insurance $23,394.00
Sub-total: $760,951.00
5101 Electrical Services $43,054.005103 Water and Sewer Services $5,700.005201 Postage Services $561.005510 Mileage Reimbursement $250.00
Sub-total: $49,565.00
6001 Office Supplies $1,122.006013 Instructional Supplies $9,818.006050 Other Expenses $982.00
Sub-total: $11,922.00
8100 Capital Outlay-Replacement $1,683.00
Sub-total: $1,683.00
Total for Dept. 260: $2,827,362.00
245
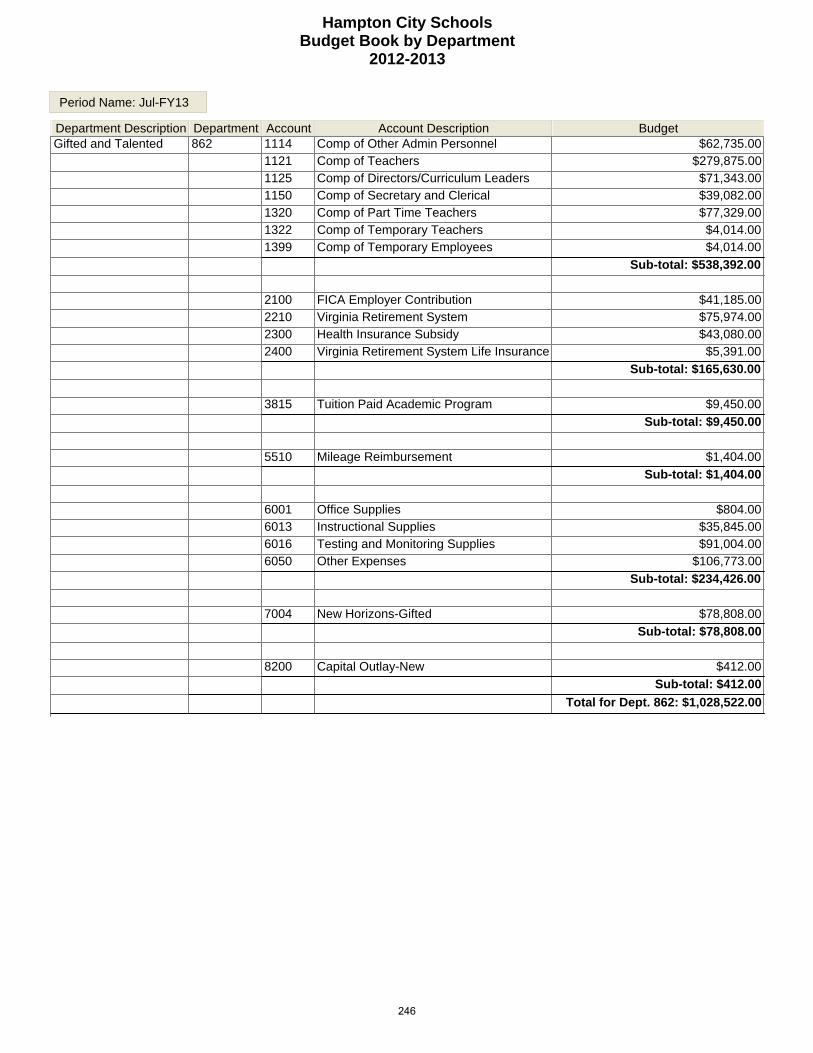
Hampton City SchoolsBudget Book by Department
2012-2013
Period Name: Jul-FY13
Department Description Department Account Account Description BudgetGifted and Talented 862 1114 Comp of Other Admin Personnel $62,735.00
1121 Comp of Teachers $279,875.001125 Comp of Directors/Curriculum Leaders $71,343.001150 Comp of Secretary and Clerical $39,082.001320 Comp of Part Time Teachers $77,329.001322 Comp of Temporary Teachers $4,014.001399 Comp of Temporary Employees $4,014.00
Sub-total: $538,392.00
2100 FICA Employer Contribution $41,185.002210 Virginia Retirement System $75,974.002300 Health Insurance Subsidy $43,080.002400 Virginia Retirement System Life Insurance $5,391.00
Sub-total: $165,630.00
3815 Tuition Paid Academic Program $9,450.00
Sub-total: $9,450.00
5510 Mileage Reimbursement $1,404.00
Sub-total: $1,404.00
6001 Office Supplies $804.006013 Instructional Supplies $35,845.006016 Testing and Monitoring Supplies $91,004.006050 Other Expenses $106,773.00
Sub-total: $234,426.00
7004 New Horizons-Gifted $78,808.00
Sub-total: $78,808.00
8200 Capital Outlay-New $412.00
Sub-total: $412.00
Total for Dept. 862: $1,028,522.00
246
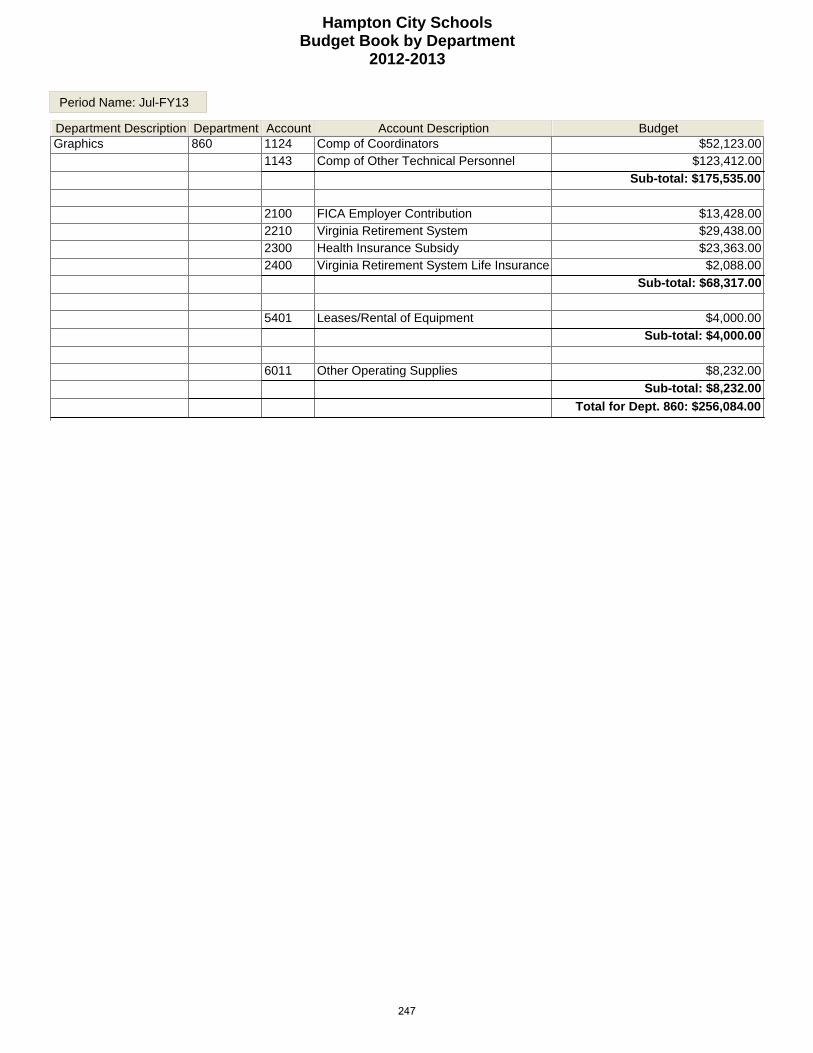
Hampton City SchoolsBudget Book by Department
2012-2013
Period Name: Jul-FY13
Department Description Department Account Account Description BudgetGraphics 860 1124 Comp of Coordinators $52,123.00
1143 Comp of Other Technical Personnel $123,412.00
Sub-total: $175,535.00
2100 FICA Employer Contribution $13,428.002210 Virginia Retirement System $29,438.002300 Health Insurance Subsidy $23,363.002400 Virginia Retirement System Life Insurance $2,088.00
Sub-total: $68,317.00
5401 Leases/Rental of Equipment $4,000.00
Sub-total: $4,000.00
6011 Other Operating Supplies $8,232.00
Sub-total: $8,232.00
Total for Dept. 860: $256,084.00
247

Hampton City SchoolsBudget Book by Department
2012-2013
Period Name: Jul-FY13
Department Description Department Account Account Description BudgetHampton High School 300 1114 Comp of Other Admin Personnel $53,766.00
1121 Comp of Teachers $4,727,320.001122 Comp of Librarians $100,898.001123 Comp of Deans and Guidance Counselors $462,888.001126 Comp of Principals $91,783.001127 Comp of Assistant Principals $267,745.001129 Comp of ROTC Instructors $151,381.001131 Comp of Nurses $35,765.001139 Comp of Other Professional Personnel $19,389.001141 Comp of Teacher Assistants $226,016.001150 Comp of Secretary and Clerical $197,169.001191 Comp of Custodians $192,521.001192 Comp of Staff Aides $93,127.001320 Comp of Part Time Teachers $19,538.001350 Comp of Part Time Secretary and Clerical $6,000.001370 Comp of Bus Drivers Extra Runs $11,357.001391 Comp of Part Time Custodians $74,128.001399 Comp of Temporary Employees $234,016.00
Sub-total: $6,964,807.00
2100 FICA Employer Contribution $532,822.002210 Virginia Retirement System $1,070,256.002300 Health Insurance Subsidy $654,193.002400 Virginia Retirement System Life Insurance $78,688.00
Sub-total: $2,335,959.00
3320 Contracted Maintenance Agreements $1,296.00
Sub-total: $1,296.00
5100 Natural Gas Services $45,552.005101 Electrical Services $192,794.005103 Water and Sewer Services $29,199.005201 Postage Services $3,254.005401 Leases/Rental of Equipment $5,683.005500 Co-Curricular Activities $4,746.005510 Mileage Reimbursement $750.00
Sub-total: $281,978.00
6001 Office Supplies $3,254.006013 Instructional Supplies $26,032.006050 Other Expenses $2,847.00
Sub-total: $32,133.00
8100 Capital Outlay-Replacement $4,881.00
Sub-total: $4,881.00
Total for Dept. 300: $9,621,054.00
248
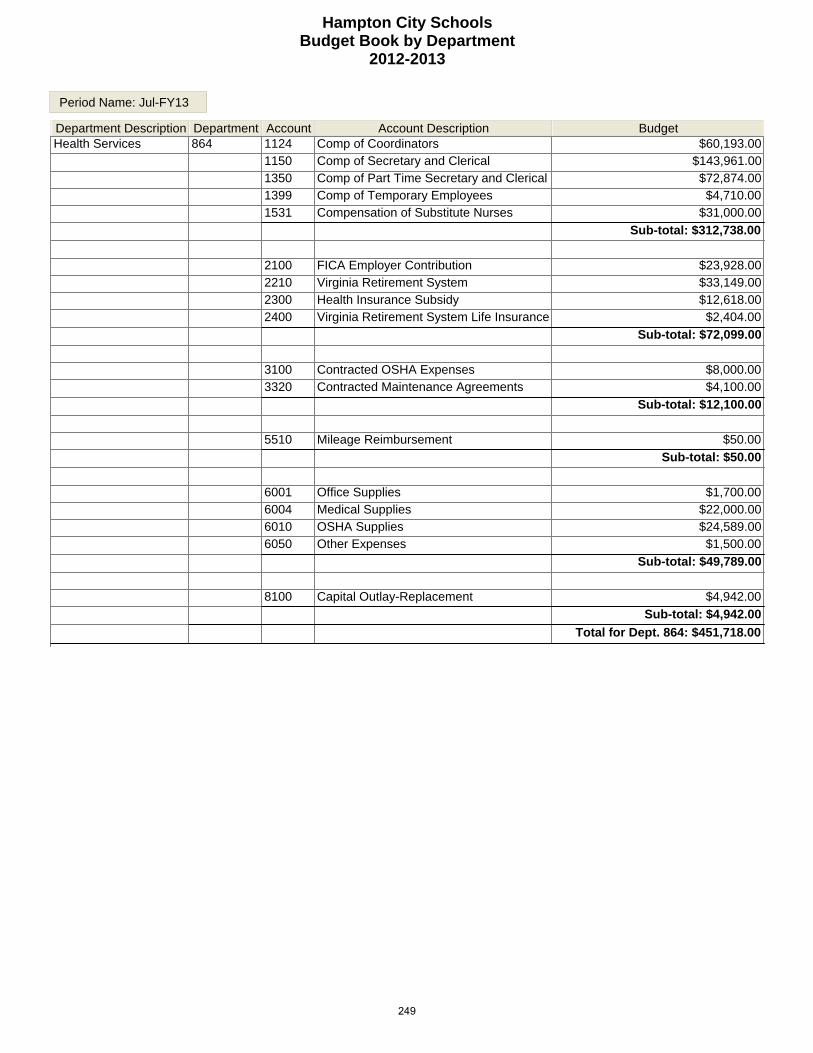
Hampton City SchoolsBudget Book by Department
2012-2013
Period Name: Jul-FY13
Department Description Department Account Account Description BudgetHealth Services 864 1124 Comp of Coordinators $60,193.00
1150 Comp of Secretary and Clerical $143,961.001350 Comp of Part Time Secretary and Clerical $72,874.001399 Comp of Temporary Employees $4,710.001531 Compensation of Substitute Nurses $31,000.00
Sub-total: $312,738.00
2100 FICA Employer Contribution $23,928.002210 Virginia Retirement System $33,149.002300 Health Insurance Subsidy $12,618.002400 Virginia Retirement System Life Insurance $2,404.00
Sub-total: $72,099.00
3100 Contracted OSHA Expenses $8,000.003320 Contracted Maintenance Agreements $4,100.00
Sub-total: $12,100.00
5510 Mileage Reimbursement $50.00
Sub-total: $50.00
6001 Office Supplies $1,700.006004 Medical Supplies $22,000.006010 OSHA Supplies $24,589.006050 Other Expenses $1,500.00
Sub-total: $49,789.00
8100 Capital Outlay-Replacement $4,942.00
Sub-total: $4,942.00
Total for Dept. 864: $451,718.00
249

Hampton City SchoolsBudget Book by Department
2012-2013
Period Name: Jul-FY13
Department Description Department Account Account Description BudgetHuman Resources 882 1114 Comp of Other Admin Personnel $255,003.00
1125 Comp of Directors/Curriculum Leaders $99,293.001150 Comp of Secretary and Clerical $223,049.001399 Comp of Temporary Employees $5,000.00
Sub-total: $582,345.00
2100 FICA Employer Contribution $44,550.002210 Virginia Retirement System $96,224.002300 Health Insurance Subsidy $45,016.002400 Virginia Retirement System Life Insurance $6,829.002834 Employee Assistance Program $33,600.00
Sub-total: $226,219.00
3113 Contracted Background Checks $1,000.003140 Consultant Services $29,950.003320 Contracted Maintenance Agreements $17,000.003610 Advertising $7,500.00
Sub-total: $55,450.00
5504 Travel Expenses Professional $11,085.005510 Mileage Reimbursement $154.005802 Dues and Association Memberships $1,836.00
Sub-total: $13,075.00
6001 Office Supplies $6,000.006050 Other Expenses $3,537.00
Sub-total: $9,537.00
Total for Dept. 882: $886,626.00
250
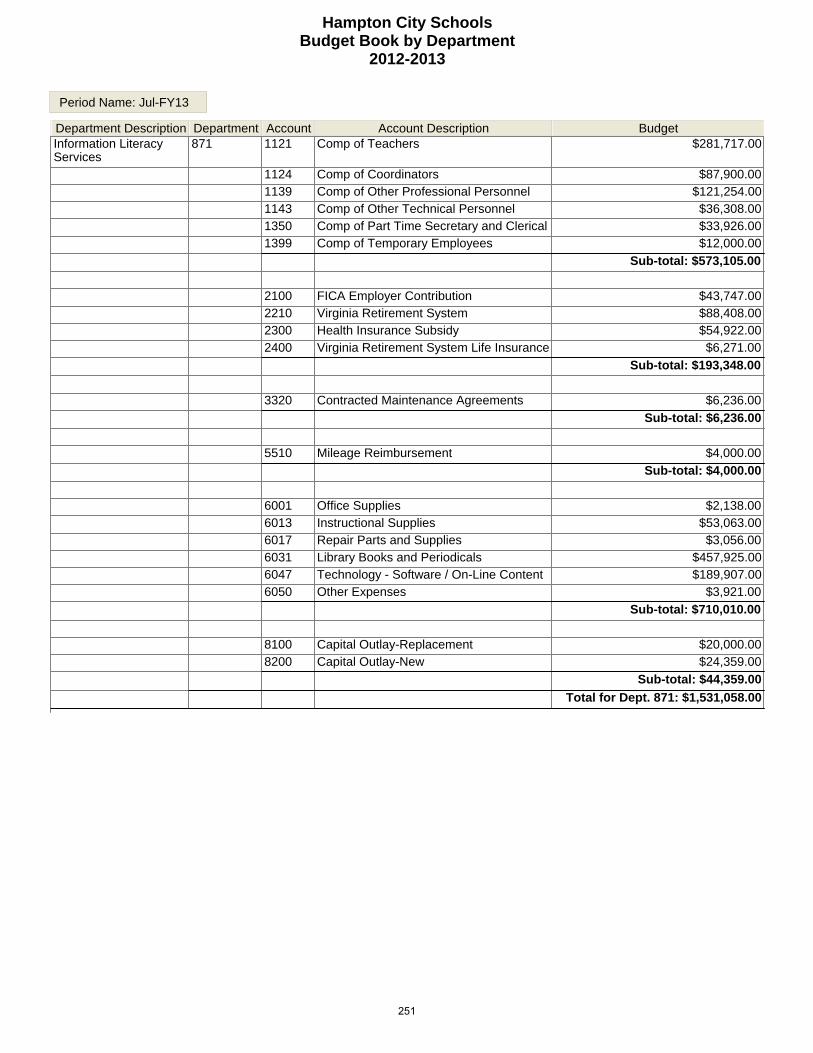
Hampton City SchoolsBudget Book by Department
2012-2013
Period Name: Jul-FY13
Department Description Department Account Account Description BudgetInformation Literacy Services
871 1121 Comp of Teachers $281,717.00
1124 Comp of Coordinators $87,900.001139 Comp of Other Professional Personnel $121,254.001143 Comp of Other Technical Personnel $36,308.001350 Comp of Part Time Secretary and Clerical $33,926.001399 Comp of Temporary Employees $12,000.00
Sub-total: $573,105.00
2100 FICA Employer Contribution $43,747.002210 Virginia Retirement System $88,408.002300 Health Insurance Subsidy $54,922.002400 Virginia Retirement System Life Insurance $6,271.00
Sub-total: $193,348.00
3320 Contracted Maintenance Agreements $6,236.00
Sub-total: $6,236.00
5510 Mileage Reimbursement $4,000.00
Sub-total: $4,000.00
6001 Office Supplies $2,138.006013 Instructional Supplies $53,063.006017 Repair Parts and Supplies $3,056.006031 Library Books and Periodicals $457,925.006047 Technology - Software / On-Line Content $189,907.006050 Other Expenses $3,921.00
Sub-total: $710,010.00
8100 Capital Outlay-Replacement $20,000.008200 Capital Outlay-New $24,359.00
Sub-total: $44,359.00
Total for Dept. 871: $1,531,058.00
251

Hampton City SchoolsBudget Book by Department
2012-2013
Period Name: Jul-FY13
Department Description Department Account Account Description BudgetInformation Technology 869 1125 Comp of Directors/Curriculum Leaders $123,634.00
1143 Comp of Other Technical Personnel $2,231,011.001150 Comp of Secretary and Clerical $41,295.00
Sub-total: $2,395,940.00
2100 FICA Employer Contribution $183,290.002210 Virginia Retirement System $384,326.002300 Health Insurance Subsidy $239,691.002400 Virginia Retirement System Life Insurance $28,440.00
Sub-total: $835,747.00
3145 Professional Services $579,218.00
Sub-total: $579,218.00
5205 Communication Technology $405,730.005401 Leases/Rental of Equipment $114,000.005510 Mileage Reimbursement $5,000.005604 Contribution-WHRO $11,500.00
Sub-total: $536,230.00
6001 Office Supplies $5,750.006017 Repair Parts and Supplies $195,000.006047 Technology - Software / On-Line Content $334,765.006049 Data Processing Supplies $1,630.006050 Other Expenses $1,745.00
Sub-total: $538,890.00
8000 Capital Outlay-Control $1,037,500.00
Sub-total: $1,037,500.00
Total for Dept. 869: $5,923,525.00
252
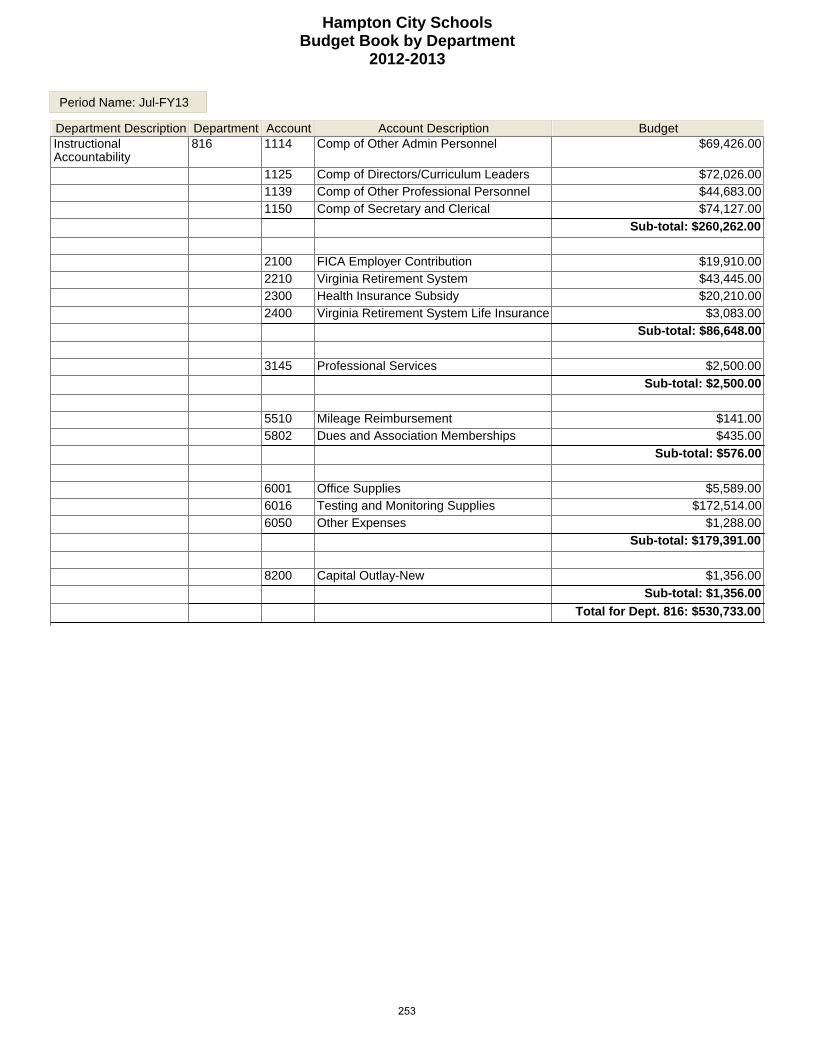
Hampton City SchoolsBudget Book by Department
2012-2013
Period Name: Jul-FY13
Department Description Department Account Account Description BudgetInstructional Accountability
816 1114 Comp of Other Admin Personnel $69,426.00
1125 Comp of Directors/Curriculum Leaders $72,026.001139 Comp of Other Professional Personnel $44,683.001150 Comp of Secretary and Clerical $74,127.00
Sub-total: $260,262.00
2100 FICA Employer Contribution $19,910.002210 Virginia Retirement System $43,445.002300 Health Insurance Subsidy $20,210.002400 Virginia Retirement System Life Insurance $3,083.00
Sub-total: $86,648.00
3145 Professional Services $2,500.00
Sub-total: $2,500.00
5510 Mileage Reimbursement $141.005802 Dues and Association Memberships $435.00
Sub-total: $576.00
6001 Office Supplies $5,589.006016 Testing and Monitoring Supplies $172,514.006050 Other Expenses $1,288.00
Sub-total: $179,391.00
8200 Capital Outlay-New $1,356.00
Sub-total: $1,356.00
Total for Dept. 816: $530,733.00
253

Hampton City SchoolsBudget Book by Department
2012-2013
Period Name: Jul-FY13
Department Description Department Account Account Description BudgetJones Magnet Middle School
310 1121 Comp of Teachers $1,991,716.00
1122 Comp of Librarians $49,114.001123 Comp of Deans and Guidance Counselors $110,718.001126 Comp of Principals $87,443.001127 Comp of Assistant Principals $126,903.001131 Comp of Nurses $39,677.001139 Comp of Other Professional Personnel $17,254.001141 Comp of Teacher Assistants $87,361.001150 Comp of Secretary and Clerical $104,040.001191 Comp of Custodians $128,660.001192 Comp of Staff Aides $32,887.001343 Comp of Part Time Employees $10,270.001350 Comp of Part Time Secretary and Clerical $6,000.001391 Comp of Part Time Custodians $36,468.001399 Comp of Temporary Employees $78,623.00
Sub-total: $2,907,134.00
2100 FICA Employer Contribution $222,395.002210 Virginia Retirement System $458,652.002300 Health Insurance Subsidy $339,902.002400 Virginia Retirement System Life Insurance $32,987.00
Sub-total: $1,053,936.00
5100 Natural Gas Services $8,428.005101 Electrical Services $173,414.005103 Water and Sewer Services $8,000.005201 Postage Services $1,100.005510 Mileage Reimbursement $500.00
Sub-total: $191,442.00
6001 Office Supplies $1,466.006013 Instructional Supplies $11,728.006017 Repair Parts and Supplies $1,420.006050 Other Expenses $1,283.00
Sub-total: $15,897.00
8100 Capital Outlay-Replacement $2,199.00
Sub-total: $2,199.00
Total for Dept. 310: $4,170,608.00
254
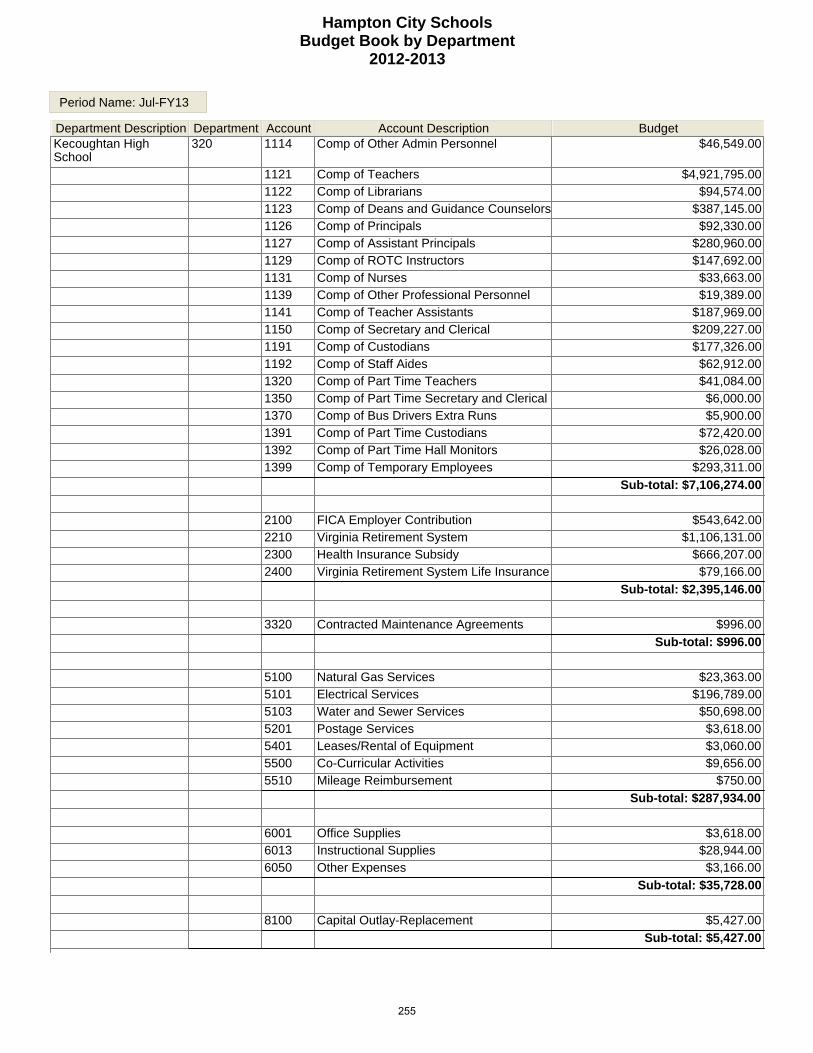
Hampton City SchoolsBudget Book by Department
2012-2013
Period Name: Jul-FY13
Department Description Department Account Account Description BudgetKecoughtan High School
320 1114 Comp of Other Admin Personnel $46,549.00
1121 Comp of Teachers $4,921,795.001122 Comp of Librarians $94,574.001123 Comp of Deans and Guidance Counselors $387,145.001126 Comp of Principals $92,330.001127 Comp of Assistant Principals $280,960.001129 Comp of ROTC Instructors $147,692.001131 Comp of Nurses $33,663.001139 Comp of Other Professional Personnel $19,389.001141 Comp of Teacher Assistants $187,969.001150 Comp of Secretary and Clerical $209,227.001191 Comp of Custodians $177,326.001192 Comp of Staff Aides $62,912.001320 Comp of Part Time Teachers $41,084.001350 Comp of Part Time Secretary and Clerical $6,000.001370 Comp of Bus Drivers Extra Runs $5,900.001391 Comp of Part Time Custodians $72,420.001392 Comp of Part Time Hall Monitors $26,028.001399 Comp of Temporary Employees $293,311.00
Sub-total: $7,106,274.00
2100 FICA Employer Contribution $543,642.002210 Virginia Retirement System $1,106,131.002300 Health Insurance Subsidy $666,207.002400 Virginia Retirement System Life Insurance $79,166.00
Sub-total: $2,395,146.00
3320 Contracted Maintenance Agreements $996.00
Sub-total: $996.00
5100 Natural Gas Services $23,363.005101 Electrical Services $196,789.005103 Water and Sewer Services $50,698.005201 Postage Services $3,618.005401 Leases/Rental of Equipment $3,060.005500 Co-Curricular Activities $9,656.005510 Mileage Reimbursement $750.00
Sub-total: $287,934.00
6001 Office Supplies $3,618.006013 Instructional Supplies $28,944.006050 Other Expenses $3,166.00
Sub-total: $35,728.00
8100 Capital Outlay-Replacement $5,427.00
Sub-total: $5,427.00
255
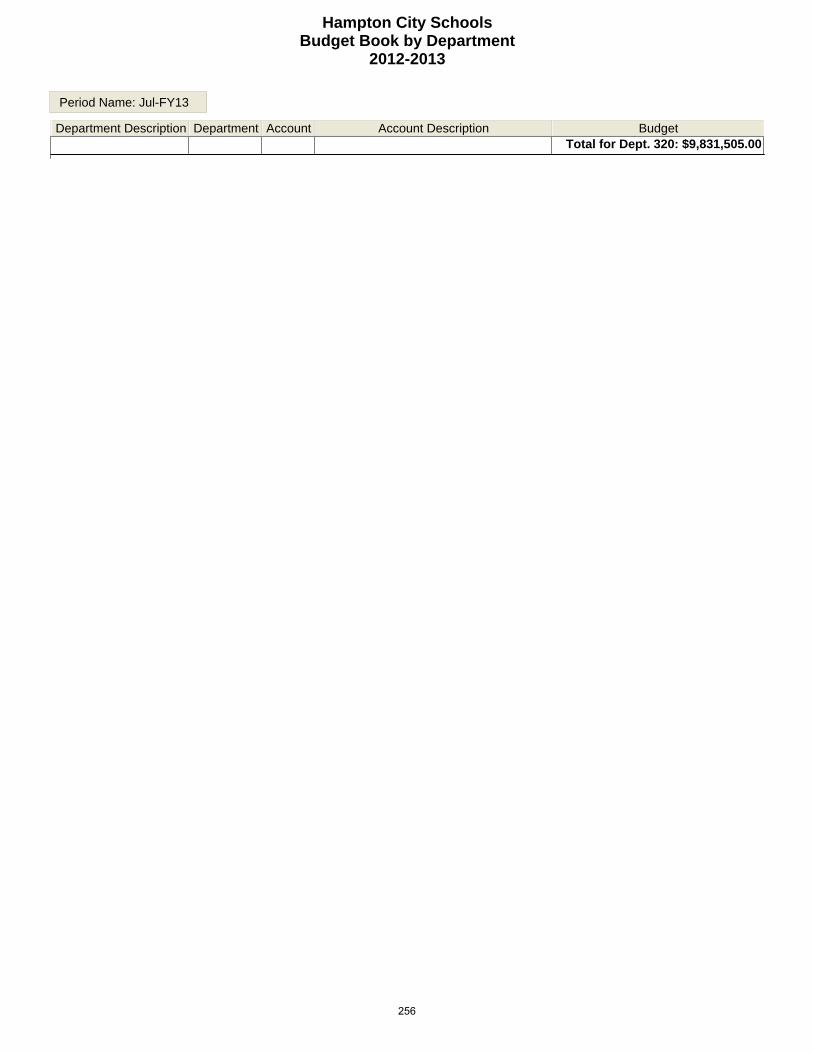
Hampton City SchoolsBudget Book by Department
2012-2013
Period Name: Jul-FY13
Department Description Department Account Account Description BudgetTotal for Dept. 320: $9,831,505.00
256

Hampton City SchoolsBudget Book by Department
2012-2013
Period Name: Jul-FY13
Department Description Department Account Account Description BudgetKraft Elementary 340 1121 Comp of Teachers $1,052,624.00
1122 Comp of Librarians $49,651.001123 Comp of Deans and Guidance Counselors $48,306.001126 Comp of Principals $79,938.001127 Comp of Assistant Principals $57,878.001131 Comp of Nurses $35,765.001141 Comp of Teacher Assistants $148,636.001150 Comp of Secretary and Clerical $31,725.001191 Comp of Custodians $45,731.001343 Comp of Part Time Employees $8,619.001350 Comp of Part Time Secretary and Clerical $12,000.001391 Comp of Part Time Custodians $21,290.001399 Comp of Temporary Employees $28,836.00
Sub-total: $1,620,999.00
2100 FICA Employer Contribution $124,003.002210 Virginia Retirement System $259,006.002300 Health Insurance Subsidy $146,691.002400 Virginia Retirement System Life Insurance $18,399.00
Sub-total: $548,099.00
5101 Electrical Services $48,948.005103 Water and Sewer Services $6,200.005201 Postage Services $360.005510 Mileage Reimbursement $250.00
Sub-total: $55,758.00
6001 Office Supplies $720.006013 Instructional Supplies $6,300.006017 Repair Parts and Supplies $209.006050 Other Expenses $630.00
Sub-total: $7,859.00
8100 Capital Outlay-Replacement $1,080.00
Sub-total: $1,080.00
Total for Dept. 340: $2,233,795.00
257
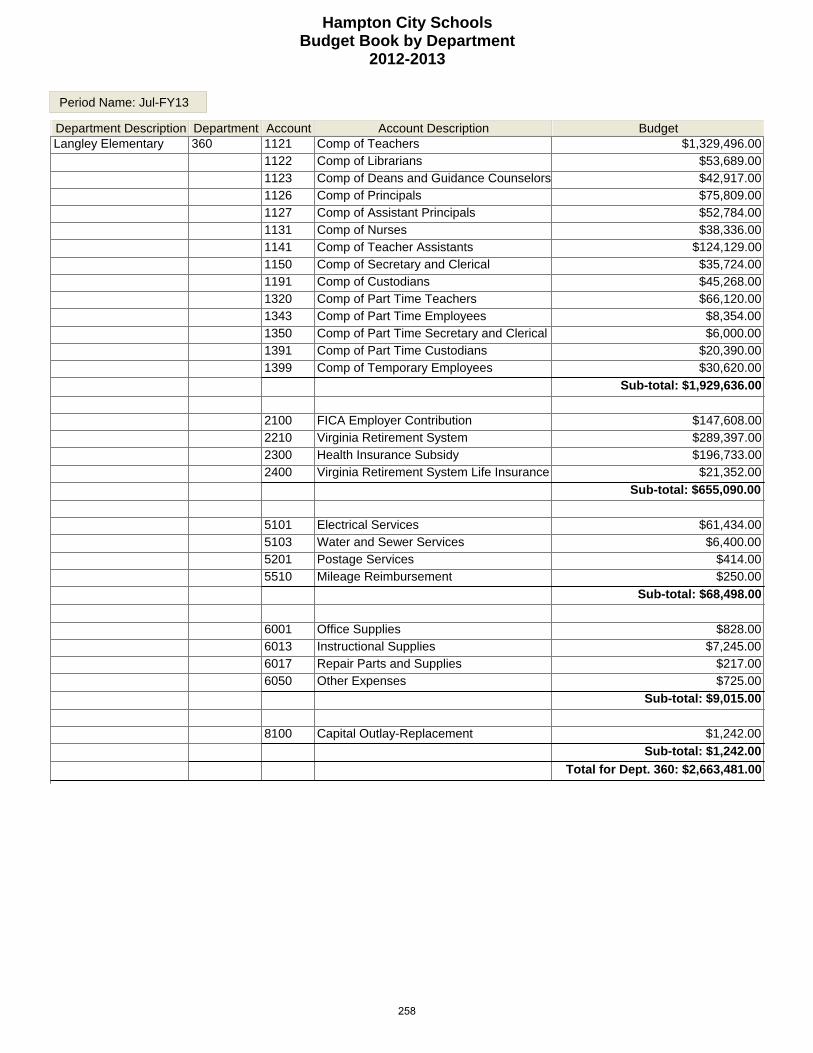
Hampton City SchoolsBudget Book by Department
2012-2013
Period Name: Jul-FY13
Department Description Department Account Account Description BudgetLangley Elementary 360 1121 Comp of Teachers $1,329,496.00
1122 Comp of Librarians $53,689.001123 Comp of Deans and Guidance Counselors $42,917.001126 Comp of Principals $75,809.001127 Comp of Assistant Principals $52,784.001131 Comp of Nurses $38,336.001141 Comp of Teacher Assistants $124,129.001150 Comp of Secretary and Clerical $35,724.001191 Comp of Custodians $45,268.001320 Comp of Part Time Teachers $66,120.001343 Comp of Part Time Employees $8,354.001350 Comp of Part Time Secretary and Clerical $6,000.001391 Comp of Part Time Custodians $20,390.001399 Comp of Temporary Employees $30,620.00
Sub-total: $1,929,636.00
2100 FICA Employer Contribution $147,608.002210 Virginia Retirement System $289,397.002300 Health Insurance Subsidy $196,733.002400 Virginia Retirement System Life Insurance $21,352.00
Sub-total: $655,090.00
5101 Electrical Services $61,434.005103 Water and Sewer Services $6,400.005201 Postage Services $414.005510 Mileage Reimbursement $250.00
Sub-total: $68,498.00
6001 Office Supplies $828.006013 Instructional Supplies $7,245.006017 Repair Parts and Supplies $217.006050 Other Expenses $725.00
Sub-total: $9,015.00
8100 Capital Outlay-Replacement $1,242.00
Sub-total: $1,242.00
Total for Dept. 360: $2,663,481.00
258
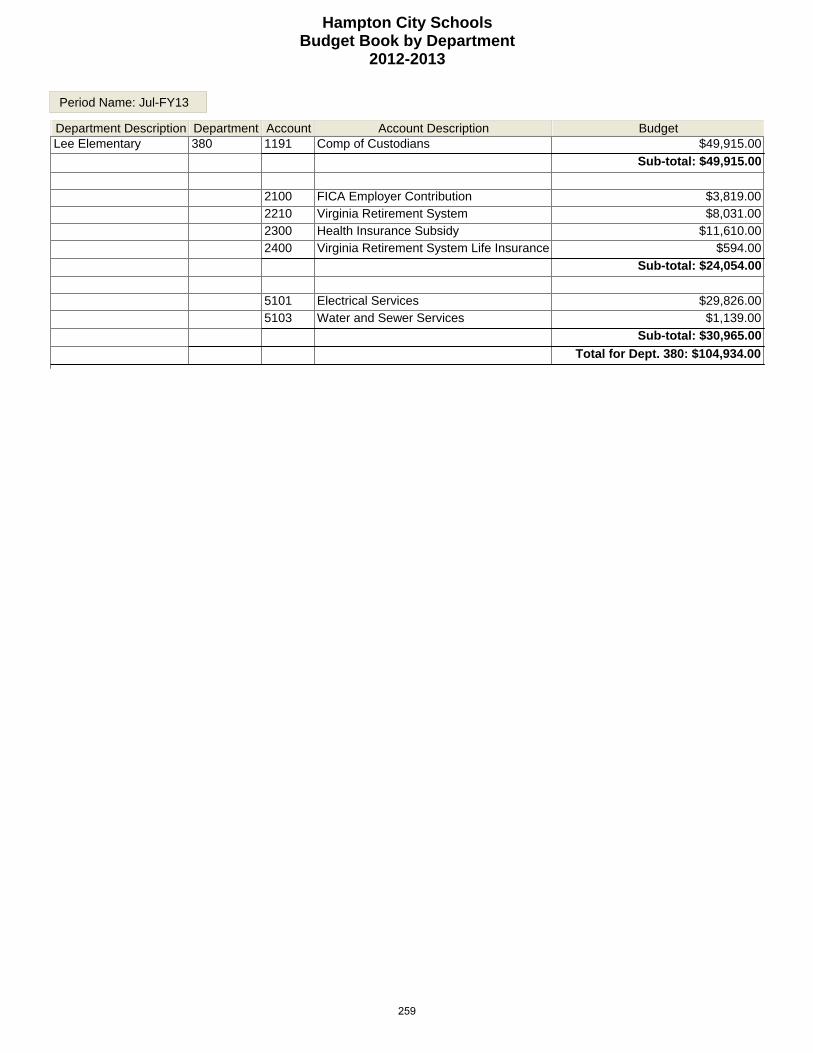
Hampton City SchoolsBudget Book by Department
2012-2013
Period Name: Jul-FY13
Department Description Department Account Account Description BudgetLee Elementary 380 1191 Comp of Custodians $49,915.00
Sub-total: $49,915.00
2100 FICA Employer Contribution $3,819.002210 Virginia Retirement System $8,031.002300 Health Insurance Subsidy $11,610.002400 Virginia Retirement System Life Insurance $594.00
Sub-total: $24,054.00
5101 Electrical Services $29,826.005103 Water and Sewer Services $1,139.00
Sub-total: $30,965.00
Total for Dept. 380: $104,934.00
259

Hampton City SchoolsBudget Book by Department
2012-2013
Period Name: Jul-FY13
Department Description Department Account Account Description BudgetLindsay Middle School 400 1121 Comp of Teachers $2,441,210.00
1122 Comp of Librarians $47,076.001123 Comp of Deans and Guidance Counselors $87,665.001126 Comp of Principals $78,734.001127 Comp of Assistant Principals $129,360.001131 Comp of Nurses $35,765.001139 Comp of Other Professional Personnel $65,554.001141 Comp of Teacher Assistants $146,781.001150 Comp of Secretary and Clerical $91,539.001191 Comp of Custodians $114,105.001192 Comp of Staff Aides $35,533.001320 Comp of Part Time Teachers $23,280.001343 Comp of Part Time Employees $8,434.001350 Comp of Part Time Secretary and Clerical $6,000.001391 Comp of Part Time Custodians $35,160.001399 Comp of Temporary Employees $46,504.00
Sub-total: $3,392,700.00
2100 FICA Employer Contribution $259,543.002210 Virginia Retirement System $534,726.002300 Health Insurance Subsidy $365,613.002400 Virginia Retirement System Life Insurance $38,864.00
Sub-total: $1,198,746.00
5100 Natural Gas Services $20,269.005101 Electrical Services $96,796.005103 Water and Sewer Services $8,800.005201 Postage Services $815.005401 Leases/Rental of Equipment $696.005510 Mileage Reimbursement $500.00
Sub-total: $127,876.00
6001 Office Supplies $1,086.006013 Instructional Supplies $8,688.006050 Other Expenses $950.00
Sub-total: $10,724.00
8100 Capital Outlay-Replacement $1,629.00
Sub-total: $1,629.00
Total for Dept. 400: $4,731,675.00
260

Hampton City SchoolsBudget Book by Department
2012-2013
Period Name: Jul-FY13
Department Description Department Account Account Description BudgetMachen Elementary 420 1121 Comp of Teachers $1,391,756.00
1122 Comp of Librarians $51,704.001123 Comp of Deans and Guidance Counselors $65,674.001126 Comp of Principals $77,492.001127 Comp of Assistant Principals $56,458.001131 Comp of Nurses $35,959.001141 Comp of Teacher Assistants $154,230.001150 Comp of Secretary and Clerical $36,931.001191 Comp of Custodians $49,836.001343 Comp of Part Time Employees $9,520.001350 Comp of Part Time Secretary and Clerical $6,000.001391 Comp of Part Time Custodians $20,440.001399 Comp of Temporary Employees $11,941.00
Sub-total: $1,967,941.00
2100 FICA Employer Contribution $150,542.002210 Virginia Retirement System $316,611.002300 Health Insurance Subsidy $211,794.002400 Virginia Retirement System Life Insurance $22,820.00
Sub-total: $701,767.00
5101 Electrical Services $38,459.005103 Water and Sewer Services $6,200.005201 Postage Services $476.005510 Mileage Reimbursement $250.00
Sub-total: $45,385.00
6001 Office Supplies $952.006013 Instructional Supplies $8,330.006017 Repair Parts and Supplies $387.006050 Other Expenses $833.00
Sub-total: $10,502.00
8100 Capital Outlay-Replacement $1,428.00
Sub-total: $1,428.00
Total for Dept. 420: $2,727,023.00
261

Hampton City SchoolsBudget Book by Department
2012-2013
Period Name: Jul-FY13
Department Description Department Account Account Description BudgetMaintenance 872 1114 Comp of Other Admin Personnel $119,422.00
1125 Comp of Directors/Curriculum Leaders $96,690.001150 Comp of Secretary and Clerical $79,182.001160 Comp of Maintenance Employees $1,798,872.001191 Comp of Custodians $71,885.001260 Comp of Maintenance Employees OT $43,680.001291 Comp of Custodians OT $13,629.001360 Comp of Part Time Maintenance Employee $18,375.001391 Comp of Part Time Custodians $14,970.001591 Comp of Substitute Custodians $86,776.00
Sub-total: $2,343,481.00
2100 FICA Employer Contribution $179,275.002210 Virginia Retirement System $337,902.002300 Health Insurance Subsidy $270,595.002400 Virginia Retirement System Life Insurance $25,339.00
Sub-total: $813,111.00
3100 Contracted OSHA Expenses $34,670.003120 Contracted Security Services $75,000.003310 Contracted Buildings and Grounds $851,086.003330 Contracted Repair Service $3,000.003823 Payment To City For Building Services $345,135.00
Sub-total: $1,308,891.00
5101 Electrical Services $103,191.005103 Water and Sewer Services $6,200.005204 Cell Phone Service $16,000.005401 Leases/Rental of Equipment $3,780.00
Sub-total: $129,171.00
6001 Office Supplies $5,087.006005 Custodial Supplies $328,759.006007 Maintenance Supplies $606,804.006010 OSHA Supplies $6,296.006017 Repair Parts and Supplies $22,254.006050 Other Expenses $168,249.00
Sub-total: $1,137,449.00
8100 Capital Outlay-Replacement $267,903.00
Sub-total: $267,903.00
Total for Dept. 872: $6,000,006.00
262
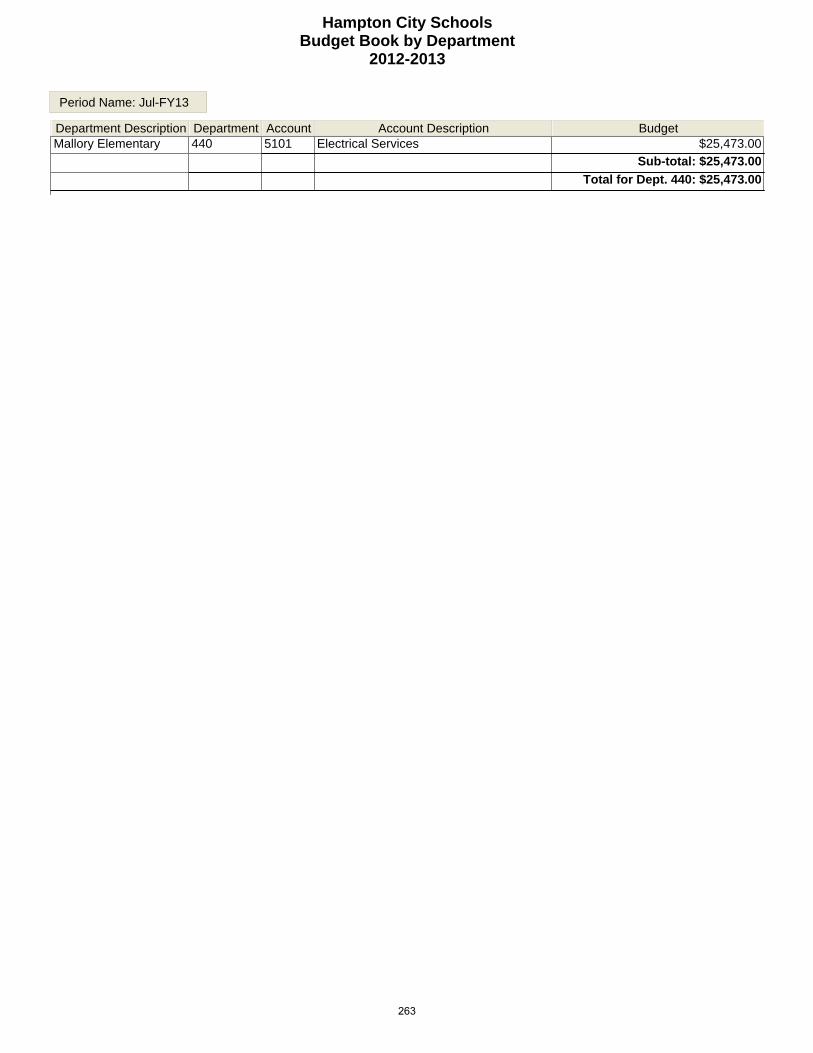
Hampton City SchoolsBudget Book by Department
2012-2013
Period Name: Jul-FY13
Department Description Department Account Account Description BudgetMallory Elementary 440 5101 Electrical Services $25,473.00
Sub-total: $25,473.00
Total for Dept. 440: $25,473.00
263
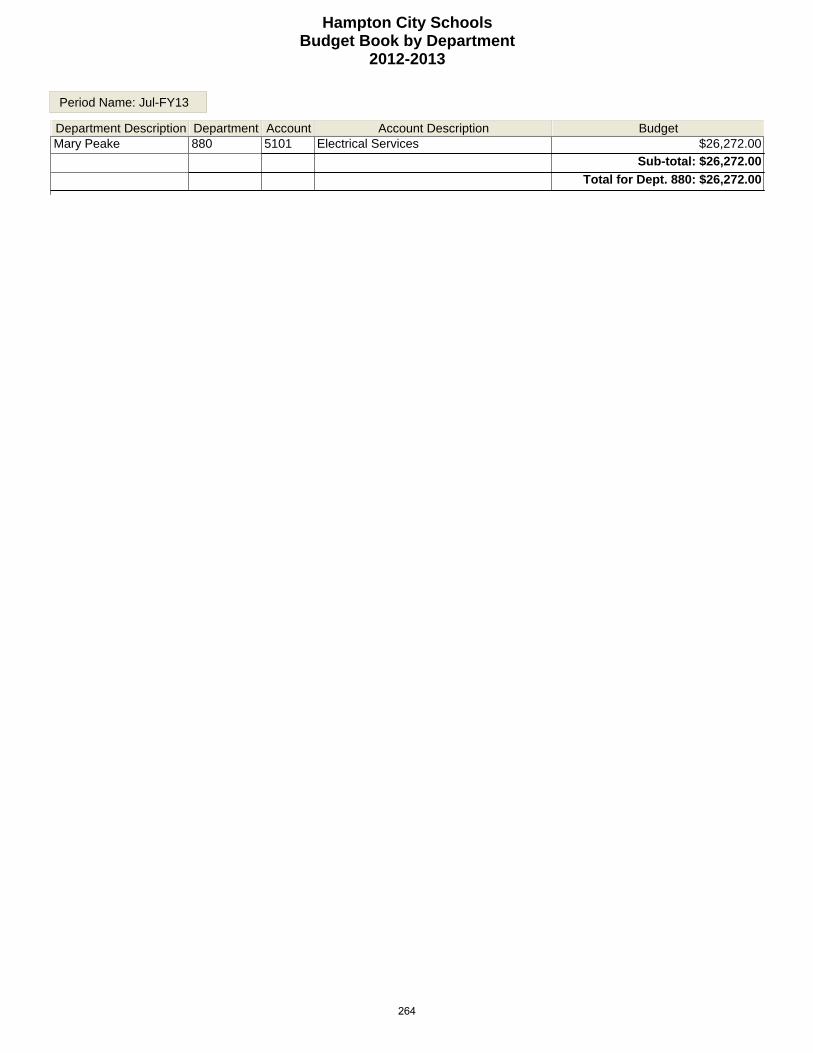
Hampton City SchoolsBudget Book by Department
2012-2013
Period Name: Jul-FY13
Department Description Department Account Account Description BudgetMary Peake 880 5101 Electrical Services $26,272.00
Sub-total: $26,272.00
Total for Dept. 880: $26,272.00
264
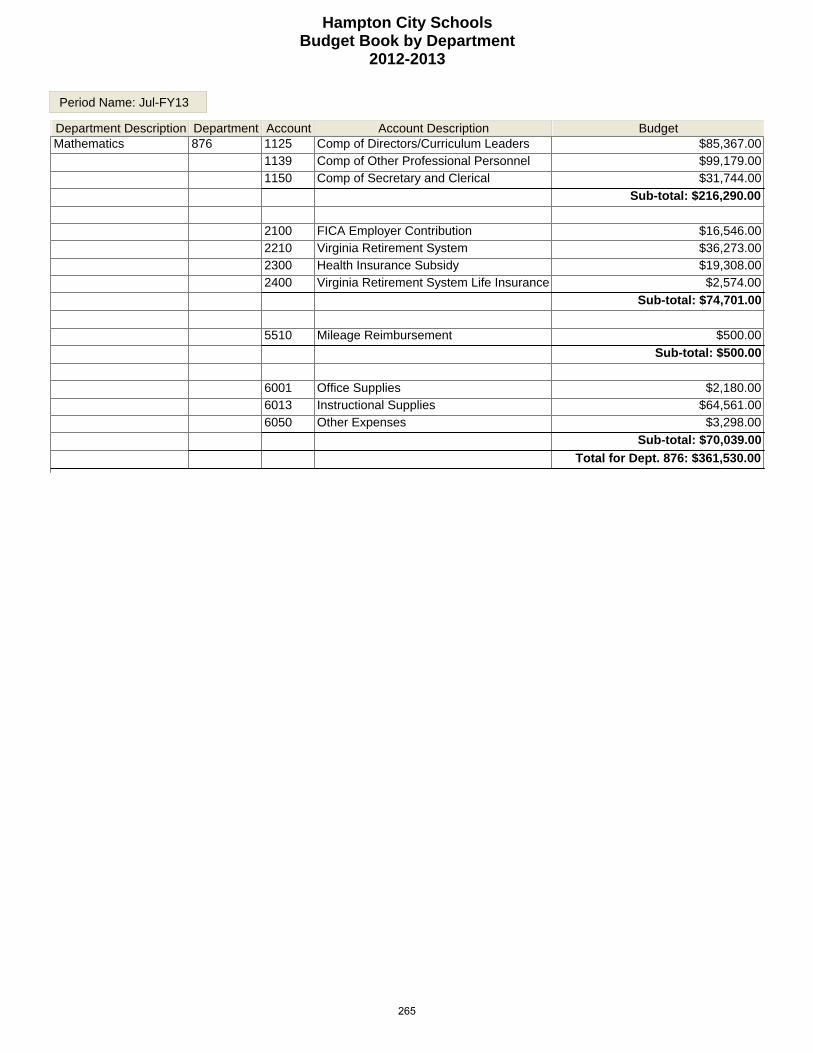
Hampton City SchoolsBudget Book by Department
2012-2013
Period Name: Jul-FY13
Department Description Department Account Account Description BudgetMathematics 876 1125 Comp of Directors/Curriculum Leaders $85,367.00
1139 Comp of Other Professional Personnel $99,179.001150 Comp of Secretary and Clerical $31,744.00
Sub-total: $216,290.00
2100 FICA Employer Contribution $16,546.002210 Virginia Retirement System $36,273.002300 Health Insurance Subsidy $19,308.002400 Virginia Retirement System Life Insurance $2,574.00
Sub-total: $74,701.00
5510 Mileage Reimbursement $500.00
Sub-total: $500.00
6001 Office Supplies $2,180.006013 Instructional Supplies $64,561.006050 Other Expenses $3,298.00
Sub-total: $70,039.00
Total for Dept. 876: $361,530.00
265

Hampton City SchoolsBudget Book by Department
2012-2013
Period Name: Jul-FY13
Department Description Department Account Account Description BudgetMerrimack Elementary 460 1399 Comp of Temporary Employees $0.00
Sub-total: $0.00
2100 FICA Employer Contribution $0.00
Sub-total: $0.00
5101 Electrical Services $35,000.005103 Water and Sewer Services $3,500.00
Sub-total: $38,500.00
Total for Dept. 460: $38,500.00
266
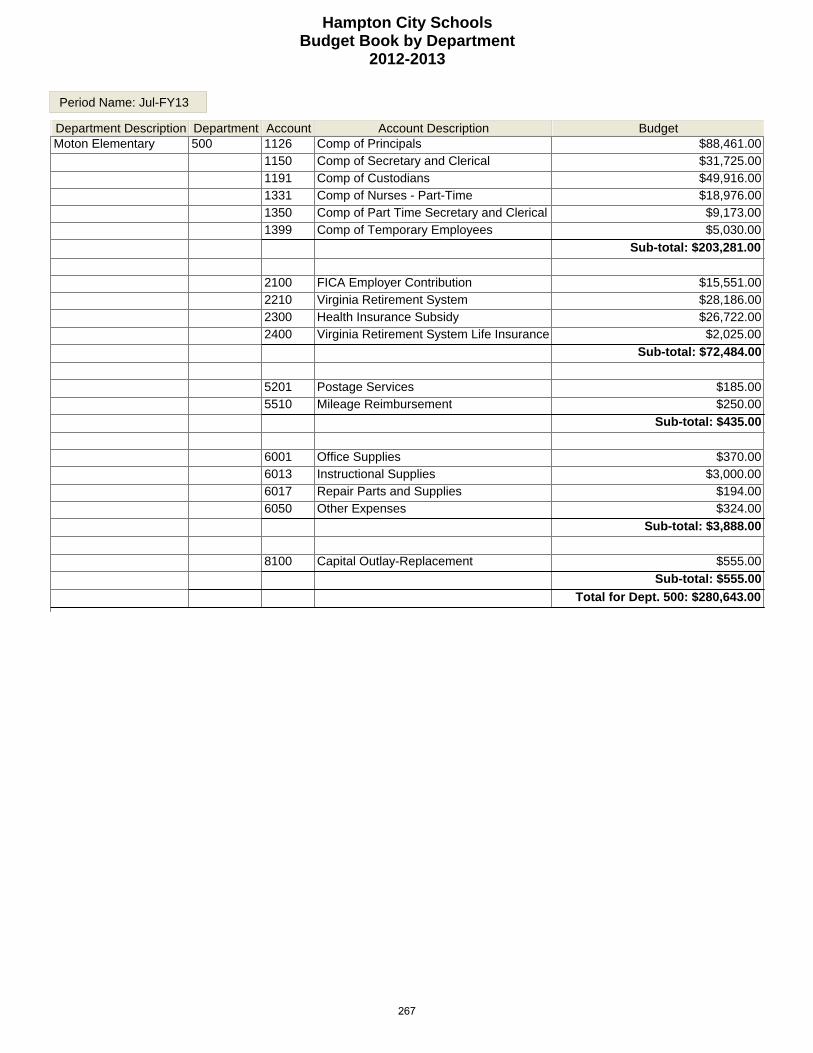
Hampton City SchoolsBudget Book by Department
2012-2013
Period Name: Jul-FY13
Department Description Department Account Account Description BudgetMoton Elementary 500 1126 Comp of Principals $88,461.00
1150 Comp of Secretary and Clerical $31,725.001191 Comp of Custodians $49,916.001331 Comp of Nurses - Part-Time $18,976.001350 Comp of Part Time Secretary and Clerical $9,173.001399 Comp of Temporary Employees $5,030.00
Sub-total: $203,281.00
2100 FICA Employer Contribution $15,551.002210 Virginia Retirement System $28,186.002300 Health Insurance Subsidy $26,722.002400 Virginia Retirement System Life Insurance $2,025.00
Sub-total: $72,484.00
5201 Postage Services $185.005510 Mileage Reimbursement $250.00
Sub-total: $435.00
6001 Office Supplies $370.006013 Instructional Supplies $3,000.006017 Repair Parts and Supplies $194.006050 Other Expenses $324.00
Sub-total: $3,888.00
8100 Capital Outlay-Replacement $555.00
Sub-total: $555.00
Total for Dept. 500: $280,643.00
267
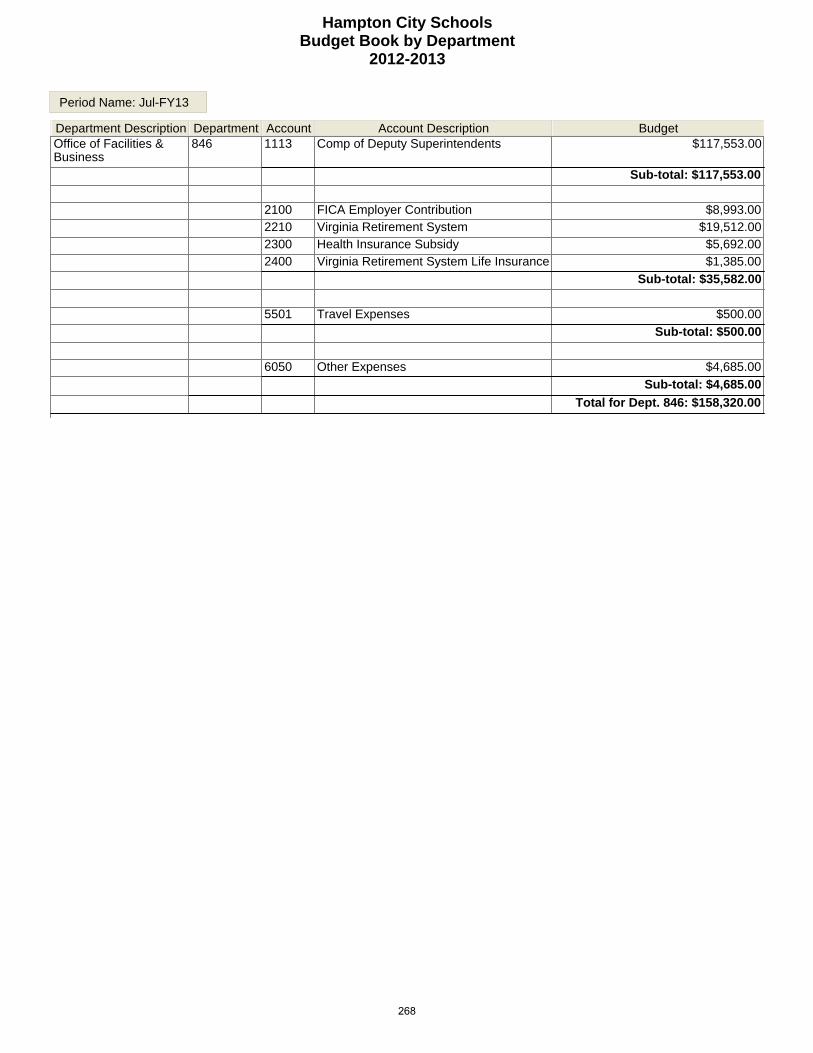
Hampton City SchoolsBudget Book by Department
2012-2013
Period Name: Jul-FY13
Department Description Department Account Account Description BudgetOffice of Facilities & Business
846 1113 Comp of Deputy Superintendents $117,553.00
Sub-total: $117,553.00
2100 FICA Employer Contribution $8,993.002210 Virginia Retirement System $19,512.002300 Health Insurance Subsidy $5,692.002400 Virginia Retirement System Life Insurance $1,385.00
Sub-total: $35,582.00
5501 Travel Expenses $500.00
Sub-total: $500.00
6050 Other Expenses $4,685.00
Sub-total: $4,685.00
Total for Dept. 846: $158,320.00
268
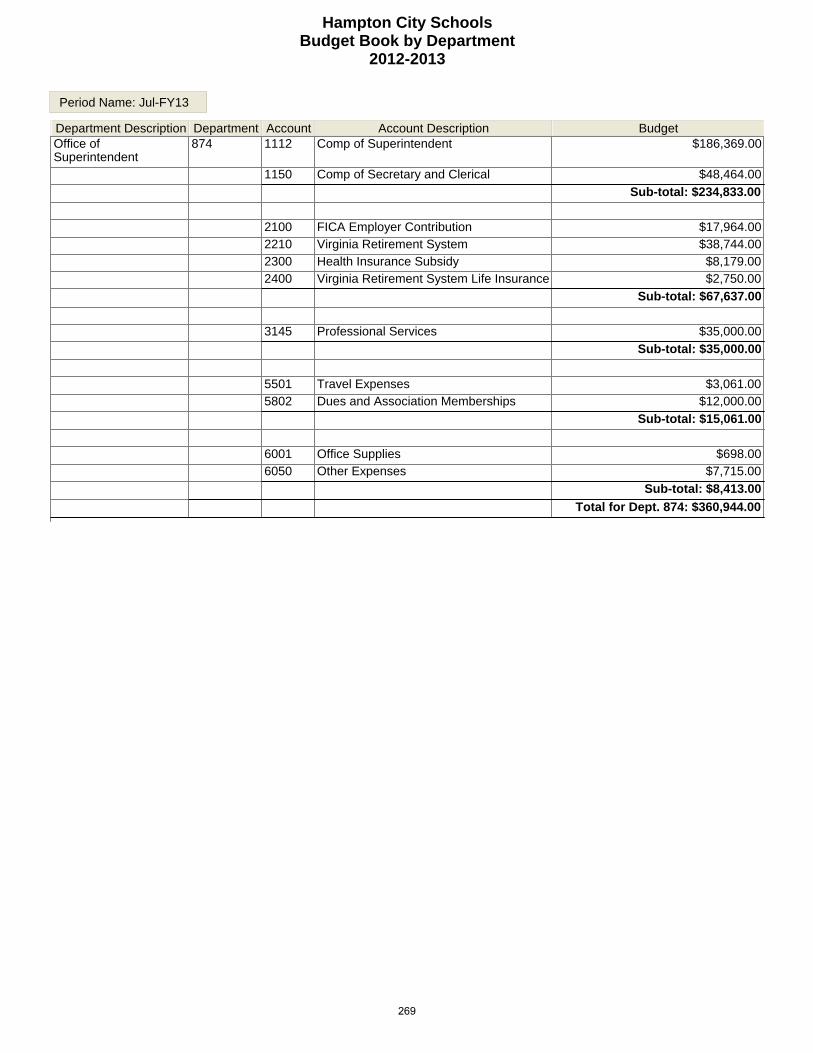
Hampton City SchoolsBudget Book by Department
2012-2013
Period Name: Jul-FY13
Department Description Department Account Account Description BudgetOffice of Superintendent
874 1112 Comp of Superintendent $186,369.00
1150 Comp of Secretary and Clerical $48,464.00
Sub-total: $234,833.00
2100 FICA Employer Contribution $17,964.002210 Virginia Retirement System $38,744.002300 Health Insurance Subsidy $8,179.002400 Virginia Retirement System Life Insurance $2,750.00
Sub-total: $67,637.00
3145 Professional Services $35,000.00
Sub-total: $35,000.00
5501 Travel Expenses $3,061.005802 Dues and Association Memberships $12,000.00
Sub-total: $15,061.00
6001 Office Supplies $698.006050 Other Expenses $7,715.00
Sub-total: $8,413.00
Total for Dept. 874: $360,944.00
269
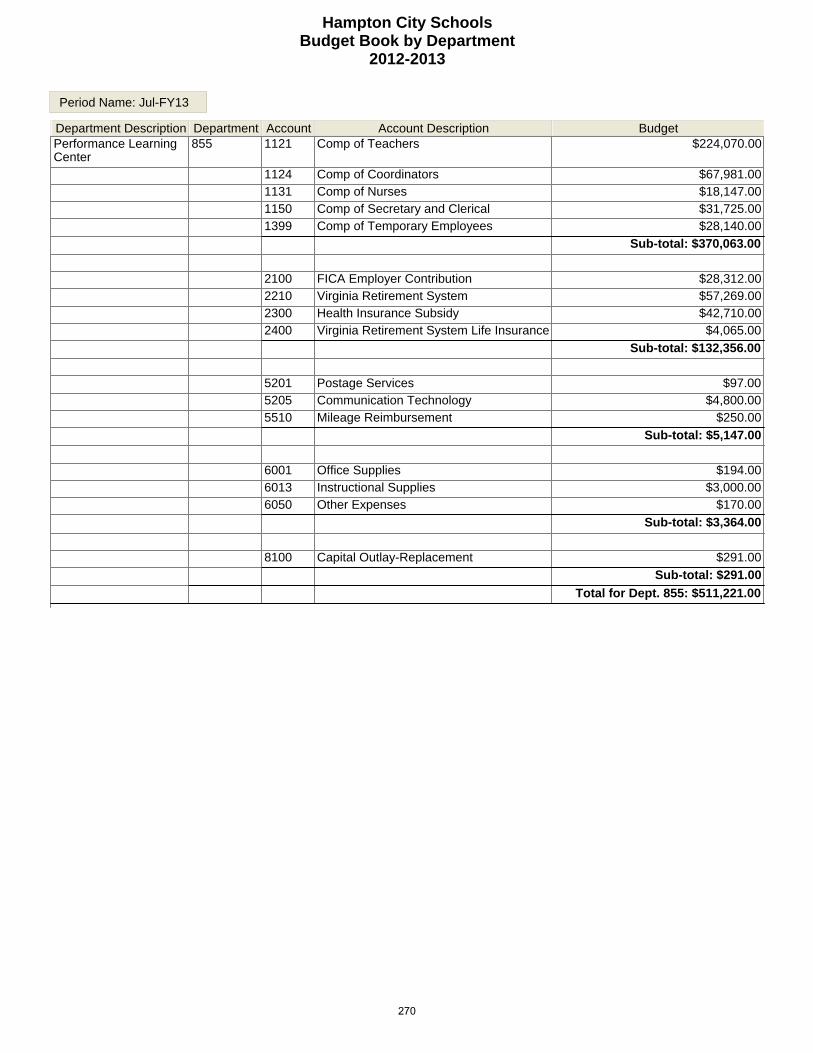
Hampton City SchoolsBudget Book by Department
2012-2013
Period Name: Jul-FY13
Department Description Department Account Account Description BudgetPerformance Learning Center
855 1121 Comp of Teachers $224,070.00
1124 Comp of Coordinators $67,981.001131 Comp of Nurses $18,147.001150 Comp of Secretary and Clerical $31,725.001399 Comp of Temporary Employees $28,140.00
Sub-total: $370,063.00
2100 FICA Employer Contribution $28,312.002210 Virginia Retirement System $57,269.002300 Health Insurance Subsidy $42,710.002400 Virginia Retirement System Life Insurance $4,065.00
Sub-total: $132,356.00
5201 Postage Services $97.005205 Communication Technology $4,800.005510 Mileage Reimbursement $250.00
Sub-total: $5,147.00
6001 Office Supplies $194.006013 Instructional Supplies $3,000.006050 Other Expenses $170.00
Sub-total: $3,364.00
8100 Capital Outlay-Replacement $291.00
Sub-total: $291.00
Total for Dept. 855: $511,221.00
270
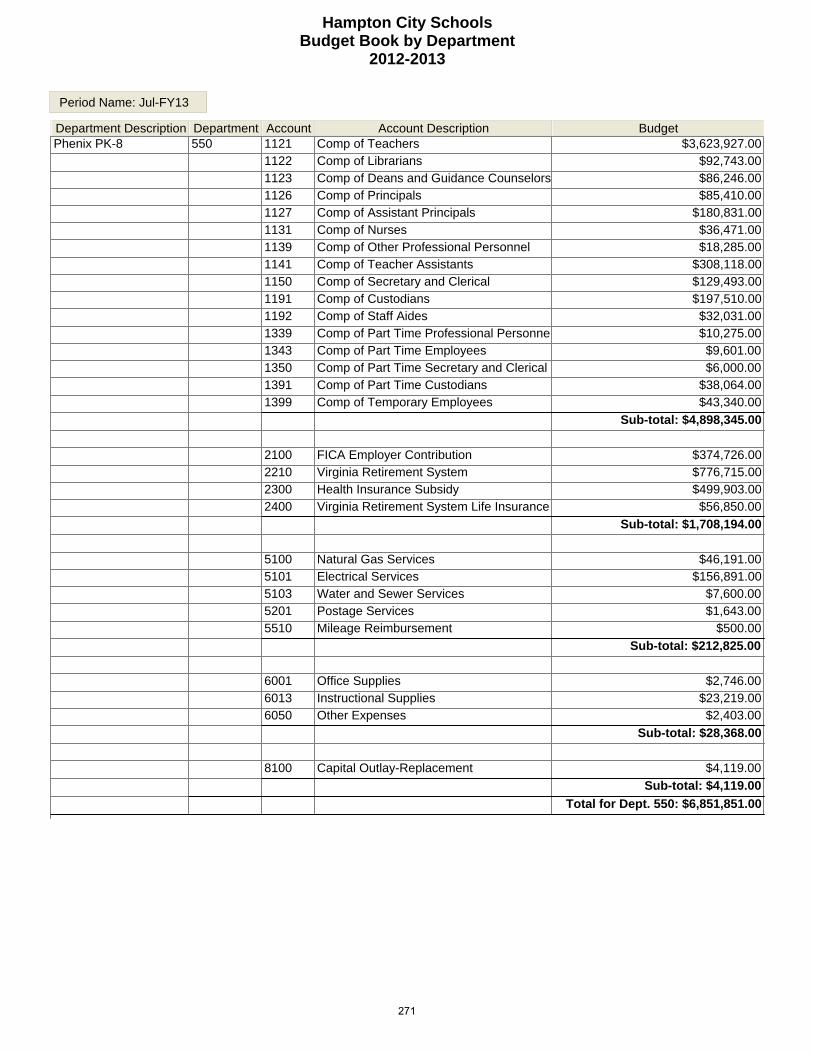
Hampton City SchoolsBudget Book by Department
2012-2013
Period Name: Jul-FY13
Department Description Department Account Account Description BudgetPhenix PK-8 550 1121 Comp of Teachers $3,623,927.00
1122 Comp of Librarians $92,743.001123 Comp of Deans and Guidance Counselors $86,246.001126 Comp of Principals $85,410.001127 Comp of Assistant Principals $180,831.001131 Comp of Nurses $36,471.001139 Comp of Other Professional Personnel $18,285.001141 Comp of Teacher Assistants $308,118.001150 Comp of Secretary and Clerical $129,493.001191 Comp of Custodians $197,510.001192 Comp of Staff Aides $32,031.001339 Comp of Part Time Professional Personnel $10,275.001343 Comp of Part Time Employees $9,601.001350 Comp of Part Time Secretary and Clerical $6,000.001391 Comp of Part Time Custodians $38,064.001399 Comp of Temporary Employees $43,340.00
Sub-total: $4,898,345.00
2100 FICA Employer Contribution $374,726.002210 Virginia Retirement System $776,715.002300 Health Insurance Subsidy $499,903.002400 Virginia Retirement System Life Insurance $56,850.00
Sub-total: $1,708,194.00
5100 Natural Gas Services $46,191.005101 Electrical Services $156,891.005103 Water and Sewer Services $7,600.005201 Postage Services $1,643.005510 Mileage Reimbursement $500.00
Sub-total: $212,825.00
6001 Office Supplies $2,746.006013 Instructional Supplies $23,219.006050 Other Expenses $2,403.00
Sub-total: $28,368.00
8100 Capital Outlay-Replacement $4,119.00
Sub-total: $4,119.00
Total for Dept. 550: $6,851,851.00
271

Hampton City SchoolsBudget Book by Department
2012-2013
Period Name: Jul-FY13
Department Description Department Account Account Description BudgetPhillips Elementary 560 1121 Comp of Teachers $1,040,676.00
1122 Comp of Librarians $50,743.001123 Comp of Deans and Guidance Counselors $48,872.001126 Comp of Principals $86,435.001127 Comp of Assistant Principals $76,342.001131 Comp of Nurses $36,293.001141 Comp of Teacher Assistants $109,918.001150 Comp of Secretary and Clerical $37,750.001191 Comp of Custodians $47,179.001343 Comp of Part Time Employees $9,520.001350 Comp of Part Time Secretary and Clerical $6,000.001391 Comp of Part Time Custodians $26,140.001399 Comp of Temporary Employees $17,141.00
Sub-total: $1,593,009.00
2100 FICA Employer Contribution $121,863.002210 Virginia Retirement System $256,241.002300 Health Insurance Subsidy $193,434.002400 Virginia Retirement System Life Insurance $18,203.00
Sub-total: $589,741.00
5101 Electrical Services $43,953.005103 Water and Sewer Services $5,600.005201 Postage Services $435.005510 Mileage Reimbursement $250.00
Sub-total: $50,238.00
6001 Office Supplies $852.006013 Instructional Supplies $7,455.006017 Repair Parts and Supplies $205.006050 Other Expenses $746.00
Sub-total: $9,258.00
8100 Capital Outlay-Replacement $1,278.00
Sub-total: $1,278.00
Total for Dept. 560: $2,243,524.00
272

Hampton City SchoolsBudget Book by Department
2012-2013
Period Name: Jul-FY13
Department Description Department Account Account Description BudgetPhoebus High School 590 1114 Comp of Other Admin Personnel $40,982.00
1121 Comp of Teachers $3,890,846.001122 Comp of Librarians $90,630.001123 Comp of Deans and Guidance Counselors $357,156.001126 Comp of Principals $92,513.001127 Comp of Assistant Principals $226,293.001129 Comp of ROTC Instructors $137,848.001131 Comp of Nurses $39,449.001139 Comp of Other Professional Personnel $22,653.001141 Comp of Teacher Assistants $201,523.001150 Comp of Secretary and Clerical $212,948.001191 Comp of Custodians $180,607.001192 Comp of Staff Aides $81,183.001320 Comp of Part Time Teachers $92,982.001350 Comp of Part Time Secretary and Clerical $6,000.001391 Comp of Part Time Custodians $69,888.001399 Comp of Temporary Employees $184,137.00
Sub-total: $5,927,638.00
2100 FICA Employer Contribution $453,472.002210 Virginia Retirement System $914,424.002300 Health Insurance Subsidy $588,913.002400 Virginia Retirement System Life Insurance $66,255.00
Sub-total: $2,023,064.00
3145 Professional Services $25,000.00
Sub-total: $25,000.00
5100 Natural Gas Services $21,336.005101 Electrical Services $220,764.005103 Water and Sewer Services $30,199.005201 Postage Services $2,322.005401 Leases/Rental of Equipment $4,216.005500 Co-Curricular Activities $7,758.005510 Mileage Reimbursement $750.00
Sub-total: $287,345.00
6001 Office Supplies $2,322.006013 Instructional Supplies $18,576.006017 Repair Parts and Supplies $901.006050 Other Expenses $2,032.00
Sub-total: $23,831.00
8100 Capital Outlay-Replacement $3,483.00
Sub-total: $3,483.00
Total for Dept. 590: $8,290,361.00
273
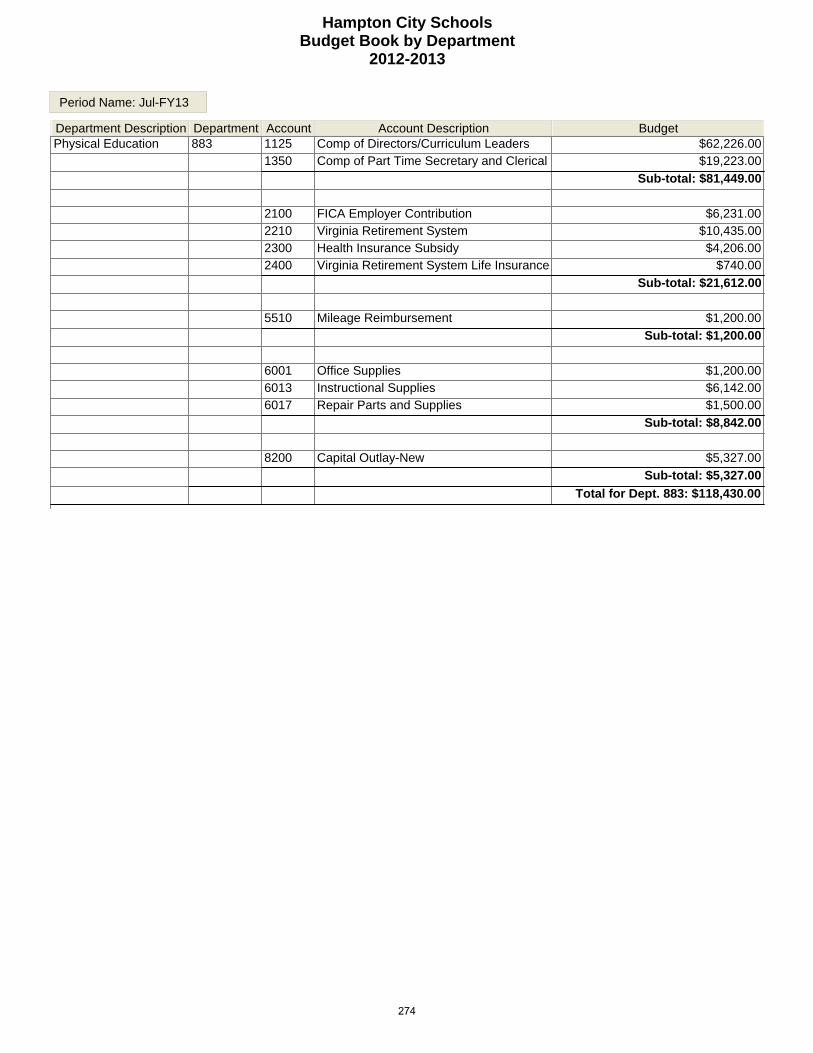
Hampton City SchoolsBudget Book by Department
2012-2013
Period Name: Jul-FY13
Department Description Department Account Account Description BudgetPhysical Education 883 1125 Comp of Directors/Curriculum Leaders $62,226.00
1350 Comp of Part Time Secretary and Clerical $19,223.00
Sub-total: $81,449.00
2100 FICA Employer Contribution $6,231.002210 Virginia Retirement System $10,435.002300 Health Insurance Subsidy $4,206.002400 Virginia Retirement System Life Insurance $740.00
Sub-total: $21,612.00
5510 Mileage Reimbursement $1,200.00
Sub-total: $1,200.00
6001 Office Supplies $1,200.006013 Instructional Supplies $6,142.006017 Repair Parts and Supplies $1,500.00
Sub-total: $8,842.00
8200 Capital Outlay-New $5,327.00
Sub-total: $5,327.00
Total for Dept. 883: $118,430.00
274
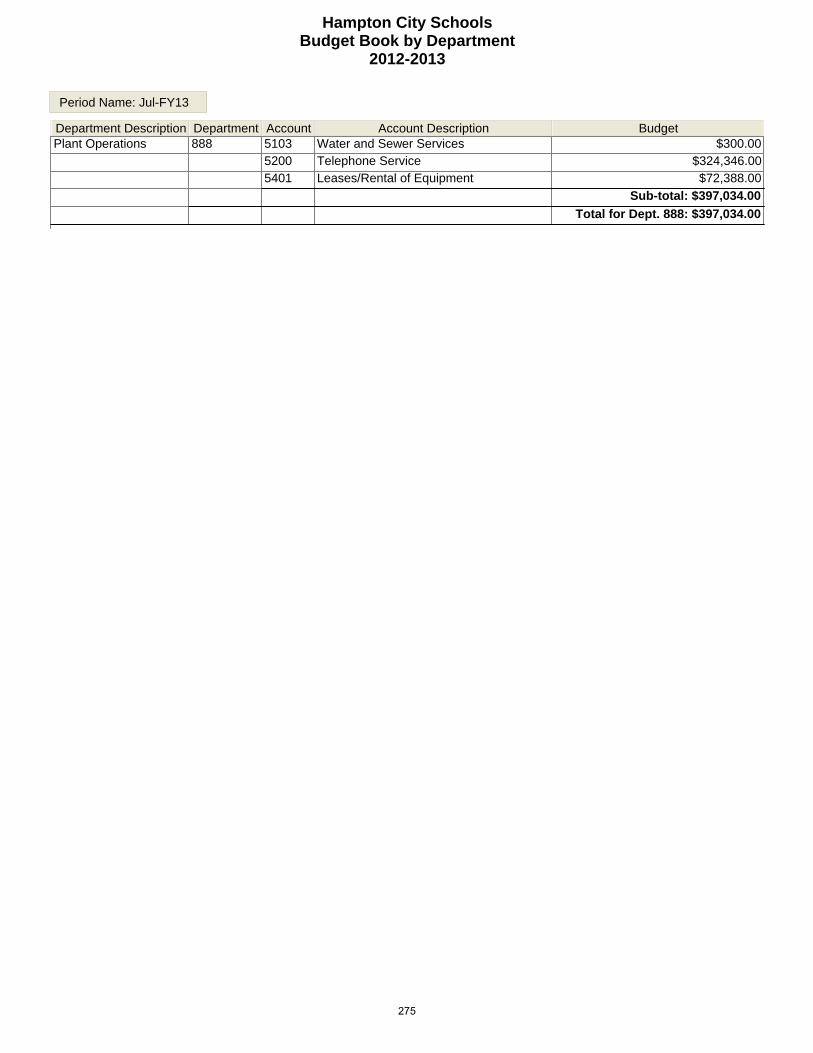
Hampton City SchoolsBudget Book by Department
2012-2013
Period Name: Jul-FY13
Department Description Department Account Account Description BudgetPlant Operations 888 5103 Water and Sewer Services $300.00
5200 Telephone Service $324,346.005401 Leases/Rental of Equipment $72,388.00
Sub-total: $397,034.00
Total for Dept. 888: $397,034.00
275
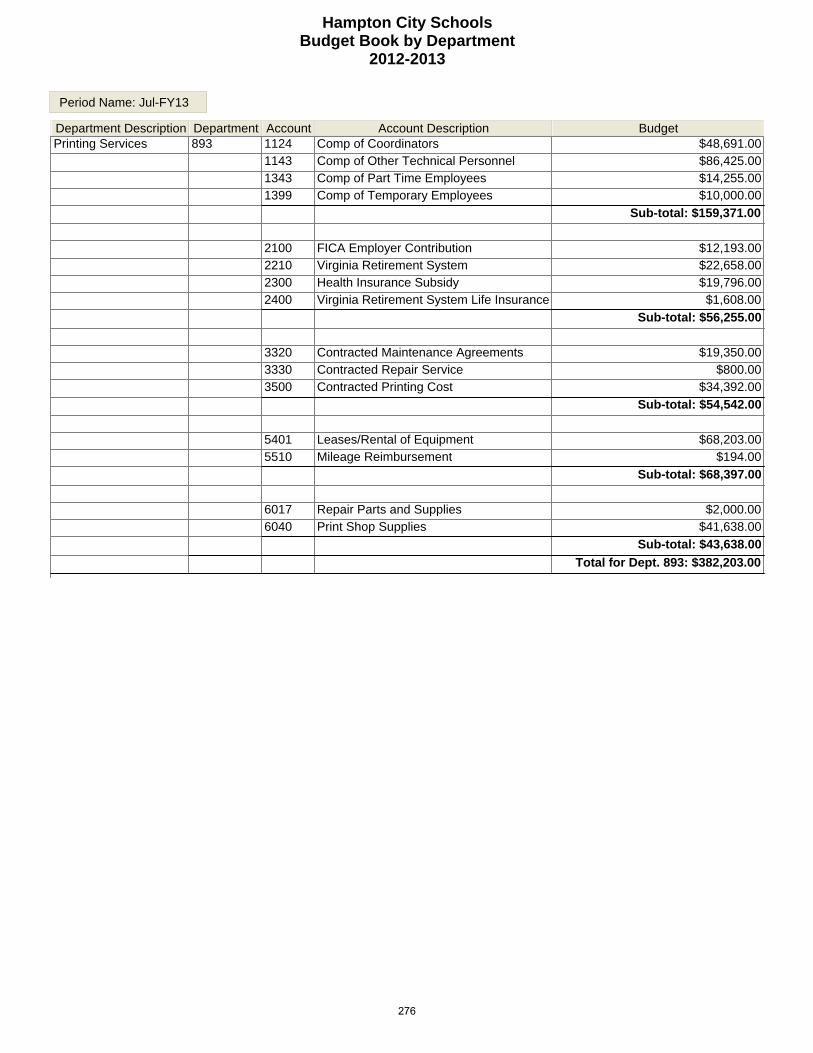
Hampton City SchoolsBudget Book by Department
2012-2013
Period Name: Jul-FY13
Department Description Department Account Account Description BudgetPrinting Services 893 1124 Comp of Coordinators $48,691.00
1143 Comp of Other Technical Personnel $86,425.001343 Comp of Part Time Employees $14,255.001399 Comp of Temporary Employees $10,000.00
Sub-total: $159,371.00
2100 FICA Employer Contribution $12,193.002210 Virginia Retirement System $22,658.002300 Health Insurance Subsidy $19,796.002400 Virginia Retirement System Life Insurance $1,608.00
Sub-total: $56,255.00
3320 Contracted Maintenance Agreements $19,350.003330 Contracted Repair Service $800.003500 Contracted Printing Cost $34,392.00
Sub-total: $54,542.00
5401 Leases/Rental of Equipment $68,203.005510 Mileage Reimbursement $194.00
Sub-total: $68,397.00
6017 Repair Parts and Supplies $2,000.006040 Print Shop Supplies $41,638.00
Sub-total: $43,638.00
Total for Dept. 893: $382,203.00
276

Hampton City SchoolsBudget Book by Department
2012-2013
Period Name: Jul-FY13
Department Description Department Account Account Description BudgetProfessional Development
837 1114 Comp of Other Admin Personnel $89,387.00
1139 Comp of Other Professional Personnel $69,999.001322 Comp of Temporary Teachers $35,000.001399 Comp of Temporary Employees $2,000.00
Sub-total: $196,386.00
2100 FICA Employer Contribution $15,024.002210 Virginia Retirement System $26,729.002300 Health Insurance Subsidy $8,412.002400 Virginia Retirement System Life Insurance $1,897.002830 Staff Development $150,500.00
Sub-total: $202,562.00
3145 Professional Services $15,000.00
Sub-total: $15,000.00
5504 Travel Expenses Professional $64,000.005510 Mileage Reimbursement $620.00
Sub-total: $64,620.00
6050 Other Expenses $6,000.00
Sub-total: $6,000.00
Total for Dept. 837: $484,568.00
277

Hampton City SchoolsBudget Book by Department
2012-2013
Period Name: Jul-FY13
Department Description Department Account Account Description BudgetPsychological Services 891 1124 Comp of Coordinators $86,359.00
1132 Comp of Psychologists $440,098.001139 Comp of Other Professional Personnel $53,900.001150 Comp of Secretary and Clerical $30,149.001339 Comp of Part Time Professional Personnel $130,434.001399 Comp of Temporary Employees $30,000.00
Sub-total: $770,940.00
2100 FICA Employer Contribution $58,975.002210 Virginia Retirement System $98,063.002300 Health Insurance Subsidy $69,467.002400 Virginia Retirement System Life Insurance $7,219.00
Sub-total: $233,724.00
3111 Contracted Testing $19,800.00
Sub-total: $19,800.00
5510 Mileage Reimbursement $3,967.005802 Dues and Association Memberships $245.00
Sub-total: $4,212.00
6001 Office Supplies $2,162.006004 Medical Supplies $18,922.006050 Other Expenses $878.00
Sub-total: $21,962.00
Total for Dept. 891: $1,050,638.00
278
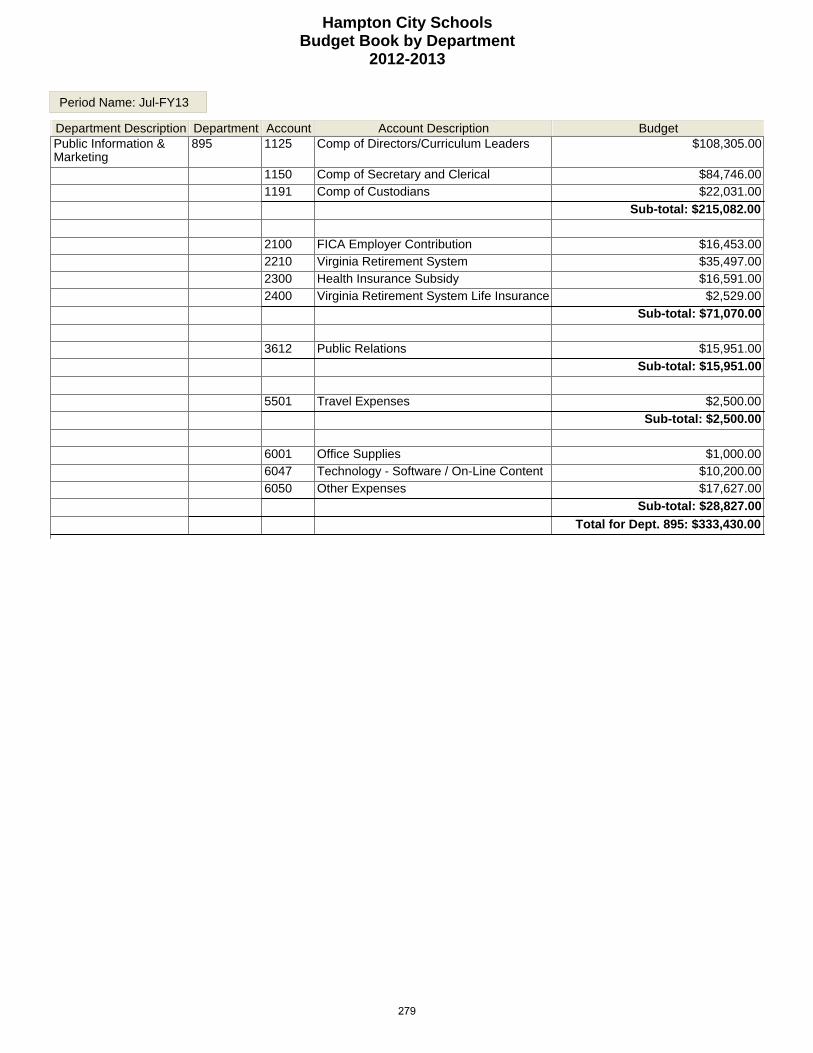
Hampton City SchoolsBudget Book by Department
2012-2013
Period Name: Jul-FY13
Department Description Department Account Account Description BudgetPublic Information & Marketing
895 1125 Comp of Directors/Curriculum Leaders $108,305.00
1150 Comp of Secretary and Clerical $84,746.001191 Comp of Custodians $22,031.00
Sub-total: $215,082.00
2100 FICA Employer Contribution $16,453.002210 Virginia Retirement System $35,497.002300 Health Insurance Subsidy $16,591.002400 Virginia Retirement System Life Insurance $2,529.00
Sub-total: $71,070.00
3612 Public Relations $15,951.00
Sub-total: $15,951.00
5501 Travel Expenses $2,500.00
Sub-total: $2,500.00
6001 Office Supplies $1,000.006047 Technology - Software / On-Line Content $10,200.006050 Other Expenses $17,627.00
Sub-total: $28,827.00
Total for Dept. 895: $333,430.00
279
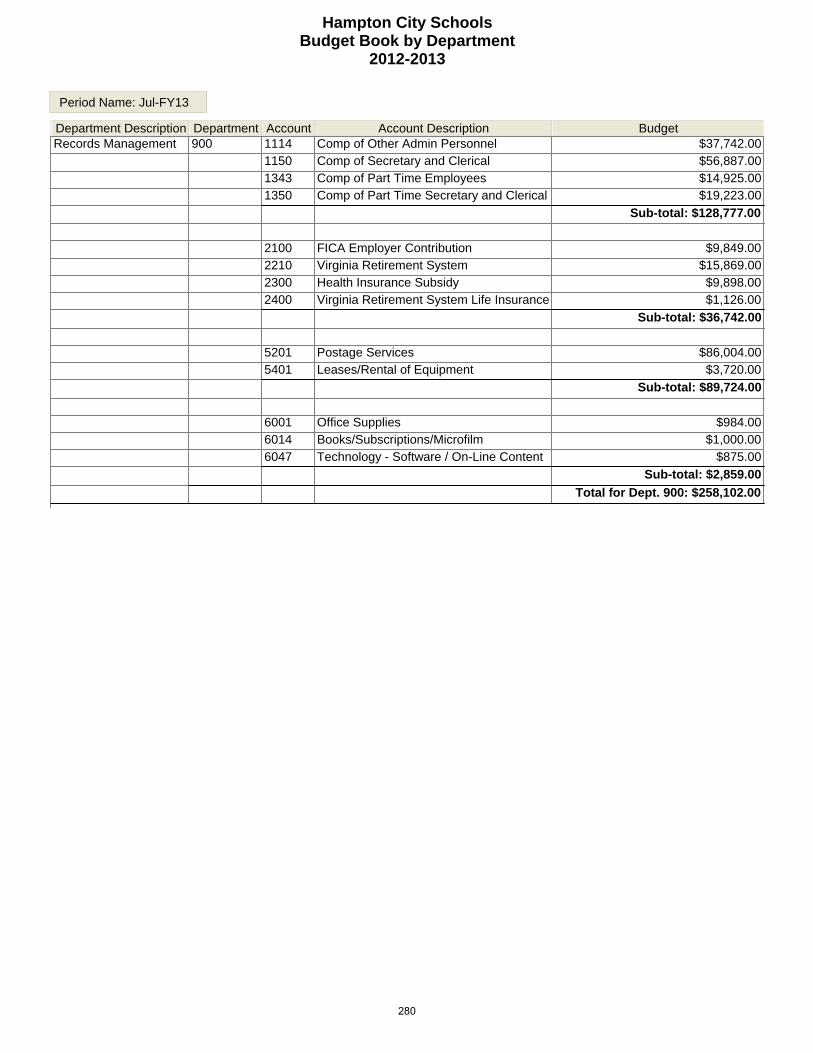
Hampton City SchoolsBudget Book by Department
2012-2013
Period Name: Jul-FY13
Department Description Department Account Account Description BudgetRecords Management 900 1114 Comp of Other Admin Personnel $37,742.00
1150 Comp of Secretary and Clerical $56,887.001343 Comp of Part Time Employees $14,925.001350 Comp of Part Time Secretary and Clerical $19,223.00
Sub-total: $128,777.00
2100 FICA Employer Contribution $9,849.002210 Virginia Retirement System $15,869.002300 Health Insurance Subsidy $9,898.002400 Virginia Retirement System Life Insurance $1,126.00
Sub-total: $36,742.00
5201 Postage Services $86,004.005401 Leases/Rental of Equipment $3,720.00
Sub-total: $89,724.00
6001 Office Supplies $984.006014 Books/Subscriptions/Microfilm $1,000.006047 Technology - Software / On-Line Content $875.00
Sub-total: $2,859.00
Total for Dept. 900: $258,102.00
280

Period Name:Jul-FY13
Department Description Department Account Account Description BudgetSchool Board 873 1111 Comp of Board Members $83,546
Sub-total: $83,546.002100 FICA Employer Contribution $6,392
Sub-total: $6,392.005505 Travel Expenses School Board $19,2645802 Dues and Association Memberships $27,646
Sub-total: $46,910.00Total for Dept. 873: $136,848.00
Hampton City Schools Budget Book by Department
2012-2013
281
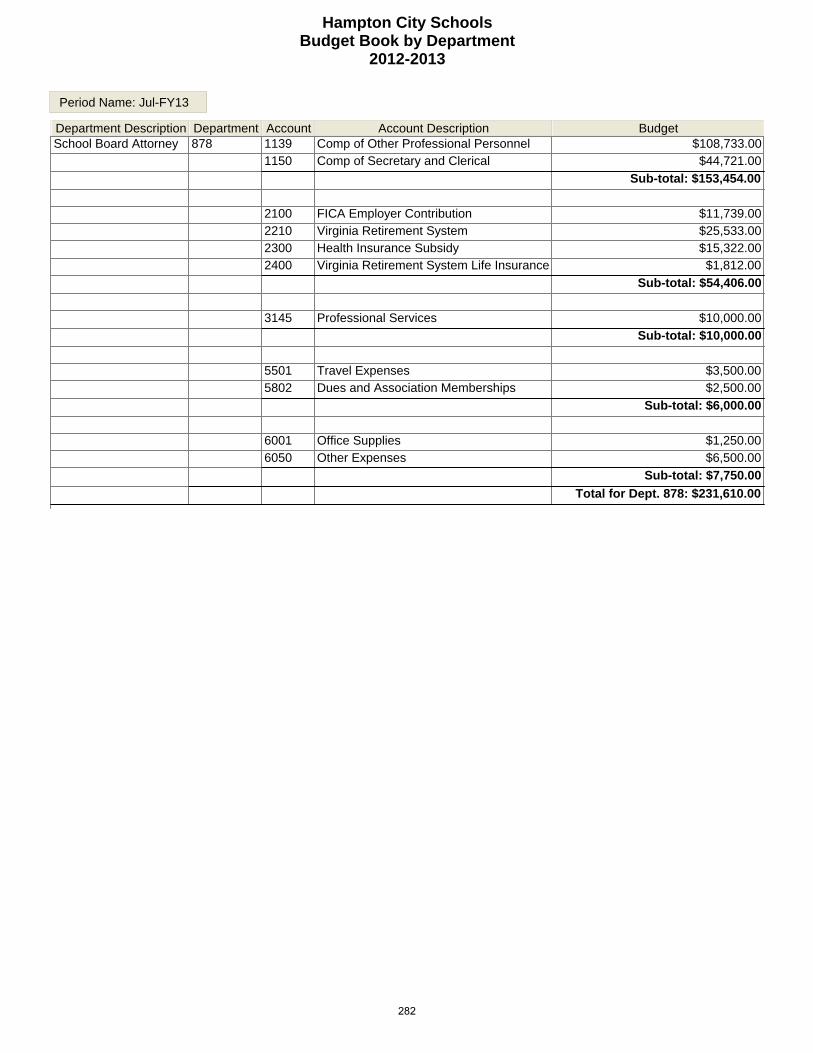
Hampton City SchoolsBudget Book by Department
2012-2013
Period Name: Jul-FY13
Department Description Department Account Account Description BudgetSchool Board Attorney 878 1139 Comp of Other Professional Personnel $108,733.00
1150 Comp of Secretary and Clerical $44,721.00
Sub-total: $153,454.00
2100 FICA Employer Contribution $11,739.002210 Virginia Retirement System $25,533.002300 Health Insurance Subsidy $15,322.002400 Virginia Retirement System Life Insurance $1,812.00
Sub-total: $54,406.00
3145 Professional Services $10,000.00
Sub-total: $10,000.00
5501 Travel Expenses $3,500.005802 Dues and Association Memberships $2,500.00
Sub-total: $6,000.00
6001 Office Supplies $1,250.006050 Other Expenses $6,500.00
Sub-total: $7,750.00
Total for Dept. 878: $231,610.00
282
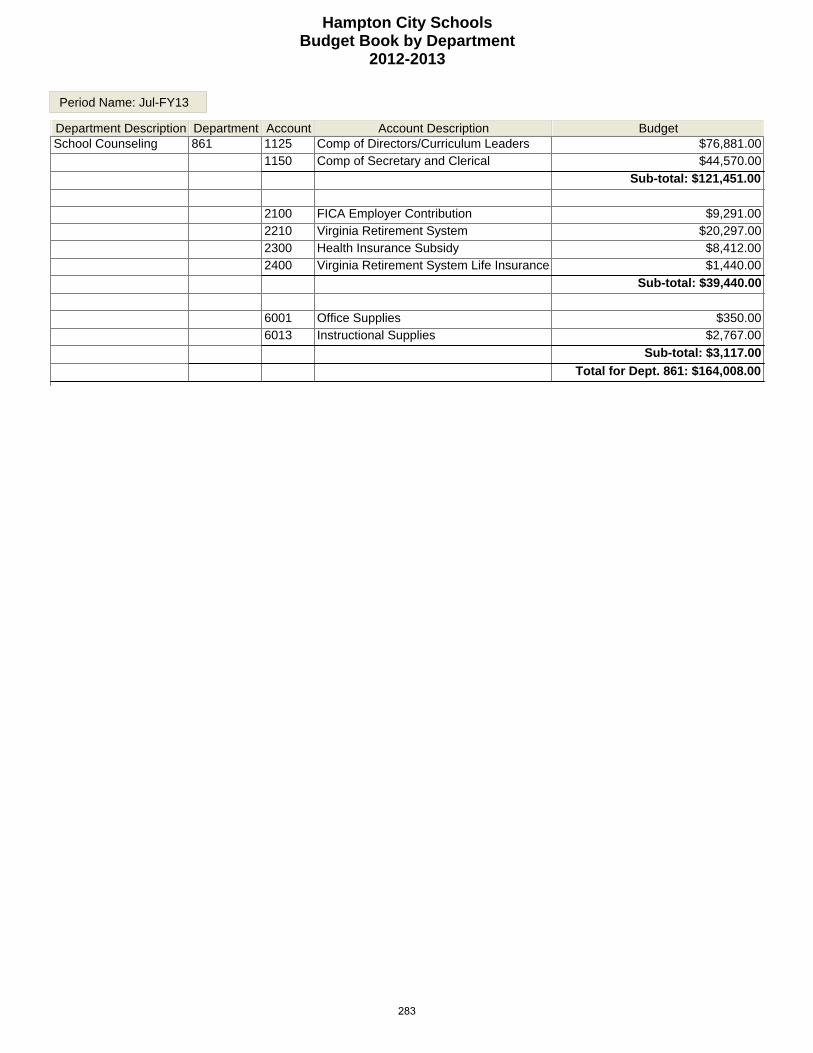
Hampton City SchoolsBudget Book by Department
2012-2013
Period Name: Jul-FY13
Department Description Department Account Account Description BudgetSchool Counseling 861 1125 Comp of Directors/Curriculum Leaders $76,881.00
1150 Comp of Secretary and Clerical $44,570.00
Sub-total: $121,451.00
2100 FICA Employer Contribution $9,291.002210 Virginia Retirement System $20,297.002300 Health Insurance Subsidy $8,412.002400 Virginia Retirement System Life Insurance $1,440.00
Sub-total: $39,440.00
6001 Office Supplies $350.006013 Instructional Supplies $2,767.00
Sub-total: $3,117.00
Total for Dept. 861: $164,008.00
283

Hampton City SchoolsBudget Book by Department
2012-2013
Period Name: Jul-FY13
Department Description Department Account Account Description BudgetSchool Social Work 901 1124 Comp of Coordinators $91,938.00
1134 Comp of Social Worker $479,792.001150 Comp of Secretary and Clerical $32,555.001334 Comp of Part-Time Social Workers $30,701.00
Sub-total: $634,986.00
2100 FICA Employer Contribution $48,575.002210 Virginia Retirement System $100,946.002300 Health Insurance Subsidy $43,530.002400 Virginia Retirement System Life Insurance $7,163.00
Sub-total: $200,214.00
5510 Mileage Reimbursement $4,934.00
Sub-total: $4,934.00
6001 Office Supplies $1,160.006013 Instructional Supplies $3,035.006050 Other Expenses $3,000.00
Sub-total: $7,195.00
7002 New Horizons- Special Ed $19,257.00
Sub-total: $19,257.00
Total for Dept. 901: $866,586.00
284
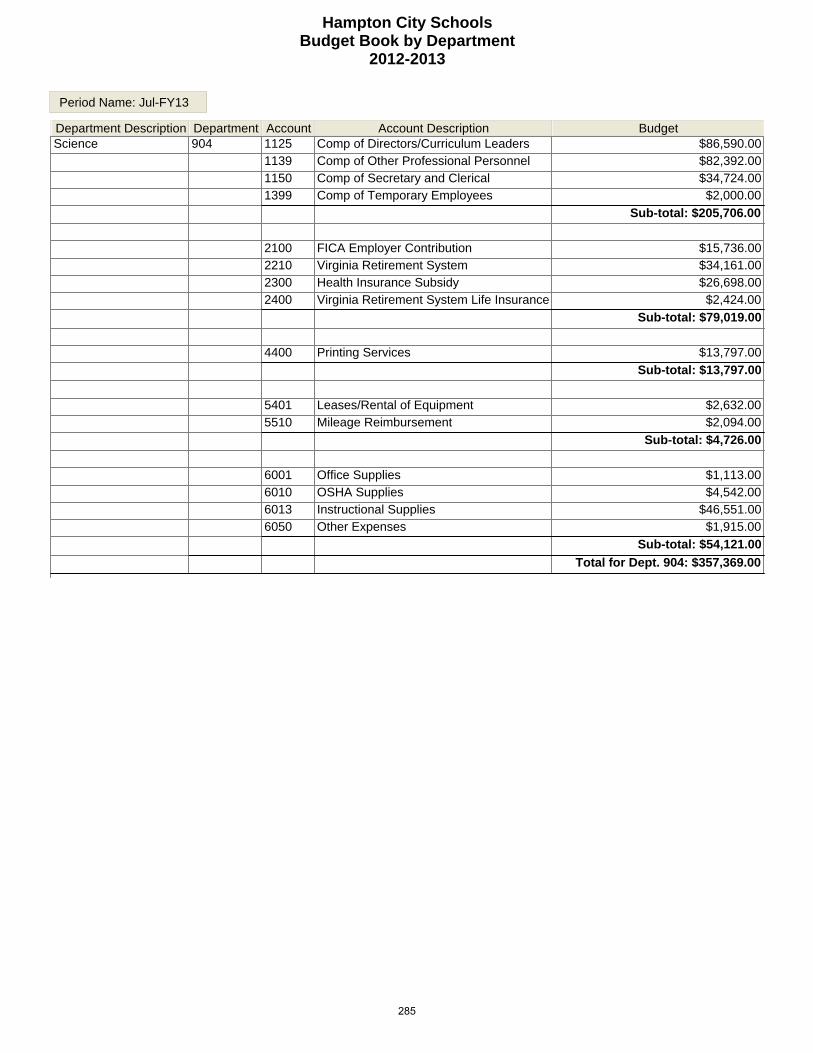
Hampton City SchoolsBudget Book by Department
2012-2013
Period Name: Jul-FY13
Department Description Department Account Account Description BudgetScience 904 1125 Comp of Directors/Curriculum Leaders $86,590.00
1139 Comp of Other Professional Personnel $82,392.001150 Comp of Secretary and Clerical $34,724.001399 Comp of Temporary Employees $2,000.00
Sub-total: $205,706.00
2100 FICA Employer Contribution $15,736.002210 Virginia Retirement System $34,161.002300 Health Insurance Subsidy $26,698.002400 Virginia Retirement System Life Insurance $2,424.00
Sub-total: $79,019.00
4400 Printing Services $13,797.00
Sub-total: $13,797.00
5401 Leases/Rental of Equipment $2,632.005510 Mileage Reimbursement $2,094.00
Sub-total: $4,726.00
6001 Office Supplies $1,113.006010 OSHA Supplies $4,542.006013 Instructional Supplies $46,551.006050 Other Expenses $1,915.00
Sub-total: $54,121.00
Total for Dept. 904: $357,369.00
285
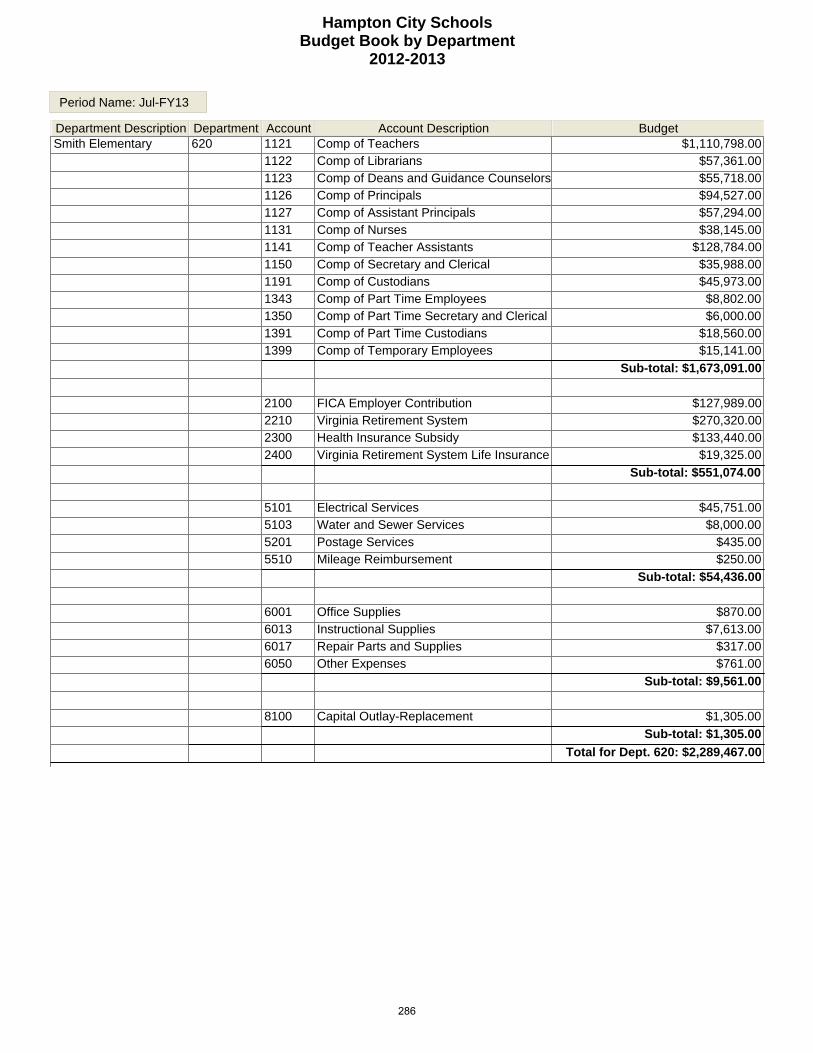
Hampton City SchoolsBudget Book by Department
2012-2013
Period Name: Jul-FY13
Department Description Department Account Account Description BudgetSmith Elementary 620 1121 Comp of Teachers $1,110,798.00
1122 Comp of Librarians $57,361.001123 Comp of Deans and Guidance Counselors $55,718.001126 Comp of Principals $94,527.001127 Comp of Assistant Principals $57,294.001131 Comp of Nurses $38,145.001141 Comp of Teacher Assistants $128,784.001150 Comp of Secretary and Clerical $35,988.001191 Comp of Custodians $45,973.001343 Comp of Part Time Employees $8,802.001350 Comp of Part Time Secretary and Clerical $6,000.001391 Comp of Part Time Custodians $18,560.001399 Comp of Temporary Employees $15,141.00
Sub-total: $1,673,091.00
2100 FICA Employer Contribution $127,989.002210 Virginia Retirement System $270,320.002300 Health Insurance Subsidy $133,440.002400 Virginia Retirement System Life Insurance $19,325.00
Sub-total: $551,074.00
5101 Electrical Services $45,751.005103 Water and Sewer Services $8,000.005201 Postage Services $435.005510 Mileage Reimbursement $250.00
Sub-total: $54,436.00
6001 Office Supplies $870.006013 Instructional Supplies $7,613.006017 Repair Parts and Supplies $317.006050 Other Expenses $761.00
Sub-total: $9,561.00
8100 Capital Outlay-Replacement $1,305.00
Sub-total: $1,305.00
Total for Dept. 620: $2,289,467.00
286

Hampton City SchoolsBudget Book by Department
2012-2013
Period Name: Jul-FY13
Department Description Department Account Account Description BudgetSocial Studies 905 1125 Comp of Directors/Curriculum Leaders $69,185.00
1139 Comp of Other Professional Personnel $126,724.001150 Comp of Secretary and Clerical $32,687.001370 Comp of Bus Drivers Extra Runs $407.00
Sub-total: $229,003.00
2100 FICA Employer Contribution $17,519.002210 Virginia Retirement System $38,336.002300 Health Insurance Subsidy $15,322.002400 Virginia Retirement System Life Insurance $2,720.00
Sub-total: $73,897.00
5510 Mileage Reimbursement $1,000.00
Sub-total: $1,000.00
6001 Office Supplies $500.006013 Instructional Supplies $37,243.006050 Other Expenses $219.00
Sub-total: $37,962.00
Total for Dept. 905: $341,862.00
287
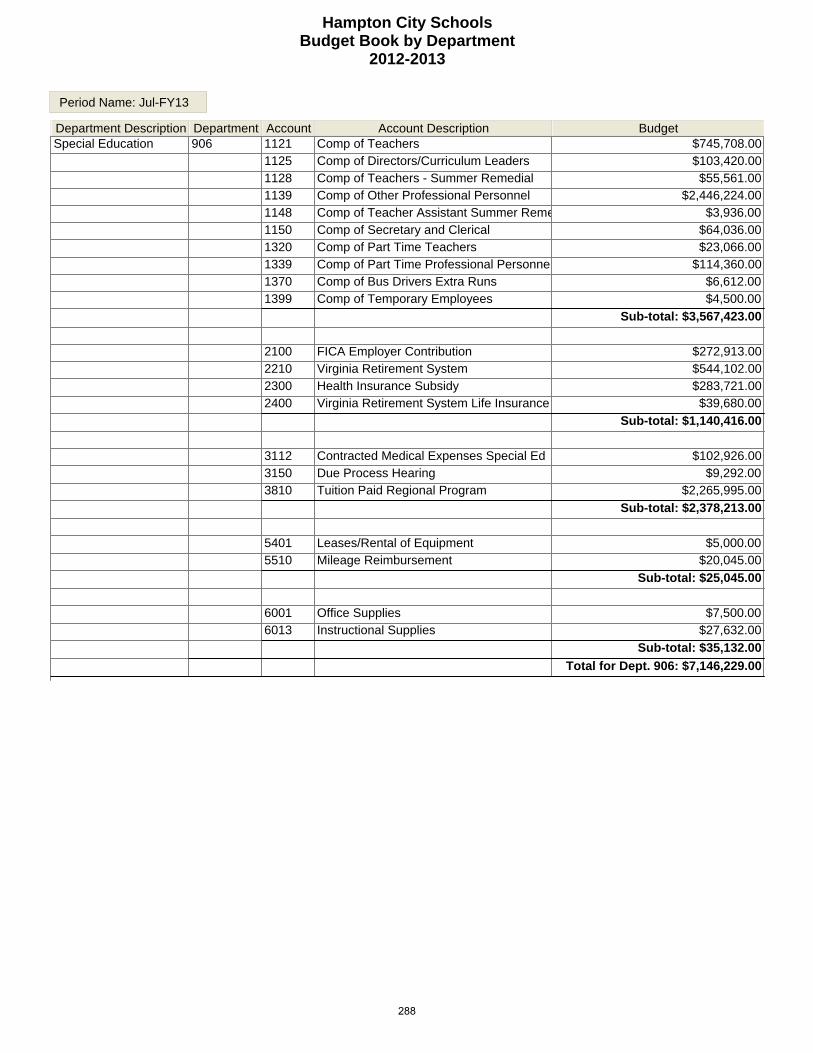
Hampton City SchoolsBudget Book by Department
2012-2013
Period Name: Jul-FY13
Department Description Department Account Account Description BudgetSpecial Education 906 1121 Comp of Teachers $745,708.00
1125 Comp of Directors/Curriculum Leaders $103,420.001128 Comp of Teachers - Summer Remedial $55,561.001139 Comp of Other Professional Personnel $2,446,224.001148 Comp of Teacher Assistant Summer Reme $3,936.001150 Comp of Secretary and Clerical $64,036.001320 Comp of Part Time Teachers $23,066.001339 Comp of Part Time Professional Personnel $114,360.001370 Comp of Bus Drivers Extra Runs $6,612.001399 Comp of Temporary Employees $4,500.00
Sub-total: $3,567,423.00
2100 FICA Employer Contribution $272,913.002210 Virginia Retirement System $544,102.002300 Health Insurance Subsidy $283,721.002400 Virginia Retirement System Life Insurance $39,680.00
Sub-total: $1,140,416.00
3112 Contracted Medical Expenses Special Ed $102,926.003150 Due Process Hearing $9,292.003810 Tuition Paid Regional Program $2,265,995.00
Sub-total: $2,378,213.00
5401 Leases/Rental of Equipment $5,000.005510 Mileage Reimbursement $20,045.00
Sub-total: $25,045.00
6001 Office Supplies $7,500.006013 Instructional Supplies $27,632.00
Sub-total: $35,132.00
Total for Dept. 906: $7,146,229.00
288
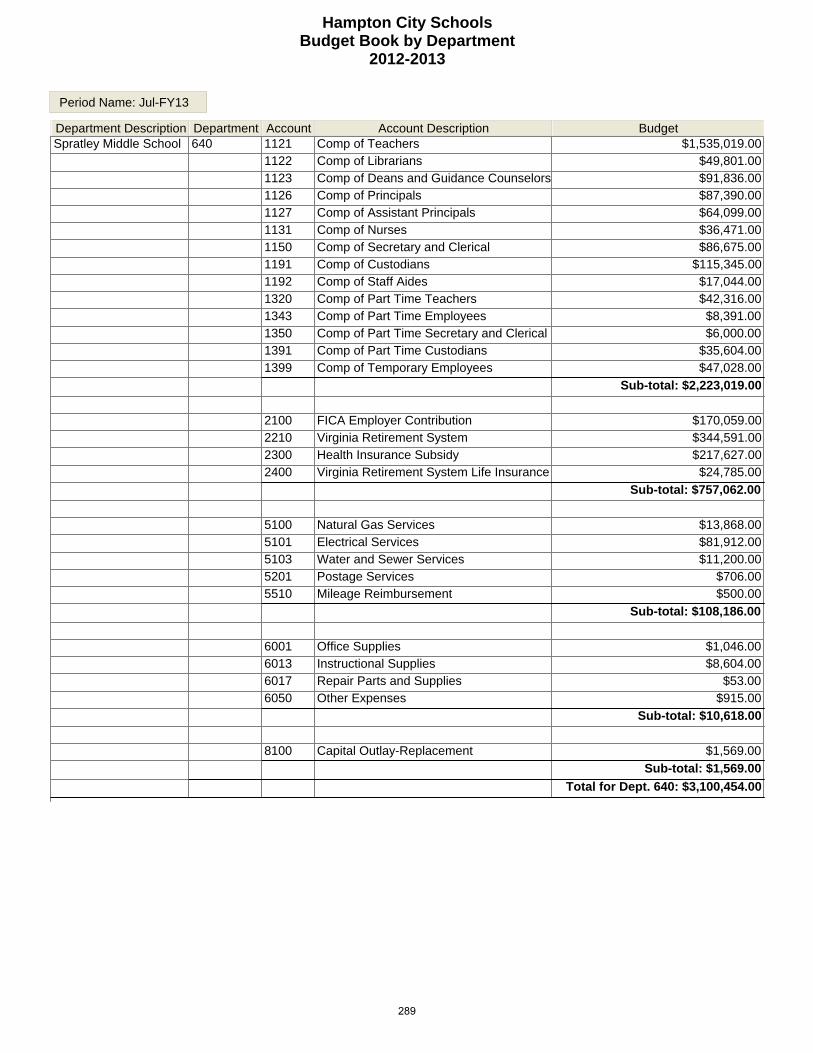
Hampton City SchoolsBudget Book by Department
2012-2013
Period Name: Jul-FY13
Department Description Department Account Account Description BudgetSpratley Middle School 640 1121 Comp of Teachers $1,535,019.00
1122 Comp of Librarians $49,801.001123 Comp of Deans and Guidance Counselors $91,836.001126 Comp of Principals $87,390.001127 Comp of Assistant Principals $64,099.001131 Comp of Nurses $36,471.001150 Comp of Secretary and Clerical $86,675.001191 Comp of Custodians $115,345.001192 Comp of Staff Aides $17,044.001320 Comp of Part Time Teachers $42,316.001343 Comp of Part Time Employees $8,391.001350 Comp of Part Time Secretary and Clerical $6,000.001391 Comp of Part Time Custodians $35,604.001399 Comp of Temporary Employees $47,028.00
Sub-total: $2,223,019.00
2100 FICA Employer Contribution $170,059.002210 Virginia Retirement System $344,591.002300 Health Insurance Subsidy $217,627.002400 Virginia Retirement System Life Insurance $24,785.00
Sub-total: $757,062.00
5100 Natural Gas Services $13,868.005101 Electrical Services $81,912.005103 Water and Sewer Services $11,200.005201 Postage Services $706.005510 Mileage Reimbursement $500.00
Sub-total: $108,186.00
6001 Office Supplies $1,046.006013 Instructional Supplies $8,604.006017 Repair Parts and Supplies $53.006050 Other Expenses $915.00
Sub-total: $10,618.00
8100 Capital Outlay-Replacement $1,569.00
Sub-total: $1,569.00
Total for Dept. 640: $3,100,454.00
289

Hampton City SchoolsBudget Book by Department
2012-2013
Period Name: Jul-FY13
Department Description Department Account Account Description BudgetStudent Services and Admin
903 1114 Comp of Other Admin Personnel $63,302.00
1125 Comp of Directors/Curriculum Leaders $87,655.001139 Comp of Other Professional Personnel $311,892.001150 Comp of Secretary and Clerical $35,328.001192 Comp of Staff Aides $36,909.001592 Comp of Substitute Staff Aides $5,000.00
Sub-total: $540,086.00
2100 FICA Employer Contribution $41,319.002210 Virginia Retirement System $87,952.002300 Health Insurance Subsidy $62,222.002400 Virginia Retirement System Life Insurance $6,241.00
Sub-total: $197,734.00
3122 Contracted Resource Officers $682,383.00
Sub-total: $682,383.00
5401 Leases/Rental of Equipment $9,000.005510 Mileage Reimbursement $2,800.00
Sub-total: $11,800.00
6001 Office Supplies $900.006013 Instructional Supplies $3,500.006017 Repair Parts and Supplies $1,800.006050 Other Expenses $2,000.00
Sub-total: $8,200.00
8100 Capital Outlay-Replacement $100.00
Sub-total: $100.00
Total for Dept. 903: $1,440,303.00
290
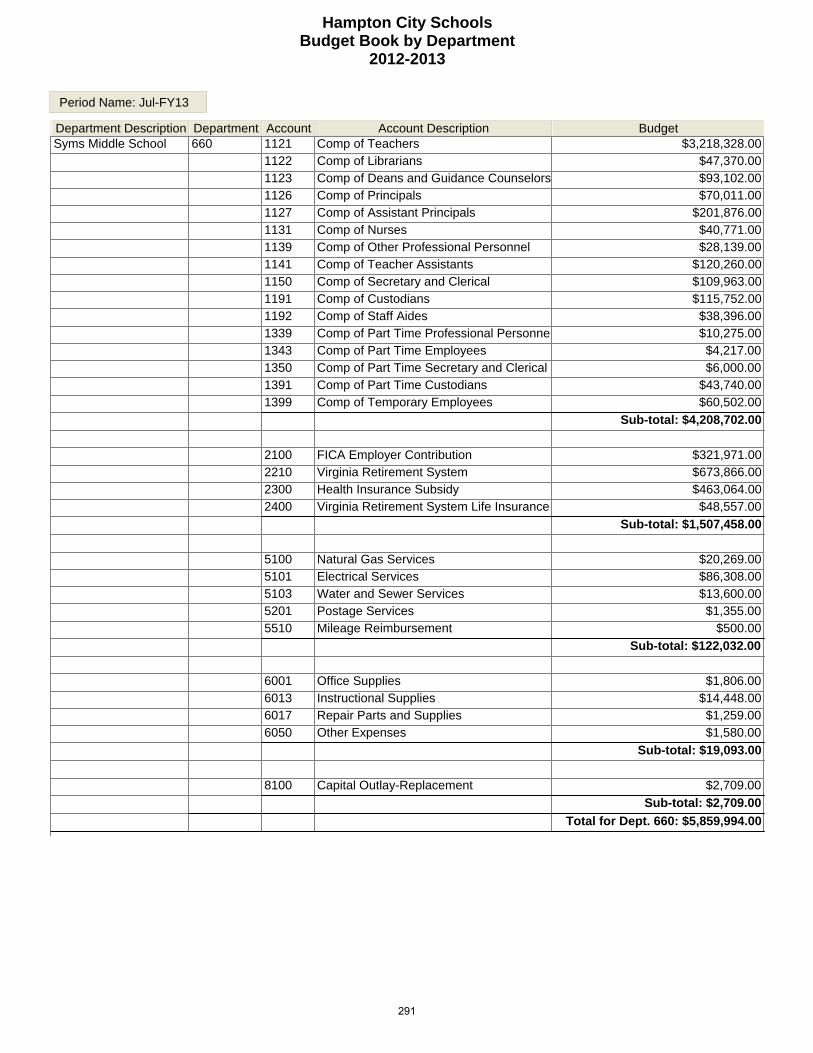
Hampton City SchoolsBudget Book by Department
2012-2013
Period Name: Jul-FY13
Department Description Department Account Account Description BudgetSyms Middle School 660 1121 Comp of Teachers $3,218,328.00
1122 Comp of Librarians $47,370.001123 Comp of Deans and Guidance Counselors $93,102.001126 Comp of Principals $70,011.001127 Comp of Assistant Principals $201,876.001131 Comp of Nurses $40,771.001139 Comp of Other Professional Personnel $28,139.001141 Comp of Teacher Assistants $120,260.001150 Comp of Secretary and Clerical $109,963.001191 Comp of Custodians $115,752.001192 Comp of Staff Aides $38,396.001339 Comp of Part Time Professional Personnel $10,275.001343 Comp of Part Time Employees $4,217.001350 Comp of Part Time Secretary and Clerical $6,000.001391 Comp of Part Time Custodians $43,740.001399 Comp of Temporary Employees $60,502.00
Sub-total: $4,208,702.00
2100 FICA Employer Contribution $321,971.002210 Virginia Retirement System $673,866.002300 Health Insurance Subsidy $463,064.002400 Virginia Retirement System Life Insurance $48,557.00
Sub-total: $1,507,458.00
5100 Natural Gas Services $20,269.005101 Electrical Services $86,308.005103 Water and Sewer Services $13,600.005201 Postage Services $1,355.005510 Mileage Reimbursement $500.00
Sub-total: $122,032.00
6001 Office Supplies $1,806.006013 Instructional Supplies $14,448.006017 Repair Parts and Supplies $1,259.006050 Other Expenses $1,580.00
Sub-total: $19,093.00
8100 Capital Outlay-Replacement $2,709.00
Sub-total: $2,709.00
Total for Dept. 660: $5,859,994.00
291
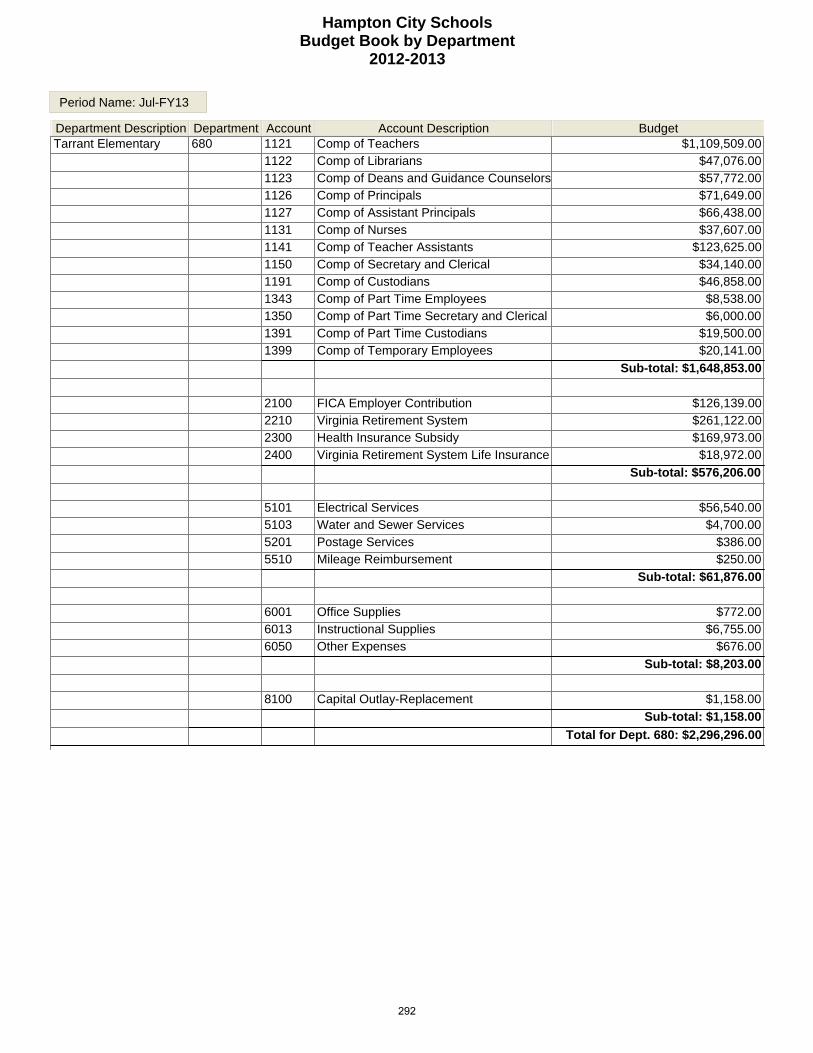
Hampton City SchoolsBudget Book by Department
2012-2013
Period Name: Jul-FY13
Department Description Department Account Account Description BudgetTarrant Elementary 680 1121 Comp of Teachers $1,109,509.00
1122 Comp of Librarians $47,076.001123 Comp of Deans and Guidance Counselors $57,772.001126 Comp of Principals $71,649.001127 Comp of Assistant Principals $66,438.001131 Comp of Nurses $37,607.001141 Comp of Teacher Assistants $123,625.001150 Comp of Secretary and Clerical $34,140.001191 Comp of Custodians $46,858.001343 Comp of Part Time Employees $8,538.001350 Comp of Part Time Secretary and Clerical $6,000.001391 Comp of Part Time Custodians $19,500.001399 Comp of Temporary Employees $20,141.00
Sub-total: $1,648,853.00
2100 FICA Employer Contribution $126,139.002210 Virginia Retirement System $261,122.002300 Health Insurance Subsidy $169,973.002400 Virginia Retirement System Life Insurance $18,972.00
Sub-total: $576,206.00
5101 Electrical Services $56,540.005103 Water and Sewer Services $4,700.005201 Postage Services $386.005510 Mileage Reimbursement $250.00
Sub-total: $61,876.00
6001 Office Supplies $772.006013 Instructional Supplies $6,755.006050 Other Expenses $676.00
Sub-total: $8,203.00
8100 Capital Outlay-Replacement $1,158.00
Sub-total: $1,158.00
Total for Dept. 680: $2,296,296.00
292

Hampton City SchoolsBudget Book by Department
2012-2013
Period Name: Jul-FY13
Department Description Department Account Account Description BudgetTransportation 922 1114 Comp of Other Admin Personnel $224,617.00
1125 Comp of Directors/Curriculum Leaders $92,397.001143 Comp of Other Technical Personnel $104,378.001150 Comp of Secretary and Clerical $35,168.001165 Comp of Garage Employees $415,419.001170 Comp of Bus Drivers $2,533,113.001190 Comp of Bus Attendants $111,573.001265 Comp of Garage Employees OT $32,240.001343 Comp of Part Time Employees $27,153.001350 Comp of Part Time Secretary and Clerical $20,505.001370 Comp of Bus Drivers Extra Runs $178,089.001371 Comp of Part Time Bus Drivers $475,868.001394 Comp of Part Time Bus Attendants $500,534.001399 Comp of Temporary Employees $28,000.00
Sub-total: $4,779,054.00
2100 FICA Employer Contribution $365,598.002210 Virginia Retirement System $510,632.002300 Health Insurance Subsidy $778,748.002400 Virginia Retirement System Life Insurance $39,686.002830 Staff Development $12,500.002831 Unused Sick Leave $1,453.002832 Unused Vacation Leave $1,511.00
Sub-total: $1,710,128.00
3145 Professional Services $25,000.00
Sub-total: $25,000.00
5100 Natural Gas Services $5,867.005101 Electrical Services $12,986.005103 Water and Sewer Services $600.005204 Cell Phone Service $15,600.005401 Leases/Rental of Equipment $5,100.005402 Leases/Rental of Buildings $120,000.00
Sub-total: $160,153.00
6001 Office Supplies $1,832.006008 Vehicle and Power Equipment Fuels $1,504,897.006009 Vehicle and Power Equipment Supplies $712,478.006047 Technology - Software / On-Line Content $40,452.006050 Other Expenses $62,000.00
Sub-total: $2,321,659.00
8102 Lease/Purchase Agreements $80,000.00
Sub-total: $80,000.00
9920 Contingency $10,000.00
293
Hampton City SchoolsBudget Book by Department
2012-2013
Period Name: Jul-FY13
Department Description Department Account Account Description BudgetSub-total: $10,000.00
Total for Dept. 922: $9,085,994.00
294
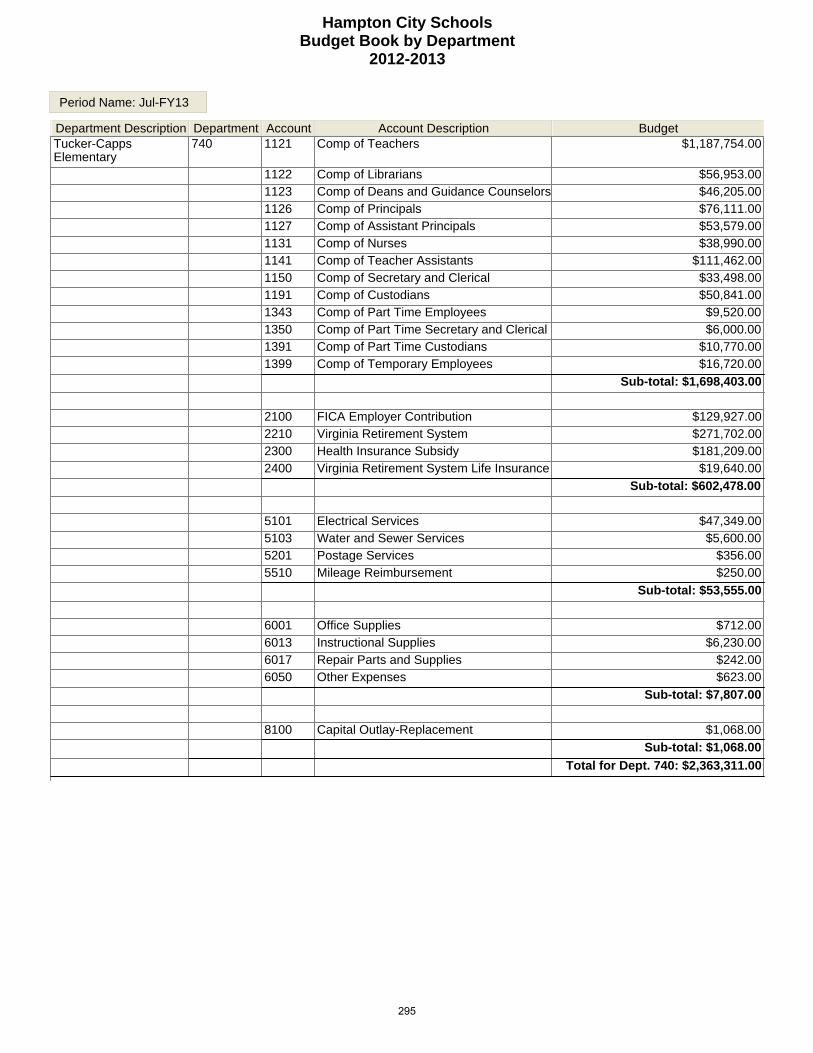
Hampton City SchoolsBudget Book by Department
2012-2013
Period Name: Jul-FY13
Department Description Department Account Account Description BudgetTucker-Capps Elementary
740 1121 Comp of Teachers $1,187,754.00
1122 Comp of Librarians $56,953.001123 Comp of Deans and Guidance Counselors $46,205.001126 Comp of Principals $76,111.001127 Comp of Assistant Principals $53,579.001131 Comp of Nurses $38,990.001141 Comp of Teacher Assistants $111,462.001150 Comp of Secretary and Clerical $33,498.001191 Comp of Custodians $50,841.001343 Comp of Part Time Employees $9,520.001350 Comp of Part Time Secretary and Clerical $6,000.001391 Comp of Part Time Custodians $10,770.001399 Comp of Temporary Employees $16,720.00
Sub-total: $1,698,403.00
2100 FICA Employer Contribution $129,927.002210 Virginia Retirement System $271,702.002300 Health Insurance Subsidy $181,209.002400 Virginia Retirement System Life Insurance $19,640.00
Sub-total: $602,478.00
5101 Electrical Services $47,349.005103 Water and Sewer Services $5,600.005201 Postage Services $356.005510 Mileage Reimbursement $250.00
Sub-total: $53,555.00
6001 Office Supplies $712.006013 Instructional Supplies $6,230.006017 Repair Parts and Supplies $242.006050 Other Expenses $623.00
Sub-total: $7,807.00
8100 Capital Outlay-Replacement $1,068.00
Sub-total: $1,068.00
Total for Dept. 740: $2,363,311.00
295

Hampton City SchoolsBudget Book by Department
2012-2013
Period Name: Jul-FY13
Department Description Department Account Account Description BudgetTyler Elementary 760 1121 Comp of Teachers $1,409,491.00
1122 Comp of Librarians $62,240.001123 Comp of Deans and Guidance Counselors $43,927.001126 Comp of Principals $70,024.001127 Comp of Assistant Principals $68,327.001131 Comp of Nurses $35,765.001141 Comp of Teacher Assistants $177,365.001150 Comp of Secretary and Clerical $34,215.001191 Comp of Custodians $49,272.001343 Comp of Part Time Employees $8,634.001350 Comp of Part Time Secretary and Clerical $6,000.001391 Comp of Part Time Custodians $19,900.001399 Comp of Temporary Employees $10,341.00
Sub-total: $1,995,501.00
2100 FICA Employer Contribution $152,655.002210 Virginia Retirement System $315,894.002300 Health Insurance Subsidy $203,703.002400 Virginia Retirement System Life Insurance $23,125.00
Sub-total: $695,377.00
5101 Electrical Services $47,349.005103 Water and Sewer Services $6,200.005201 Postage Services $482.005510 Mileage Reimbursement $250.00
Sub-total: $54,281.00
6001 Office Supplies $964.006013 Instructional Supplies $8,435.006050 Other Expenses $844.00
Sub-total: $10,243.00
8100 Capital Outlay-Replacement $1,446.00
Sub-total: $1,446.00
Total for Dept. 760: $2,756,848.00
296
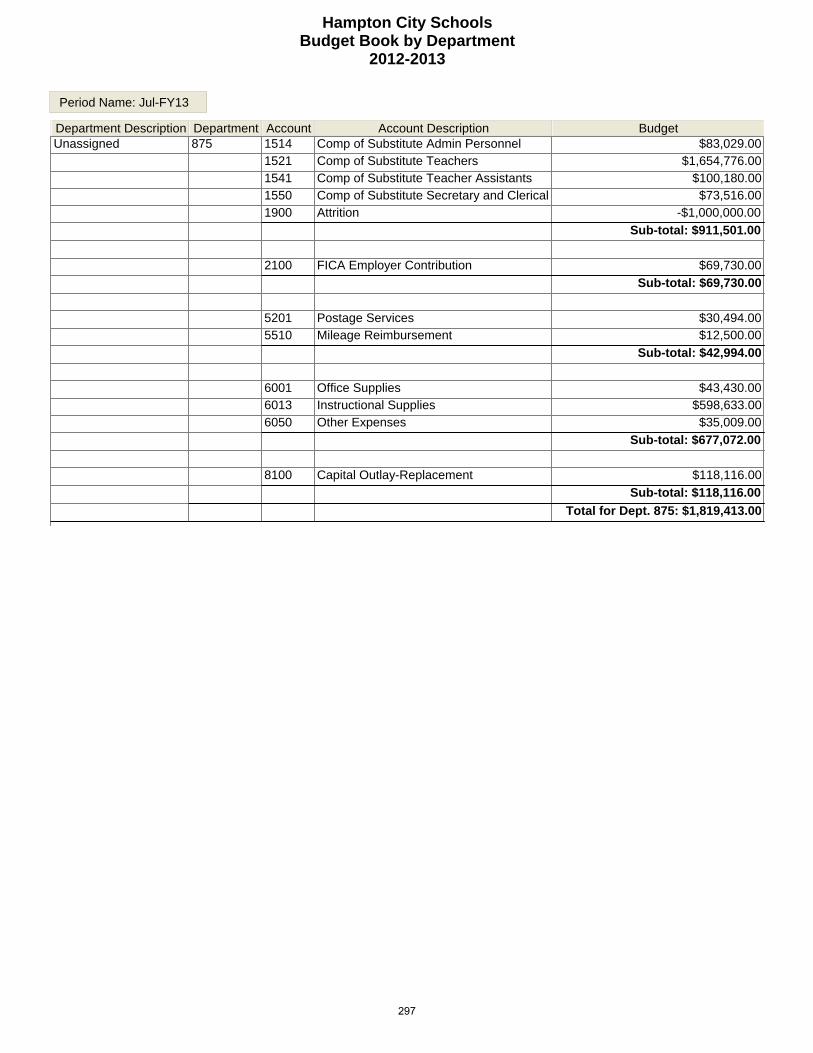
Hampton City SchoolsBudget Book by Department
2012-2013
Period Name: Jul-FY13
Department Description Department Account Account Description BudgetUnassigned 875 1514 Comp of Substitute Admin Personnel $83,029.00
1521 Comp of Substitute Teachers $1,654,776.001541 Comp of Substitute Teacher Assistants $100,180.001550 Comp of Substitute Secretary and Clerical $73,516.001900 Attrition -$1,000,000.00
Sub-total: $911,501.00
2100 FICA Employer Contribution $69,730.00
Sub-total: $69,730.00
5201 Postage Services $30,494.005510 Mileage Reimbursement $12,500.00
Sub-total: $42,994.00
6001 Office Supplies $43,430.006013 Instructional Supplies $598,633.006050 Other Expenses $35,009.00
Sub-total: $677,072.00
8100 Capital Outlay-Replacement $118,116.00
Sub-total: $118,116.00
Total for Dept. 875: $1,819,413.00
297

Hampton City SchoolsBudget Book by Department
2012-2013
Period Name: Jul-FY13
Department Description Department Account Account Description BudgetWythe Elementary 820 5101 Electrical Services $23,275.00
Sub-total: $23,275.00
Total for Dept. 820: $23,275.00
298
OTHER FUNDS
FOOD & NUTRITION SERVICES REIMBURSABLE PROJECTS
STUDENT ACTIVITIES
2012 - 2013
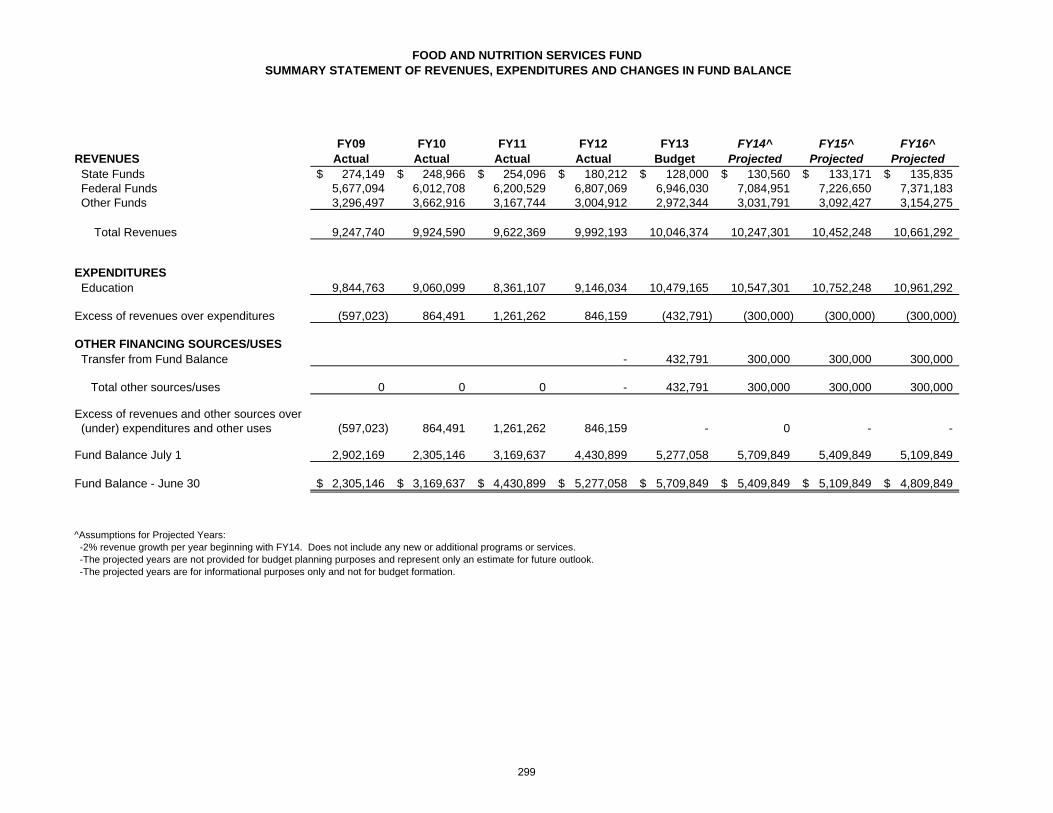
FOOD AND NUTRITION SERVICES FUNDSUMMARY STATEMENT OF REVENUES, EXPENDITURES AND CHANGES IN FUND BALANCE
FY09 FY10 FY11 FY12 FY13 FY14^ FY15^ FY16^REVENUES Actual Actual Actual Actual Budget Projected Projected Projected State Funds 274,149$ 248,966$ 254,096$ 180,212$ 128,000$ 130,560$ 133,171$ 135,835$ Federal Funds 5,677,094 6,012,708 6,200,529 6,807,069 6,946,030 7,084,951 7,226,650 7,371,183 Other Funds 3,296,497 3,662,916 3,167,744 3,004,912 2,972,344 3,031,791 3,092,427 3,154,275
Total Revenues 9,247,740 9,924,590 9,622,369 9,992,193 10,046,374 10,247,301 10,452,248 10,661,292
EXPENDITURES Education 9,844,763 9,060,099 8,361,107 9,146,034 10,479,165 10,547,301 10,752,248 10,961,292
Excess of revenues over expenditures (597,023) 864,491 1,261,262 846,159 (432,791) (300,000) (300,000) (300,000)
OTHER FINANCING SOURCES/USES Transfer from Fund Balance - 432,791 300,000 300,000 300,000
Total other sources/uses 0 0 0 - 432,791 300,000 300,000 300,000
Excess of revenues and other sources over (under) expenditures and other uses (597,023) 864,491 1,261,262 846,159 - 0 - -
Fund Balance July 1 2,902,169 2,305,146 3,169,637 4,430,899 5,277,058 5,709,849 5,409,849 5,109,849
Fund Balance - June 30 2,305,146$ 3,169,637$ 4,430,899$ 5,277,058$ 5,709,849$ 5,409,849$ 5,109,849$ 4,809,849$
^Assumptions for Projected Years: -2% revenue growth per year beginning with FY14. Does not include any new or additional programs or services. -The projected years are not provided for budget planning purposes and represent only an estimate for future outlook. -The projected years are for informational purposes only and not for budget formation.
299
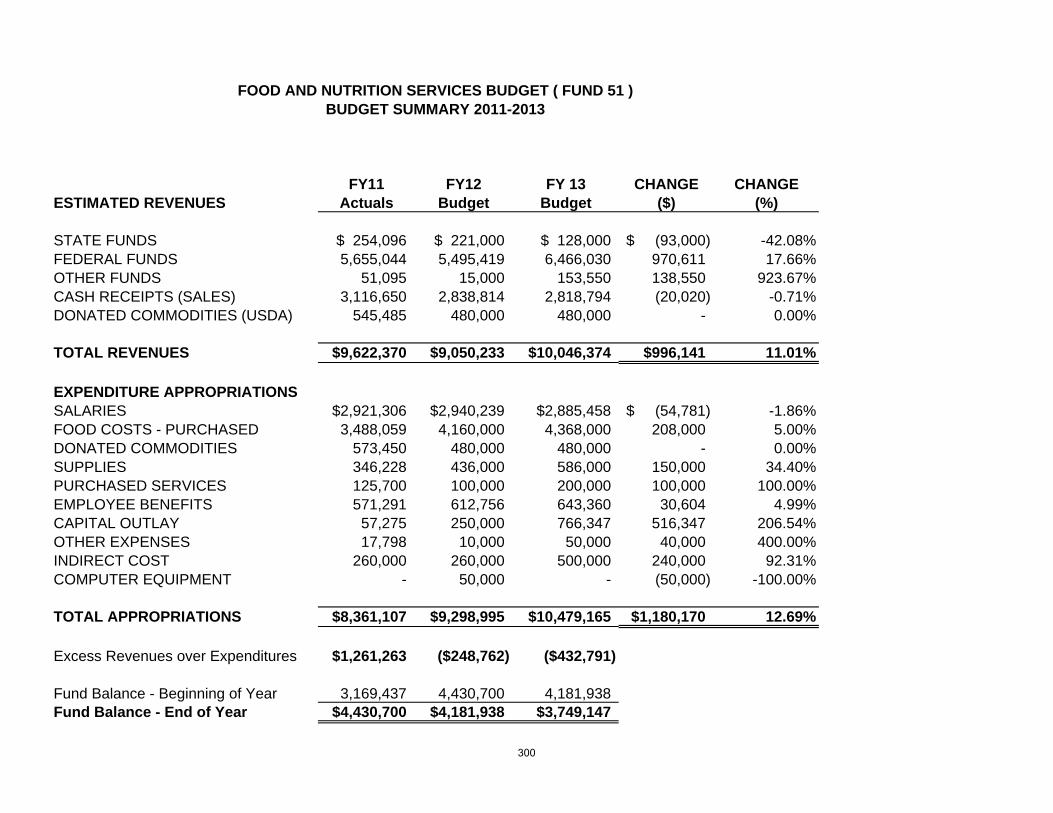
FY11 FY12 FY 13 CHANGE CHANGEESTIMATED REVENUES Actuals Budget Budget ($) (%)
STATE FUNDS $ 254,096 $ 221,000 $ 128,000 (93,000)$ -42.08%FEDERAL FUNDS 5,655,044 5,495,419 6,466,030 970,611 17.66%OTHER FUNDS 51,095 15,000 153,550 138,550 923.67%CASH RECEIPTS (SALES) 3,116,650 2,838,814 2,818,794 (20,020) -0.71%DONATED COMMODITIES (USDA) 545,485 480,000 480,000 - 0.00%
TOTAL REVENUES $9,622,370 $9,050,233 $10,046,374 $996,141 11.01%
EXPENDITURE APPROPRIATIONS SALARIES $2,921,306 $2,940,239 $2,885,458 (54,781)$ -1.86% FOOD COSTS - PURCHASED 3,488,059 4,160,000 4,368,000 208,000 5.00%DONATED COMMODITIES 573,450 480,000 480,000 - 0.00%SUPPLIES 346,228 436,000 586,000 150,000 34.40%PURCHASED SERVICES 125,700 100,000 200,000 100,000 100.00%EMPLOYEE BENEFITS 571,291 612,756 643,360 30,604 4.99%CAPITAL OUTLAY 57,275 250,000 766,347 516,347 206.54%OTHER EXPENSES 17,798 10,000 50,000 40,000 400.00%INDIRECT COST 260,000 260,000 500,000 240,000 92.31%COMPUTER EQUIPMENT - 50,000 - (50,000) -100.00%
TOTAL APPROPRIATIONS $8,361,107 $9,298,995 $10,479,165 $1,180,170 12.69%
Excess Revenues over Expenditures $1,261,263 ($248,762) ($432,791)
Fund Balance - Beginning of Year 3,169,437 4,430,700 4,181,938Fund Balance - End of Year $4,430,700 $4,181,938 $3,749,147
FOOD AND NUTRITION SERVICES BUDGET ( FUND 51 )BUDGET SUMMARY 2011-2013
300
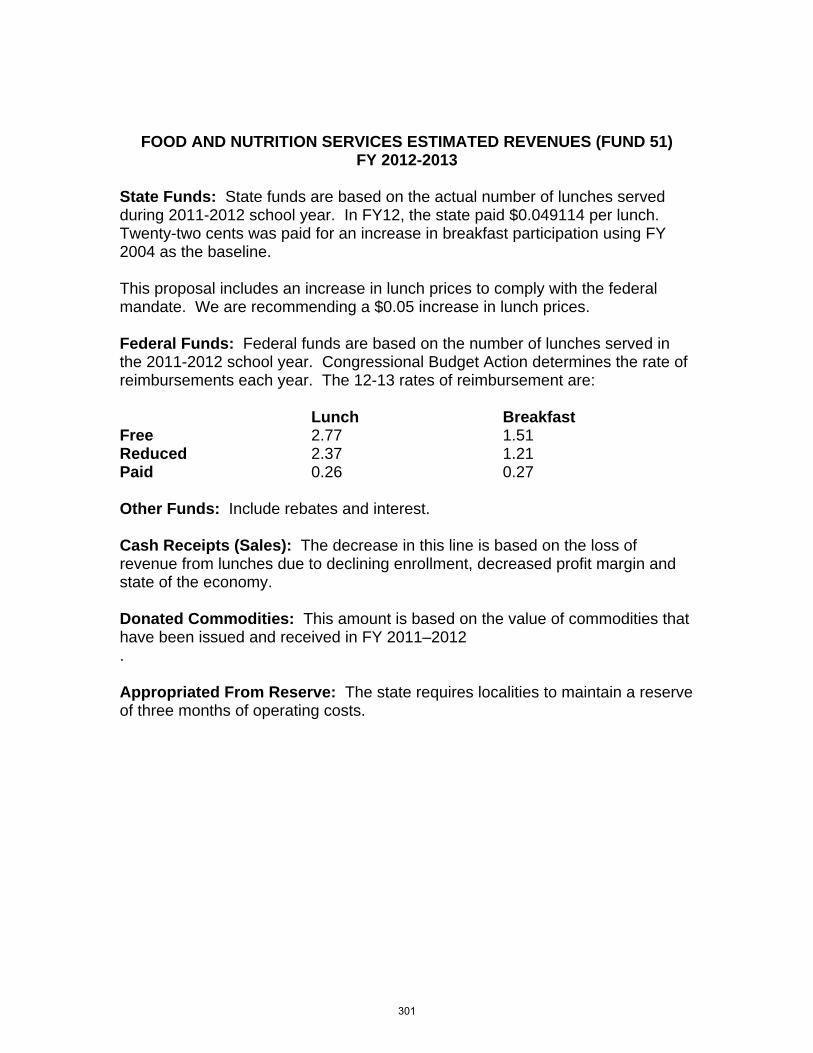
FOOD AND NUTRITION SERVICES ESTIMATED REVENUES (FUND 51) FY 2012-2013
State Funds: State funds are based on the actual number of lunches served during 2011-2012 school year. In FY12, the state paid $0.049114 per lunch. Twenty-two cents was paid for an increase in breakfast participation using FY 2004 as the baseline. This proposal includes an increase in lunch prices to comply with the federal mandate. We are recommending a $0.05 increase in lunch prices. Federal Funds: Federal funds are based on the number of lunches served in the 2011-2012 school year. Congressional Budget Action determines the rate of reimbursements each year. The 12-13 rates of reimbursement are: Lunch Breakfast Free 2.77 1.51 Reduced 2.37 1.21 Paid 0.26 0.27 Other Funds: Include rebates and interest. Cash Receipts (Sales): The decrease in this line is based on the loss of revenue from lunches due to declining enrollment, decreased profit margin and state of the economy. Donated Commodities: This amount is based on the value of commodities that have been issued and received in FY 2011–2012 . Appropriated From Reserve: The state requires localities to maintain a reserve of three months of operating costs.
301

FOOD AND NUTRITION SERVICES APPROPRIATIONS (FUND 51) FY 2012-2013
Salaries: The decrease in this line item is based on actual staffing costs incurred in 2011-12. Food Costs – Purchased: The increase in this line item is due to a 5% increase in food costs and new federal regulations. Donated Commodities: Donated commodities are based on the percent of participation in the previous year. Supplies: The line item is increased due to an escalation in the price of petroleum products. Purchased Services: The line item increased due to the need for more software products and the cost of licenses and maintenance agreements. Employee Benefits: Funds are increased due to a VRS rate change from 12.21% to 17.96% for all full time employees. Capital Outlay: This line item is based on planned equipment replacement. Other Expenses: This line item includes marketing, staff development, printing of menus, meal applications and the increased cost of uniforms. Indirect Cost: This line item is the cost charged to Food and Nutrition Services by Fund 50. Computer Equipment: These items are now included in Capital Outlay.
302
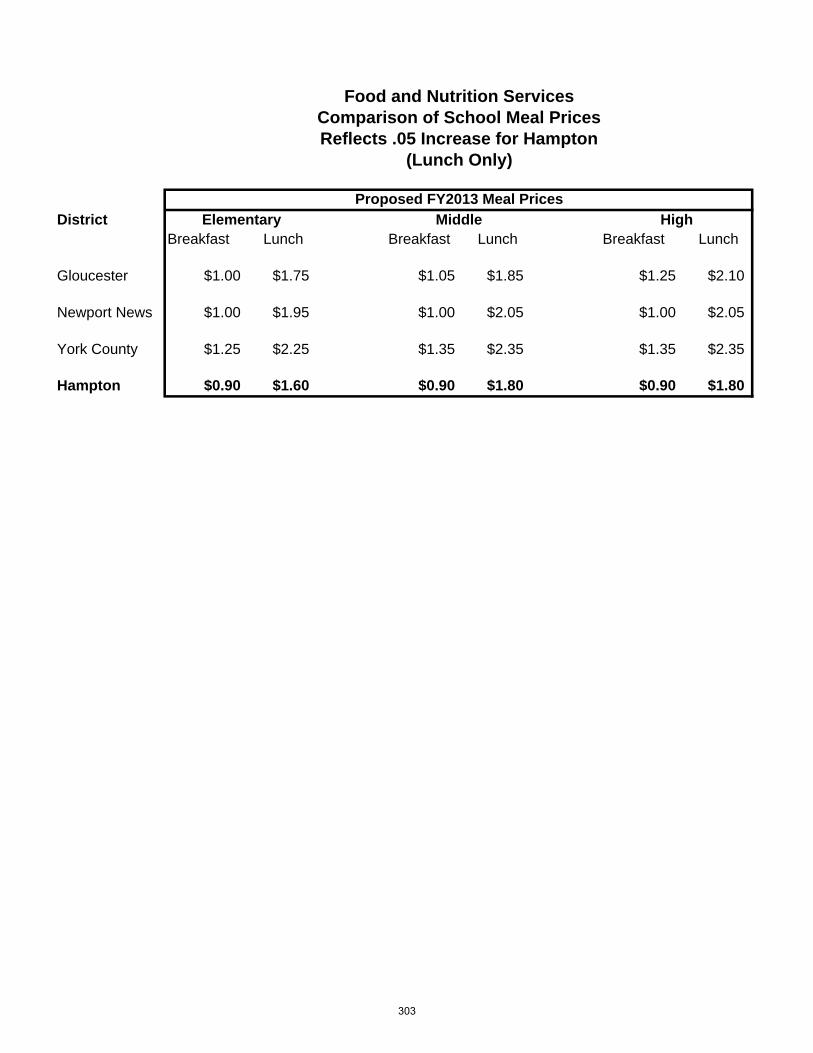
DistrictBreakfast Lunch Breakfast Lunch Breakfast Lunch
Gloucester $1.00 $1.75 $1.05 $1.85 $1.25 $2.10
Newport News $1.00 $1.95 $1.00 $2.05 $1.00 $2.05
York County $1.25 $2.25 $1.35 $2.35 $1.35 $2.35
Hampton $0.90 $1.60 $0.90 $1.80 $0.90 $1.80
Food and Nutrition Services
Elementary Middle High
Comparison of School Meal PricesReflects .05 Increase for Hampton
(Lunch Only)
Proposed FY2013 Meal Prices
303
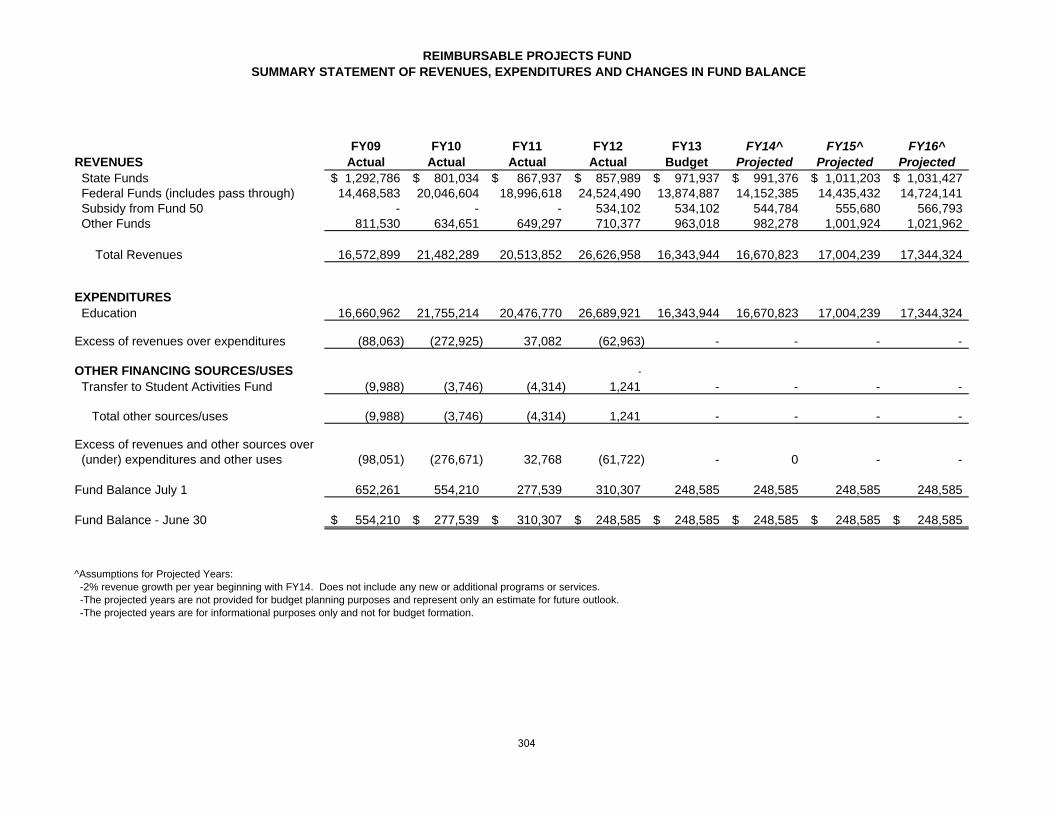
REIMBURSABLE PROJECTS FUNDSUMMARY STATEMENT OF REVENUES, EXPENDITURES AND CHANGES IN FUND BALANCE
FY09 FY10 FY11 FY12 FY13 FY14^ FY15^ FY16^REVENUES Actual Actual Actual Actual Budget Projected Projected Projected State Funds 1,292,786$ 801,034$ 867,937$ 857,989$ 971,937$ 991,376$ 1,011,203$ 1,031,427$ Federal Funds (includes pass through) 14,468,583 20,046,604 18,996,618 24,524,490 13,874,887 14,152,385 14,435,432 14,724,141 Subsidy from Fund 50 - - - 534,102 534,102 544,784 555,680 566,793 Other Funds 811,530 634,651 649,297 710,377 963,018 982,278 1,001,924 1,021,962
Total Revenues 16,572,899 21,482,289 20,513,852 26,626,958 16,343,944 16,670,823 17,004,239 17,344,324
EXPENDITURES Education 16,660,962 21,755,214 20,476,770 26,689,921 16,343,944 16,670,823 17,004,239 17,344,324
Excess of revenues over expenditures (88,063) (272,925) 37,082 (62,963) - - - -
OTHER FINANCING SOURCES/USES -
Transfer to Student Activities Fund (9,988) (3,746) (4,314) 1,241 - - - -
Total other sources/uses (9,988) (3,746) (4,314) 1,241 - - - -
Excess of revenues and other sources over (under) expenditures and other uses (98,051) (276,671) 32,768 (61,722) - 0 - -
Fund Balance July 1 652,261 554,210 277,539 310,307 248,585 248,585 248,585 248,585
Fund Balance - June 30 554,210$ 277,539$ 310,307$ 248,585$ 248,585$ 248,585$ 248,585$ 248,585$
^Assumptions for Projected Years: -2% revenue growth per year beginning with FY14. Does not include any new or additional programs or services. -The projected years are not provided for budget planning purposes and represent only an estimate for future outlook. -The projected years are for informational purposes only and not for budget formation.
304
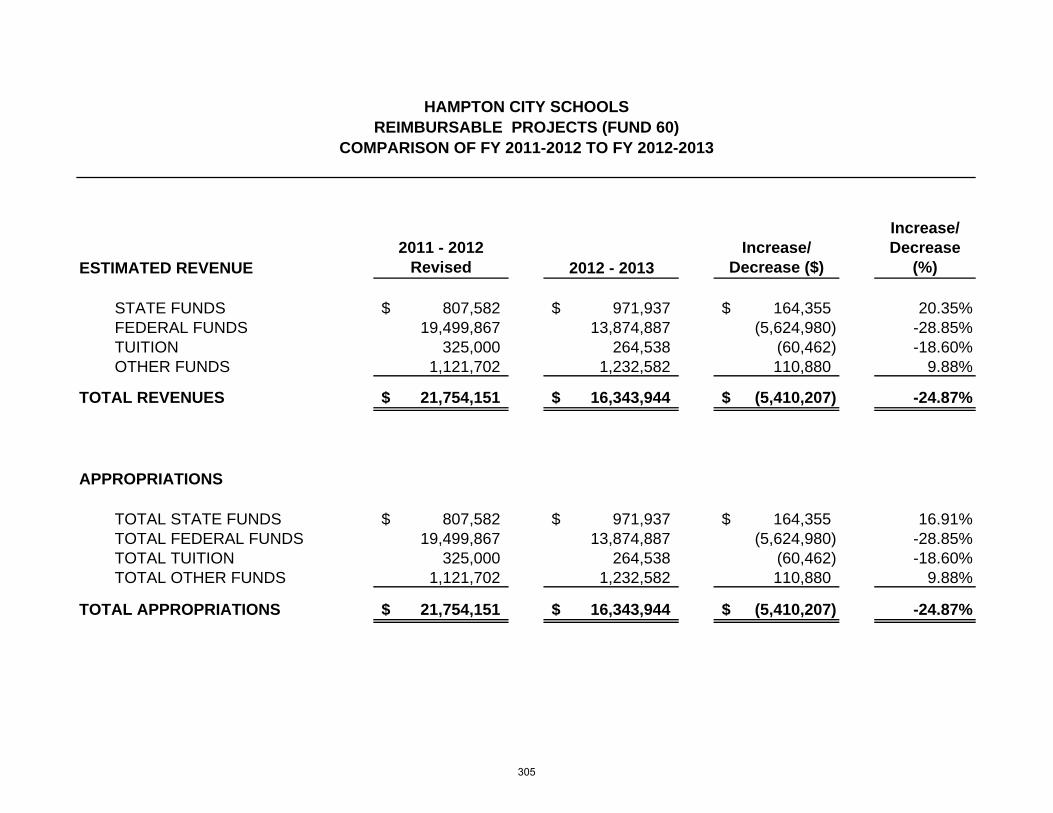
ESTIMATED REVENUE2011 - 2012
Revised 2012 - 2013Increase/
Decrease ($)
Increase/ Decrease
(%)
STATE FUNDS 807,582$ 971,937$ 164,355$ 20.35% FEDERAL FUNDS 19,499,867 13,874,887 (5,624,980) -28.85% TUITION 325,000 264,538 (60,462) -18.60% OTHER FUNDS 1,121,702 1,232,582 110,880 9.88%
TOTAL REVENUES 21,754,151$ 16,343,944$ (5,410,207)$ -24.87%
APPROPRIATIONS
TOTAL STATE FUNDS 807,582$ 971,937$ 164,355$ 16.91% TOTAL FEDERAL FUNDS 19,499,867 13,874,887 (5,624,980) -28.85% TOTAL TUITION 325,000 264,538 (60,462) -18.60% TOTAL OTHER FUNDS 1,121,702 1,232,582 110,880 9.88%
TOTAL APPROPRIATIONS 21,754,151$ 16,343,944$ (5,410,207)$ -24.87%
REIMBURSABLE PROJECTS (FUND 60)HAMPTON CITY SCHOOLS
COMPARISON OF FY 2011-2012 TO FY 2012-2013
305
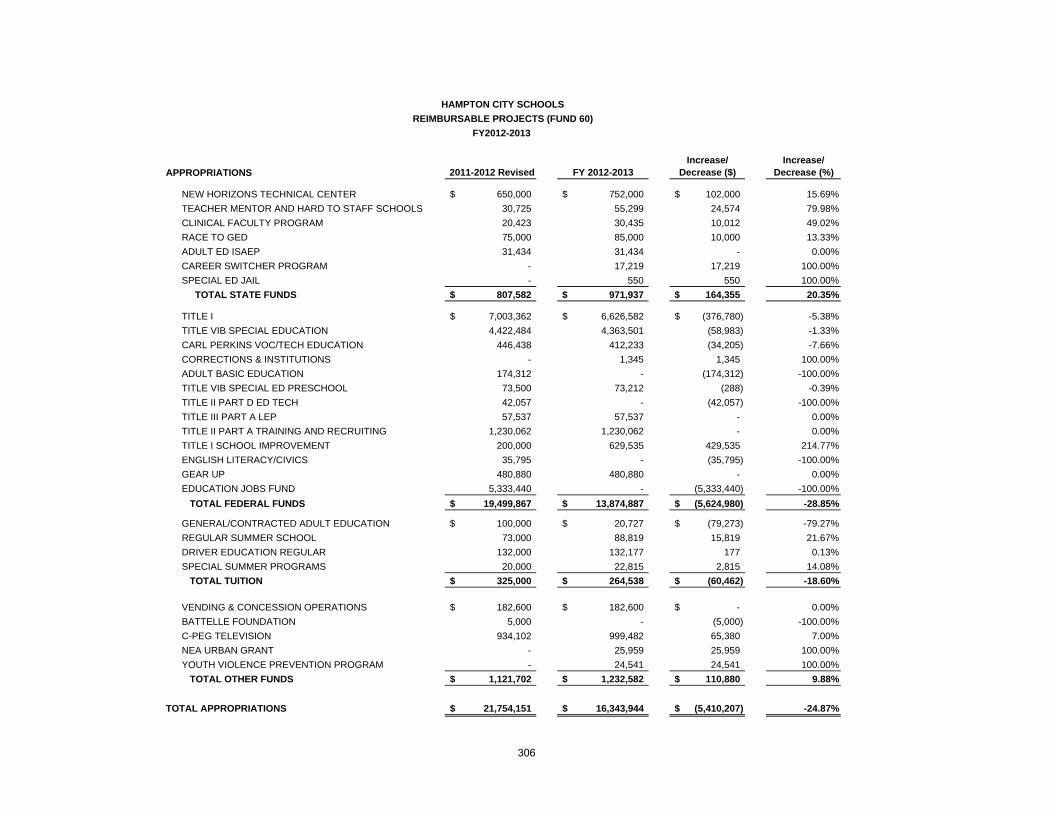
APPROPRIATIONS 2011-2012 Revised FY 2012-2013Increase/
Decrease ($)Increase/
Decrease (%)
NEW HORIZONS TECHNICAL CENTER 650,000$ 752,000$ 102,000$ 15.69%
TEACHER MENTOR AND HARD TO STAFF SCHOOLS 30,725 55,299 24,574 79.98%
CLINICAL FACULTY PROGRAM 20,423 30,435 10,012 49.02%
RACE TO GED 75,000 85,000 10,000 13.33%
ADULT ED ISAEP 31,434 31,434 - 0.00%
CAREER SWITCHER PROGRAM - 17,219 17,219 100.00%
SPECIAL ED JAIL - 550 550 100.00%
TOTAL STATE FUNDS 807,582$ 971,937$ 164,355$ 20.35%
TITLE I 7,003,362$ 6,626,582$ (376,780)$ -5.38%
TITLE VIB SPECIAL EDUCATION 4,422,484 4,363,501 (58,983) -1.33%
CARL PERKINS VOC/TECH EDUCATION 446,438 412,233 (34,205) -7.66%
CORRECTIONS & INSTITUTIONS - 1,345 1,345 100.00%
ADULT BASIC EDUCATION 174,312 - (174,312) -100.00%
TITLE VIB SPECIAL ED PRESCHOOL 73,500 73,212 (288) -0.39%
TITLE II PART D ED TECH 42,057 - (42,057) -100.00%
TITLE III PART A LEP 57,537 57,537 - 0.00%
TITLE II PART A TRAINING AND RECRUITING 1,230,062 1,230,062 - 0.00%
TITLE I SCHOOL IMPROVEMENT 200,000 629,535 429,535 214.77%
ENGLISH LITERACY/CIVICS 35,795 - (35,795) -100.00%
GEAR UP 480,880 480,880 - 0.00%
EDUCATION JOBS FUND 5,333,440 - (5,333,440) -100.00%
TOTAL FEDERAL FUNDS 19,499,867$ 13,874,887$ (5,624,980)$ -28.85%
GENERAL/CONTRACTED ADULT EDUCATION 100,000$ 20,727$ (79,273)$ -79.27%
REGULAR SUMMER SCHOOL 73,000 88,819 15,819 21.67%
DRIVER EDUCATION REGULAR 132,000 132,177 177 0.13%
SPECIAL SUMMER PROGRAMS 20,000 22,815 2,815 14.08%
TOTAL TUITION 325,000$ 264,538$ (60,462)$ -18.60%
VENDING & CONCESSION OPERATIONS 182,600$ 182,600$ -$ 0.00%
BATTELLE FOUNDATION 5,000 - (5,000) -100.00%
C-PEG TELEVISION 934,102 999,482 65,380 7.00%
NEA URBAN GRANT - 25,959 25,959 100.00%
YOUTH VIOLENCE PREVENTION PROGRAM - 24,541 24,541 100.00%
TOTAL OTHER FUNDS 1,121,702$ 1,232,582$ 110,880$ 9.88%
TOTAL APPROPRIATIONS 21,754,151$ 16,343,944$ (5,410,207)$ -24.87%
HAMPTON CITY SCHOOLS
REIMBURSABLE PROJECTS (FUND 60)
FY2012-2013
306

STUDENT ACTIVITIES FUNDSUMMARY STATEMENT OF REVENUES, EXPENDITURES AND CHANGES IN FUND BALANCE
FY09 FY10 FY11 FY12 FY13 FY14^ FY15^ FY16^REVENUES Actual Actual Actual Actual Budget Projected Projected Projected Other Receipts 145,241$ 140,166$ 157,104$ 154,045$ 201,300$ 205,326$ 209,433$ 213,621$ Subsidy from Fund 50 316,000 316,000 287,000 287,000 287,000 287,000 287,000 287,000
Total Revenues 461,241 456,166 444,104 441,045 488,300 492,326 496,433 500,621
EXPENDITURES Education 418,591 415,624 401,971 426,501 488,300 492,326 496,433 500,621
Excess of revenues over expenditures 42,650 40,542 42,133 14,544 - - - -
OTHER FINANCING SOURCES/USES Transfer to Reimbursable Projects Fund (1,241) Transfer from Reimbursable Projects Fund 9,988 3,746 4,314
Total other sources/uses 9,988 3,746 4,314 (1,241) - - - -
Excess of revenues and other sources over (under) expenditures and other uses 52,638 44,288 46,447 13,303 - - - -
Fund Balance July 1 6,636 59,274 103,562 150,009 163,312 163,312 163,312 163,312
Fund Balance - June 30 59,274$ 103,562$ 150,009$ 163,312$ 163,312$ 163,312$ 163,312$ 163,312$
^Assumptions for Projected Years: -2% revenue growth per year beginning with FY13. Does not include any new or additional programs or services. -The projected years are not provided for budget planning purposes and represent only an estimate for future outlook. -The projected years are for informational purposes only and not for budget formation.
307
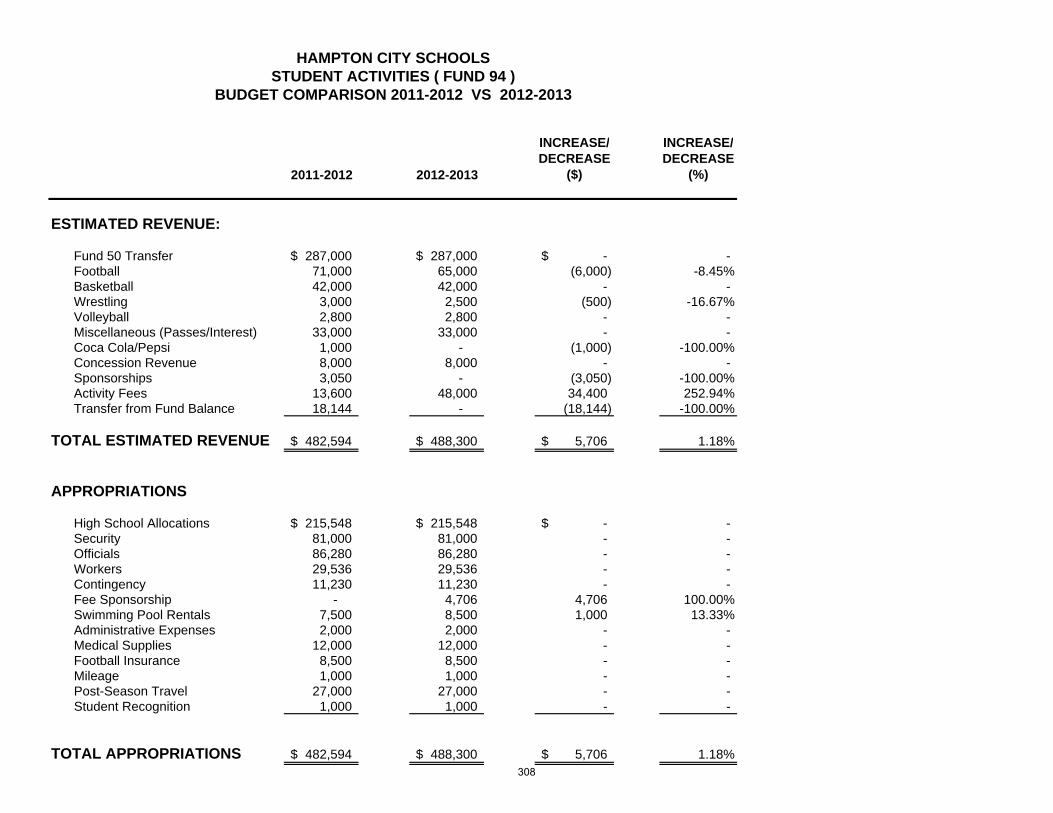
2011-2012 2012-2013
INCREASE/DECREASE
($)
INCREASE/DECREASE
(%)
ESTIMATED REVENUE:
Fund 50 Transfer 287,000$ 287,000$ -$ - Football 71,000 65,000 (6,000) -8.45%Basketball 42,000 42,000 - - Wrestling 3,000 2,500 (500) -16.67%Volleyball 2,800 2,800 - - Miscellaneous (Passes/Interest) 33,000 33,000 - - Coca Cola/Pepsi 1,000 - (1,000) -100.00%Concession Revenue 8,000 8,000 - - Sponsorships 3,050 - (3,050) -100.00%Activity Fees 13,600 48,000 34,400 252.94%Transfer from Fund Balance 18,144 - (18,144) -100.00%
TOTAL ESTIMATED REVENUE 482,594$ 488,300$ 5,706$ 1.18%
APPROPRIATIONS
High School Allocations 215,548$ 215,548$ -$ - Security 81,000 81,000 - - Officials 86,280 86,280 - - Workers 29,536 29,536 - - Contingency 11,230 11,230 - - Fee Sponsorship - 4,706 4,706 100.00%Swimming Pool Rentals 7,500 8,500 1,000 13.33%Administrative Expenses 2,000 2,000 - - Medical Supplies 12,000 12,000 - - Football Insurance 8,500 8,500 - - Mileage 1,000 1,000 - - Post-Season Travel 27,000 27,000 - - Student Recognition 1,000 1,000 - -
TOTAL APPROPRIATIONS 482,594$ 488,300$ 5,706$ 1.18%
HAMPTON CITY SCHOOLSSTUDENT ACTIVITIES ( FUND 94 )
BUDGET COMPARISON 2011-2012 VS 2012-2013
308
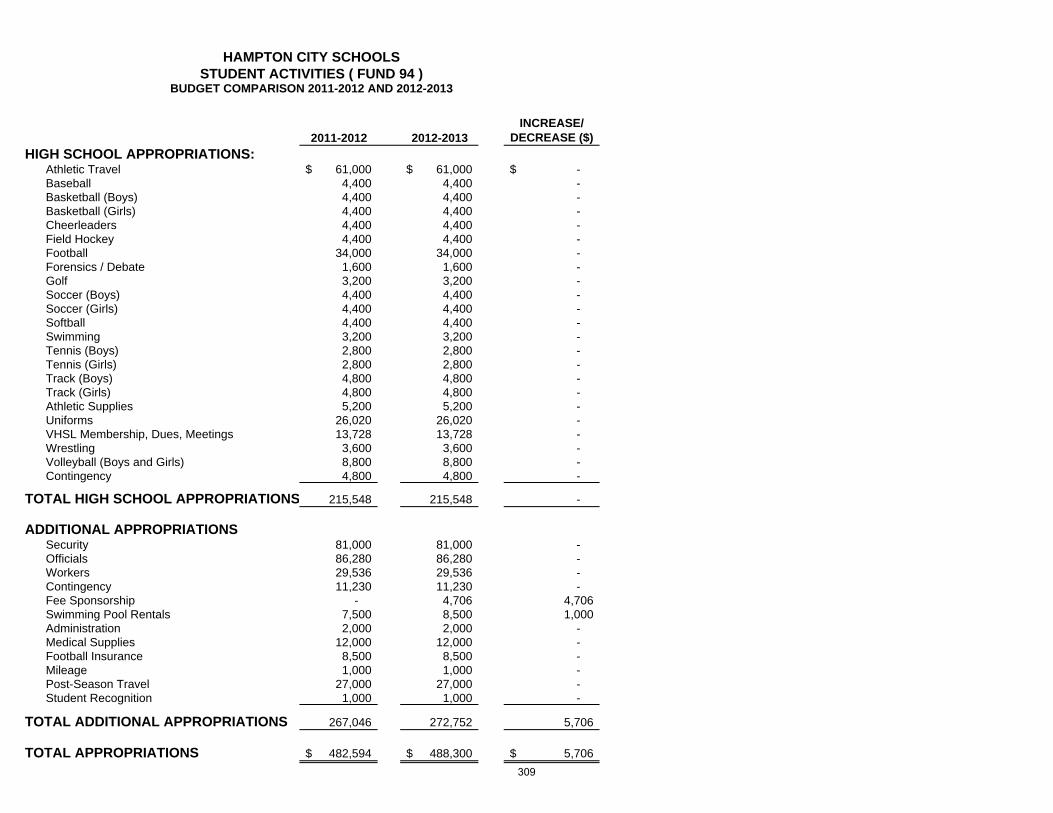
2011-2012 2012-2013INCREASE/
DECREASE ($)
HIGH SCHOOL APPROPRIATIONS:Athletic Travel 61,000$ 61,000$ -$ Baseball 4,400 4,400 - Basketball (Boys) 4,400 4,400 - Basketball (Girls) 4,400 4,400 - Cheerleaders 4,400 4,400 - Field Hockey 4,400 4,400 - Football 34,000 34,000 - Forensics / Debate 1,600 1,600 - Golf 3,200 3,200 - Soccer (Boys) 4,400 4,400 - Soccer (Girls) 4,400 4,400 - Softball 4,400 4,400 - Swimming 3,200 3,200 - Tennis (Boys) 2,800 2,800 - Tennis (Girls) 2,800 2,800 - Track (Boys) 4,800 4,800 - Track (Girls) 4,800 4,800 - Athletic Supplies 5,200 5,200 - Uniforms 26,020 26,020 - VHSL Membership, Dues, Meetings 13,728 13,728 - Wrestling 3,600 3,600 - Volleyball (Boys and Girls) 8,800 8,800 - Contingency 4,800 4,800 -
TOTAL HIGH SCHOOL APPROPRIATIONS 215,548 215,548 -
ADDITIONAL APPROPRIATIONSSecurity 81,000 81,000 - Officials 86,280 86,280 - Workers 29,536 29,536 - Contingency 11,230 11,230 - Fee Sponsorship - 4,706 4,706 Swimming Pool Rentals 7,500 8,500 1,000 Administration 2,000 2,000 - Medical Supplies 12,000 12,000 - Football Insurance 8,500 8,500 - Mileage 1,000 1,000 - Post-Season Travel 27,000 27,000 - Student Recognition 1,000 1,000 -
TOTAL ADDITIONAL APPROPRIATIONS 267,046 272,752 5,706
TOTAL APPROPRIATIONS 482,594$ 488,300$ 5,706$
BUDGET COMPARISON 2011-2012 AND 2012-2013
HAMPTON CITY SCHOOLSSTUDENT ACTIVITIES ( FUND 94 )
309
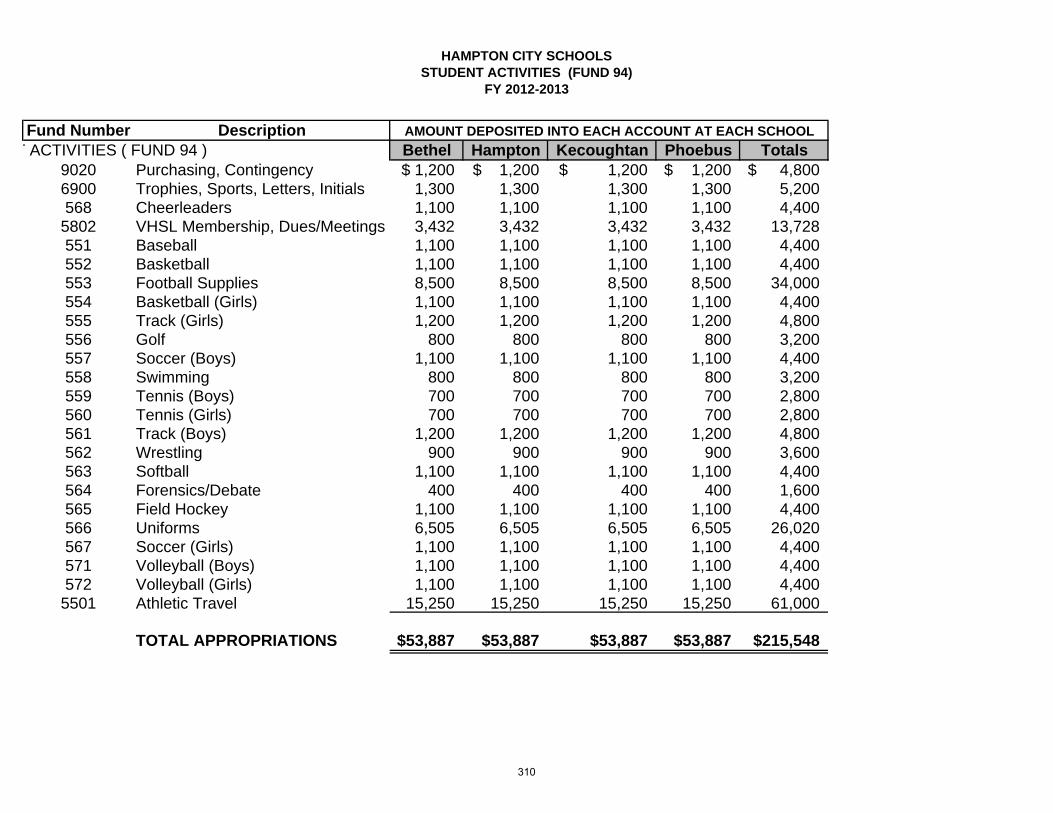
HAMPTON CITY SCHOOLSSTUDENT ACTIVITIES (FUND 94)
FY 2012-2013
Fund Number DescriptionT ACTIVITIES ( FUND 94 ) Bethel Hampton Kecoughtan Phoebus Totals
9020 Purchasing, Contingency 1,200$ 1,200$ 1,200$ 1,200$ 4,800$ 6900 Trophies, Sports, Letters, Initials 1,300 1,300 1,300 1,300 5,200568 Cheerleaders 1,100 1,100 1,100 1,100 4,400
5802 VHSL Membership, Dues/Meetings 3,432 3,432 3,432 3,432 13,728551 Baseball 1,100 1,100 1,100 1,100 4,400552 Basketball 1,100 1,100 1,100 1,100 4,400553 Football Supplies 8,500 8,500 8,500 8,500 34,000554 Basketball (Girls) 1,100 1,100 1,100 1,100 4,400555 Track (Girls) 1,200 1,200 1,200 1,200 4,800556 Golf 800 800 800 800 3,200557 Soccer (Boys) 1,100 1,100 1,100 1,100 4,400558 Swimming 800 800 800 800 3,200559 Tennis (Boys) 700 700 700 700 2,800560 Tennis (Girls) 700 700 700 700 2,800561 Track (Boys) 1,200 1,200 1,200 1,200 4,800562 Wrestling 900 900 900 900 3,600563 Softball 1,100 1,100 1,100 1,100 4,400564 Forensics/Debate 400 400 400 400 1,600565 Field Hockey 1,100 1,100 1,100 1,100 4,400566 Uniforms 6,505 6,505 6,505 6,505 26,020567 Soccer (Girls) 1,100 1,100 1,100 1,100 4,400571 Volleyball (Boys) 1,100 1,100 1,100 1,100 4,400572 Volleyball (Girls) 1,100 1,100 1,100 1,100 4,400
5501 Athletic Travel 15,250 15,250 15,250 15,250 61,000
TOTAL APPROPRIATIONS $53,887 $53,887 $53,887 $53,887 $215,548
AMOUNT DEPOSITED INTO EACH ACCOUNT AT EACH SCHOOL
310

INFORMATIONAL
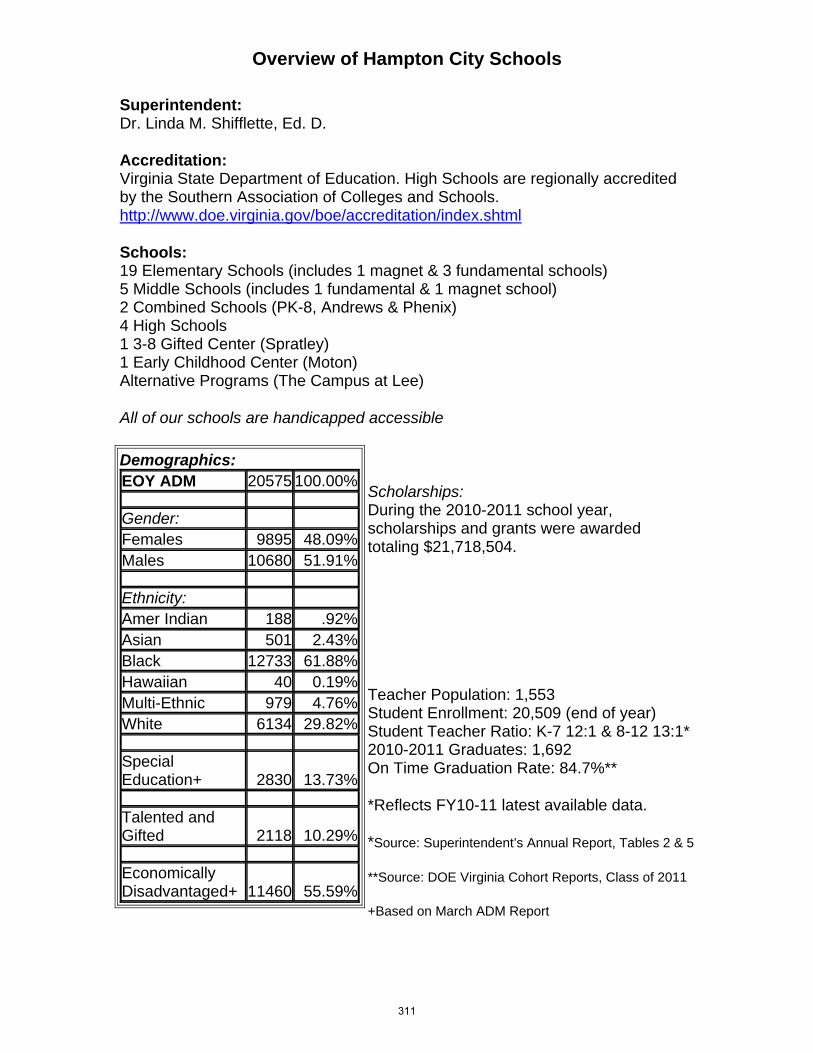
Overview of Hampton City Schools
Superintendent: Dr. Linda M. Shifflette, Ed. D.
Accreditation: Virginia State Department of Education. High Schools are regionally accredited by the Southern Association of Colleges and Schools. http://www.doe.virginia.gov/boe/accreditation/index.shtml
Schools: 19 Elementary Schools (includes 1 magnet & 3 fundamental schools) 5 Middle Schools (includes 1 fundamental & 1 magnet school) 2 Combined Schools (PK-8, Andrews & Phenix) 4 High Schools 1 3-8 Gifted Center (Spratley) 1 Early Childhood Center (Moton) Alternative Programs (The Campus at Lee)
All of our schools are handicapped accessible
Scholarships: During the 2010-2011 school year, scholarships and grants were awarded totaling $21,718,504.
Teacher Population: 1,553 Student Enrollment: 20,509 (end of year) Student Teacher Ratio: K-7 12:1 & 8-12 13:1* 2010-2011 Graduates: 1,692 On Time Graduation Rate: 84.7%**
*Reflects FY10-11 latest available data.
*Source: Superintendent’s Annual Report, Tables 2 & 5
**Source: DOE Virginia Cohort Reports, Class of 2011
+Based on March ADM Report
Demographics: EOY ADM 20575 100.00%
Gender:
Females 9895 48.09%Males 10680 51.91%
Ethnicity:
Amer Indian 188 .92%Asian 501 2.43%Black 12733 61.88%Hawaiian 40 0.19%Multi-Ethnic 979 4.76%White 6134 29.82%
Special Education+ 2830 13.73%
Talented and Gifted 2118 10.29%
Economically Disadvantaged+ 11460 55.59%
311
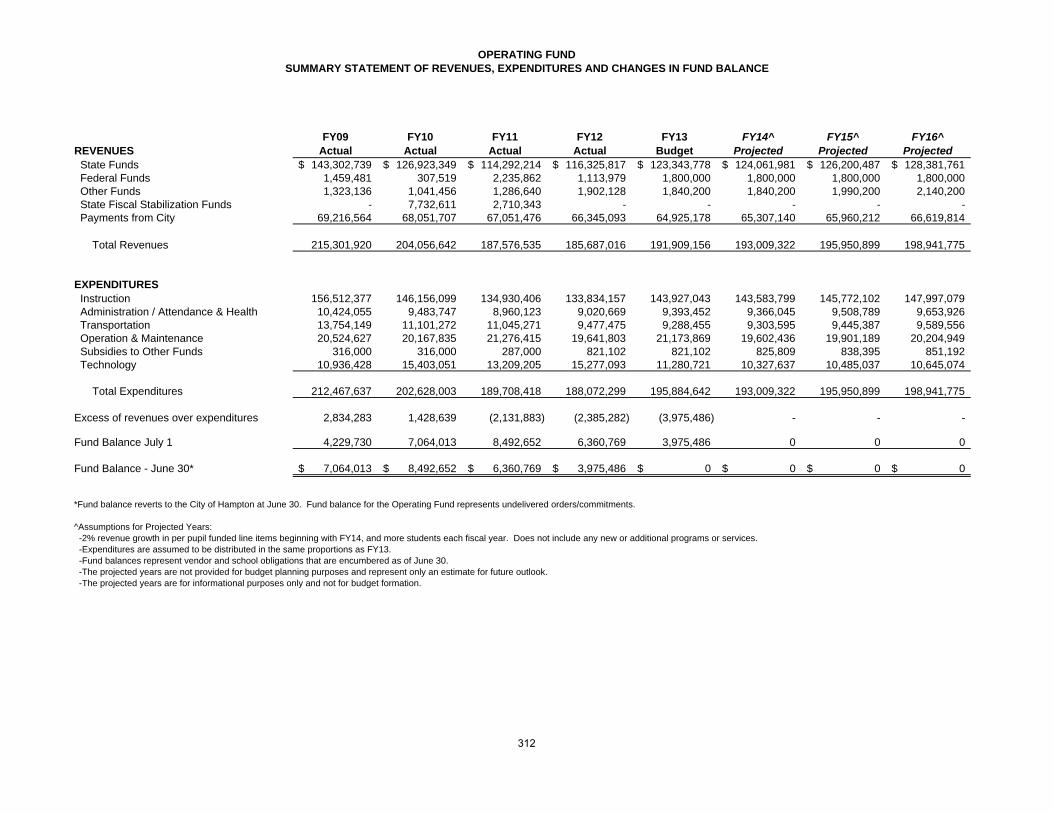
OPERATING FUNDSUMMARY STATEMENT OF REVENUES, EXPENDITURES AND CHANGES IN FUND BALANCE
FY09 FY10 FY11 FY12 FY13 FY14^ FY15^ FY16^REVENUES Actual Actual Actual Actual Budget Projected Projected Projected State Funds 143,302,739$ 126,923,349$ 114,292,214$ 116,325,817$ 123,343,778$ 124,061,981$ 126,200,487$ 128,381,761$ Federal Funds 1,459,481 307,519 2,235,862 1,113,979 1,800,000 1,800,000 1,800,000 1,800,000 Other Funds 1,323,136 1,041,456 1,286,640 1,902,128 1,840,200 1,840,200 1,990,200 2,140,200 State Fiscal Stabilization Funds - 7,732,611 2,710,343 - - - - - Payments from City 69,216,564 68,051,707 67,051,476 66,345,093 64,925,178 65,307,140 65,960,212 66,619,814
Total Revenues 215,301,920 204,056,642 187,576,535 185,687,016 191,909,156 193,009,322 195,950,899 198,941,775
EXPENDITURES Instruction 156,512,377 146,156,099 134,930,406 133,834,157 143,927,043 143,583,799 145,772,102 147,997,079 Administration / Attendance & Health 10,424,055 9,483,747 8,960,123 9,020,669 9,393,452 9,366,045 9,508,789 9,653,926 Transportation 13,754,149 11,101,272 11,045,271 9,477,475 9,288,455 9,303,595 9,445,387 9,589,556 Operation & Maintenance 20,524,627 20,167,835 21,276,415 19,641,803 21,173,869 19,602,436 19,901,189 20,204,949 Subsidies to Other Funds 316,000 316,000 287,000 821,102 821,102 825,809 838,395 851,192 Technology 10,936,428 15,403,051 13,209,205 15,277,093 11,280,721 10,327,637 10,485,037 10,645,074
Total Expenditures 212,467,637 202,628,003 189,708,418 188,072,299 195,884,642 193,009,322 195,950,899 198,941,775
Excess of revenues over expenditures 2,834,283 1,428,639 (2,131,883) (2,385,282) (3,975,486) - - -
Fund Balance July 1 4,229,730 7,064,013 8,492,652 6,360,769 3,975,486 0 0 0
Fund Balance - June 30* 7,064,013$ 8,492,652$ 6,360,769$ 3,975,486$ 0$ 0$ 0$ 0$
*Fund balance reverts to the City of Hampton at June 30. Fund balance for the Operating Fund represents undelivered orders/commitments.
^Assumptions for Projected Years: -2% revenue growth in per pupil funded line items beginning with FY14, and more students each fiscal year. Does not include any new or additional programs or services. -Expenditures are assumed to be distributed in the same proportions as FY13. -Fund balances represent vendor and school obligations that are encumbered as of June 30. -The projected years are not provided for budget planning purposes and represent only an estimate for future outlook. -The projected years are for informational purposes only and not for budget formation.
312

FOOD AND NUTRITION SERVICES FUNDSUMMARY STATEMENT OF REVENUES, EXPENDITURES AND CHANGES IN FUND BALANCE
FY09 FY10 FY11 FY12 FY13 FY14^ FY15^ FY16^REVENUES Actual Actual Actual Actual Budget Projected Projected Projected State Funds 274,149$ 248,966$ 254,096$ 180,212$ 128,000$ 130,560$ 133,171$ 135,835$ Federal Funds 5,677,094 6,012,708 6,200,529 6,807,069 6,946,030 7,084,951 7,226,650 7,371,183 Other Funds 3,296,497 3,662,916 3,167,744 3,004,912 2,972,344 3,031,791 3,092,427 3,154,275
Total Revenues 9,247,740 9,924,590 9,622,369 9,992,193 10,046,374 10,247,301 10,452,248 10,661,292
EXPENDITURES Education 9,844,763 9,060,099 8,361,107 9,146,034 10,479,165 10,547,301 10,752,248 10,961,292
Excess of revenues over expenditures (597,023) 864,491 1,261,262 846,159 (432,791) (300,000) (300,000) (300,000)
OTHER FINANCING SOURCES/USES Transfer from Fund Balance - 432,791 300,000 300,000 300,000
Total other sources/uses 0 0 0 - 432,791 300,000 300,000 300,000
Excess of revenues and other sources over (under) expenditures and other uses (597,023) 864,491 1,261,262 846,159 - 0 - -
Fund Balance July 1 2,902,169 2,305,146 3,169,637 4,430,899 5,277,058 5,709,849 5,409,849 5,109,849
Fund Balance - June 30 2,305,146$ 3,169,637$ 4,430,899$ 5,277,058$ 5,709,849$ 5,409,849$ 5,109,849$ 4,809,849$
^Assumptions for Projected Years: -2% revenue growth per year beginning with FY14. Does not include any new or additional programs or services. -The projected years are not provided for budget planning purposes and represent only an estimate for future outlook. -The projected years are for informational purposes only and not for budget formation.
313

REIMBURSABLE PROJECTS FUNDSUMMARY STATEMENT OF REVENUES, EXPENDITURES AND CHANGES IN FUND BALANCE
FY09 FY10 FY11 FY12 FY13 FY14^ FY15^ FY16^REVENUES Actual Actual Actual Actual Budget Projected Projected Projected State Funds 1,292,786$ 801,034$ 867,937$ 857,989$ 971,937$ 991,376$ 1,011,203$ 1,031,427$ Federal Funds (includes pass through) 14,468,583 20,046,604 18,996,618 24,524,490 13,874,887 14,152,385 14,435,432 14,724,141 Subsidy from Fund 50 - - - 534,102 534,102 544,784 555,680 566,793 Other Funds 811,530 634,651 649,297 710,377 963,018 982,278 1,001,924 1,021,962
Total Revenues 16,572,899 21,482,289 20,513,852 26,626,958 16,343,944 16,670,823 17,004,239 17,344,324
EXPENDITURES Education 16,660,962 21,755,214 20,476,770 26,689,921 16,343,944 16,670,823 17,004,239 17,344,324
Excess of revenues over expenditures (88,063) (272,925) 37,082 (62,963) - - - -
OTHER FINANCING SOURCES/USES -
Transfer to Student Activities Fund (9,988) (3,746) (4,314) 1,241 - - - -
Total other sources/uses (9,988) (3,746) (4,314) 1,241 - - - -
Excess of revenues and other sources over (under) expenditures and other uses (98,051) (276,671) 32,768 (61,722) - 0 - -
Fund Balance July 1 652,261 554,210 277,539 310,307 248,585 248,585 248,585 248,585
Fund Balance - June 30 554,210$ 277,539$ 310,307$ 248,585$ 248,585$ 248,585$ 248,585$ 248,585$
^Assumptions for Projected Years: -2% revenue growth per year beginning with FY14. Does not include any new or additional programs or services. -The projected years are not provided for budget planning purposes and represent only an estimate for future outlook. -The projected years are for informational purposes only and not for budget formation.
314
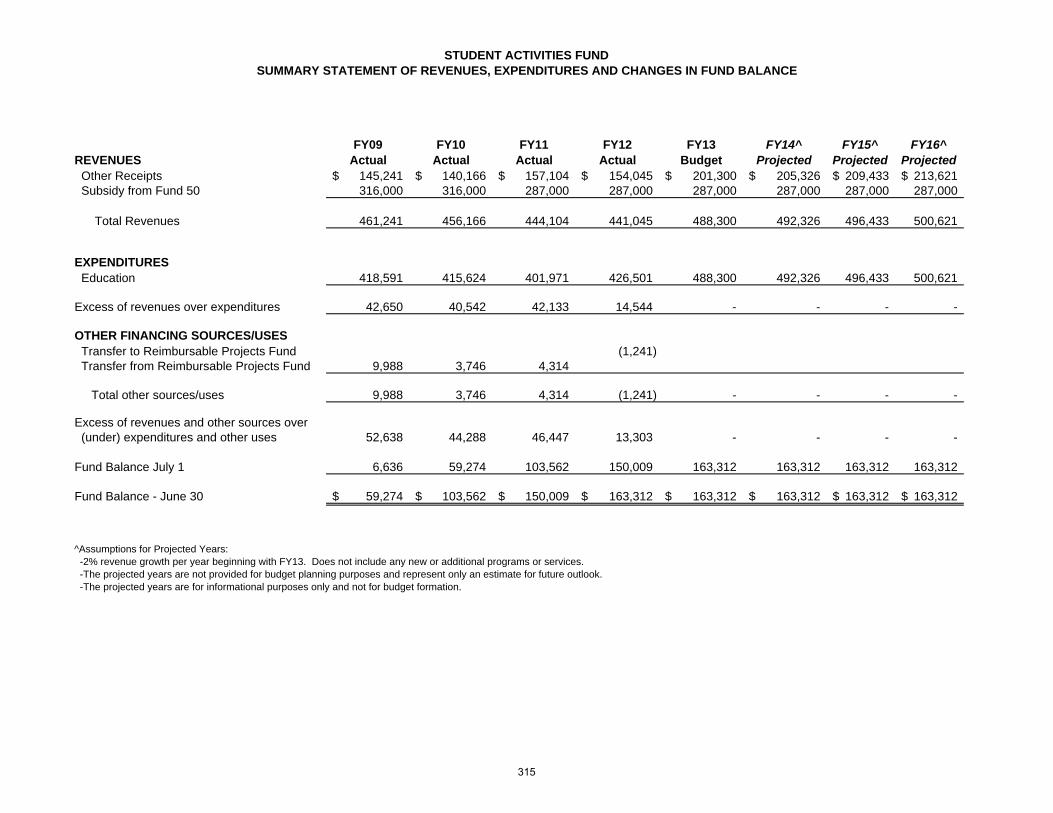
STUDENT ACTIVITIES FUNDSUMMARY STATEMENT OF REVENUES, EXPENDITURES AND CHANGES IN FUND BALANCE
FY09 FY10 FY11 FY12 FY13 FY14^ FY15^ FY16^REVENUES Actual Actual Actual Actual Budget Projected Projected Projected Other Receipts 145,241$ 140,166$ 157,104$ 154,045$ 201,300$ 205,326$ 209,433$ 213,621$ Subsidy from Fund 50 316,000 316,000 287,000 287,000 287,000 287,000 287,000 287,000
Total Revenues 461,241 456,166 444,104 441,045 488,300 492,326 496,433 500,621
EXPENDITURES Education 418,591 415,624 401,971 426,501 488,300 492,326 496,433 500,621
Excess of revenues over expenditures 42,650 40,542 42,133 14,544 - - - -
OTHER FINANCING SOURCES/USES Transfer to Reimbursable Projects Fund (1,241) Transfer from Reimbursable Projects Fund 9,988 3,746 4,314
Total other sources/uses 9,988 3,746 4,314 (1,241) - - - -
Excess of revenues and other sources over (under) expenditures and other uses 52,638 44,288 46,447 13,303 - - - -
Fund Balance July 1 6,636 59,274 103,562 150,009 163,312 163,312 163,312 163,312
Fund Balance - June 30 59,274$ 103,562$ 150,009$ 163,312$ 163,312$ 163,312$ 163,312$ 163,312$
^Assumptions for Projected Years: -2% revenue growth per year beginning with FY13. Does not include any new or additional programs or services. -The projected years are not provided for budget planning purposes and represent only an estimate for future outlook. -The projected years are for informational purposes only and not for budget formation.
315
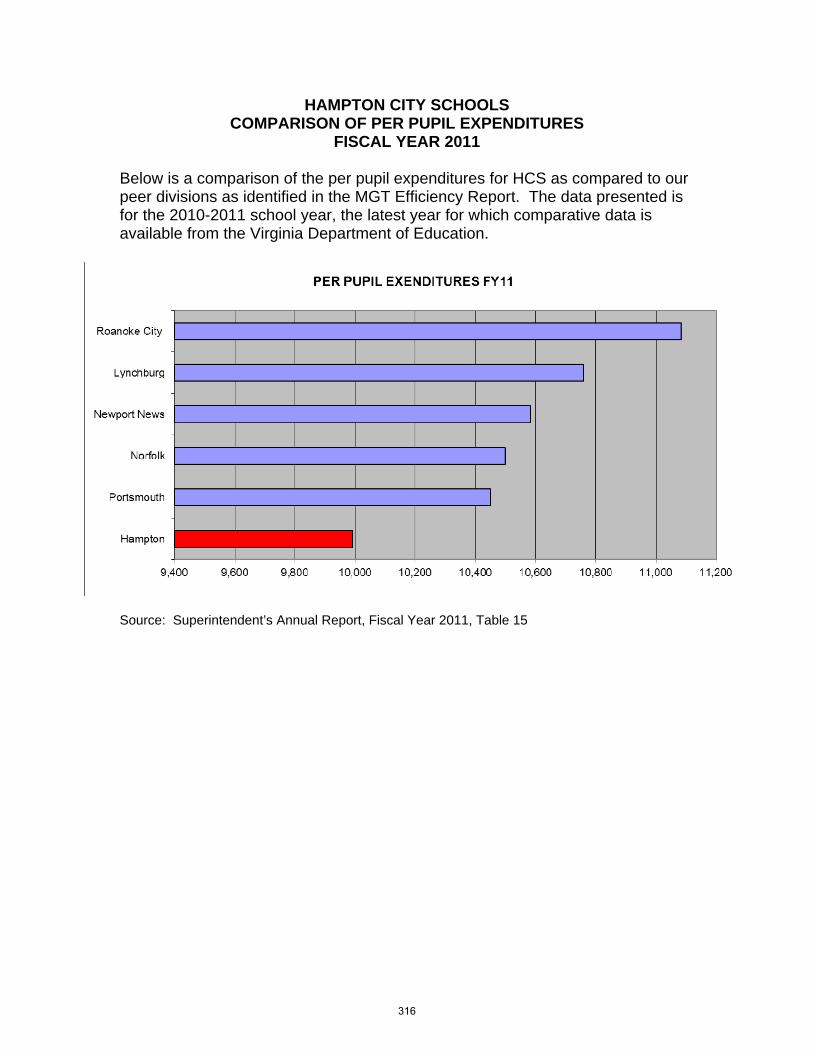
HAMPTON CITY SCHOOLS COMPARISON OF PER PUPIL EXPENDITURES
FISCAL YEAR 2011
Below is a comparison of the per pupil expenditures for HCS as compared to our peer divisions as identified in the MGT Efficiency Report. The data presented is for the 2010-2011 school year, the latest year for which comparative data is available from the Virginia Department of Education.
Source: Superintendent’s Annual Report, Fiscal Year 2011, Table 15
316
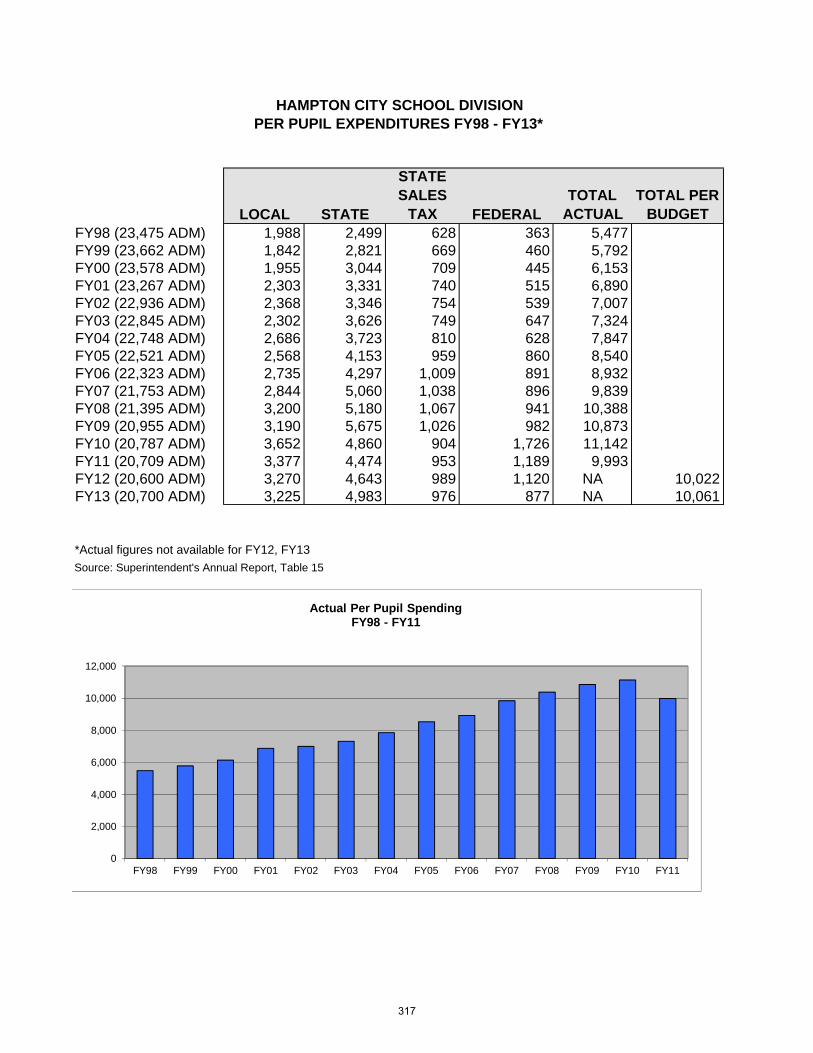
LOCAL STATE
STATE SALES
TAX FEDERALTOTAL
ACTUALTOTAL PER
BUDGETFY98 (23,475 ADM) 1,988 2,499 628 363 5,477FY99 (23,662 ADM) 1,842 2,821 669 460 5,792FY00 (23,578 ADM) 1,955 3,044 709 445 6,153FY01 (23,267 ADM) 2,303 3,331 740 515 6,890FY02 (22,936 ADM) 2,368 3,346 754 539 7,007FY03 (22,845 ADM) 2,302 3,626 749 647 7,324FY04 (22,748 ADM) 2,686 3,723 810 628 7,847FY05 (22,521 ADM) 2,568 4,153 959 860 8,540FY06 (22,323 ADM) 2,735 4,297 1,009 891 8,932FY07 (21,753 ADM) 2,844 5,060 1,038 896 9,839FY08 (21,395 ADM) 3,200 5,180 1,067 941 10,388FY09 (20,955 ADM) 3,190 5,675 1,026 982 10,873FY10 (20,787 ADM) 3,652 4,860 904 1,726 11,142FY11 (20,709 ADM) 3,377 4,474 953 1,189 9,993FY12 (20,600 ADM) 3,270 4,643 989 1,120 NA 10,022FY13 (20,700 ADM) 3,225 4,983 976 877 NA 10,061
Source: Superintendent's Annual Report, Table 15
HAMPTON CITY SCHOOL DIVISIONPER PUPIL EXPENDITURES FY98 - FY13*
*Actual figures not available for FY12, FY13
0
2,000
4,000
6,000
8,000
10,000
12,000
FY98 FY99 FY00 FY01 FY02 FY03 FY04 FY05 FY06 FY07 FY08 FY09 FY10 FY11
Actual Per Pupil SpendingFY98 - FY11
317
Enrollment Forecasting and Historical Data The School Board utilizes enrollment projections provided by the Office of Business and Finance to prepare its budget. The School Board’s approved FY12 Operating Budget was prepared using 20,600 projected students. Actual enrollment was 20,615 (March ADM), which is a decrease over the previous year’s enrollment (20,656) of 41 students. Our enrollment projection of 20,700 for FY13 represents 85 or .41% more students than FY12 actual. Student enrollment projections are a major consideration when developing the School Board budget. Student enrollment drives the amount of state and federal funding the School Division receives. It is also significant because it drives the number of instructional and support staff needed to provide educational and support services to students. When calculating projected enrollment, the Weldon Cooper Center (of the University of Virginia) model is used as a starting point. This model looks at grade progression ratios, birth rates, and historical data to project future enrollment. The results of this model are then compared to local knowledge of recent trends, new housing areas, and the impact of opening new or closing old schools to further refine the projections. The following tables show historical enrollment by school for fiscal 2006 through fiscal 2012, actual and projected March ADM for fiscal 2003 through 2015, as well as a graph of the enrollment trends for this period of time.
318
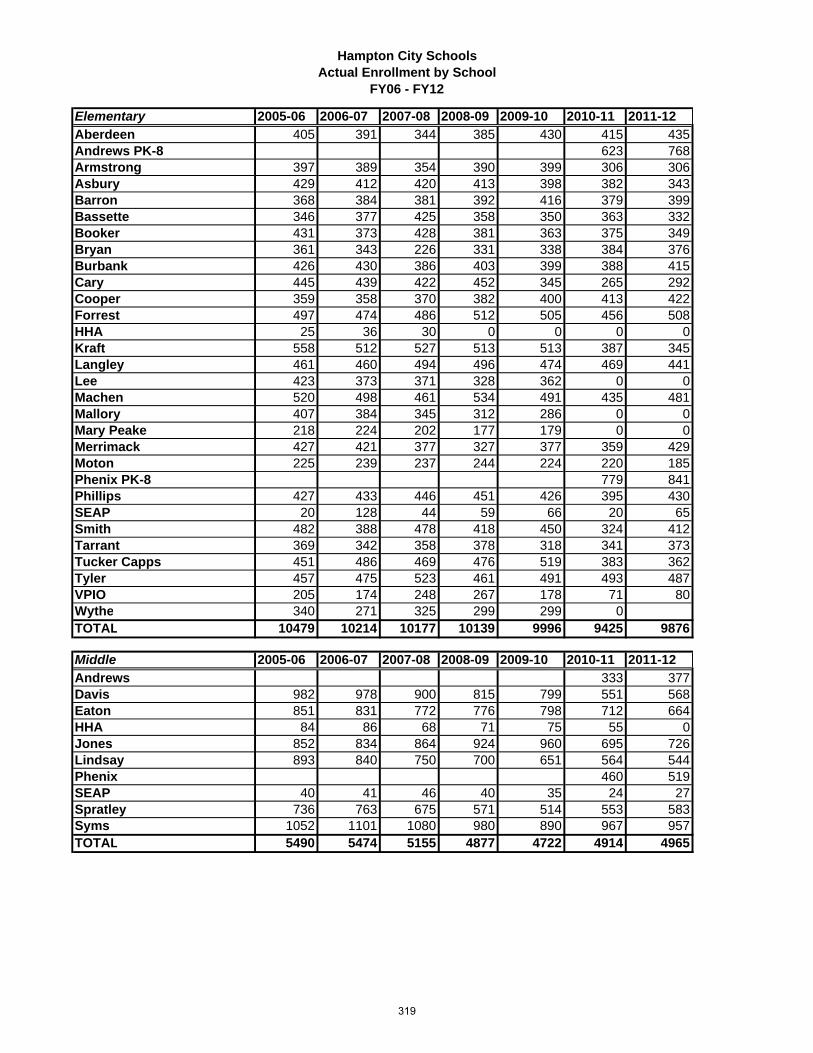
Hampton City SchoolsActual Enrollment by School
FY06 - FY12
Elementary 2005-06 2006-07 2007-08 2008-09 2009-10 2010-11 2011-12Aberdeen 405 391 344 385 430 415 435Andrews PK-8 623 768Armstrong 397 389 354 390 399 306 306Asbury 429 412 420 413 398 382 343Barron 368 384 381 392 416 379 399Bassette 346 377 425 358 350 363 332Booker 431 373 428 381 363 375 349Bryan 361 343 226 331 338 384 376Burbank 426 430 386 403 399 388 415Cary 445 439 422 452 345 265 292Cooper 359 358 370 382 400 413 422Forrest 497 474 486 512 505 456 508HHA 25 36 30 0 0 0 0Kraft 558 512 527 513 513 387 345Langley 461 460 494 496 474 469 441Lee 423 373 371 328 362 0 0Machen 520 498 461 534 491 435 481Mallory 407 384 345 312 286 0 0Mary Peake 218 224 202 177 179 0 0Merrimack 427 421 377 327 377 359 429Moton 225 239 237 244 224 220 185Phenix PK-8 779 841Phillips 427 433 446 451 426 395 430SEAP 20 128 44 59 66 20 65Smith 482 388 478 418 450 324 412Tarrant 369 342 358 378 318 341 373Tucker Capps 451 486 469 476 519 383 362Tyler 457 475 523 461 491 493 487VPIO 205 174 248 267 178 71 80Wythe 340 271 325 299 299 0TOTAL 10479 10214 10177 10139 9996 9425 9876
Middle 2005-06 2006-07 2007-08 2008-09 2009-10 2010-11 2011-12Andrews 333 377Davis 982 978 900 815 799 551 568Eaton 851 831 772 776 798 712 664HHA 84 86 68 71 75 55 0Jones 852 834 864 924 960 695 726Lindsay 893 840 750 700 651 564 544Phenix 460 519SEAP 40 41 46 40 35 24 27Spratley 736 763 675 571 514 553 583Syms 1052 1101 1080 980 890 967 957TOTAL 5490 5474 5155 4877 4722 4914 4965
319
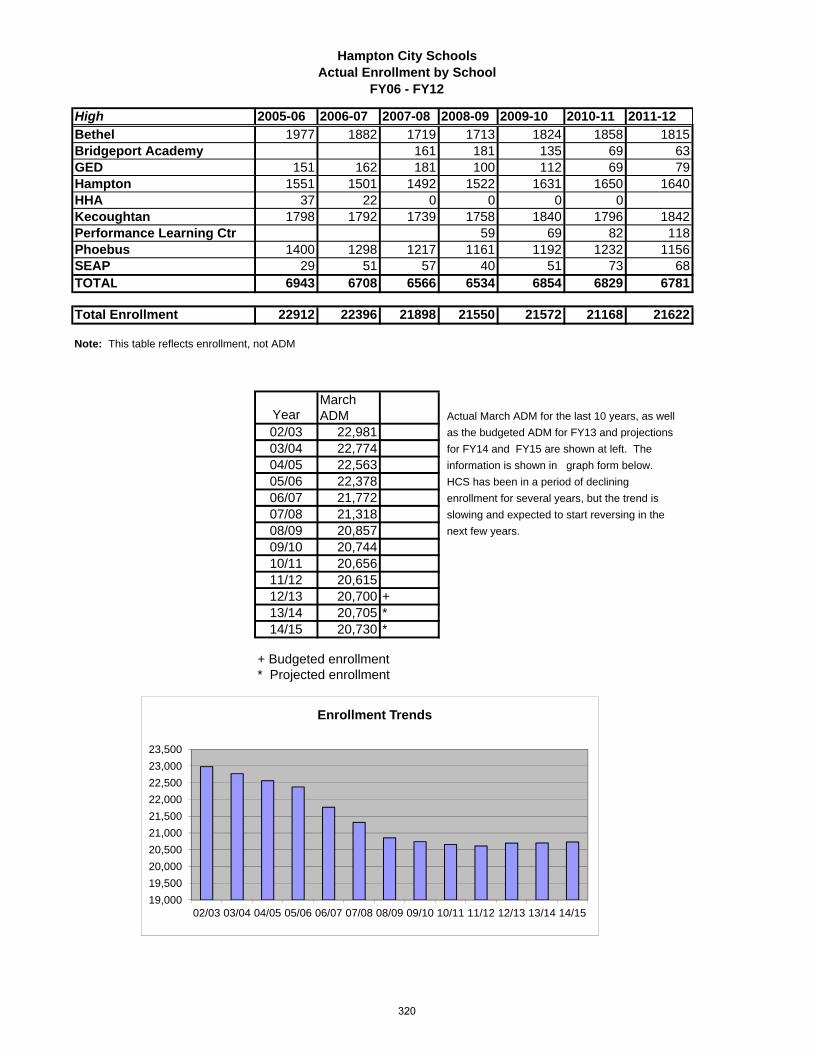
Hampton City SchoolsActual Enrollment by School
FY06 - FY12
High 2005-06 2006-07 2007-08 2008-09 2009-10 2010-11 2011-12Bethel 1977 1882 1719 1713 1824 1858 1815Bridgeport Academy 161 181 135 69 63GED 151 162 181 100 112 69 79Hampton 1551 1501 1492 1522 1631 1650 1640HHA 37 22 0 0 0 0Kecoughtan 1798 1792 1739 1758 1840 1796 1842Performance Learning Ctr 59 69 82 118Phoebus 1400 1298 1217 1161 1192 1232 1156SEAP 29 51 57 40 51 73 68TOTAL 6943 6708 6566 6534 6854 6829 6781
Total Enrollment 22912 22396 21898 21550 21572 21168 21622
Note: This table reflects enrollment, not ADM
YearMarch ADM Actual March ADM for the last 10 years, as well
02/03 22,981 as the budgeted ADM for FY13 and projections
03/04 22,774 for FY14 and FY15 are shown at left. The
04/05 22,563 information is shown in graph form below.
05/06 22,378 HCS has been in a period of declining
06/07 21,772 enrollment for several years, but the trend is
07/08 21,318 slowing and expected to start reversing in the
08/09 20,857 next few years.
09/10 20,74410/11 20,65611/12 20,61512/13 20,700 +13/14 20,705 *14/15 20,730 *
+ Budgeted enrollment* Projected enrollment
19,000
19,500
20,000
20,500
21,000
21,500
22,000
22,500
23,000
23,500
02/03 03/04 04/05 05/06 06/07 07/08 08/09 09/10 10/11 11/12 12/13 13/14 14/15
Enrollment Trends
320

Hampton City SchoolsPer Pupil Allocations FY13
For FY13, fifty percent of the allocation is distributed July 1, with the remainder redistributedin October based on the Fall Membership Report.
# Pupils FY13 Per Pupil Instructional Supplies Served Budget Amt
Fine Arts - All 21,305 170,440 8.00Gifted & Talented 2,174 28,262 13.00 Science - Science (MS, HS) 11,285 93,101 8.25CTE Business - All 11,285 53,604 4.75CTE Technology - All 11,285 118,493 10.50Schools - Elementary * 10,155 362,225 35.00Schools - Middle 4,720 151,040 32.00Schools - High ** 6,430 205,760 32.00
Total 1,182,925
**Bridgeport, Moton, and PLC min $6,000
# Pupils FY13 Per Pupil Office Supplies Served Budget Amt
Elementary Schools (includes Moton, PLC, Bridgeport) 10,155 40,620 4.00Middle Schools 4,720 18,880 4.00High Schools 6,430 25,720 4.00
Total 85,220
# Pupils FY13 Per Pupil Postage Served Budget Amt
Elementary Schools (includes Moton, PLC, Bridgeport) 10,155 20,310 2.00Middle Schools 4,720 14,160 3.00High Schools 6,430 25,720 4.00
Total 60,190
# Pupils FY13 Per Pupil Capital Served Budget Amt
Schools 21,305 127,830 6.00Fine Arts - Music - Band 11,285 84,638 7.50Fine Arts - Music - Choral 21,305 21,305 1.00
Total 233,773
# Pupils FY13 Per Pupil Field Trips Served Budget Amt
Elementary & Middle Schools (includes Moton, PLC, Bridgeport) 14,875 29,750 2.00High Schools 6,430 19,290 3.00
Total 49,040
FY13 Per Bldg Local Travel-Schools Budget Amt
11,000 500.00Middle Schools 8,000 1000.00High Schools 6,000 1500.00
Total 25,000
# Pupils FY13 Per Pupil Other Expenses Served Budget Amt
Elementary Schools (includes Moton, PLC, Bridgeport) 10,155 35,543 3.50Middle Schools 4,720 16,520 3.50High Schools 6,430 22,505 3.50
Total 74,568
Elementary Schools (includes Moton, PLC, Bridgeport)
321
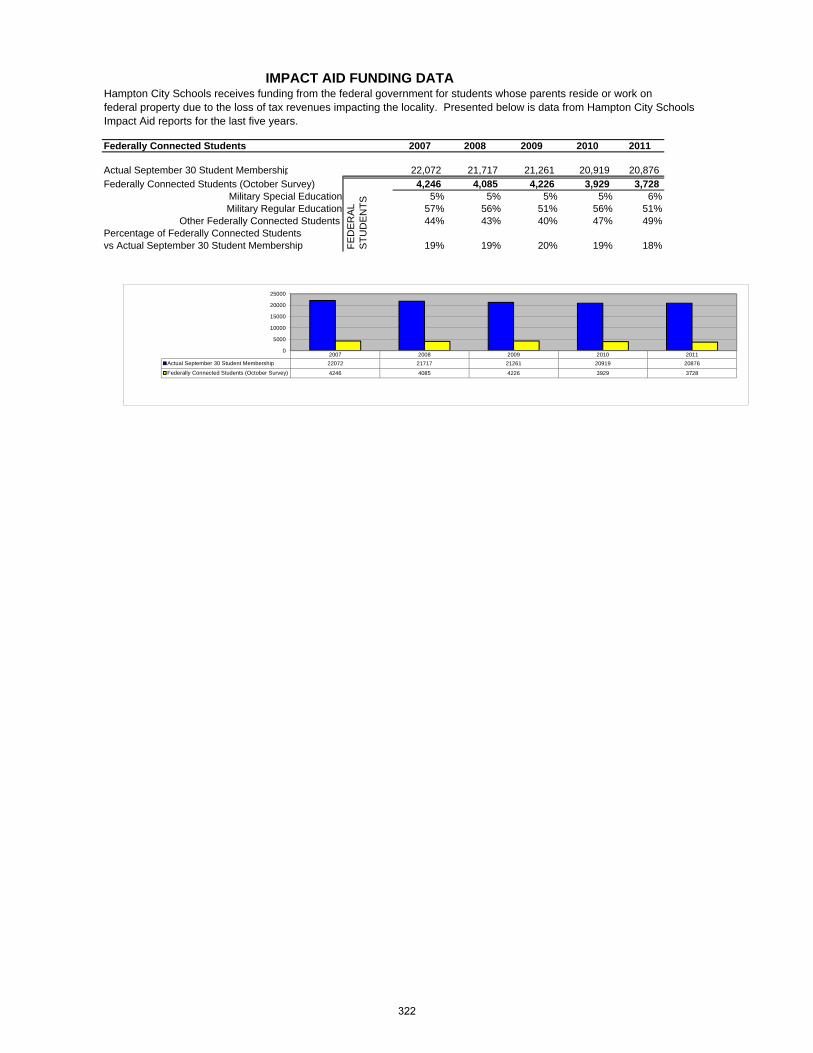
Hampton City Schools receives funding from the federal government for students whose parents reside or work on federal property due to the loss of tax revenues impacting the locality. Presented below is data from Hampton City SchoolsImpact Aid reports for the last five years.
Federally Connected Students 2007 2008 2009 2010 2011
Actual September 30 Student Membership 22,072 21,717 21,261 20,919 20,876
Federally Connected Students (October Survey) 4,246 4,085 4,226 3,929 3,728 Military Special Education 5% 5% 5% 5% 6%Military Regular Education 57% 56% 51% 56% 51%
Other Federally Connected Students 44% 43% 40% 47% 49%Percentage of Federally Connected Studentsvs Actual September 30 Student Membership 19% 19% 20% 19% 18%F
ED
ER
AL
S
TU
DE
NT
S
IMPACT AID FUNDING DATA
2007 2008 2009 2010 2011
Actual September 30 Student Membership 22072 21717 21261 20919 20876
Federally Connected Students (October Survey) 4246 4085 4226 3929 3728
0
5000
10000
15000
20000
25000
322
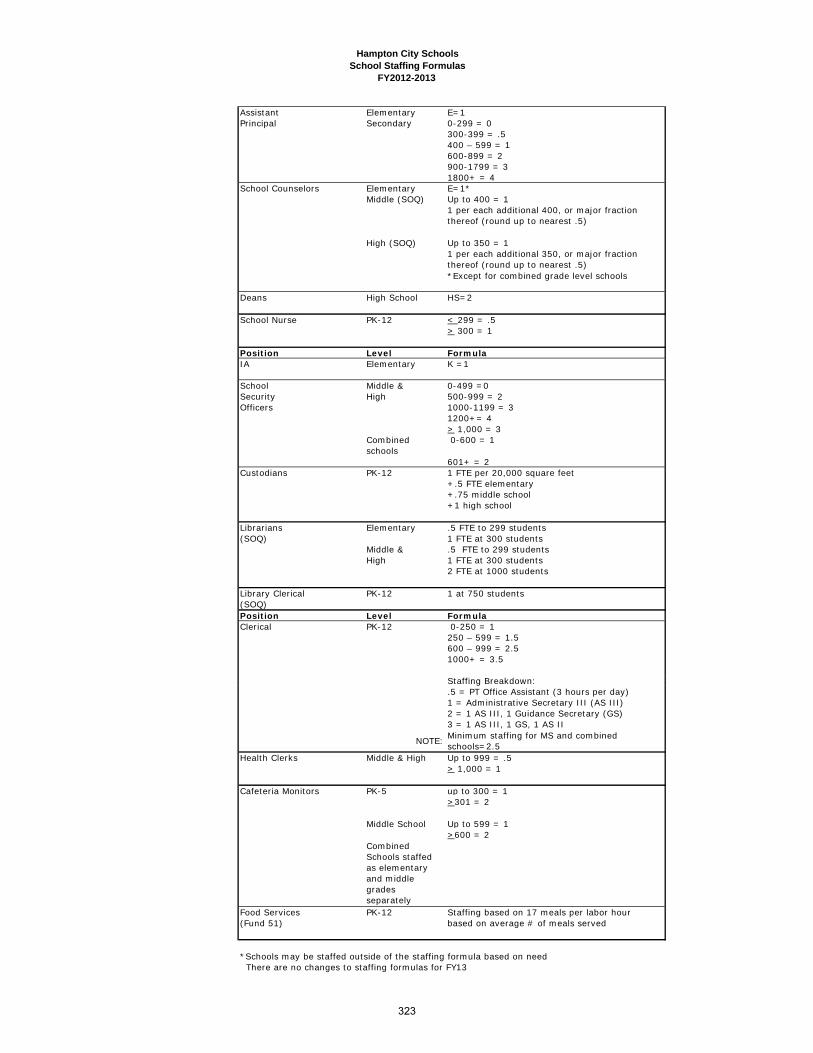
Hampton City SchoolsSchool Staffing Formulas
FY2012-2013
Assistant Elementary E=1Principal Secondary 0-299 = 0
300-399 = .5400 – 599 = 1600-899 = 2900-1799 = 31800+ = 4
Elementary E=1*Middle (SOQ) Up to 400 = 1
1 per each additional 400, or major fraction thereof (round up to nearest .5)
High (SOQ) Up to 350 = 11 per each additional 350, or major fraction thereof (round up to nearest .5)*Except for combined grade level schools
Deans HS=2 School Nurse PK-12 < 299 = .5
> 300 = 1
Position Level FormulaIA Elementary K =1
School Middle & 0-499 =0Security High 500-999 = 2Officers 1000-1199 = 3
1200+= 4> 1,000 = 3
Combined schools
0-600 = 1
601+ = 2Custodians PK-12 1 FTE per 20,000 square feet
+.5 FTE elementary+.75 middle school+1 high school
Librarians Elementary .5 FTE to 299 students(SOQ) 1 FTE at 300 students
Middle & .5 FTE to 299 studentsHigh 1 FTE at 300 students
2 FTE at 1000 students
Library Clerical PK-12 1 at 750 students(SOQ)Position Level FormulaClerical 0-250 = 1
250 – 599 = 1.5600 – 999 = 2.51000+ = 3.5
Staffing Breakdown:.5 = PT Office Assistant (3 hours per day)
1 = Administrative Secretary III (AS III)2 = 1 AS III, 1 Guidance Secretary (GS)3 = 1 AS III, 1 GS, 1 AS II
NOTE:Minimum staffing for MS and combined schools=2.5
Health Clerks Middle & High Up to 999 = .5> 1,000 = 1
Cafeteria Monitors PK-5 up to 300 = 1 >301 = 2
Middle School Up to 599 = 1 >600 = 2
Combined Schools staffed as elementary and middle grades separately
Food Services PK-12 Staffing based on 17 meals per labor hour(Fund 51) based on average # of meals served
*Schools may be staffed outside of the staffing formula based on need There are no changes to staffing formulas for FY13
School Counselors
High School
PK-12
323
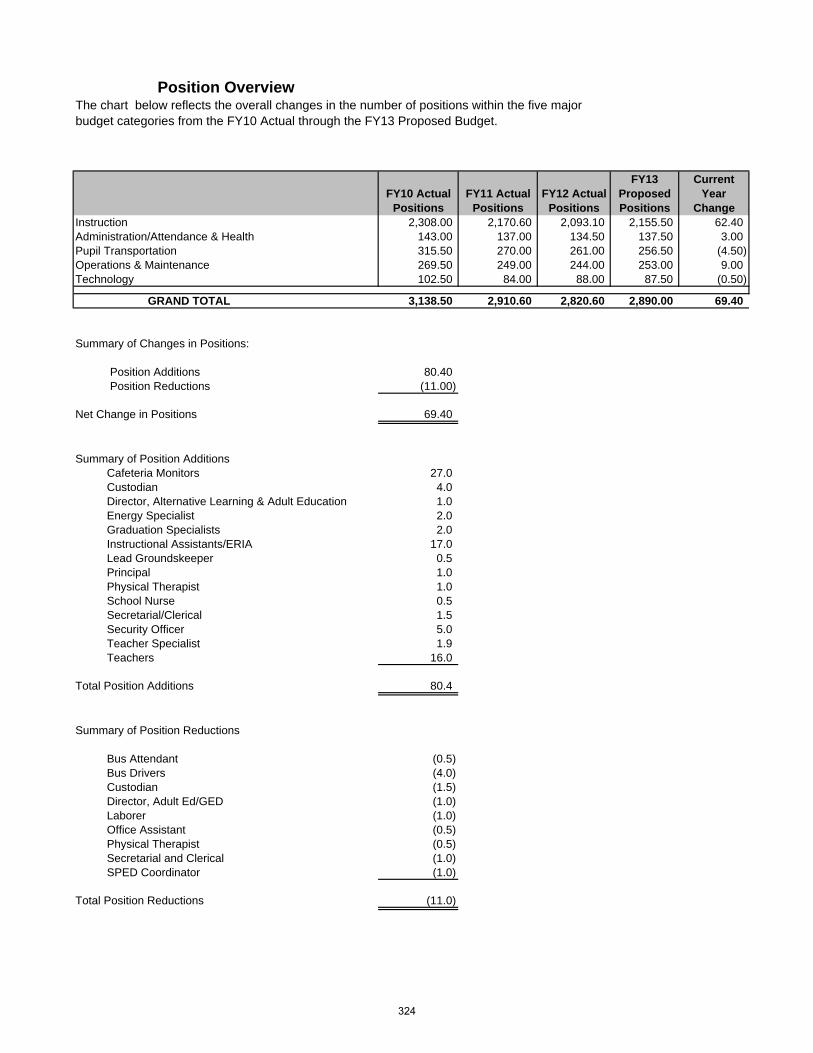
Position OverviewThe chart below reflects the overall changes in the number of positions within the five major budget categories from the FY10 Actual through the FY13 Proposed Budget.
FY10 Actual Positions
FY11 Actual Positions
FY12 Actual Positions
FY13 Proposed Positions
Current Year
ChangeInstruction 2,308.00 2,170.60 2,093.10 2,155.50 62.40Administration/Attendance & Health 143.00 137.00 134.50 137.50 3.00Pupil Transportation 315.50 270.00 261.00 256.50 (4.50)Operations & Maintenance 269.50 249.00 244.00 253.00 9.00Technology 102.50 84.00 88.00 87.50 (0.50)
GRAND TOTAL 3,138.50 2,910.60 2,820.60 2,890.00 69.40
Summary of Changes in Positions:
Position Additions 80.40 Position Reductions (11.00)
Net Change in Positions 69.40
Summary of Position Additions Cafeteria Monitors 27.0 Custodian 4.0 Director, Alternative Learning & Adult Education 1.0 Energy Specialist 2.0 Graduation Specialists 2.0 Instructional Assistants/ERIA 17.0 Lead Groundskeeper 0.5 Principal 1.0 Physical Therapist 1.0 School Nurse 0.5 Secretarial/Clerical 1.5 Security Officer 5.0 Teacher Specialist 1.9 Teachers 16.0
Total Position Additions 80.4
Summary of Position Reductions
Bus Attendant (0.5) Bus Drivers (4.0) Custodian (1.5) Director, Adult Ed/GED (1.0) Laborer (1.0) Office Assistant (0.5) Physical Therapist (0.5) Secretarial and Clerical (1.0) SPED Coordinator (1.0)
Total Position Reductions (11.0)
324

Position Summary - Operating Fund by Program Category
ProgramCode Description FY12 FY13 FY12 FY13 FY13
Actual F/T Change Budget F/T Actual P/T Change Budget P/T TotalINSTRUCTION
59 School Food ServicesCafeteria Monitors 0.00 0.00 0.00 0.00 27.00 27.00 27.00
82 Personnel ServicesTeacher Specialist 1.00 1.00 0.00 0.00 1.00
100 Regular ProgramsAdministrative Secretary II 6.00 6.00 0.00 0.00 6.00Administrative Secretary III 33.30 33.30 0.00 0.00 33.30Assistant Principal 51.00 51.00 0.00 0.00 51.00Dean of Students 9.00 9.00 0.00 0.00 9.00Executive Director 2.30 2.30 0.00 0.00 2.30Instructional Assistant - General Ed 69.00 5.00 74.00 0.00 0.00 74.00Library Assistant 0.00 0.00 0.00 0.50 0.50 0.50Office Assistant 0.00 0.00 15.50 (0.50) 15.00 15.00Principal 30.00 30.00 0.00 0.00 30.00School Accountant 4.00 4.00 0.00 0.00 4.00School Finance Officer 7.00 7.00 0.00 0.00 7.00Teacher - Elementary 427.00 427.00 0.00 0.00 427.00Teacher - Other 10.00 10.00 0.00 0.00 10.00Testing Specialist 4.00 4.00 0.00 0.00 4.00
101 School Social WorkAdministrative Secretary II 1.00 1.00 0.00 0.00 1.00Coordinator, School Social Work Services 1.00 1.00 0.00 0.00 1.00School Social Worker 8.00 8.00 0.50 0.50 8.50
102 English and Language ArtsAdministrative Support Specialist 1.00 1.00 0.00 0.00 1.00Curriculum Leader 1.00 1.00 0.00 0.00 1.00Teacher - Secondary 131.00 131.00 0.00 0.00 131.00Teacher Specialist 1.00 1.00 2.00 0.00 0.00 2.00
103 MathAdministrative Support Specialist 1.00 1.00 0.00 0.00 1.00Curriculum Leader 1.00 1.00 0.00 0.00 1.00Math Coach 0.00 1.00 1.00 0.00 0.00 1.00Teacher - Secondary 121.00 0.00 121.00 3.00 (1.00) 2.00 123.00Teacher Specialist 1.00 0.60 1.60 0.00 0.00 1.60
104 ReadingReading Coach - Elementary 5.00 5.00 0.00 0.00 5.00Reading Coach - Secondary 6.00 (1.00) 5.00 0.00 0.00 5.00Teacher - Elementary 13.00 (1.00) 12.00 0.00 0.00 12.00Teacher - Secondary 6.00 6.00 0.00 0.00 6.00
105 ArtTeacher - Elementary 19.00 19.00 0.00 0.00 19.00Teacher - Secondary 24.00 1.00 25.00 0.50 0.50 25.50
106 Health and PEAdministrative Secretary II 0.00 0.00 0.50 0.50 0.50Curriculum Leader 1.00 1.00 0.00 0.00 1.00Teacher - Elementary 19.00 19.00 0.00 0.00 19.00Teacher - Secondary 65.00 1.00 66.00 0.00 0.00 66.00
108 COMPASSCareer Coach 1.00 1.00 0.00 0.00 1.00Math Coach 2.00 (1.00) 1.00 0.00 0.00 1.00Parent Involvement Facilitator 2.00 2.00 0.00 0.00 2.00
109 Social SciencesAdministrative Support Specialist 1.00 1.00 0.00 0.00 1.00Curriculum Leader 1.00 1.00 0.00 0.00 1.00Teacher - Secondary 92.00 6.00 98.00 0.50 (0.50) 0.00 98.00Teacher Specialist 2.00 2.00 0.00 0.00 2.00
110 Music - ChoralStaff Accompaniest 0.00 0.00 1.00 1.00 1.00Teacher - Elementary 19.00 19.00 0.00 0.00 19.00Teacher - Secondary 10.00 (1.00) 9.00 0.00 0.50 0.50 9.50
111 Music - BandTeacher - Secondary 13.00 13.00 0 0.00 13.00
112 Foreign LanguagesCurriculum Leader 1.00 1.00 0.00 0.00 1.00Teacher - Elementary 1.00 1.00 0.00 0.00 1.00Teacher - Secondary 42.00 (2.00) 40.00 1.00 0.50 1.50 41.50
113 Student ServicesAdministrative Secretary III 1.00 1.00 0.00 0.00 1.00
PROPOSED POSITIONS
325

Position Summary - Operating Fund by Program Category
ProgramCode Description FY12 FY13 FY12 FY13 FY13
Actual F/T Change Budget F/T Actual P/T Change Budget P/T Total
PROPOSED POSITIONS
Behavior Specialist 1.00 1.00 0.00 0.00 1.00Director, Student Services 1.00 1.00 0.00 0.00 1.00School Court Liaison 1.00 1.00 0.00 0.00 1.00
114 ScienceAdministrative Support Specialist 1.00 1.00 0.00 0.00 1.00Curriculum Leader 1.00 1.00 0.00 0.00 1.00Teacher - Secondary 85.00 6.00 91.00 1.00 (1.00) 0.00 91.00Teacher Specialist 1.00 0.30 1.30 0.00 0.00 1.30
117 Early Reading InterventionEarly Reading Intervention Assistant 0.00 0.00 12.00 3.00 15.00 15.00Teacher Specialist 1.00 1.00 0.00 0.00 1.00
119 International Bacc-SecondaryInternational Baccalaureate Coordinator 1.00 1.00 0.00 0.00 1.00
124 SOL Algebra ReadinessTeacher - Secondary 6.00 0.00 6.00 0.00 1.00 1.00 7.00
140 Fine ArtsCurriculum Leader 1.00 1.00 0.00 0.00 1.00Teacher Specialist 1.00 1.00 0.00 0.00 1.00
157 English as a Second LanguageTeacher - Elementary 5.00 5.00 1.50 1.50 6.50Teacher - Secondary 5.00 (1.00) 4.00 0.00 0.00 4.00
161 Guidance ServicesAdministrative Secretary II 12.00 12.00 0.00 0.00 12.00Administrative Secretary III 1.00 1.00 0.00 0.00 1.00Director, School Counseling 1.00 1.00 0.00 0.00 1.00Guidance Counselor - Elementary 19.00 19.00 0.00 0.00 19.00Guidance Counselor - Secondary 36.00 36.00 1.00 1.00 37.00School Counseling Coordinator 4.00 4.00 0.00 0.00 4.00
171 Library Media ServicesCoordinator, Library Media Services 1.00 1.00 0.00 0.00 1.00Library Database Specialist 1.00 1.00 0.00 0.00 1.00Library Media Specialist 37.00 37.00 0.00 0.00 37.00Library Processing Clerk 0.00 0.00 1.00 1.00 1.00Library Technician 9.00 9.00 0.00 0.00 9.00
200 Special General CurriculumAdministrative Secretary III 1.00 1.00 0.00 0.00 1.00Director, Special Education 1.00 1.00 0.00 0.00 1.00Graduation Facilitators 4.00 4.00 0.00 0.00 4.00Information Systems Processing Specialist 1.00 1.00 0.00 0.00 1.00Instructional Assistant 38.00 48.00 86.00 0.00 0.00 86.00Parent Resource Facilitator 0.00 0.00 0.50 0.50 0.50Special Education Coordinator 6.00 (1.00) 5.00 0.00 0.00 5.00Teacher - Elementary 48.00 (3.00) 45.00 0.00 0.00 45.00Teacher - Secondary 25.00 71.00 96.00 0.00 0.50 0.50 96.50
210 Educable Intellectually DisabledTeacher - Elementary 3.00 5.00 8.00 0.00 0.00 8.00Teacher - Secondary 14.00 (1.00) 13.00 0.00 0.00 13.00Instructional Assistant 19.00 6.00 25.00 0.00 0.00 25.00
211 Trainable Intellectually DisabledInstructional Assistant 5.00 13.00 18.00 0.00 0.00 18.00Teacher - Elementary 1.00 4.00 5.00 0.00 0.00 5.00Teacher - Secondary 4.00 9.00 13.00 0.00 0.00 13.00
212 Severely and Prof HandicappedInstructional Assistant 2.00 2.00 4.00 0.00 0.00 4.00Student Attendant 3.00 (1.00) 2.00 0.00 0.00 2.00Teacher - Elementary 0.00 2.00 2.00 0.00 0.00 2.00Teacher - Secondary 3.00 (1.00) 2.00 0.00 0.00 2.00
213 Hard of HearingEducational Interpreter 8.00 8.00 0.00 8.00Hearing Impairment Specialist 3.00 3.00 0.00 0.00 3.00Instructional Assistant 1.00 1.00 0.00 0.00 1.00
215 Speech or Language ImpairedSpeech/Language Pathologist 18.00 18.00 1.00 1.00 19.00
216 Visually HandicappedInstructional Assistant 1.00 (1.00) 0.00 0.00 0.00 0.00Orientation and Mobility Specialist 1.00 1.00 0.00 1.00Visual Impairment Specialist 1.00 1.00 0.00 0.00 1.00
217 Emotionally DisturbedInstructional Assistant 10.00 (7.00) 3.00 0.00 0.00 3.00Teacher - Elementary 3.00 3.00 0.00 0.00 3.00Teacher - Secondary 11.00 (11.00) 0.00 0.00 0.00 0.00
218 Orthopedically Impaired
326

Position Summary - Operating Fund by Program Category
ProgramCode Description FY12 FY13 FY12 FY13 FY13
Actual F/T Change Budget F/T Actual P/T Change Budget P/T Total
PROPOSED POSITIONS
Instructional Assistant 1.00 1.00 0.00 0.00 1.00219 Other Health Impaired
Instructional Assistant 3.00 3.00 0.00 0.00 3.00220 Autistic
Instructional Assistant 21.00 (9.00) 12.00 0.00 0.00 12.00Teacher - Elementary 3.00 (3.00) 0.00 0.00 0.00 0.00Teacher - Secondary 5.00 (4.00) 1.00 0.00 0.00 1.00
221 Specific Learning DisabilityInstructional Assistant 38.00 (38.00) 0.00 0.00 0.00 0.00Instructional Leader 6.00 6.00 0.00 6.00Teacher - Secondary 56.00 (56.00) 0.00 0.00 0.00 0.00
224 Developmentally DelayedInstructional Assistant 12.00 (4.00) 8.00 0.00 0.00 8.00Teacher - Elementary 15.00 (3.00) 12.00 0.00 0.00 12.00
300 Vocational ProgramsAdministrative Secretary II 1.00 1.00 0.00 0.00 1.00Curriculum Leader 1.00 1.00 0.00 0.00 1.00
320 MarketingTeacher - Secondary 5.00 5.00 0.00 0.00 5.00
340 FACS-OccupationalTeacher - Secondary 2.00 2.00 0.00 0.00 2.00
341 FACS-Family FocusTeacher - Secondary 15.00 (2.00) 13.00 1.00 (0.50) 0.50 13.50
342 FACS-Health OccupationsTeacher - Secondary 1.00 1.00 2.00 0.50 (0.50) 0.00 2.00
360 Business EducationTeacher - Secondary 28.00 1.00 29.00 0.50 (0.50) 0.00 29.00
380 Trade and IndustrialTeacher - Secondary 3.00 3.00 0.00 0.00 3.00
400 Gifted and TalentedAdministrative Secretary III 2.00 2.00 0.00 0.00 2.00Assistant Principal 1.00 1.00 0.00 0.00 1.00Director, Academic Advancement & Enrichment 1.00 1.00 0.00 0.00 1.00Office Assistant 0.00 0.00 0.50 0.50 0.50Principal 1.00 1.00 0.00 0.00 1.00School Finance Officer 1.00 1.00 0.00 0.00 1.00Teacher - Secondary 12.00 12.00 0.00 0.00 12.00Teacher - Other 7.00 (1.00) 6.00 0.50 1.00 1.50 7.50
500 Other ProgramsAdministrative Secretary III 1.00 1.00 0.00 0.00 1.00Coordinator 1.00 1.00 0.00 0.00 1.00Director, Adult Education & GED Programs 1.00 (1.00) 0.00 0.00 0.00 0.00Director, Alternative Learning & Adult Education 0.00 1.00 1.00 0.00 0.00 1.00
505 Performance Learning CenterAcademic Coordinator 1.00 1.00 0.00 0.00 1.00Administrative Secretary III 1.00 1.00 0.00 0.00 1.00Learning Facilitator 5.00 5.00 0.00 0.00 5.00
510 Dropout PreventionAdministrative Coordinator 1.00 1.00 0.00 0.00 1.00Teacher - G.E.D. 3.00 1.00 4.00 0.00 0.00 4.00
516 HomeboundHomebound Services Director 1.00 1.00 0.00 0.00 1.00Homebound Staff 0.00 0.00 0.50 0.50 0.50School Info Processing Specialist II 1.00 (1.00) 0.00 0.00 0.00 0.00
570 General Athletic ExpensesCoordinator, Athletics 1.00 1.00 0.00 0.00 1.00
810 At-Risk-4-Year Old ProgramAdministrative Secretary I 0.00 0.00 0.50 (0.50) 0.00 0.00Administrative Secretary III 0.00 0.00 0.00 0.00 0.00Director, Early Childhood Education 1.00 1.00 0.00 0.00 1.00Family Service Worker 1.00 1.00 0.00 0.00 1.00Instructional Assistant - Pre-school 27.00 27.00 0.00 0.00 27.00Teacher - Pre-School 27.00 27.00 0.00 0.00 27.00
820 Early Childhood ProgramsAdministrative Secretary I 0.00 0.00 0.00 0.50 0.50 0.50Administrative Secretary III 0.00 1.00 1.00 0.00 0.00 1.00Principal 0.00 1.00 1.00 0.00 0.00 1.00
TOTAL INSTRUCTION 2,048.60 32.90 2,081.50 44.50 29.50 74.00 2,155.50
327
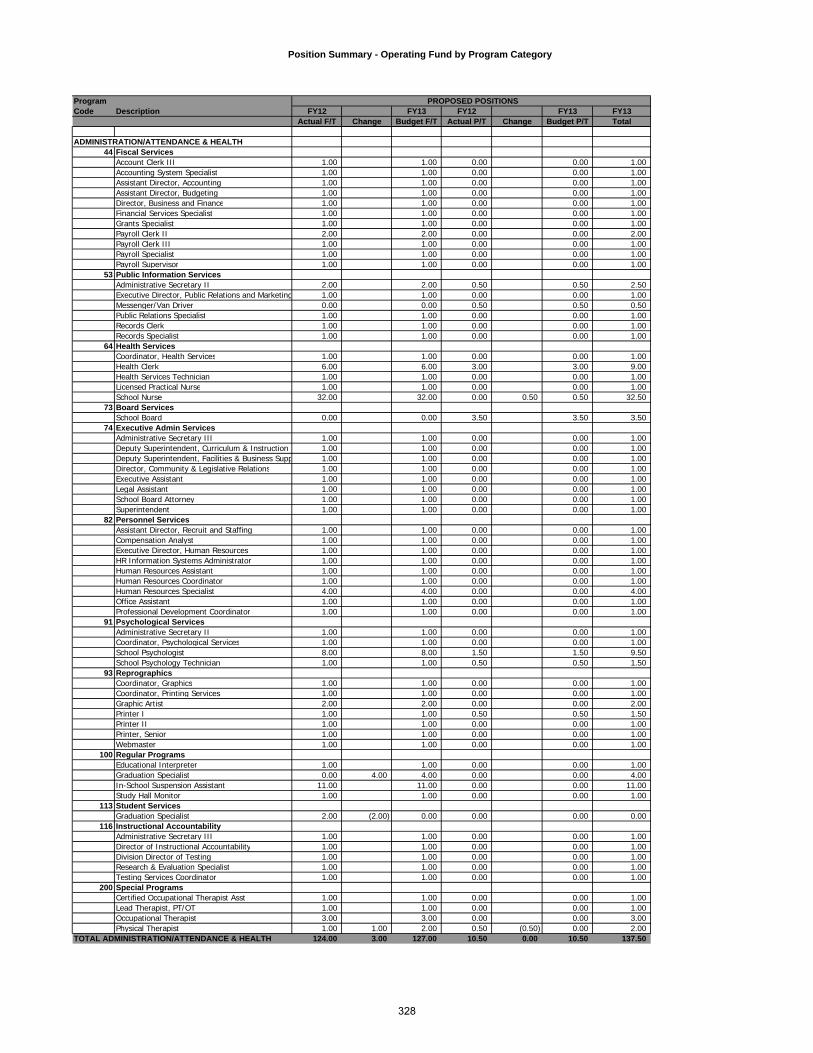
Position Summary - Operating Fund by Program Category
ProgramCode Description FY12 FY13 FY12 FY13 FY13
Actual F/T Change Budget F/T Actual P/T Change Budget P/T Total
PROPOSED POSITIONS
ADMINISTRATION/ATTENDANCE & HEALTH44 Fiscal Services
Account Clerk III 1.00 1.00 0.00 0.00 1.00Accounting System Specialist 1.00 1.00 0.00 0.00 1.00Assistant Director, Accounting 1.00 1.00 0.00 0.00 1.00Assistant Director, Budgeting 1.00 1.00 0.00 0.00 1.00Director, Business and Finance 1.00 1.00 0.00 0.00 1.00Financial Services Specialist 1.00 1.00 0.00 0.00 1.00Grants Specialist 1.00 1.00 0.00 0.00 1.00Payroll Clerk II 2.00 2.00 0.00 0.00 2.00Payroll Clerk III 1.00 1.00 0.00 0.00 1.00Payroll Specialist 1.00 1.00 0.00 0.00 1.00Payroll Supervisor 1.00 1.00 0.00 0.00 1.00
53 Public Information ServicesAdministrative Secretary II 2.00 2.00 0.50 0.50 2.50Executive Director, Public Relations and Marketing 1.00 1.00 0.00 0.00 1.00Messenger/Van Driver 0.00 0.00 0.50 0.50 0.50Public Relations Specialist 1.00 1.00 0.00 0.00 1.00Records Clerk 1.00 1.00 0.00 0.00 1.00Records Specialist 1.00 1.00 0.00 0.00 1.00
64 Health ServicesCoordinator, Health Services 1.00 1.00 0.00 0.00 1.00Health Clerk 6.00 6.00 3.00 3.00 9.00Health Services Technician 1.00 1.00 0.00 0.00 1.00Licensed Practical Nurse 1.00 1.00 0.00 0.00 1.00School Nurse 32.00 32.00 0.00 0.50 0.50 32.50
73 Board ServicesSchool Board 0.00 0.00 3.50 3.50 3.50
74 Executive Admin ServicesAdministrative Secretary III 1.00 1.00 0.00 0.00 1.00Deputy Superintendent, Curriculum & Instruction 1.00 1.00 0.00 0.00 1.00Deputy Superintendent, Facilities & Business Supp 1.00 1.00 0.00 0.00 1.00Director, Community & Legislative Relations 1.00 1.00 0.00 0.00 1.00Executive Assistant 1.00 1.00 0.00 0.00 1.00Legal Assistant 1.00 1.00 0.00 0.00 1.00School Board Attorney 1.00 1.00 0.00 0.00 1.00Superintendent 1.00 1.00 0.00 0.00 1.00
82 Personnel ServicesAssistant Director, Recruit and Staffing 1.00 1.00 0.00 0.00 1.00Compensation Analyst 1.00 1.00 0.00 0.00 1.00Executive Director, Human Resources 1.00 1.00 0.00 0.00 1.00HR Information Systems Administrator 1.00 1.00 0.00 0.00 1.00Human Resources Assistant 1.00 1.00 0.00 0.00 1.00Human Resources Coordinator 1.00 1.00 0.00 0.00 1.00Human Resources Specialist 4.00 4.00 0.00 0.00 4.00Office Assistant 1.00 1.00 0.00 0.00 1.00Professional Development Coordinator 1.00 1.00 0.00 0.00 1.00
91 Psychological ServicesAdministrative Secretary II 1.00 1.00 0.00 0.00 1.00Coordinator, Psychological Services 1.00 1.00 0.00 0.00 1.00School Psychologist 8.00 8.00 1.50 1.50 9.50School Psychology Technician 1.00 1.00 0.50 0.50 1.50
93 ReprographicsCoordinator, Graphics 1.00 1.00 0.00 0.00 1.00Coordinator, Printing Services 1.00 1.00 0.00 0.00 1.00Graphic Artist 2.00 2.00 0.00 0.00 2.00Printer I 1.00 1.00 0.50 0.50 1.50Printer II 1.00 1.00 0.00 0.00 1.00Printer, Senior 1.00 1.00 0.00 0.00 1.00Webmaster 1.00 1.00 0.00 0.00 1.00
100 Regular ProgramsEducational Interpreter 1.00 1.00 0.00 0.00 1.00Graduation Specialist 0.00 4.00 4.00 0.00 0.00 4.00In-School Suspension Assistant 11.00 11.00 0.00 0.00 11.00Study Hall Monitor 1.00 1.00 0.00 0.00 1.00
113 Student ServicesGraduation Specialist 2.00 (2.00) 0.00 0.00 0.00 0.00
116 Instructional AccountabilityAdministrative Secretary III 1.00 1.00 0.00 0.00 1.00Director of Instructional Accountability 1.00 1.00 0.00 0.00 1.00Division Director of Testing 1.00 1.00 0.00 0.00 1.00Research & Evaluation Specialist 1.00 1.00 0.00 0.00 1.00Testing Services Coordinator 1.00 1.00 0.00 0.00 1.00
200 Special ProgramsCertified Occupational Therapist Asst 1.00 1.00 0.00 0.00 1.00Lead Therapist, PT/OT 1.00 1.00 0.00 0.00 1.00Occupational Therapist 3.00 3.00 0.00 0.00 3.00Physical Therapist 1.00 1.00 2.00 0.50 (0.50) 0.00 2.00
TOTAL ADMINISTRATION/ATTENDANCE & HEALTH 124.00 3.00 127.00 10.50 0.00 10.50 137.50
328
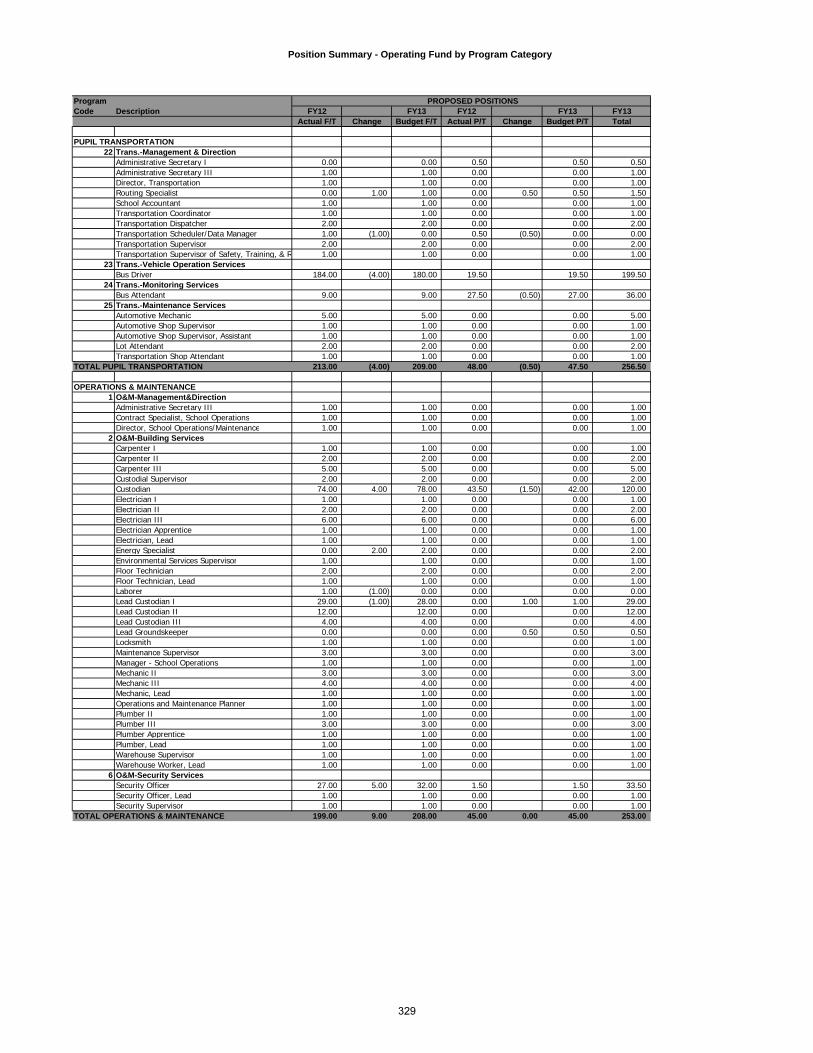
Position Summary - Operating Fund by Program Category
ProgramCode Description FY12 FY13 FY12 FY13 FY13
Actual F/T Change Budget F/T Actual P/T Change Budget P/T Total
PROPOSED POSITIONS
PUPIL TRANSPORTATION22 Trans.-Management & Direction
Administrative Secretary I 0.00 0.00 0.50 0.50 0.50Administrative Secretary III 1.00 1.00 0.00 0.00 1.00Director, Transportation 1.00 1.00 0.00 0.00 1.00Routing Specialist 0.00 1.00 1.00 0.00 0.50 0.50 1.50School Accountant 1.00 1.00 0.00 0.00 1.00Transportation Coordinator 1.00 1.00 0.00 0.00 1.00Transportation Dispatcher 2.00 2.00 0.00 0.00 2.00Transportation Scheduler/Data Manager 1.00 (1.00) 0.00 0.50 (0.50) 0.00 0.00Transportation Supervisor 2.00 2.00 0.00 0.00 2.00Transportation Supervisor of Safety, Training, & R 1.00 1.00 0.00 0.00 1.00
23 Trans.-Vehicle Operation ServicesBus Driver 184.00 (4.00) 180.00 19.50 19.50 199.50
24 Trans.-Monitoring ServicesBus Attendant 9.00 9.00 27.50 (0.50) 27.00 36.00
25 Trans.-Maintenance ServicesAutomotive Mechanic 5.00 5.00 0.00 0.00 5.00Automotive Shop Supervisor 1.00 1.00 0.00 0.00 1.00Automotive Shop Supervisor, Assistant 1.00 1.00 0.00 0.00 1.00Lot Attendant 2.00 2.00 0.00 0.00 2.00Transportation Shop Attendant 1.00 1.00 0.00 0.00 1.00
TOTAL PUPIL TRANSPORTATION 213.00 (4.00) 209.00 48.00 (0.50) 47.50 256.50
OPERATIONS & MAINTENANCE1 O&M-Management&Direction
Administrative Secretary III 1.00 1.00 0.00 0.00 1.00Contract Specialist, School Operations 1.00 1.00 0.00 0.00 1.00Director, School Operations/Maintenance 1.00 1.00 0.00 0.00 1.00
2 O&M-Building ServicesCarpenter I 1.00 1.00 0.00 0.00 1.00Carpenter II 2.00 2.00 0.00 0.00 2.00Carpenter III 5.00 5.00 0.00 0.00 5.00Custodial Supervisor 2.00 2.00 0.00 0.00 2.00Custodian 74.00 4.00 78.00 43.50 (1.50) 42.00 120.00Electrician I 1.00 1.00 0.00 0.00 1.00Electrician II 2.00 2.00 0.00 0.00 2.00Electrician III 6.00 6.00 0.00 0.00 6.00Electrician Apprentice 1.00 1.00 0.00 0.00 1.00Electrician, Lead 1.00 1.00 0.00 0.00 1.00Energy Specialist 0.00 2.00 2.00 0.00 0.00 2.00Environmental Services Supervisor 1.00 1.00 0.00 0.00 1.00Floor Technician 2.00 2.00 0.00 0.00 2.00Floor Technician, Lead 1.00 1.00 0.00 0.00 1.00Laborer 1.00 (1.00) 0.00 0.00 0.00 0.00Lead Custodian I 29.00 (1.00) 28.00 0.00 1.00 1.00 29.00Lead Custodian II 12.00 12.00 0.00 0.00 12.00Lead Custodian III 4.00 4.00 0.00 0.00 4.00Lead Groundskeeper 0.00 0.00 0.00 0.50 0.50 0.50Locksmith 1.00 1.00 0.00 0.00 1.00Maintenance Supervisor 3.00 3.00 0.00 0.00 3.00Manager - School Operations 1.00 1.00 0.00 0.00 1.00Mechanic II 3.00 3.00 0.00 0.00 3.00Mechanic III 4.00 4.00 0.00 0.00 4.00Mechanic, Lead 1.00 1.00 0.00 0.00 1.00Operations and Maintenance Planner 1.00 1.00 0.00 0.00 1.00Plumber II 1.00 1.00 0.00 0.00 1.00Plumber III 3.00 3.00 0.00 0.00 3.00Plumber Apprentice 1.00 1.00 0.00 0.00 1.00Plumber, Lead 1.00 1.00 0.00 0.00 1.00Warehouse Supervisor 1.00 1.00 0.00 0.00 1.00Warehouse Worker, Lead 1.00 1.00 0.00 0.00 1.00
6 O&M-Security ServicesSecurity Officer 27.00 5.00 32.00 1.50 1.50 33.50Security Officer, Lead 1.00 1.00 0.00 0.00 1.00Security Supervisor 1.00 1.00 0.00 0.00 1.00
TOTAL OPERATIONS & MAINTENANCE 199.00 9.00 208.00 45.00 0.00 45.00 253.00
329

Position Summary - Operating Fund by Program Category
ProgramCode Description FY12 FY13 FY12 FY13 FY13
Actual F/T Change Budget F/T Actual P/T Change Budget P/T Total
PROPOSED POSITIONS
TECHNOLOGY69 Tech.-Management & Direction
Administrative Secretary III 1.00 1.00 0.00 0.00 1.00Director, Information Systems 1.00 1.00 0.00 0.00 1.00
70 Tech.-Instructional SupportApplications Database Administrator 1.00 1.00 0.00 0.00 1.00Assistant Network Administrator 1.00 1.00 0.00 0.00 1.00Assistant System Administrator 1.00 1.00 0.00 0.00 1.00Communication Network Specialist 1.00 1.00 0.00 0.00 1.00Database Manager 1.00 1.00 0.00 0.00 1.00Fixed Asset Specialist 1.00 1.00 0.00 0.00 1.00Information Systems Support Specialist II 1.00 1.00 0.00 0.00 1.00Information Systems Support Specialist Sr 2.00 2.00 0.00 0.00 2.00Local Database Manager 1.00 1.00 0.00 0.00 1.00MAC School Technology Specialist 1.00 1.00 0.00 0.00 1.00Network Support Specialist II 1.00 1.00 0.00 0.00 1.00Network Support Specialist Senior 1.00 1.00 0.00 0.00 1.00Network Support Supervisor 1.00 1.00 0.00 0.00 1.00Network System Administrator 1.00 1.00 0.00 0.00 1.00Programmer Analyst II 1.00 1.00 0.00 0.00 1.00Programmer Analyst, Senior 3.00 3.00 0.00 0.00 3.00School Info Processing Specialist II 8.00 8.00 0.00 0.00 8.00School Technology Specialist I 1.00 1.00 0.00 0.00 1.00School Technology Specialist II 13.00 13.00 0.00 0.00 13.00Senior System Administrator 1.00 1.00 0.00 0.00 1.00Technical Analyst 1.00 1.00 0.00 0.00 1.00Technology Repair Specialist II 1.00 1.00 0.00 0.00 1.00Technology Repair Specialist, Senior 3.00 3.00 0.00 0.00 3.00Technology Support Manager 1.00 1.00 0.00 0.00 1.00Technology Support Specialist II 3.00 3.00 0.00 0.00 3.00Technology Support Specialist, Senior 3.00 3.00 0.00 0.00 3.00
170 Tech.-Classroom InstructionTeacher - Other (ITRT) 6.00 6.00 0.00 0.00 6.00Teacher Specialist 2.00 2.00 0.00 0.00 2.00
370 Technology EducationTeacher - Elementary 2.00 2.00 0.00 0.00 2.00Teacher - Secondary 22.00 (1.00) 21.00 0.00 0.50 0.50 21.50
TOTAL TECHNOLOGY 88.00 (1.00) 87.00 0.00 0.50 0.50 87.50
TOTAL POSITIONS - OPERATING BUDGET 2,672.60 39.90 2,712.50 148.00 29.50 177.50 2,890.00
330

PERFORMANCE MEASURES
Parent Satisfaction Survey
For three consecutive years since the Hampton school division made a decision to query parents about their perceptions of Hampton City Schools, the division has received outstanding parent approval. Our 2010 Parent Survey yielded great results from our Hampton parents regarding their perceptions about Hampton City Schools.
The survey results showed that 81% of our parents gave the Hampton school division an overall grade of “A” or “B”.
This is highly significant in that a national survey conducted in 2009 by the Phi Delta Kappa/Gallup Poll, recorded only 74% of parents awarding their local public schools an “A” or B” rating. In addition, 96% of the Hampton parents gave the school division an overall grade of “A”, “B” or “C.”
The 2010 Parent Survey consisted of statements in six categories, which were School Environment, Student Achievement, Teacher/Staff Expectations, Support and Service, Bell Schedule and Transportation. The Response choices ranged from “Strongly Agree” to “No Opinion.” The Overall Grade category included “A”, “B”, “C”, ”D” and “F”, and the survey also included a section for written comments.
Surveys are conducted on a biennial basis. A survey was conducted during the 11-12 school year, and a report is expected to be presented to the School Board in Fall 2012.
MGT Efficiency Review
The Commonwealth of Virginia inaugurated the school efficiency review program in the 2004-05 school year as the governor’s Education for a Lifetime initiative. The program involves contracting with outside educational experts to perform efficiency reviews for school divisions within the Commonwealth; school divisions volunteer to participate. The goals of the reviews are to ensure that non-instructional functions are running efficiently so that as much of school division funding as possible goes directly into the classroom and to identify savings that can be gained in the school division through best practices. School divisions participating in this program are required to pay 25 percent of the cost of the study, 25 percent of internal direct costs to be reimbursed, plus an additional 25 percent if certain implementation targets are not met. The efficiency review results provide guidance to school divisions in determining whether educational dollars are being utilized to the fullest extent possible. In July 2008, MGT of America, Inc. (MGT), was awarded a contract to conduct an efficiency review of Hampton City Schools (HCS). As stated in the Request for Proposal (RFP), the purpose of the study is to conduct an external review of the efficiency of various offices and operations within the division and to present a final
331
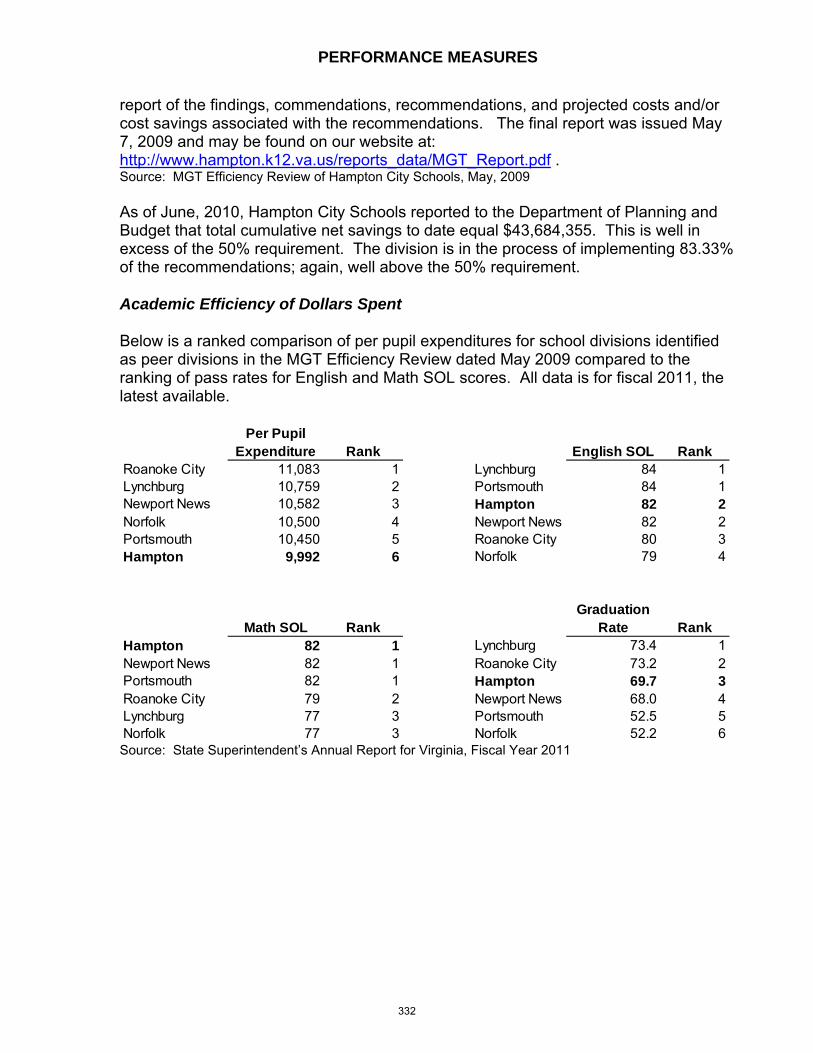
PERFORMANCE MEASURES
report of the findings, commendations, recommendations, and projected costs and/or cost savings associated with the recommendations. The final report was issued May 7, 2009 and may be found on our website at: http://www.hampton.k12.va.us/reports_data/MGT_Report.pdf . Source: MGT Efficiency Review of Hampton City Schools, May, 2009 As of June, 2010, Hampton City Schools reported to the Department of Planning and Budget that total cumulative net savings to date equal $43,684,355. This is well in excess of the 50% requirement. The division is in the process of implementing 83.33% of the recommendations; again, well above the 50% requirement.
Academic Efficiency of Dollars Spent
Below is a ranked comparison of per pupil expenditures for school divisions identified as peer divisions in the MGT Efficiency Review dated May 2009 compared to the ranking of pass rates for English and Math SOL scores. All data is for fiscal 2011, the latest available.
Per Pupil Expenditure Rank English SOL Rank
Roanoke City 11,083 1 Lynchburg 84 1Lynchburg 10,759 2 Portsmouth 84 1Newport News 10,582 3 Hampton 82 2Norfolk 10,500 4 Newport News 82 2Portsmouth 10,450 5 Roanoke City 80 3Hampton 9,992 6 Norfolk 79 4
Math SOL RankGraduation
Rate RankHampton 82 1 Lynchburg 73.4 1Newport News 82 1 Roanoke City 73.2 2Portsmouth 82 1 Hampton 69.7 3Roanoke City 79 2 Newport News 68.0 4Lynchburg 77 3 Portsmouth 52.5 5Norfolk 77 3 Norfolk 52.2 6 Source: State Superintendent’s Annual Report for Virginia, Fiscal Year 2011
332
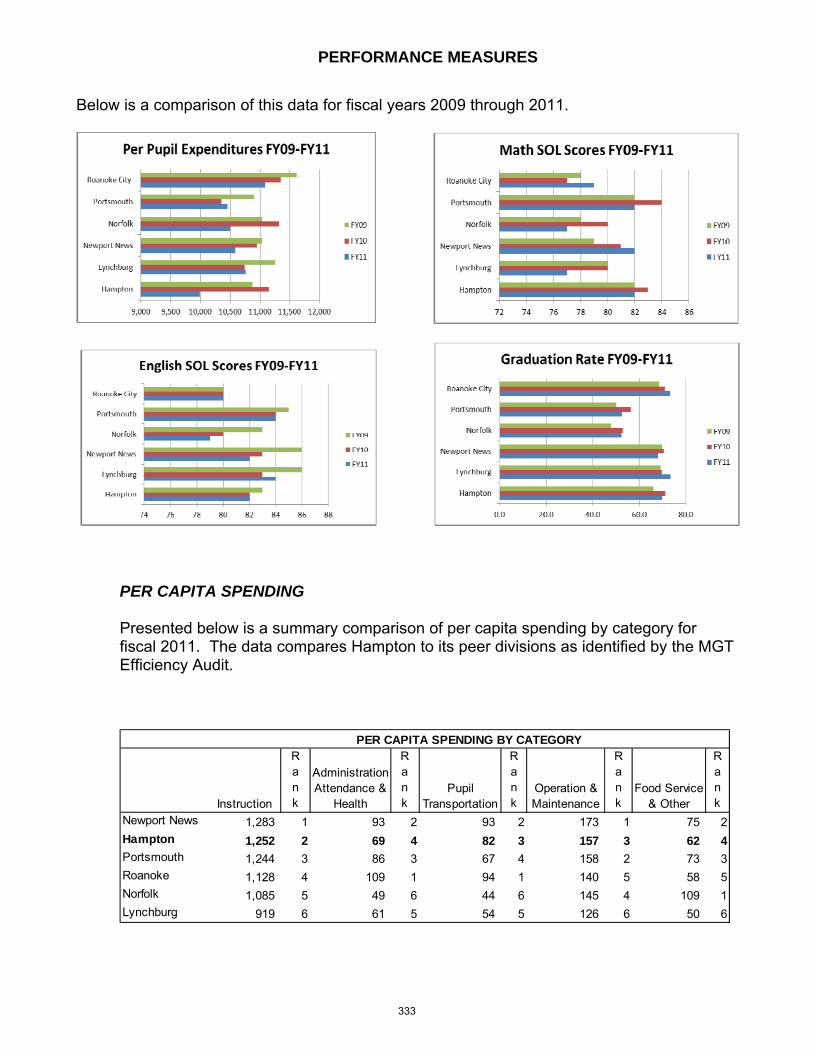
PERFORMANCE MEASURES
Below is a comparison of this data for fiscal years 2009 through 2011.
PER CAPITA SPENDING
Presented below is a summary comparison of per capita spending by category for fiscal 2011. The data compares Hampton to its peer divisions as identified by the MGT Efficiency Audit.
Instruction
Rank
Administration Attendance &
Health
Rank
Pupil Transportation
Rank
Operation & Maintenance
Rank
Food Service & Other
Rank
Newport News 1,283 1 93 2 93 2 173 1 75 2
Hampton 1,252 2 69 4 82 3 157 3 62 4Portsmouth 1,244 3 86 3 67 4 158 2 73 3Roanoke 1,128 4 109 1 94 1 140 5 58 5Norfolk 1,085 5 49 6 44 6 145 4 109 1Lynchburg 919 6 61 5 54 5 126 6 50 6
PER CAPITA SPENDING BY CATEGORY
333
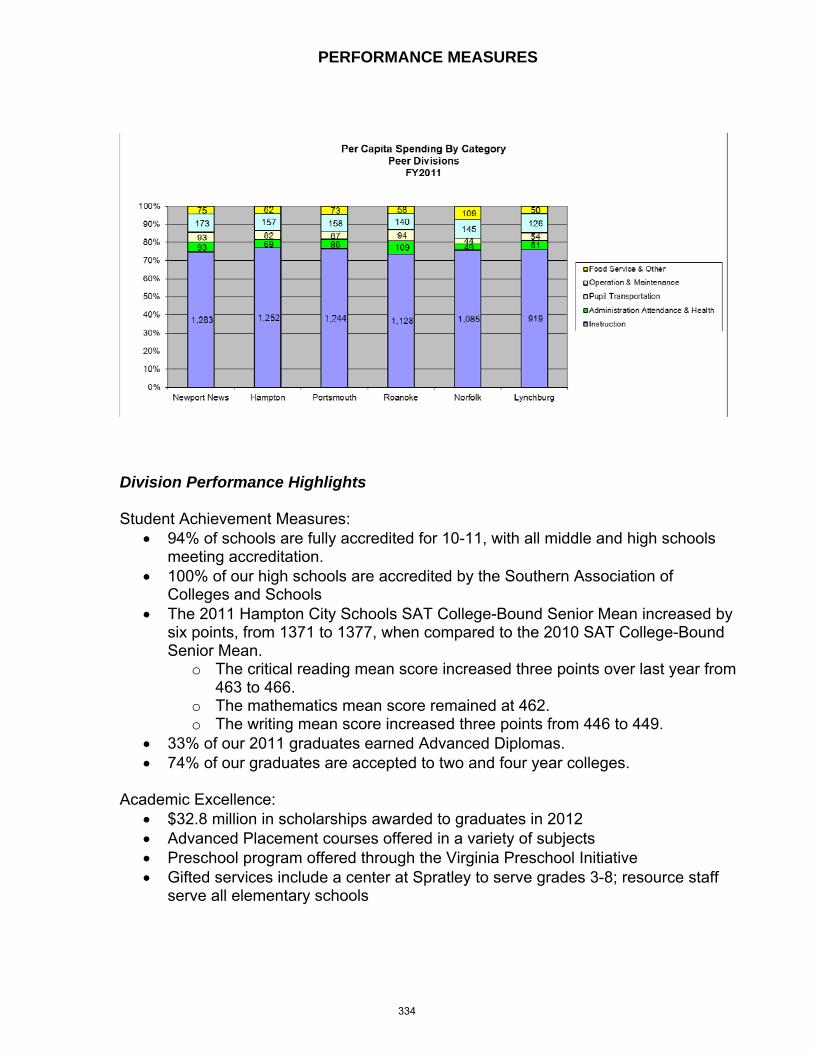
PERFORMANCE MEASURES
Division Performance Highlights Student Achievement Measures:
94% of schools are fully accredited for 10-11, with all middle and high schools meeting accreditation.
100% of our high schools are accredited by the Southern Association of Colleges and Schools
The 2011 Hampton City Schools SAT College-Bound Senior Mean increased by six points, from 1371 to 1377, when compared to the 2010 SAT College-Bound Senior Mean.
o The critical reading mean score increased three points over last year from 463 to 466.
o The mathematics mean score remained at 462. o The writing mean score increased three points from 446 to 449.
33% of our 2011 graduates earned Advanced Diplomas. 74% of our graduates are accepted to two and four year colleges.
Academic Excellence:
$32.8 million in scholarships awarded to graduates in 2012 Advanced Placement courses offered in a variety of subjects Preschool program offered through the Virginia Preschool Initiative Gifted services include a center at Spratley to serve grades 3-8; resource staff
serve all elementary schools
334

PERFORMANCE MEASURES
Teaching Staff:
1616 teachers & guidance counselors. 108 National Board Certified Teachers 48% of teachers hold advanced degrees 96% of teacher vacancies filled prior to the start of school 88% of all new teachers hired during the 2010-11 school year returned to HCS in
2011-12 Student Demographics:
Enrollment 2011-12 (End of Year ADM): 20,575 o 61.88% African American o 29.82% Caucasian o 4.76% Multi-Ethnic o 3.54% Other
13.73% of students were enrolled in the Special Education Program in 2011-12 10.29% of students were enrolled in the Gifted Education Program in 2011-12 56% of students received free or reduced lunches in 2011-12
GOALS GOAL ONE: MAXIMIZE EVERY CHILD’S LEARNING To meet or exceed the performance levels described in the student learning targets, the following strategic objectives will be implemented: � Standards-based teaching and learning—policies, initiatives, curriculum, instruction, assessments and student performance based upon clearly defined rigorous academic standards � Students as critical and creative thinkers—opportunities provided for students to explore new ideas, points of view and possibilities, to frame questions and gather information, use reason to investigate questions, evaluate ideas, advocate positions and resolve conflicts � Students as responsible learners—opportunities provided for students to set goals and monitor progress, both individually and collaboratively, design learning strategies and identify indicators of success � Prevention, not remediation—system that includes both time and support for intervention and enrichment � Relevancy-based teaching and learning—opportunities provided for students to apply core knowledge, concepts and skills to solve real world problems or tasks, connecting concepts to current issues
335
PERFORMANCE MEASURES
GOAL TWO: CREATE SAFE, NURTURING LEARNING ENVIRONMENTS To meet or exceed the performance levels described in the student learning targets, the following strategic objectives will be implemented: � Relationship building—relationships and safety nets to ensure student success academically, socially, emotionally and physically. � Physical environment—comfortable, welcoming, clean facilities that are in compliance with regulatory guidelines. � Caring environment—psychological, social and emotional safety to increase student connection to school. � Positive culture—students and staff demonstrate Hampton City Schools core values and a sense of community in each classroom. GOAL THREE: ENHANCE PARENT AND COMMUNITY ENGAGEMENT AND SATIS FACTION To meet or exceed the performance levels described in the student learning targets the following strategic objectives will be implemented: � Parent, student and staff alliances—active participation in the division in areas that most interest and affect them with a clear understanding of mutual roles and benefits. � Customer-based culture—superior customer service designed to identify and exceed the expectations of all customers. � Community collaboration—involvement of stakeholders to address district challenges. GOAL FOUR: ATTRACT, DEVELOP AND RETAIN EXCEPTIONAL STAFF KEY INITIATIVES—GOAL 4 To meet or exceed the performance levels described in the student learning targets the following strategic objectives will be implemented: � Build staff capacity—learning systems that develop the knowledge, skills and abilities of all staff. � Talent investment—systems, policies and processes for recruitment, retention, assessment and evaluation, compensation and benefits and succession planning. � Workforce commitment—systems, policies and processes that support collaborative, trusting, respectful relationships, a safe environment, good communication and information flow and satisfaction with work. GOAL FIVE: MAINTAIN EFFECTIVE, EFFICIENT AND INNOVATIVE SUPPORT SYSTEMS To meet or exceed the performance levels described in the student learning targets the following strategic objectives will be implemented: � Management by fact—data and information analyzed to determine trends, projections, and cause ad effect to support planning, improve division operations, and identify best practice benchmarks and compare division performance with comparable districts. � Culture of continuous improvement—the structured problem-solving process of plan-dostudy-act (PDSA) followed for all improvement activities.
336
PERFORMANCE MEASURES
� Process management—organizational knowledge and skills deployed to identify and improve core processes. � Emergency preparedness—procedures focused on prevention, management, continuity of operations and recovery of key work processes. GOAL SIX: MANAGE FISCAL RESOURCES EFFECTIVELY AND EFFICIENTLY To meet or exceed the performance levels described in the student learning targets the following strategic objectives will be implemented: � Transparency—disclosing fiscal information in a timely and systematic manner. � Benchmarking—comparing business processes and performance metrics to best practices. � Financial discipline—systematically collecting, analyzing and using information to align performance expectations with resources.
337

HAMPTON CITY SCHOOLS Our Commitment to Excellence
AWARDS AND RECOGNITIONS
Gates Millennium Scholar Named
Phoebus High School’s Valedictorian, Mia Knowles, has been named a Gates Millennium Scholar! This is the second Gates Scholar to hail from Phoebus High School. The Bill Gates Scholarship Program provides winners with funds to attend any United States college or university through graduate school.
HHS Student Wins International Art Contest
Joshua Williams, a student at Hampton High School, was selected the Grand Prize winner in the Sister Cities International Young Artist Contest. This year’s theme was “Youth as a Catalyst for Change", and Josh's winning Linoleum Print Artwork was entitled "Cotton Club Crescendo." He was presented with a certificate and a check for $1,000.
Bethel Grad Wins Gold in London
Francena McCorory, a 2006 graduate of Bethel High School, won Olympic Gold in the women's 4x400 relay race in London! While at Bethel High, she won 14 state titles — and was named to the Junior Olympic squad. She continued her education at Hampton University where she graduated in 2010.
Peninsula District PTA Award Winner
Carolyn Boothe, a sixth grade student at Spratley Gifted Center, won First Place among middle school students in Hampton, Newport News and York County, for her essay entitled "Community Responsibility." Carolyn competed against 91 sixth, seventh and eighth graders for the PTA Citizenship Contest award.
Tidewater Science and Engineering Fair Award Winners Hampton High School brothers Alan and Wyatt Booth won U.S. Achievement Awards (Senior Division) at the Tidewater Science and Engineering Fair held at Old Dominion University. Alan won in the Life Sciences area, while Wyatt earned it in the Environmental Sciences area.
Spelling Bee Champ
Karlesha Canandy, a student at Lindsay Middle School, is the winner of the Scripps Tidewater Regional Spelling Bee Championship. She also went to Washington, D.C. to participate on the national level in May.
338

HAMPTON CITY SCHOOLS Our Commitment to Excellence
National Scholarship Finalists
Kecoughtan High School senior Victoria Worrals has been named a National Merit Finalist while KHS senior, Terry (T.J) Stokes, has been named a National Achievement Finalist.
Hampton High Band Named Honor Band
The Hampton High School Band has earned the HIGHEST honor that a high school music program can earn – the title of "Virginia Honor Band". This represents the second year in a row that the band has earned this all-important title. The band is under the direction of Mr. Justin Ratcliff.
PHS Robotics Team Wins Xerox Creativity Award
The Phoebus High School Robotics Team has won the Xerox Creativity Award for the design of our basketball shooting mechanism at the Chesapeake Regional FIRST Robotics Competition. With 63 teams competing, there were only two engineering awards presented at the tournament. According to teacher/coordinator Don William, the team won for "their unique engineering design of the basketball shooting mechanism incorporating four balanced springs, a machined ball cradle, and electromagnetic catch and release system."
Lindsay and Hampton Named IB World Schools
Lindsay Middle School and Hampton High School have received official Middle Years Programme (MYP) certification from the International Baccalaureate (IB) in Geneva, Switzerland, and are now designated “IB World Schools!” Only 900 schools worldwide offer IB MYP. The Middle Years Programme is a program of international education, designed for students ages 11 to 16. Now Hampton has a complete K-12 International Baccalaureate pipeline, with Burbank Elementary offering the IB Primary Years Programme, Lindsay and Hampton offering the MYP, and Hampton High offering the IB diploma program.
Jones Students Take Top Foreign Language Awards
When the Foreign Language Association of Virginia (FLAVA) held its 100th Anniversary Student Poster Contest, three students from Jones Magnet Middle School won all top three awards!! With the theme – Languages Are Timeless -Ty'khari Antonio Rawlings, Amanda Elisabeth Ruck and Brionna Nicole Boetger - placed First, Second and Third respectively! According to FLAVA’s president, Dr. Kathryn Murphy-Judy, the “entire ballroom corridor was lined with poster submissions from across the state. It is the simple truth that Mr. Rawlings, Ms. Ruck and Ms. Boetger …produced the best posters.”
339

HAMPTON CITY SCHOOLS Our Commitment to Excellence
HCS Named A 'Best Community For Music Education' in the United States
The National Association of Music Merchants Foundation has named Hampton City Schools a "Best Community" for music education, based on the results of its 13th annual Best Communities for Music Education (BCME) survey. The survey is a nationwide search for communities that provide access to music education as an essential part of a complete education and exemplify commitment and support for music education. The BCME survey is designed and implemented in collaboration with The Institute for Educational Research and Public Services of Lawrence, Kansas, an affiliate of the University of Kansas. Only 176 communities nationwide (166 School Districts and 10 Schools) achieved this prestigious designation.
Eaton Teacher Named Virginia Lottery's "Super Teacher"
On May 24th, Eaton Middle School 8th grade science teacher, Jeffrey Weigel, was surprised at school by Virginia Lottery officials when he was named a "Virginia Lottery Super Teacher!" Mr. Weigel is a career switcher who spent a gratifying career in Aerospace Engineering. He is one of only eight winning teachers from throughout Virginia!! Mr. Weigel received a $2,000 cash prize and an additional $2,000 classroom credit from The Supply Room Companies.
Top Nurse
Glory Gill, School Nurse at Andrews PreK-8 School, was listed in the April edition of Hampton Roads Magazine, as one of the area's Top 10 Medical Professionals! Glory, whose maiden name just happens to be Nightingale, has been as nurse for seven years and is also the recipient of the Outstanding Nurse of the year award from the Air Force Association.
Caggiano Competes In IronmanLIVE Event!
On August 11, John Caggiano (Executive Director for Elementary School Leadership) competed in "IronmanLIVE"! This NYC race involved a 2.4 mile swim (in the Hudson River), a 112-mile bike ride and a 26.2 mile run. John successfully completed the race with the following times: Swim – (2.4 miles) – 53 mins, 40 sec/Bike – (112 miles) – 5 hrs, 59 mins, 6 sec/Run - (26.2 miles) - 4 hrs, 34 mins, 39 sec. Total Time : 11 hrs, 47 mins, 6 sec.
All Four High Schools Fully Accredited
All four of Hampton’s high schools reached full accreditation in all 5 areas, including the newly added graduation index. The benchmark set for this indicator is 85%. Bethel High School reached 93%, Kecoughtan High School and Hampton High School both reached 91%, and Phoebus High School
340
HAMPTON CITY SCHOOLS Our Commitment to Excellence
reached 87%. This represents a significant increase for each high school and echoes the commitment HCS has to....Every Child, Every Day!
HCS Increases Graduation Rate, Decreases Dropout Rate
The Hampton school division has made significant gains in increasing the graduation rates of its students! This year the division showed a graduation rate of 84.8% compared to a rate of 79% a year ago. Also of importance is the fact that the division's dropout rate fell from 8% in 2010 to 4.8% in 2011.
VSBA "Healthy Meals" Winner
Hampton City Schools won First Place in the Virginia School Boards Association's (VSBA) "Hunger and Healthy Meals 2012 Competition"! The division received VSBA's highest honor - "Food For Thought Leaders" - in the area of Healthy School Meals. Kudos to Julia Bryant, HCS Director of Food and Nutrition Services, for submitting the division's "Let's Grow Healthy" program, which proved to be the #1 winner in the Student Population 10,001 and Up category!
HCS PR Department Wins National Award
In mid-July, the National School Public Relations Association (NSPRA) presented the school division's Public Relations & Marketing Department with its Golden Achievement Award. It was given for the department's School Board Recognition - Recipe for Success Marketing Program. Working with students from the Moton Early Childhood Center, this involved the development of a cookbook, an ad being placed in the daily newspaper, the development of a video and an official presentation to the School Board.
341

GLOSSARY OF KEY FINANCIAL TERMS
Accrual Basis – A basis of accounting in which transactions are recognized at the time they are incurred, as opposed to when cash is received or spent. Appropriation – a legal authorization granted by a legislative body to make expenditures and to incur obligations for specific purposes. Attrition – A method of achieving a reduction in personnel cost by not refilling the positions vacated through resignation, reassignment, transfer, retirement, or means other than layoffs for a period of time or at a reduced salary. Authorized Positions – Employee positions, which are authorized in the adopted budget, to be filled during the year. ADM – Average Daily Membership (unadjusted) – Student membership on any given day within a school month. ADM – Average Daily Membership (adjusted) – Student membership on any given day within a school month with a 15% reduction for half-day kindergarten. Basis of Accounting – a term used to refer to when revenues, expenditures, expenses and transfers and the related assets and liabilities are recognized in the accounts and reported in the financial statements (i.e. Accrual or Cash). Budget – a financial plan for a given period, usually a fiscal year, containing an estimate of proposed expenditures and a proposed means of financing them. Budget Calendar – The schedule of key dates which the government follows in the preparation and adoption of the budget. Cash Basis – A basis of accounting in which transactions are recognized only when cash is increased or decreased. Category, Administration/Attendance and Health – activities concerned with establishing and administering policy for the school division. These include the School Board, Executive Services, Human Resources, Fiscal Services and Health Services. Also included are the costs associated with promoting the well-being of students and staff and costs related to encouraging good school attendance. Category, Instruction – programs and services dealing directly with the interaction between teachers and students. Also, included in this category are the activities associated with curriculum development and instructional staff training. Funds for instructional supplies and equipment are also included as are funds for contributions to joint regional, vocational and special education programs.
342
GLOSSARY OF KEY FINANCIAL TERMS
Category, Operations and Maintenance – activities concerned with keeping the physical plants clean, open, and safe for use. This includes heating, lighting, ventilating systems, repair of facilities and replacement of facility equipment. Utilities, postage and communication are also included in this area. Category, Pupil Transportation – activities associated with transporting students from home to school and back home as well as on other trips to school activities. This includes the purchase and maintenance of our yellow bus fleet. Category, Technology – captures technology-related expenditures as required by the General Assembly. Any services involving the use of technology for instructional, public information, or any other use should be recorded here. This includes technology for classroom instruction, instructional support, administration and operations and maintenance. This category was new in FY09. Chart of Accounts - a list of all accounts in an accounting system. Compensation – Compensation includes salaries and benefits paid to staff for services rendered. Composite Index - a factor used in the Virginia Basic Aid formula, (derived from true values of property, ADM, population, retail sales, adjusted gross income, etc.) to determine local and state share of basic appropriation. Contingency – A budgetary reserve set aside for emergencies or unforeseen expenditures not otherwise budgeted. Contractual Services – Services rendered to a government by private firms, individuals, or other governmental agencies. Examples include utilities, rent, maintenance agreements, and professional consulting services. Deficit – The excess of an entity’s liabilities over its assets or the excess of expenditures or expenses over revenues during a single accounting period. Department – The basic organizational unit of government which is functionally unique in its delivery of services. Disbursement – The expenditure of monies from an account. Employee (Fringe) Benefits – Compensation in addition to regular salary, provided to an employee. This may include such benefits as health insurance, life insurance, retirement contributions, social security, etc. Encumbrances – Obligations in the form of purchase orders, contracts, or other commitments which are chargeable to an appropriation and for which a part of the appropriation is reserved.
343

GLOSSARY OF KEY FINANCIAL TERMS
Equipment (Capital Outlay) – The purchase of additional equipment not currently owned. Equipment (Replacement) – The purchases of equipment to replace another piece of equipment which is to be sold or scrapped. Expenditure – The payment of cash on the transfer of property or services for the purpose of acquiring an asset, service or settling a loss. Expenditures Per Pupil – Expenditures for a given period divided by a pupil unit of measure (i.e., ADM or ADA, etc.). Expense – Charges incurred (whether paid immediately or unpaid) for operations, maintenance, interest or other charges. Fiscal Year – A twelve month period to which the annual budget applies and at the end of which the entity determines its financial position and results of operations. Local school divisions in the Commonwealth of Virginia have fiscal years that begin July 1 and end June 30. Food Service Budget – This fund accounts for all of the cafeteria operations within the school division, including the preparation and serving of school breakfast and lunch. The primary funding source for this independent financial operation is the fees charged for meals. Full-Time Equivalent Position (FTE) – a measurement equal to one staff person working a full-time work schedule for a specific position for one fiscal year. A part-time position is converted to the decimal equivalent of a full-time position. Fund – An independent accounting entity with a self-balancing set of accounts, which are segregated for the purpose of carrying on specific activities in accordance with special regulations, restrictions or limitations. Fund Balance – The excess of assets of a fund over its liabilities and reserves. Fund Balance – Reserved for Encumbrances – An account used to segregate a portion of fund balance for expenditure upon vendor performance. Generally Accepted Accounting Principles (GAAP) – Uniform minimum standards for financial accounting and recording, encompassing the conventions, rules, and procedures that define accepted accounting principles. Grant – A contribution made by a government or other organization to support a particular function. Grants may be classified as either operational or capital, depending upon the grantee.
344
GLOSSARY OF KEY FINANCIAL TERMS
Hampton City School Board – An elected body created according to state law and vested with the responsibility for elementary and secondary public education activities in the City of Hampton. Impact Aid – Section 8003 – Funding from the United States Department of Education for loss of tax revenues for students whose parents live or work on federal property. Indirect Cost – A cost necessary for the functioning of the organization as a whole, but which cannot be directly assigned to one service. Also an amount, usually a percentage of expenditures, allowed to be recovered from administering grant programs. Interfund Transfers – The movement of monies between funds of the same governmental entity. Line-Item Budget – A budget prepared along departmental lines that focuses on what is to be bought. Materials and Supplies – Expendable materials and operating supplies necessary to conduct departmental operations. Operating Budget – This is the general fund for the school division. It is used to account for all financial resources except those required to be accounted for in other funds. Operating Expenses – The cost for personnel, materials, and equipment required for a department to function. Operating Revenue – Funds that the government receives as income to pay for ongoing operations. It includes such items as taxes, fees from specific services, interest earnings, and grant revenues. Operating revenue are used to pay for day-to-day services. Performance Budget – A budget wherein expenditures are based primarily upon measurable performance of activities and work programs. Personnel Services – Expenditures for salaries, wages and fringe benefits of an entity’s employees. Program Budget – A budget which allocates money to the functions or activities of a government rather than to specific items of cost or to specific departments. Purchase Order – A document submitted to a vendor which requests materials or services at a price indicated on the purchase order. The issuance of a purchase order establishes an encumbrance in the accounting system.
345
GLOSSARY OF KEY FINANCIAL TERMS
Resources – Total amounts available for appropriation including estimated revenues, fund transfers and beginning balances. Revenue – Sources of income financing the operations of government. State Standards of Accreditation – the standards for the accreditation of public schools in Virginia are designed to ensure that an effective educational program is established and maintained in Virginia’s public schools. The Code of Virginia requires the Virginia Board of Education to promulgate regulations establishing standards for accreditation of public elementary and secondary schools. A school can be assigned one of the following ratings: (1)Fully Accredited (2)Accredited with Warning (3)Conditionally Accredited. SOL (Standards of Learning) – State-mandated testing that occurs in the spring. Beginning with the Class of 2004, verified credits for graduation will be based on the achievement by the student of a passing score. Supplemental Appropriation – An additional appropriation made by the governing body after the budget year has started. Transfers In/Out – Amounts transferred from one fund to another to assist in financing the services for the recipient fund.
346
COMPENSATION PLAN
Pay Scales and Supplemental Schedules
School Year 12-13
Effective July 1, 2012
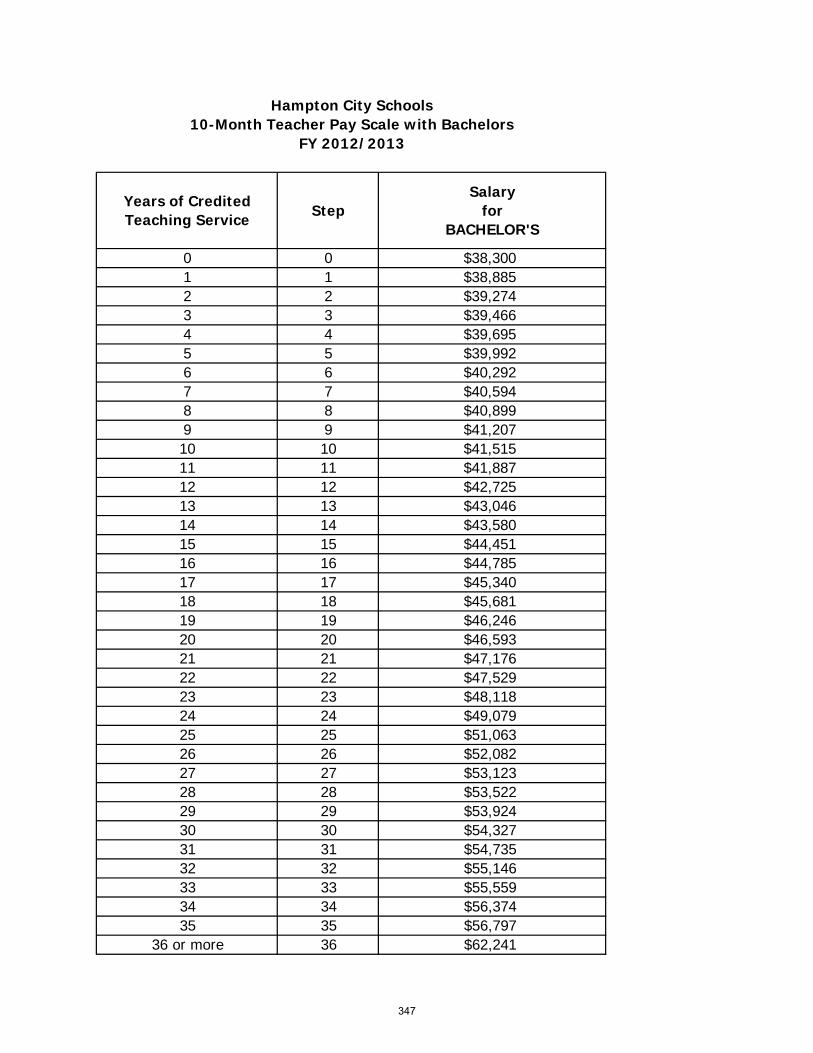
0 0 $38,3001 1 $38,8852 2 $39,2743 3 $39,4664 4 $39,6955 5 $39,9926 6 $40,2927 7 $40,5948 8 $40,8999 9 $41,20710 10 $41,51511 11 $41,88712 12 $42,72513 13 $43,04614 14 $43,58015 15 $44,45116 16 $44,78517 17 $45,34018 18 $45,68119 19 $46,24620 20 $46,59321 21 $47,17622 22 $47,52923 23 $48,11824 24 $49,07925 25 $51,06326 26 $52,08227 27 $53,12328 28 $53,52229 29 $53,92430 30 $54,32731 31 $54,73532 32 $55,14633 33 $55,55934 34 $56,37435 35 $56,797
36 or more 36 $62,241
Years of Credited Teaching Service
StepSalary
forBACHELOR'S
Hampton City Schools10-Month Teacher Pay Scale with Bachelors
FY 2012/2013
347

0 0 $38,300 $40,100 $40,900 $41,100 $42,1001 1 $38,885 $40,703 $41,511 $41,713 $42,7232 2 $39,274 $41,092 $41,900 $42,102 $43,1123 3 $39,466 $41,284 $42,092 $42,294 $43,3044 4 $39,695 $41,512 $42,320 $42,522 $43,5325 5 $39,992 $41,810 $42,618 $42,820 $43,8306 6 $40,292 $42,110 $42,918 $43,120 $44,1307 7 $40,594 $42,412 $43,220 $43,422 $44,4328 8 $40,899 $42,717 $43,525 $43,727 $44,7379 9 $41,207 $43,024 $43,832 $44,034 $45,04410 10 $41,515 $43,333 $44,140 $44,342 $45,35211 11 $41,887 $43,704 $44,512 $44,714 $45,72412 12 $42,725 $44,543 $45,351 $45,553 $46,56313 13 $43,046 $44,864 $45,672 $45,873 $46,88314 14 $43,580 $45,398 $46,206 $46,408 $47,41815 15 $44,451 $46,269 $47,077 $47,279 $48,28916 16 $44,785 $46,603 $47,411 $47,613 $48,62317 17 $45,340 $47,158 $47,966 $48,168 $49,17818 18 $45,681 $47,498 $48,306 $48,508 $49,51819 19 $46,246 $48,064 $48,872 $49,074 $50,08420 20 $46,593 $48,411 $49,219 $49,421 $50,43121 21 $47,176 $48,994 $49,801 $50,003 $51,01322 22 $47,529 $49,347 $50,155 $50,357 $51,36723 23 $48,118 $49,936 $50,744 $50,946 $51,95624 24 $49,079 $50,897 $51,705 $51,907 $52,91725 25 $51,063 $52,881 $53,689 $53,891 $54,90126 26 $52,082 $53,900 $54,708 $54,910 $55,92027 27 $53,123 $54,941 $55,749 $55,951 $56,96128 28 $53,522 $55,340 $56,148 $56,350 $57,36029 29 $53,924 $55,742 $56,550 $56,752 $57,76230 30 $54,327 $56,145 $56,953 $57,155 $58,16531 31 $54,735 $56,553 $57,361 $57,563 $58,57332 32 $55,146 $56,964 $57,772 $57,974 $58,98433 33 $55,559 $57,377 $58,185 $58,387 $59,39734 34 $56,374 $58,192 $59,000 $59,202 $60,21235 35 $56,797 $58,615 $59,423 $59,625 $60,635
36 or more 36 $62,241 $64,059 $64,867 $65,069 $66,079
10-Month Teacher Pay Scale with MastersFY 2012/2013
Years of Credited Teaching Service
Step
Hampton City Schools
Salaryfor
BACHELOR'S
Salaryfor
MASTER'S
Salaryfor
MASTER'S +30
Salaryfor
EDS/CAGS
Salaryfor
DOCTORATE
348
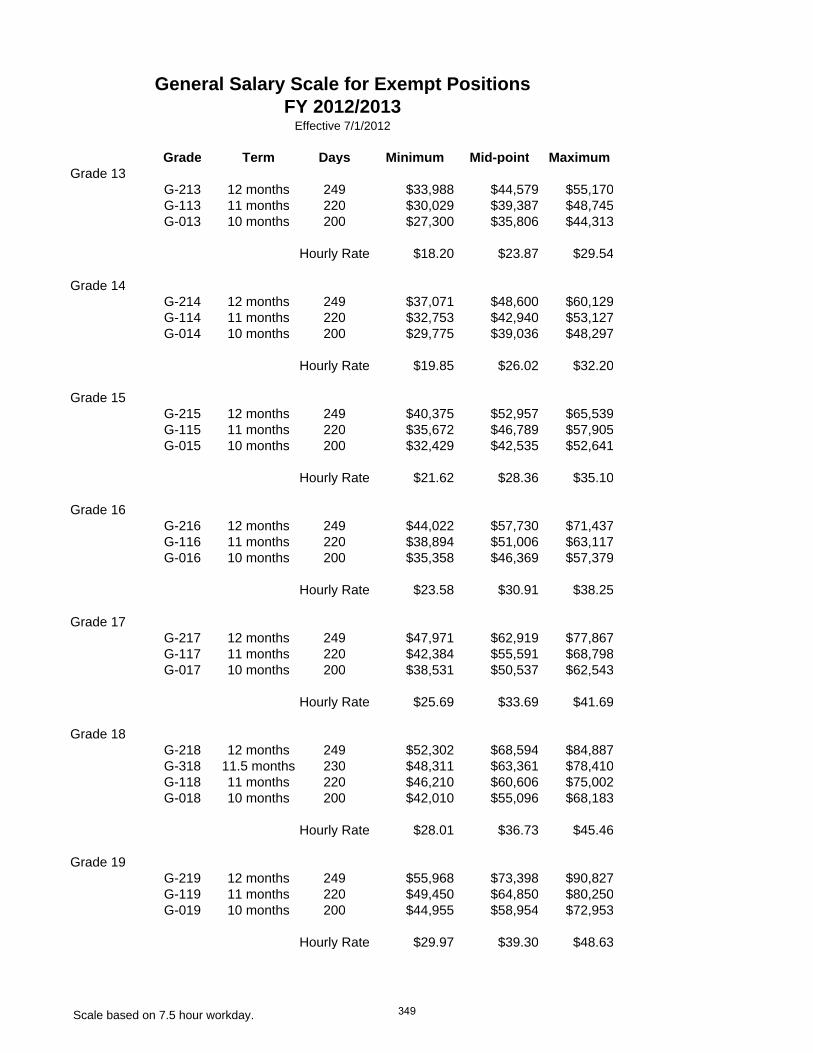
Grade Term Days Minimum Mid-point MaximumGrade 13
G-213 12 months 249 $33,988 $44,579 $55,170G-113 11 months 220 $30,029 $39,387 $48,745G-013 10 months 200 $27,300 $35,806 $44,313
Hourly Rate $18.20 $23.87 $29.54
Grade 14G-214 12 months 249 $37,071 $48,600 $60,129G-114 11 months 220 $32,753 $42,940 $53,127G-014 10 months 200 $29,775 $39,036 $48,297
Hourly Rate $19.85 $26.02 $32.20
Grade 15G-215 12 months 249 $40,375 $52,957 $65,539G-115 11 months 220 $35,672 $46,789 $57,905G-015 10 months 200 $32,429 $42,535 $52,641
Hourly Rate $21.62 $28.36 $35.10
Grade 16G-216 12 months 249 $44,022 $57,730 $71,437G-116 11 months 220 $38,894 $51,006 $63,117G-016 10 months 200 $35,358 $46,369 $57,379
Hourly Rate $23.58 $30.91 $38.25
Grade 17G-217 12 months 249 $47,971 $62,919 $77,867G-117 11 months 220 $42,384 $55,591 $68,798G-017 10 months 200 $38,531 $50,537 $62,543
Hourly Rate $25.69 $33.69 $41.69
Grade 18G-218 12 months 249 $52,302 $68,594 $84,887G-318 11.5 months 230 $48,311 $63,361 $78,410G-118 11 months 220 $46,210 $60,606 $75,002G-018 10 months 200 $42,010 $55,096 $68,183
Hourly Rate $28.01 $36.73 $45.46
Grade 19G-219 12 months 249 $55,968 $73,398 $90,827G-119 11 months 220 $49,450 $64,850 $80,250G-019 10 months 200 $44,955 $58,954 $72,953
Hourly Rate $29.97 $39.30 $48.63
General Salary Scale for Exempt PositionsFY 2012/2013
Effective 7/1/2012
Scale based on 7.5 hour workday. 349
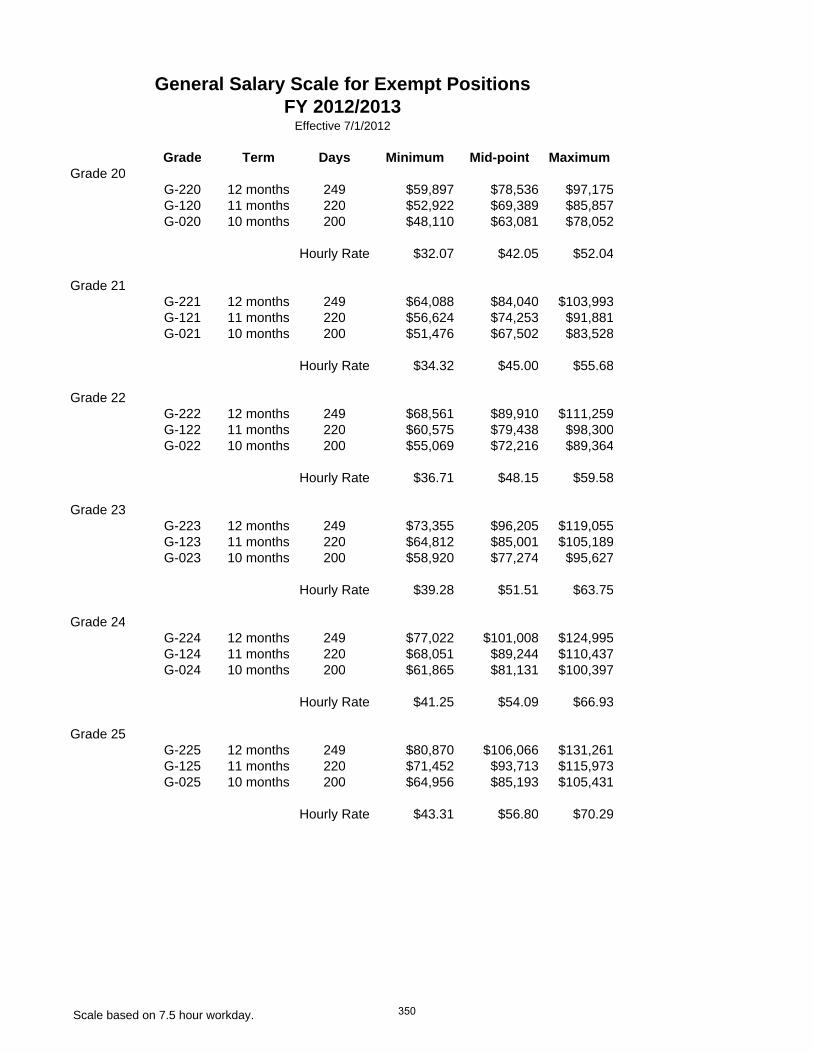
Grade Term Days Minimum Mid-point Maximum
General Salary Scale for Exempt PositionsFY 2012/2013
Effective 7/1/2012
Grade 20G-220 12 months 249 $59,897 $78,536 $97,175G-120 11 months 220 $52,922 $69,389 $85,857G-020 10 months 200 $48,110 $63,081 $78,052
Hourly Rate $32.07 $42.05 $52.04
Grade 21G-221 12 months 249 $64,088 $84,040 $103,993G-121 11 months 220 $56,624 $74,253 $91,881G-021 10 months 200 $51,476 $67,502 $83,528
Hourly Rate $34.32 $45.00 $55.68
Grade 22G-222 12 months 249 $68,561 $89,910 $111,259G-122 11 months 220 $60,575 $79,438 $98,300G-022 10 months 200 $55,069 $72,216 $89,364
Hourly Rate $36.71 $48.15 $59.58
Grade 23G-223 12 months 249 $73,355 $96,205 $119,055G-123 11 months 220 $64,812 $85,001 $105,189G-023 10 months 200 $58,920 $77,274 $95,627
Hourly Rate $39.28 $51.51 $63.75
Grade 24G-224 12 months 249 $77,022 $101,008 $124,995G-124 11 months 220 $68,051 $89,244 $110,437G-024 10 months 200 $61,865 $81,131 $100,397
Hourly Rate $41.25 $54.09 $66.93
Grade 25G-225 12 months 249 $80,870 $106,066 $131,261G-125 11 months 220 $71,452 $93,713 $115,973G-025 10 months 200 $64,956 $85,193 $105,431
Hourly Rate $43.31 $56.80 $70.29
Scale based on 7.5 hour workday. 350
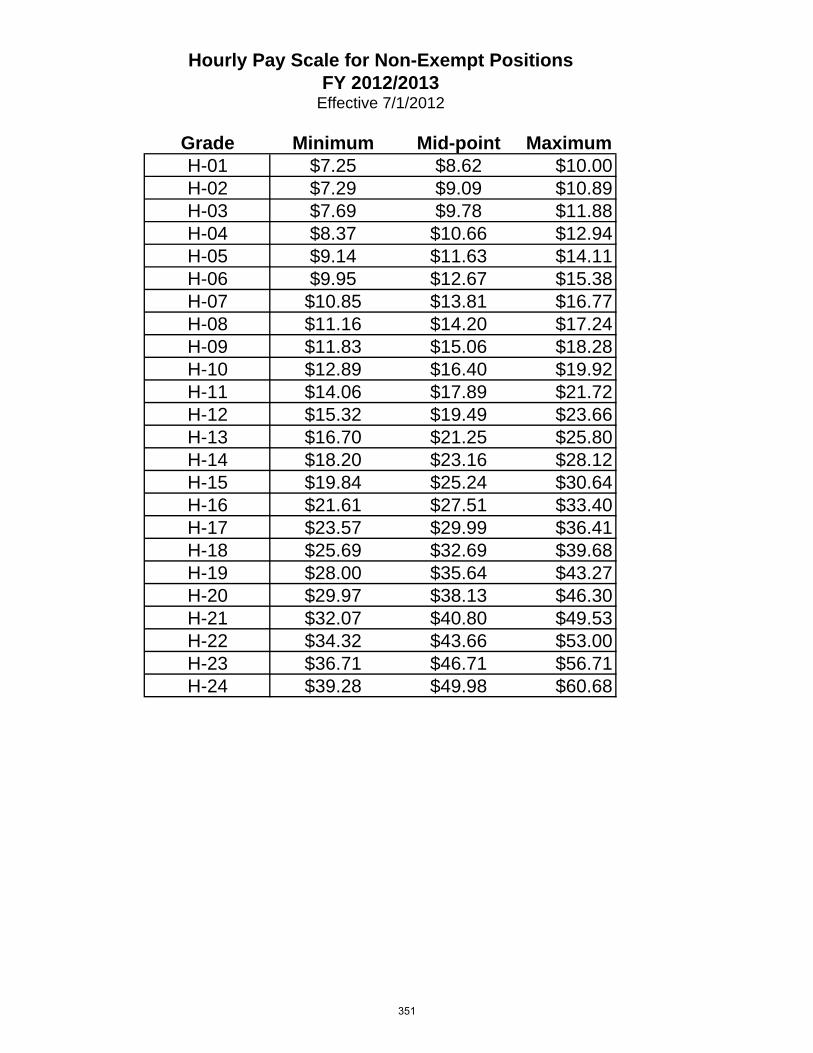
Grade Minimum Mid-point MaximumH-01 $7.25 $8.62 $10.00H-02 $7.29 $9.09 $10.89H-03 $7.69 $9.78 $11.88H-04 $8.37 $10.66 $12.94H-05 $9.14 $11.63 $14.11H-06 $9.95 $12.67 $15.38H-07 $10.85 $13.81 $16.77H-08 $11.16 $14.20 $17.24H-09 $11.83 $15.06 $18.28H-10 $12.89 $16.40 $19.92H-11 $14.06 $17.89 $21.72H-12 $15.32 $19.49 $23.66H-13 $16.70 $21.25 $25.80H-14 $18.20 $23.16 $28.12H-15 $19.84 $25.24 $30.64H-16 $21.61 $27.51 $33.40H-17 $23.57 $29.99 $36.41H-18 $25.69 $32.69 $39.68H-19 $28.00 $35.64 $43.27H-20 $29.97 $38.13 $46.30H-21 $32.07 $40.80 $49.53H-22 $34.32 $43.66 $53.00H-23 $36.71 $46.71 $56.71H-24 $39.28 $49.98 $60.68
Hourly Pay Scale for Non-Exempt PositionsFY 2012/2013
Effective 7/1/2012
351
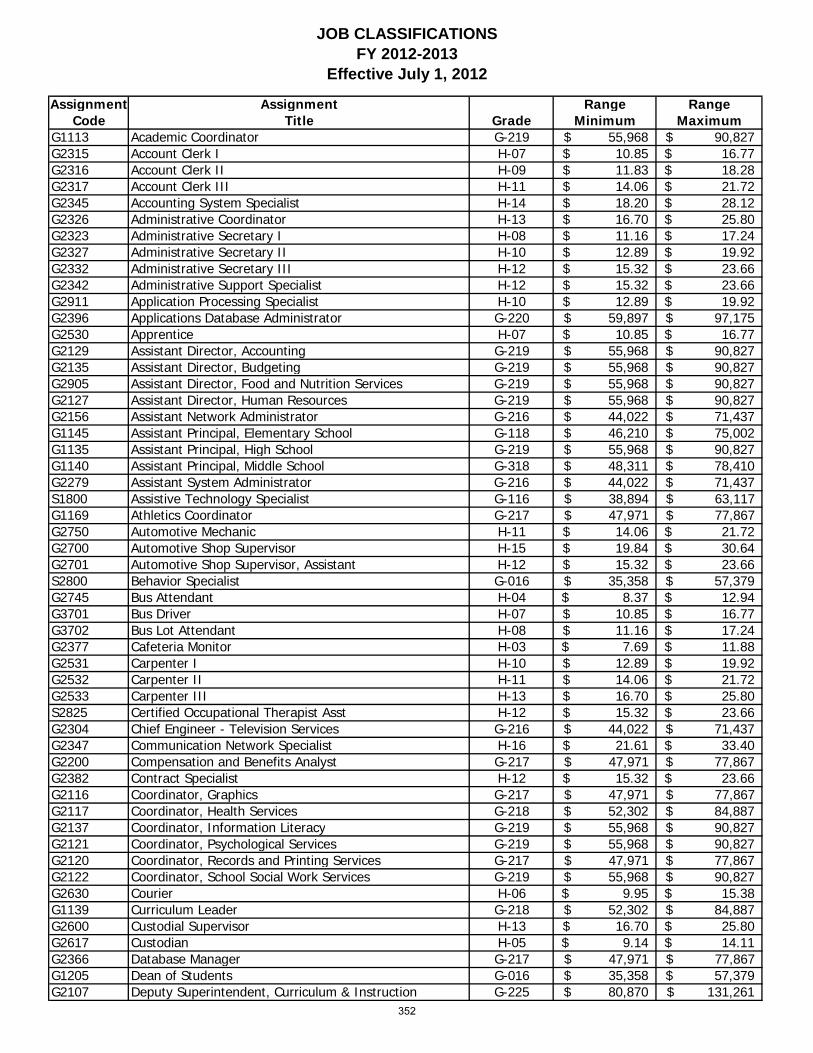
JOB CLASSIFICATIONSFY 2012-2013
Effective July 1, 2012
Assignment Assignment Range RangeCode Title Grade Minimum Maximum
G1113 Academic Coordinator G-219 55,968$ 90,827$ G2315 Account Clerk I H-07 10.85$ 16.77$ G2316 Account Clerk II H-09 11.83$ 18.28$ G2317 Account Clerk III H-11 14.06$ 21.72$ G2345 Accounting System Specialist H-14 18.20$ 28.12$ G2326 Administrative Coordinator H-13 16.70$ 25.80$ G2323 Administrative Secretary I H-08 11.16$ 17.24$ G2327 Administrative Secretary II H-10 12.89$ 19.92$ G2332 Administrative Secretary III H-12 15.32$ 23.66$ G2342 Administrative Support Specialist H-12 15.32$ 23.66$ G2911 Application Processing Specialist H-10 12.89$ 19.92$ G2396 Applications Database Administrator G-220 59,897$ 97,175$ G2530 Apprentice H-07 10.85$ 16.77$ G2129 Assistant Director, Accounting G-219 55,968$ 90,827$ G2135 Assistant Director, Budgeting G-219 55,968$ 90,827$ G2905 Assistant Director, Food and Nutrition Services G-219 55,968$ 90,827$ G2127 Assistant Director, Human Resources G-219 55,968$ 90,827$ G2156 Assistant Network Administrator G-216 44,022$ 71,437$ G1145 Assistant Principal, Elementary School G-118 46,210$ 75,002$ G1135 Assistant Principal, High School G-219 55,968$ 90,827$ G1140 Assistant Principal, Middle School G-318 48,311$ 78,410$ G2279 Assistant System Administrator G-216 44,022$ 71,437$ S1800 Assistive Technology Specialist G-116 38,894$ 63,117$ G1169 Athletics Coordinator G-217 47,971$ 77,867$ G2750 Automotive Mechanic H-11 14.06$ 21.72$ G2700 Automotive Shop Supervisor H-15 19.84$ 30.64$ G2701 Automotive Shop Supervisor, Assistant H-12 15.32$ 23.66$ S2800 Behavior Specialist G-016 35,358$ 57,379$ G2745 Bus Attendant H-04 8.37$ 12.94$ G3701 Bus Driver H-07 10.85$ 16.77$ G3702 Bus Lot Attendant H-08 11.16$ 17.24$ G2377 Cafeteria Monitor H-03 7.69$ 11.88$ G2531 Carpenter I H-10 12.89$ 19.92$ G2532 Carpenter II H-11 14.06$ 21.72$ G2533 Carpenter III H-13 16.70$ 25.80$ S2825 Certified Occupational Therapist Asst H-12 15.32$ 23.66$ G2304 Chief Engineer - Television Services G-216 44,022$ 71,437$ G2347 Communication Network Specialist H-16 21.61$ 33.40$ G2200 Compensation and Benefits Analyst G-217 47,971$ 77,867$ G2382 Contract Specialist H-12 15.32$ 23.66$ G2116 Coordinator, Graphics G-217 47,971$ 77,867$ G2117 Coordinator, Health Services G-218 52,302$ 84,887$ G2137 Coordinator, Information Literacy G-219 55,968$ 90,827$ G2121 Coordinator, Psychological Services G-219 55,968$ 90,827$ G2120 Coordinator, Records and Printing Services G-217 47,971$ 77,867$ G2122 Coordinator, School Social Work Services G-219 55,968$ 90,827$ G2630 Courier H-06 9.95$ 15.38$ G1139 Curriculum Leader G-218 52,302$ 84,887$ G2600 Custodial Supervisor H-13 16.70$ 25.80$ G2617 Custodian H-05 9.14$ 14.11$ G2366 Database Manager G-217 47,971$ 77,867$ G1205 Dean of Students G-016 35,358$ 57,379$ G2107 Deputy Superintendent, Curriculum & Instruction G-225 80,870$ 131,261$
352

JOB CLASSIFICATIONSFY 2012-2013
Effective July 1, 2012
Assignment Assignment Range RangeCode Title Grade Minimum Maximum
G1103 Deputy Superintendent, Facilities & Business Support G-225 80,870$ 131,261$ G1134 Director, Academic Advancement & Enrichment G-220 59,897$ 97,175$ G2446 Director, Alternative Learning G-223 73,355$ 119,055$ G2104 Director, Business and Finance G-224 77,022$ 124,995$ G2927 Director, Community & Legislative Relations G-217 47,971$ 77,867$ G1168 Director, Early Childhood Education G-220 59,897$ 97,175$ G2900 Director, Food and Nutrition Services G-221 64,088$ 103,993$ G1129 Director, Information Systems G-225 80,870$ 131,261$ G1151 Director, Instructional Accountability& Quality G-224 77,022$ 124,995$ G1102 Director, School Counseling G-221 64,088$ 103,993$ G2108 Director, School Operations/Maintenance G-223 73,355$ 119,055$ S1151 Director, Special Education G-224 77,022$ 124,995$ G1154 Director, Student Services G-220 59,897$ 97,175$ G2111 Director, Transportation G-221 64,088$ 103,993$ G2134 Division Director of Testing G-219 55,968$ 90,827$ G3944 Early Reading Intervention Assistant H-09 11.83$ 18.28$ S2815 Educational Interpreter, Lead H-17 23.57$ 36.41$ S2810 Educational Interpreter, Level 0 H-15 19.84$ 30.64$ S2811 Educational Interpreter, Level 1 H-15 19.84$ 30.64$ S2812 Educational Interpreter, Level 2 H-15 19.84$ 30.64$ S2816 Educational Interpreter, Level 3 H-16 21.61$ 33.40$ S2817 Educational Interpreter, Level 4 H-16 21.61$ 33.40$ S2818 Educational Interpreter, Nationally Certified H-16 21.61$ 33.40$ G2524 Electrician I H-10 12.89$ 19.92$ G2525 Electrician II H-11 14.06$ 21.72$ G2526 Electrician III H-13 16.70$ 25.80$ G2502 Electrician, Lead H-14 18.20$ 28.12$ G2303 Engineer - Television Services G-216 40,375$ 65,539$ G2603 Environmental Compliance & Safety Coordinator G-214 37,071$ 60,129$ G2325 Executive Assistant H-13 16.70$ 25.80$ G2119 Executive Director, Human Resources G-224 77,022$ 124,995$ G2132 Executive Director, Public Relations and Marketing G-224 77,022$ 124,995$ G1173 Executive Director, Research, Planning and Evaluation G-224 77,022$ 124,995$ G1137 Executive Director, School Leadership (Elem & Comp Prog G-224 77,022$ 124,995$ G1153 Executive Director, School Leadership (Elem & Pre-school) G-224 77,022$ 124,995$ G1152 Executive Director, School Leadership (Secondary) G-224 77,022$ 124,995$ G2320 Executive Secretary H-12 15.32$ 23.66$ G3942 Faith Based Outreach Specialist G-213 33,988$ 55,170$ G2445 Family Engagement Specialist G-014 29,775$ 48,297$ G2407 Family Service Worker G-215 40,375$ 65,539$ G2958 Financial Services Coordinator G-214 37,071$ 60,129$ G2353 Financial Services Specialist G-215 40,375$ 65,539$ G2313 Fixed Assets Specialist H-11 14.06$ 21.72$ G2622 Floor Technician H-05 9.14$ 14.11$ G2624 Floor Technician, Lead H-09 11.83$ 18.28$ G2916 Food Service Manager - Elementary H-09 11.83$ 18.28$ G2917 Food Service Manager - Secondary H-11 14.06$ 21.72$ G2920 Food Service Manager (In Training) H-07 10.85$ 16.77$ G2947 Food Service Worker I H-03 7.69$ 11.88$ G2948 Food Service Worker II H-04 8.37$ 12.94$ G2949 Food Service Worker III H-06 9.95$ 15.38$ G2070 GEAR UP College/Career Coach G-115 35,672$ 57,905$ G1118 GEAR UP/AVID/MYP Coordinator TCH10 38,300$ 62,241$
353
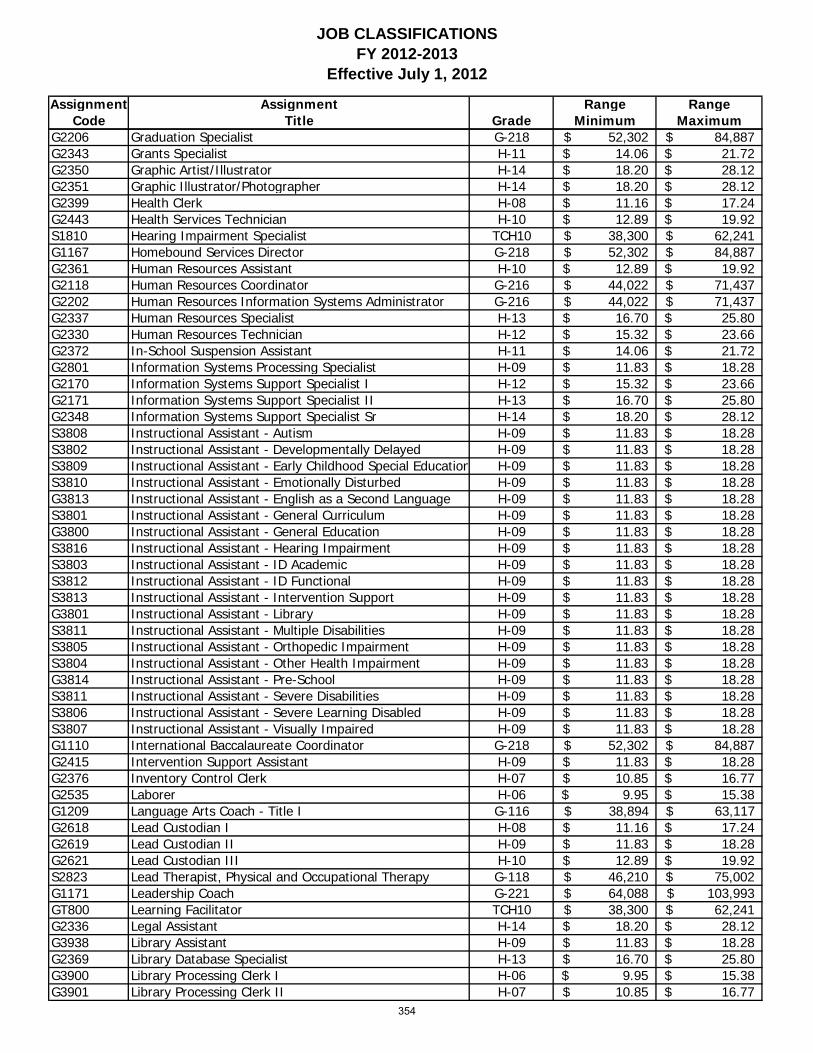
JOB CLASSIFICATIONSFY 2012-2013
Effective July 1, 2012
Assignment Assignment Range RangeCode Title Grade Minimum Maximum
G2206 Graduation Specialist G-218 52,302$ 84,887$ G2343 Grants Specialist H-11 14.06$ 21.72$ G2350 Graphic Artist/Illustrator H-14 18.20$ 28.12$ G2351 Graphic Illustrator/Photographer H-14 18.20$ 28.12$ G2399 Health Clerk H-08 11.16$ 17.24$ G2443 Health Services Technician H-10 12.89$ 19.92$ S1810 Hearing Impairment Specialist TCH10 38,300$ 62,241$ G1167 Homebound Services Director G-218 52,302$ 84,887$ G2361 Human Resources Assistant H-10 12.89$ 19.92$ G2118 Human Resources Coordinator G-216 44,022$ 71,437$ G2202 Human Resources Information Systems Administrator G-216 44,022$ 71,437$ G2337 Human Resources Specialist H-13 16.70$ 25.80$ G2330 Human Resources Technician H-12 15.32$ 23.66$ G2372 In-School Suspension Assistant H-11 14.06$ 21.72$ G2801 Information Systems Processing Specialist H-09 11.83$ 18.28$ G2170 Information Systems Support Specialist I H-12 15.32$ 23.66$ G2171 Information Systems Support Specialist II H-13 16.70$ 25.80$ G2348 Information Systems Support Specialist Sr H-14 18.20$ 28.12$ S3808 Instructional Assistant - Autism H-09 11.83$ 18.28$ S3802 Instructional Assistant - Developmentally Delayed H-09 11.83$ 18.28$ S3809 Instructional Assistant - Early Childhood Special Education H-09 11.83$ 18.28$ S3810 Instructional Assistant - Emotionally Disturbed H-09 11.83$ 18.28$ G3813 Instructional Assistant - English as a Second Language H-09 11.83$ 18.28$ S3801 Instructional Assistant - General Curriculum H-09 11.83$ 18.28$ G3800 Instructional Assistant - General Education H-09 11.83$ 18.28$ S3816 Instructional Assistant - Hearing Impairment H-09 11.83$ 18.28$ S3803 Instructional Assistant - ID Academic H-09 11.83$ 18.28$ S3812 Instructional Assistant - ID Functional H-09 11.83$ 18.28$ S3813 Instructional Assistant - Intervention Support H-09 11.83$ 18.28$ G3801 Instructional Assistant - Library H-09 11.83$ 18.28$ S3811 Instructional Assistant - Multiple Disabilities H-09 11.83$ 18.28$ S3805 Instructional Assistant - Orthopedic Impairment H-09 11.83$ 18.28$ S3804 Instructional Assistant - Other Health Impairment H-09 11.83$ 18.28$ G3814 Instructional Assistant - Pre-School H-09 11.83$ 18.28$ S3811 Instructional Assistant - Severe Disabilities H-09 11.83$ 18.28$ S3806 Instructional Assistant - Severe Learning Disabled H-09 11.83$ 18.28$ S3807 Instructional Assistant - Visually Impaired H-09 11.83$ 18.28$ G1110 International Baccalaureate Coordinator G-218 52,302$ 84,887$ G2415 Intervention Support Assistant H-09 11.83$ 18.28$ G2376 Inventory Control Clerk H-07 10.85$ 16.77$ G2535 Laborer H-06 9.95$ 15.38$ G1209 Language Arts Coach - Title I G-116 38,894$ 63,117$ G2618 Lead Custodian I H-08 11.16$ 17.24$ G2619 Lead Custodian II H-09 11.83$ 18.28$ G2621 Lead Custodian III H-10 12.89$ 19.92$ S2823 Lead Therapist, Physical and Occupational Therapy G-118 46,210$ 75,002$ G1171 Leadership Coach G-221 64,088$ 103,993$ GT800 Learning Facilitator TCH10 38,300$ 62,241$ G2336 Legal Assistant H-14 18.20$ 28.12$ G3938 Library Assistant H-09 11.83$ 18.28$ G2369 Library Database Specialist H-13 16.70$ 25.80$ G3900 Library Processing Clerk I H-06 9.95$ 15.38$ G3901 Library Processing Clerk II H-07 10.85$ 16.77$
354
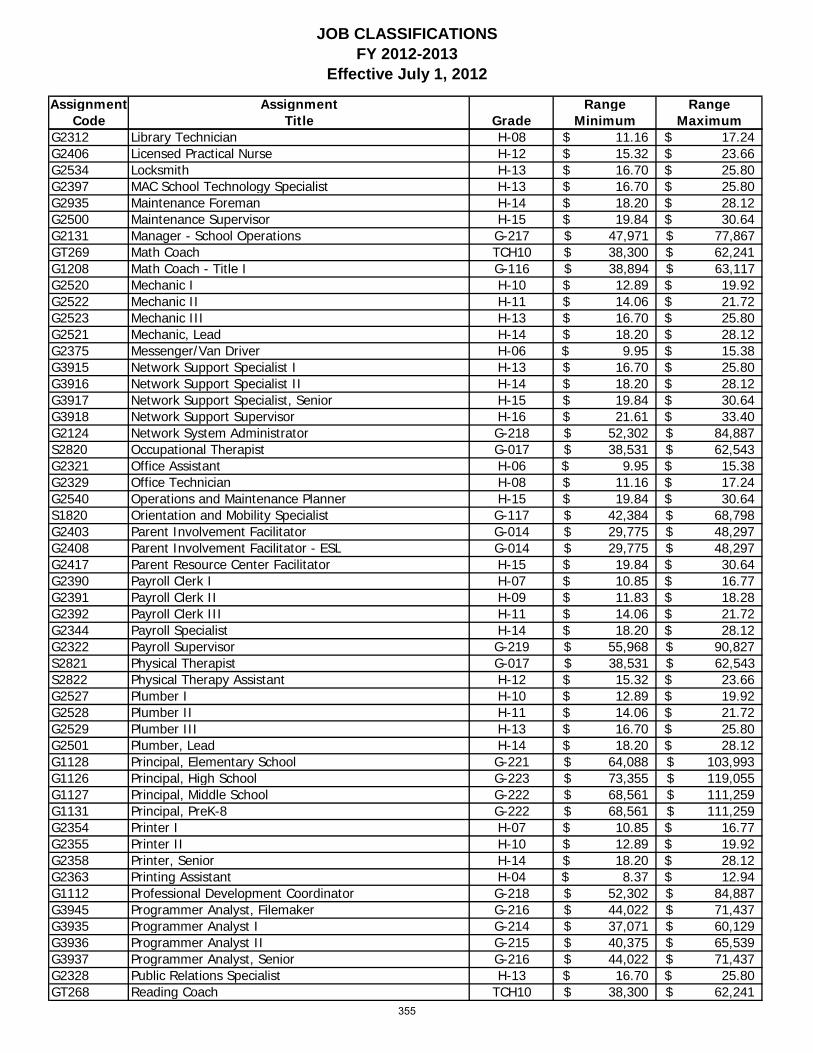
JOB CLASSIFICATIONSFY 2012-2013
Effective July 1, 2012
Assignment Assignment Range RangeCode Title Grade Minimum Maximum
G2312 Library Technician H-08 11.16$ 17.24$ G2406 Licensed Practical Nurse H-12 15.32$ 23.66$ G2534 Locksmith H-13 16.70$ 25.80$ G2397 MAC School Technology Specialist H-13 16.70$ 25.80$ G2935 Maintenance Foreman H-14 18.20$ 28.12$ G2500 Maintenance Supervisor H-15 19.84$ 30.64$ G2131 Manager - School Operations G-217 47,971$ 77,867$ GT269 Math Coach TCH10 38,300$ 62,241$ G1208 Math Coach - Title I G-116 38,894$ 63,117$ G2520 Mechanic I H-10 12.89$ 19.92$ G2522 Mechanic II H-11 14.06$ 21.72$ G2523 Mechanic III H-13 16.70$ 25.80$ G2521 Mechanic, Lead H-14 18.20$ 28.12$ G2375 Messenger/Van Driver H-06 9.95$ 15.38$ G3915 Network Support Specialist I H-13 16.70$ 25.80$ G3916 Network Support Specialist II H-14 18.20$ 28.12$ G3917 Network Support Specialist, Senior H-15 19.84$ 30.64$ G3918 Network Support Supervisor H-16 21.61$ 33.40$ G2124 Network System Administrator G-218 52,302$ 84,887$ S2820 Occupational Therapist G-017 38,531$ 62,543$ G2321 Office Assistant H-06 9.95$ 15.38$ G2329 Office Technician H-08 11.16$ 17.24$ G2540 Operations and Maintenance Planner H-15 19.84$ 30.64$ S1820 Orientation and Mobility Specialist G-117 42,384$ 68,798$ G2403 Parent Involvement Facilitator G-014 29,775$ 48,297$ G2408 Parent Involvement Facilitator - ESL G-014 29,775$ 48,297$ G2417 Parent Resource Center Facilitator H-15 19.84$ 30.64$ G2390 Payroll Clerk I H-07 10.85$ 16.77$ G2391 Payroll Clerk II H-09 11.83$ 18.28$ G2392 Payroll Clerk III H-11 14.06$ 21.72$ G2344 Payroll Specialist H-14 18.20$ 28.12$ G2322 Payroll Supervisor G-219 55,968$ 90,827$ S2821 Physical Therapist G-017 38,531$ 62,543$ S2822 Physical Therapy Assistant H-12 15.32$ 23.66$ G2527 Plumber I H-10 12.89$ 19.92$ G2528 Plumber II H-11 14.06$ 21.72$ G2529 Plumber III H-13 16.70$ 25.80$ G2501 Plumber, Lead H-14 18.20$ 28.12$ G1128 Principal, Elementary School G-221 64,088$ 103,993$ G1126 Principal, High School G-223 73,355$ 119,055$ G1127 Principal, Middle School G-222 68,561$ 111,259$ G1131 Principal, PreK-8 G-222 68,561$ 111,259$ G2354 Printer I H-07 10.85$ 16.77$ G2355 Printer II H-10 12.89$ 19.92$ G2358 Printer, Senior H-14 18.20$ 28.12$ G2363 Printing Assistant H-04 8.37$ 12.94$ G1112 Professional Development Coordinator G-218 52,302$ 84,887$ G3945 Programmer Analyst, Filemaker G-216 44,022$ 71,437$ G3935 Programmer Analyst I G-214 37,071$ 60,129$ G3936 Programmer Analyst II G-215 40,375$ 65,539$ G3937 Programmer Analyst, Senior G-216 44,022$ 71,437$ G2328 Public Relations Specialist H-13 16.70$ 25.80$ GT268 Reading Coach TCH10 38,300$ 62,241$
355
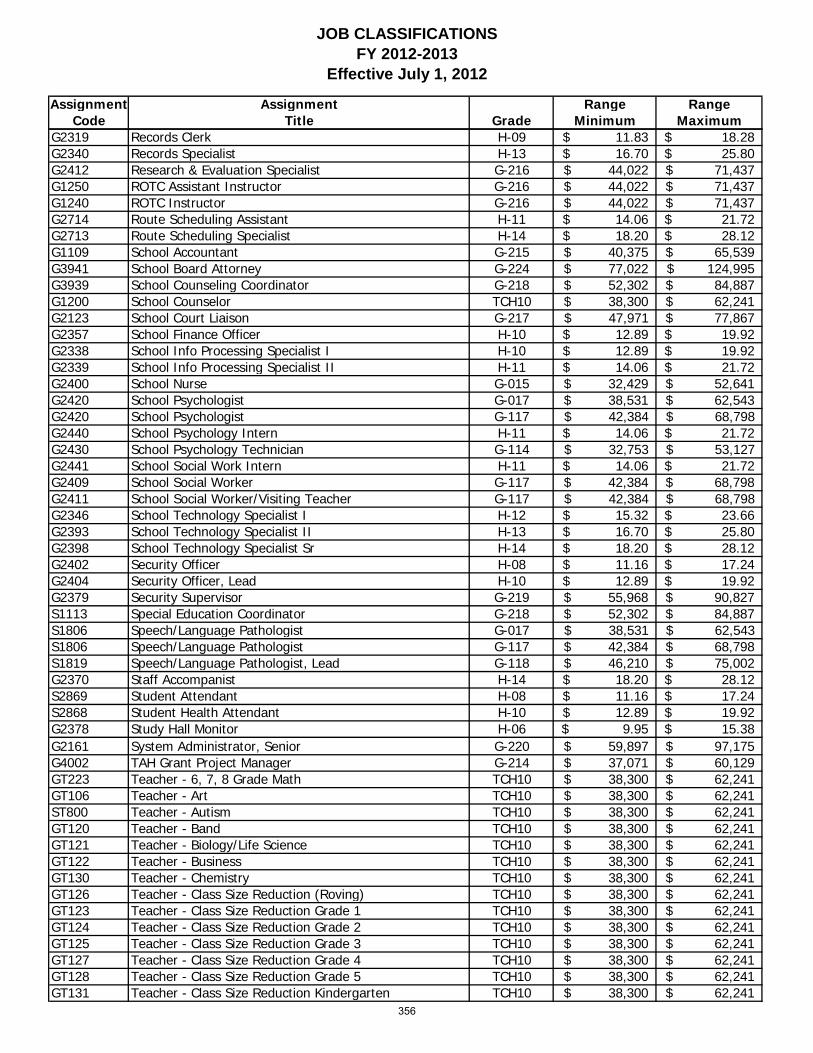
JOB CLASSIFICATIONSFY 2012-2013
Effective July 1, 2012
Assignment Assignment Range RangeCode Title Grade Minimum Maximum
G2319 Records Clerk H-09 11.83$ 18.28$ G2340 Records Specialist H-13 16.70$ 25.80$ G2412 Research & Evaluation Specialist G-216 44,022$ 71,437$ G1250 ROTC Assistant Instructor G-216 44,022$ 71,437$ G1240 ROTC Instructor G-216 44,022$ 71,437$ G2714 Route Scheduling Assistant H-11 14.06$ 21.72$ G2713 Route Scheduling Specialist H-14 18.20$ 28.12$ G1109 School Accountant G-215 40,375$ 65,539$ G3941 School Board Attorney G-224 77,022$ 124,995$ G3939 School Counseling Coordinator G-218 52,302$ 84,887$ G1200 School Counselor TCH10 38,300$ 62,241$ G2123 School Court Liaison G-217 47,971$ 77,867$ G2357 School Finance Officer H-10 12.89$ 19.92$ G2338 School Info Processing Specialist I H-10 12.89$ 19.92$ G2339 School Info Processing Specialist II H-11 14.06$ 21.72$ G2400 School Nurse G-015 32,429$ 52,641$ G2420 School Psychologist G-017 38,531$ 62,543$ G2420 School Psychologist G-117 42,384$ 68,798$ G2440 School Psychology Intern H-11 14.06$ 21.72$ G2430 School Psychology Technician G-114 32,753$ 53,127$ G2441 School Social Work Intern H-11 14.06$ 21.72$ G2409 School Social Worker G-117 42,384$ 68,798$ G2411 School Social Worker/Visiting Teacher G-117 42,384$ 68,798$ G2346 School Technology Specialist I H-12 15.32$ 23.66$ G2393 School Technology Specialist II H-13 16.70$ 25.80$ G2398 School Technology Specialist Sr H-14 18.20$ 28.12$ G2402 Security Officer H-08 11.16$ 17.24$ G2404 Security Officer, Lead H-10 12.89$ 19.92$ G2379 Security Supervisor G-219 55,968$ 90,827$ S1113 Special Education Coordinator G-218 52,302$ 84,887$ S1806 Speech/Language Pathologist G-017 38,531$ 62,543$ S1806 Speech/Language Pathologist G-117 42,384$ 68,798$ S1819 Speech/Language Pathologist, Lead G-118 46,210$ 75,002$ G2370 Staff Accompanist H-14 18.20$ 28.12$ S2869 Student Attendant H-08 11.16$ 17.24$ S2868 Student Health Attendant H-10 12.89$ 19.92$ G2378 Study Hall Monitor H-06 9.95$ 15.38$ G2161 System Administrator, Senior G-220 59,897$ 97,175$ G4002 TAH Grant Project Manager G-214 37,071$ 60,129$ GT223 Teacher - 6, 7, 8 Grade Math TCH10 38,300$ 62,241$ GT106 Teacher - Art TCH10 38,300$ 62,241$ ST800 Teacher - Autism TCH10 38,300$ 62,241$ GT120 Teacher - Band TCH10 38,300$ 62,241$ GT121 Teacher - Biology/Life Science TCH10 38,300$ 62,241$ GT122 Teacher - Business TCH10 38,300$ 62,241$ GT130 Teacher - Chemistry TCH10 38,300$ 62,241$ GT126 Teacher - Class Size Reduction (Roving) TCH10 38,300$ 62,241$ GT123 Teacher - Class Size Reduction Grade 1 TCH10 38,300$ 62,241$ GT124 Teacher - Class Size Reduction Grade 2 TCH10 38,300$ 62,241$ GT125 Teacher - Class Size Reduction Grade 3 TCH10 38,300$ 62,241$ GT127 Teacher - Class Size Reduction Grade 4 TCH10 38,300$ 62,241$ GT128 Teacher - Class Size Reduction Grade 5 TCH10 38,300$ 62,241$ GT131 Teacher - Class Size Reduction Kindergarten TCH10 38,300$ 62,241$
356
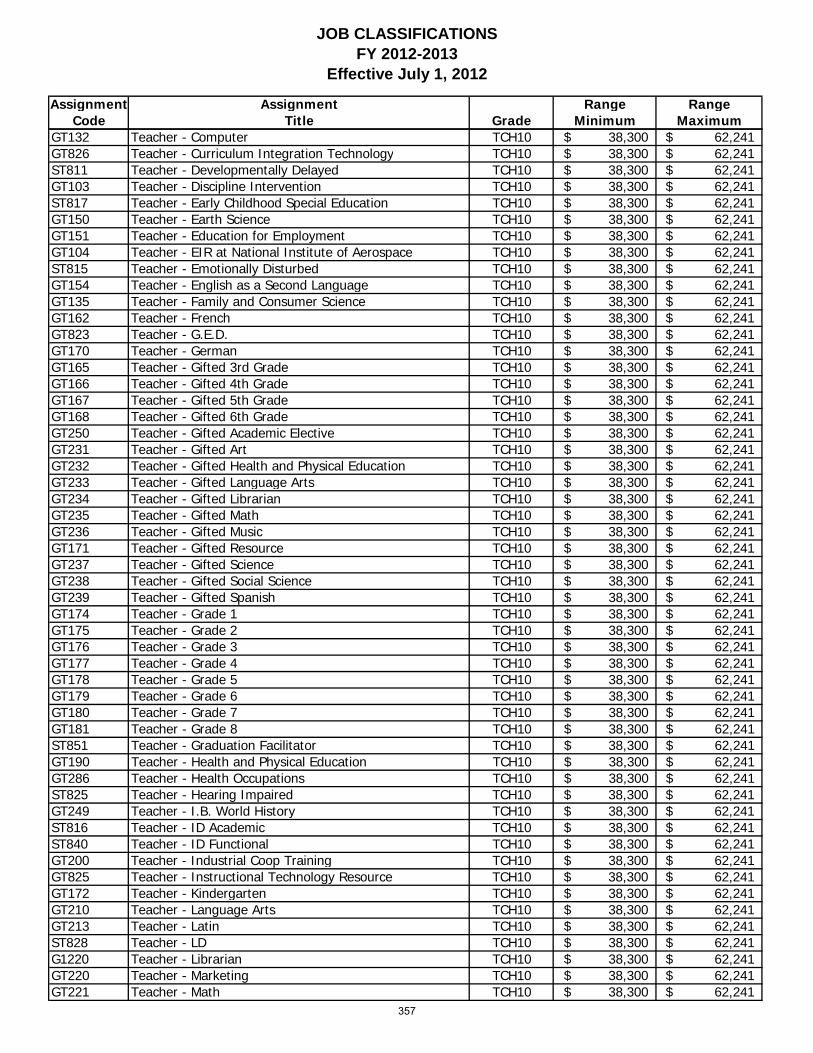
JOB CLASSIFICATIONSFY 2012-2013
Effective July 1, 2012
Assignment Assignment Range RangeCode Title Grade Minimum Maximum
GT132 Teacher - Computer TCH10 38,300$ 62,241$ GT826 Teacher - Curriculum Integration Technology TCH10 38,300$ 62,241$ ST811 Teacher - Developmentally Delayed TCH10 38,300$ 62,241$ GT103 Teacher - Discipline Intervention TCH10 38,300$ 62,241$ ST817 Teacher - Early Childhood Special Education TCH10 38,300$ 62,241$ GT150 Teacher - Earth Science TCH10 38,300$ 62,241$ GT151 Teacher - Education for Employment TCH10 38,300$ 62,241$ GT104 Teacher - EIR at National Institute of Aerospace TCH10 38,300$ 62,241$ ST815 Teacher - Emotionally Disturbed TCH10 38,300$ 62,241$ GT154 Teacher - English as a Second Language TCH10 38,300$ 62,241$ GT135 Teacher - Family and Consumer Science TCH10 38,300$ 62,241$ GT162 Teacher - French TCH10 38,300$ 62,241$ GT823 Teacher - G.E.D. TCH10 38,300$ 62,241$ GT170 Teacher - German TCH10 38,300$ 62,241$ GT165 Teacher - Gifted 3rd Grade TCH10 38,300$ 62,241$ GT166 Teacher - Gifted 4th Grade TCH10 38,300$ 62,241$ GT167 Teacher - Gifted 5th Grade TCH10 38,300$ 62,241$ GT168 Teacher - Gifted 6th Grade TCH10 38,300$ 62,241$ GT250 Teacher - Gifted Academic Elective TCH10 38,300$ 62,241$ GT231 Teacher - Gifted Art TCH10 38,300$ 62,241$ GT232 Teacher - Gifted Health and Physical Education TCH10 38,300$ 62,241$ GT233 Teacher - Gifted Language Arts TCH10 38,300$ 62,241$ GT234 Teacher - Gifted Librarian TCH10 38,300$ 62,241$ GT235 Teacher - Gifted Math TCH10 38,300$ 62,241$ GT236 Teacher - Gifted Music TCH10 38,300$ 62,241$ GT171 Teacher - Gifted Resource TCH10 38,300$ 62,241$ GT237 Teacher - Gifted Science TCH10 38,300$ 62,241$ GT238 Teacher - Gifted Social Science TCH10 38,300$ 62,241$ GT239 Teacher - Gifted Spanish TCH10 38,300$ 62,241$ GT174 Teacher - Grade 1 TCH10 38,300$ 62,241$ GT175 Teacher - Grade 2 TCH10 38,300$ 62,241$ GT176 Teacher - Grade 3 TCH10 38,300$ 62,241$ GT177 Teacher - Grade 4 TCH10 38,300$ 62,241$ GT178 Teacher - Grade 5 TCH10 38,300$ 62,241$ GT179 Teacher - Grade 6 TCH10 38,300$ 62,241$ GT180 Teacher - Grade 7 TCH10 38,300$ 62,241$ GT181 Teacher - Grade 8 TCH10 38,300$ 62,241$ ST851 Teacher - Graduation Facilitator TCH10 38,300$ 62,241$ GT190 Teacher - Health and Physical Education TCH10 38,300$ 62,241$ GT286 Teacher - Health Occupations TCH10 38,300$ 62,241$ ST825 Teacher - Hearing Impaired TCH10 38,300$ 62,241$ GT249 Teacher - I.B. World History TCH10 38,300$ 62,241$ ST816 Teacher - ID Academic TCH10 38,300$ 62,241$ ST840 Teacher - ID Functional TCH10 38,300$ 62,241$ GT200 Teacher - Industrial Coop Training TCH10 38,300$ 62,241$ GT825 Teacher - Instructional Technology Resource TCH10 38,300$ 62,241$ GT172 Teacher - Kindergarten TCH10 38,300$ 62,241$ GT210 Teacher - Language Arts TCH10 38,300$ 62,241$ GT213 Teacher - Latin TCH10 38,300$ 62,241$ ST828 Teacher - LD TCH10 38,300$ 62,241$ G1220 Teacher - Librarian TCH10 38,300$ 62,241$ GT220 Teacher - Marketing TCH10 38,300$ 62,241$ GT221 Teacher - Math TCH10 38,300$ 62,241$
357
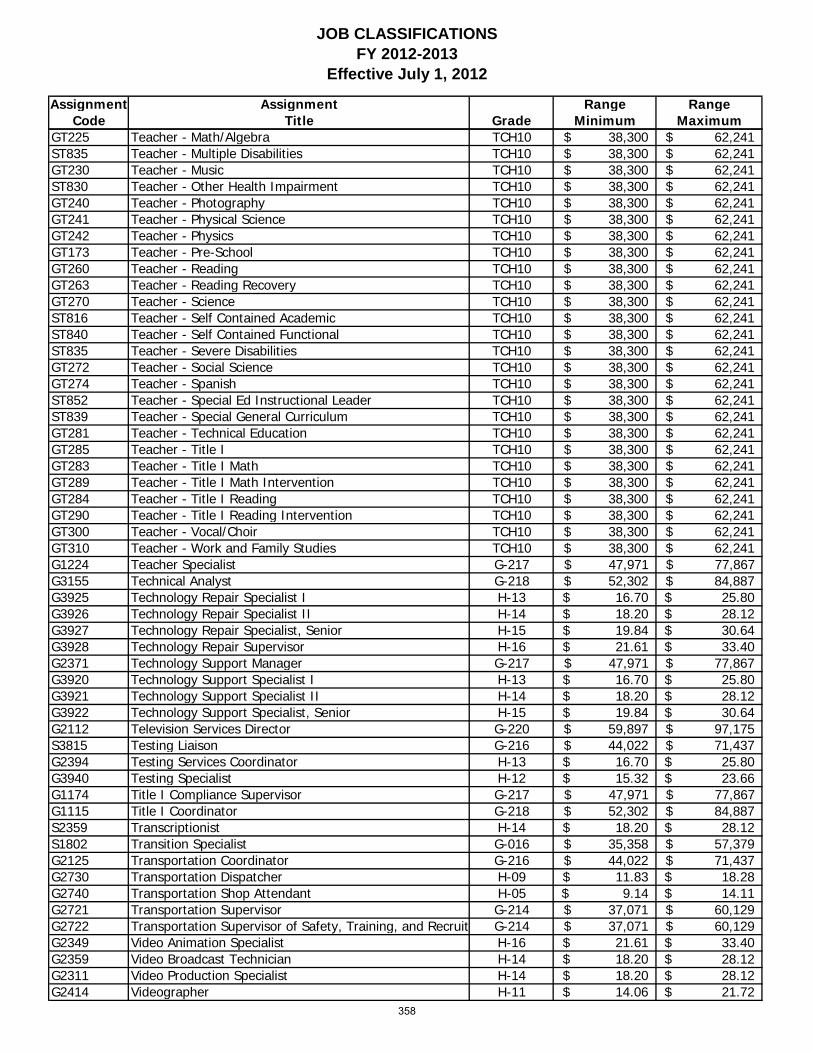
JOB CLASSIFICATIONSFY 2012-2013
Effective July 1, 2012
Assignment Assignment Range RangeCode Title Grade Minimum Maximum
GT225 Teacher - Math/Algebra TCH10 38,300$ 62,241$ ST835 Teacher - Multiple Disabilities TCH10 38,300$ 62,241$ GT230 Teacher - Music TCH10 38,300$ 62,241$ ST830 Teacher - Other Health Impairment TCH10 38,300$ 62,241$ GT240 Teacher - Photography TCH10 38,300$ 62,241$ GT241 Teacher - Physical Science TCH10 38,300$ 62,241$ GT242 Teacher - Physics TCH10 38,300$ 62,241$ GT173 Teacher - Pre-School TCH10 38,300$ 62,241$ GT260 Teacher - Reading TCH10 38,300$ 62,241$ GT263 Teacher - Reading Recovery TCH10 38,300$ 62,241$ GT270 Teacher - Science TCH10 38,300$ 62,241$ ST816 Teacher - Self Contained Academic TCH10 38,300$ 62,241$ ST840 Teacher - Self Contained Functional TCH10 38,300$ 62,241$ ST835 Teacher - Severe Disabilities TCH10 38,300$ 62,241$ GT272 Teacher - Social Science TCH10 38,300$ 62,241$ GT274 Teacher - Spanish TCH10 38,300$ 62,241$ ST852 Teacher - Special Ed Instructional Leader TCH10 38,300$ 62,241$ ST839 Teacher - Special General Curriculum TCH10 38,300$ 62,241$ GT281 Teacher - Technical Education TCH10 38,300$ 62,241$ GT285 Teacher - Title I TCH10 38,300$ 62,241$ GT283 Teacher - Title I Math TCH10 38,300$ 62,241$ GT289 Teacher - Title I Math Intervention TCH10 38,300$ 62,241$ GT284 Teacher - Title I Reading TCH10 38,300$ 62,241$ GT290 Teacher - Title I Reading Intervention TCH10 38,300$ 62,241$ GT300 Teacher - Vocal/Choir TCH10 38,300$ 62,241$ GT310 Teacher - Work and Family Studies TCH10 38,300$ 62,241$ G1224 Teacher Specialist G-217 47,971$ 77,867$ G3155 Technical Analyst G-218 52,302$ 84,887$ G3925 Technology Repair Specialist I H-13 16.70$ 25.80$ G3926 Technology Repair Specialist II H-14 18.20$ 28.12$ G3927 Technology Repair Specialist, Senior H-15 19.84$ 30.64$ G3928 Technology Repair Supervisor H-16 21.61$ 33.40$ G2371 Technology Support Manager G-217 47,971$ 77,867$ G3920 Technology Support Specialist I H-13 16.70$ 25.80$ G3921 Technology Support Specialist II H-14 18.20$ 28.12$ G3922 Technology Support Specialist, Senior H-15 19.84$ 30.64$ G2112 Television Services Director G-220 59,897$ 97,175$ S3815 Testing Liaison G-216 44,022$ 71,437$ G2394 Testing Services Coordinator H-13 16.70$ 25.80$ G3940 Testing Specialist H-12 15.32$ 23.66$ G1174 Title I Compliance Supervisor G-217 47,971$ 77,867$ G1115 Title I Coordinator G-218 52,302$ 84,887$ S2359 Transcriptionist H-14 18.20$ 28.12$ S1802 Transition Specialist G-016 35,358$ 57,379$ G2125 Transportation Coordinator G-216 44,022$ 71,437$ G2730 Transportation Dispatcher H-09 11.83$ 18.28$ G2740 Transportation Shop Attendant H-05 9.14$ 14.11$ G2721 Transportation Supervisor G-214 37,071$ 60,129$ G2722 Transportation Supervisor of Safety, Training, and Recruit G-214 37,071$ 60,129$ G2349 Video Animation Specialist H-16 21.61$ 33.40$ G2359 Video Broadcast Technician H-14 18.20$ 28.12$ G2311 Video Production Specialist H-14 18.20$ 28.12$ G2414 Videographer H-11 14.06$ 21.72$
358
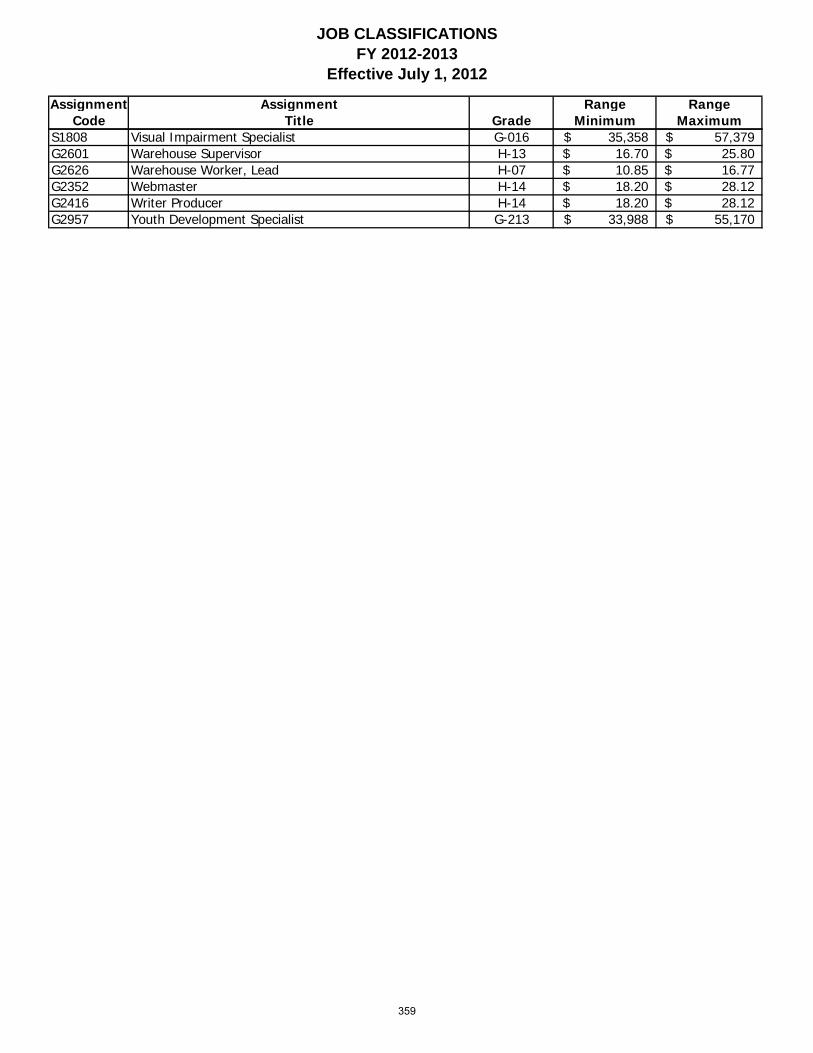
JOB CLASSIFICATIONSFY 2012-2013
Effective July 1, 2012
Assignment Assignment Range RangeCode Title Grade Minimum Maximum
S1808 Visual Impairment Specialist G-016 35,358$ 57,379$ G2601 Warehouse Supervisor H-13 16.70$ 25.80$ G2626 Warehouse Worker, Lead H-07 10.85$ 16.77$ G2352 Webmaster H-14 18.20$ 28.12$ G2416 Writer Producer H-14 18.20$ 28.12$ G2957 Youth Development Specialist G-213 33,988$ 55,170$
359
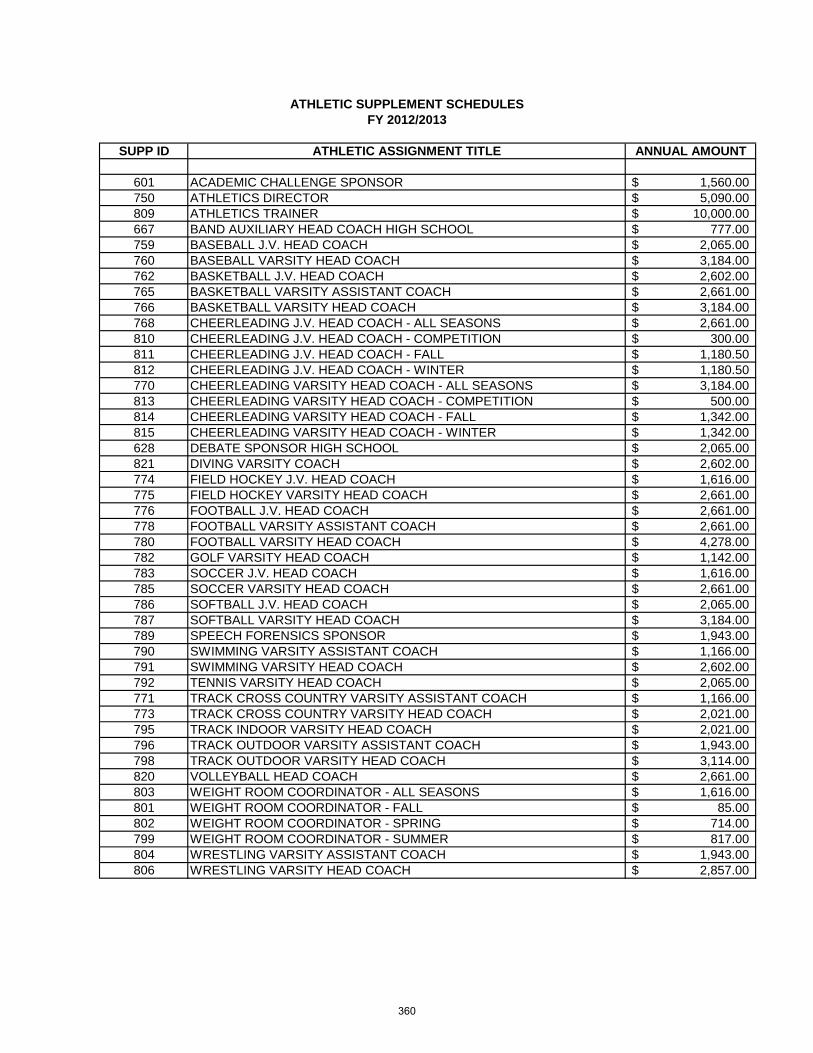
ATHLETIC SUPPLEMENT SCHEDULESFY 2012/2013
SUPP ID ATHLETIC ASSIGNMENT TITLE ANNUAL AMOUNT
601 ACADEMIC CHALLENGE SPONSOR 1,560.00$ 750 ATHLETICS DIRECTOR 5,090.00$ 809 ATHLETICS TRAINER 10,000.00$ 667 BAND AUXILIARY HEAD COACH HIGH SCHOOL 777.00$ 759 BASEBALL J.V. HEAD COACH 2,065.00$ 760 BASEBALL VARSITY HEAD COACH 3,184.00$ 762 BASKETBALL J.V. HEAD COACH 2,602.00$ 765 BASKETBALL VARSITY ASSISTANT COACH 2,661.00$ 766 BASKETBALL VARSITY HEAD COACH 3,184.00$ 768 CHEERLEADING J.V. HEAD COACH - ALL SEASONS 2,661.00$ 810 CHEERLEADING J.V. HEAD COACH - COMPETITION 300.00$ 811 CHEERLEADING J.V. HEAD COACH - FALL 1,180.50$ 812 CHEERLEADING J.V. HEAD COACH - WINTER 1,180.50$ 770 CHEERLEADING VARSITY HEAD COACH - ALL SEASONS 3,184.00$ 813 CHEERLEADING VARSITY HEAD COACH - COMPETITION 500.00$ 814 CHEERLEADING VARSITY HEAD COACH - FALL 1,342.00$ 815 CHEERLEADING VARSITY HEAD COACH - WINTER 1,342.00$ 628 DEBATE SPONSOR HIGH SCHOOL 2,065.00$ 821 DIVING VARSITY COACH 2,602.00$ 774 FIELD HOCKEY J.V. HEAD COACH 1,616.00$ 775 FIELD HOCKEY VARSITY HEAD COACH 2,661.00$ 776 FOOTBALL J.V. HEAD COACH 2,661.00$ 778 FOOTBALL VARSITY ASSISTANT COACH 2,661.00$ 780 FOOTBALL VARSITY HEAD COACH 4,278.00$ 782 GOLF VARSITY HEAD COACH 1,142.00$ 783 SOCCER J.V. HEAD COACH 1,616.00$ 785 SOCCER VARSITY HEAD COACH 2,661.00$ 786 SOFTBALL J.V. HEAD COACH 2,065.00$ 787 SOFTBALL VARSITY HEAD COACH 3,184.00$ 789 SPEECH FORENSICS SPONSOR 1,943.00$ 790 SWIMMING VARSITY ASSISTANT COACH 1,166.00$ 791 SWIMMING VARSITY HEAD COACH 2,602.00$ 792 TENNIS VARSITY HEAD COACH 2,065.00$ 771 TRACK CROSS COUNTRY VARSITY ASSISTANT COACH 1,166.00$ 773 TRACK CROSS COUNTRY VARSITY HEAD COACH 2,021.00$ 795 TRACK INDOOR VARSITY HEAD COACH 2,021.00$ 796 TRACK OUTDOOR VARSITY ASSISTANT COACH 1,943.00$ 798 TRACK OUTDOOR VARSITY HEAD COACH 3,114.00$ 820 VOLLEYBALL HEAD COACH 2,661.00$ 803 WEIGHT ROOM COORDINATOR - ALL SEASONS 1,616.00$ 801 WEIGHT ROOM COORDINATOR - FALL 85.00$ 802 WEIGHT ROOM COORDINATOR - SPRING 714.00$ 799 WEIGHT ROOM COORDINATOR - SUMMER 817.00$ 804 WRESTLING VARSITY ASSISTANT COACH 1,943.00$ 806 WRESTLING VARSITY HEAD COACH 2,857.00$
360
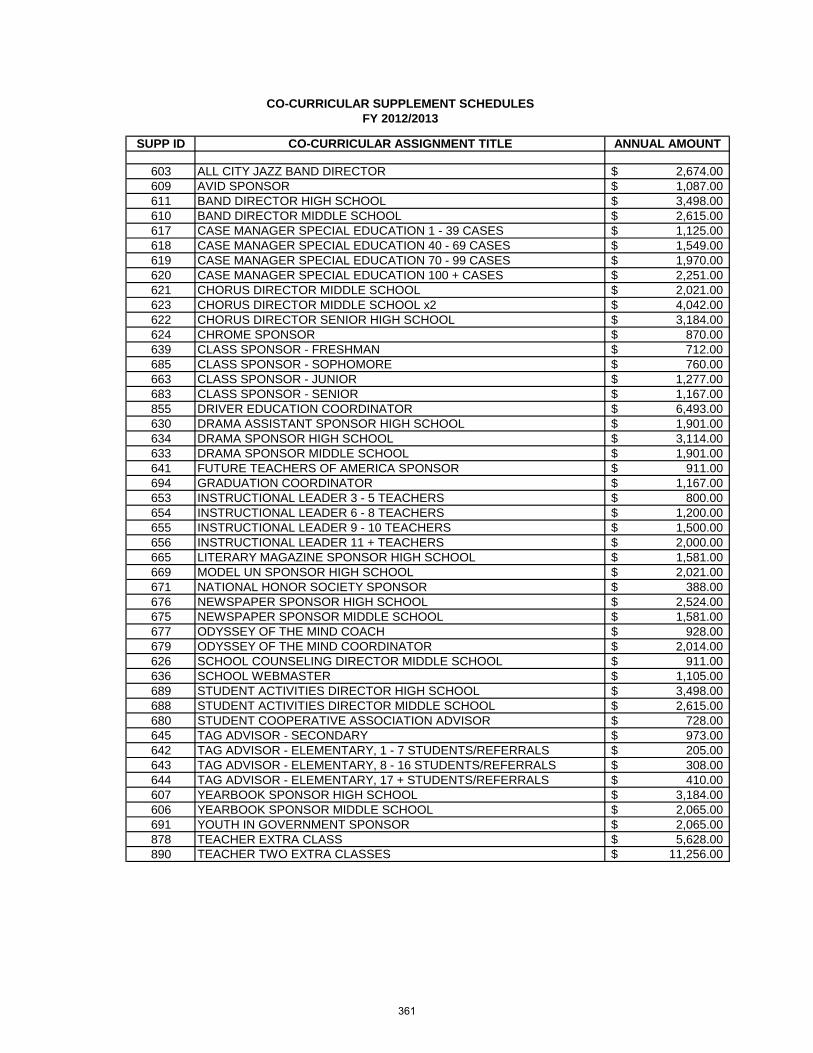
CO-CURRICULAR SUPPLEMENT SCHEDULESFY 2012/2013
SUPP ID CO-CURRICULAR ASSIGNMENT TITLE ANNUAL AMOUNT
603 ALL CITY JAZZ BAND DIRECTOR 2,674.00$ 609 AVID SPONSOR 1,087.00$ 611 BAND DIRECTOR HIGH SCHOOL 3,498.00$ 610 BAND DIRECTOR MIDDLE SCHOOL 2,615.00$ 617 CASE MANAGER SPECIAL EDUCATION 1 - 39 CASES 1,125.00$ 618 CASE MANAGER SPECIAL EDUCATION 40 - 69 CASES 1,549.00$ 619 CASE MANAGER SPECIAL EDUCATION 70 - 99 CASES 1,970.00$ 620 CASE MANAGER SPECIAL EDUCATION 100 + CASES 2,251.00$ 621 CHORUS DIRECTOR MIDDLE SCHOOL 2,021.00$ 623 CHORUS DIRECTOR MIDDLE SCHOOL x2 4,042.00$ 622 CHORUS DIRECTOR SENIOR HIGH SCHOOL 3,184.00$ 624 CHROME SPONSOR 870.00$ 639 CLASS SPONSOR - FRESHMAN 712.00$ 685 CLASS SPONSOR - SOPHOMORE 760.00$ 663 CLASS SPONSOR - JUNIOR 1,277.00$ 683 CLASS SPONSOR - SENIOR 1,167.00$ 855 DRIVER EDUCATION COORDINATOR 6,493.00$ 630 DRAMA ASSISTANT SPONSOR HIGH SCHOOL 1,901.00$ 634 DRAMA SPONSOR HIGH SCHOOL 3,114.00$ 633 DRAMA SPONSOR MIDDLE SCHOOL 1,901.00$ 641 FUTURE TEACHERS OF AMERICA SPONSOR 911.00$ 694 GRADUATION COORDINATOR 1,167.00$ 653 INSTRUCTIONAL LEADER 3 - 5 TEACHERS 800.00$ 654 INSTRUCTIONAL LEADER 6 - 8 TEACHERS 1,200.00$ 655 INSTRUCTIONAL LEADER 9 - 10 TEACHERS 1,500.00$ 656 INSTRUCTIONAL LEADER 11 + TEACHERS 2,000.00$ 665 LITERARY MAGAZINE SPONSOR HIGH SCHOOL 1,581.00$ 669 MODEL UN SPONSOR HIGH SCHOOL 2,021.00$ 671 NATIONAL HONOR SOCIETY SPONSOR 388.00$ 676 NEWSPAPER SPONSOR HIGH SCHOOL 2,524.00$ 675 NEWSPAPER SPONSOR MIDDLE SCHOOL 1,581.00$ 677 ODYSSEY OF THE MIND COACH 928.00$ 679 ODYSSEY OF THE MIND COORDINATOR 2,014.00$ 626 SCHOOL COUNSELING DIRECTOR MIDDLE SCHOOL 911.00$ 636 SCHOOL WEBMASTER 1,105.00$ 689 STUDENT ACTIVITIES DIRECTOR HIGH SCHOOL 3,498.00$ 688 STUDENT ACTIVITIES DIRECTOR MIDDLE SCHOOL 2,615.00$ 680 STUDENT COOPERATIVE ASSOCIATION ADVISOR 728.00$ 645 TAG ADVISOR - SECONDARY 973.00$ 642 TAG ADVISOR - ELEMENTARY, 1 - 7 STUDENTS/REFERRALS 205.00$ 643 TAG ADVISOR - ELEMENTARY, 8 - 16 STUDENTS/REFERRALS 308.00$ 644 TAG ADVISOR - ELEMENTARY, 17 + STUDENTS/REFERRALS 410.00$ 607 YEARBOOK SPONSOR HIGH SCHOOL 3,184.00$ 606 YEARBOOK SPONSOR MIDDLE SCHOOL 2,065.00$ 691 YOUTH IN GOVERNMENT SPONSOR 2,065.00$ 878 TEACHER EXTRA CLASS 5,628.00$ 890 TEACHER TWO EXTRA CLASSES 11,256.00$
361
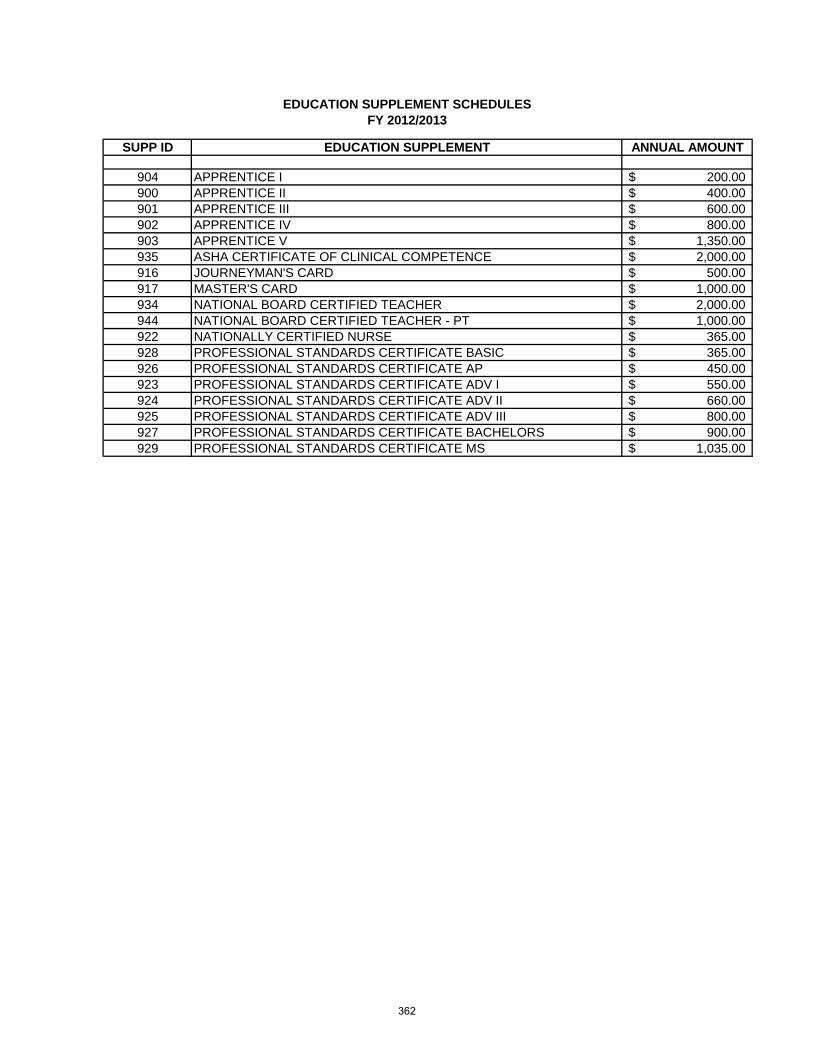
EDUCATION SUPPLEMENT SCHEDULESFY 2012/2013
SUPP ID EDUCATION SUPPLEMENT ANNUAL AMOUNT
904 APPRENTICE I 200.00$ 900 APPRENTICE II 400.00$ 901 APPRENTICE III 600.00$ 902 APPRENTICE IV 800.00$ 903 APPRENTICE V 1,350.00$ 935 ASHA CERTIFICATE OF CLINICAL COMPETENCE 2,000.00$ 916 JOURNEYMAN'S CARD 500.00$ 917 MASTER'S CARD 1,000.00$ 934 NATIONAL BOARD CERTIFIED TEACHER 2,000.00$ 944 NATIONAL BOARD CERTIFIED TEACHER - PT 1,000.00$ 922 NATIONALLY CERTIFIED NURSE 365.00$ 928 PROFESSIONAL STANDARDS CERTIFICATE BASIC 365.00$ 926 PROFESSIONAL STANDARDS CERTIFICATE AP 450.00$ 923 PROFESSIONAL STANDARDS CERTIFICATE ADV I 550.00$ 924 PROFESSIONAL STANDARDS CERTIFICATE ADV II 660.00$ 925 PROFESSIONAL STANDARDS CERTIFICATE ADV III 800.00$ 927 PROFESSIONAL STANDARDS CERTIFICATE BACHELORS 900.00$ 929 PROFESSIONAL STANDARDS CERTIFICATE MS 1,035.00$
362

GENERAL SUPPLEMENT SCHEDULESFY 2012/2013
SUPP ID GENERAL SUPPLEMENT TITLE ANNUAL AMOUNT
849 BASIC NEEDS PROVIDER 1,350.00$ 982 CELL PHONE A 12 MONTHS 1,200.00$ 983 CELL PHONE B 12 MONTHS 600.00$ 984 CELL PHONE C 12 MONTHS 420.00$ 979 CELL PHONE A 11 MONTHS 1,100.00$ 980 CELL PHONE B 11 MONTHS 550.00$ 981 CELL PHONE C 11 MONTHS 385.00$ 976 CELL PHONE A 10 MONTHS 1,000.00$ 977 CELL PHONE B 10 MONTHS 500.00$ 978 CELL PHONE C 10 MONTHS 350.00$ 985 CELL PHONE SUPERINTENDENT 3,000.00$ 881 SPECIAL EDUCATION BUS DRIVER 1 RUN 225.00$ 882 SPECIAL EDUCATION BUS DRIVER 2 RUNS 450.00$ 883 SPECIAL EDUCATION BUS DRIVER 3 RUNS 675.00$ 884 SPECIAL EDUCATION BUS DRIVER 4 RUNS 900.00$ 885 SPECIAL EDUCATION BUS DRIVER 5 RUNS 1,125.00$ 886 SPECIAL EDUCATION BUS DRIVER 6+ RUNS 1,350.00$
363
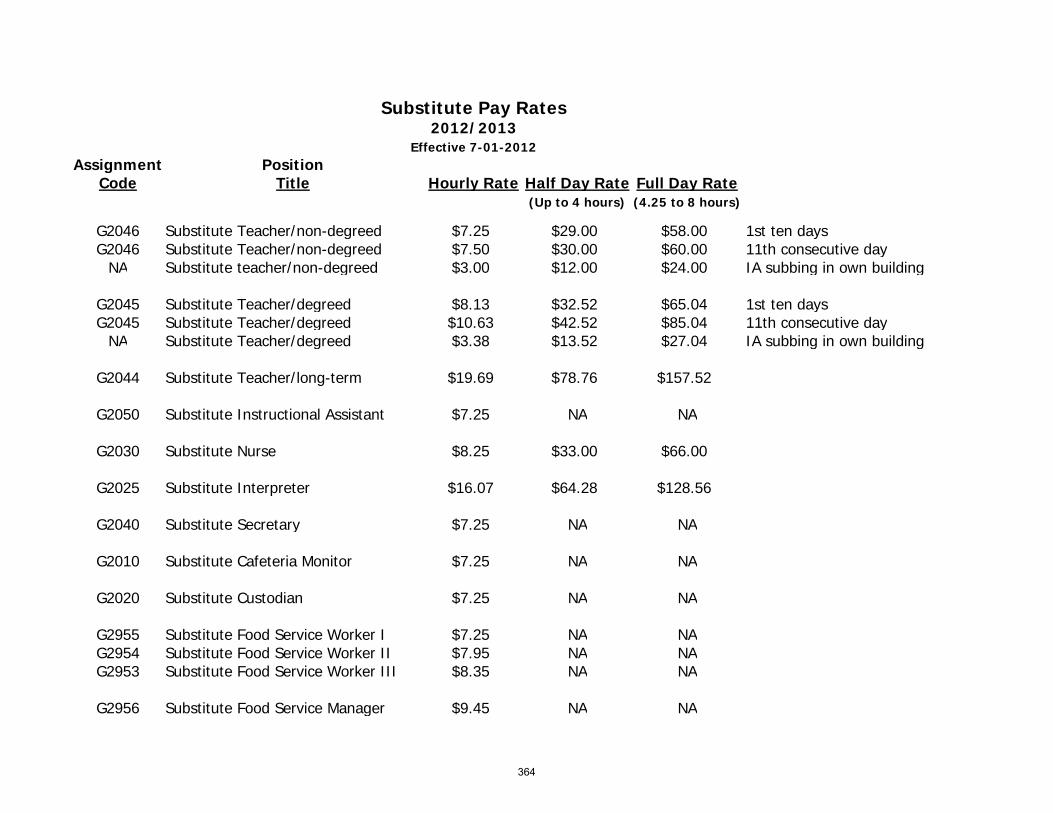
Substitute Pay Rates2012/2013
Effective 7-01-2012Assignment Position
Code Title Hourly Rate Half Day Rate Full Day Rate(Up to 4 hours) (4.25 to 8 hours)
G2046 Substitute Teacher/non-degreed $7.25 $29.00 $58.00 1st ten daysG2046 Substitute Teacher/non-degreed $7.50 $30.00 $60.00 11th consecutive day
NA Substitute teacher/non-degreed $3.00 $12.00 $24.00 IA subbing in own building
G2045 Substitute Teacher/degreed $8.13 $32.52 $65.04 1st ten daysG2045 Substitute Teacher/degreed $10.63 $42.52 $85.04 11th consecutive day
NA Substitute Teacher/degreed $3.38 $13.52 $27.04 IA subbing in own building
G2044 Substitute Teacher/long-term $19.69 $78.76 $157.52
G2050 Substitute Instructional Assistant $7.25 NA NA
G2030 Substitute Nurse $8.25 $33.00 $66.00
G2025 Substitute Interpreter $16.07 $64.28 $128.56
G2040 Substitute Secretary $7.25 NA NA
G2010 Substitute Cafeteria Monitor $7.25 NA NA
G2020 Substitute Custodian $7.25 NA NA
G2955 Substitute Food Service Worker I $7.25 NA NAG2954 Substitute Food Service Worker II $7.95 NA NAG2953 Substitute Food Service Worker III $8.35 NA NA
G2956 Substitute Food Service Manager $9.45 NA NA
364

HAMPTON CITY SCHOOLS NON-DISCRIMINATION NOTICE
Hampton City Schools Non-Discrimination Notice Hampton City Schools does not discriminate on the basis of race, color, national origin, sex, disability, age or other protected classes in its programs and activities and provides equal access to the Boy Scouts and other designated youth groups. The following person has been designated to handle inquiries regarding the non-discrimination policies: Robbin G. Ruth, Executive Director of Human Resources One Franklin Street, Hampton, VA 23669 757 727-2318
365

THIS PAGE INTENTIONALLY LEFT BLANK
366