2012-2013 national surveys on drug use and health: model ... · 2 140909 table 1 illicit drug use...
TRANSCRIPT

2012-2013 National Surveys on Drug Use and Health:
Model-Based Estimated Totals (in Thousands)
(50 States and the District of Columbia)

2
140909
Table 1 Illicit Drug Use in the Past Month, by Age Group and State: Estimated Numbers (in Thousands), Annual Averages Based on 2012 and 2013 NSDUHs
State 12+
(Estimate)
12+ (95% Confidence
Interval) 12-17
(Estimate)
12-17 (95% Confidence
Interval) 18-25
(Estimate)
18-25 (95% Confidence
Interval) 26+
(Estimate)
26+ (95% Confidence
Interval) 18+
(Estimate)
18+ (95% Confidence
Interval)
Total U.S. 24,218 (23,525 - 24,930) 2,287 (2,201 - 2,376) 7,436 (7,242 - 7,633) 14,495 (13,873 - 15,143) 21,931 (21,248 - 22,635) Northeast 4,530 (4,290 - 4,784) 392 (366 - 420) 1,450 (1,386 - 1,515) 2,688 (2,472 - 2,921) 4,138 (3,902 - 4,388) Midwest 4,956 (4,737 - 5,182) 479 (452 - 507) 1,543 (1,485 - 1,602) 2,934 (2,740 - 3,139) 4,477 (4,264 - 4,697) South 7,755 (7,404 - 8,121) 794 (749 - 841) 2,438 (2,342 - 2,538) 4,522 (4,218 - 4,847) 6,961 (6,622 - 7,316) West 6,977 (6,605 - 7,367) 621 (577 - 669) 2,005 (1,908 - 2,105) 4,351 (4,008 - 4,720) 6,355 (5,990 - 6,740) Alabama 304 (254 - 362) 30 (24 - 37) 94 (80 - 109) 180 (140 - 231) 274 (227 - 330) Alaska 75 (63 - 87) 6 (5 - 7) 19 (17 - 22) 50 (40 - 61) 69 (58 - 81) Arizona 564 (475 - 667) 60 (49 - 73) 159 (136 - 185) 345 (270 - 437) 504 (420 - 603) Arkansas 194 (162 - 232) 21 (17 - 26) 55 (47 - 65) 118 (92 - 151) 173 (143 - 209) California 3,527 (3,240 - 3,838) 305 (272 - 343) 1,075 (998 - 1,157) 2,147 (1,884 - 2,441) 3,222 (2,942 - 3,527) Colorado 641 (552 - 740) 58 (48 - 70) 180 (159 - 202) 403 (326 - 495) 583 (498 - 679) Connecticut 302 (257 - 354) 29 (23 - 35) 95 (83 - 110) 178 (141 - 223) 273 (230 - 323) Delaware 74 (63 - 86) 7 (6 - 9) 24 (20 - 27) 43 (34 - 54) 67 (56 - 79) District of Columbia 83 (73 - 95) 4 (3 - 5) 26 (23 - 30) 53 (44 - 64) 79 (69 - 91) Florida 1,423 (1,297 - 1,560) 131 (116 - 147) 431 (398 - 466) 861 (750 - 987) 1,292 (1,170 - 1,427) Georgia 771 (647 - 915) 79 (64 - 97) 222 (190 - 258) 470 (369 - 597) 692 (575 - 830) Hawaii 117 (98 - 138) 11 (9 - 13) 32 (27 - 37) 74 (58 - 94) 106 (88 - 127) Idaho 89 (74 - 107) 11 (9 - 13) 28 (23 - 33) 50 (39 - 66) 78 (64 - 95) Illinois 934 (852 - 1,024) 85 (75 - 96) 311 (287 - 335) 538 (466 - 620) 849 (769 - 937) Indiana 430 (365 - 505) 43 (34 - 53) 147 (127 - 169) 240 (189 - 305) 387 (325 - 459) Iowa 188 (156 - 225) 19 (15 - 24) 65 (55 - 76) 104 (80 - 136) 169 (139 - 205) Kansas 141 (116 - 171) 16 (13 - 20) 48 (39 - 57) 78 (58 - 103) 125 (101 - 154) Kentucky 263 (221 - 312) 24 (19 - 30) 87 (75 - 101) 151 (118 - 194) 239 (199 - 286) Louisiana 295 (248 - 350) 31 (25 - 38) 90 (77 - 106) 173 (135 - 221) 264 (219 - 317) Maine 130 (110 - 153) 11 (9 - 13) 34 (30 - 38) 86 (68 - 107) 119 (100 - 142) Maryland 440 (373 - 518) 44 (36 - 53) 141 (122 - 162) 255 (200 - 324) 396 (332 - 471) Massachusetts 658 (568 - 760) 52 (43 - 63) 223 (197 - 250) 384 (308 - 475) 606 (519 - 706) Michigan 954 (880 - 1,034) 92 (82 - 102) 264 (246 - 283) 598 (531 - 674) 862 (790 - 940) Minnesota 343 (284 - 411) 33 (26 - 42) 106 (90 - 124) 203 (157 - 263) 309 (254 - 375) Mississippi 176 (147 - 211) 19 (16 - 24) 59 (51 - 69) 97 (74 - 127) 157 (129 - 190) Missouri 443 (378 - 519) 45 (36 - 55) 147 (128 - 168) 252 (199 - 317) 398 (336 - 471) Montana 94 (80 - 110) 8 (6 - 9) 27 (23 - 30) 60 (48 - 74) 87 (73 - 102)
(continued)
3
140909
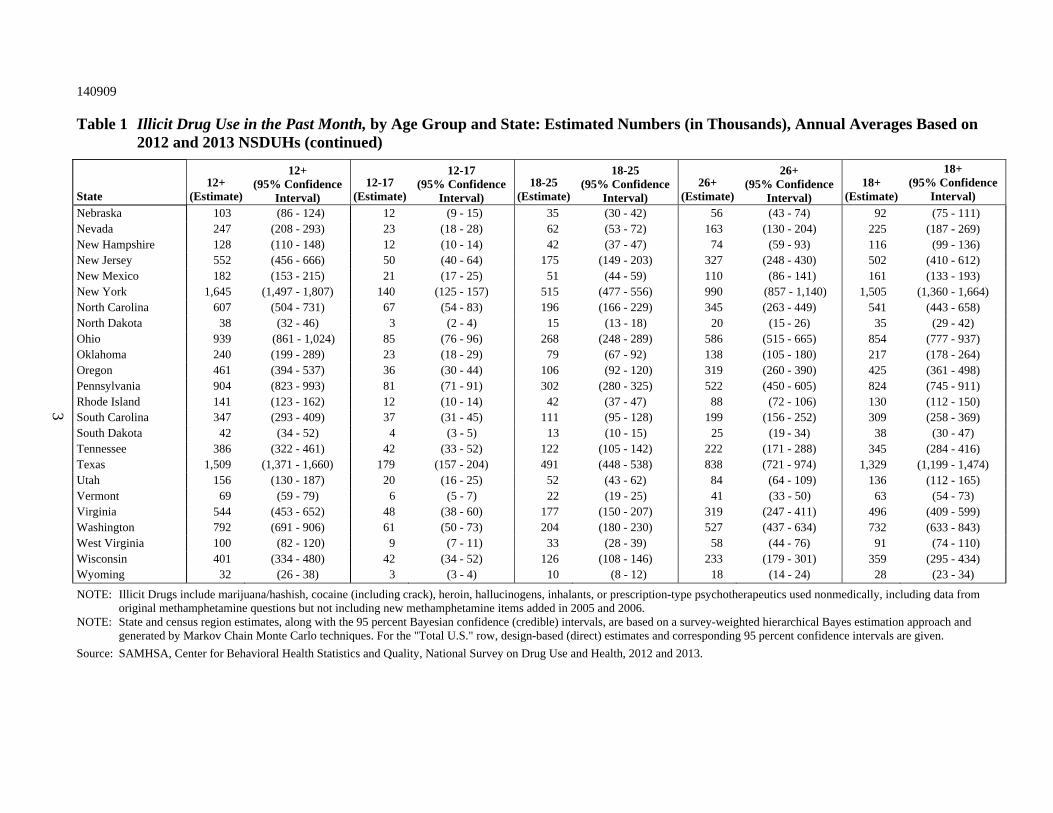
Table 1 Illicit Drug Use in the Past Month, by Age Group and State: Estimated Numbers (in Thousands), Annual Averages Based on 2012 and 2013 NSDUHs (continued)
State 12+
(Estimate)
12+ (95% Confidence
Interval) 12-17
(Estimate)
12-17 (95% Confidence
Interval) 18-25
(Estimate)
18-25 (95% Confidence
Interval) 26+
(Estimate)
26+ (95% Confidence
Interval)18+
(Estimate)
18+ (95% Confidence
Interval)
Nebraska 103 (86 - 124) 12 (9 - 15) 35 (30 - 42) 56 (43 - 74) 92 (75 - 111) Nevada 247 (208 - 293) 23 (18 - 28) 62 (53 - 72) 163 (130 - 204) 225 (187 - 269) New Hampshire 128 (110 - 148) 12 (10 - 14) 42 (37 - 47) 74 (59 - 93) 116 (99 - 136) New Jersey 552 (456 - 666) 50 (40 - 64) 175 (149 - 203) 327 (248 - 430) 502 (410 - 612) New Mexico 182 (153 - 215) 21 (17 - 25) 51 (44 - 59) 110 (86 - 141) 161 (133 - 193) New York 1,645 (1,497 - 1,807) 140 (125 - 157) 515 (477 - 556) 990 (857 - 1,140) 1,505 (1,360 - 1,664) North Carolina 607 (504 - 731) 67 (54 - 83) 196 (166 - 229) 345 (263 - 449) 541 (443 - 658) North Dakota 38 (32 - 46) 3 (2 - 4) 15 (13 - 18) 20 (15 - 26) 35 (29 - 42) Ohio 939 (861 - 1,024) 85 (76 - 96) 268 (248 - 289) 586 (515 - 665) 854 (777 - 937) Oklahoma 240 (199 - 289) 23 (18 - 29) 79 (67 - 92) 138 (105 - 180) 217 (178 - 264) Oregon 461 (394 - 537) 36 (30 - 44) 106 (92 - 120) 319 (260 - 390) 425 (361 - 498) Pennsylvania 904 (823 - 993) 81 (71 - 91) 302 (280 - 325) 522 (450 - 605) 824 (745 - 911) Rhode Island 141 (123 - 162) 12 (10 - 14) 42 (37 - 47) 88 (72 - 106) 130 (112 - 150) South Carolina 347 (293 - 409) 37 (31 - 45) 111 (95 - 128) 199 (156 - 252) 309 (258 - 369) South Dakota 42 (34 - 52) 4 (3 - 5) 13 (10 - 15) 25 (19 - 34) 38 (30 - 47) Tennessee 386 (322 - 461) 42 (33 - 52) 122 (105 - 142) 222 (171 - 288) 345 (284 - 416) Texas 1,509 (1,371 - 1,660) 179 (157 - 204) 491 (448 - 538) 838 (721 - 974) 1,329 (1,199 - 1,474) Utah 156 (130 - 187) 20 (16 - 25) 52 (43 - 62) 84 (64 - 109) 136 (112 - 165) Vermont 69 (59 - 79) 6 (5 - 7) 22 (19 - 25) 41 (33 - 50) 63 (54 - 73) Virginia 544 (453 - 652) 48 (38 - 60) 177 (150 - 207) 319 (247 - 411) 496 (409 - 599) Washington 792 (691 - 906) 61 (50 - 73) 204 (180 - 230) 527 (437 - 634) 732 (633 - 843) West Virginia 100 (82 - 120) 9 (7 - 11) 33 (28 - 39) 58 (44 - 76) 91 (74 - 110) Wisconsin 401 (334 - 480) 42 (34 - 52) 126 (108 - 146) 233 (179 - 301) 359 (295 - 434) Wyoming 32 (26 - 38) 3 (3 - 4) 10 (8 - 12) 18 (14 - 24) 28 (23 - 34)
NOTE: Illicit Drugs include marijuana/hashish, cocaine (including crack), heroin, hallucinogens, inhalants, or prescription-type psychotherapeutics used nonmedically, including data from original methamphetamine questions but not including new methamphetamine items added in 2005 and 2006.
NOTE: State and census region estimates, along with the 95 percent Bayesian confidence (credible) intervals, are based on a survey-weighted hierarchical Bayes estimation approach and generated by Markov Chain Monte Carlo techniques. For the "Total U.S." row, design-based (direct) estimates and corresponding 95 percent confidence intervals are given.
Source: SAMHSA, Center for Behavioral Health Statistics and Quality, National Survey on Drug Use and Health, 2012 and 2013.

4
140909
Table 2 Marijuana Use in the Past Year, by Age Group and State: Estimated Numbers (in Thousands), Annual Averages Based on 2012 and 2013 NSDUHs
State 12+
(Estimate)
12+ (95% Confidence
Interval) 12-17
(Estimate)
12-17 (95% Confidence
Interval) 18-25
(Estimate)
18-25 (95% Confidence
Interval) 26+
(Estimate)
26+ (95% Confidence
Interval) 18+
(Estimate)
18+ (95% Confidence
Interval)
Total U.S. 32,231 (31,447 - 33,036) 3,355 (3,253 - 3,460) 10,944 (10,700 - 11,190) 17,933 (17,258 - 18,635) 28,877 (28,106 - 29,668) Northeast 6,281 (5,994 - 6,582) 602 (569 - 637) 2,173 (2,097 - 2,250) 3,506 (3,252 - 3,779) 5,679 (5,401 - 5,972) Midwest 6,735 (6,472 - 7,004) 709 (675 - 744) 2,311 (2,242 - 2,380) 3,716 (3,483 - 3,961) 6,027 (5,774 - 6,286) South 10,328 (9,906 - 10,766) 1,154 (1,097 - 1,213) 3,643 (3,533 - 3,754) 5,531 (5,159 - 5,928) 9,174 (8,766 - 9,599) West 8,887 (8,468 - 9,326) 890 (834 - 949) 2,818 (2,711 - 2,926) 5,179 (4,801 - 5,586) 7,997 (7,588 - 8,426) Alabama 389 (332 - 455) 40 (32 - 49) 136 (120 - 154) 213 (166 - 273) 350 (295 - 412) Alaska 114 (100 - 129) 9 (8 - 11) 29 (26 - 33) 75 (62 - 89) 104 (91 - 119) Arizona 699 (599 - 813) 81 (68 - 96) 225 (200 - 252) 392 (307 - 498) 618 (522 - 728) Arkansas 235 (201 - 275) 30 (25 - 36) 78 (68 - 88) 128 (100 - 163) 205 (173 - 243) California 4,384 (4,057 - 4,736) 444 (400 - 492) 1,519 (1,429 - 1,612) 2,421 (2,131 - 2,745) 3,940 (3,622 - 4,283) Colorado 814 (715 - 922) 75 (64 - 89) 240 (218 - 262) 499 (412 - 602) 739 (643 - 844) Connecticut 425 (372 - 486) 46 (39 - 55) 148 (134 - 163) 231 (186 - 286) 379 (328 - 437) Delaware 108 (95 - 122) 11 (10 - 13) 39 (35 - 43) 57 (46 - 70) 96 (84 - 110) District of Columbia 116 (104 - 128) 6 (5 - 6) 41 (38 - 45) 69 (58 - 81) 110 (98 - 123) Florida 1,885 (1,737 - 2,044) 189 (170 - 209) 632 (596 - 670) 1,063 (929 - 1,215) 1,696 (1,552 - 1,851) Georgia 925 (790 - 1,080) 105 (88 - 125) 303 (267 - 341) 518 (406 - 657) 820 (691 - 969) Hawaii 151 (130 - 175) 15 (12 - 18) 44 (39 - 49) 93 (74 - 115) 137 (116 - 160) Idaho 127 (109 - 148) 18 (15 - 21) 44 (38 - 49) 66 (52 - 84) 110 (93 - 129) Illinois 1,247 (1,154 - 1,347) 132 (119 - 146) 438 (413 - 465) 677 (595 - 770) 1,115 (1,025 - 1,212) Indiana 598 (518 - 689) 66 (55 - 78) 232 (207 - 258) 300 (236 - 380) 532 (457 - 618) Iowa 266 (227 - 311) 29 (24 - 35) 104 (92 - 117) 133 (102 - 174) 237 (200 - 280) Kansas 192 (163 - 226) 24 (20 - 29) 78 (68 - 89) 90 (68 - 120) 168 (141 - 201) Kentucky 334 (287 - 388) 34 (28 - 42) 125 (110 - 141) 175 (136 - 224) 300 (255 - 352) Louisiana 405 (346 - 472) 45 (38 - 54) 140 (124 - 158) 219 (171 - 280) 359 (303 - 424) Maine 186 (161 - 214) 15 (13 - 18) 50 (45 - 55) 121 (99 - 148) 171 (147 - 198) Maryland 565 (487 - 654) 66 (56 - 79) 216 (194 - 240) 282 (219 - 363) 499 (425 - 584) Massachusetts 885 (779 - 1,004) 74 (62 - 87) 324 (295 - 355) 487 (396 - 596) 812 (709 - 926) Michigan 1,268 (1,180 - 1,361) 130 (119 - 142) 383 (362 - 404) 755 (675 - 842) 1,138 (1,053 - 1,229) Minnesota 536 (461 - 621) 51 (42 - 61) 183 (163 - 205) 302 (239 - 379) 485 (413 - 567) Mississippi 213 (180 - 251) 25 (21 - 31) 86 (75 - 98) 102 (75 - 136) 188 (157 - 224) Missouri 581 (501 - 673) 65 (54 - 78) 210 (187 - 233) 307 (241 - 388) 516 (440 - 604) Montana 134 (116 - 153) 12 (10 - 14) 38 (34 - 42) 84 (69 - 102) 122 (105 - 141)
(continued)
5
140909
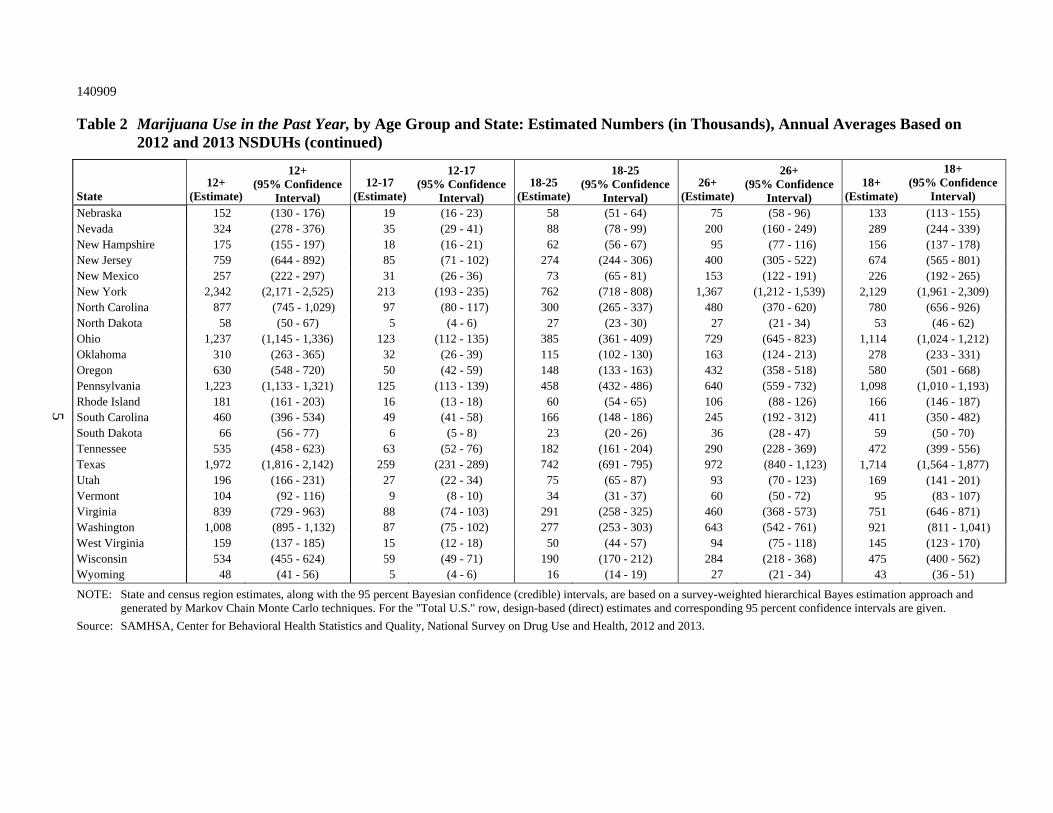
Table 2 Marijuana Use in the Past Year, by Age Group and State: Estimated Numbers (in Thousands), Annual Averages Based on 2012 and 2013 NSDUHs (continued)
State 12+
(Estimate)
12+ (95% Confidence
Interval) 12-17
(Estimate)
12-17 (95% Confidence
Interval) 18-25
(Estimate)
18-25 (95% Confidence
Interval) 26+
(Estimate)
26+ (95% Confidence
Interval)18+
(Estimate)
18+ (95% Confidence
Interval)
Nebraska 152 (130 - 176) 19 (16 - 23) 58 (51 - 64) 75 (58 - 96) 133 (113 - 155) Nevada 324 (278 - 376) 35 (29 - 41) 88 (78 - 99) 200 (160 - 249) 289 (244 - 339) New Hampshire 175 (155 - 197) 18 (16 - 21) 62 (56 - 67) 95 (77 - 116) 156 (137 - 178) New Jersey 759 (644 - 892) 85 (71 - 102) 274 (244 - 306) 400 (305 - 522) 674 (565 - 801) New Mexico 257 (222 - 297) 31 (26 - 36) 73 (65 - 81) 153 (122 - 191) 226 (192 - 265) New York 2,342 (2,171 - 2,525) 213 (193 - 235) 762 (718 - 808) 1,367 (1,212 - 1,539) 2,129 (1,961 - 2,309) North Carolina 877 (745 - 1,029) 97 (80 - 117) 300 (265 - 337) 480 (370 - 620) 780 (656 - 926) North Dakota 58 (50 - 67) 5 (4 - 6) 27 (23 - 30) 27 (21 - 34) 53 (46 - 62) Ohio 1,237 (1,145 - 1,336) 123 (112 - 135) 385 (361 - 409) 729 (645 - 823) 1,114 (1,024 - 1,212) Oklahoma 310 (263 - 365) 32 (26 - 39) 115 (102 - 130) 163 (124 - 213) 278 (233 - 331) Oregon 630 (548 - 720) 50 (42 - 59) 148 (133 - 163) 432 (358 - 518) 580 (501 - 668) Pennsylvania 1,223 (1,133 - 1,321) 125 (113 - 139) 458 (432 - 486) 640 (559 - 732) 1,098 (1,010 - 1,193) Rhode Island 181 (161 - 203) 16 (13 - 18) 60 (54 - 65) 106 (88 - 126) 166 (146 - 187) South Carolina 460 (396 - 534) 49 (41 - 58) 166 (148 - 186) 245 (192 - 312) 411 (350 - 482) South Dakota 66 (56 - 77) 6 (5 - 8) 23 (20 - 26) 36 (28 - 47) 59 (50 - 70) Tennessee 535 (458 - 623) 63 (52 - 76) 182 (161 - 204) 290 (228 - 369) 472 (399 - 556) Texas 1,972 (1,816 - 2,142) 259 (231 - 289) 742 (691 - 795) 972 (840 - 1,123) 1,714 (1,564 - 1,877) Utah 196 (166 - 231) 27 (22 - 34) 75 (65 - 87) 93 (70 - 123) 169 (141 - 201) Vermont 104 (92 - 116) 9 (8 - 10) 34 (31 - 37) 60 (50 - 72) 95 (83 - 107) Virginia 839 (729 - 963) 88 (74 - 103) 291 (258 - 325) 460 (368 - 573) 751 (646 - 871) Washington 1,008 (895 - 1,132) 87 (75 - 102) 277 (253 - 303) 643 (542 - 761) 921 (811 - 1,041) West Virginia 159 (137 - 185) 15 (12 - 18) 50 (44 - 57) 94 (75 - 118) 145 (123 - 170) Wisconsin 534 (455 - 624) 59 (49 - 71) 190 (170 - 212) 284 (218 - 368) 475 (400 - 562) Wyoming 48 (41 - 56) 5 (4 - 6) 16 (14 - 19) 27 (21 - 34) 43 (36 - 51)
NOTE: State and census region estimates, along with the 95 percent Bayesian confidence (credible) intervals, are based on a survey-weighted hierarchical Bayes estimation approach and generated by Markov Chain Monte Carlo techniques. For the "Total U.S." row, design-based (direct) estimates and corresponding 95 percent confidence intervals are given.
Source: SAMHSA, Center for Behavioral Health Statistics and Quality, National Survey on Drug Use and Health, 2012 and 2013.

6
140909
Table 3 Marijuana Use in the Past Month, by Age Group and State: Estimated Numbers (in Thousands), Annual Averages Based on 2012 and 2013 NSDUHs
State 12+
(Estimate)
12+ (95% Confidence
Interval) 12-17
(Estimate)
12-17 (95% Confidence
Interval) 18-25
(Estimate)
18-25 (95% Confidence
Interval) 26+
(Estimate)
26+ (95% Confidence
Interval) 18+
(Estimate)
18+ (95% Confidence
Interval)
Total U.S. 19,332 (18,726 - 19,958) 1,781 (1,706 - 1,859) 6,560 (6,372 - 6,753) 10,991 (10,453 - 11,556) 17,551 (16,954 - 18,169) Northeast 3,709 (3,490 - 3,942) 323 (299 - 349) 1,289 (1,230 - 1,350) 2,096 (1,900 - 2,312) 3,385 (3,172 - 3,614) Midwest 3,976 (3,777 - 4,182) 376 (354 - 399) 1,384 (1,330 - 1,440) 2,216 (2,043 - 2,401) 3,600 (3,407 - 3,801) South 5,946 (5,633 - 6,275) 589 (550 - 630) 2,100 (2,009 - 2,194) 3,257 (2,985 - 3,552) 5,357 (5,053 - 5,678) West 5,702 (5,369 - 6,054) 493 (454 - 534) 1,787 (1,695 - 1,883) 3,422 (3,122 - 3,749) 5,209 (4,883 - 5,555) Alabama 199 (160 - 246) 18 (14 - 24) 75 (62 - 89) 105 (76 - 147) 180 (143 - 226) Alaska 69 (58 - 81) 5 (4 - 7) 17 (15 - 20) 46 (37 - 58) 63 (53 - 76) Arizona 426 (349 - 518) 45 (36 - 55) 134 (113 - 158) 248 (185 - 329) 381 (308 - 470) Arkansas 138 (110 - 173) 13 (10 - 17) 46 (38 - 55) 79 (57 - 110) 125 (98 - 158) California 2,822 (2,562 - 3,107) 243 (213 - 277) 965 (888 - 1,047) 1,614 (1,383 - 1,880) 2,579 (2,325 - 2,860) Colorado 547 (467 - 636) 45 (37 - 55) 164 (144 - 186) 338 (269 - 420) 502 (425 - 589) Connecticut 272 (228 - 323) 25 (20 - 31) 92 (79 - 106) 156 (121 - 200) 247 (206 - 297) Delaware 61 (52 - 73) 6 (5 - 8) 21 (18 - 25) 34 (26 - 44) 55 (46 - 66) District of Columbia 66 (56 - 77) 3 (3 - 4) 24 (21 - 28) 39 (31 - 49) 63 (54 - 74) Florida 1,153 (1,034 - 1,286) 104 (91 - 119) 377 (346 - 409) 673 (568 - 794) 1,049 (934 - 1,178) Georgia 624 (510 - 759) 59 (47 - 74) 199 (170 - 233) 365 (272 - 487) 564 (456 - 695) Hawaii 98 (81 - 118) 9 (7 - 11) 26 (22 - 31) 62 (47 - 81) 88 (72 - 108) Idaho 72 (58 - 89) 8 (6 - 10) 24 (20 - 29) 40 (29 - 54) 64 (51 - 80) Illinois 744 (670 - 825) 65 (57 - 75) 280 (258 - 303) 398 (335 - 473) 678 (607 - 757) Indiana 340 (280 - 411) 32 (26 - 40) 130 (110 - 153) 177 (131 - 239) 307 (250 - 376) Iowa 153 (124 - 188) 15 (12 - 19) 57 (48 - 68) 81 (59 - 111) 138 (110 - 172) Kansas 103 (82 - 129) 12 (9 - 15) 40 (32 - 48) 52 (36 - 73) 91 (71 - 116) Kentucky 194 (159 - 235) 17 (13 - 22) 77 (65 - 90) 99 (73 - 135) 176 (144 - 216) Louisiana 191 (153 - 237) 19 (15 - 24) 76 (63 - 91) 96 (68 - 134) 172 (136 - 216) Maine 114 (96 - 136) 9 (7 - 11) 32 (28 - 36) 73 (57 - 94) 105 (87 - 126) Maryland 342 (283 - 412) 34 (28 - 42) 126 (108 - 147) 181 (136 - 241) 308 (252 - 375) Massachusetts 563 (476 - 664) 44 (35 - 54) 206 (180 - 235) 313 (242 - 402) 519 (435 - 618) Michigan 809 (739 - 886) 74 (65 - 83) 245 (227 - 265) 490 (426 - 563) 735 (667 - 811) Minnesota 279 (227 - 343) 28 (23 - 36) 98 (82 - 116) 153 (112 - 207) 251 (201 - 312) Mississippi 124 (101 - 152) 13 (10 - 16) 51 (43 - 60) 60 (43 - 83) 111 (89 - 137) Missouri 355 (295 - 426) 34 (27 - 42) 132 (113 - 153) 189 (141 - 251) 321 (264 - 390) Montana 88 (73 - 104) 6 (5 - 8) 25 (22 - 29) 56 (44 - 71) 81 (67 - 97)
(continued)

7
140909
Table 3 Marijuana Use in the Past Month, by Age Group and State: Estimated Numbers (in Thousands), Annual Averages Based on 2012 and 2013 NSDUHs (continued)
State 12+
(Estimate)
12+ (95% Confidence
Interval) 12-17
(Estimate)
12-17 (95% Confidence
Interval) 18-25
(Estimate)
18-25 (95% Confidence
Interval) 26+
(Estimate)
26+ (95% Confidence
Interval)18+
(Estimate)
18+ (95% Confidence
Interval)
Nebraska 83 (68 - 102) 9 (7 - 12) 31 (26 - 37) 43 (31 - 58) 74 (59 - 91) Nevada 183 (150 - 223) 18 (15 - 23) 53 (45 - 63) 112 (84 - 148) 165 (133 - 204) New Hampshire 111 (95 - 129) 10 (8 - 12) 39 (34 - 44) 62 (49 - 79) 101 (86 - 119) New Jersey 389 (309 - 487) 38 (29 - 49) 137 (114 - 163) 214 (151 - 301) 351 (275 - 445) New Mexico 154 (128 - 185) 15 (13 - 19) 44 (38 - 51) 95 (72 - 123) 139 (113 - 169) New York 1,373 (1,241 - 1,518) 118 (105 - 134) 457 (421 - 495) 798 (681 - 933) 1,255 (1,127 - 1,396) North Carolina 497 (402 - 612) 51 (40 - 64) 173 (145 - 206) 273 (199 - 372) 446 (356 - 556) North Dakota 30 (25 - 37) 3 (2 - 3) 14 (11 - 16) 14 (10 - 20) 28 (22 - 34) Ohio 734 (666 - 809) 68 (60 - 77) 232 (214 - 251) 434 (372 - 505) 666 (599 - 740) Oklahoma 173 (138 - 218) 16 (12 - 20) 62 (51 - 74) 96 (68 - 134) 157 (123 - 200) Oregon 395 (333 - 466) 28 (23 - 35) 96 (83 - 110) 270 (215 - 337) 367 (307 - 436) Pennsylvania 697 (627 - 775) 65 (56 - 74) 266 (244 - 289) 366 (305 - 439) 632 (564 - 708) Rhode Island 126 (109 - 146) 10 (8 - 12) 39 (35 - 44) 77 (62 - 95) 116 (99 - 136) South Carolina 270 (220 - 329) 26 (21 - 32) 97 (82 - 114) 147 (108 - 198) 244 (197 - 301) South Dakota 34 (27 - 43) 3 (3 - 4) 12 (10 - 14) 19 (14 - 27) 31 (24 - 39) Tennessee 292 (235 - 361) 31 (24 - 39) 104 (87 - 123) 158 (115 - 216) 262 (208 - 328) Texas 1,117 (995 - 1,254) 134 (116 - 155) 411 (370 - 456) 572 (471 - 693) 983 (866 - 1,116) Utah 114 (91 - 142) 15 (11 - 19) 40 (32 - 50) 59 (42 - 82) 99 (77 - 125) Vermont 64 (54 - 74) 5 (4 - 6) 21 (19 - 24) 38 (30 - 47) 59 (50 - 69) Virginia 425 (346 - 521) 38 (29 - 48) 152 (127 - 181) 236 (174 - 318) 388 (313 - 480) Washington 708 (610 - 819) 52 (43 - 63) 189 (166 - 214) 468 (380 - 572) 656 (561 - 765) West Virginia 80 (64 - 99) 7 (5 - 9) 28 (24 - 34) 45 (32 - 61) 73 (58 - 91) Wisconsin 311 (255 - 380) 32 (26 - 40) 114 (96 - 134) 165 (120 - 225) 279 (225 - 345) Wyoming 28 (22 - 35) 3 (2 - 3) 9 (7 - 11) 16 (12 - 22) 25 (20 - 32)
NOTE: State and census region estimates, along with the 95 percent Bayesian confidence (credible) intervals, are based on a survey-weighted hierarchical Bayes estimation approach and generated by Markov Chain Monte Carlo techniques. For the "Total U.S." row, design-based (direct) estimates and corresponding 95 percent confidence intervals are given.
Source: SAMHSA, Center for Behavioral Health Statistics and Quality, National Survey on Drug Use and Health, 2012 and 2013.

8
140909
Table 4 Perceptions of Great Risk of Smoking Marijuana Once a Month, by Age Group and State: Estimated Numbers (in Thousands), Annual Averages Based on 2012 and 2013 NSDUHs
State 12+
(Estimate)
12+ (95% Confidence
Interval) 12-17
(Estimate)
12-17 (95% Confidence
Interval) 18-25
(Estimate)
18-25 (95% Confidence
Interval) 26+
(Estimate)
26+ (95% Confidence
Interval) 18+
(Estimate)
18+ (95% Confidence
Interval)
Total U.S. 77,132 (75,730 - 78,432) 6,312 (6,174 - 6,453) 5,484 (5,310 - 5,661) 65,337 (64,033 - 66,650) 70,820 (69,437 - 72,094) Northeast 13,126 (12,653 - 13,584) 992 (947 - 1,039) 813 (764 - 864) 11,320 (10,871 - 11,778) 12,133 (11,665 - 12,587) Midwest 15,231 (14,791 - 15,654) 1,409 (1,365 - 1,453) 1,038 (991 - 1,088) 12,784 (12,370 - 13,206) 13,822 (13,389 - 14,239) South 32,721 (31,957 - 33,457) 2,614 (2,536 - 2,695) 2,357 (2,266 - 2,452) 27,749 (27,029 - 28,481) 30,107 (29,349 - 30,833) West 16,055 (15,438 - 16,656) 1,297 (1,235 - 1,361) 1,275 (1,198 - 1,356) 13,483 (12,897 - 14,080) 14,758 (14,148 - 15,351) Alabama 1,577 (1,441 - 1,716) 123 (110 - 137) 106 (92 - 123) 1,347 (1,217 - 1,480) 1,454 (1,320 - 1,590) Alaska 113 (98 - 130) 11 (10 - 13) 11 (9 - 13) 91 (77 - 106) 102 (87 - 118) Arizona 1,404 (1,245 - 1,573) 117 (102 - 134) 104 (87 - 124) 1,183 (1,033 - 1,344) 1,287 (1,132 - 1,451) Arkansas 865 (788 - 944) 73 (65 - 81) 53 (45 - 63) 739 (666 - 814) 792 (717 - 869) California 8,957 (8,448 - 9,468) 653 (603 - 706) 741 (676 - 810) 7,563 (7,077 - 8,067) 8,304 (7,802 - 8,808) Colorado 946 (832 - 1,071) 79 (68 - 91) 60 (49 - 74) 807 (698 - 927) 868 (755 - 990) Connecticut 752 (669 - 841) 66 (58 - 76) 46 (37 - 56) 640 (561 - 725) 686 (604 - 773) Delaware 223 (200 - 247) 15 (13 - 17) 13 (11 - 16) 195 (173 - 218) 208 (186 - 232) District of Columbia 123 (108 - 139) 7 (6 - 8) 11 (9 - 13) 105 (91 - 121) 116 (102 - 132) Florida 5,416 (5,137 - 5,695) 365 (340 - 391) 348 (320 - 378) 4,703 (4,434 - 4,979) 5,051 (4,774 - 5,328) Georgia 2,880 (2,626 - 3,141) 249 (223 - 277) 221 (191 - 255) 2,409 (2,166 - 2,660) 2,630 (2,381 - 2,886) Hawaii 300 (266 - 336) 21 (18 - 24) 18 (15 - 22) 261 (228 - 296) 279 (246 - 314) Idaho 382 (344 - 423) 39 (35 - 44) 29 (25 - 35) 314 (278 - 353) 343 (306 - 383) Illinois 3,169 (2,995 - 3,344) 274 (256 - 293) 207 (188 - 227) 2,688 (2,521 - 2,861) 2,895 (2,723 - 3,068) Indiana 1,595 (1,430 - 1,769) 153 (136 - 172) 105 (88 - 125) 1,337 (1,182 - 1,502) 1,442 (1,282 - 1,611) Iowa 717 (637 - 802) 66 (59 - 75) 49 (41 - 58) 602 (526 - 683) 651 (573 - 733) Kansas 623 (554 - 697) 62 (55 - 70) 55 (47 - 65) 506 (441 - 576) 561 (494 - 633) Kentucky 1,193 (1,081 - 1,310) 104 (93 - 116) 80 (69 - 94) 1,008 (900 - 1,122) 1,089 (978 - 1,204) Louisiana 1,349 (1,235 - 1,467) 110 (98 - 123) 106 (92 - 122) 1,133 (1,024 - 1,246) 1,240 (1,127 - 1,355) Maine 230 (200 - 262) 21 (19 - 24) 12 (10 - 15) 196 (167 - 228) 208 (179 - 240) Maryland 1,478 (1,319 - 1,644) 108 (95 - 122) 95 (79 - 113) 1,275 (1,124 - 1,437) 1,370 (1,214 - 1,534) Massachusetts 1,180 (1,029 - 1,344) 95 (82 - 109) 66 (53 - 82) 1,019 (876 - 1,178) 1,085 (937 - 1,246) Michigan 2,016 (1,890 - 2,143) 184 (171 - 198) 137 (123 - 152) 1,694 (1,574 - 1,821) 1,831 (1,707 - 1,958) Minnesota 1,124 (986 - 1,273) 104 (92 - 118) 69 (57 - 83) 951 (820 - 1,095) 1,020 (885 - 1,166) Mississippi 899 (821 - 978) 81 (73 - 90) 82 (72 - 94) 735 (662 - 810) 817 (742 - 895) Missouri 1,431 (1,279 - 1,590) 125 (111 - 140) 87 (73 - 103) 1,219 (1,076 - 1,372) 1,306 (1,158 - 1,462) Montana 213 (188 - 239) 18 (16 - 21) 11 (9 - 14) 183 (160 - 209) 195 (171 - 221)
(continued)

9
140909
Table 4 Perceptions of Great Risk of Smoking Marijuana Once a Month, by Age Group and State: Estimated Numbers (in Thousands), Annual Averages Based on 2012 and 2013 NSDUHs (continued)
State 12+
(Estimate)
12+ (95% Confidence
Interval) 12-17
(Estimate)
12-17 (95% Confidence
Interval) 18-25
(Estimate)
18-25 (95% Confidence
Interval) 26+
(Estimate)
26+ (95% Confidence
Interval)18+
(Estimate)
18+ (95% Confidence
Interval)
Nebraska 425 (377 - 475) 39 (34 - 44) 31 (26 - 36) 355 (310 - 403) 386 (340 - 435) Nevada 656 (584 - 732) 49 (43 - 57) 45 (38 - 54) 562 (493 - 635) 607 (537 - 681) New Hampshire 226 (198 - 256) 20 (18 - 23) 11 (9 - 14) 195 (168 - 224) 206 (179 - 235) New Jersey 2,480 (2,232 - 2,737) 174 (152 - 199) 132 (111 - 157) 2,173 (1,935 - 2,423) 2,305 (2,062 - 2,559) New Mexico 469 (416 - 525) 39 (34 - 45) 36 (31 - 43) 394 (344 - 447) 430 (378 - 485) New York 4,782 (4,501 - 5,065) 333 (308 - 360) 319 (289 - 353) 4,129 (3,859 - 4,409) 4,449 (4,171 - 4,729) North Carolina 2,475 (2,209 - 2,755) 192 (169 - 217) 172 (144 - 204) 2,111 (1,859 - 2,379) 2,283 (2,023 - 2,557) North Dakota 170 (154 - 188) 16 (14 - 17) 15 (12 - 18) 140 (124 - 157) 155 (138 - 172) Ohio 2,512 (2,358 - 2,667) 244 (228 - 260) 176 (160 - 194) 2,092 (1,944 - 2,247) 2,268 (2,116 - 2,422) Oklahoma 910 (815 - 1,010) 90 (79 - 101) 81 (69 - 95) 739 (649 - 837) 820 (727 - 919) Oregon 647 (560 - 743) 59 (50 - 68) 47 (38 - 57) 542 (460 - 635) 589 (504 - 682) Pennsylvania 3,155 (2,986 - 3,325) 257 (240 - 274) 204 (185 - 224) 2,695 (2,533 - 2,861) 2,899 (2,732 - 3,065) Rhode Island 199 (174 - 227) 16 (13 - 18) 14 (12 - 17) 169 (145 - 196) 183 (159 - 210) South Carolina 1,293 (1,171 - 1,419) 100 (89 - 112) 92 (78 - 107) 1,101 (985 - 1,223) 1,193 (1,073 - 1,317) South Dakota 200 (181 - 221) 19 (17 - 21) 16 (13 - 19) 165 (147 - 185) 181 (162 - 201) Tennessee 1,931 (1,763 - 2,104) 147 (130 - 164) 129 (112 - 149) 1,655 (1,494 - 1,822) 1,784 (1,620 - 1,954) Texas 7,815 (7,467 - 8,160) 658 (616 - 700) 614 (567 - 663) 6,544 (6,210 - 6,883) 7,158 (6,814 - 7,497) Utah 751 (681 - 824) 97 (87 - 108) 77 (66 - 89) 577 (513 - 644) 654 (587 - 724) Vermont 122 (107 - 138) 9 (8 - 11) 7 (6 - 9) 105 (91 - 120) 112 (98 - 128) Virginia 1,772 (1,575 - 1,982) 156 (138 - 176) 122 (100 - 148) 1,493 (1,307 - 1,695) 1,616 (1,422 - 1,821) Washington 1,080 (943 - 1,229) 101 (88 - 116) 84 (69 - 101) 895 (767 - 1,039) 979 (845 - 1,125) West Virginia 523 (476 - 571) 37 (33 - 42) 31 (26 - 36) 454 (409 - 502) 485 (439 - 533) Wisconsin 1,248 (1,101 - 1,404) 122 (108 - 137) 92 (77 - 109) 1,034 (895 - 1,185) 1,126 (983 - 1,279) Wyoming 135 (121 - 149) 13 (11 - 14) 10 (8 - 12) 112 (99 - 126) 122 (109 - 136)
NOTE: State and census region estimates, along with the 95 percent Bayesian confidence (credible) intervals, are based on a survey-weighted hierarchical Bayes estimation approach and generated by Markov Chain Monte Carlo techniques. For the "Total U.S." row, design-based (direct) estimates and corresponding 95 percent confidence intervals are given.
Source: SAMHSA, Center for Behavioral Health Statistics and Quality, National Survey on Drug Use and Health, 2012 and 2013.

10
140909
Table 5 Average Annual Marijuana Initiates, by Age Group and State: Estimated Numbers (in Thousands), Based on 2012 and 2013 NSDUHs
State 12+
(Estimate)
12+ (95% Confidence
Interval) 12-17
(Estimate)
12-17 (95% Confidence
Interval) 18-25
(Estimate)
18-25 (95% Confidence
Interval) 26+
(Estimate)
26+ (95% Confidence
Interval) 18+
(Estimate)
18+ (95% Confidence
Interval)
Total U.S. 2,857 (2,755 - 2,961) 1,268 (1,224 - 1,314) 1,348 (1,288 - 1,411) 240 (192 - 300) 1,588 (1,502 - 1,679) Northeast 531 (499 - 566) 223 (208 - 238) 262 (241 - 283) 47 (33 - 66) 309 (281 - 339) Midwest 619 (586 - 653) 277 (262 - 292) 293 (273 - 314) 49 (36 - 67) 342 (314 - 372) South 999 (943 - 1,058) 456 (431 - 483) 463 (429 - 499) 80 (58 - 110) 543 (496 - 595) West 707 (662 - 756) 313 (290 - 336) 330 (301 - 363) 64 (45 - 92) 395 (356 - 437) Alabama 39 (34 - 45) 18 (15 - 22) 18 (15 - 23) 3 (1 - 5) 21 (17 - 26) Alaska 7 (6 - 8) 3 (2 - 3) 3 (2 - 4) 1 (0 - 1) 4 (3 - 5) Arizona 58 (49 - 68) 28 (23 - 34) 24 (19 - 31) 5 (3 - 10) 30 (24 - 38) Arkansas 26 (22 - 30) 12 (10 - 15) 11 (9 - 14) 2 (1 - 4) 14 (11 - 17) California 389 (354 - 428) 164 (146 - 184) 193 (169 - 220) 32 (19 - 54) 225 (197 - 259) Colorado 49 (42 - 58) 24 (19 - 29) 20 (16 - 26) 5 (3 - 9) 26 (20 - 32) Connecticut 37 (32 - 43) 18 (15 - 22) 16 (13 - 20) 3 (2 - 6) 19 (15 - 24) Delaware 9 (8 - 11) 4 (3 - 5) 4 (3 - 5) 1 (0 - 2) 5 (4 - 6) District of Columbia 7 (6 - 9) 2 (2 - 3) 4 (4 - 5) 1 (0 - 2) 5 (4 - 6) Florida 163 (147 - 180) 75 (67 - 84) 73 (64 - 84) 15 (9 - 24) 88 (76 - 102) Georgia 85 (73 - 100) 41 (33 - 50) 39 (31 - 49) 6 (3 - 12) 45 (36 - 55) Hawaii 11 (9 - 14) 5 (4 - 6) 5 (4 - 7) 2 (1 - 4) 7 (5 - 9) Idaho 14 (12 - 16) 7 (6 - 9) 6 (4 - 7) 1 (1 - 2) 7 (5 - 9) Illinois 115 (104 - 126) 51 (45 - 57) 54 (47 - 62) 9 (6 - 16) 64 (55 - 74) Indiana 60 (51 - 70) 26 (21 - 31) 30 (24 - 37) 4 (2 - 8) 34 (28 - 42) Iowa 29 (25 - 34) 12 (10 - 15) 14 (12 - 18) 3 (1 - 5) 17 (14 - 21) Kansas 25 (21 - 30) 10 (8 - 13) 13 (10 - 16) 2 (1 - 4) 15 (12 - 19) Kentucky 35 (30 - 41) 15 (12 - 18) 17 (13 - 21) 3 (1 - 5) 20 (16 - 25) Louisiana 41 (35 - 48) 17 (14 - 21) 19 (15 - 24) 4 (2 - 8) 23 (18 - 29) Maine 12 (10 - 14) 5 (4 - 6) 6 (5 - 7) 1 (1 - 2) 7 (6 - 9) Maryland 58 (50 - 67) 27 (22 - 32) 26 (21 - 32) 5 (3 - 9) 31 (25 - 38) Massachusetts 72 (62 - 84) 27 (22 - 33) 40 (32 - 49) 5 (3 - 10) 45 (37 - 55) Michigan 102 (93 - 112) 48 (43 - 53) 48 (42 - 54) 7 (4 - 11) 54 (47 - 62) Minnesota 43 (36 - 51) 19 (15 - 23) 20 (15 - 25) 4 (2 - 8) 24 (19 - 30) Mississippi 23 (20 - 28) 11 (8 - 13) 11 (9 - 14) 2 (1 - 4) 13 (10 - 16) Missouri 58 (50 - 67) 26 (22 - 31) 27 (22 - 33) 5 (3 - 9) 32 (26 - 39) Montana 9 (8 - 10) 4 (3 - 5) 4 (3 - 5) 1 (0 - 1) 5 (4 - 6)
(continued)
11
140909
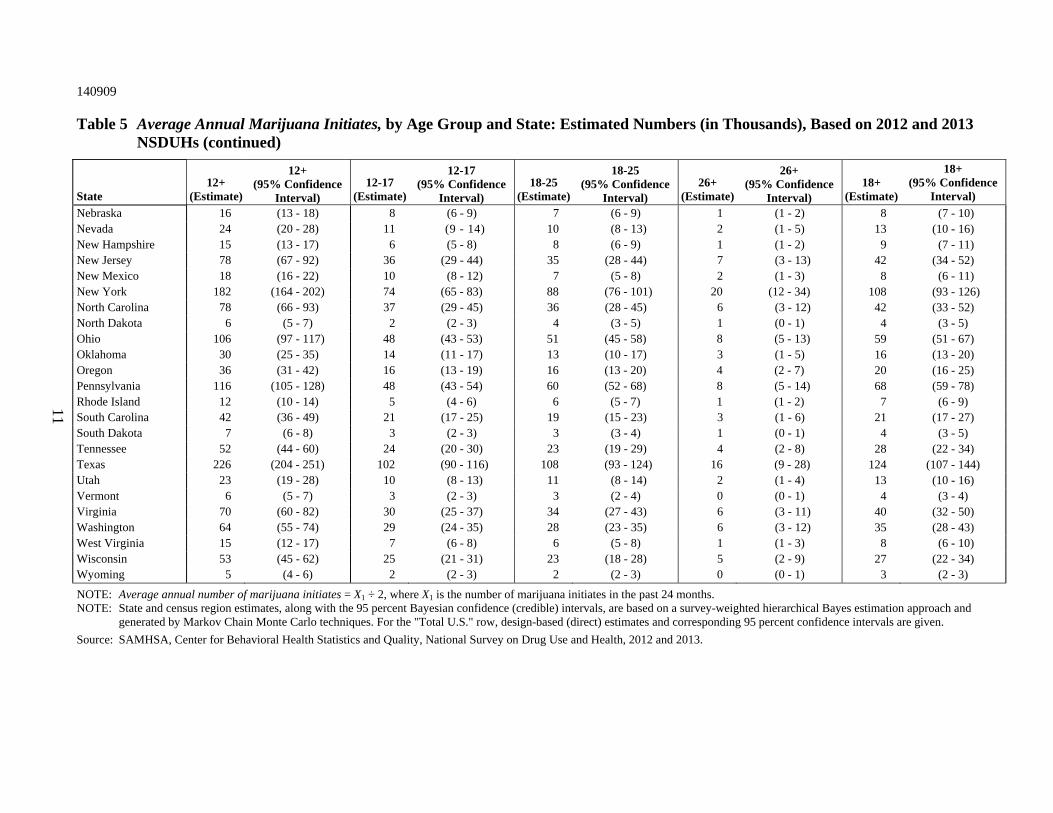
Table 5 Average Annual Marijuana Initiates, by Age Group and State: Estimated Numbers (in Thousands), Based on 2012 and 2013 NSDUHs (continued)
State 12+
(Estimate)
12+ (95% Confidence
Interval) 12-17
(Estimate)
12-17 (95% Confidence
Interval) 18-25
(Estimate)
18-25 (95% Confidence
Interval) 26+
(Estimate)
26+ (95% Confidence
Interval)18+
(Estimate)
18+ (95% Confidence
Interval)
Nebraska 16 (13 - 18) 8 (6 - 9) 7 (6 - 9) 1 (1 - 2) 8 (7 - 10) Nevada 24 (20 - 28) 11 (9 - 14) 10 (8 - 13) 2 (1 - 5) 13 (10 - 16) New Hampshire 15 (13 - 17) 6 (5 - 8) 8 (6 - 9) 1 (1 - 2) 9 (7 - 11) New Jersey 78 (67 - 92) 36 (29 - 44) 35 (28 - 44) 7 (3 - 13) 42 (34 - 52) New Mexico 18 (16 - 22) 10 (8 - 12) 7 (5 - 8) 2 (1 - 3) 8 (6 - 11) New York 182 (164 - 202) 74 (65 - 83) 88 (76 - 101) 20 (12 - 34) 108 (93 - 126) North Carolina 78 (66 - 93) 37 (29 - 45) 36 (28 - 45) 6 (3 - 12) 42 (33 - 52) North Dakota 6 (5 - 7) 2 (2 - 3) 4 (3 - 5) 1 (0 - 1) 4 (3 - 5) Ohio 106 (97 - 117) 48 (43 - 53) 51 (45 - 58) 8 (5 - 13) 59 (51 - 67) Oklahoma 30 (25 - 35) 14 (11 - 17) 13 (10 - 17) 3 (1 - 5) 16 (13 - 20) Oregon 36 (31 - 42) 16 (13 - 19) 16 (13 - 20) 4 (2 - 7) 20 (16 - 25) Pennsylvania 116 (105 - 128) 48 (43 - 54) 60 (52 - 68) 8 (5 - 14) 68 (59 - 78) Rhode Island 12 (10 - 14) 5 (4 - 6) 6 (5 - 7) 1 (1 - 2) 7 (6 - 9) South Carolina 42 (36 - 49) 21 (17 - 25) 19 (15 - 23) 3 (1 - 6) 21 (17 - 27) South Dakota 7 (6 - 8) 3 (2 - 3) 3 (3 - 4) 1 (0 - 1) 4 (3 - 5) Tennessee 52 (44 - 60) 24 (20 - 30) 23 (19 - 29) 4 (2 - 8) 28 (22 - 34) Texas 226 (204 - 251) 102 (90 - 116) 108 (93 - 124) 16 (9 - 28) 124 (107 - 144) Utah 23 (19 - 28) 10 (8 - 13) 11 (8 - 14) 2 (1 - 4) 13 (10 - 16) Vermont 6 (5 - 7) 3 (2 - 3) 3 (2 - 4) 0 (0 - 1) 4 (3 - 4) Virginia 70 (60 - 82) 30 (25 - 37) 34 (27 - 43) 6 (3 - 11) 40 (32 - 50) Washington 64 (55 - 74) 29 (24 - 35) 28 (23 - 35) 6 (3 - 12) 35 (28 - 43) West Virginia 15 (12 - 17) 7 (6 - 8) 6 (5 - 8) 1 (1 - 3) 8 (6 - 10) Wisconsin 53 (45 - 62) 25 (21 - 31) 23 (18 - 28) 5 (2 - 9) 27 (22 - 34) Wyoming 5 (4 - 6) 2 (2 - 3) 2 (2 - 3) 0 (0 - 1) 3 (2 - 3)
NOTE: Average annual number of marijuana initiates = X1 ÷ 2, where X1 is the number of marijuana initiates in the past 24 months. NOTE: State and census region estimates, along with the 95 percent Bayesian confidence (credible) intervals, are based on a survey-weighted hierarchical Bayes estimation approach and
generated by Markov Chain Monte Carlo techniques. For the "Total U.S." row, design-based (direct) estimates and corresponding 95 percent confidence intervals are given.
Source: SAMHSA, Center for Behavioral Health Statistics and Quality, National Survey on Drug Use and Health, 2012 and 2013.

12
140909
Table 6 Illicit Drug Use Other Than Marijuana in the Past Month, by Age Group and State: Estimated Numbers (in Thousands), Annual Averages Based on 2012 and 2013 NSDUHs
State 12+
(Estimate)
12+ (95% Confidence
Interval) 12-17
(Estimate)
12-17 (95% Confidence
Interval) 18-25
(Estimate)
18-25 (95% Confidence
Interval) 26+
(Estimate)
26+ (95% Confidence
Interval) 18+
(Estimate)
18+ (95% Confidence
Interval)
Total U.S. 8,774 (8,359 - 9,209) 837 (782 - 896) 2,386 (2,273 - 2,504) 5,551 (5,162 - 5,967) 7,937 (7,523 - 8,372) Northeast 1,451 (1,322 - 1,592) 120 (105 - 136) 432 (397 - 470) 899 (785 - 1,027) 1,331 (1,207 - 1,467) Midwest 1,748 (1,624 - 1,880) 172 (157 - 189) 495 (461 - 530) 1,081 (969 - 1,205) 1,576 (1,456 - 1,704) South 3,252 (3,026 - 3,494) 330 (301 - 362) 872 (815 - 933) 2,049 (1,846 - 2,274) 2,922 (2,703 - 3,157) West 2,324 (2,113 - 2,554) 215 (191 - 242) 587 (535 - 643) 1,522 (1,331 - 1,738) 2,109 (1,904 - 2,334) Alabama 155 (121 - 198) 15 (11 - 20) 40 (31 - 51) 100 (72 - 138) 140 (108 - 181) Alaska 17 (13 - 23) 2 (1 - 3) 5 (4 - 7) 10 (7 - 15) 15 (11 - 20) Arizona 210 (161 - 272) 21 (15 - 28) 49 (39 - 63) 140 (99 - 197) 189 (144 - 249) Arkansas 91 (70 - 118) 10 (7 - 13) 23 (18 - 29) 58 (41 - 82) 81 (62 - 106) California 1,226 (1,058 - 1,418) 112 (93 - 135) 305 (265 - 352) 808 (661 - 988) 1,114 (953 - 1,301) Colorado 170 (131 - 219) 15 (11 - 20) 45 (36 - 58) 109 (77 - 154) 155 (118 - 202) Connecticut 82 (61 - 110) 7 (5 - 11) 25 (20 - 33) 49 (33 - 74) 75 (55 - 101) Delaware 26 (20 - 34) 2 (2 - 3) 9 (7 - 11) 15 (11 - 22) 24 (18 - 31) District of Columbia 32 (25 - 40) 2 (1 - 2) 7 (5 - 9) 23 (17 - 31) 30 (23 - 39) Florida 504 (431 - 590) 42 (35 - 52) 145 (126 - 167) 317 (252 - 396) 462 (392 - 545) Georgia 330 (254 - 427) 34 (25 - 46) 76 (60 - 97) 220 (156 - 307) 296 (225 - 389) Hawaii 40 (30 - 52) 4 (3 - 5) 10 (7 - 12) 26 (18 - 38) 36 (27 - 48) Idaho 35 (26 - 46) 4 (3 - 5) 12 (9 - 15) 19 (13 - 29) 31 (23 - 41) Illinois 303 (258 - 355) 31 (25 - 37) 84 (72 - 97) 188 (150 - 236) 272 (230 - 323) Indiana 186 (144 - 238) 17 (12 - 24) 59 (46 - 74) 110 (77 - 156) 168 (130 - 218) Iowa 70 (52 - 92) 7 (5 - 10) 22 (17 - 29) 40 (27 - 61) 63 (46 - 84) Kansas 64 (49 - 85) 7 (5 - 10) 18 (14 - 24) 39 (26 - 58) 57 (43 - 77) Kentucky 115 (89 - 148) 9 (7 - 13) 36 (28 - 45) 70 (49 - 99) 106 (81 - 137) Louisiana 152 (118 - 196) 16 (12 - 22) 35 (28 - 45) 101 (72 - 140) 136 (104 - 177) Maine 32 (25 - 42) 3 (2 - 4) 10 (8 - 13) 20 (13 - 29) 30 (22 - 39) Maryland 154 (116 - 203) 15 (11 - 21) 42 (33 - 53) 97 (66 - 142) 139 (103 - 186) Massachusetts 173 (131 - 228) 15 (11 - 21) 53 (41 - 68) 105 (71 - 153) 158 (118 - 210) Michigan 294 (254 - 340) 31 (26 - 37) 74 (64 - 86) 189 (154 - 231) 263 (225 - 307) Minnesota 111 (82 - 149) 11 (8 - 15) 34 (25 - 44) 66 (44 - 101) 100 (73 - 136) Mississippi 88 (68 - 114) 10 (7 - 13) 23 (18 - 29) 55 (39 - 79) 78 (59 - 103) Missouri 156 (120 - 203) 16 (12 - 22) 46 (36 - 58) 94 (66 - 135) 140 (107 - 184) Montana 24 (18 - 31) 2 (2 - 3) 8 (6 - 10) 14 (9 - 20) 22 (16 - 29)
(continued)

13
140909
Table 6 Illicit Drug Use Other Than Marijuana in the Past Month, by Age Group and State: Estimated Numbers (in Thousands), Annual Averages Based on 2012 and 2013 NSDUHs (continued)
State 12+
(Estimate)
12+ (95% Confidence
Interval) 12-17
(Estimate)
12-17 (95% Confidence
Interval) 18-25
(Estimate)
18-25 (95% Confidence
Interval) 26+
(Estimate)
26+ (95% Confidence
Interval)18+
(Estimate)
18+ (95% Confidence
Interval)
Nebraska 36 (26 - 49) 4 (3 - 5) 11 (8 - 15) 21 (13 - 32) 32 (23 - 44) Nevada 92 (69 - 121) 8 (6 - 11) 20 (16 - 26) 63 (44 - 90) 84 (62 - 112) New Hampshire 40 (31 - 51) 3 (2 - 4) 14 (11 - 17) 23 (16 - 33) 37 (29 - 48) New Jersey 215 (161 - 285) 20 (14 - 28) 65 (51 - 84) 130 (87 - 193) 195 (145 - 262) New Mexico 64 (48 - 85) 7 (5 - 10) 14 (11 - 18) 43 (29 - 63) 57 (42 - 77) New York 513 (437 - 602) 39 (32 - 49) 153 (132 - 176) 321 (255 - 403) 474 (401 - 560) North Carolina 269 (203 - 355) 27 (19 - 37) 77 (60 - 99) 165 (112 - 242) 242 (181 - 323) North Dakota 16 (12 - 22) 1 (1 - 2) 6 (4 - 7) 10 (7 - 14) 15 (11 - 20) Ohio 348 (305 - 397) 31 (26 - 37) 94 (82 - 106) 224 (185 - 270) 318 (276 - 365) Oklahoma 106 (82 - 136) 10 (7 - 13) 31 (24 - 40) 65 (45 - 93) 96 (74 - 125) Oregon 135 (104 - 173) 12 (9 - 16) 32 (25 - 41) 91 (65 - 126) 123 (94 - 160) Pennsylvania 339 (291 - 395) 28 (23 - 34) 95 (82 - 109) 216 (174 - 268) 311 (265 - 365) Rhode Island 38 (30 - 49) 3 (2 - 4) 11 (9 - 14) 24 (17 - 34) 35 (27 - 46) South Carolina 145 (111 - 189) 15 (11 - 20) 37 (29 - 46) 94 (65 - 134) 130 (98 - 172) South Dakota 17 (12 - 23) 2 (1 - 2) 5 (4 - 7) 10 (7 - 15) 15 (11 - 21) Tennessee 170 (131 - 221) 17 (13 - 23) 48 (38 - 60) 105 (74 - 150) 153 (116 - 201) Texas 679 (580 - 795) 84 (69 - 102) 177 (151 - 207) 418 (335 - 523) 596 (502 - 706) Utah 71 (55 - 91) 8 (6 - 11) 23 (18 - 30) 40 (28 - 57) 63 (48 - 81) Vermont 18 (14 - 24) 2 (1 - 2) 6 (5 - 7) 11 (7 - 16) 17 (13 - 22) Virginia 196 (149 - 259) 19 (14 - 26) 54 (41 - 69) 123 (85 - 179) 177 (132 - 237) Washington 232 (183 - 293) 20 (15 - 26) 59 (47 - 75) 153 (112 - 208) 212 (166 - 270) West Virginia 39 (29 - 51) 3 (2 - 4) 13 (10 - 16) 23 (15 - 34) 35 (26 - 47) Wisconsin 148 (112 - 195) 15 (11 - 22) 43 (33 - 54) 90 (61 - 133) 132 (99 - 177) Wyoming 11 (8 - 15) 1 (1 - 2) 3 (2 - 4) 6 (4 - 10) 10 (7 - 13)
NOTE: Illicit Drugs Other Than Marijuana include cocaine (including crack), heroin, hallucinogens, inhalants, or prescription-type psychotherapeutics used nonmedically, including data from original methamphetamine questions but not including new methamphetamine items added in 2005 and 2006.
NOTE: State and census region estimates, along with the 95 percent Bayesian confidence (credible) intervals, are based on a survey-weighted hierarchical Bayes estimation approach and generated by Markov Chain Monte Carlo techniques. For the "Total U.S." row, design-based (direct) estimates and corresponding 95 percent confidence intervals are given.
Source: SAMHSA, Center for Behavioral Health Statistics and Quality, National Survey on Drug Use and Health, 2012 and 2013.

14
140909
Table 7 Cocaine Use in the Past Year, by Age Group and State: Estimated Numbers (in Thousands), Annual Averages Based on 2012 and 2013 NSDUHs
State 12+
(Estimate)
12+ (95% Confidence
Interval) 12-17
(Estimate)
12-17 (95% Confidence
Interval) 18-25
(Estimate)
18-25 (95% Confidence
Interval) 26+
(Estimate)
26+ (95% Confidence
Interval) 18+
(Estimate)
18+ (95% Confidence
Interval)
Total U.S. 4,427 (4,153 - 4,718) 156 (133 - 182) 1,572 (1,468 - 1,682) 2,699 (2,457 - 2,965) 4,271 (3,998 - 4,562) Northeast 912 (811 - 1,026) 25 (20 - 32) 324 (292 - 359) 563 (474 - 669) 887 (787 - 1,000) Midwest 782 (693 - 881) 26 (20 - 33) 259 (234 - 287) 496 (417 - 590) 756 (669 - 854) South 1,511 (1,365 - 1,673) 58 (47 - 71) 498 (455 - 545) 955 (825 - 1,105) 1,453 (1,309 - 1,614) West 1,222 (1,082 - 1,378) 47 (36 - 61) 490 (438 - 548) 684 (566 - 827) 1,174 (1,037 - 1,328) Alabama 48 (32 - 72) 2 (1 - 3) 14 (9 - 20) 32 (19 - 54) 46 (30 - 70) Alaska 9 (7 - 13) 0 (0 - 1) 4 (3 - 5) 5 (3 - 8) 9 (6 - 12) Arizona 120 (87 - 165) 6 (3 - 11) 44 (33 - 58) 70 (44 - 112) 114 (82 - 158) Arkansas 32 (22 - 46) 1 (1 - 2) 10 (7 - 14) 21 (13 - 33) 30 (21 - 44) California 663 (557 - 789) 25 (17 - 36) 278 (236 - 327) 361 (273 - 478) 639 (535 - 763) Colorado 115 (86 - 154) 4 (2 - 6) 46 (35 - 60) 66 (43 - 100) 112 (83 - 150) Connecticut 60 (44 - 82) 2 (1 - 3) 24 (18 - 32) 35 (22 - 54) 59 (43 - 80) Delaware 13 (9 - 18) 0 (0 - 1) 5 (4 - 7) 8 (5 - 13) 13 (9 - 18) District of Columbia 18 (13 - 24) 0 (0 - 0) 5 (4 - 7) 13 (9 - 19) 18 (13 - 24) Florida 300 (245 - 368) 10 (6 - 14) 102 (86 - 120) 189 (141 - 254) 291 (236 - 358) Georgia 147 (105 - 207) 4 (3 - 8) 37 (27 - 53) 106 (69 - 160) 143 (101 - 202) Hawaii 18 (13 - 26) 1 (0 - 1) 6 (5 - 8) 11 (7 - 19) 18 (12 - 26) Idaho 15 (10 - 21) 1 (0 - 1) 6 (4 - 8) 8 (5 - 14) 14 (9 - 20) Illinois 183 (147 - 227) 5 (3 - 8) 54 (44 - 66) 124 (92 - 167) 178 (143 - 222) Indiana 75 (53 - 106) 3 (2 - 6) 30 (22 - 42) 42 (24 - 70) 72 (50 - 103) Iowa 35 (24 - 49) 1 (1 - 2) 13 (9 - 18) 20 (13 - 33) 33 (23 - 48) Kansas 32 (22 - 46) 1 (1 - 2) 11 (8 - 16) 19 (12 - 31) 31 (21 - 44) Kentucky 56 (40 - 78) 2 (1 - 3) 20 (14 - 27) 35 (22 - 54) 54 (39 - 76) Louisiana 66 (47 - 93) 2 (1 - 4) 18 (13 - 24) 46 (30 - 71) 64 (45 - 91) Maine 17 (12 - 24) 1 (0 - 1) 6 (5 - 9) 10 (6 - 16) 17 (12 - 23) Maryland 72 (49 - 105) 2 (1 - 4) 24 (17 - 33) 46 (27 - 76) 70 (47 - 102) Massachusetts 129 (95 - 176) 4 (2 - 6) 46 (35 - 62) 79 (52 - 121) 126 (92 - 171) Michigan 90 (68 - 119) 3 (2 - 5) 30 (24 - 38) 57 (38 - 86) 88 (66 - 116) Minnesota 59 (41 - 85) 2 (1 - 4) 19 (13 - 27) 38 (23 - 61) 57 (39 - 82) Mississippi 34 (23 - 50) 1 (1 - 2) 9 (6 - 13) 24 (15 - 38) 33 (22 - 49) Missouri 53 (34 - 82) 2 (1 - 4) 18 (12 - 27) 33 (18 - 60) 51 (33 - 79) Montana 13 (10 - 18) 1 (0 - 1) 5 (4 - 7) 7 (5 - 12) 12 (9 - 17)
(continued)

15
140909
Table 7 Cocaine Use in the Past Year, by Age Group and State: Estimated Numbers (in Thousands), Annual Averages Based on 2012 and 2013 NSDUHs (continued)
State 12+
(Estimate)
12+ (95% Confidence
Interval) 12-17
(Estimate)
12-17 (95% Confidence
Interval) 18-25
(Estimate)
18-25 (95% Confidence
Interval) 26+
(Estimate)
26+ (95% Confidence
Interval)18+
(Estimate)
18+ (95% Confidence
Interval)
Nebraska 19 (13 - 27) 1 (0 - 1) 7 (5 - 10) 11 (6 - 18) 18 (13 - 26) Nevada 34 (24 - 48) 1 (1 - 2) 11 (8 - 16) 21 (13 - 34) 32 (22 - 46) New Hampshire 22 (17 - 30) 1 (0 - 1) 10 (7 - 12) 12 (7 - 19) 21 (16 - 29) New Jersey 125 (89 - 176) 5 (3 - 8) 45 (33 - 61) 76 (47 - 121) 120 (85 - 170) New Mexico 36 (26 - 50) 2 (1 - 3) 12 (9 - 16) 23 (14 - 36) 35 (25 - 49) New York 345 (284 - 419) 9 (6 - 13) 124 (105 - 147) 212 (160 - 282) 336 (276 - 410) North Carolina 131 (93 - 187) 5 (3 - 9) 44 (32 - 61) 82 (51 - 131) 126 (88 - 180) North Dakota 8 (6 - 12) 0 (0 - 1) 3 (2 - 5) 5 (3 - 8) 8 (6 - 11) Ohio 153 (124 - 189) 4 (3 - 7) 49 (41 - 59) 100 (74 - 134) 149 (120 - 184) Oklahoma 35 (24 - 52) 1 (1 - 3) 13 (9 - 18) 21 (12 - 36) 34 (23 - 50) Oregon 59 (43 - 81) 2 (1 - 4) 24 (18 - 32) 33 (21 - 52) 57 (41 - 79) Pennsylvania 183 (147 - 227) 4 (3 - 7) 57 (47 - 69) 122 (90 - 164) 179 (143 - 222) Rhode Island 19 (14 - 26) 0 (0 - 1) 7 (5 - 10) 12 (8 - 18) 19 (14 - 26) South Carolina 63 (43 - 91) 2 (1 - 3) 19 (14 - 27) 42 (26 - 68) 61 (42 - 89) South Dakota 7 (5 - 11) 0 (0 - 1) 3 (2 - 4) 5 (3 - 8) 7 (5 - 11) Tennessee 73 (52 - 104) 3 (2 - 5) 22 (16 - 31) 48 (30 - 75) 70 (49 - 100) Texas 298 (243 - 365) 17 (12 - 25) 119 (98 - 144) 162 (116 - 224) 281 (227 - 347) Utah 35 (24 - 49) 1 (1 - 3) 13 (9 - 18) 20 (13 - 33) 33 (23 - 48) Vermont 11 (8 - 15) 0 (0 - 1) 5 (4 - 6) 6 (4 - 9) 10 (8 - 14) Virginia 101 (70 - 145) 3 (2 - 5) 30 (21 - 44) 67 (43 - 106) 98 (68 - 141) Washington 98 (72 - 134) 4 (2 - 6) 39 (29 - 52) 55 (35 - 87) 94 (69 - 129) West Virginia 23 (16 - 32) 1 (0 - 1) 7 (5 - 10) 14 (9 - 23) 22 (15 - 31) Wisconsin 67 (46 - 97) 2 (1 - 4) 21 (15 - 30) 44 (26 - 72) 65 (45 - 95) Wyoming 6 (4 - 9) 0 (0 - 0) 2 (2 - 3) 3 (2 - 6) 6 (4 - 8)
NOTE: State and census region estimates, along with the 95 percent Bayesian confidence (credible) intervals, are based on a survey-weighted hierarchical Bayes estimation approach and generated by Markov Chain Monte Carlo techniques. For the "Total U.S." row, design-based (direct) estimates and corresponding 95 percent confidence intervals are given.
Source: SAMHSA, Center for Behavioral Health Statistics and Quality, National Survey on Drug Use and Health, 2012 and 2013.

16
140909
Table 8 Nonmedical Use of Pain Relievers in the Past Year, by Age Group and State: Estimated Numbers (in Thousands), Annual Averages Based on 2012 and 2013 NSDUHs
State 12+
(Estimate)
12+ (95% Confidence
Interval) 12-17
(Estimate)
12-17 (95% Confidence
Interval) 18-25
(Estimate)
18-25 (95% Confidence
Interval) 26+
(Estimate)
26+ (95% Confidence
Interval) 18+
(Estimate)
18+ (95% Confidence
Interval)
Total U.S. 11,786 (11,302 - 12,289) 1,245 (1,181 - 1,312) 3,284 (3,150 - 3,423) 7,257 (6,815 - 7,727) 10,541 (10,068 - 11,035) Northeast 1,844 (1,694 - 2,007) 171 (153 - 190) 531 (493 - 573) 1,142 (1,013 - 1,286) 1,673 (1,529 - 1,831) Midwest 2,433 (2,287 - 2,587) 261 (241 - 282) 695 (655 - 737) 1,477 (1,350 - 1,615) 2,172 (2,032 - 2,321) South 4,375 (4,118 - 4,646) 481 (446 - 519) 1,207 (1,139 - 1,279) 2,686 (2,459 - 2,934) 3,893 (3,646 - 4,157) West 3,135 (2,885 - 3,403) 332 (299 - 369) 850 (783 - 923) 1,952 (1,733 - 2,197) 2,802 (2,560 - 3,064) Alabama 218 (177 - 267) 24 (19 - 31) 59 (48 - 72) 135 (102 - 177) 194 (155 - 241) Alaska 28 (23 - 35) 3 (2 - 4) 9 (7 - 11) 16 (12 - 22) 25 (20 - 31) Arizona 314 (252 - 390) 38 (29 - 49) 80 (64 - 98) 197 (146 - 264) 276 (218 - 349) Arkansas 131 (106 - 160) 17 (13 - 22) 37 (30 - 45) 77 (57 - 103) 114 (91 - 142) California 1,643 (1,451 - 1,860) 164 (139 - 192) 459 (405 - 519) 1,021 (853 - 1,219) 1,480 (1,293 - 1,692) Colorado 218 (177 - 269) 26 (19 - 33) 61 (49 - 74) 132 (99 - 177) 193 (153 - 242) Connecticut 108 (85 - 137) 11 (8 - 15) 32 (25 - 40) 65 (47 - 90) 97 (75 - 125) Delaware 38 (31 - 46) 4 (3 - 5) 11 (9 - 13) 23 (17 - 30) 34 (27 - 42) District of Columbia 25 (20 - 32) 2 (1 - 2) 7 (6 - 9) 16 (12 - 22) 24 (19 - 30) Florida 595 (515 - 686) 62 (52 - 73) 154 (135 - 177) 379 (311 - 461) 533 (457 - 622) Georgia 371 (296 - 462) 42 (32 - 55) 96 (76 - 120) 232 (173 - 310) 329 (259 - 416) Hawaii 51 (41 - 65) 5 (4 - 7) 14 (11 - 17) 32 (23 - 44) 46 (36 - 59) Idaho 58 (47 - 71) 8 (6 - 10) 17 (14 - 21) 33 (24 - 44) 50 (40 - 63) Illinois 382 (331 - 441) 40 (33 - 48) 112 (98 - 127) 230 (187 - 283) 342 (293 - 399) Indiana 286 (233 - 349) 31 (24 - 40) 90 (74 - 109) 165 (124 - 219) 255 (205 - 316) Iowa 101 (80 - 125) 11 (8 - 15) 32 (26 - 39) 58 (42 - 78) 89 (71 - 113) Kansas 85 (68 - 108) 11 (8 - 14) 25 (19 - 31) 50 (37 - 69) 75 (58 - 96) Kentucky 167 (134 - 206) 16 (12 - 21) 45 (36 - 56) 106 (80 - 139) 151 (120 - 189) Louisiana 182 (149 - 223) 21 (16 - 27) 47 (37 - 58) 115 (88 - 150) 162 (130 - 201) Maine 44 (35 - 54) 4 (3 - 5) 11 (9 - 14) 28 (21 - 38) 39 (31 - 50) Maryland 206 (164 - 258) 20 (16 - 27) 54 (43 - 67) 132 (98 - 177) 186 (146 - 236) Massachusetts 211 (167 - 265) 20 (15 - 27) 66 (53 - 83) 124 (91 - 170) 191 (149 - 243) Michigan 397 (353 - 447) 47 (41 - 54) 112 (100 - 126) 238 (200 - 283) 350 (308 - 398) Minnesota 161 (127 - 205) 17 (12 - 23) 45 (35 - 58) 99 (73 - 135) 145 (112 - 186) Mississippi 113 (91 - 140) 13 (10 - 17) 32 (26 - 40) 67 (50 - 90) 100 (79 - 126) Missouri 235 (193 - 287) 25 (19 - 32) 72 (58 - 88) 139 (105 - 182) 210 (170 - 260) Montana 33 (27 - 42) 4 (3 - 5) 10 (8 - 13) 19 (14 - 26) 29 (23 - 37)
(continued)
17
140909
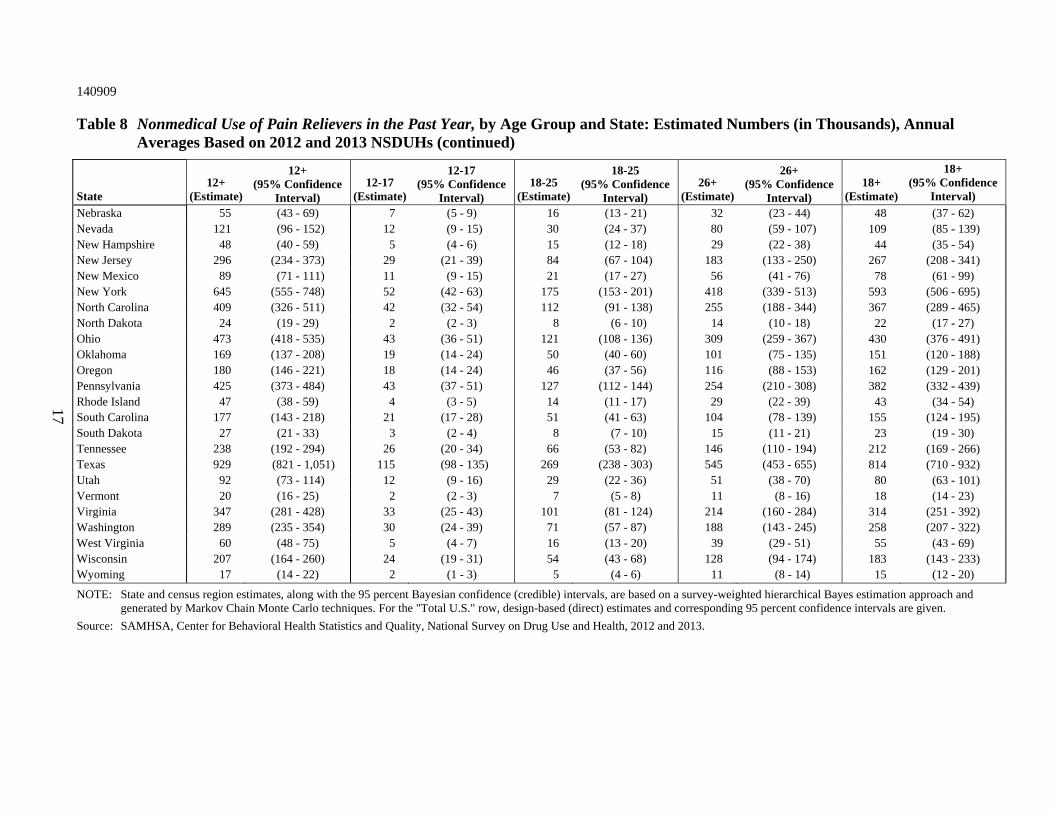
Table 8 Nonmedical Use of Pain Relievers in the Past Year, by Age Group and State: Estimated Numbers (in Thousands), Annual Averages Based on 2012 and 2013 NSDUHs (continued)
State 12+
(Estimate)
12+ (95% Confidence
Interval) 12-17
(Estimate)
12-17 (95% Confidence
Interval) 18-25
(Estimate)
18-25 (95% Confidence
Interval) 26+
(Estimate)
26+ (95% Confidence
Interval)18+
(Estimate)
18+ (95% Confidence
Interval)
Nebraska 55 (43 - 69) 7 (5 - 9) 16 (13 - 21) 32 (23 - 44) 48 (37 - 62) Nevada 121 (96 - 152) 12 (9 - 15) 30 (24 - 37) 80 (59 - 107) 109 (85 - 139) New Hampshire 48 (40 - 59) 5 (4 - 6) 15 (12 - 18) 29 (22 - 38) 44 (35 - 54) New Jersey 296 (234 - 373) 29 (21 - 39) 84 (67 - 104) 183 (133 - 250) 267 (208 - 341) New Mexico 89 (71 - 111) 11 (9 - 15) 21 (17 - 27) 56 (41 - 76) 78 (61 - 99) New York 645 (555 - 748) 52 (42 - 63) 175 (153 - 201) 418 (339 - 513) 593 (506 - 695) North Carolina 409 (326 - 511) 42 (32 - 54) 112 (91 - 138) 255 (188 - 344) 367 (289 - 465) North Dakota 24 (19 - 29) 2 (2 - 3) 8 (6 - 10) 14 (10 - 18) 22 (17 - 27) Ohio 473 (418 - 535) 43 (36 - 51) 121 (108 - 136) 309 (259 - 367) 430 (376 - 491) Oklahoma 169 (137 - 208) 19 (14 - 24) 50 (40 - 60) 101 (75 - 135) 151 (120 - 188) Oregon 180 (146 - 221) 18 (14 - 24) 46 (37 - 56) 116 (88 - 153) 162 (129 - 201) Pennsylvania 425 (373 - 484) 43 (37 - 51) 127 (112 - 144) 254 (210 - 308) 382 (332 - 439) Rhode Island 47 (38 - 59) 4 (3 - 5) 14 (11 - 17) 29 (22 - 39) 43 (34 - 54) South Carolina 177 (143 - 218) 21 (17 - 28) 51 (41 - 63) 104 (78 - 139) 155 (124 - 195) South Dakota 27 (21 - 33) 3 (2 - 4) 8 (7 - 10) 15 (11 - 21) 23 (19 - 30) Tennessee 238 (192 - 294) 26 (20 - 34) 66 (53 - 82) 146 (110 - 194) 212 (169 - 266) Texas 929 (821 - 1,051) 115 (98 - 135) 269 (238 - 303) 545 (453 - 655) 814 (710 - 932) Utah 92 (73 - 114) 12 (9 - 16) 29 (22 - 36) 51 (38 - 70) 80 (63 - 101) Vermont 20 (16 - 25) 2 (2 - 3) 7 (5 - 8) 11 (8 - 16) 18 (14 - 23) Virginia 347 (281 - 428) 33 (25 - 43) 101 (81 - 124) 214 (160 - 284) 314 (251 - 392) Washington 289 (235 - 354) 30 (24 - 39) 71 (57 - 87) 188 (143 - 245) 258 (207 - 322) West Virginia 60 (48 - 75) 5 (4 - 7) 16 (13 - 20) 39 (29 - 51) 55 (43 - 69) Wisconsin 207 (164 - 260) 24 (19 - 31) 54 (43 - 68) 128 (94 - 174) 183 (143 - 233) Wyoming 17 (14 - 22) 2 (1 - 3) 5 (4 - 6) 11 (8 - 14) 15 (12 - 20)
NOTE: State and census region estimates, along with the 95 percent Bayesian confidence (credible) intervals, are based on a survey-weighted hierarchical Bayes estimation approach and generated by Markov Chain Monte Carlo techniques. For the "Total U.S." row, design-based (direct) estimates and corresponding 95 percent confidence intervals are given.
Source: SAMHSA, Center for Behavioral Health Statistics and Quality, National Survey on Drug Use and Health, 2012 and 2013.

18
140909
Table 9 Alcohol Use in the Past Month, by Age Group and State: Estimated Numbers (in Thousands), Annual Averages Based on 2012 and 2013 NSDUHs
State 12+
(Estimate)
12+ (95% Confidence
Interval) 12-17
(Estimate)
12-17 (95% Confidence
Interval) 18-25
(Estimate)
18-25 (95% Confidence
Interval) 26+
(Estimate)
26+ (95% Confidence
Interval) 18+
(Estimate)
18+ (95% Confidence
Interval)
Total U.S. 136,188 (134,680 - 137,688) 3,047 (2,946 - 3,151) 20,783 (20,531 - 21,034) 112,358 (110,923 - 113,782) 133,141 (131,655 - 134,617) Northeast 27,304 (26,809 - 27,794) 586 (553 - 621) 3,973 (3,895 - 4,050) 22,744 (22,263 - 23,219) 26,718 (26,225 - 27,205) Midwest 30,964 (30,514 - 31,416) 673 (641 - 706) 4,710 (4,640 - 4,779) 25,581 (25,142 - 26,018) 30,291 (29,842 - 30,739) South 46,833 (46,069 - 47,589) 1,087 (1,035 - 1,141) 7,277 (7,157 - 7,396) 38,470 (37,726 - 39,203) 45,747 (44,984 - 46,498) West 31,087 (30,451 - 31,726) 701 (654 - 750) 4,823 (4,719 - 4,925) 25,563 (24,944 - 26,184) 30,386 (29,752 - 31,021) Alabama 1,752 (1,620 - 1,886) 43 (36 - 51) 273 (253 - 294) 1,435 (1,309 - 1,563) 1,709 (1,577 - 1,841) Alaska 306 (287 - 325) 6 (5 - 8) 47 (43 - 50) 253 (235 - 271) 299 (281 - 318) Arizona 2,762 (2,579 - 2,945) 70 (59 - 82) 416 (386 - 444) 2,277 (2,103 - 2,448) 2,692 (2,510 - 2,872) Arkansas 1,007 (930 - 1,085) 26 (22 - 31) 176 (163 - 188) 805 (732 - 880) 981 (905 - 1,057) California 15,611 (15,076 - 16,145) 362 (324 - 403) 2,567 (2,476 - 2,656) 12,683 (12,161 - 13,202) 15,249 (14,716 - 15,781) Colorado 2,623 (2,492 - 2,754) 53 (44 - 62) 387 (367 - 407) 2,183 (2,055 - 2,305) 2,571 (2,438 - 2,697) Connecticut 1,846 (1,749 - 1,940) 41 (34 - 49) 250 (235 - 265) 1,555 (1,461 - 1,644) 1,805 (1,708 - 1,897) Delaware 424 (400 - 448) 8 (7 - 10) 63 (59 - 67) 353 (329 - 376) 416 (391 - 440) District of Columbia 357 (341 - 373) 4 (3 - 4) 70 (66 - 73) 284 (268 - 299) 353 (337 - 369) Florida 8,540 (8,259 - 8,818) 177 (160 - 196) 1,151 (1,110 - 1,192) 7,211 (6,934 - 7,486) 8,362 (8,082 - 8,640) Georgia 3,810 (3,533 - 4,090) 94 (79 - 111) 582 (538 - 624) 3,135 (2,868 - 3,400) 3,716 (3,439 - 3,992) Hawaii 568 (531 - 606) 11 (9 - 13) 80 (75 - 86) 477 (441 - 513) 557 (520 - 595) Idaho 625 (584 - 667) 16 (13 - 19) 86 (79 - 93) 523 (484 - 563) 609 (568 - 650) Illinois 5,935 (5,760 - 6,109) 129 (118 - 142) 891 (864 - 918) 4,915 (4,745 - 5,081) 5,806 (5,631 - 5,978) Indiana 2,794 (2,618 - 2,970) 65 (55 - 77) 461 (433 - 487) 2,268 (2,101 - 2,432) 2,729 (2,553 - 2,901) Iowa 1,470 (1,386 - 1,553) 30 (25 - 35) 236 (223 - 248) 1,204 (1,122 - 1,283) 1,440 (1,355 - 1,522) Kansas 1,253 (1,174 - 1,331) 27 (23 - 32) 191 (178 - 204) 1,035 (959 - 1,108) 1,226 (1,147 - 1,302) Kentucky 1,607 (1,497 - 1,720) 34 (28 - 41) 261 (243 - 279) 1,312 (1,205 - 1,419) 1,573 (1,463 - 1,684) Louisiana 1,825 (1,704 - 1,947) 48 (40 - 57) 292 (272 - 312) 1,485 (1,370 - 1,600) 1,777 (1,657 - 1,897) Maine 627 (588 - 665) 12 (10 - 14) 83 (78 - 87) 532 (495 - 569) 615 (576 - 652) Maryland 2,876 (2,714 - 3,034) 61 (52 - 72) 409 (385 - 433) 2,405 (2,249 - 2,555) 2,815 (2,653 - 2,971) Massachusetts 3,682 (3,511 - 3,846) 71 (61 - 83) 545 (516 - 572) 3,066 (2,902 - 3,219) 3,611 (3,439 - 3,772) Michigan 4,546 (4,410 - 4,680) 104 (95 - 114) 703 (682 - 723) 3,739 (3,607 - 3,870) 4,442 (4,307 - 4,575) Minnesota 2,642 (2,501 - 2,781) 51 (42 - 60) 370 (347 - 391) 2,222 (2,085 - 2,353) 2,591 (2,450 - 2,728) Mississippi 1,036 (957 - 1,117) 29 (24 - 34) 192 (179 - 205) 816 (740 - 893) 1,007 (929 - 1,087) Missouri 2,584 (2,425 - 2,741) 59 (49 - 69) 398 (373 - 422) 2,127 (1,976 - 2,276) 2,525 (2,367 - 2,681) Montana 506 (478 - 533) 10 (8 - 12) 73 (69 - 77) 423 (396 - 449) 496 (468 - 523)
(continued)

19
140909
Table 9 Alcohol Use in the Past Month, by Age Group and State: Estimated Numbers (in Thousands), Annual Averages Based on 2012 and 2013 NSDUHs (continued)
State 12+
(Estimate)
12+ (95% Confidence
Interval) 12-17
(Estimate)
12-17 (95% Confidence
Interval) 18-25
(Estimate)
18-25 (95% Confidence
Interval) 26+
(Estimate)
26+ (95% Confidence
Interval)18+
(Estimate)
18+ (95% Confidence
Interval)
Nebraska 855 (805 - 905) 17 (14 - 20) 131 (123 - 139) 707 (658 - 754) 838 (788 - 887) Nevada 1,255 (1,176 - 1,332) 28 (23 - 34) 168 (157 - 179) 1,058 (982 - 1,132) 1,226 (1,148 - 1,302) New Hampshire 740 (706 - 773) 15 (13 - 17) 103 (98 - 107) 623 (590 - 654) 725 (691 - 757) New Jersey 4,139 (3,878 - 4,395) 96 (81 - 114) 523 (487 - 557) 3,520 (3,266 - 3,764) 4,042 (3,781 - 4,296) New Mexico 858 (800 - 916) 20 (17 - 24) 129 (120 - 137) 709 (654 - 765) 838 (780 - 895) New York 9,340 (9,037 - 9,640) 209 (190 - 230) 1,427 (1,378 - 1,475) 7,704 (7,408 - 7,994) 9,131 (8,829 - 9,428) North Carolina 3,931 (3,658 - 4,203) 89 (75 - 106) 597 (555 - 638) 3,245 (2,985 - 3,503) 3,842 (3,571 - 4,110) North Dakota 346 (327 - 364) 6 (5 - 7) 68 (65 - 72) 272 (254 - 289) 340 (321 - 358) Ohio 5,199 (5,037 - 5,360) 111 (100 - 122) 777 (752 - 801) 4,312 (4,154 - 4,468) 5,089 (4,928 - 5,247) Oklahoma 1,482 (1,379 - 1,585) 31 (26 - 37) 242 (225 - 258) 1,210 (1,112 - 1,307) 1,451 (1,349 - 1,554) Oregon 1,917 (1,808 - 2,024) 37 (31 - 44) 255 (239 - 271) 1,624 (1,520 - 1,724) 1,880 (1,771 - 1,984) Pennsylvania 6,079 (5,899 - 6,257) 125 (113 - 137) 900 (873 - 928) 5,054 (4,878 - 5,227) 5,955 (5,775 - 6,132) Rhode Island 532 (503 - 561) 11 (9 - 13) 92 (86 - 97) 430 (402 - 456) 521 (492 - 549) South Carolina 1,947 (1,818 - 2,076) 42 (35 - 50) 314 (293 - 333) 1,591 (1,468 - 1,714) 1,905 (1,777 - 2,032) South Dakota 386 (366 - 406) 7 (6 - 8) 59 (56 - 63) 320 (300 - 339) 379 (359 - 399) Tennessee 2,079 (1,908 - 2,257) 50 (41 - 60) 333 (307 - 358) 1,697 (1,533 - 1,865) 2,029 (1,858 - 2,204) Texas 9,827 (9,497 - 10,158) 263 (236 - 292) 1,652 (1,594 - 1,711) 7,912 (7,592 - 8,231) 9,564 (9,236 - 9,892) Utah 700 (633 - 770) 22 (17 - 28) 127 (113 - 141) 552 (489 - 619) 679 (612 - 748) Vermont 319 (302 - 336) 7 (6 - 8) 51 (48 - 53) 261 (245 - 277) 312 (295 - 329) Virginia 3,734 (3,512 - 3,952) 74 (63 - 88) 571 (535 - 606) 3,088 (2,877 - 3,294) 3,660 (3,439 - 3,875) Washington 3,093 (2,916 - 3,269) 61 (52 - 72) 448 (420 - 475) 2,584 (2,414 - 2,751) 3,032 (2,855 - 3,205) West Virginia 601 (553 - 650) 15 (12 - 17) 99 (92 - 107) 487 (441 - 534) 586 (539 - 635) Wisconsin 2,955 (2,793 - 3,111) 68 (58 - 80) 426 (404 - 447) 2,461 (2,305 - 2,608) 2,887 (2,725 - 3,040) Wyoming 262 (246 - 277) 5 (4 - 7) 41 (38 - 43) 216 (201 - 230) 256 (241 - 271)
NOTE: State and census region estimates, along with the 95 percent Bayesian confidence (credible) intervals, are based on a survey-weighted hierarchical Bayes estimation approach and generated by Markov Chain Monte Carlo techniques. For the "Total U.S." row, design-based (direct) estimates and corresponding 95 percent confidence intervals are given.
Source: SAMHSA, Center for Behavioral Health Statistics and Quality, National Survey on Drug Use and Health, 2012 and 2013.

20
140909
Table 10 Binge Alcohol Use in the Past Month, by Age Group and State: Estimated Numbers (in Thousands), Annual Averages Based on 2012 and 2013 NSDUHs
State 12+
(Estimate)
12+ (95% Confidence
Interval) 12-17
(Estimate)
12-17 (95% Confidence
Interval) 18-25
(Estimate)
18-25 (95% Confidence
Interval) 26+
(Estimate)
26+ (95% Confidence
Interval) 18+
(Estimate)
18+ (95% Confidence
Interval)
Total U.S. 59,876 (58,746 - 61,019) 1,678 (1,604 - 1,754) 13,424 (13,164 - 13,687) 44,774 (43,713 - 45,851) 58,199 (57,077 - 59,332) Northeast 11,496 (11,102 - 11,900) 312 (288 - 337) 2,645 (2,564 - 2,727) 8,539 (8,164 - 8,926) 11,184 (10,790 - 11,588) Midwest 14,321 (13,931 - 14,718) 372 (350 - 396) 3,182 (3,105 - 3,259) 10,767 (10,396 - 11,145) 13,949 (13,559 - 14,344) South 20,792 (20,190 - 21,405) 601 (563 - 642) 4,529 (4,401 - 4,659) 15,662 (15,097 - 16,240) 20,191 (19,592 - 20,800) West 13,267 (12,752 - 13,798) 392 (360 - 428) 3,069 (2,957 - 3,182) 9,806 (9,324 - 10,308) 12,875 (12,363 - 13,402) Alabama 860 (766 - 963) 25 (20 - 31) 170 (152 - 189) 665 (577 - 763) 835 (741 - 937) Alaska 128 (114 - 143) 3 (3 - 4) 30 (27 - 33) 94 (82 - 108) 124 (110 - 139) Arizona 1,242 (1,106 - 1,389) 37 (30 - 46) 275 (246 - 304) 930 (805 - 1,069) 1,205 (1,069 - 1,351) Arkansas 511 (454 - 572) 16 (13 - 20) 114 (103 - 126) 381 (328 - 440) 495 (438 - 557) California 6,684 (6,280 - 7,107) 198 (173 - 227) 1,591 (1,503 - 1,680) 4,895 (4,513 - 5,300) 6,486 (6,084 - 6,908) Colorado 1,097 (987 - 1,215) 28 (23 - 35) 248 (227 - 271) 821 (719 - 932) 1,069 (958 - 1,186) Connecticut 728 (653 - 809) 22 (17 - 27) 167 (152 - 183) 539 (469 - 616) 706 (632 - 787) Delaware 172 (153 - 193) 4 (3 - 5) 42 (38 - 46) 127 (109 - 146) 168 (149 - 189) District of Columbia 185 (169 - 201) 2 (1 - 2) 47 (43 - 51) 137 (122 - 152) 183 (168 - 200) Florida 3,424 (3,202 - 3,656) 88 (77 - 101) 687 (649 - 726) 2,648 (2,436 - 2,874) 3,336 (3,114 - 3,568) Georgia 1,598 (1,407 - 1,809) 53 (43 - 66) 337 (300 - 377) 1,207 (1,032 - 1,405) 1,545 (1,354 - 1,754) Hawaii 261 (233 - 291) 6 (5 - 8) 55 (50 - 61) 200 (174 - 229) 255 (227 - 285) Idaho 254 (225 - 286) 10 (8 - 12) 56 (49 - 62) 189 (162 - 218) 244 (216 - 276) Illinois 2,845 (2,684 - 3,012) 71 (62 - 81) 615 (587 - 644) 2,158 (2,005 - 2,318) 2,773 (2,613 - 2,940) Indiana 1,206 (1,080 - 1,342) 38 (31 - 47) 300 (274 - 327) 868 (751 - 997) 1,168 (1,042 - 1,304) Iowa 672 (605 - 744) 18 (14 - 22) 168 (155 - 182) 486 (424 - 555) 655 (587 - 726) Kansas 582 (520 - 650) 17 (14 - 20) 126 (114 - 139) 439 (382 - 502) 566 (503 - 633) Kentucky 798 (715 - 887) 21 (17 - 26) 185 (168 - 202) 592 (515 - 677) 777 (695 - 865) Louisiana 955 (859 - 1,058) 27 (22 - 34) 187 (168 - 206) 741 (652 - 837) 928 (833 - 1,030) Maine 247 (221 - 276) 7 (5 - 8) 56 (51 - 61) 185 (160 - 213) 241 (214 - 269) Maryland 1,138 (1,015 - 1,271) 31 (25 - 38) 249 (225 - 273) 858 (744 - 984) 1,107 (984 - 1,239) Massachusetts 1,470 (1,330 - 1,619) 40 (33 - 49) 358 (328 - 388) 1,072 (943 - 1,213) 1,430 (1,290 - 1,579) Michigan 2,027 (1,914 - 2,144) 52 (46 - 59) 462 (440 - 484) 1,514 (1,406 - 1,626) 1,975 (1,863 - 2,092) Minnesota 1,216 (1,099 - 1,341) 28 (22 - 34) 260 (238 - 282) 929 (819 - 1,047) 1,188 (1,071 - 1,312) Mississippi 482 (424 - 544) 16 (13 - 20) 112 (100 - 125) 353 (300 - 413) 466 (409 - 528) Missouri 1,218 (1,089 - 1,356) 35 (29 - 43) 267 (242 - 292) 916 (795 - 1,048) 1,183 (1,055 - 1,320) Montana 214 (192 - 237) 5 (4 - 7) 49 (45 - 53) 160 (140 - 182) 209 (187 - 232)
(continued)
21
140909
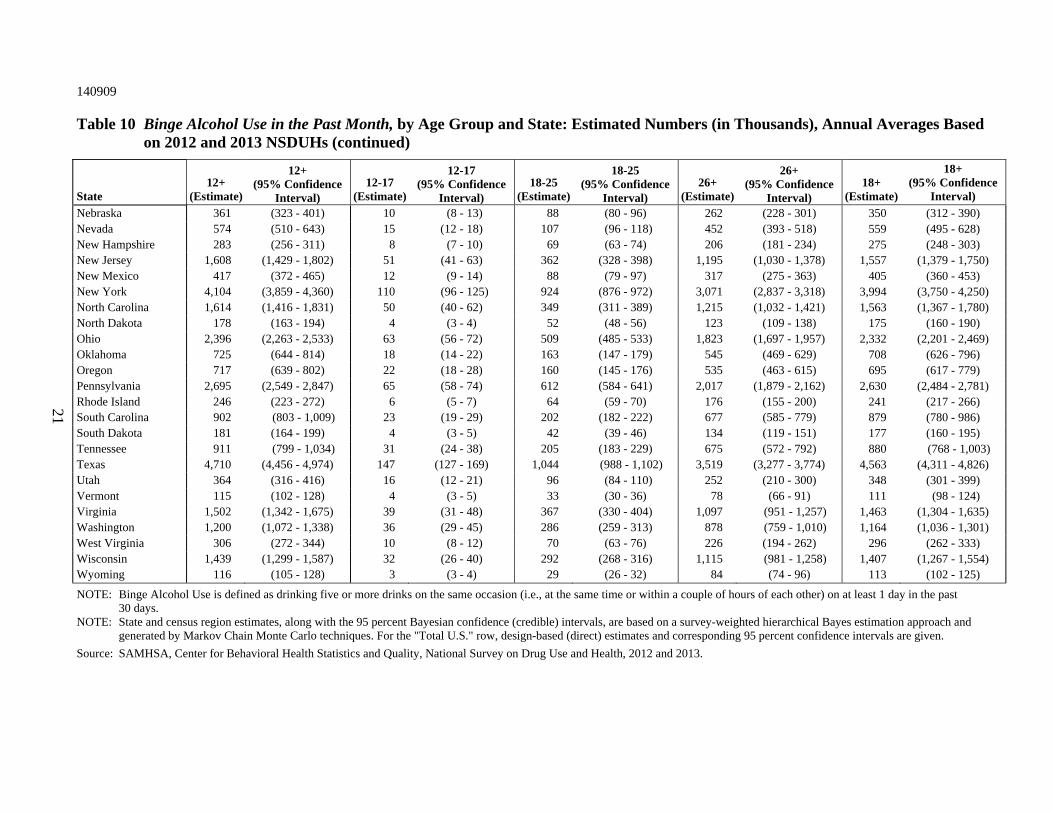
Table 10 Binge Alcohol Use in the Past Month, by Age Group and State: Estimated Numbers (in Thousands), Annual Averages Based on 2012 and 2013 NSDUHs (continued)
State 12+
(Estimate)
12+ (95% Confidence
Interval) 12-17
(Estimate)
12-17 (95% Confidence
Interval) 18-25
(Estimate)
18-25 (95% Confidence
Interval) 26+
(Estimate)
26+ (95% Confidence
Interval)18+
(Estimate)
18+ (95% Confidence
Interval)
Nebraska 361 (323 - 401) 10 (8 - 13) 88 (80 - 96) 262 (228 - 301) 350 (312 - 390) Nevada 574 (510 - 643) 15 (12 - 18) 107 (96 - 118) 452 (393 - 518) 559 (495 - 628) New Hampshire 283 (256 - 311) 8 (7 - 10) 69 (63 - 74) 206 (181 - 234) 275 (248 - 303) New Jersey 1,608 (1,429 - 1,802) 51 (41 - 63) 362 (328 - 398) 1,195 (1,030 - 1,378) 1,557 (1,379 - 1,750) New Mexico 417 (372 - 465) 12 (9 - 14) 88 (79 - 97) 317 (275 - 363) 405 (360 - 453) New York 4,104 (3,859 - 4,360) 110 (96 - 125) 924 (876 - 972) 3,071 (2,837 - 3,318) 3,994 (3,750 - 4,250) North Carolina 1,614 (1,416 - 1,831) 50 (40 - 62) 349 (311 - 389) 1,215 (1,032 - 1,421) 1,563 (1,367 - 1,780) North Dakota 178 (163 - 194) 4 (3 - 4) 52 (48 - 56) 123 (109 - 138) 175 (160 - 190) Ohio 2,396 (2,263 - 2,533) 63 (56 - 72) 509 (485 - 533) 1,823 (1,697 - 1,957) 2,332 (2,201 - 2,469) Oklahoma 725 (644 - 814) 18 (14 - 22) 163 (147 - 179) 545 (469 - 629) 708 (626 - 796) Oregon 717 (639 - 802) 22 (18 - 28) 160 (145 - 176) 535 (463 - 615) 695 (617 - 779) Pennsylvania 2,695 (2,549 - 2,847) 65 (58 - 74) 612 (584 - 641) 2,017 (1,879 - 2,162) 2,630 (2,484 - 2,781) Rhode Island 246 (223 - 272) 6 (5 - 7) 64 (59 - 70) 176 (155 - 200) 241 (217 - 266) South Carolina 902 (803 - 1,009) 23 (19 - 29) 202 (182 - 222) 677 (585 - 779) 879 (780 - 986) South Dakota 181 (164 - 199) 4 (3 - 5) 42 (39 - 46) 134 (119 - 151) 177 (160 - 195) Tennessee 911 (799 - 1,034) 31 (24 - 38) 205 (183 - 229) 675 (572 - 792) 880 (768 - 1,003) Texas 4,710 (4,456 - 4,974) 147 (127 - 169) 1,044 (988 - 1,102) 3,519 (3,277 - 3,774) 4,563 (4,311 - 4,826) Utah 364 (316 - 416) 16 (12 - 21) 96 (84 - 110) 252 (210 - 300) 348 (301 - 399) Vermont 115 (102 - 128) 4 (3 - 5) 33 (30 - 36) 78 (66 - 91) 111 (98 - 124) Virginia 1,502 (1,342 - 1,675) 39 (31 - 48) 367 (330 - 404) 1,097 (951 - 1,257) 1,463 (1,304 - 1,635) Washington 1,200 (1,072 - 1,338) 36 (29 - 45) 286 (259 - 313) 878 (759 - 1,010) 1,164 (1,036 - 1,301) West Virginia 306 (272 - 344) 10 (8 - 12) 70 (63 - 76) 226 (194 - 262) 296 (262 - 333) Wisconsin 1,439 (1,299 - 1,587) 32 (26 - 40) 292 (268 - 316) 1,115 (981 - 1,258) 1,407 (1,267 - 1,554) Wyoming 116 (105 - 128) 3 (3 - 4) 29 (26 - 32) 84 (74 - 96) 113 (102 - 125)
NOTE: Binge Alcohol Use is defined as drinking five or more drinks on the same occasion (i.e., at the same time or within a couple of hours of each other) on at least 1 day in the past 30 days.
NOTE: State and census region estimates, along with the 95 percent Bayesian confidence (credible) intervals, are based on a survey-weighted hierarchical Bayes estimation approach and generated by Markov Chain Monte Carlo techniques. For the "Total U.S." row, design-based (direct) estimates and corresponding 95 percent confidence intervals are given.
Source: SAMHSA, Center for Behavioral Health Statistics and Quality, National Survey on Drug Use and Health, 2012 and 2013.
22
140909
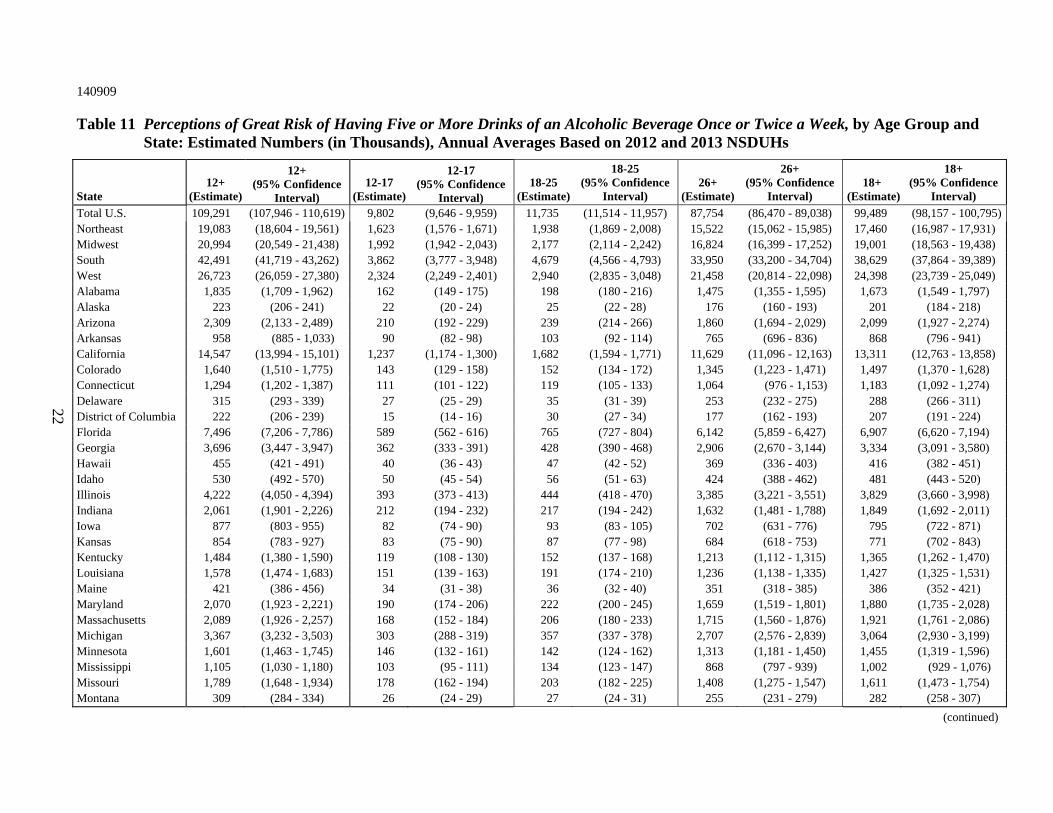
Table 11 Perceptions of Great Risk of Having Five or More Drinks of an Alcoholic Beverage Once or Twice a Week, by Age Group and State: Estimated Numbers (in Thousands), Annual Averages Based on 2012 and 2013 NSDUHs
State 12+
(Estimate)
12+ (95% Confidence
Interval) 12-17
(Estimate)
12-17 (95% Confidence
Interval) 18-25
(Estimate)
18-25 (95% Confidence
Interval) 26+
(Estimate)
26+ (95% Confidence
Interval) 18+
(Estimate)
18+ (95% Confidence
Interval)
Total U.S. 109,291 (107,946 - 110,619) 9,802 (9,646 - 9,959) 11,735 (11,514 - 11,957) 87,754 (86,470 - 89,038) 99,489 (98,157 - 100,795) Northeast 19,083 (18,604 - 19,561) 1,623 (1,576 - 1,671) 1,938 (1,869 - 2,008) 15,522 (15,062 - 15,985) 17,460 (16,987 - 17,931) Midwest 20,994 (20,549 - 21,438) 1,992 (1,942 - 2,043) 2,177 (2,114 - 2,242) 16,824 (16,399 - 17,252) 19,001 (18,563 - 19,438) South 42,491 (41,719 - 43,262) 3,862 (3,777 - 3,948) 4,679 (4,566 - 4,793) 33,950 (33,200 - 34,704) 38,629 (37,864 - 39,389) West 26,723 (26,059 - 27,380) 2,324 (2,249 - 2,401) 2,940 (2,835 - 3,048) 21,458 (20,814 - 22,098) 24,398 (23,739 - 25,049) Alabama 1,835 (1,709 - 1,962) 162 (149 - 175) 198 (180 - 216) 1,475 (1,355 - 1,595) 1,673 (1,549 - 1,797) Alaska 223 (206 - 241) 22 (20 - 24) 25 (22 - 28) 176 (160 - 193) 201 (184 - 218) Arizona 2,309 (2,133 - 2,489) 210 (192 - 229) 239 (214 - 266) 1,860 (1,694 - 2,029) 2,099 (1,927 - 2,274) Arkansas 958 (885 - 1,033) 90 (82 - 98) 103 (92 - 114) 765 (696 - 836) 868 (796 - 941) California 14,547 (13,994 - 15,101) 1,237 (1,174 - 1,300) 1,682 (1,594 - 1,771) 11,629 (11,096 - 12,163) 13,311 (12,763 - 13,858) Colorado 1,640 (1,510 - 1,775) 143 (129 - 158) 152 (134 - 172) 1,345 (1,223 - 1,471) 1,497 (1,370 - 1,628) Connecticut 1,294 (1,202 - 1,387) 111 (101 - 122) 119 (105 - 133) 1,064 (976 - 1,153) 1,183 (1,092 - 1,274) Delaware 315 (293 - 339) 27 (25 - 29) 35 (31 - 39) 253 (232 - 275) 288 (266 - 311) District of Columbia 222 (206 - 239) 15 (14 - 16) 30 (27 - 34) 177 (162 - 193) 207 (191 - 224) Florida 7,496 (7,206 - 7,786) 589 (562 - 616) 765 (727 - 804) 6,142 (5,859 - 6,427) 6,907 (6,620 - 7,194) Georgia 3,696 (3,447 - 3,947) 362 (333 - 391) 428 (390 - 468) 2,906 (2,670 - 3,144) 3,334 (3,091 - 3,580) Hawaii 455 (421 - 491) 40 (36 - 43) 47 (42 - 52) 369 (336 - 403) 416 (382 - 451) Idaho 530 (492 - 570) 50 (45 - 54) 56 (51 - 63) 424 (388 - 462) 481 (443 - 520) Illinois 4,222 (4,050 - 4,394) 393 (373 - 413) 444 (418 - 470) 3,385 (3,221 - 3,551) 3,829 (3,660 - 3,998) Indiana 2,061 (1,901 - 2,226) 212 (194 - 232) 217 (194 - 242) 1,632 (1,481 - 1,788) 1,849 (1,692 - 2,011) Iowa 877 (803 - 955) 82 (74 - 90) 93 (83 - 105) 702 (631 - 776) 795 (722 - 871) Kansas 854 (783 - 927) 83 (75 - 90) 87 (77 - 98) 684 (618 - 753) 771 (702 - 843) Kentucky 1,484 (1,380 - 1,590) 119 (108 - 130) 152 (137 - 168) 1,213 (1,112 - 1,315) 1,365 (1,262 - 1,470) Louisiana 1,578 (1,474 - 1,683) 151 (139 - 163) 191 (174 - 210) 1,236 (1,138 - 1,335) 1,427 (1,325 - 1,531) Maine 421 (386 - 456) 34 (31 - 38) 36 (32 - 40) 351 (318 - 385) 386 (352 - 421) Maryland 2,070 (1,923 - 2,221) 190 (174 - 206) 222 (200 - 245) 1,659 (1,519 - 1,801) 1,880 (1,735 - 2,028) Massachusetts 2,089 (1,926 - 2,257) 168 (152 - 184) 206 (180 - 233) 1,715 (1,560 - 1,876) 1,921 (1,761 - 2,086) Michigan 3,367 (3,232 - 3,503) 303 (288 - 319) 357 (337 - 378) 2,707 (2,576 - 2,839) 3,064 (2,930 - 3,199) Minnesota 1,601 (1,463 - 1,745) 146 (132 - 161) 142 (124 - 162) 1,313 (1,181 - 1,450) 1,455 (1,319 - 1,596) Mississippi 1,105 (1,030 - 1,180) 103 (95 - 111) 134 (123 - 147) 868 (797 - 939) 1,002 (929 - 1,076) Missouri 1,789 (1,648 - 1,934) 178 (162 - 194) 203 (182 - 225) 1,408 (1,275 - 1,547) 1,611 (1,473 - 1,754) Montana 309 (284 - 334) 26 (24 - 29) 27 (24 - 31) 255 (231 - 279) 282 (258 - 307)
(continued)

23
140909
Table 11 Perceptions of Great Risk of Having Five or More Drinks of an Alcoholic Beverage Once or Twice a Week, by Age Group and State: Estimated Numbers (in Thousands), Annual Averages Based on 2012 and 2013 NSDUHs (continued)
State 12+
(Estimate)
12+ (95% Confidence
Interval) 12-17
(Estimate)
12-17 (95% Confidence
Interval) 18-25
(Estimate)
18-25 (95% Confidence
Interval) 26+
(Estimate)
26+ (95% Confidence
Interval)18+
(Estimate)
18+ (95% Confidence
Interval)
Nebraska 593 (548 - 639) 57 (52 - 62) 56 (50 - 63) 480 (437 - 523) 536 (493 - 581) Nevada 1,016 (942 - 1,091) 85 (78 - 93) 104 (94 - 115) 826 (757 - 897) 931 (858 - 1,004) New Hampshire 398 (366 - 431) 32 (29 - 36) 30 (26 - 34) 335 (305 - 367) 365 (334 - 398) New Jersey 3,192 (2,953 - 3,434) 268 (244 - 292) 298 (266 - 332) 2,626 (2,399 - 2,857) 2,924 (2,691 - 3,161) New Mexico 775 (723 - 828) 63 (57 - 69) 89 (81 - 98) 623 (573 - 672) 712 (661 - 764) New York 7,157 (6,863 - 7,452) 597 (568 - 626) 784 (740 - 829) 5,776 (5,493 - 6,062) 6,560 (6,270 - 6,851) North Carolina 3,416 (3,167 - 3,669) 312 (284 - 341) 385 (348 - 424) 2,719 (2,484 - 2,958) 3,104 (2,860 - 3,352) North Dakota 200 (183 - 217) 18 (16 - 19) 24 (21 - 28) 157 (142 - 174) 182 (166 - 199) Ohio 3,536 (3,387 - 3,686) 343 (327 - 359) 357 (335 - 379) 2,836 (2,692 - 2,984) 3,193 (3,045 - 3,342) Oklahoma 1,275 (1,182 - 1,369) 115 (105 - 125) 146 (132 - 162) 1,013 (925 - 1,103) 1,160 (1,068 - 1,253) Oregon 1,268 (1,169 - 1,370) 104 (94 - 115) 125 (111 - 140) 1,039 (946 - 1,135) 1,164 (1,066 - 1,264) Pennsylvania 3,993 (3,814 - 4,176) 370 (353 - 388) 410 (386 - 435) 3,213 (3,039 - 3,390) 3,623 (3,445 - 3,804) Rhode Island 335 (308 - 362) 29 (26 - 32) 37 (33 - 41) 269 (244 - 295) 306 (279 - 333) South Carolina 1,711 (1,591 - 1,833) 152 (140 - 165) 174 (157 - 193) 1,385 (1,270 - 1,501) 1,559 (1,441 - 1,679) South Dakota 243 (223 - 263) 24 (22 - 26) 25 (22 - 29) 194 (175 - 213) 219 (200 - 239) Tennessee 2,491 (2,321 - 2,662) 213 (196 - 231) 267 (243 - 292) 2,010 (1,847 - 2,175) 2,278 (2,110 - 2,447) Texas 9,412 (9,067 - 9,756) 952 (906 - 999) 1,098 (1,041 - 1,156) 7,361 (7,030 - 7,695) 8,459 (8,119 - 8,799) Utah 1,012 (947 - 1,078) 126 (115 - 137) 141 (128 - 154) 746 (685 - 807) 886 (823 - 950) Vermont 205 (189 - 222) 14 (12 - 15) 19 (17 - 21) 173 (157 - 189) 192 (175 - 208) Virginia 2,772 (2,565 - 2,982) 262 (240 - 284) 286 (254 - 320) 2,224 (2,030 - 2,423) 2,510 (2,307 - 2,717) Washington 2,463 (2,289 - 2,639) 203 (185 - 221) 234 (209 - 261) 2,026 (1,860 - 2,194) 2,260 (2,089 - 2,434) West Virginia 658 (611 - 705) 50 (46 - 54) 62 (56 - 69) 546 (501 - 591) 608 (561 - 655) Wisconsin 1,652 (1,509 - 1,802) 154 (139 - 170) 171 (152 - 191) 1,327 (1,191 - 1,471) 1,498 (1,357 - 1,646) Wyoming 174 (160 - 188) 16 (14 - 17) 18 (16 - 20) 141 (128 - 154) 159 (145 - 172)
NOTE: State and census region estimates, along with the 95 percent Bayesian confidence (credible) intervals, are based on a survey-weighted hierarchical Bayes estimation approach and generated by Markov Chain Monte Carlo techniques. For the "Total U.S." row, design-based (direct) estimates and corresponding 95 percent confidence intervals are given.
Source: SAMHSA, Center for Behavioral Health Statistics and Quality, National Survey on Drug Use and Health, 2012 and 2013.

24
140909
Table 12 Alcohol Use and Binge Alcohol Use in the Past Month among Individuals Aged 12 to 20, by State: Estimated Numbers (in Thousands), Annual Averages Based on 2012 and 2013 NSDUHs
State Alcohol Use in Past Month (Estimate)
Alcohol Use in Past Month (95% Confidence Interval)
Binge Alcohol Use in Past Month (Estimate)
Binge Alcohol Use in Past Month (95% Confidence Interval)
Total U.S. 8,973 (8,732 - 9,218) 5,626 (5,424 - 5,834) Northeast 1,738 (1,678 - 1,799) 1,083 (1,034 - 1,134) Midwest 2,020 (1,962 - 2,081) 1,302 (1,256 - 1,350) South 3,015 (2,917 - 3,115) 1,875 (1,801 - 1,953) West 2,200 (2,108 - 2,293) 1,365 (1,296 - 1,437) Alabama 113 (100 - 127) 71 (61 - 82) Alaska 19 (17 - 22) 12 (10 - 14) Arizona 190 (170 - 212) 119 (103 - 137) Arkansas 70 (62 - 79) 48 (42 - 55) California 1,193 (1,119 - 1,269) 722 (665 - 783) Colorado 156 (141 - 172) 95 (83 - 108) Connecticut 123 (111 - 135) 77 (68 - 87) Delaware 25 (22 - 27) 15 (13 - 17) District of Columbia 19 (17 - 21) 11 (9 - 13) Florida 493 (464 - 523) 279 (256 - 302) Georgia 270 (238 - 304) 168 (145 - 194) Hawaii 29 (26 - 33) 18 (15 - 21) Idaho 40 (36 - 45) 26 (22 - 29) Illinois 376 (354 - 398) 241 (224 - 260) Indiana 193 (175 - 213) 123 (109 - 139) Iowa 89 (80 - 98) 60 (52 - 68) Kansas 85 (76 - 95) 57 (50 - 64) Kentucky 103 (92 - 116) 74 (65 - 83) Louisiana 124 (110 - 138) 81 (71 - 93) Maine 35 (31 - 39) 23 (20 - 26) Maryland 150 (134 - 167) 87 (76 - 99) Massachusetts 214 (194 - 234) 133 (117 - 151) Michigan 321 (303 - 339) 198 (184 - 213) Minnesota 150 (134 - 166) 97 (85 - 111) Mississippi 84 (75 - 93) 49 (42 - 57) Missouri 162 (146 - 180) 108 (95 - 123) Montana 35 (32 - 38) 22 (20 - 25)
(continued)

25
140909
Table 12 Alcohol Use and Binge Alcohol Use in the Past Month among Individuals Aged 12 to 20, by State: Estimated Numbers (in Thousands), Annual Averages Based on 2012 and 2013 NSDUHs (continued)
State Alcohol Use in Past Month (Estimate)
Alcohol Use in Past Month (95% Confidence Interval)
Binge Alcohol Use in Past Month (Estimate)
Binge Alcohol Use in Past Month (95% Confidence Interval)
Nebraska 56 (51 - 62) 38 (33 - 43) Nevada 81 (72 - 91) 48 (42 - 55) New Hampshire 63 (59 - 68) 41 (37 - 45) New Jersey 242 (216 - 270) 153 (134 - 174) New Mexico 53 (47 - 59) 35 (31 - 40) New York 608 (573 - 645) 360 (332 - 389) North Carolina 205 (180 - 232) 128 (109 - 149) North Dakota 27 (25 - 30) 20 (18 - 22) Ohio 345 (326 - 365) 220 (204 - 237) Oklahoma 110 (97 - 123) 75 (65 - 85) Oregon 116 (104 - 129) 78 (68 - 88) Pennsylvania 388 (368 - 409) 254 (237 - 272) Rhode Island 43 (40 - 47) 28 (25 - 32) South Carolina 118 (106 - 132) 74 (64 - 85) South Dakota 25 (22 - 28) 18 (16 - 21) Tennessee 126 (111 - 143) 86 (74 - 100) Texas 745 (699 - 793) 458 (422 - 496) Utah 59 (50 - 70) 46 (38 - 54) Vermont 21 (19 - 23) 14 (12 - 16) Virginia 213 (189 - 238) 135 (117 - 155) Washington 208 (187 - 231) 132 (116 - 150) West Virginia 49 (44 - 55) 38 (34 - 43) Wisconsin 191 (174 - 210) 122 (108 - 137) Wyoming 18 (16 - 20) 13 (11 - 14)
NOTE: Binge Alcohol Use is defined as drinking five or more drinks on the same occasion (i.e., at the same time or within a couple hours of each other) on at least 1 day in the past 30 days.
NOTE: State and census region estimates, along with the 95 percent Bayesian confidence (credible) intervals, are based on a survey-weighted hierarchical Bayes estimation approach and generated by Markov Chain Monte Carlo techniques. For the "Total U.S." row, design-based (direct) estimates and corresponding 95 percent confidence intervals are given.
Source: SAMHSA, Center for Behavioral Health Statistics and Quality, National Survey on Drug Use and Health, 2012 and 2013.
26
140909
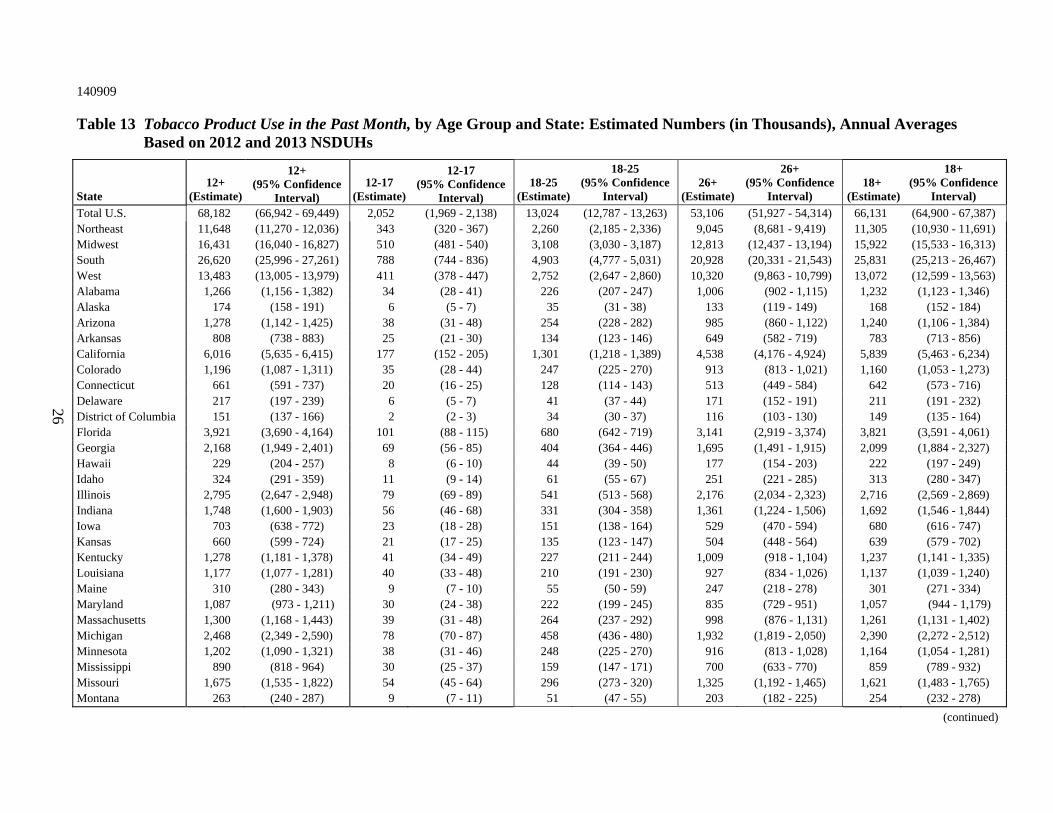
Table 13 Tobacco Product Use in the Past Month, by Age Group and State: Estimated Numbers (in Thousands), Annual Averages Based on 2012 and 2013 NSDUHs
State 12+
(Estimate)
12+ (95% Confidence
Interval) 12-17
(Estimate)
12-17 (95% Confidence
Interval) 18-25
(Estimate)
18-25 (95% Confidence
Interval) 26+
(Estimate)
26+ (95% Confidence
Interval) 18+
(Estimate)
18+ (95% Confidence
Interval)
Total U.S. 68,182 (66,942 - 69,449) 2,052 (1,969 - 2,138) 13,024 (12,787 - 13,263) 53,106 (51,927 - 54,314) 66,131 (64,900 - 67,387) Northeast 11,648 (11,270 - 12,036) 343 (320 - 367) 2,260 (2,185 - 2,336) 9,045 (8,681 - 9,419) 11,305 (10,930 - 11,691) Midwest 16,431 (16,040 - 16,827) 510 (481 - 540) 3,108 (3,030 - 3,187) 12,813 (12,437 - 13,194) 15,922 (15,533 - 16,313) South 26,620 (25,996 - 27,261) 788 (744 - 836) 4,903 (4,777 - 5,031) 20,928 (20,331 - 21,543) 25,831 (25,213 - 26,467) West 13,483 (13,005 - 13,979) 411 (378 - 447) 2,752 (2,647 - 2,860) 10,320 (9,863 - 10,799) 13,072 (12,599 - 13,563) Alabama 1,266 (1,156 - 1,382) 34 (28 - 41) 226 (207 - 247) 1,006 (902 - 1,115) 1,232 (1,123 - 1,346) Alaska 174 (158 - 191) 6 (5 - 7) 35 (31 - 38) 133 (119 - 149) 168 (152 - 184) Arizona 1,278 (1,142 - 1,425) 38 (31 - 48) 254 (228 - 282) 985 (860 - 1,122) 1,240 (1,106 - 1,384) Arkansas 808 (738 - 883) 25 (21 - 30) 134 (123 - 146) 649 (582 - 719) 783 (713 - 856) California 6,016 (5,635 - 6,415) 177 (152 - 205) 1,301 (1,218 - 1,389) 4,538 (4,176 - 4,924) 5,839 (5,463 - 6,234) Colorado 1,196 (1,087 - 1,311) 35 (28 - 44) 247 (225 - 270) 913 (813 - 1,021) 1,160 (1,053 - 1,273) Connecticut 661 (591 - 737) 20 (16 - 25) 128 (114 - 143) 513 (449 - 584) 642 (573 - 716) Delaware 217 (197 - 239) 6 (5 - 7) 41 (37 - 44) 171 (152 - 191) 211 (191 - 232) District of Columbia 151 (137 - 166) 2 (2 - 3) 34 (30 - 37) 116 (103 - 130) 149 (135 - 164) Florida 3,921 (3,690 - 4,164) 101 (88 - 115) 680 (642 - 719) 3,141 (2,919 - 3,374) 3,821 (3,591 - 4,061) Georgia 2,168 (1,949 - 2,401) 69 (56 - 85) 404 (364 - 446) 1,695 (1,491 - 1,915) 2,099 (1,884 - 2,327) Hawaii 229 (204 - 257) 8 (6 - 10) 44 (39 - 50) 177 (154 - 203) 222 (197 - 249) Idaho 324 (291 - 359) 11 (9 - 14) 61 (55 - 67) 251 (221 - 285) 313 (280 - 347) Illinois 2,795 (2,647 - 2,948) 79 (69 - 89) 541 (513 - 568) 2,176 (2,034 - 2,323) 2,716 (2,569 - 2,869) Indiana 1,748 (1,600 - 1,903) 56 (46 - 68) 331 (304 - 358) 1,361 (1,224 - 1,506) 1,692 (1,546 - 1,844) Iowa 703 (638 - 772) 23 (18 - 28) 151 (138 - 164) 529 (470 - 594) 680 (616 - 747) Kansas 660 (599 - 724) 21 (17 - 25) 135 (123 - 147) 504 (448 - 564) 639 (579 - 702) Kentucky 1,278 (1,181 - 1,378) 41 (34 - 49) 227 (211 - 244) 1,009 (918 - 1,104) 1,237 (1,141 - 1,335) Louisiana 1,177 (1,077 - 1,281) 40 (33 - 48) 210 (191 - 230) 927 (834 - 1,026) 1,137 (1,039 - 1,240) Maine 310 (280 - 343) 9 (7 - 10) 55 (50 - 59) 247 (218 - 278) 301 (271 - 334) Maryland 1,087 (973 - 1,211) 30 (24 - 38) 222 (199 - 245) 835 (729 - 951) 1,057 (944 - 1,179) Massachusetts 1,300 (1,168 - 1,443) 39 (31 - 48) 264 (237 - 292) 998 (876 - 1,131) 1,261 (1,131 - 1,402) Michigan 2,468 (2,349 - 2,590) 78 (70 - 87) 458 (436 - 480) 1,932 (1,819 - 2,050) 2,390 (2,272 - 2,512) Minnesota 1,202 (1,090 - 1,321) 38 (31 - 46) 248 (225 - 270) 916 (813 - 1,028) 1,164 (1,054 - 1,281) Mississippi 890 (818 - 964) 30 (25 - 37) 159 (147 - 171) 700 (633 - 770) 859 (789 - 932) Missouri 1,675 (1,535 - 1,822) 54 (45 - 64) 296 (273 - 320) 1,325 (1,192 - 1,465) 1,621 (1,483 - 1,765) Montana 263 (240 - 287) 9 (7 - 11) 51 (47 - 55) 203 (182 - 225) 254 (232 - 278)
(continued)
27
140909
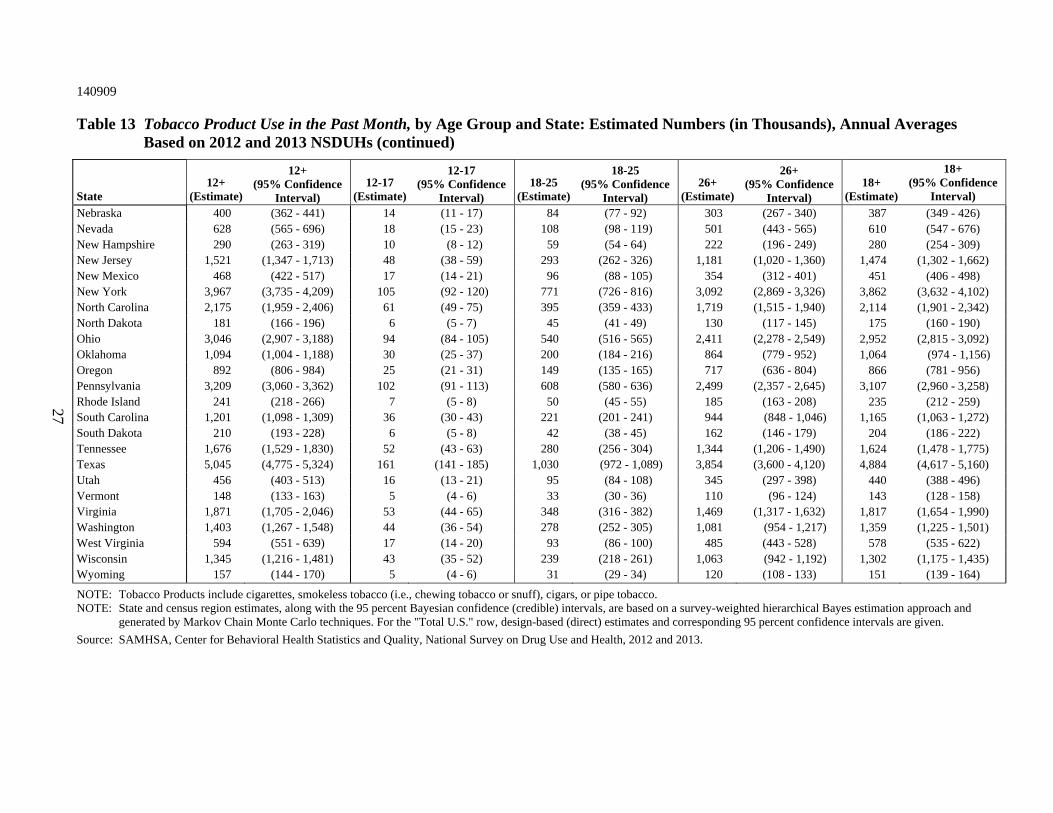
Table 13 Tobacco Product Use in the Past Month, by Age Group and State: Estimated Numbers (in Thousands), Annual Averages Based on 2012 and 2013 NSDUHs (continued)
State 12+
(Estimate)
12+ (95% Confidence
Interval) 12-17
(Estimate)
12-17 (95% Confidence
Interval) 18-25
(Estimate)
18-25 (95% Confidence
Interval) 26+
(Estimate)
26+ (95% Confidence
Interval)18+
(Estimate)
18+ (95% Confidence
Interval)
Nebraska 400 (362 - 441) 14 (11 - 17) 84 (77 - 92) 303 (267 - 340) 387 (349 - 426) Nevada 628 (565 - 696) 18 (15 - 23) 108 (98 - 119) 501 (443 - 565) 610 (547 - 676) New Hampshire 290 (263 - 319) 10 (8 - 12) 59 (54 - 64) 222 (196 - 249) 280 (254 - 309) New Jersey 1,521 (1,347 - 1,713) 48 (38 - 59) 293 (262 - 326) 1,181 (1,020 - 1,360) 1,474 (1,302 - 1,662) New Mexico 468 (422 - 517) 17 (14 - 21) 96 (88 - 105) 354 (312 - 401) 451 (406 - 498) New York 3,967 (3,735 - 4,209) 105 (92 - 120) 771 (726 - 816) 3,092 (2,869 - 3,326) 3,862 (3,632 - 4,102) North Carolina 2,175 (1,959 - 2,406) 61 (49 - 75) 395 (359 - 433) 1,719 (1,515 - 1,940) 2,114 (1,901 - 2,342) North Dakota 181 (166 - 196) 6 (5 - 7) 45 (41 - 49) 130 (117 - 145) 175 (160 - 190) Ohio 3,046 (2,907 - 3,188) 94 (84 - 105) 540 (516 - 565) 2,411 (2,278 - 2,549) 2,952 (2,815 - 3,092) Oklahoma 1,094 (1,004 - 1,188) 30 (25 - 37) 200 (184 - 216) 864 (779 - 952) 1,064 (974 - 1,156) Oregon 892 (806 - 984) 25 (21 - 31) 149 (135 - 165) 717 (636 - 804) 866 (781 - 956) Pennsylvania 3,209 (3,060 - 3,362) 102 (91 - 113) 608 (580 - 636) 2,499 (2,357 - 2,645) 3,107 (2,960 - 3,258) Rhode Island 241 (218 - 266) 7 (5 - 8) 50 (45 - 55) 185 (163 - 208) 235 (212 - 259) South Carolina 1,201 (1,098 - 1,309) 36 (30 - 43) 221 (201 - 241) 944 (848 - 1,046) 1,165 (1,063 - 1,272) South Dakota 210 (193 - 228) 6 (5 - 8) 42 (38 - 45) 162 (146 - 179) 204 (186 - 222) Tennessee 1,676 (1,529 - 1,830) 52 (43 - 63) 280 (256 - 304) 1,344 (1,206 - 1,490) 1,624 (1,478 - 1,775) Texas 5,045 (4,775 - 5,324) 161 (141 - 185) 1,030 (972 - 1,089) 3,854 (3,600 - 4,120) 4,884 (4,617 - 5,160) Utah 456 (403 - 513) 16 (13 - 21) 95 (84 - 108) 345 (297 - 398) 440 (388 - 496) Vermont 148 (133 - 163) 5 (4 - 6) 33 (30 - 36) 110 (96 - 124) 143 (128 - 158) Virginia 1,871 (1,705 - 2,046) 53 (44 - 65) 348 (316 - 382) 1,469 (1,317 - 1,632) 1,817 (1,654 - 1,990) Washington 1,403 (1,267 - 1,548) 44 (36 - 54) 278 (252 - 305) 1,081 (954 - 1,217) 1,359 (1,225 - 1,501) West Virginia 594 (551 - 639) 17 (14 - 20) 93 (86 - 100) 485 (443 - 528) 578 (535 - 622) Wisconsin 1,345 (1,216 - 1,481) 43 (35 - 52) 239 (218 - 261) 1,063 (942 - 1,192) 1,302 (1,175 - 1,435) Wyoming 157 (144 - 170) 5 (4 - 6) 31 (29 - 34) 120 (108 - 133) 151 (139 - 164)
NOTE: Tobacco Products include cigarettes, smokeless tobacco (i.e., chewing tobacco or snuff), cigars, or pipe tobacco. NOTE: State and census region estimates, along with the 95 percent Bayesian confidence (credible) intervals, are based on a survey-weighted hierarchical Bayes estimation approach and
generated by Markov Chain Monte Carlo techniques. For the "Total U.S." row, design-based (direct) estimates and corresponding 95 percent confidence intervals are given.
Source: SAMHSA, Center for Behavioral Health Statistics and Quality, National Survey on Drug Use and Health, 2012 and 2013.
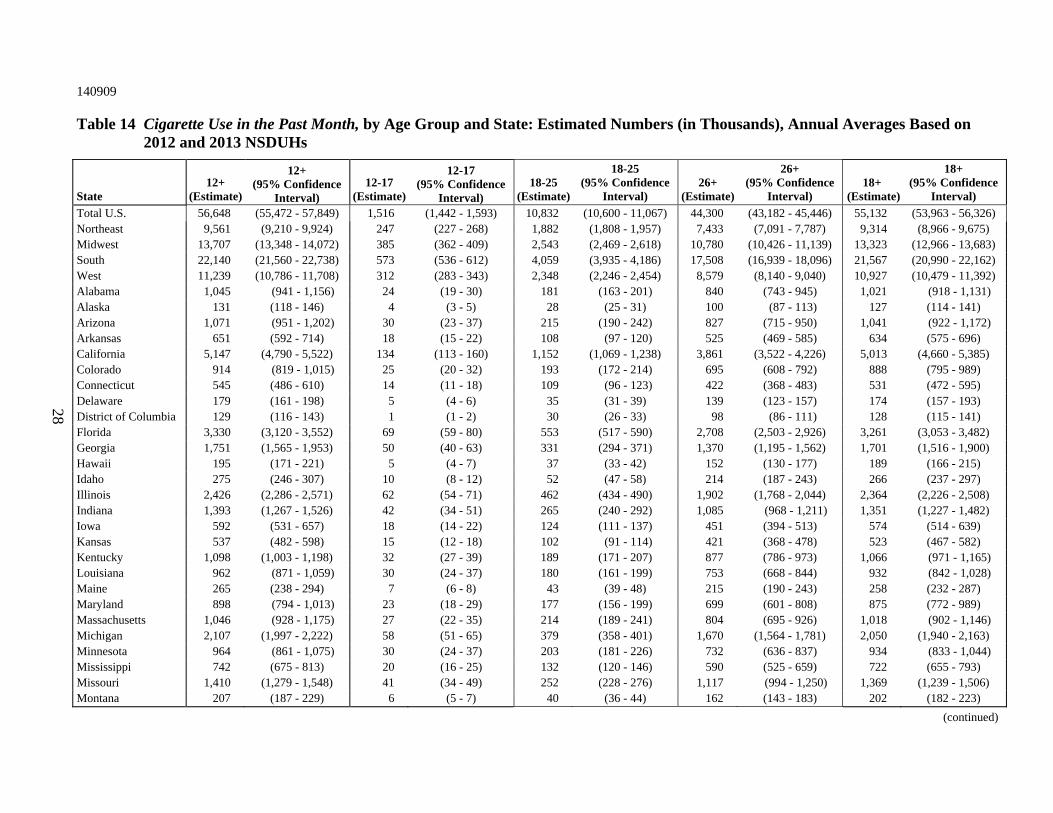
28
140909
Table 14 Cigarette Use in the Past Month, by Age Group and State: Estimated Numbers (in Thousands), Annual Averages Based on 2012 and 2013 NSDUHs
State 12+
(Estimate)
12+ (95% Confidence
Interval) 12-17
(Estimate)
12-17 (95% Confidence
Interval) 18-25
(Estimate)
18-25 (95% Confidence
Interval) 26+
(Estimate)
26+ (95% Confidence
Interval) 18+
(Estimate)
18+ (95% Confidence
Interval)
Total U.S. 56,648 (55,472 - 57,849) 1,516 (1,442 - 1,593) 10,832 (10,600 - 11,067) 44,300 (43,182 - 45,446) 55,132 (53,963 - 56,326) Northeast 9,561 (9,210 - 9,924) 247 (227 - 268) 1,882 (1,808 - 1,957) 7,433 (7,091 - 7,787) 9,314 (8,966 - 9,675) Midwest 13,707 (13,348 - 14,072) 385 (362 - 409) 2,543 (2,469 - 2,618) 10,780 (10,426 - 11,139) 13,323 (12,966 - 13,683) South 22,140 (21,560 - 22,738) 573 (536 - 612) 4,059 (3,935 - 4,186) 17,508 (16,939 - 18,096) 21,567 (20,990 - 22,162) West 11,239 (10,786 - 11,708) 312 (283 - 343) 2,348 (2,246 - 2,454) 8,579 (8,140 - 9,040) 10,927 (10,479 - 11,392) Alabama 1,045 (941 - 1,156) 24 (19 - 30) 181 (163 - 201) 840 (743 - 945) 1,021 (918 - 1,131) Alaska 131 (118 - 146) 4 (3 - 5) 28 (25 - 31) 100 (87 - 113) 127 (114 - 141) Arizona 1,071 (951 - 1,202) 30 (23 - 37) 215 (190 - 242) 827 (715 - 950) 1,041 (922 - 1,172) Arkansas 651 (592 - 714) 18 (15 - 22) 108 (97 - 120) 525 (469 - 585) 634 (575 - 696) California 5,147 (4,790 - 5,522) 134 (113 - 160) 1,152 (1,069 - 1,238) 3,861 (3,522 - 4,226) 5,013 (4,660 - 5,385) Colorado 914 (819 - 1,015) 25 (20 - 32) 193 (172 - 214) 695 (608 - 792) 888 (795 - 989) Connecticut 545 (486 - 610) 14 (11 - 18) 109 (96 - 123) 422 (368 - 483) 531 (472 - 595) Delaware 179 (161 - 198) 5 (4 - 6) 35 (31 - 39) 139 (123 - 157) 174 (157 - 193) District of Columbia 129 (116 - 143) 1 (1 - 2) 30 (26 - 33) 98 (86 - 111) 128 (115 - 141) Florida 3,330 (3,120 - 3,552) 69 (59 - 80) 553 (517 - 590) 2,708 (2,503 - 2,926) 3,261 (3,053 - 3,482) Georgia 1,751 (1,565 - 1,953) 50 (40 - 63) 331 (294 - 371) 1,370 (1,195 - 1,562) 1,701 (1,516 - 1,900) Hawaii 195 (171 - 221) 5 (4 - 7) 37 (33 - 42) 152 (130 - 177) 189 (166 - 215) Idaho 275 (246 - 307) 10 (8 - 12) 52 (47 - 58) 214 (187 - 243) 266 (237 - 297) Illinois 2,426 (2,286 - 2,571) 62 (54 - 71) 462 (434 - 490) 1,902 (1,768 - 2,044) 2,364 (2,226 - 2,508) Indiana 1,393 (1,267 - 1,526) 42 (34 - 51) 265 (240 - 292) 1,085 (968 - 1,211) 1,351 (1,227 - 1,482) Iowa 592 (531 - 657) 18 (14 - 22) 124 (111 - 137) 451 (394 - 513) 574 (514 - 639) Kansas 537 (482 - 598) 15 (12 - 18) 102 (91 - 114) 421 (368 - 478) 523 (467 - 582) Kentucky 1,098 (1,003 - 1,198) 32 (27 - 39) 189 (171 - 207) 877 (786 - 973) 1,066 (971 - 1,165) Louisiana 962 (871 - 1,059) 30 (24 - 37) 180 (161 - 199) 753 (668 - 844) 932 (842 - 1,028) Maine 265 (238 - 294) 7 (6 - 8) 43 (39 - 48) 215 (190 - 243) 258 (232 - 287) Maryland 898 (794 - 1,013) 23 (18 - 29) 177 (156 - 199) 699 (601 - 808) 875 (772 - 989) Massachusetts 1,046 (928 - 1,175) 27 (22 - 35) 214 (189 - 241) 804 (695 - 926) 1,018 (902 - 1,146) Michigan 2,107 (1,997 - 2,222) 58 (51 - 65) 379 (358 - 401) 1,670 (1,564 - 1,781) 2,050 (1,940 - 2,163) Minnesota 964 (861 - 1,075) 30 (24 - 37) 203 (181 - 226) 732 (636 - 837) 934 (833 - 1,044) Mississippi 742 (675 - 813) 20 (16 - 25) 132 (120 - 146) 590 (525 - 659) 722 (655 - 793) Missouri 1,410 (1,279 - 1,548) 41 (34 - 49) 252 (228 - 276) 1,117 (994 - 1,250) 1,369 (1,239 - 1,506) Montana 207 (187 - 229) 6 (5 - 7) 40 (36 - 44) 162 (143 - 183) 202 (182 - 223)
(continued)

29
140909
Table 14 Cigarette Use in the Past Month, by Age Group and State: Estimated Numbers (in Thousands), Annual Averages Based on 2012 and 2013 NSDUHs (continued)
State 12+
(Estimate)
12+ (95% Confidence
Interval) 12-17
(Estimate)
12-17 (95% Confidence
Interval) 18-25
(Estimate)
18-25 (95% Confidence
Interval) 26+
(Estimate)
26+ (95% Confidence
Interval)18+
(Estimate)
18+ (95% Confidence
Interval)
Nebraska 333 (298 - 372) 10 (8 - 12) 63 (56 - 71) 260 (227 - 297) 323 (288 - 362) Nevada 554 (494 - 619) 13 (11 - 17) 94 (84 - 105) 447 (391 - 508) 541 (481 - 605) New Hampshire 228 (203 - 254) 7 (6 - 9) 47 (42 - 52) 173 (151 - 199) 220 (196 - 247) New Jersey 1,277 (1,124 - 1,448) 36 (28 - 46) 252 (222 - 283) 990 (846 - 1,152) 1,241 (1,089 - 1,410) New Mexico 389 (348 - 433) 12 (10 - 16) 80 (72 - 89) 296 (258 - 339) 376 (336 - 420) New York 3,302 (3,092 - 3,523) 74 (64 - 86) 651 (608 - 696) 2,577 (2,375 - 2,792) 3,228 (3,020 - 3,447) North Carolina 1,855 (1,663 - 2,062) 47 (38 - 59) 332 (296 - 371) 1,475 (1,294 - 1,673) 1,808 (1,617 - 2,013) North Dakota 147 (133 - 161) 4 (3 - 5) 34 (30 - 37) 109 (96 - 123) 143 (129 - 157) Ohio 2,556 (2,428 - 2,688) 68 (60 - 77) 434 (409 - 459) 2,054 (1,931 - 2,183) 2,488 (2,361 - 2,619) Oklahoma 911 (827 - 999) 20 (16 - 25) 161 (145 - 178) 729 (650 - 814) 891 (808 - 978) Oregon 699 (625 - 780) 18 (14 - 23) 121 (106 - 136) 561 (491 - 637) 681 (608 - 761) Pennsylvania 2,597 (2,457 - 2,744) 72 (64 - 82) 501 (474 - 529) 2,024 (1,890 - 2,165) 2,525 (2,386 - 2,670) Rhode Island 184 (164 - 206) 5 (4 - 6) 40 (36 - 45) 140 (121 - 160) 180 (160 - 201) South Carolina 1,023 (927 - 1,125) 26 (21 - 32) 185 (166 - 206) 811 (721 - 908) 996 (902 - 1,097) South Dakota 177 (161 - 194) 5 (4 - 6) 34 (30 - 37) 138 (123 - 154) 172 (156 - 189) Tennessee 1,359 (1,235 - 1,492) 39 (32 - 47) 228 (205 - 252) 1,093 (974 - 1,221) 1,321 (1,197 - 1,452) Texas 4,196 (3,931 - 4,472) 119 (101 - 140) 881 (824 - 939) 3,196 (2,945 - 3,464) 4,077 (3,815 - 4,351) Utah 392 (345 - 443) 15 (11 - 19) 87 (75 - 99) 291 (248 - 339) 377 (331 - 428) Vermont 116 (105 - 128) 4 (3 - 4) 26 (23 - 28) 87 (76 - 98) 113 (101 - 125) Virginia 1,531 (1,375 - 1,699) 38 (30 - 48) 284 (251 - 319) 1,209 (1,066 - 1,365) 1,493 (1,338 - 1,659) Washington 1,144 (1,025 - 1,273) 35 (28 - 44) 226 (202 - 253) 882 (772 - 1,003) 1,108 (991 - 1,236) West Virginia 480 (439 - 524) 12 (10 - 14) 73 (66 - 80) 396 (357 - 438) 468 (428 - 511) Wisconsin 1,066 (958 - 1,182) 33 (27 - 41) 192 (172 - 214) 840 (738 - 952) 1,032 (925 - 1,148) Wyoming 121 (110 - 132) 4 (3 - 5) 24 (21 - 26) 93 (83 - 104) 117 (106 - 128)
NOTE: State and census region estimates, along with the 95 percent Bayesian confidence (credible) intervals, are based on a survey-weighted hierarchical Bayes estimation approach and generated by Markov Chain Monte Carlo techniques. For the "Total U.S." row, design-based (direct) estimates and corresponding 95 percent confidence intervals are given.
Source: SAMHSA, Center for Behavioral Health Statistics and Quality, National Survey on Drug Use and Health, 2012 and 2013.

30
140909
Table 15 Perceptions of Great Risk of Smoking One or More Packs of Cigarettes per Day, by Age Group and State: Estimated Numbers (in Thousands), Annual Averages Based on 2012 and 2013 NSDUHs
State 12+
(Estimate)
12+ (95% Confidence
Interval) 12-17
(Estimate)
12-17 (95% Confidence
Interval) 18-25
(Estimate)
18-25 (95% Confidence
Interval) 26+
(Estimate)
26+ (95% Confidence
Interval) 18+
(Estimate)
18+ (95% Confidence
Interval)
Total U.S. 186,092 (184,890 - 187,288) 16,183 (16,030 - 16,335) 23,006 (22,796 - 23,215) 146,903 (145,734 - 148,045) 169,909 (168,709 - 171,078) Northeast 34,656 (34,267 - 35,038) 2,772 (2,726 - 2,818) 4,183 (4,116 - 4,249) 27,701 (27,328 - 28,063) 31,884 (31,497 - 32,259) Midwest 38,037 (37,633 - 38,439) 3,472 (3,420 - 3,522) 4,636 (4,569 - 4,701) 29,930 (29,541 - 30,312) 34,565 (34,168 - 34,956) South 68,469 (67,827 - 69,105) 6,020 (5,936 - 6,103) 8,401 (8,292 - 8,510) 54,048 (53,430 - 54,651) 62,449 (61,811 - 63,071) West 44,930 (44,390 - 45,459) 3,920 (3,849 - 3,989) 5,786 (5,687 - 5,883) 35,224 (34,703 - 35,727) 41,010 (40,475 - 41,527) Alabama 2,748 (2,640 - 2,852) 236 (223 - 249) 333 (315 - 350) 2,179 (2,076 - 2,276) 2,512 (2,406 - 2,612) Alaska 379 (362 - 395) 36 (33 - 38) 49 (46 - 52) 295 (279 - 310) 343 (327 - 359) Arizona 3,800 (3,656 - 3,936) 332 (313 - 350) 469 (444 - 493) 2,998 (2,863 - 3,124) 3,468 (3,328 - 3,599) Arkansas 1,583 (1,514 - 1,649) 142 (133 - 150) 197 (187 - 207) 1,244 (1,179 - 1,306) 1,441 (1,374 - 1,505) California 24,049 (23,609 - 24,473) 2,089 (2,030 - 2,147) 3,237 (3,154 - 3,315) 18,723 (18,299 - 19,123) 21,960 (21,524 - 22,374) Colorado 3,137 (3,028 - 3,241) 268 (253 - 282) 376 (356 - 395) 2,493 (2,391 - 2,588) 2,869 (2,764 - 2,969) Connecticut 2,250 (2,174 - 2,322) 198 (188 - 207) 260 (247 - 272) 1,793 (1,720 - 1,860) 2,052 (1,978 - 2,122) Delaware 563 (544 - 582) 45 (42 - 47) 72 (68 - 75) 447 (428 - 464) 519 (499 - 537) District of Columbia 416 (403 - 428) 19 (17 - 20) 69 (66 - 72) 329 (316 - 340) 397 (384 - 410) Florida 12,382 (12,139 - 12,617) 976 (949 - 1,002) 1,373 (1,335 - 1,409) 10,034 (9,798 - 10,258) 11,406 (11,165 - 11,637) Georgia 5,816 (5,600 - 6,020) 536 (506 - 564) 739 (701 - 774) 4,541 (4,339 - 4,728) 5,280 (5,069 - 5,477) Hawaii 830 (800 - 857) 62 (58 - 65) 96 (91 - 101) 672 (644 - 698) 768 (739 - 795) Idaho 891 (858 - 923) 89 (84 - 94) 112 (106 - 117) 691 (659 - 720) 802 (770 - 833) Illinois 7,514 (7,355 - 7,668) 672 (651 - 692) 906 (879 - 932) 5,936 (5,785 - 6,082) 6,842 (6,686 - 6,992) Indiana 3,672 (3,527 - 3,811) 351 (332 - 370) 462 (437 - 485) 2,859 (2,721 - 2,989) 3,320 (3,178 - 3,456) Iowa 1,727 (1,655 - 1,797) 159 (151 - 167) 215 (203 - 227) 1,353 (1,285 - 1,417) 1,568 (1,497 - 1,635) Kansas 1,601 (1,540 - 1,659) 153 (146 - 161) 203 (191 - 214) 1,244 (1,187 - 1,298) 1,447 (1,388 - 1,504) Kentucky 2,266 (2,163 - 2,367) 204 (192 - 215) 263 (247 - 279) 1,799 (1,701 - 1,894) 2,063 (1,961 - 2,161) Louisiana 2,654 (2,554 - 2,748) 232 (219 - 244) 342 (324 - 358) 2,080 (1,988 - 2,167) 2,422 (2,325 - 2,514) Maine 780 (749 - 811) 61 (58 - 64) 79 (75 - 83) 640 (610 - 669) 719 (688 - 749) Maryland 3,660 (3,539 - 3,775) 302 (286 - 317) 424 (403 - 443) 2,935 (2,819 - 3,041) 3,358 (3,239 - 3,469) Massachusetts 4,112 (3,969 - 4,248) 321 (305 - 337) 526 (501 - 551) 3,265 (3,129 - 3,391) 3,791 (3,650 - 3,923) Michigan 5,655 (5,536 - 5,773) 517 (501 - 532) 695 (675 - 716) 4,443 (4,327 - 4,556) 5,139 (5,020 - 5,254) Minnesota 3,084 (2,961 - 3,203) 273 (258 - 287) 363 (344 - 382) 2,448 (2,330 - 2,558) 2,811 (2,690 - 2,926) Mississippi 1,586 (1,514 - 1,655) 147 (138 - 156) 212 (200 - 223) 1,227 (1,159 - 1,291) 1,439 (1,368 - 1,506) Missouri 3,293 (3,156 - 3,426) 289 (273 - 305) 392 (369 - 414) 2,612 (2,482 - 2,736) 3,004 (2,869 - 3,134) Montana 571 (548 - 594) 47 (44 - 49) 67 (63 - 71) 458 (436 - 479) 525 (502 - 547)
(continued)

31
140909
Table 15 Perceptions of Great Risk of Smoking One or More Packs of Cigarettes per Day, by Age Group and State: Estimated Numbers (in Thousands), Annual Averages Based on 2012 and 2013 NSDUHs (continued)
State 12+
(Estimate)
12+ (95% Confidence
Interval) 12-17
(Estimate)
12-17 (95% Confidence
Interval) 18-25
(Estimate)
18-25 (95% Confidence
Interval) 26+
(Estimate)
26+ (95% Confidence
Interval)18+
(Estimate)
18+ (95% Confidence
Interval)
Nebraska 1,015 (973 - 1,056) 97 (91 - 102) 129 (122 - 135) 790 (750 - 828) 919 (878 - 958) Nevada 1,602 (1,540 - 1,661) 143 (135 - 151) 188 (178 - 198) 1,271 (1,213 - 1,326) 1,459 (1,399 - 1,516) New Hampshire 818 (789 - 846) 67 (64 - 70) 95 (91 - 99) 656 (628 - 682) 751 (722 - 778) New Jersey 5,683 (5,497 - 5,856) 459 (435 - 483) 635 (605 - 663) 4,589 (4,413 - 4,749) 5,224 (5,042 - 5,390) New Mexico 1,235 (1,190 - 1,277) 106 (100 - 111) 149 (141 - 156) 980 (938 - 1,020) 1,129 (1,085 - 1,170) New York 12,568 (12,340 - 12,789) 989 (961 - 1,016) 1,567 (1,523 - 1,610) 10,012 (9,796 - 10,217) 11,579 (11,354 - 11,794) North Carolina 5,498 (5,262 - 5,723) 482 (454 - 510) 661 (625 - 695) 4,355 (4,130 - 4,565) 5,016 (4,784 - 5,235) North Dakota 385 (370 - 400) 32 (30 - 33) 58 (55 - 62) 295 (280 - 308) 353 (338 - 368) Ohio 6,341 (6,196 - 6,483) 592 (575 - 608) 758 (734 - 781) 4,991 (4,851 - 5,128) 5,749 (5,606 - 5,889) Oklahoma 2,032 (1,946 - 2,115) 187 (176 - 197) 259 (244 - 273) 1,586 (1,505 - 1,663) 1,845 (1,761 - 1,926) Oregon 2,346 (2,259 - 2,429) 185 (175 - 195) 272 (258 - 285) 1,889 (1,806 - 1,967) 2,161 (2,076 - 2,241) Pennsylvania 7,403 (7,242 - 7,560) 597 (579 - 616) 882 (857 - 907) 5,923 (5,767 - 6,074) 6,806 (6,646 - 6,961) Rhode Island 653 (630 - 674) 49 (46 - 51) 91 (86 - 95) 514 (492 - 534) 604 (582 - 625) South Carolina 2,744 (2,644 - 2,839) 227 (214 - 239) 332 (315 - 349) 2,185 (2,091 - 2,273) 2,517 (2,420 - 2,610) South Dakota 441 (422 - 459) 42 (40 - 44) 57 (54 - 60) 341 (324 - 358) 399 (380 - 416) Tennessee 3,648 (3,503 - 3,788) 320 (301 - 337) 442 (419 - 463) 2,887 (2,750 - 3,016) 3,329 (3,186 - 3,464) Texas 14,993 (14,686 - 15,293) 1,475 (1,430 - 1,519) 1,985 (1,930 - 2,039) 11,533 (11,241 - 11,813) 13,518 (13,217 - 13,809) Utah 1,627 (1,572 - 1,679) 191 (182 - 200) 258 (245 - 269) 1,177 (1,128 - 1,224) 1,435 (1,382 - 1,485) Vermont 387 (373 - 401) 30 (29 - 32) 48 (45 - 50) 310 (296 - 322) 357 (344 - 370) Virginia 4,888 (4,718 - 5,050) 412 (391 - 432) 589 (557 - 620) 3,887 (3,727 - 4,036) 4,476 (4,309 - 4,633) Washington 4,145 (4,005 - 4,280) 345 (326 - 362) 476 (451 - 500) 3,325 (3,192 - 3,449) 3,801 (3,663 - 3,931) West Virginia 992 (948 - 1,034) 81 (76 - 85) 111 (105 - 118) 800 (758 - 840) 911 (868 - 953) Wisconsin 3,308 (3,174 - 3,436) 295 (279 - 310) 397 (376 - 416) 2,616 (2,490 - 2,735) 3,013 (2,882 - 3,138) Wyoming 318 (306 - 330) 28 (26 - 29) 38 (36 - 41) 252 (241 - 263) 290 (278 - 302)
NOTE: State and census region estimates, along with the 95 percent Bayesian confidence (credible) intervals, are based on a survey-weighted hierarchical Bayes estimation approach and generated by Markov Chain Monte Carlo techniques. For the "Total U.S." row, design-based (direct) estimates and corresponding 95 percent confidence intervals are given.
Source: SAMHSA, Center for Behavioral Health Statistics and Quality, National Survey on Drug Use and Health, 2012 and 2013.
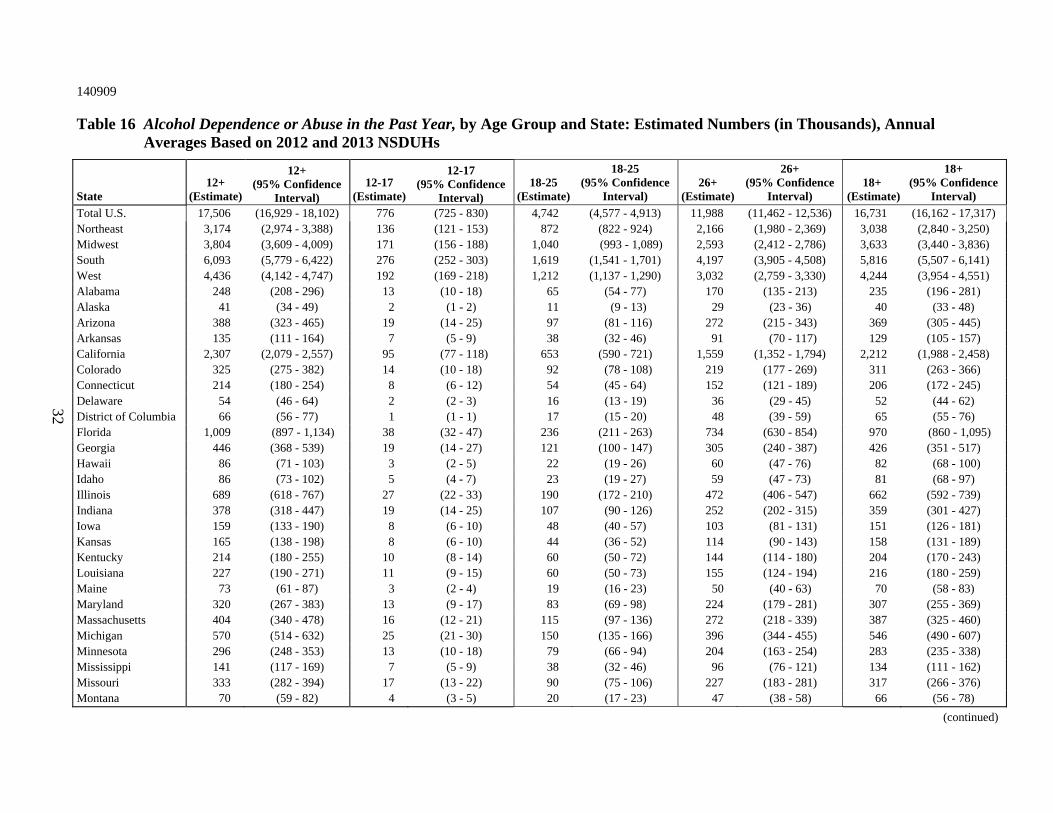
32
140909
Table 16 Alcohol Dependence or Abuse in the Past Year, by Age Group and State: Estimated Numbers (in Thousands), Annual Averages Based on 2012 and 2013 NSDUHs
State 12+
(Estimate)
12+ (95% Confidence
Interval) 12-17
(Estimate)
12-17 (95% Confidence
Interval) 18-25
(Estimate)
18-25 (95% Confidence
Interval) 26+
(Estimate)
26+ (95% Confidence
Interval) 18+
(Estimate)
18+ (95% Confidence
Interval)
Total U.S. 17,506 (16,929 - 18,102) 776 (725 - 830) 4,742 (4,577 - 4,913) 11,988 (11,462 - 12,536) 16,731 (16,162 - 17,317) Northeast 3,174 (2,974 - 3,388) 136 (121 - 153) 872 (822 - 924) 2,166 (1,980 - 2,369) 3,038 (2,840 - 3,250) Midwest 3,804 (3,609 - 4,009) 171 (156 - 188) 1,040 (993 - 1,089) 2,593 (2,412 - 2,786) 3,633 (3,440 - 3,836) South 6,093 (5,779 - 6,422) 276 (252 - 303) 1,619 (1,541 - 1,701) 4,197 (3,905 - 4,508) 5,816 (5,507 - 6,141) West 4,436 (4,142 - 4,747) 192 (169 - 218) 1,212 (1,137 - 1,290) 3,032 (2,759 - 3,330) 4,244 (3,954 - 4,551) Alabama 248 (208 - 296) 13 (10 - 18) 65 (54 - 77) 170 (135 - 213) 235 (196 - 281) Alaska 41 (34 - 49) 2 (1 - 2) 11 (9 - 13) 29 (23 - 36) 40 (33 - 48) Arizona 388 (323 - 465) 19 (14 - 25) 97 (81 - 116) 272 (215 - 343) 369 (305 - 445) Arkansas 135 (111 - 164) 7 (5 - 9) 38 (32 - 46) 91 (70 - 117) 129 (105 - 157) California 2,307 (2,079 - 2,557) 95 (77 - 118) 653 (590 - 721) 1,559 (1,352 - 1,794) 2,212 (1,988 - 2,458) Colorado 325 (275 - 382) 14 (10 - 18) 92 (78 - 108) 219 (177 - 269) 311 (263 - 366) Connecticut 214 (180 - 254) 8 (6 - 12) 54 (45 - 64) 152 (121 - 189) 206 (172 - 245) Delaware 54 (46 - 64) 2 (2 - 3) 16 (13 - 19) 36 (29 - 45) 52 (44 - 62) District of Columbia 66 (56 - 77) 1 (1 - 1) 17 (15 - 20) 48 (39 - 59) 65 (55 - 76) Florida 1,009 (897 - 1,134) 38 (32 - 47) 236 (211 - 263) 734 (630 - 854) 970 (860 - 1,095) Georgia 446 (368 - 539) 19 (14 - 27) 121 (100 - 147) 305 (240 - 387) 426 (351 - 517) Hawaii 86 (71 - 103) 3 (2 - 5) 22 (19 - 26) 60 (47 - 76) 82 (68 - 100) Idaho 86 (73 - 102) 5 (4 - 7) 23 (19 - 27) 59 (47 - 73) 81 (68 - 97) Illinois 689 (618 - 767) 27 (22 - 33) 190 (172 - 210) 472 (406 - 547) 662 (592 - 739) Indiana 378 (318 - 447) 19 (14 - 25) 107 (90 - 126) 252 (202 - 315) 359 (301 - 427) Iowa 159 (133 - 190) 8 (6 - 10) 48 (40 - 57) 103 (81 - 131) 151 (126 - 181) Kansas 165 (138 - 198) 8 (6 - 10) 44 (36 - 52) 114 (90 - 143) 158 (131 - 189) Kentucky 214 (180 - 255) 10 (8 - 14) 60 (50 - 72) 144 (114 - 180) 204 (170 - 243) Louisiana 227 (190 - 271) 11 (9 - 15) 60 (50 - 73) 155 (124 - 194) 216 (180 - 259) Maine 73 (61 - 87) 3 (2 - 4) 19 (16 - 23) 50 (40 - 63) 70 (58 - 83) Maryland 320 (267 - 383) 13 (9 - 17) 83 (69 - 98) 224 (179 - 281) 307 (255 - 369) Massachusetts 404 (340 - 478) 16 (12 - 21) 115 (97 - 136) 272 (218 - 339) 387 (325 - 460) Michigan 570 (514 - 632) 25 (21 - 30) 150 (135 - 166) 396 (344 - 455) 546 (490 - 607) Minnesota 296 (248 - 353) 13 (10 - 18) 79 (66 - 94) 204 (163 - 254) 283 (235 - 338) Mississippi 141 (117 - 169) 7 (5 - 9) 38 (32 - 46) 96 (76 - 121) 134 (111 - 162) Missouri 333 (282 - 394) 17 (13 - 22) 90 (75 - 106) 227 (183 - 281) 317 (266 - 376) Montana 70 (59 - 82) 4 (3 - 5) 20 (17 - 23) 47 (38 - 58) 66 (56 - 78)
(continued)
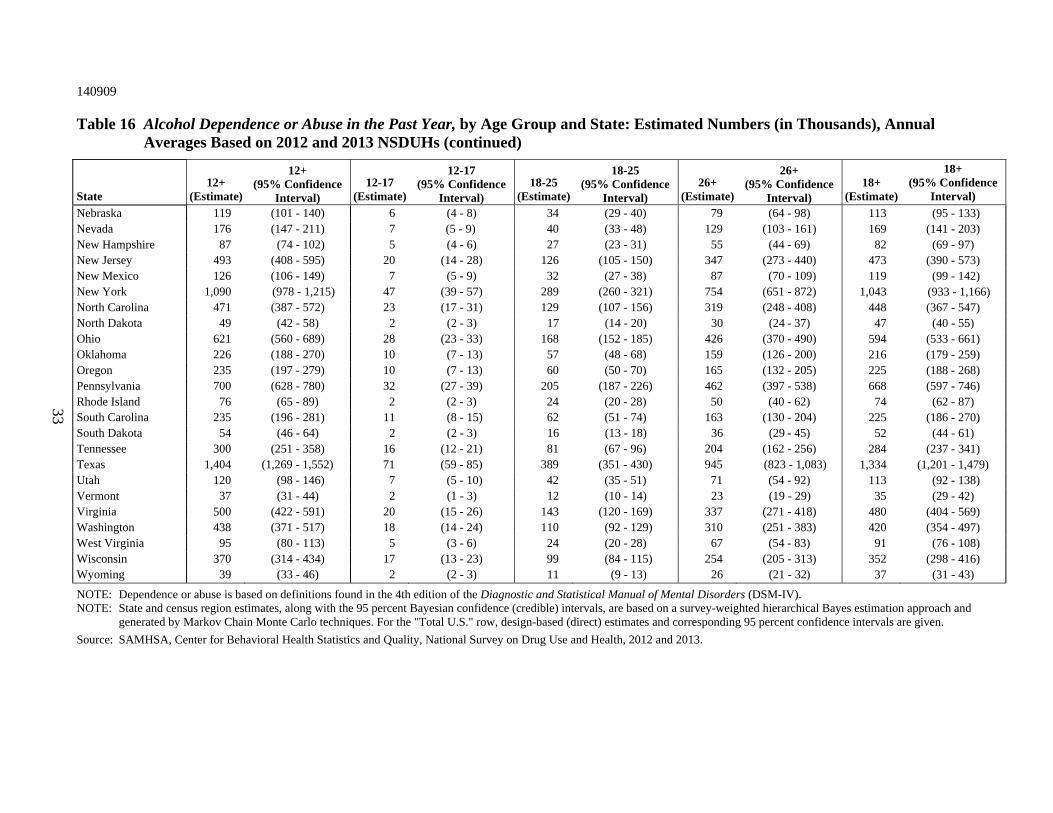
33
140909
Table 16 Alcohol Dependence or Abuse in the Past Year, by Age Group and State: Estimated Numbers (in Thousands), Annual Averages Based on 2012 and 2013 NSDUHs (continued)
State 12+
(Estimate)
12+ (95% Confidence
Interval) 12-17
(Estimate)
12-17 (95% Confidence
Interval) 18-25
(Estimate)
18-25 (95% Confidence
Interval) 26+
(Estimate)
26+ (95% Confidence
Interval)18+
(Estimate)
18+ (95% Confidence
Interval)
Nebraska 119 (101 - 140) 6 (4 - 8) 34 (29 - 40) 79 (64 - 98) 113 (95 - 133) Nevada 176 (147 - 211) 7 (5 - 9) 40 (33 - 48) 129 (103 - 161) 169 (141 - 203) New Hampshire 87 (74 - 102) 5 (4 - 6) 27 (23 - 31) 55 (44 - 69) 82 (69 - 97) New Jersey 493 (408 - 595) 20 (14 - 28) 126 (105 - 150) 347 (273 - 440) 473 (390 - 573) New Mexico 126 (106 - 149) 7 (5 - 9) 32 (27 - 38) 87 (70 - 109) 119 (99 - 142) New York 1,090 (978 - 1,215) 47 (39 - 57) 289 (260 - 321) 754 (651 - 872) 1,043 (933 - 1,166) North Carolina 471 (387 - 572) 23 (17 - 31) 129 (107 - 156) 319 (248 - 408) 448 (367 - 547) North Dakota 49 (42 - 58) 2 (2 - 3) 17 (14 - 20) 30 (24 - 37) 47 (40 - 55) Ohio 621 (560 - 689) 28 (23 - 33) 168 (152 - 185) 426 (370 - 490) 594 (533 - 661) Oklahoma 226 (188 - 270) 10 (7 - 13) 57 (48 - 68) 159 (126 - 200) 216 (179 - 259) Oregon 235 (197 - 279) 10 (7 - 13) 60 (50 - 70) 165 (132 - 205) 225 (188 - 268) Pennsylvania 700 (628 - 780) 32 (27 - 39) 205 (187 - 226) 462 (397 - 538) 668 (597 - 746) Rhode Island 76 (65 - 89) 2 (2 - 3) 24 (20 - 28) 50 (40 - 62) 74 (62 - 87) South Carolina 235 (196 - 281) 11 (8 - 15) 62 (51 - 74) 163 (130 - 204) 225 (186 - 270) South Dakota 54 (46 - 64) 2 (2 - 3) 16 (13 - 18) 36 (29 - 45) 52 (44 - 61) Tennessee 300 (251 - 358) 16 (12 - 21) 81 (67 - 96) 204 (162 - 256) 284 (237 - 341) Texas 1,404 (1,269 - 1,552) 71 (59 - 85) 389 (351 - 430) 945 (823 - 1,083) 1,334 (1,201 - 1,479) Utah 120 (98 - 146) 7 (5 - 10) 42 (35 - 51) 71 (54 - 92) 113 (92 - 138) Vermont 37 (31 - 44) 2 (1 - 3) 12 (10 - 14) 23 (19 - 29) 35 (29 - 42) Virginia 500 (422 - 591) 20 (15 - 26) 143 (120 - 169) 337 (271 - 418) 480 (404 - 569) Washington 438 (371 - 517) 18 (14 - 24) 110 (92 - 129) 310 (251 - 383) 420 (354 - 497) West Virginia 95 (80 - 113) 5 (3 - 6) 24 (20 - 28) 67 (54 - 83) 91 (76 - 108) Wisconsin 370 (314 - 434) 17 (13 - 23) 99 (84 - 115) 254 (205 - 313) 352 (298 - 416) Wyoming 39 (33 - 46) 2 (2 - 3) 11 (9 - 13) 26 (21 - 32) 37 (31 - 43)
NOTE: Dependence or abuse is based on definitions found in the 4th edition of the Diagnostic and Statistical Manual of Mental Disorders (DSM-IV). NOTE: State and census region estimates, along with the 95 percent Bayesian confidence (credible) intervals, are based on a survey-weighted hierarchical Bayes estimation approach and
generated by Markov Chain Monte Carlo techniques. For the "Total U.S." row, design-based (direct) estimates and corresponding 95 percent confidence intervals are given.
Source: SAMHSA, Center for Behavioral Health Statistics and Quality, National Survey on Drug Use and Health, 2012 and 2013.

34
140909
Table 17 Alcohol Dependence in the Past Year, by Age Group and State: Estimated Numbers (in Thousands), Annual Averages Based on 2012 and 2013 NSDUHs
State 12+
(Estimate)
12+ (95% Confidence
Interval) 12-17
(Estimate)
12-17 (95% Confidence
Interval) 18-25
(Estimate)
18-25 (95% Confidence
Interval) 26+
(Estimate)
26+ (95% Confidence
Interval) 18+
(Estimate)
18+ (95% Confidence
Interval)
Total U.S. 8,312 (7,916 - 8,728) 286 (256 - 320) 2,001 (1,897 - 2,111) 6,025 (5,644 - 6,431) 8,026 (7,634 - 8,438) Northeast 1,459 (1,335 - 1,594) 49 (42 - 57) 365 (331 - 403) 1,045 (931 - 1,171) 1,410 (1,287 - 1,544) Midwest 1,783 (1,660 - 1,916) 62 (53 - 71) 422 (392 - 453) 1,300 (1,185 - 1,425) 1,722 (1,599 - 1,853) South 2,955 (2,749 - 3,175) 102 (88 - 117) 676 (628 - 727) 2,177 (1,985 - 2,387) 2,853 (2,649 - 3,072) West 2,116 (1,929 - 2,319) 74 (61 - 89) 538 (487 - 595) 1,503 (1,333 - 1,695) 2,042 (1,857 - 2,243) Alabama 132 (104 - 167) 5 (3 - 7) 27 (21 - 35) 100 (75 - 133) 127 (99 - 162) Alaska 19 (15 - 24) 1 (0 - 1) 5 (4 - 7) 13 (10 - 17) 18 (14 - 23) Arizona 186 (146 - 236) 7 (5 - 11) 42 (33 - 55) 136 (101 - 183) 179 (139 - 228) Arkansas 72 (56 - 91) 2 (2 - 4) 17 (13 - 22) 52 (39 - 70) 69 (54 - 88) California 1,118 (970 - 1,289) 37 (28 - 49) 296 (255 - 344) 785 (650 - 947) 1,081 (935 - 1,250) Colorado 151 (120 - 188) 5 (3 - 7) 36 (28 - 47) 109 (83 - 144) 146 (116 - 183) Connecticut 98 (75 - 127) 3 (2 - 4) 22 (16 - 30) 73 (53 - 99) 95 (73 - 123) Delaware 25 (20 - 32) 1 (0 - 1) 7 (5 - 9) 18 (13 - 24) 25 (19 - 31) District of Columbia 28 (23 - 35) 0 (0 - 1) 8 (6 - 11) 19 (15 - 26) 28 (22 - 35) Florida 479 (406 - 565) 15 (11 - 20) 89 (75 - 105) 376 (307 - 459) 464 (392 - 549) Georgia 221 (171 - 286) 8 (5 - 12) 52 (40 - 69) 161 (118 - 220) 214 (164 - 277) Hawaii 44 (34 - 57) 2 (1 - 3) 12 (9 - 15) 31 (22 - 43) 43 (33 - 56) Idaho 38 (30 - 49) 2 (1 - 2) 9 (7 - 12) 28 (21 - 37) 37 (29 - 47) Illinois 326 (279 - 380) 11 (8 - 14) 79 (67 - 92) 236 (194 - 288) 315 (269 - 369) Indiana 169 (134 - 213) 7 (5 - 10) 44 (34 - 56) 119 (88 - 159) 162 (128 - 206) Iowa 77 (61 - 98) 3 (2 - 4) 20 (15 - 26) 55 (40 - 73) 74 (58 - 95) Kansas 80 (63 - 101) 3 (2 - 4) 18 (13 - 24) 59 (44 - 79) 77 (60 - 98) Kentucky 112 (88 - 142) 4 (3 - 6) 25 (19 - 32) 83 (62 - 111) 108 (84 - 137) Louisiana 116 (92 - 146) 4 (3 - 5) 29 (22 - 37) 83 (62 - 111) 112 (88 - 142) Maine 38 (30 - 49) 1 (1 - 2) 8 (6 - 10) 30 (22 - 40) 37 (29 - 48) Maryland 147 (116 - 186) 5 (3 - 7) 37 (29 - 48) 105 (78 - 141) 142 (112 - 181) Massachusetts 173 (137 - 217) 5 (4 - 8) 48 (37 - 62) 119 (89 - 160) 167 (132 - 211) Michigan 275 (237 - 318) 10 (7 - 12) 65 (55 - 76) 200 (166 - 241) 265 (228 - 308) Minnesota 137 (107 - 176) 4 (3 - 7) 32 (24 - 42) 101 (75 - 137) 133 (103 - 171) Mississippi 72 (57 - 92) 2 (2 - 4) 17 (13 - 22) 53 (40 - 72) 70 (55 - 89) Missouri 156 (123 - 198) 5 (4 - 8) 35 (27 - 46) 116 (86 - 154) 151 (119 - 192) Montana 32 (26 - 41) 1 (1 - 2) 8 (6 - 10) 23 (17 - 31) 31 (25 - 40)
(continued)
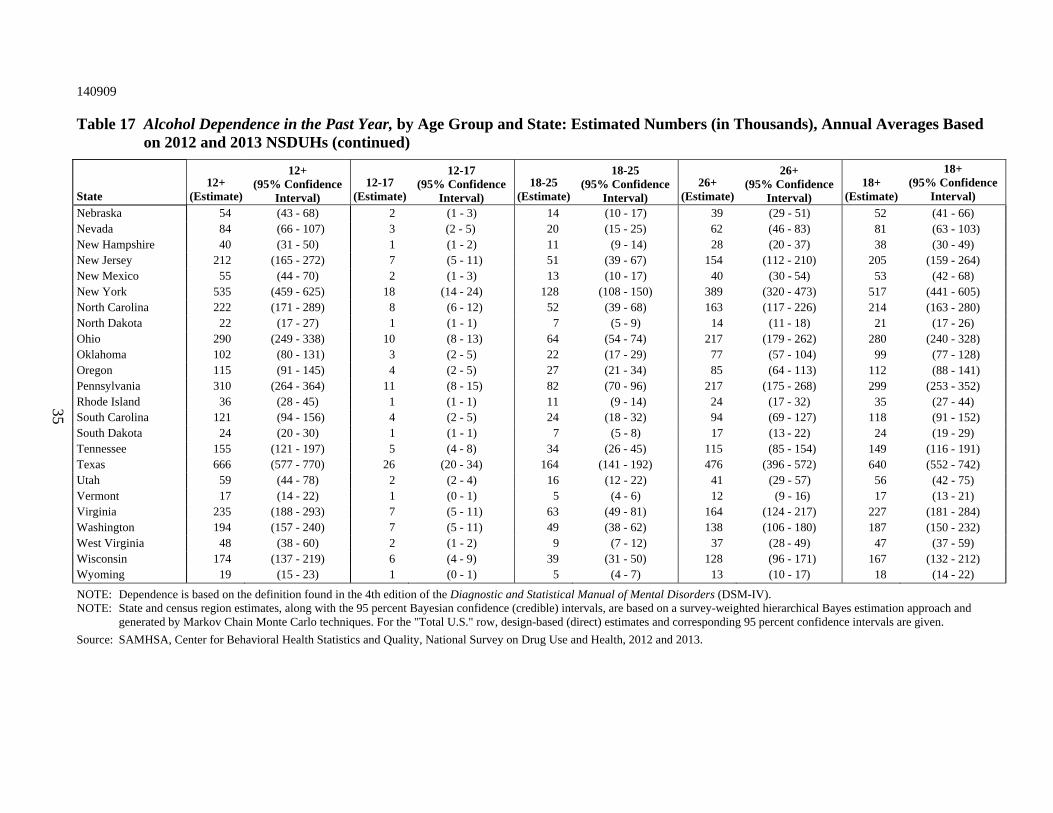
35
140909
Table 17 Alcohol Dependence in the Past Year, by Age Group and State: Estimated Numbers (in Thousands), Annual Averages Based on 2012 and 2013 NSDUHs (continued)
State 12+
(Estimate)
12+ (95% Confidence
Interval) 12-17
(Estimate)
12-17 (95% Confidence
Interval) 18-25
(Estimate)
18-25 (95% Confidence
Interval) 26+
(Estimate)
26+ (95% Confidence
Interval)18+
(Estimate)
18+ (95% Confidence
Interval)
Nebraska 54 (43 - 68) 2 (1 - 3) 14 (10 - 17) 39 (29 - 51) 52 (41 - 66) Nevada 84 (66 - 107) 3 (2 - 5) 20 (15 - 25) 62 (46 - 83) 81 (63 - 103) New Hampshire 40 (31 - 50) 1 (1 - 2) 11 (9 - 14) 28 (20 - 37) 38 (30 - 49) New Jersey 212 (165 - 272) 7 (5 - 11) 51 (39 - 67) 154 (112 - 210) 205 (159 - 264) New Mexico 55 (44 - 70) 2 (1 - 3) 13 (10 - 17) 40 (30 - 54) 53 (42 - 68) New York 535 (459 - 625) 18 (14 - 24) 128 (108 - 150) 389 (320 - 473) 517 (441 - 605) North Carolina 222 (171 - 289) 8 (6 - 12) 52 (39 - 68) 163 (117 - 226) 214 (163 - 280) North Dakota 22 (17 - 27) 1 (1 - 1) 7 (5 - 9) 14 (11 - 18) 21 (17 - 26) Ohio 290 (249 - 338) 10 (8 - 13) 64 (54 - 74) 217 (179 - 262) 280 (240 - 328) Oklahoma 102 (80 - 131) 3 (2 - 5) 22 (17 - 29) 77 (57 - 104) 99 (77 - 128) Oregon 115 (91 - 145) 4 (2 - 5) 27 (21 - 34) 85 (64 - 113) 112 (88 - 141) Pennsylvania 310 (264 - 364) 11 (8 - 15) 82 (70 - 96) 217 (175 - 268) 299 (253 - 352) Rhode Island 36 (28 - 45) 1 (1 - 1) 11 (9 - 14) 24 (17 - 32) 35 (27 - 44) South Carolina 121 (94 - 156) 4 (2 - 5) 24 (18 - 32) 94 (69 - 127) 118 (91 - 152) South Dakota 24 (20 - 30) 1 (1 - 1) 7 (5 - 8) 17 (13 - 22) 24 (19 - 29) Tennessee 155 (121 - 197) 5 (4 - 8) 34 (26 - 45) 115 (85 - 154) 149 (116 - 191) Texas 666 (577 - 770) 26 (20 - 34) 164 (141 - 192) 476 (396 - 572) 640 (552 - 742) Utah 59 (44 - 78) 2 (2 - 4) 16 (12 - 22) 41 (29 - 57) 56 (42 - 75) Vermont 17 (14 - 22) 1 (0 - 1) 5 (4 - 6) 12 (9 - 16) 17 (13 - 21) Virginia 235 (188 - 293) 7 (5 - 11) 63 (49 - 81) 164 (124 - 217) 227 (181 - 284) Washington 194 (157 - 240) 7 (5 - 11) 49 (38 - 62) 138 (106 - 180) 187 (150 - 232) West Virginia 48 (38 - 60) 2 (1 - 2) 9 (7 - 12) 37 (28 - 49) 47 (37 - 59) Wisconsin 174 (137 - 219) 6 (4 - 9) 39 (31 - 50) 128 (96 - 171) 167 (132 - 212) Wyoming 19 (15 - 23) 1 (0 - 1) 5 (4 - 7) 13 (10 - 17) 18 (14 - 22)
NOTE: Dependence is based on the definition found in the 4th edition of the Diagnostic and Statistical Manual of Mental Disorders (DSM-IV). NOTE: State and census region estimates, along with the 95 percent Bayesian confidence (credible) intervals, are based on a survey-weighted hierarchical Bayes estimation approach and
generated by Markov Chain Monte Carlo techniques. For the "Total U.S." row, design-based (direct) estimates and corresponding 95 percent confidence intervals are given.
Source: SAMHSA, Center for Behavioral Health Statistics and Quality, National Survey on Drug Use and Health, 2012 and 2013.
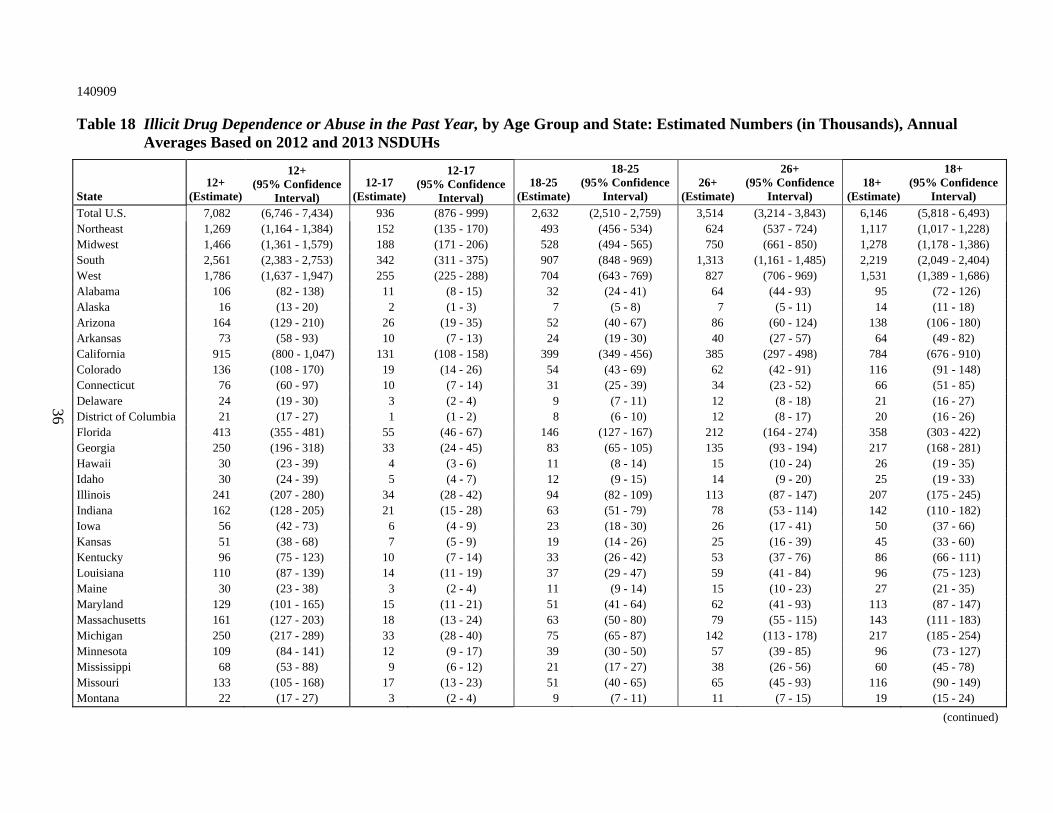
36
140909
Table 18 Illicit Drug Dependence or Abuse in the Past Year, by Age Group and State: Estimated Numbers (in Thousands), Annual Averages Based on 2012 and 2013 NSDUHs
State 12+
(Estimate)
12+ (95% Confidence
Interval) 12-17
(Estimate)
12-17 (95% Confidence
Interval) 18-25
(Estimate)
18-25 (95% Confidence
Interval) 26+
(Estimate)
26+ (95% Confidence
Interval) 18+
(Estimate)
18+ (95% Confidence
Interval)
Total U.S. 7,082 (6,746 - 7,434) 936 (876 - 999) 2,632 (2,510 - 2,759) 3,514 (3,214 - 3,843) 6,146 (5,818 - 6,493) Northeast 1,269 (1,164 - 1,384) 152 (135 - 170) 493 (456 - 534) 624 (537 - 724) 1,117 (1,017 - 1,228) Midwest 1,466 (1,361 - 1,579) 188 (171 - 206) 528 (494 - 565) 750 (661 - 850) 1,278 (1,178 - 1,386) South 2,561 (2,383 - 2,753) 342 (311 - 375) 907 (848 - 969) 1,313 (1,161 - 1,485) 2,219 (2,049 - 2,404) West 1,786 (1,637 - 1,947) 255 (225 - 288) 704 (643 - 769) 827 (706 - 969) 1,531 (1,389 - 1,686) Alabama 106 (82 - 138) 11 (8 - 15) 32 (24 - 41) 64 (44 - 93) 95 (72 - 126) Alaska 16 (13 - 20) 2 (1 - 3) 7 (5 - 8) 7 (5 - 11) 14 (11 - 18) Arizona 164 (129 - 210) 26 (19 - 35) 52 (40 - 67) 86 (60 - 124) 138 (106 - 180) Arkansas 73 (58 - 93) 10 (7 - 13) 24 (19 - 30) 40 (27 - 57) 64 (49 - 82) California 915 (800 - 1,047) 131 (108 - 158) 399 (349 - 456) 385 (297 - 498) 784 (676 - 910) Colorado 136 (108 - 170) 19 (14 - 26) 54 (43 - 69) 62 (42 - 91) 116 (91 - 148) Connecticut 76 (60 - 97) 10 (7 - 14) 31 (25 - 39) 34 (23 - 52) 66 (51 - 85) Delaware 24 (19 - 30) 3 (2 - 4) 9 (7 - 11) 12 (8 - 18) 21 (16 - 27) District of Columbia 21 (17 - 27) 1 (1 - 2) 8 (6 - 10) 12 (8 - 17) 20 (16 - 26) Florida 413 (355 - 481) 55 (46 - 67) 146 (127 - 167) 212 (164 - 274) 358 (303 - 422) Georgia 250 (196 - 318) 33 (24 - 45) 83 (65 - 105) 135 (93 - 194) 217 (168 - 281) Hawaii 30 (23 - 39) 4 (3 - 6) 11 (8 - 14) 15 (10 - 24) 26 (19 - 35) Idaho 30 (24 - 39) 5 (4 - 7) 12 (9 - 15) 14 (9 - 20) 25 (19 - 33) Illinois 241 (207 - 280) 34 (28 - 42) 94 (82 - 109) 113 (87 - 147) 207 (175 - 245) Indiana 162 (128 - 205) 21 (15 - 28) 63 (51 - 79) 78 (53 - 114) 142 (110 - 182) Iowa 56 (42 - 73) 6 (4 - 9) 23 (18 - 30) 26 (17 - 41) 50 (37 - 66) Kansas 51 (38 - 68) 7 (5 - 9) 19 (14 - 26) 25 (16 - 39) 45 (33 - 60) Kentucky 96 (75 - 123) 10 (7 - 14) 33 (26 - 42) 53 (37 - 76) 86 (66 - 111) Louisiana 110 (87 - 139) 14 (11 - 19) 37 (29 - 47) 59 (41 - 84) 96 (75 - 123) Maine 30 (23 - 38) 3 (2 - 4) 11 (9 - 14) 15 (10 - 23) 27 (21 - 35) Maryland 129 (101 - 165) 15 (11 - 21) 51 (41 - 64) 62 (41 - 93) 113 (87 - 147) Massachusetts 161 (127 - 203) 18 (13 - 24) 63 (50 - 80) 79 (55 - 115) 143 (111 - 183) Michigan 250 (217 - 289) 33 (28 - 40) 75 (65 - 87) 142 (113 - 178) 217 (185 - 254) Minnesota 109 (84 - 141) 12 (9 - 17) 39 (30 - 50) 57 (39 - 85) 96 (73 - 127) Mississippi 68 (53 - 88) 9 (6 - 12) 21 (17 - 27) 38 (26 - 56) 60 (45 - 78) Missouri 133 (105 - 168) 17 (13 - 23) 51 (40 - 65) 65 (45 - 93) 116 (90 - 149) Montana 22 (17 - 27) 3 (2 - 4) 9 (7 - 11) 11 (7 - 15) 19 (15 - 24)
(continued)

37
140909
Table 18 Illicit Drug Dependence or Abuse in the Past Year, by Age Group and State: Estimated Numbers (in Thousands), Annual Averages Based on 2012 and 2013 NSDUHs (continued)
State 12+
(Estimate)
12+ (95% Confidence
Interval) 12-17
(Estimate)
12-17 (95% Confidence
Interval) 18-25
(Estimate)
18-25 (95% Confidence
Interval) 26+
(Estimate)
26+ (95% Confidence
Interval)18+
(Estimate)
18+ (95% Confidence
Interval)
Nebraska 41 (31 - 52) 6 (4 - 8) 14 (11 - 18) 20 (14 - 31) 35 (26 - 45) Nevada 60 (47 - 77) 9 (6 - 12) 21 (17 - 27) 30 (20 - 45) 51 (39 - 67) New Hampshire 33 (26 - 41) 4 (3 - 6) 13 (11 - 16) 15 (10 - 22) 28 (22 - 36) New Jersey 166 (128 - 214) 22 (16 - 31) 70 (55 - 88) 74 (48 - 114) 143 (109 - 188) New Mexico 56 (43 - 71) 8 (6 - 11) 18 (14 - 23) 30 (20 - 43) 47 (36 - 62) New York 450 (388 - 521) 56 (46 - 68) 178 (156 - 204) 215 (167 - 278) 394 (336 - 462) North Carolina 272 (213 - 348) 32 (24 - 44) 94 (75 - 118) 145 (100 - 210) 240 (185 - 311) North Dakota 16 (12 - 20) 2 (1 - 2) 7 (5 - 8) 8 (5 - 11) 14 (11 - 18) Ohio 282 (246 - 324) 33 (27 - 40) 96 (84 - 109) 154 (123 - 192) 249 (215 - 289) Oklahoma 67 (51 - 90) 7 (5 - 11) 27 (21 - 36) 33 (20 - 52) 60 (44 - 81) Oregon 107 (84 - 136) 15 (11 - 20) 34 (27 - 43) 58 (41 - 84) 92 (71 - 119) Pennsylvania 305 (264 - 353) 33 (27 - 39) 107 (94 - 122) 165 (130 - 210) 273 (233 - 319) Rhode Island 33 (26 - 42) 4 (3 - 5) 12 (9 - 15) 18 (12 - 25) 30 (23 - 38) South Carolina 114 (90 - 144) 14 (10 - 19) 38 (30 - 48) 62 (43 - 88) 100 (77 - 128) South Dakota 15 (11 - 19) 2 (1 - 2) 5 (4 - 7) 8 (5 - 12) 13 (10 - 17) Tennessee 134 (104 - 173) 17 (12 - 23) 48 (38 - 61) 69 (46 - 103) 118 (90 - 154) Texas 462 (395 - 541) 83 (68 - 102) 173 (148 - 202) 206 (155 - 274) 379 (317 - 453) Utah 64 (51 - 81) 10 (7 - 14) 26 (20 - 33) 29 (19 - 42) 54 (42 - 70) Vermont 16 (13 - 20) 2 (1 - 2) 7 (5 - 8) 7 (5 - 11) 14 (11 - 18) Virginia 177 (139 - 225) 22 (16 - 30) 70 (54 - 89) 86 (59 - 124) 155 (120 - 200) Washington 174 (137 - 221) 21 (15 - 28) 58 (46 - 73) 95 (67 - 135) 153 (119 - 197) West Virginia 43 (33 - 55) 4 (3 - 6) 13 (10 - 17) 25 (18 - 36) 39 (29 - 50) Wisconsin 110 (85 - 143) 16 (11 - 22) 41 (32 - 52) 54 (36 - 82) 95 (71 - 125) Wyoming 11 (8 - 14) 1 (1 - 2) 4 (3 - 5) 5 (4 - 8) 9 (7 - 12)
NOTE: Illicit Drugs include marijuana/hashish, cocaine (including crack), heroin, hallucinogens, inhalants, or prescription-type psychotherapeutics used nonmedically, including data from original methamphetamine questions but not including new methamphetamine items added in 2005 and 2006.
NOTE: Dependence or abuse is based on definitions found in the 4th edition of the Diagnostic and Statistical Manual of Mental Disorders (DSM-IV). NOTE: State and census region estimates, along with the 95 percent Bayesian confidence (credible) intervals, are based on a survey-weighted hierarchical Bayes estimation approach and
generated by Markov Chain Monte Carlo techniques. For the "Total U.S." row, design-based (direct) estimates and corresponding 95 percent confidence intervals are given.
Source: SAMHSA, Center for Behavioral Health Statistics and Quality, National Survey on Drug Use and Health, 2012 and 2013.

38
140909
Table 19 Illicit Drug Dependence in the Past Year, by Age Group and State: Estimated Numbers (in Thousands), Annual Averages Based on 2012 and 2013 NSDUHs
State 12+
(Estimate)
12+ (95% Confidence
Interval) 12-17
(Estimate)
12-17 (95% Confidence
Interval) 18-25
(Estimate)
18-25 (95% Confidence
Interval) 26+
(Estimate)
26+ (95% Confidence
Interval) 18+
(Estimate)
18+ (95% Confidence
Interval)
Total U.S. 4,986 (4,704 - 5,285) 489 (449 - 534) 1,865 (1,764 - 1,971) 2,632 (2,376 - 2,915) 4,497 (4,219 - 4,793) Northeast 939 (850 - 1,038) 81 (70 - 93) 354 (323 - 389) 504 (428 - 593) 858 (771 - 955) Midwest 1,031 (946 - 1,123) 103 (92 - 116) 380 (351 - 412) 547 (475 - 631) 928 (845 - 1,017) South 1,771 (1,623 - 1,933) 185 (166 - 207) 629 (582 - 680) 957 (826 - 1,108) 1,586 (1,442 - 1,745) West 1,245 (1,118 - 1,385) 120 (103 - 139) 501 (449 - 559) 624 (522 - 746) 1,125 (1,003 - 1,262) Alabama 68 (51 - 91) 7 (5 - 9) 23 (17 - 31) 39 (26 - 59) 62 (46 - 83) Alaska 10 (8 - 13) 1 (1 - 1) 5 (3 - 6) 5 (3 - 7) 9 (7 - 12) Arizona 92 (70 - 120) 10 (7 - 14) 34 (25 - 46) 49 (33 - 71) 82 (62 - 109) Arkansas 47 (35 - 62) 5 (3 - 6) 15 (11 - 20) 27 (18 - 40) 42 (31 - 56) California 675 (575 - 791) 63 (50 - 80) 290 (246 - 340) 322 (245 - 422) 611 (515 - 725) Colorado 90 (70 - 115) 8 (6 - 12) 38 (29 - 49) 44 (30 - 65) 82 (63 - 106) Connecticut 56 (43 - 72) 5 (4 - 8) 24 (18 - 32) 27 (17 - 41) 50 (38 - 66) Delaware 17 (13 - 23) 1 (1 - 2) 6 (5 - 8) 10 (7 - 14) 16 (12 - 21) District of Columbia 17 (13 - 22) 1 (1 - 1) 6 (4 - 8) 10 (7 - 14) 16 (12 - 21) Florida 305 (258 - 361) 30 (24 - 37) 103 (87 - 121) 172 (132 - 224) 275 (229 - 330) Georgia 159 (120 - 211) 16 (11 - 21) 52 (39 - 70) 91 (61 - 136) 143 (106 - 194) Hawaii 21 (15 - 28) 2 (1 - 2) 7 (5 - 10) 12 (8 - 18) 19 (14 - 26) Idaho 21 (16 - 27) 3 (2 - 4) 8 (6 - 11) 10 (6 - 15) 18 (14 - 24) Illinois 176 (149 - 208) 19 (15 - 23) 66 (55 - 78) 92 (70 - 120) 158 (132 - 189) Indiana 113 (88 - 143) 11 (8 - 15) 46 (36 - 60) 55 (38 - 80) 102 (78 - 131) Iowa 38 (29 - 51) 4 (3 - 6) 14 (10 - 20) 20 (13 - 31) 34 (25 - 46) Kansas 33 (24 - 45) 3 (2 - 5) 13 (9 - 18) 17 (11 - 27) 30 (21 - 41) Kentucky 73 (57 - 94) 6 (4 - 8) 26 (20 - 34) 41 (29 - 59) 67 (52 - 88) Louisiana 79 (62 - 101) 8 (6 - 10) 29 (21 - 38) 43 (30 - 61) 71 (55 - 92) Maine 21 (17 - 28) 2 (1 - 2) 8 (6 - 11) 11 (8 - 17) 20 (15 - 26) Maryland 101 (78 - 130) 9 (7 - 13) 38 (29 - 50) 54 (37 - 78) 92 (70 - 120) Massachusetts 121 (94 - 156) 10 (7 - 14) 47 (35 - 61) 64 (45 - 93) 111 (85 - 145) Michigan 165 (141 - 194) 18 (14 - 22) 55 (47 - 65) 93 (72 - 119) 148 (124 - 175) Minnesota 77 (58 - 101) 7 (5 - 10) 27 (19 - 36) 43 (29 - 64) 69 (51 - 93) Mississippi 46 (35 - 60) 5 (4 - 7) 14 (10 - 20) 26 (18 - 39) 41 (30 - 54) Missouri 97 (76 - 125) 9 (7 - 13) 39 (30 - 51) 49 (33 - 72) 88 (68 - 115) Montana 16 (12 - 20) 2 (1 - 2) 6 (5 - 8) 8 (5 - 12) 14 (11 - 19)
(continued)
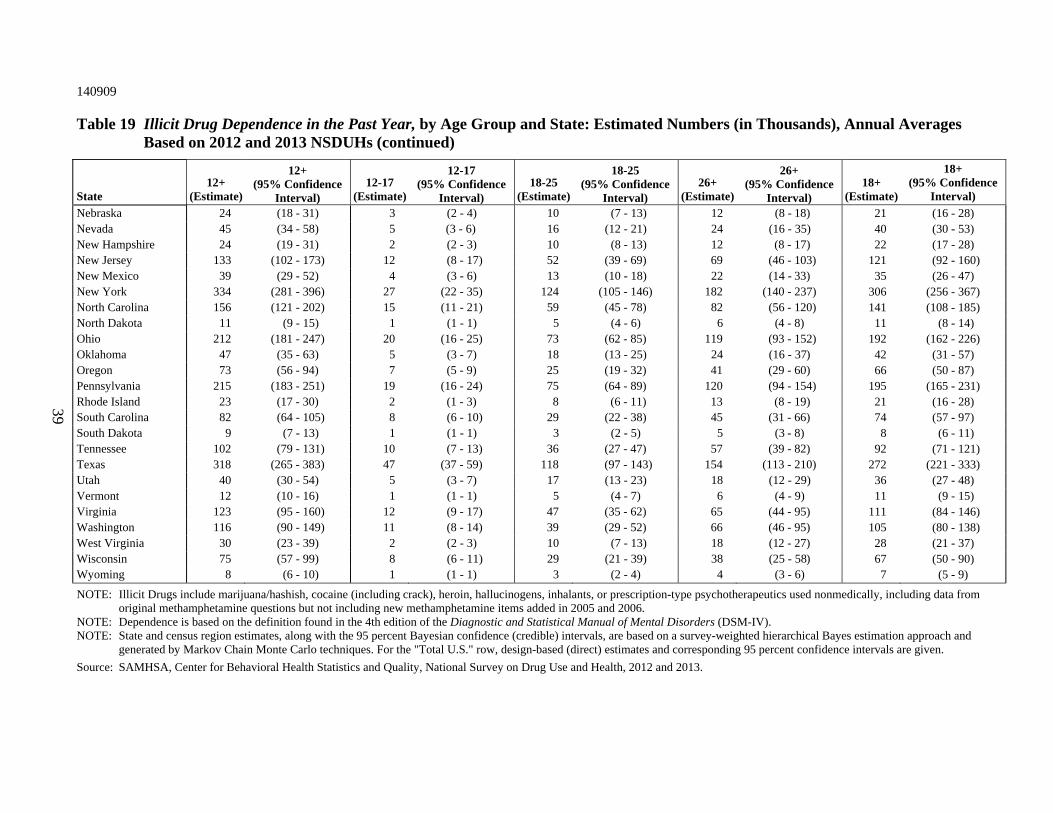
39
140909
Table 19 Illicit Drug Dependence in the Past Year, by Age Group and State: Estimated Numbers (in Thousands), Annual Averages Based on 2012 and 2013 NSDUHs (continued)
State 12+
(Estimate)
12+ (95% Confidence
Interval) 12-17
(Estimate)
12-17 (95% Confidence
Interval) 18-25
(Estimate)
18-25 (95% Confidence
Interval) 26+
(Estimate)
26+ (95% Confidence
Interval)18+
(Estimate)
18+ (95% Confidence
Interval)
Nebraska 24 (18 - 31) 3 (2 - 4) 10 (7 - 13) 12 (8 - 18) 21 (16 - 28) Nevada 45 (34 - 58) 5 (3 - 6) 16 (12 - 21) 24 (16 - 35) 40 (30 - 53) New Hampshire 24 (19 - 31) 2 (2 - 3) 10 (8 - 13) 12 (8 - 17) 22 (17 - 28) New Jersey 133 (102 - 173) 12 (8 - 17) 52 (39 - 69) 69 (46 - 103) 121 (92 - 160) New Mexico 39 (29 - 52) 4 (3 - 6) 13 (10 - 18) 22 (14 - 33) 35 (26 - 47) New York 334 (281 - 396) 27 (22 - 35) 124 (105 - 146) 182 (140 - 237) 306 (256 - 367) North Carolina 156 (121 - 202) 15 (11 - 21) 59 (45 - 78) 82 (56 - 120) 141 (108 - 185) North Dakota 11 (9 - 15) 1 (1 - 1) 5 (4 - 6) 6 (4 - 8) 11 (8 - 14) Ohio 212 (181 - 247) 20 (16 - 25) 73 (62 - 85) 119 (93 - 152) 192 (162 - 226) Oklahoma 47 (35 - 63) 5 (3 - 7) 18 (13 - 25) 24 (16 - 37) 42 (31 - 57) Oregon 73 (56 - 94) 7 (5 - 9) 25 (19 - 32) 41 (29 - 60) 66 (50 - 87) Pennsylvania 215 (183 - 251) 19 (16 - 24) 75 (64 - 89) 120 (94 - 154) 195 (165 - 231) Rhode Island 23 (17 - 30) 2 (1 - 3) 8 (6 - 11) 13 (8 - 19) 21 (16 - 28) South Carolina 82 (64 - 105) 8 (6 - 10) 29 (22 - 38) 45 (31 - 66) 74 (57 - 97) South Dakota 9 (7 - 13) 1 (1 - 1) 3 (2 - 5) 5 (3 - 8) 8 (6 - 11) Tennessee 102 (79 - 131) 10 (7 - 13) 36 (27 - 47) 57 (39 - 82) 92 (71 - 121) Texas 318 (265 - 383) 47 (37 - 59) 118 (97 - 143) 154 (113 - 210) 272 (221 - 333) Utah 40 (30 - 54) 5 (3 - 7) 17 (13 - 23) 18 (12 - 29) 36 (27 - 48) Vermont 12 (10 - 16) 1 (1 - 1) 5 (4 - 7) 6 (4 - 9) 11 (9 - 15) Virginia 123 (95 - 160) 12 (9 - 17) 47 (35 - 62) 65 (44 - 95) 111 (84 - 146) Washington 116 (90 - 149) 11 (8 - 14) 39 (29 - 52) 66 (46 - 95) 105 (80 - 138) West Virginia 30 (23 - 39) 2 (2 - 3) 10 (7 - 13) 18 (12 - 27) 28 (21 - 37) Wisconsin 75 (57 - 99) 8 (6 - 11) 29 (21 - 39) 38 (25 - 58) 67 (50 - 90) Wyoming 8 (6 - 10) 1 (1 - 1) 3 (2 - 4) 4 (3 - 6) 7 (5 - 9)
NOTE: Illicit Drugs include marijuana/hashish, cocaine (including crack), heroin, hallucinogens, inhalants, or prescription-type psychotherapeutics used nonmedically, including data from original methamphetamine questions but not including new methamphetamine items added in 2005 and 2006.
NOTE: Dependence is based on the definition found in the 4th edition of the Diagnostic and Statistical Manual of Mental Disorders (DSM-IV). NOTE: State and census region estimates, along with the 95 percent Bayesian confidence (credible) intervals, are based on a survey-weighted hierarchical Bayes estimation approach and
generated by Markov Chain Monte Carlo techniques. For the "Total U.S." row, design-based (direct) estimates and corresponding 95 percent confidence intervals are given.
Source: SAMHSA, Center for Behavioral Health Statistics and Quality, National Survey on Drug Use and Health, 2012 and 2013.

40
140909
Table 20 Dependence or Abuse of Illicit Drugs or Alcohol in the Past Year, by Age Group and State: Estimated Numbers (in Thousands), Annual Averages Based on 2012 and 2013 NSDUHs
State 12+
(Estimate)
12+ (95% Confidence
Interval) 12-17
(Estimate)
12-17 (95% Confidence
Interval) 18-25
(Estimate)
18-25 (95% Confidence
Interval) 26+
(Estimate)
26+ (95% Confidence
Interval) 18+
(Estimate)
18+ (95% Confidence
Interval)
Total U.S. 21,873 (21,224 - 22,542) 1,410 (1,338 - 1,485) 6,275 (6,086 - 6,468) 14,189 (13,603 - 14,799) 20,464 (19,826 - 21,121) Northeast 3,935 (3,729 - 4,154) 238 (218 - 260) 1,175 (1,118 - 1,234) 2,523 (2,336 - 2,724) 3,697 (3,496 - 3,911) Midwest 4,748 (4,546 - 4,959) 292 (272 - 314) 1,358 (1,306 - 1,412) 3,098 (2,912 - 3,296) 4,456 (4,259 - 4,662) South 7,745 (7,414 - 8,089) 523 (486 - 562) 2,151 (2,066 - 2,240) 5,070 (4,765 - 5,393) 7,222 (6,897 - 7,560) West 5,445 (5,146 - 5,758) 356 (323 - 393) 1,591 (1,506 - 1,678) 3,498 (3,228 - 3,788) 5,088 (4,796 - 5,396) Alabama 309 (265 - 359) 22 (17 - 28) 81 (69 - 94) 206 (168 - 252) 287 (245 - 336) Alaska 53 (45 - 61) 3 (2 - 4) 16 (14 - 18) 34 (28 - 42) 50 (43 - 58) Arizona 487 (422 - 560) 34 (27 - 44) 132 (113 - 153) 320 (265 - 386) 452 (390 - 523) Arkansas 187 (162 - 216) 13 (10 - 17) 55 (47 - 64) 119 (97 - 145) 174 (150 - 202) California 2,765 (2,534 - 3,014) 182 (156 - 211) 854 (784 - 930) 1,729 (1,526 - 1,956) 2,583 (2,358 - 2,828) Colorado 420 (364 - 483) 27 (21 - 34) 121 (105 - 139) 272 (224 - 328) 393 (339 - 453) Connecticut 253 (218 - 293) 15 (12 - 20) 71 (61 - 82) 167 (136 - 204) 238 (204 - 277) Delaware 71 (62 - 82) 4 (3 - 5) 21 (18 - 24) 46 (38 - 56) 67 (58 - 78) District of Columbia 76 (66 - 87) 2 (2 - 2) 21 (18 - 24) 53 (45 - 63) 74 (65 - 85) Florida 1,299 (1,178 - 1,431) 79 (68 - 92) 319 (292 - 348) 901 (789 - 1,026) 1,219 (1,101 - 1,350) Georgia 589 (505 - 686) 43 (33 - 55) 164 (139 - 193) 383 (312 - 469) 547 (466 - 640) Hawaii 98 (83 - 116) 7 (5 - 9) 28 (24 - 33) 63 (51 - 79) 92 (77 - 109) Idaho 108 (93 - 124) 8 (7 - 11) 28 (24 - 32) 71 (59 - 86) 99 (85 - 115) Illinois 825 (749 - 908) 50 (43 - 59) 246 (225 - 268) 529 (461 - 607) 775 (701 - 856) Indiana 477 (415 - 546) 32 (25 - 41) 148 (129 - 170) 296 (244 - 358) 444 (385 - 512) Iowa 202 (172 - 236) 11 (9 - 15) 62 (54 - 72) 128 (103 - 159) 191 (162 - 224) Kansas 197 (169 - 228) 12 (9 - 15) 54 (47 - 63) 130 (107 - 159) 185 (158 - 215) Kentucky 286 (248 - 331) 17 (14 - 22) 82 (70 - 95) 187 (154 - 226) 269 (231 - 312) Louisiana 307 (267 - 353) 22 (18 - 28) 85 (73 - 98) 200 (165 - 241) 285 (246 - 329) Maine 98 (85 - 114) 5 (4 - 6) 26 (22 - 29) 68 (55 - 83) 93 (80 - 109) Maryland 395 (343 - 455) 24 (19 - 30) 115 (99 - 133) 256 (211 - 309) 371 (321 - 429) Massachusetts 507 (441 - 581) 27 (22 - 34) 155 (134 - 177) 325 (268 - 392) 479 (415 - 552) Michigan 731 (671 - 796) 47 (41 - 54) 193 (177 - 210) 491 (435 - 553) 684 (625 - 748) Minnesota 378 (325 - 438) 21 (16 - 27) 104 (89 - 121) 253 (208 - 306) 357 (306 - 416) Mississippi 189 (161 - 220) 14 (11 - 18) 49 (42 - 58) 125 (102 - 153) 174 (148 - 205) Missouri 419 (363 - 483) 27 (22 - 34) 118 (102 - 136) 273 (225 - 331) 392 (338 - 453) Montana 86 (75 - 98) 5 (4 - 6) 25 (22 - 28) 56 (47 - 68) 81 (70 - 93)
(continued)

41
140909
Table 20 Dependence or Abuse of Illicit Drugs or Alcohol in the Past Year, by Age Group and State: Estimated Numbers (in Thousands), Annual Averages Based on 2012 and 2013 NSDUHs (continued)
State 12+
(Estimate)
12+ (95% Confidence
Interval) 12-17
(Estimate)
12-17 (95% Confidence
Interval) 18-25
(Estimate)
18-25 (95% Confidence
Interval) 26+
(Estimate)
26+ (95% Confidence
Interval)18+
(Estimate)
18+ (95% Confidence
Interval)
Nebraska 143 (124 - 164) 10 (8 - 12) 41 (36 - 47) 92 (76 - 111) 133 (115 - 154) Nevada 211 (182 - 245) 13 (10 - 16) 53 (45 - 62) 145 (119 - 176) 198 (170 - 231) New Hampshire 106 (92 - 121) 7 (5 - 9) 33 (29 - 38) 66 (54 - 80) 99 (86 - 114) New Jersey 566 (484 - 660) 36 (28 - 47) 170 (147 - 197) 359 (290 - 444) 530 (451 - 621) New Mexico 163 (141 - 188) 12 (10 - 15) 42 (36 - 48) 109 (90 - 132) 151 (130 - 176) New York 1,365 (1,245 - 1,496) 85 (73 - 99) 400 (365 - 436) 881 (773 - 1,003) 1,280 (1,163 - 1,409) North Carolina 679 (587 - 785) 45 (35 - 58) 192 (166 - 221) 442 (363 - 537) 634 (546 - 736) North Dakota 58 (51 - 66) 3 (2 - 4) 20 (17 - 23) 35 (29 - 42) 55 (48 - 62) Ohio 807 (738 - 881) 48 (41 - 55) 227 (209 - 246) 532 (469 - 602) 759 (692 - 832) Oklahoma 262 (225 - 305) 15 (12 - 19) 75 (64 - 87) 173 (140 - 212) 247 (211 - 289) Oregon 307 (265 - 355) 19 (15 - 24) 79 (69 - 91) 209 (172 - 253) 288 (247 - 335) Pennsylvania 894 (818 - 976) 55 (47 - 63) 275 (253 - 297) 564 (495 - 643) 839 (765 - 920) Rhode Island 97 (85 - 110) 5 (4 - 6) 30 (26 - 34) 62 (51 - 74) 92 (80 - 105) South Carolina 315 (271 - 364) 21 (16 - 26) 86 (73 - 100) 208 (171 - 254) 294 (252 - 343) South Dakota 61 (53 - 70) 3 (3 - 4) 18 (16 - 21) 40 (33 - 48) 58 (50 - 67) Tennessee 399 (343 - 462) 26 (20 - 34) 112 (95 - 130) 261 (214 - 317) 373 (319 - 434) Texas 1,676 (1,537 - 1,825) 134 (116 - 154) 490 (448 - 534) 1,052 (929 - 1,191) 1,542 (1,408 - 1,689) Utah 158 (134 - 187) 13 (10 - 17) 56 (47 - 66) 90 (71 - 114) 146 (123 - 173) Vermont 50 (43 - 58) 3 (2 - 4) 15 (13 - 18) 32 (26 - 39) 47 (41 - 54) Virginia 576 (501 - 662) 35 (28 - 44) 174 (149 - 202) 367 (305 - 442) 541 (469 - 625) Washington 542 (471 - 622) 31 (24 - 39) 144 (125 - 165) 367 (305 - 441) 511 (442 - 589) West Virginia 129 (111 - 150) 7 (6 - 9) 32 (27 - 37) 90 (74 - 110) 122 (104 - 142) Wisconsin 451 (390 - 521) 28 (22 - 35) 125 (109 - 143) 298 (245 - 362) 423 (364 - 491) Wyoming 46 (40 - 53) 3 (2 - 4) 12 (10 - 14) 31 (26 - 37) 43 (37 - 50)
NOTE: Illicit Drugs include marijuana/hashish, cocaine (including crack), heroin, hallucinogens, inhalants, or prescription-type psychotherapeutics used nonmedically, including data from original methamphetamine questions but not including new methamphetamine items added in 2005 and 2006.
NOTE: Dependence or abuse is based on definitions found in the 4th edition of the Diagnostic and Statistical Manual of Mental Disorders (DSM-IV). NOTE: State and census region estimates, along with the 95 percent Bayesian confidence (credible) intervals, are based on a survey-weighted hierarchical Bayes estimation approach and
generated by Markov Chain Monte Carlo techniques. For the "Total U.S." row, design-based (direct) estimates and corresponding 95 percent confidence intervals are given.
Source: SAMHSA, Center for Behavioral Health Statistics and Quality, National Survey on Drug Use and Health, 2012 and 2013.
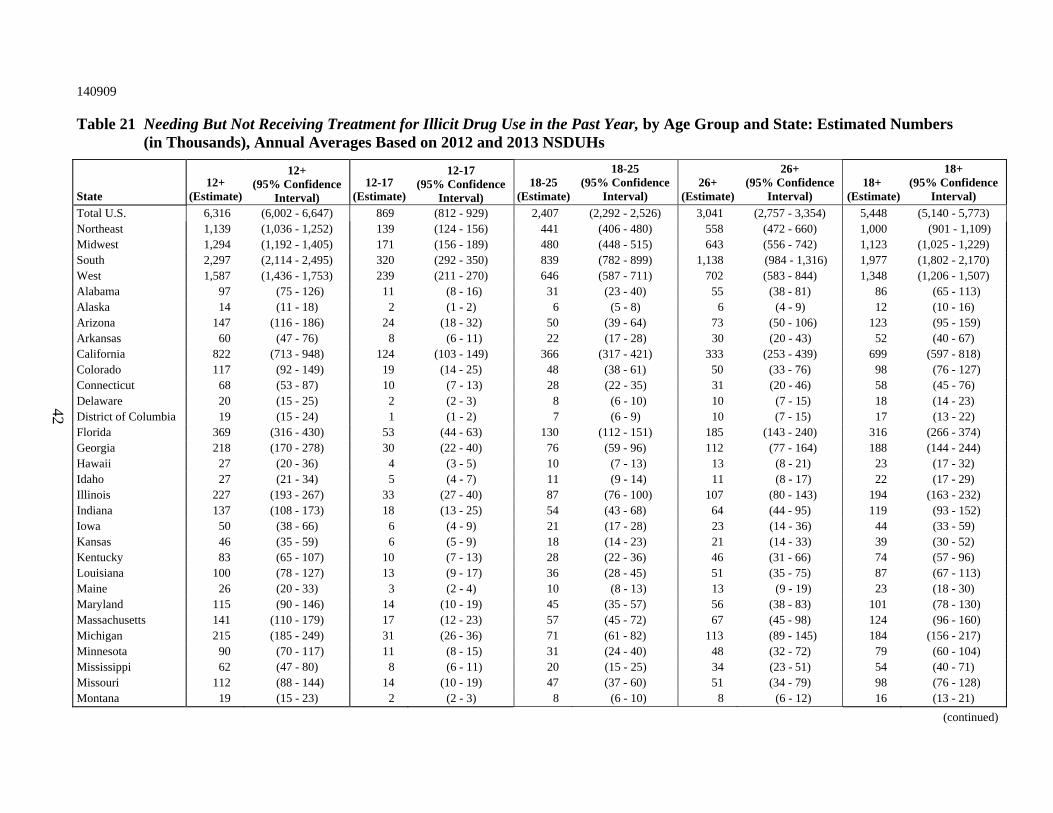
42
140909
Table 21 Needing But Not Receiving Treatment for Illicit Drug Use in the Past Year, by Age Group and State: Estimated Numbers (in Thousands), Annual Averages Based on 2012 and 2013 NSDUHs
State 12+
(Estimate)
12+ (95% Confidence
Interval) 12-17
(Estimate)
12-17 (95% Confidence
Interval) 18-25
(Estimate)
18-25 (95% Confidence
Interval) 26+
(Estimate)
26+ (95% Confidence
Interval) 18+
(Estimate)
18+ (95% Confidence
Interval)
Total U.S. 6,316 (6,002 - 6,647) 869 (812 - 929) 2,407 (2,292 - 2,526) 3,041 (2,757 - 3,354) 5,448 (5,140 - 5,773) Northeast 1,139 (1,036 - 1,252) 139 (124 - 156) 441 (406 - 480) 558 (472 - 660) 1,000 (901 - 1,109) Midwest 1,294 (1,192 - 1,405) 171 (156 - 189) 480 (448 - 515) 643 (556 - 742) 1,123 (1,025 - 1,229) South 2,297 (2,114 - 2,495) 320 (292 - 350) 839 (782 - 899) 1,138 (984 - 1,316) 1,977 (1,802 - 2,170) West 1,587 (1,436 - 1,753) 239 (211 - 270) 646 (587 - 711) 702 (583 - 844) 1,348 (1,206 - 1,507) Alabama 97 (75 - 126) 11 (8 - 16) 31 (23 - 40) 55 (38 - 81) 86 (65 - 113) Alaska 14 (11 - 18) 2 (1 - 2) 6 (5 - 8) 6 (4 - 9) 12 (10 - 16) Arizona 147 (116 - 186) 24 (18 - 32) 50 (39 - 64) 73 (50 - 106) 123 (95 - 159) Arkansas 60 (47 - 76) 8 (6 - 11) 22 (17 - 28) 30 (20 - 43) 52 (40 - 67) California 822 (713 - 948) 124 (103 - 149) 366 (317 - 421) 333 (253 - 439) 699 (597 - 818) Colorado 117 (92 - 149) 19 (14 - 25) 48 (38 - 61) 50 (33 - 76) 98 (76 - 127) Connecticut 68 (53 - 87) 10 (7 - 13) 28 (22 - 35) 31 (20 - 46) 58 (45 - 76) Delaware 20 (15 - 25) 2 (2 - 3) 8 (6 - 10) 10 (7 - 15) 18 (14 - 23) District of Columbia 19 (15 - 24) 1 (1 - 2) 7 (6 - 9) 10 (7 - 15) 17 (13 - 22) Florida 369 (316 - 430) 53 (44 - 63) 130 (112 - 151) 185 (143 - 240) 316 (266 - 374) Georgia 218 (170 - 278) 30 (22 - 40) 76 (59 - 96) 112 (77 - 164) 188 (144 - 244) Hawaii 27 (20 - 36) 4 (3 - 5) 10 (7 - 13) 13 (8 - 21) 23 (17 - 32) Idaho 27 (21 - 34) 5 (4 - 7) 11 (9 - 14) 11 (8 - 17) 22 (17 - 29) Illinois 227 (193 - 267) 33 (27 - 40) 87 (76 - 100) 107 (80 - 143) 194 (163 - 232) Indiana 137 (108 - 173) 18 (13 - 25) 54 (43 - 68) 64 (44 - 95) 119 (93 - 152) Iowa 50 (38 - 66) 6 (4 - 9) 21 (17 - 28) 23 (14 - 36) 44 (33 - 59) Kansas 46 (35 - 59) 6 (5 - 9) 18 (14 - 23) 21 (14 - 33) 39 (30 - 52) Kentucky 83 (65 - 107) 10 (7 - 13) 28 (22 - 36) 46 (31 - 66) 74 (57 - 96) Louisiana 100 (78 - 127) 13 (9 - 17) 36 (28 - 45) 51 (35 - 75) 87 (67 - 113) Maine 26 (20 - 33) 3 (2 - 4) 10 (8 - 13) 13 (9 - 19) 23 (18 - 30) Maryland 115 (90 - 146) 14 (10 - 19) 45 (35 - 57) 56 (38 - 83) 101 (78 - 130) Massachusetts 141 (110 - 179) 17 (12 - 23) 57 (45 - 72) 67 (45 - 98) 124 (96 - 160) Michigan 215 (185 - 249) 31 (26 - 36) 71 (61 - 82) 113 (89 - 145) 184 (156 - 217) Minnesota 90 (70 - 117) 11 (8 - 15) 31 (24 - 40) 48 (32 - 72) 79 (60 - 104) Mississippi 62 (47 - 80) 8 (6 - 11) 20 (15 - 25) 34 (23 - 51) 54 (40 - 71) Missouri 112 (88 - 144) 14 (10 - 19) 47 (37 - 60) 51 (34 - 79) 98 (76 - 128) Montana 19 (15 - 23) 2 (2 - 3) 8 (6 - 10) 8 (6 - 12) 16 (13 - 21)
(continued)

43
140909
Table 21 Needing But Not Receiving Treatment for Illicit Drug Use in the Past Year, by Age Group and State: Estimated Numbers (in Thousands), Annual Averages Based on 2012 and 2013 NSDUHs (continued)
State 12+
(Estimate)
12+ (95% Confidence
Interval) 12-17
(Estimate)
12-17 (95% Confidence
Interval) 18-25
(Estimate)
18-25 (95% Confidence
Interval) 26+
(Estimate)
26+ (95% Confidence
Interval)18+
(Estimate)
18+ (95% Confidence
Interval)
Nebraska 35 (27 - 45) 5 (4 - 7) 13 (10 - 16) 17 (11 - 25) 30 (23 - 39) Nevada 54 (42 - 69) 8 (6 - 11) 20 (16 - 26) 26 (17 - 39) 46 (35 - 60) New Hampshire 28 (22 - 36) 4 (3 - 5) 12 (10 - 15) 12 (8 - 18) 24 (19 - 31) New Jersey 145 (112 - 188) 21 (15 - 28) 59 (46 - 76) 65 (41 - 103) 125 (94 - 165) New Mexico 49 (38 - 62) 8 (6 - 11) 16 (13 - 20) 24 (16 - 36) 40 (31 - 53) New York 423 (363 - 492) 51 (42 - 62) 164 (141 - 189) 208 (159 - 272) 371 (315 - 438) North Carolina 244 (189 - 314) 31 (22 - 42) 89 (70 - 113) 123 (83 - 184) 213 (162 - 279) North Dakota 13 (10 - 17) 1 (1 - 2) 6 (4 - 7) 7 (4 - 10) 12 (9 - 16) Ohio 258 (223 - 298) 30 (25 - 37) 89 (78 - 102) 138 (109 - 175) 227 (194 - 266) Oklahoma 59 (44 - 78) 7 (5 - 10) 25 (19 - 33) 26 (16 - 43) 51 (38 - 69) Oregon 95 (73 - 123) 13 (10 - 18) 31 (24 - 40) 50 (34 - 75) 82 (61 - 108) Pennsylvania 267 (230 - 311) 29 (24 - 35) 95 (82 - 110) 143 (112 - 183) 238 (202 - 281) Rhode Island 27 (21 - 34) 3 (2 - 4) 11 (8 - 13) 13 (9 - 19) 24 (18 - 30) South Carolina 99 (78 - 125) 13 (10 - 17) 35 (27 - 45) 51 (36 - 74) 86 (67 - 111) South Dakota 13 (10 - 17) 2 (1 - 2) 5 (4 - 6) 6 (4 - 10) 11 (8 - 15) Tennessee 122 (96 - 155) 15 (11 - 21) 46 (36 - 57) 61 (42 - 89) 107 (83 - 137) Texas 432 (366 - 510) 79 (64 - 97) 165 (141 - 193) 188 (138 - 255) 353 (292 - 426) Utah 57 (45 - 71) 10 (7 - 13) 24 (18 - 30) 24 (16 - 35) 47 (37 - 60) Vermont 14 (11 - 17) 2 (1 - 2) 6 (5 - 7) 6 (4 - 9) 12 (9 - 16) Virginia 161 (127 - 203) 20 (15 - 27) 64 (50 - 82) 76 (52 - 111) 140 (109 - 180) Washington 150 (117 - 192) 20 (15 - 26) 53 (42 - 67) 78 (53 - 113) 131 (100 - 170) West Virginia 39 (30 - 50) 4 (3 - 5) 12 (10 - 16) 23 (16 - 32) 35 (27 - 45) Wisconsin 98 (76 - 127) 14 (10 - 19) 38 (29 - 49) 46 (30 - 69) 84 (64 - 110) Wyoming 10 (7 - 12) 1 (1 - 2) 4 (3 - 5) 5 (3 - 7) 8 (6 - 11)
NOTE: Needing But Not Receiving Treatment refers to respondents classified as needing treatment for illicit drugs, but not receiving treatment for an illicit drug problem at a specialty facility (i.e., drug and alcohol rehabilitation facilities [inpatient or outpatient], hospitals [inpatient only], and mental health centers). Illicit Drugs include marijuana/hashish, cocaine (including crack), inhalants, hallucinogens, heroin, or prescription-type psychotherapeutics used nonmedically, including data from original methamphetamine questions but not including new methamphetamine items added in 2005 and 2006.
NOTE: State and census region estimates, along with the 95 percent Bayesian confidence (credible) intervals, are based on a survey-weighted hierarchical Bayes estimation approach and generated by Markov Chain Monte Carlo techniques. For the "Total U.S." row, design-based (direct) estimates and corresponding 95 percent confidence intervals are given.
Source: SAMHSA, Center for Behavioral Health Statistics and Quality, National Survey on Drug Use and Health, 2012 and 2013.

44
140909
Table 22 Needing But Not Receiving Treatment for Alcohol Use in the Past Year, by Age Group and State: Estimated Numbers (in Thousands), Annual Averages Based on 2012 and 2013 NSDUHs
State 12+
(Estimate)
12+ (95% Confidence
Interval) 12-17
(Estimate)
12-17 (95% Confidence
Interval) 18-25
(Estimate)
18-25 (95% Confidence
Interval) 26+
(Estimate)
26+ (95% Confidence
Interval) 18+
(Estimate)
18+ (95% Confidence
Interval)
Total U.S. 16,714 (16,151 - 17,294) 738 (688 - 790) 4,629 (4,465 - 4,797) 11,348 (10,836 - 11,882) 15,976 (15,423 - 16,548) Northeast 3,010 (2,824 - 3,210) 131 (117 - 146) 847 (796 - 901) 2,033 (1,863 - 2,218) 2,880 (2,696 - 3,077) Midwest 3,658 (3,474 - 3,852) 162 (147 - 178) 1,005 (955 - 1,057) 2,491 (2,318 - 2,677) 3,496 (3,314 - 3,688) South 5,908 (5,593 - 6,239) 263 (239 - 289) 1,604 (1,524 - 1,688) 4,040 (3,749 - 4,351) 5,645 (5,333 - 5,973) West 4,137 (3,875 - 4,414) 182 (160 - 207) 1,172 (1,095 - 1,253) 2,783 (2,546 - 3,041) 3,955 (3,696 - 4,230) Alabama 245 (203 - 295) 13 (9 - 17) 65 (54 - 77) 168 (131 - 213) 232 (191 - 281) Alaska 38 (32 - 46) 2 (1 - 2) 11 (9 - 13) 26 (20 - 33) 37 (30 - 44) Arizona 362 (299 - 436) 17 (13 - 23) 93 (77 - 111) 251 (198 - 318) 344 (284 - 417) Arkansas 130 (107 - 157) 6 (5 - 8) 39 (32 - 46) 85 (65 - 109) 124 (102 - 150) California 2,144 (1,929 - 2,381) 91 (73 - 113) 640 (577 - 709) 1,413 (1,222 - 1,632) 2,053 (1,841 - 2,287) Colorado 299 (251 - 355) 12 (9 - 17) 84 (71 - 99) 202 (161 - 253) 287 (240 - 341) Connecticut 206 (171 - 249) 8 (6 - 11) 54 (45 - 64) 144 (113 - 183) 198 (163 - 240) Delaware 51 (43 - 61) 2 (1 - 3) 15 (13 - 18) 34 (27 - 43) 49 (41 - 59) District of Columbia 63 (53 - 73) 1 (1 - 1) 17 (14 - 20) 45 (37 - 55) 62 (52 - 73) Florida 964 (857 - 1,083) 37 (30 - 45) 233 (209 - 260) 693 (595 - 807) 927 (821 - 1,046) Georgia 432 (351 - 530) 19 (14 - 26) 116 (95 - 141) 297 (229 - 385) 413 (334 - 509) Hawaii 82 (68 - 99) 3 (2 - 5) 22 (18 - 27) 57 (44 - 73) 79 (65 - 96) Idaho 85 (71 - 102) 5 (4 - 7) 22 (18 - 26) 59 (47 - 74) 80 (67 - 96) Illinois 662 (589 - 744) 26 (21 - 32) 185 (166 - 206) 451 (386 - 527) 636 (564 - 717) Indiana 373 (314 - 442) 18 (13 - 23) 103 (86 - 121) 253 (202 - 315) 356 (298 - 423) Iowa 150 (123 - 182) 7 (5 - 9) 46 (39 - 55) 97 (74 - 125) 143 (117 - 174) Kansas 160 (133 - 191) 8 (6 - 10) 42 (35 - 50) 110 (87 - 139) 152 (126 - 183) Kentucky 212 (176 - 256) 10 (8 - 13) 61 (51 - 73) 141 (110 - 181) 202 (167 - 245) Louisiana 223 (185 - 269) 11 (8 - 14) 61 (51 - 73) 152 (119 - 194) 213 (175 - 258) Maine 70 (59 - 84) 3 (2 - 4) 18 (16 - 22) 49 (39 - 62) 67 (56 - 81) Maryland 313 (260 - 377) 12 (9 - 17) 83 (70 - 99) 218 (171 - 276) 301 (248 - 364) Massachusetts 375 (317 - 444) 16 (12 - 21) 110 (92 - 131) 249 (200 - 310) 360 (302 - 427) Michigan 552 (496 - 613) 24 (20 - 29) 146 (133 - 161) 381 (330 - 439) 528 (473 - 588) Minnesota 276 (228 - 333) 13 (9 - 17) 74 (62 - 89) 189 (149 - 240) 264 (217 - 319) Mississippi 143 (119 - 172) 7 (5 - 9) 37 (31 - 45) 99 (78 - 125) 136 (112 - 164) Missouri 324 (270 - 389) 16 (12 - 21) 87 (73 - 103) 222 (175 - 281) 309 (255 - 372) Montana 66 (55 - 78) 3 (2 - 4) 18 (16 - 21) 44 (35 - 55) 62 (52 - 74)
(continued)
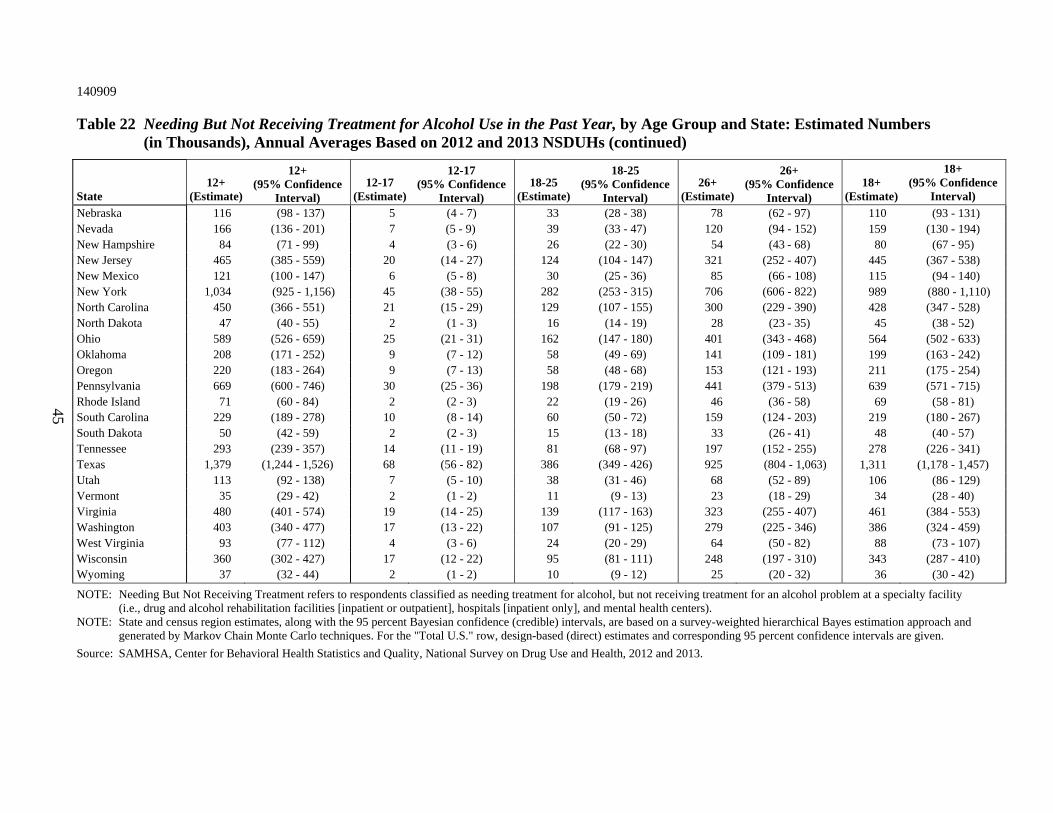
45
140909
Table 22 Needing But Not Receiving Treatment for Alcohol Use in the Past Year, by Age Group and State: Estimated Numbers (in Thousands), Annual Averages Based on 2012 and 2013 NSDUHs (continued)
State 12+
(Estimate)
12+ (95% Confidence
Interval) 12-17
(Estimate)
12-17 (95% Confidence
Interval) 18-25
(Estimate)
18-25 (95% Confidence
Interval) 26+
(Estimate)
26+ (95% Confidence
Interval)18+
(Estimate)
18+ (95% Confidence
Interval)
Nebraska 116 (98 - 137) 5 (4 - 7) 33 (28 - 38) 78 (62 - 97) 110 (93 - 131) Nevada 166 (136 - 201) 7 (5 - 9) 39 (33 - 47) 120 (94 - 152) 159 (130 - 194) New Hampshire 84 (71 - 99) 4 (3 - 6) 26 (22 - 30) 54 (43 - 68) 80 (67 - 95) New Jersey 465 (385 - 559) 20 (14 - 27) 124 (104 - 147) 321 (252 - 407) 445 (367 - 538) New Mexico 121 (100 - 147) 6 (5 - 8) 30 (25 - 36) 85 (66 - 108) 115 (94 - 140) New York 1,034 (925 - 1,156) 45 (38 - 55) 282 (253 - 315) 706 (606 - 822) 989 (880 - 1,110) North Carolina 450 (366 - 551) 21 (15 - 29) 129 (107 - 155) 300 (229 - 390) 428 (347 - 528) North Dakota 47 (40 - 55) 2 (1 - 3) 16 (14 - 19) 28 (23 - 35) 45 (38 - 52) Ohio 589 (526 - 659) 25 (21 - 31) 162 (147 - 180) 401 (343 - 468) 564 (502 - 633) Oklahoma 208 (171 - 252) 9 (7 - 12) 58 (49 - 69) 141 (109 - 181) 199 (163 - 242) Oregon 220 (183 - 264) 9 (7 - 13) 58 (48 - 68) 153 (121 - 193) 211 (175 - 254) Pennsylvania 669 (600 - 746) 30 (25 - 36) 198 (179 - 219) 441 (379 - 513) 639 (571 - 715) Rhode Island 71 (60 - 84) 2 (2 - 3) 22 (19 - 26) 46 (36 - 58) 69 (58 - 81) South Carolina 229 (189 - 278) 10 (8 - 14) 60 (50 - 72) 159 (124 - 203) 219 (180 - 267) South Dakota 50 (42 - 59) 2 (2 - 3) 15 (13 - 18) 33 (26 - 41) 48 (40 - 57) Tennessee 293 (239 - 357) 14 (11 - 19) 81 (68 - 97) 197 (152 - 255) 278 (226 - 341) Texas 1,379 (1,244 - 1,526) 68 (56 - 82) 386 (349 - 426) 925 (804 - 1,063) 1,311 (1,178 - 1,457) Utah 113 (92 - 138) 7 (5 - 10) 38 (31 - 46) 68 (52 - 89) 106 (86 - 129) Vermont 35 (29 - 42) 2 (1 - 2) 11 (9 - 13) 23 (18 - 29) 34 (28 - 40) Virginia 480 (401 - 574) 19 (14 - 25) 139 (117 - 163) 323 (255 - 407) 461 (384 - 553) Washington 403 (340 - 477) 17 (13 - 22) 107 (91 - 125) 279 (225 - 346) 386 (324 - 459) West Virginia 93 (77 - 112) 4 (3 - 6) 24 (20 - 29) 64 (50 - 82) 88 (73 - 107) Wisconsin 360 (302 - 427) 17 (12 - 22) 95 (81 - 111) 248 (197 - 310) 343 (287 - 410) Wyoming 37 (32 - 44) 2 (1 - 2) 10 (9 - 12) 25 (20 - 32) 36 (30 - 42)
NOTE: Needing But Not Receiving Treatment refers to respondents classified as needing treatment for alcohol, but not receiving treatment for an alcohol problem at a specialty facility (i.e., drug and alcohol rehabilitation facilities [inpatient or outpatient], hospitals [inpatient only], and mental health centers).
NOTE: State and census region estimates, along with the 95 percent Bayesian confidence (credible) intervals, are based on a survey-weighted hierarchical Bayes estimation approach and generated by Markov Chain Monte Carlo techniques. For the "Total U.S." row, design-based (direct) estimates and corresponding 95 percent confidence intervals are given.
Source: SAMHSA, Center for Behavioral Health Statistics and Quality, National Survey on Drug Use and Health, 2012 and 2013.
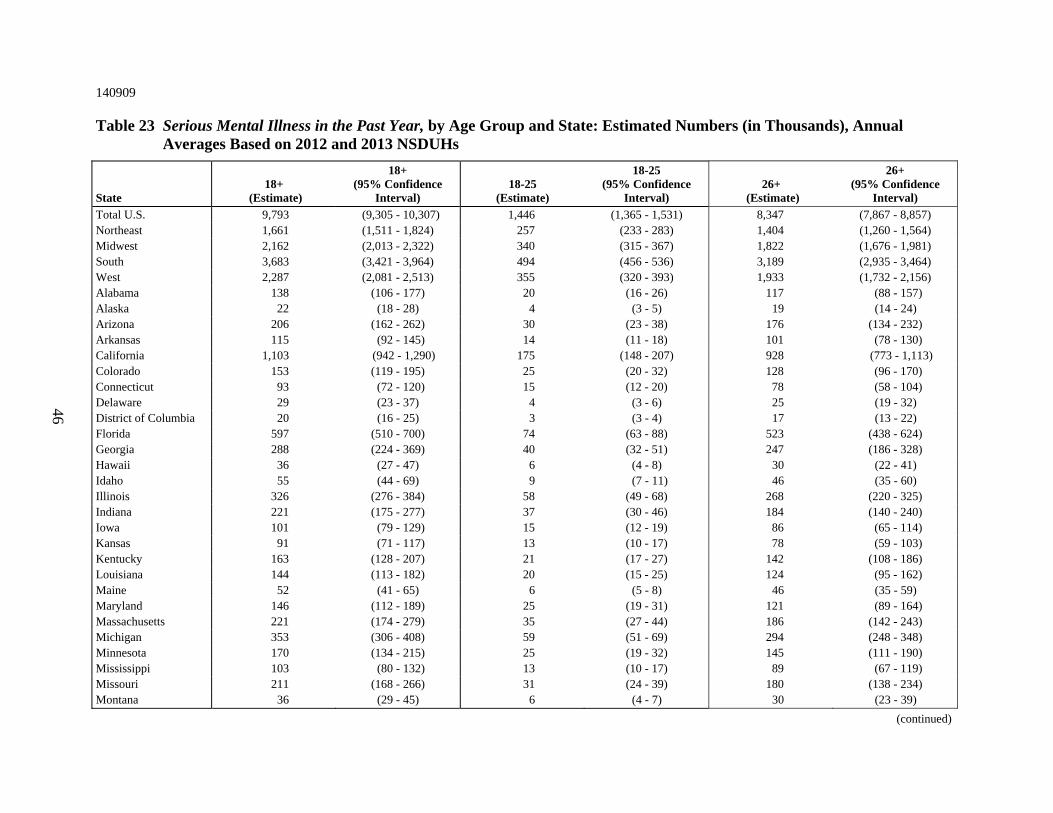
46
140909
Table 23 Serious Mental Illness in the Past Year, by Age Group and State: Estimated Numbers (in Thousands), Annual Averages Based on 2012 and 2013 NSDUHs
State 18+
(Estimate)
18+ (95% Confidence
Interval) 18-25
(Estimate)
18-25 (95% Confidence
Interval) 26+
(Estimate)
26+ (95% Confidence
Interval)
Total U.S. 9,793 (9,305 - 10,307) 1,446 (1,365 - 1,531) 8,347 (7,867 - 8,857) Northeast 1,661 (1,511 - 1,824) 257 (233 - 283) 1,404 (1,260 - 1,564) Midwest 2,162 (2,013 - 2,322) 340 (315 - 367) 1,822 (1,676 - 1,981) South 3,683 (3,421 - 3,964) 494 (456 - 536) 3,189 (2,935 - 3,464) West 2,287 (2,081 - 2,513) 355 (320 - 393) 1,933 (1,732 - 2,156) Alabama 138 (106 - 177) 20 (16 - 26) 117 (88 - 157) Alaska 22 (18 - 28) 4 (3 - 5) 19 (14 - 24) Arizona 206 (162 - 262) 30 (23 - 38) 176 (134 - 232) Arkansas 115 (92 - 145) 14 (11 - 18) 101 (78 - 130) California 1,103 (942 - 1,290) 175 (148 - 207) 928 (773 - 1,113) Colorado 153 (119 - 195) 25 (20 - 32) 128 (96 - 170) Connecticut 93 (72 - 120) 15 (12 - 20) 78 (58 - 104) Delaware 29 (23 - 37) 4 (3 - 6) 25 (19 - 32) District of Columbia 20 (16 - 25) 3 (3 - 4) 17 (13 - 22) Florida 597 (510 - 700) 74 (63 - 88) 523 (438 - 624) Georgia 288 (224 - 369) 40 (32 - 51) 247 (186 - 328) Hawaii 36 (27 - 47) 6 (4 - 8) 30 (22 - 41) Idaho 55 (44 - 69) 9 (7 - 11) 46 (35 - 60) Illinois 326 (276 - 384) 58 (49 - 68) 268 (220 - 325) Indiana 221 (175 - 277) 37 (30 - 46) 184 (140 - 240) Iowa 101 (79 - 129) 15 (12 - 19) 86 (65 - 114) Kansas 91 (71 - 117) 13 (10 - 17) 78 (59 - 103) Kentucky 163 (128 - 207) 21 (17 - 27) 142 (108 - 186) Louisiana 144 (113 - 182) 20 (15 - 25) 124 (95 - 162) Maine 52 (41 - 65) 6 (5 - 8) 46 (35 - 59) Maryland 146 (112 - 189) 25 (19 - 31) 121 (89 - 164) Massachusetts 221 (174 - 279) 35 (27 - 44) 186 (142 - 243) Michigan 353 (306 - 408) 59 (51 - 69) 294 (248 - 348) Minnesota 170 (134 - 215) 25 (19 - 32) 145 (111 - 190) Mississippi 103 (80 - 132) 13 (10 - 17) 89 (67 - 119) Missouri 211 (168 - 266) 31 (24 - 39) 180 (138 - 234) Montana 36 (29 - 45) 6 (4 - 7) 30 (23 - 39)
(continued)

47
140909
Table 23 Serious Mental Illness in the Past Year, by Age Group and State: Estimated Numbers (in Thousands), Annual Averages Based on 2012 and 2013 NSDUHs (continued)
State 18+
(Estimate)
18+ (95% Confidence
Interval) 18-25
(Estimate)
18-25 (95% Confidence
Interval) 26+
(Estimate)
26+ (95% Confidence
Interval)
Nebraska 58 (46 - 73) 9 (7 - 12) 49 (37 - 63) Nevada 85 (66 - 108) 12 (10 - 16) 73 (55 - 96) New Hampshire 41 (32 - 51) 7 (5 - 9) 34 (26 - 44) New Jersey 222 (172 - 285) 36 (28 - 46) 186 (139 - 248) New Mexico 66 (51 - 85) 10 (8 - 13) 56 (42 - 75) New York 566 (481 - 666) 88 (74 - 105) 478 (396 - 576) North Carolina 346 (268 - 444) 43 (34 - 55) 303 (228 - 400) North Dakota 22 (18 - 28) 5 (4 - 6) 18 (14 - 23) Ohio 403 (348 - 466) 56 (48 - 66) 346 (293 - 409) Oklahoma 140 (111 - 176) 17 (14 - 22) 122 (94 - 158) Oregon 146 (115 - 183) 20 (16 - 26) 125 (96 - 163) Pennsylvania 399 (340 - 467) 60 (51 - 71) 339 (283 - 405) Rhode Island 40 (31 - 51) 6 (5 - 8) 34 (26 - 45) South Carolina 156 (124 - 196) 22 (17 - 28) 134 (104 - 173) South Dakota 22 (17 - 28) 4 (3 - 5) 18 (14 - 25) Tennessee 224 (177 - 283) 29 (23 - 37) 195 (150 - 253) Texas 759 (649 - 887) 103 (86 - 124) 656 (550 - 781) Utah 107 (86 - 132) 21 (17 - 27) 85 (66 - 110) Vermont 27 (22 - 34) 4 (3 - 5) 24 (18 - 31) Virginia 240 (186 - 308) 35 (27 - 45) 205 (154 - 273) Washington 255 (203 - 318) 34 (27 - 43) 221 (171 - 283) West Virginia 75 (60 - 95) 9 (7 - 12) 66 (51 - 85) Wisconsin 184 (144 - 233) 28 (22 - 36) 155 (118 - 204) Wyoming 19 (15 - 23) 3 (2 - 4) 15 (12 - 20)
NOTE: Serious mental illness (SMI) is defined as having a diagnosable mental, behavioral, or emotional disorder, other than a developmental or substance use disorder, as assessed by the Mental Health Surveillance Study (MHSS) Structured Clinical Interview for the Diagnostic and Statistical Manual of Mental Disorders—Fourth Edition—Research Version—Axis I Disorders (MHSS-SCID), which is based on the 4th edition of the Diagnostic and Statistical Manual of Mental Disorders (DSM-IV). SMI includes individuals with diagnoses resulting in serious functional impairment. For details, see Section B of the "2011-2012 NSDUH: Guide to State Tables and Summary of Small Area Estimation Methodology" at http://www.samhsa.gov/data/population-data-nsduh/reports?tab=33.
NOTE: State and census region estimates, along with the 95 percent Bayesian confidence (credible) intervals, are based on a survey-weighted hierarchical Bayes estimation approach and generated by Markov Chain Monte Carlo techniques. For the "Total U.S." row, design-based (direct) estimates and corresponding 95 percent confidence intervals are given.
Source: SAMHSA, Center for Behavioral Health Statistics and Quality, National Survey on Drug Use and Health, 2012 and 2013.

48
140909
Table 24 Any Mental Illness in the Past Year, by Age Group and State: Estimated Numbers (in Thousands), Annual Averages Based on 2012 and 2013 NSDUHs
State 18+
(Estimate)
18+ (95% Confidence
Interval) 18-25
(Estimate)
18-25 (95% Confidence
Interval) 26+
(Estimate)
26+ (95% Confidence
Interval)
Total U.S. 43,778 (42,774 - 44,804) 6,764 (6,592 - 6,939) 37,014 (36,026 - 38,027) Northeast 7,808 (7,488 - 8,139) 1,224 (1,167 - 1,283) 6,584 (6,276 - 6,905) Midwest 9,410 (9,088 - 9,740) 1,466 (1,412 - 1,522) 7,944 (7,630 - 8,267) South 16,140 (15,599 - 16,698) 2,316 (2,224 - 2,410) 13,824 (13,295 - 14,372) West 10,420 (9,968 - 10,888) 1,758 (1,669 - 1,851) 8,662 (8,225 - 9,118) Alabama 703 (621 - 792) 98 (86 - 113) 604 (526 - 691) Alaska 96 (85 - 108) 17 (15 - 19) 80 (69 - 91) Arizona 892 (784 - 1,011) 138 (120 - 158) 754 (650 - 870) Arkansas 449 (398 - 504) 60 (52 - 68) 389 (340 - 443) California 5,278 (4,902 - 5,676) 937 (864 - 1,014) 4,341 (3,977 - 4,732) Colorado 670 (589 - 760) 108 (93 - 124) 562 (485 - 649) Connecticut 475 (417 - 539) 69 (59 - 80) 406 (351 - 468) Delaware 129 (114 - 146) 20 (18 - 23) 109 (94 - 125) District of Columbia 104 (92 - 117) 16 (14 - 18) 88 (77 - 100) Florida 2,554 (2,352 - 2,769) 336 (308 - 365) 2,218 (2,018 - 2,432) Georgia 1,364 (1,197 - 1,549) 186 (161 - 215) 1,178 (1,017 - 1,357) Hawaii 188 (165 - 214) 29 (25 - 33) 159 (136 - 184) Idaho 231 (204 - 260) 36 (31 - 41) 195 (170 - 224) Illinois 1,610 (1,488 - 1,740) 259 (238 - 281) 1,351 (1,232 - 1,480) Indiana 954 (847 - 1,071) 150 (131 - 171) 804 (701 - 918) Iowa 418 (367 - 473) 69 (60 - 79) 349 (301 - 402) Kansas 371 (325 - 422) 58 (50 - 67) 313 (269 - 362) Kentucky 646 (574 - 724) 96 (85 - 109) 549 (480 - 626) Louisiana 681 (604 - 765) 94 (82 - 108) 587 (513 - 669) Maine 225 (199 - 253) 27 (23 - 30) 198 (173 - 226) Maryland 740 (648 - 842) 117 (102 - 134) 623 (535 - 722) Massachusetts 1,005 (892 - 1,127) 168 (146 - 194) 836 (729 - 955) Michigan 1,509 (1,410 - 1,614) 233 (216 - 250) 1,277 (1,180 - 1,379) Minnesota 730 (642 - 827) 113 (98 - 130) 617 (533 - 711) Mississippi 416 (366 - 472) 55 (48 - 64) 361 (313 - 415) Missouri 863 (764 - 971) 124 (108 - 142) 739 (643 - 844) Montana 153 (136 - 172) 24 (21 - 27) 130 (113 - 148)
(continued)

49
140909
Table 24 Any Mental Illness in the Past Year, by Age Group and State: Estimated Numbers (in Thousands), Annual Averages Based on 2012 and 2013 NSDUHs (continued)
State 18+
(Estimate)
18+ (95% Confidence
Interval) 18-25
(Estimate)
18-25 (95% Confidence
Interval) 26+
(Estimate)
26+ (95% Confidence
Interval)
Nebraska 247 (217 - 279) 40 (35 - 45) 207 (179 - 238) Nevada 381 (335 - 432) 57 (50 - 65) 324 (280 - 374) New Hampshire 193 (171 - 217) 30 (26 - 34) 163 (142 - 186) New Jersey 1,055 (915 - 1,211) 167 (144 - 192) 888 (754 - 1,040) New Mexico 297 (263 - 334) 45 (39 - 52) 252 (219 - 288) New York 2,825 (2,618 - 3,044) 429 (394 - 466) 2,396 (2,196 - 2,610) North Carolina 1,347 (1,185 - 1,527) 185 (159 - 213) 1,163 (1,007 - 1,336) North Dakota 88 (77 - 99) 19 (16 - 21) 69 (59 - 80) Ohio 1,719 (1,607 - 1,837) 257 (239 - 276) 1,462 (1,353 - 1,578) Oklahoma 575 (510 - 647) 86 (75 - 98) 489 (426 - 559) Oregon 673 (597 - 756) 99 (86 - 113) 575 (502 - 655) Pennsylvania 1,768 (1,645 - 1,898) 292 (270 - 314) 1,476 (1,357 - 1,604) Rhode Island 165 (145 - 187) 26 (23 - 30) 139 (120 - 160) South Carolina 644 (566 - 729) 92 (80 - 106) 551 (477 - 634) South Dakota 105 (92 - 119) 18 (16 - 21) 87 (75 - 100) Tennessee 1,001 (893 - 1,118) 135 (118 - 153) 867 (763 - 980) Texas 3,394 (3,150 - 3,653) 526 (484 - 571) 2,868 (2,630 - 3,122) Utah 437 (391 - 487) 99 (87 - 111) 339 (295 - 387) Vermont 98 (87 - 110) 16 (14 - 18) 82 (71 - 94) Virginia 1,080 (952 - 1,221) 176 (153 - 202) 904 (782 - 1,041) Washington 1,039 (927 - 1,162) 158 (139 - 179) 881 (774 - 1,000) West Virginia 314 (280 - 351) 38 (33 - 43) 276 (243 - 313) Wisconsin 797 (700 - 904) 127 (111 - 144) 671 (578 - 774) Wyoming 83 (74 - 93) 13 (11 - 15) 70 (61 - 79)
NOTE: Any mental illness (AMI) is defined as having a diagnosable mental, behavioral, or emotional disorder, other than a developmental or substance use disorder, as assessed by the Mental Health Surveillance Study (MHSS) Structured Clinical Interview for the Diagnostic and Statistical Manual of Mental Disorders—Fourth Edition—Research Version—Axis I Disorders (MHSS-SCID), which is based on the 4th edition of the Diagnostic and Statistical Manual of Mental Disorders (DSM-IV). For details, see Section B of the "2011-2012 NSDUH: Guide to State Tables and Summary of Small Area Estimation Methodology" at http://www.samhsa.gov/data/population-data-nsduh/reports?tab=33.
NOTE: State and census region estimates, along with the 95 percent Bayesian confidence (credible) intervals, are based on a survey-weighted hierarchical Bayes estimation approach and generated by Markov Chain Monte Carlo techniques. For the "Total U.S." row, design-based (direct) estimates and corresponding 95 percent confidence intervals are given.
Source: SAMHSA, Center for Behavioral Health Statistics and Quality, National Survey on Drug Use and Health, 2012 and 2013.
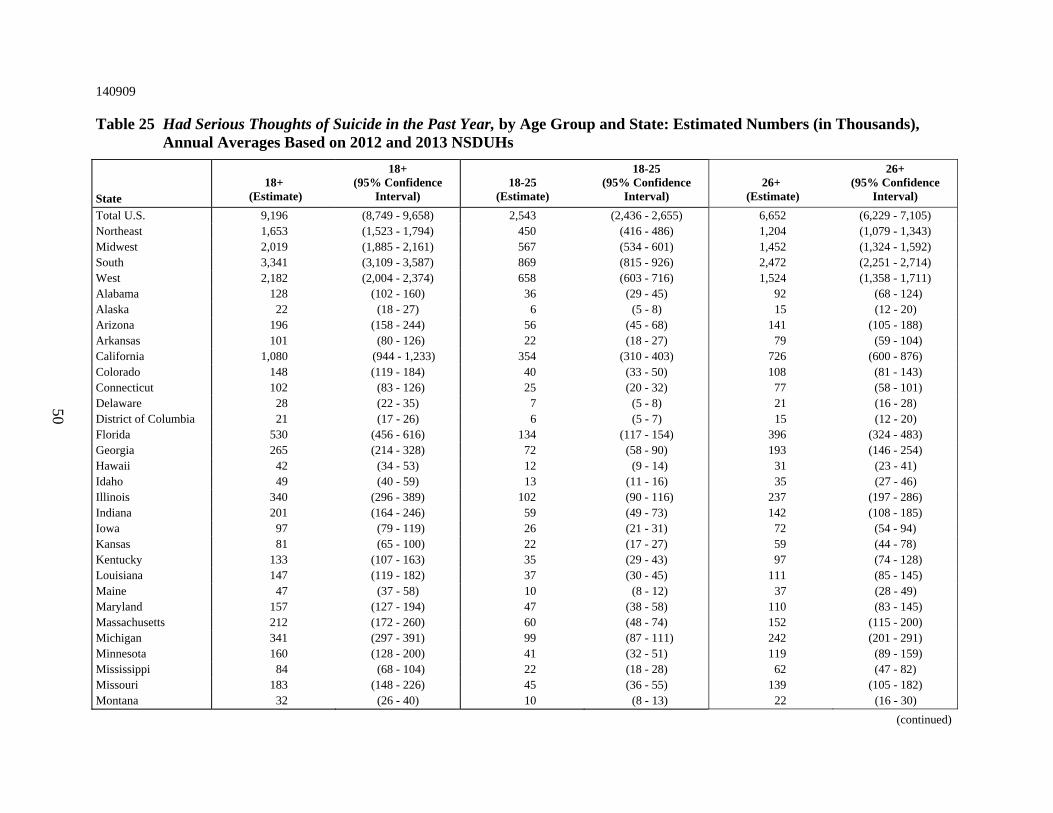
50
140909
Table 25 Had Serious Thoughts of Suicide in the Past Year, by Age Group and State: Estimated Numbers (in Thousands), Annual Averages Based on 2012 and 2013 NSDUHs
State 18+
(Estimate)
18+ (95% Confidence
Interval) 18-25
(Estimate)
18-25 (95% Confidence
Interval) 26+
(Estimate)
26+ (95% Confidence
Interval)
Total U.S. 9,196 (8,749 - 9,658) 2,543 (2,436 - 2,655) 6,652 (6,229 - 7,105) Northeast 1,653 (1,523 - 1,794) 450 (416 - 486) 1,204 (1,079 - 1,343) Midwest 2,019 (1,885 - 2,161) 567 (534 - 601) 1,452 (1,324 - 1,592) South 3,341 (3,109 - 3,587) 869 (815 - 926) 2,472 (2,251 - 2,714) West 2,182 (2,004 - 2,374) 658 (603 - 716) 1,524 (1,358 - 1,711) Alabama 128 (102 - 160) 36 (29 - 45) 92 (68 - 124) Alaska 22 (18 - 27) 6 (5 - 8) 15 (12 - 20) Arizona 196 (158 - 244) 56 (45 - 68) 141 (105 - 188) Arkansas 101 (80 - 126) 22 (18 - 27) 79 (59 - 104) California 1,080 (944 - 1,233) 354 (310 - 403) 726 (600 - 876) Colorado 148 (119 - 184) 40 (33 - 50) 108 (81 - 143) Connecticut 102 (83 - 126) 25 (20 - 32) 77 (58 - 101) Delaware 28 (22 - 35) 7 (5 - 8) 21 (16 - 28) District of Columbia 21 (17 - 26) 6 (5 - 7) 15 (12 - 20) Florida 530 (456 - 616) 134 (117 - 154) 396 (324 - 483) Georgia 265 (214 - 328) 72 (58 - 90) 193 (146 - 254) Hawaii 42 (34 - 53) 12 (9 - 14) 31 (23 - 41) Idaho 49 (40 - 59) 13 (11 - 16) 35 (27 - 46) Illinois 340 (296 - 389) 102 (90 - 116) 237 (197 - 286) Indiana 201 (164 - 246) 59 (49 - 73) 142 (108 - 185) Iowa 97 (79 - 119) 26 (21 - 31) 72 (54 - 94) Kansas 81 (65 - 100) 22 (17 - 27) 59 (44 - 78) Kentucky 133 (107 - 163) 35 (29 - 43) 97 (74 - 128) Louisiana 147 (119 - 182) 37 (30 - 45) 111 (85 - 145) Maine 47 (37 - 58) 10 (8 - 12) 37 (28 - 49) Maryland 157 (127 - 194) 47 (38 - 58) 110 (83 - 145) Massachusetts 212 (172 - 260) 60 (48 - 74) 152 (115 - 200) Michigan 341 (297 - 391) 99 (87 - 111) 242 (201 - 291) Minnesota 160 (128 - 200) 41 (32 - 51) 119 (89 - 159) Mississippi 84 (68 - 104) 22 (18 - 28) 62 (47 - 82) Missouri 183 (148 - 226) 45 (36 - 55) 139 (105 - 182) Montana 32 (26 - 40) 10 (8 - 13) 22 (16 - 30)
(continued)
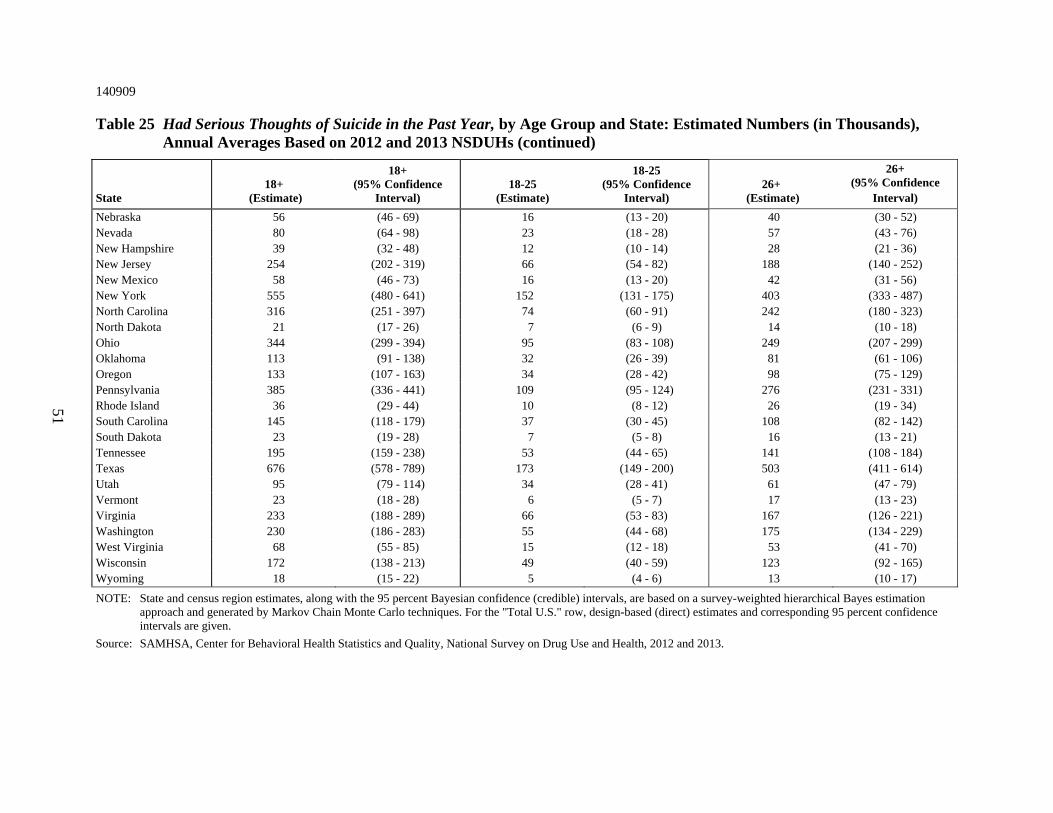
51
140909
Table 25 Had Serious Thoughts of Suicide in the Past Year, by Age Group and State: Estimated Numbers (in Thousands), Annual Averages Based on 2012 and 2013 NSDUHs (continued)
State 18+
(Estimate)
18+ (95% Confidence
Interval) 18-25
(Estimate)
18-25 (95% Confidence
Interval) 26+
(Estimate)
26+ (95% Confidence
Interval)
Nebraska 56 (46 - 69) 16 (13 - 20) 40 (30 - 52) Nevada 80 (64 - 98) 23 (18 - 28) 57 (43 - 76) New Hampshire 39 (32 - 48) 12 (10 - 14) 28 (21 - 36) New Jersey 254 (202 - 319) 66 (54 - 82) 188 (140 - 252) New Mexico 58 (46 - 73) 16 (13 - 20) 42 (31 - 56) New York 555 (480 - 641) 152 (131 - 175) 403 (333 - 487) North Carolina 316 (251 - 397) 74 (60 - 91) 242 (180 - 323) North Dakota 21 (17 - 26) 7 (6 - 9) 14 (10 - 18) Ohio 344 (299 - 394) 95 (83 - 108) 249 (207 - 299) Oklahoma 113 (91 - 138) 32 (26 - 39) 81 (61 - 106) Oregon 133 (107 - 163) 34 (28 - 42) 98 (75 - 129) Pennsylvania 385 (336 - 441) 109 (95 - 124) 276 (231 - 331) Rhode Island 36 (29 - 44) 10 (8 - 12) 26 (19 - 34) South Carolina 145 (118 - 179) 37 (30 - 45) 108 (82 - 142) South Dakota 23 (19 - 28) 7 (5 - 8) 16 (13 - 21) Tennessee 195 (159 - 238) 53 (44 - 65) 141 (108 - 184) Texas 676 (578 - 789) 173 (149 - 200) 503 (411 - 614) Utah 95 (79 - 114) 34 (28 - 41) 61 (47 - 79) Vermont 23 (18 - 28) 6 (5 - 7) 17 (13 - 23) Virginia 233 (188 - 289) 66 (53 - 83) 167 (126 - 221) Washington 230 (186 - 283) 55 (44 - 68) 175 (134 - 229) West Virginia 68 (55 - 85) 15 (12 - 18) 53 (41 - 70) Wisconsin 172 (138 - 213) 49 (40 - 59) 123 (92 - 165) Wyoming 18 (15 - 22) 5 (4 - 6) 13 (10 - 17)
NOTE: State and census region estimates, along with the 95 percent Bayesian confidence (credible) intervals, are based on a survey-weighted hierarchical Bayes estimation approach and generated by Markov Chain Monte Carlo techniques. For the "Total U.S." row, design-based (direct) estimates and corresponding 95 percent confidence intervals are given.
Source: SAMHSA, Center for Behavioral Health Statistics and Quality, National Survey on Drug Use and Health, 2012 and 2013.

52
140909
Table 26 Had at Least One Major Depressive Episode in the Past Year, by Age Group and State: Estimated Numbers (in Thousands), Annual Averages Based on 2012 and 2013 NSDUHs
State 18+
(Estimate)
18+ (95% Confidence
Interval)12-17
(Estimate)
12-17 (95% Confidence
Interval)18-25
(Estimate)
18-25 (95% Confidence
Interval)26+
(Estimate)
26+ (95% Confidence
Interval)Total U.S. 15,989 (15,375 - 16,627) 2,457 (2,361 - 2,556) 3,058 (2,933 - 3,187) 12,932 (12,330 - 13,562) Northeast 2,803 (2,606 - 3,013) 386 (360 - 414) 530 (493 - 570) 2,272 (2,084 - 2,477) Midwest 3,470 (3,277 - 3,673) 527 (499 - 556) 676 (639 - 714) 2,794 (2,608 - 2,992) South 5,929 (5,597 - 6,279) 912 (864 - 961) 1,063 (1,004 - 1,124) 4,866 (4,546 - 5,207) West 3,788 (3,523 - 4,071) 633 (589 - 679) 789 (733 - 849) 2,999 (2,748 - 3,272) Alabama 229 (185 - 282) 37 (30 - 44) 45 (37 - 55) 183 (143 - 235) Alaska 38 (31 - 46) 6 (5 - 7) 8 (7 - 10) 29 (23 - 37) Arizona 339 (273 - 418) 59 (49 - 71) 61 (50 - 75) 278 (216 - 355) Arkansas 160 (131 - 196) 24 (20 - 29) 28 (23 - 34) 132 (105 - 166) California 1,864 (1,653 - 2,101) 327 (292 - 365) 405 (359 - 455) 1,459 (1,261 - 1,687) Colorado 246 (199 - 303) 39 (32 - 47) 48 (39 - 59) 198 (154 - 252) Connecticut 173 (140 - 212) 27 (22 - 33) 31 (26 - 38) 141 (111 - 179) Delaware 49 (40 - 60) 6 (5 - 8) 10 (8 - 11) 40 (31 - 50) District of Columbia 36 (29 - 44) 2 (2 - 3) 7 (6 - 9) 29 (23 - 36) Florida 910 (794 - 1,042) 134 (119 - 150) 149 (131 - 169) 762 (650 - 891) Georgia 490 (397 - 602) 71 (58 - 86) 86 (70 - 105) 404 (318 - 512) Hawaii 69 (56 - 86) 9 (8 - 12) 13 (11 - 16) 56 (43 - 72) Idaho 86 (72 - 103) 15 (12 - 18) 18 (15 - 22) 68 (55 - 84) Illinois 538 (471 - 613) 97 (86 - 109) 112 (99 - 127) 426 (361 - 500) Indiana 351 (292 - 421) 53 (44 - 64) 69 (57 - 83) 282 (227 - 349) Iowa 168 (139 - 203) 24 (20 - 29) 35 (29 - 42) 133 (106 - 166) Kansas 143 (117 - 174) 23 (19 - 28) 28 (23 - 34) 115 (91 - 144) Kentucky 230 (188 - 279) 31 (26 - 37) 40 (33 - 48) 190 (151 - 238) Louisiana 213 (172 - 262) 34 (28 - 41) 39 (31 - 48) 174 (136 - 222) Maine 84 (70 - 102) 11 (9 - 13) 13 (11 - 15) 72 (58 - 89) Maryland 283 (228 - 351) 47 (39 - 57) 55 (45 - 67) 229 (177 - 294) Massachusetts 346 (285 - 418) 42 (35 - 52) 66 (54 - 80) 280 (224 - 349) Michigan 560 (500 - 625) 82 (73 - 92) 114 (102 - 127) 445 (389 - 509) Minnesota 267 (216 - 328) 35 (28 - 43) 50 (41 - 62) 216 (169 - 276) Mississippi 159 (129 - 196) 22 (18 - 27) 26 (21 - 32) 134 (105 - 169) Missouri 333 (273 - 404) 47 (39 - 56) 61 (51 - 74) 271 (215 - 341) Montana 55 (45 - 66) 7 (6 - 8) 11 (9 - 13) 44 (35 - 55)
(continued)
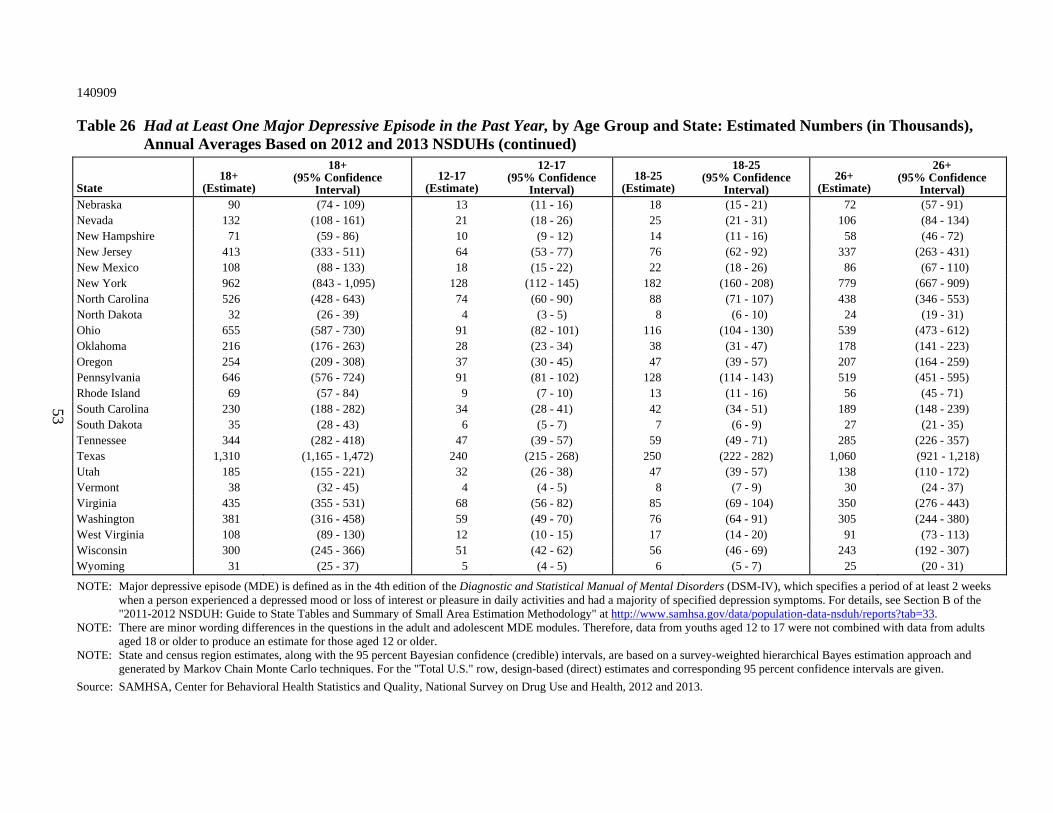
53
140909
Table 26 Had at Least One Major Depressive Episode in the Past Year, by Age Group and State: Estimated Numbers (in Thousands), Annual Averages Based on 2012 and 2013 NSDUHs (continued)
State 18+
(Estimate)
18+ (95% Confidence
Interval)12-17
(Estimate)
12-17 (95% Confidence
Interval)18-25
(Estimate)
18-25 (95% Confidence
Interval)26+
(Estimate)
26+ (95% Confidence
Interval)Nebraska 90 (74 - 109) 13 (11 - 16) 18 (15 - 21) 72 (57 - 91) Nevada 132 (108 - 161) 21 (18 - 26) 25 (21 - 31) 106 (84 - 134) New Hampshire 71 (59 - 86) 10 (9 - 12) 14 (11 - 16) 58 (46 - 72) New Jersey 413 (333 - 511) 64 (53 - 77) 76 (62 - 92) 337 (263 - 431) New Mexico 108 (88 - 133) 18 (15 - 22) 22 (18 - 26) 86 (67 - 110) New York 962 (843 - 1,095) 128 (112 - 145) 182 (160 - 208) 779 (667 - 909) North Carolina 526 (428 - 643) 74 (60 - 90) 88 (71 - 107) 438 (346 - 553) North Dakota 32 (26 - 39) 4 (3 - 5) 8 (6 - 10) 24 (19 - 31) Ohio 655 (587 - 730) 91 (82 - 101) 116 (104 - 130) 539 (473 - 612) Oklahoma 216 (176 - 263) 28 (23 - 34) 38 (31 - 47) 178 (141 - 223) Oregon 254 (209 - 308) 37 (30 - 45) 47 (39 - 57) 207 (164 - 259) Pennsylvania 646 (576 - 724) 91 (81 - 102) 128 (114 - 143) 519 (451 - 595) Rhode Island 69 (57 - 84) 9 (7 - 10) 13 (11 - 16) 56 (45 - 71) South Carolina 230 (188 - 282) 34 (28 - 41) 42 (34 - 51) 189 (148 - 239) South Dakota 35 (28 - 43) 6 (5 - 7) 7 (6 - 9) 27 (21 - 35) Tennessee 344 (282 - 418) 47 (39 - 57) 59 (49 - 71) 285 (226 - 357) Texas 1,310 (1,165 - 1,472) 240 (215 - 268) 250 (222 - 282) 1,060 (921 - 1,218) Utah 185 (155 - 221) 32 (26 - 38) 47 (39 - 57) 138 (110 - 172) Vermont 38 (32 - 45) 4 (4 - 5) 8 (7 - 9) 30 (24 - 37) Virginia 435 (355 - 531) 68 (56 - 82) 85 (69 - 104) 350 (276 - 443) Washington 381 (316 - 458) 59 (49 - 70) 76 (64 - 91) 305 (244 - 380) West Virginia 108 (89 - 130) 12 (10 - 15) 17 (14 - 20) 91 (73 - 113) Wisconsin 300 (245 - 366) 51 (42 - 62) 56 (46 - 69) 243 (192 - 307) Wyoming 31 (25 - 37) 5 (4 - 5) 6 (5 - 7) 25 (20 - 31)
NOTE: Major depressive episode (MDE) is defined as in the 4th edition of the Diagnostic and Statistical Manual of Mental Disorders (DSM-IV), which specifies a period of at least 2 weeks when a person experienced a depressed mood or loss of interest or pleasure in daily activities and had a majority of specified depression symptoms. For details, see Section B of the "2011-2012 NSDUH: Guide to State Tables and Summary of Small Area Estimation Methodology" at http://www.samhsa.gov/data/population-data-nsduh/reports?tab=33.
NOTE: There are minor wording differences in the questions in the adult and adolescent MDE modules. Therefore, data from youths aged 12 to 17 were not combined with data from adults aged 18 or older to produce an estimate for those aged 12 or older.
NOTE: State and census region estimates, along with the 95 percent Bayesian confidence (credible) intervals, are based on a survey-weighted hierarchical Bayes estimation approach and generated by Markov Chain Monte Carlo techniques. For the "Total U.S." row, design-based (direct) estimates and corresponding 95 percent confidence intervals are given.
Source: SAMHSA, Center for Behavioral Health Statistics and Quality, National Survey on Drug Use and Health, 2012 and 2013.

54