2012-2013 annual report of the athletic council … fileathletic council university of massachusetts...
TRANSCRIPT

Sen. Doc. No. 14-035
2012-2013 ANNUAL REPORT
OF THE
ATHLETIC COUNCIL
UNIVERSITY OF MASSACHUSETTS AMHERST
Presented at the 737th Regular Meeting of the Faculty Senate
April 17, 2014
MEMBERSHIP LIST
Representing the Faculty Tim Anderson
Marilyn Billings (Fall 2012) Anne Moore (Spring 2013)
Samuel Hazen Nelson Lacey (Co-Chair)
Tracy Schoenadel Rebecca Spencer (Co-Chair)
Rod Warnick (Secretary) Patricia Vittum
Representing the Alumni
Robert Goodhue George Richason James Sullivan
Ed Ward JC Schnabel
Representing the Students (Graduate and Undergraduate)
Robin Anderson Nicholas J. Avanzato
Evan Briere Ben Johnson (Fall Semester)
Rick Jones Emily Boucher James Murray
Avery Nagy-Normyle
Ex-Officio Members Ernest May (voting, Faculty Senate)
John McCutcheon (non-voting, Director of Athletics) Steve Upton (voting, University Advancement designee)
Glenn Wong (voting, NCAA Faculty Athletic Representative)

Sen. Doc. No. 14-035
I. ATHLETIC COUNCIL OVERVIEW
According to Section 3: paragraph 5-3-1 of the Bylaws of the University of Massachusetts at Amherst’s Faculty Senate, The Athletic Council …
“shall implement the ‘Statement of Athletic Policy’ adopted by the Board of Trustees on February 14, 1957, and any resolution which the board may adopt thereafter. Consistent with present policies on admissions and academic standards, the Intercollegiate Athletic Program shall be developed to a point where it is representative of the best efforts of the University, with aims and ideals of achievement comparable to those expected of the academic departments. This development shall proceed in accord with policies and regulations of the NCAA, and all athletic conferences in which the University maintains membership. The Intramural Athletic Program shall be staffed and equipped to meet the needs of all students who desire to participate, and the University shall encourage participation through a varied program including sports with carry-over value for life after graduation. All athletic accounts shall be open to review by the President of the Student Government Association or a designee. This council shall submit an annual report both to the Faculty Senate and the Undergraduate Senate, which shall include a detailed breakdown of all athletic program budgets.
A. Introduction. In accordance with its mission, the Athletic Council (hereafter the Council) held eight regularly scheduled meetings during the academic year 2012/2013. Each of six subcommittees (Finance, Facilities, Compliance, Academics, Equity, and Vision) met outside the regularly scheduled meeting times to focus on issues within their purview. A summary of each of the subcommittee reports appears in the Appendix of this report. The Council’s meetings were organized around an agenda that included but was not limited to (1) brief overviews from representatives of the Athletic department, (2) discussion of items of current interest to the Council, (3) reports from the sub-committees, and (4) reports from invited guests. Last year’s Athletic department representatives included Athletic Director John McCutcheon, Executive Associate Athletic Director Jaime Seguin, Senior Women’s Administrator Elaine Sortino, Associate Athletic Director Kim Callicoatte, Associate Athletic Director Joan Hopkins, and a variety of coaches and administrators from the department. Last year’s special invited guests included John Micheletto, Head Ice Hockey Coach; Joe Balzano from Facilities Planning and the Design Team from Perkins and Will for Design of McGuirk Support Building and Press Box; Chancellor Subbaswamy; John Blihar, Director of the Campus Recreation; Joan Hopkins, Associate Athletic Director of Academic Support Services; Jeff Smith, Associate Athletic Director for Sports Medicine; Tim Anderson, Director of the UMass Marching Band; Brett Albert, Research Economist for REMI, Amherst, MA; and Pete Montague, Academic Support Services and Staff Advisor to the Student Athlete Advisory Committee. In addition to issues that faced the Council on an on-going basis, four topics dominated the agenda over 2012/ 2013:
1. Priority Registration and impact on student athletes 2. Conference realignment and football’s move to the FBS division 3. Pro-forma financials and athletic budget reports 4. Rules Committee charges and reviews of the Ad Hoc FBS Football Committee
B. Council Structure. The membership list of the Council includes eight faculty members (appointed by the Faculty Senate), four members appointed by the Alumni Association, four ex-officio members (Director of Athletics, NCAA Faculty Athletics Representative, Secretary of the Faculty Senate, and a

Sen. Doc. No. 14-035 designee from the office of the Vice Chancellor for University Advancement) and eight student members (with one student slot reserved for the SGA president or designee, and one student slot reserved for the president of the Graduate Student Senate or a designee). The full roster of the Athletic Council appears on the cover page of this document. Each member of the Athletic Council is also appointed to one of six (6) subcommittees. These appointments are listed in this report.
C. Attendance Records: Attendance records for the 2012-13 year (meetings attended/meetings eligible as member) for each member of the Council:
Faculty (F), Alumni (A), and Ex-Officio (X) Billings (F)................. 3/4 (Fall Only) Spencer (F) .........................7/7 Goodhue (A) .............. 5/7 Upton (A) ...........................5/7 May (X) ..................... 6/7 Vittum (F) ..........................7/7 McCutcheon (X) ........ 6/7 Moore (F) Spring Only ......0/3 Ward (A) ................... 7/7 Anderson (F).......................7/7 Warnick (F)................ 7/7 Lacey (F)............................6/7 Richason (A) .............. 7/7 Schoenadel (F) ........... 6/7 Wong (X) ...........................7/7 Sullivan (A) ............... 0/7 Hazen (F)............................6/7 Student Representative Attendance (Student appointments began in October)
Anderson ................... 0/6 Avanzato ................... 5/6 Boucher ................... 0/6 Briere………………..5/6 Jones……................... 0/6 Johnson……………...2/4 (Fall Only) Murray....................... 0/6 Nagy- Normyle……..0/6 D. Meetings Schedule – 2012-2013 Academic Year. Council meetings took place on:
In Fall Semester 2012: September 12; October 12; November 16; December 14 In Spring Semester 2013: February 20; March 1; April 12 (Cancelled); May 4.
Sen. Doc. No. 14-035 II. OVERVIEW OF THE ATHLETIC COUNCIL’S 2012-2013 ACTIVITIES The Athletic Council is responsible for making recommendations on policy and providing advice on general operations of the Athletic Department at the University of Massachusetts, Amherst. The Athletic Department has long been visible regionally and nationally, achieving success both in the classroom and on the playing fields among its 21 athletic teams and nearly 700 student athletes. The University maintains its long tradition of balance between academics and athletics.
The 2012-13 year was dominated by the move by the football program to the Football Bowl Subdivision (FBS) and the responses from the Rules Committee and statements made by the Ad Hoc Committee on FBS Football; however, other important accomplishments were noted by the Council during the academic year. While the agenda was dominated by a variety of important issues for the Athletic Department, perhaps the most difficult issue felt by the department and the council was the loss of long time Senior Women’s Athletic Administrator and Head Softball Coach Elaine Sortino, who passed away in August 2013 from a prolonged and courageous battle with cancer. The Athletic Department also completed the process to rename the softball field, “Sortino Field” in the fall of 2012 attended by many of her former players, family, friends, faculty and staff. She will be missed by all for her dedication and commitment to UMass, UMass Athletics and especially to the prominence and remembrance of her beloved softball teams and players. In 2012-2013, the Athletic Director John McCutcheon, and Executive Associate Athletic Director, Jaime Seguin continued to keep the Athletic Council informed of the financial aspects of the move to FBS Football and of ongoing changes to the conference realignment possibilities and the respective challenges. The Finance subcommittee was provided a detailed pro-forma analysis of the expected financial impacts and the reports were both thorough and open to full transparency and in context of the programmatic changes. The Athletic Council members were representatives on the Ad Hoc Committee on FBS Football and those activities are reflected in that committee’s report. Highlights from the 2012-2013 Academic Year for the Athletic Council included:
1. Introduction of the New Men’s Ice Hockey Coach – John Micheletto.
2. Continued review and advancement of priority registration for student athletes in both semesters – including competing and non-competing semesters and the advancement of a proposed recommendation to extend to both semesters. Priority registration for both semesters was approved in July 2013.
3. Proposed recommendation for joint Ad Hoc FBS Football Committee meetings with AC Finance Subcommittee meetings for efficiency and timely meeting purposes without duplication and redundancy of reporting and accountability purposes.
4. Facility presentation and discussions of the final project designs and location of the McGuirk Athletic Support Building and Press Box, the completion of the UMass Rowing Team Boathouse and the design of the proposed Champions Center.
5. Report from Tim Anderson, Director of the UMass Marching Band, updating the Council about the
impact of UMass Football on the UMass Marching Band. 6. Report from Jeff Smith, Associate Athletic Director of Sports Medicine, on concussion research and
the how to lessen concussion risk for student-athletes.

Sen. Doc. No. 14-035
7. Chancellor Subbaswamy addressed to the Athletic Council and expressed his support and dedication to high quality athletics and the move to FBS Football as part of the commitment and timing of the issue.
8. Continued and ongoing discussion about the various conference realignment issues and the impacts on UMass with regard to A10 Conference, MAC, Hockey East and various other sport team impacts.
9. Report of the Recreation Center by John Blihar including the continued success of use and programming of the facility for the student population and the “2012 Facility of Merit Award” for the Recreation Center by Athletic Business. The annual participation report from Campus Recreation Department is also included here in the Appendix.
10. Presentation by Brett Albert, Research Economist from REMI, Inc. of Amherst, MA on “A Comprehensive Approach to Valuing the University of Massachusetts Football Program.”
11. A recommendation to the Rules Committee was made by the Athletic Council at the February 2013 meeting regarding the process by which the Ad Hoc Football Committee Interim Report was prepared and presented to the Faculty Senate and how the information in the report was used for purposes not within the charge of the committee. This included a proposal statement that was voted upon unanimously and sent forward to the Rules Committee regarding the status, preparation and process by which the report was prepared and how committee members were excluded from the process and how proper procedures were not followed. The initial recommendation was sent back to the Athletic Council stating that the Rules Committee does not monitor or enforce the actions of councils and committees. The Athletic Council submitted a revised recommendation to the Rules Committee at the March 2013 meeting.
12. On going monitoring and reporting of the Athletic Department budgets and revenue sources through the Finance Subcommittee. The department continues to remain within its approved budget and has increased outside revenue sources while holding steady the subsidy from the University.
The minutes of the Athletic Council are all posted online at the Faculty Senate site and may be reviewed for more detailed discussion and review of topics, invited guests and vote outcomes of the councils and its recommendations.

Sen. Doc. No. 14-035 III. Subcommittee Reports The following six subcommittees were comprised of the following members:
1. Finance: Lacey (Co-Chair), Richason (Co-Chair) Goodhue, Avanzato, Schoenadel, Ward, and Warnick. Staff – Seguin and McCutcheon
2. Compliance: Warnick (Chair), Schoenadel, Schnabl, Spencer, Vittum, Wong. Staff -- Callicoatte
3. Academics: Lacey (Co-Chair) Spencer (Co-Chair), Anderson, Goodhue, Hazen, Jones, Richason, Staff - Hopkins
4. Facilities: Ward (Chair), Vittum, Upton, Briere, Anderson, Schnabl, Avanzato, Warnick Staff -- Markowski
5. Equity: Billings, Hazen, Lacey, Schoenadel, Sortino, Spencer. Staff – Sortino (note – with the passing of Elaine Sortino, Jaime Seguin assisted in the final report preparation)
6. Vision: Goodhue (Co-Chair), Hazen (Co-Chair); Richason, Upton, Ward, Lacey, Anderson, Jones, Briere, Avanzato. Staff – Callicoatte and McCutcheon
This Annual Report concludes with the highlights of each of the subcommittee reports and the actual summary reports of each of the subcommittee are contained in the Appendices along with one additional report filed by guest research economist, Brett Albert of REMI, Inc. of Amherst, MA. (See appendices here for reports.)

Sen. Doc. No. 14-035
Highlights of Subcommittee Reports Academics
§ Monitored academic progress of student athletes and provided academic support services. § Considered and reviewed the impacts of priority registration for both in-season and out-of-season
teams and athletes in course registration. Noted success and implications of academic progress in completing degrees for student athletes and how well received this program change has been over the past two years. Sent forward a letter recommending implementation to cover both seasons – in-season and out-of-season semesters.
§ Attended SAAC Meetings to monitor and hear concerns regarding academic issues and the quality of student athlete experiences.
Compliance
§ Reviewed the MAC Conference Compliance Report § Supported and recommended the implementation of reporting mechanisms and the quality of the
reporting currently undertaken by the Compliance Office and its staff § Monitored APRs, special NCAA funding, and special needs funding § Reviewed and noted violations – 7 reported minor violations and the remedies for corrections,
supported corrective actions. § Participated as a review committee of an NCAA Inquiry from January 2013 regarding practices, video
filming, and conditioning/training techniques of the football program. Conducted staff and student athlete interviews and prepared a report and findings summary regarding the inquiry, allegations, and outcomes.
Equity and Diversity
§ Information provided by the University of Massachusetts Office of Institutional Research and stated on the Equity in Athletics Disclosure Act (EADA) report indicated that there were 10,431 males (51.7%) and 9,746 females (48.3%) full-time, baccalaureate, degree-seeking undergraduate students enrolled at the University of Massachusetts for Fall of 2012.
§ Using the EADA guidelines, the duplicated participation for all sports for the 2012-13 academic year were 379 men (49.9%) and 380 women (50.1%). The unduplicated participation for all sports for the 2012-13 academic year were 331 men (51.6%) and 311 women (48.4%). UMass is compliant on gender equity.
§ Regarding diversity, the Department of Athletics provides the NCAA with information on ethnicity of student- athletes through submission of the annual Sports Sponsorship Report. The data for 2012-13 show a total minority percentage of 24.9% (160/642). Further defined by gender, the total for males was 30.5% (102) and 18.3% (58) for females.
§ In regard to student-athletes receiving athletic aid, there were a total of 113 minority student-athletes in 2012-13 receiving athletic aid, which corresponds to 29.7%. The percentage for males was 37.6% (74) and 21.3% (39) for females receiving athletic aid awards.
§ The amount of scholarship dollars provided to student-athletes for the 2012-13 academic year is as follows: 57.9% went to males and 42.1% went to females. This gender discrepancy was anticipated as the department transitioned into FBS Football and phased in the scholarship aid for females and the challenges of granting scholarship aid to women in the recruiting process.
§ The Athletic Department continues to conduct exit interviews and due to challenges and staff health issues hopes to improve response rates in 2013-2014.

Sen. Doc. No. 14-035 Facilities
§ Participated in the review of the on-going projects and planned projects for the Athletic Department. § Reviewed the siting of the Champions Center. § Reviewed the final plans and participated in ground-breaking programs for McGuirk Athletic Support
Building and Press Box. § Identified projects in the planning and need stages including enhancements to the Lorden Field
(baseball); lighting at Sortino Field (softball); and turf replacement at both McGuirk and Garber Fields due to use demands.
Vision
§ Responded as appropriate to strategic planning process. § Met as a committee to review the planning process and response statement of the Athletic Department. § Addressed these key components of the strategic plan – 1) unifying factor; 2) rallying point for alumni;
and 3) the need to mobilize for success of the program.
Finance
§ Continued to monitor the Athletic Department budgets, including the actuals for 2012-2013 and projected for 2014.
§ Participated in joint meeting with the Ad Hoc Committee on FBS Football where and when appropriate.
Sen. Doc. No. 14-035
Appendices – Athletic Council Subcommittee Reports
Academic Year 2012 – 2013
Sen. Doc. No. 14-035
Athletic Council Academics Subcommittee Report for Spring 2012
May 3, 2013 Boyden Conference Room
Attendees – R. Spencer (subcommittee chair), S. Hazen, J. Hopkins Absent – R. Goodhue, T. Anderson, J. Schnabl, G. Richason The Academic Subcommittee met to get a report from the academics support staff on use and changes over the past semester. This office produces an annual report in the summer that will be reviewed in the fall. Thus, spring numbers are less extensive but there were a number of points nonetheless of note:
-‐ Fall 2013 cumulative GPA for all sports was 3.046. The campus-wide GPA is not available for comparison. Other fall numbers (of 662 student-athletes):
§ 4 men’s and 7 women’s teams had a fall GPA > 3.0 § 363 student-athletes (54%) were named to the Maroon Scholars List for a GPA ≥ 3.0 § 157 student-athletes (24%) were named to the Dean’s List (GPA ≥ 3.5) § 23 student-athletes (3%) had a GPA of 4.0 § 62 student-athletes (9%) are members of the Commonwealth Honors College
-‐ Tutoring use has risen recently. The increase is thought to be associated with the implementation of “Grades
First”, an advising/tutoring management program that allows student-athletes to request tutors on-line. This has resulted in costs going over-budget. Notably, a significant amount of tutor-use was by students with a GPA ≥ 3.0, and those using more than one tutor. Thus, to control costs, student-athletes with a GPA ≥ 2.5 will be restricted to a tutor for 1 subject at a time and for 1 hr/week and will be referred to free on-campus tutoring for all other requests.
-‐ There were 34 Chi Sigma Alpha inductees – Chi Alpha Sigma is a national honorary society for student-athletes with a minimum GPA ≥ 3.4 and junior standing.
-‐ SAAC activities included: Crocker Farms Elementary School Breakfasts, Toy Drive for Shriners Hospital, Big Brothers Big Sisters Bowl-a-Thon, Judges for Chili Cook-off, read to children at Fort River Elementary School, served as members of the Vice Chancellor’s Student Leadership Advisory Council, Spring Social Event, assisted with branding, third place in the A-10 SAAC video contest (theme ‘Evolution of the Student Athlete), developed Zamboni contest for hockey games for the Marketing Department.
-‐ Maroon Connections Week activities: § Spring:
§ Freshmen: Senior Panel “Who Knows Best?” § Sophomores: Resume Boot Camp § Juniors: Art of Networking event, Northwestern Mutual
§ Fall: § Freshmen: The Power of Being A Student Athlete 101, Career Athletes § Sophomores: The Money Game with Eric Smith § Juniors: The Money Game with Eric Smith § Seniors: The Power of Being a Student-Athlete 201, Career Athletes
Additionally, the Academics Subcommittee has assisted in developing a proposal for increased priority registration (RAM) for off-season student-athletes. The draft will likely be submitted in summer 2013.

Sen. Doc. No. 14-035 Student-Athlete Advisory Committee The Athletic Department continues to sponsor this committee to enhance the total student athlete experience. The group increases the awareness of opportunities through the sharing of information, discussing issues regarding student-athlete welfare, and fostering a positive student-athlete image. The Student-Athlete Advisory Committee (SAAC) met 10 times during the school year, five times each semester. There was an average of 15-25 representatives at each meeting. Some highlights from the 2012-13 academic year:
• Some representatives were involved in related organizations. Katie Bettencourt and Callie Sweigart were part of SAAC at the A-10 Conference level. They took part in regular conference calls, and UMass sent a student-athlete to the in-person meeting during the 2013 summer. Jocelyn Providence and Beau Garufi served on the Student Leadership Advisory Council, where they collaborated with other student leaders across campus.
• To increase support at their respective competitions, we paired up "Buddy Teams". Each team picked a home
competition or "Big Game" that was likely to be their most important of the season, and their buddy team is responsible for either attending the competition or making a nice gesture to let the other team know they were supported.
• We continued the practice of opening every meeting with “athletic superlatives”, which gives each team a
chance to talk about what has happened with their team since our last meeting. This is meant to engender respect between teams.
• The fall BBQ was cancelled due in part to the mosquito-borne illness concerns.
• There were two end-of-year gatherings. The student-athlete picnic got merged with sesquicentennial
celebrations, which enabled current student-athletes to meet and hear from a handful of alumni student-athletes from 1963. SAAC also organized a study break on Reading Day where they rented the practice rink for skating and games. Although we did not have the numbers that were expected, the feedback about the event was positive.
• SAAC conducted a toy drive on behalf of Shriners Hospital for Children in Springfield, MA, in December. It
collected about a dozen boxes of toys from teammates and other staff members in athletics in addition to collecting from the general public at two men's basketball games and two ice hockey games. Seven student-athletes traveled to deliver the toys to the children and spend time with them.
• SAAC sent about 8-10 student-athletes to eat breakfast and spend time with children at Crocker Farms
Elementary School on one Friday during both the fall and spring semesters.
• SAAC submitted teams of four to participate in the Big Brothers Big Sisters of Hampshire County bowl-a-thon in April. UMass had 12 student-athletes from seven different athletic teams take part in raising awareness for this cause.
• Approximately 15-20 student-athletes handed out glow sticks at a men’s basketball game to raise awareness
for the American Cancer Society.
• Six student-athletes visited Fort River Elementary School to read to the children during their Book Fair and judge their chili cook-off.
• SAAC raised on average $100 per game by conducting the Zamboni contest for the marketing department
prior every ice hockey game.

Sen. Doc. No. 14-035
• UMass finished third in the Atlantic 10 Conference video competition. This year’s topic was the evolution of the student-athlete.
• There are two projects that will extend into next academic year. SAAC is working on developing a branding concept for what it means to be a UMass student-athlete. The results could be integrated into marketing, fund-raising, recruiting, and the physical plant. Also, SAAC wants to develop a blog where they could provide content that shows multiple sides of the student-athlete.

Sen. Doc. No. 14-035
Compliance Subcommittee Report
Meeting Subcommittee Dates: February 1, 2013 (Fall Semester Report) and May 8, 2013 (Spring Semester Report) Additional Review Committee Meetings: The Compliance Subcommittee met with the Compliance Office and staff on the following dates; February 1, March 5, April 1, April 19 and May 3, 2013 for additional purposes for the NCAA institutional review inquiry. The Subcommittee reviewed:
§ The documentations of seven (7) minor violations involving Men’s Basketball, Crew, and Tennis teams that were self-reported and considered minor infractions where corrective institutional actions have been taken. These violations included reimbursement for a meal and minor institutional infractions with Twitter communication.
§ The APR will be certified and reviewed this fall with noted compliance review of Football transfers and Men’s Basketball. Examined waivers for NCAA eligibility requirements and medical red-shirts.
§ Examined compliance agendas and meetings including publications put out by the Compliance Office for coaches and staff.
§ Reviewed pending NCAA legislation and addressed potential impacts on the Athletic Department.
§ Reviewed the work of the FAR including A10 meetings, governance issues, pay to play issues, and eligibility requirements to be imposed that are more stringent.
§ Participated in one Transfer Appeals Committee meeting and hearing regarding a student athlete appeal to transfer in the Spring 2013. Completed interviews and filed finding.
§ Glenn Wong will be stepping down as Faculty Athletic Representative but will be available to help with the new FAR’s transition. Glenn continued to provide reviews of the Transfer Appeals Committee, the Professional Student Athlete Counseling Committee, and the Athletic Communications Committee. The new FAR is expected to be named sometime within the next few weeks (early summer).
§ The subcommittee did receive an NCAA institutional review inquiry regarding practice times and summer workouts of the football program in January 2013. The subcommittee was heavily involved in the review process and filed a review report to the NCAA in the late spring/early summer. This review required regular meetings and an extensive set of interviews of staff and student athletes and updates and reporting by the Athletic Department Compliance Office. The outcome of this review was not known during this review reporting period.

Sen. Doc. No. 14-035
Equity, Minority Opportunities and Student-Athlete Welfare Equity Subcommittee Report of the Athletic Council
2012-2013 Academic Year
The role of the Equity Minority opportunities and Student-Athlete Welfare Subcommittee is to monitor and report on Title IX compliance, gender, minority, and student-athlete welfare within the Athletic Department. Participation Information provided by the University of Massachusetts Office of Institutional Research and stated on the Equity in Athletics Disclosure Act (EADA) report indicated that there were 10,431 males (51.7%) and 9,746 females (48.3%) full-time, baccalaureate, degree-seeking undergraduate students enrolled at the University of Massachusetts for Fall of 2012. Based on the following EADA participation guidelines a participant is a student-athlete who, as of the day of a varsity team’s first scheduled contest in the traditional season:
• is listed as a team member; • practices with the varsity team and receives coaching from one or more varsity coaches; or • receives athletically –related student aid.
Any student who satisfies one or more of the criteria above is a participant, including a student on a team the institution designates or defines as junior varsity, freshman, or novice, or a student who does not play in a scheduled contest, whether for medical reasons or to preserve eligibility (i.e., a redshirt). Student-athletes who participate in more than more sport should be counted in each sport. Male practice players are NOT to be included as participants. Using the EADA guidelines, the duplicated participation for all sports for the 2012-13 academic year were 379 men (49.9%) and 380 women (50.1%). The unduplicated participation for all sports for the 2012-13 academic year were 331 men (51.6%) and 311 women (48.4%). Student-Athlete Minority Opportunity The Department of Athletics provides the NCAA with information on ethnicity of student- athletes through submission of the annual Sports Sponsorship Report. The data for 2012-13 show a total minority percentage of 24.9% (160/642). Further defined by gender, the total for males was 30.5% (102) and 18.3% (58) for females. In regard to student-athletes receiving athletic aid, there were a total of 113 minority student-athletes in 2012-13 receiving athletic aid, which corresponds to 29.7%. The percentage for males was 37.6% (74) and 21.3% (39) for females receiving athletic aid awards. % of Minority Student-
Athletes % of Minority Student-Athletes on Aid
Women 18.35% 21.31%
Men 30.54% 37.56%
Total 24.92% 29.74%
Scholarships The amount of scholarship dollars provided to student-athletes for the 2012-13 academic year is as follows:
Males $4,933,395 (57.9%) Females $3,587,295 (42.1%)
Sen. Doc. No. 14-035 It should be noted that these figures include all scholarships, winter session aid, summer session aid, and books. The Department anticipated this increase on the men’s side with the move to FBS Football. Student Athlete Welfare Group and Diversity Committee: These committees were created to be a vital resource in the department for discussing and promoting opportunities to enhance student- athlete welfare and diversity. Both committees were created and chaired by the SWA and were comprised of various administrative staff such as the Associate Athletic Director for Academics, Compliance, and Sports Medicine. Unfortunately, due the health of the SWA these committees did not meet during the 2012-13 academic year. Exit Interviews The Athletic Department continues its practice of conducting exit interviews with student-athletes who have exhausted their eligibility. These interviews were provided to all student-athletes who completed eligibility in their respective sport(s) via an online survey instrument. In addition, 10% -20% of all seniors were interviewed in-person by senior athletic administrators. For 2012-13, we relied heavily on the individual interviews as we experienced a significant lack of response from seniors who received the on-line instrument, due to the timing of the distribution of the surveys and a lack of follow-up. We have had a change in personnel and are hopeful that for 2013-14 we will have a much better response rate. Athletic Department Staffing The Athletic Department remains committed in its efforts to encourage and recruit minority applicants. Whenever a search is conducted, the department advertises positions with the NCAA Black Coaches Association (this organization is currently in transition and not available to advertise with moving forward), the Springfield Newspapers, and continues to use the NCAA Diversity and Inclusion Participant Profiles. The Athletic Department will continue to work with the UMass Equal Opportunity and Diversity Office (EO&D) to try and find new advertising mediums and ways to attract a diverse pool of candidates for all open positions. In 2012-13 the department consisted of:
• 151 full-time and part-time employees o 97 male and 54 female (35.8%) o 15 minority employees (9.9%)
§ 11 FT and 4 PT § 12 male and 3 female
In 2012-13:
• 26 full time positions were filled in Athletics and the breakdown is as follows: o 15 male and 11 female o Of the 26 hires 3 were minority males o Of the 26 hires 18 of these positions were coaches
§ Of the 18 coaches hired 10 were male (3 minority male) and 8 were female o Of the 26 hires 8 of these positions were administrative
§ Of the 8 administrators hired 5 were male and 3 were female Blackmer Student Project Jaime Seguin also discussed the student-athlete wellness group that implements ideas for diversity through the “Blackmer Student Project.”
Sen. Doc. No. 14-035
Facilities Subcommittee Report
Facilities- Subcommittee Chair Ed Ward reviewed his meeting with Dan Markowski, Associate AD for Facilities and Subcommittee Members. The following projects are completed, underway and planned:
§ The Football Performance Center Building Project - $34.5 Million project with 55 thousand square feet did break ground this spring and is on track for completion in July or summer of 2014. The completion of the Football Complex, including the Football Performance Center and the Press Box are part of this project. A separate utilities project is also in progress that will provided upgraded utility service to the stadium area.
§ The New Champions Center Complex estimated at $28.5 million with over 50 thousand square feet housing basketball practice courts; strength and conditioning areas; coaches offices, film rooms and Hall of UMass Basketball highlights. Construction will be fully underway in September 2014 with preliminary designs nearly final now.
§ The New UMass Boathouse is nearly complete and launch docks have been installed on the Connecticut River. Signage on the Complex will fully reveal and introduce travelers on US Route 9 after crossing the Coolidge Bridge that they have arrive at UMass.
§ Planning stages for lights at Sortino Field and Softball Complex to host more and larger tournaments in the future are underway.
§ McGuirk and Garber Fields’ turf needs to be replaced soon. Increased use has led to the need for replacement sooner than expected.
§ Tennis Courts needs to be rebuilt and this work should take place soon.
§ The Recreation Center will be shut down for one week for floor renovations.

Sen. Doc. No. 14-035
Athletic Council Vision Subcommittee Athletics and the UMass Strategic Plan
Overview. At the April 12, 2013 Athletic Council meeting, the Vision Subcommittee was charged with the responsibility of meeting the request of the Faculty Senate Rules Committee to respond to three critical statements of the University Strategic Plan being reviewed and developed under the guidance of the Chancellor and the University’s Strategic Planning Committee. To this end, the Visions Subcommittee met on April 18, 2013 to review the critical statements. It was discussed that the Athletic Department will begin to participate in the next round of the strategic planning process and these broad statements should serve as a starting point. The Athletic Department’s current Strategic Plan (dated 2010 to 2015??) was discussed and will likely be updated with the University Strategic Plan. This discussion resulted in the following proposed statement to be presented to the Athletic Council as the initial step in the planning process. Statement on Strategic Planning Process as Prepared by Vision Subcommittee Intercollegiate athletics, intramural, clubs sports and fitness services collectively are a key feature of the high quality of life experienced at UMass Amherst. They encourage an active, healthy lifestyle, and promote student development and leadership. Athletics is one of our clear differentiators from so-called sister and competitor or comparable peer institutions. Athletics establishes UMass Amherst as “the destination of choice for the next generation of the Commonwealth’s high school graduate.” Athletics serves as a unifying factor for on-campus student life. While students are increasingly compartmentalized within colleges and residence housing complexes, “Athletics” transcends these campus divisions by providing and maintaining common facilities to exercise and compete. Entertainment provided by intercollegiate competition is a unifying factor on-campus as well as a solid link between eastern and western Massachusetts and to the New England Region. Students, faculty, and staff enjoy a healthy active lifestyle and the Commonwealth enjoys the camaraderie of routing for UMass intercollegiate athletics. Furthermore, it serves as a focal point for creating awareness through news and external views into the University with media appearances and publicity. Athletics establishes UMass Amherst as “the investment of choice in the next generation of the Commonwealth’s progress.” Athletics serve as a rallying point for alumni. Successful athletics and national exposure enhances academic reputation, increases the number of applicants, reduces acceptance rates, raises average incoming SAT scores, and increases alumni athletic donations. Alumni Homecoming is always coupled with athletic competition and is an obvious point of creating “community” on campus, for the university, the alumni and the Commonwealth’s pride. UMass Athletics is also “mobilizing for success.” The last major addition to athletics facilities was the Recreation Center and it quickly became one of the most popular destinations on campus. New facilities projects will have a far reaching and positive impact on campus life. Boathouse construction is nearly complete and launch docks have been installed on the Connecticut River for our notable woman’s rowing team and serves as a focal point and campus corridor introduction. Facilities dedicated to practice and training for football, and men’s and women’s basketball will be completed by the summer of 2014 and will serve to advance both programs into higher levels of prominence. New athletics facilities are perfectly aligned with the goals of current campus construction of new classrooms, laboratories, and residence halls to raise the campus to the level of a major, land-grant institution of higher learning.

Sen. Doc. No. 14-035
Finance Subcommittee Report
The Finance Subcommittee of the Athletic Council reviewed the projected/actual 2012- 2013 (FY 2013) and the projected 2013-2014 (FY 14) during the course of the academic year and those full reports may be found at the Faculty Senate website. The subcommittee met jointly with the Ad Hoc FBS Football Committee when possible and some of the findings are available through their reporting as well. Co-Chair Lacey and Rod Warnick discussed the May 1st Faculty Senate Meeting and the Annual Report which included a review of the Athletic Department’s 2013 Fiscal Year (2012-2013). The only comment at the May 1st meeting was a sincere “thank you” to the Athletic Council for their great work and thorough reporting in the advisory capacity and communication with the Faculty Senate and the operations of the Athletic Department. The council noted the contributions and transparency in the financial reporting presented by Jaime Seguin and the Athletic Department, including the full discussion and explanations by John McCutcheon for the dedicated work with the Finance Subcommittee and meetings with the Ad Hoc FBS Football Committee. Highlights of the FY 2013 (the projected actuals) were shared along with the projections and budget forecasts for Fiscal Year 2014 (2013-2014) has many “moving parts.” Both of these budgets will be finalized later in the summer and eventually reported to the Faculty Senate in the Fall Semester 2013. The Actual Athletic Department Budget (FY 2012-2013 or FY 2013) and Projected 2013-2014 (FY 2014) Athletic Department Budget were presented to the Faculty Senate in November 2013.

Sen. Doc. No. 14-035
This report documents the actual for the FY 2013 and the project FY 2014, including overall budget summary, team summary, expense detail, team expense projected 2014,
administrative expense projected 2014; and football projected 2013, actual 2013 and projected 2014.
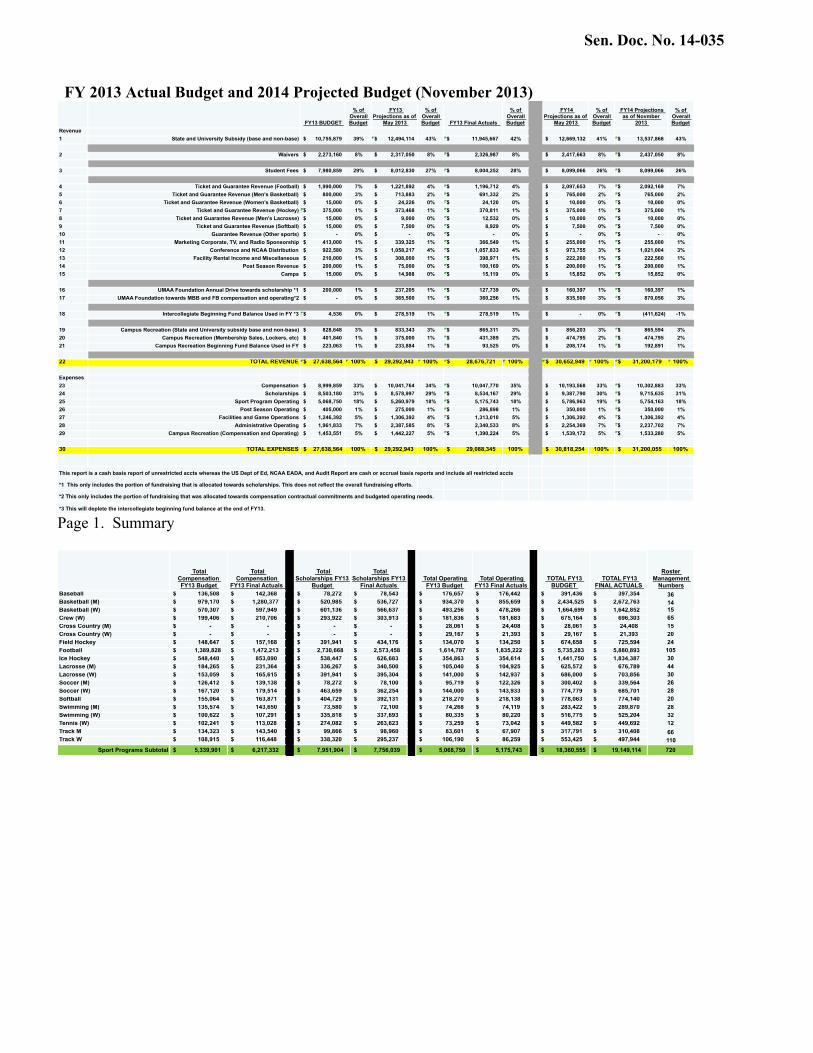
Sen. Doc. No. 14-035 FY 2013 Actual Budget and 2014 Projected Budget (November 2013)
Page 1. Summary
FY13 BUDGET
% of Overall Budget
FY13 Projections as of
May 2013
% of Overall Budget FY13 Final Actuals
% of Overall Budget
FY14 Projections as of
May 2013
% of Overall Budget
FY14 Projections as of Novmber
2013
% of Overall Budget
Revenue1 State and University Subsidy (base and non-base) $ 10,755,879 39% $ 12,494,114 43% $ 11,945,667 42% $ 12,669,132 41% $ 13,537,868 43%
2 Waivers $ 2,273,160 8% $ 2,317,050 8% $ 2,326,987 8% $ 2,417,663 8% $ 2,437,050 8%
3 Student Fees $ 7,980,859 29% $ 8,012,830 27% $ 8,004,252 28% $ 8,099,066 26% $ 8,099,066 26%
4 Ticket and Guarantee Revenue (Football) $ 1,990,000 7% $ 1,221,892 4% $ 1,196,712 4% $ 2,097,653 7% $ 2,092,169 7%5 Ticket and Guarantee Revenue (Men's Basketball) $ 800,000 3% $ 713,883 2% $ 691,332 2% $ 765,000 2% $ 765,000 2%6 Ticket and Guarantee Revenue (Women's Basketball) $ 15,000 0% $ 24,226 0% $ 24,120 0% $ 10,000 0% $ 10,000 0%7 Ticket and Guarantee Revenue (Hockey) $ 375,000 1% $ 373,468 1% $ 370,811 1% $ 375,000 1% $ 375,000 1%8 Ticket and Guarantee Revenue (Men's Lacrosse) $ 15,000 0% $ 9,000 0% $ 12,532 0% $ 10,000 0% $ 10,000 0%9 Ticket and Guarantee Revenue (Softball) $ 15,000 0% $ 7,500 0% $ 8,929 0% $ 7,500 0% $ 7,500 0%10 Guarantee Revenue (Other sports) $ - 0% $ - 0% $ - 0% $ - 0% $ - 0%11 Marketing Corporate, TV, and Radio Sponsorship $ 413,000 1% $ 339,325 1% $ 366,549 1% $ 255,000 1% $ 255,000 1%12 Conference and NCAA Distribution $ 922,580 3% $ 1,058,217 4% $ 1,057,833 4% $ 973,755 3% $ 1,021,004 3%13 Facility Rental Income and Miscellaneous $ 210,000 1% $ 308,000 1% $ 398,971 1% $ 222,260 1% $ 222,560 1%14 Post Season Revenue $ 200,000 1% $ 75,000 0% $ 100,169 0% $ 200,000 1% $ 200,000 1%15 Camps $ 15,000 0% $ 14,988 0% $ 15,119 0% $ 15,852 0% $ 15,852 0%
16 UMAA Foundation Annual Drive towards scholarship *1 $ 200,000 1% $ 237,205 1% $ 127,739 0% $ 160,397 1% $ 160,397 1%17 UMAA Foundation towards MBB and FB compensation and operating*2 $ - 0% $ 365,500 1% $ 360,256 1% $ 835,500 3% $ 870,056 3%
18 Intercollegiate Beginning Fund Balance Used in FY *3 $ 4,536 0% $ 278,519 1% $ 278,519 1% $ - 0% $ (411,624) -1%
19 Campus Recreation (State and University subsidy base and non-base) $ 828,648 3% $ 833,343 3% $ 865,311 3% $ 856,203 3% $ 865,594 3%20 Campus Recreation (Membership Sales, Lockers, etc) $ 401,840 1% $ 375,000 1% $ 431,389 2% $ 474,795 2% $ 474,795 2%21 Campus Recreation Beginning Fund Balance Used in FY $ 223,063 1% $ 233,884 1% $ 93,525 0% $ 208,174 1% $ 192,891 1%
22 TOTAL REVENUE $ 27,638,564 100% $ 29,292,943 100% $ 28,676,721 100% $ 30,652,949 100% $ 31,200,179 100%
Expenses23 Compensation $ 8,999,859 33% $ 10,041,764 34% $ 10,047,770 35% $ 10,193,568 33% $ 10,302,883 33%24 Scholarships $ 8,503,180 31% $ 8,578,997 29% $ 8,534,167 29% $ 9,387,790 30% $ 9,715,635 31%25 Sport Program Operating $ 5,068,750 18% $ 5,260,979 18% $ 5,175,743 18% $ 5,786,963 19% $ 5,754,163 18%26 Post Season Operating $ 405,000 1% $ 275,000 1% $ 286,898 1% $ 350,000 1% $ 350,000 1%27 Facilities and Game Operations $ 1,246,392 5% $ 1,306,392 4% $ 1,313,010 5% $ 1,306,392 4% $ 1,306,392 4%28 Administrative Operating $ 1,961,833 7% $ 2,387,585 8% $ 2,340,533 8% $ 2,254,369 7% $ 2,237,702 7%29 Campus Recreation (Compensation and Operating) $ 1,453,551 5% $ 1,442,227 5% $ 1,390,224 5% $ 1,539,172 5% $ 1,533,280 5%
30 TOTAL EXPENSES $ 27,638,564 100% $ 29,292,943 100% $ 29,088,345 100% $ 30,818,254 100% $ 31,200,055 100%
This report is a cash basis report of unrestricted accts whereas the US Dept of Ed, NCAA EADA, and Audit Report are cash or accrual basis reports and include all restricted accts
*1 This only includes the portion of fundraising that is allocated towards scholarships. This does not reflect the overall fundraising efforts.
*2 This only includes the portion of fundraising that was allocated towards compensation contractual commitments and budgeted operating needs.
*3 This will deplete the intercollegiate beginning fund balance at the end of FY13.
Total Compensation FY13 Budget
Total Compensation
FY13 Final Actuals
Total Scholarships FY13
Budget
Total Scholarships FY13
Final Actuals Total Operating
FY13 Budget Total Operating
FY13 Final Actuals TOTAL FY13
BUDGET TOTAL FY13
FINAL ACTUALS
Roster Management
NumbersBaseball $ 136,508 $ 142,368 $ 78,272 $ 78,543 $ 176,657 $ 176,442 $ 391,436 $ 397,354 36Basketball (M) $ 979,170 $ 1,280,377 $ 520,985 $ 536,727 $ 934,370 $ 855,659 $ 2,434,525 $ 2,672,763 14Basketball (W) $ 570,307 $ 597,949 $ 601,136 $ 566,637 $ 493,256 $ 478,266 $ 1,664,699 $ 1,642,852 15Crew (W) $ 199,406 $ 210,706 $ 293,922 $ 303,913 $ 181,836 $ 181,683 $ 675,164 $ 696,303 65Cross Country (M) $ - $ - $ - $ - $ 28,061 $ 24,408 $ 28,061 $ 24,408 15Cross Country (W) $ - $ - $ - $ - $ 29,167 $ 21,393 $ 29,167 $ 21,393 20Field Hockey $ 148,647 $ 157,168 $ 391,941 $ 434,176 $ 134,070 $ 134,250 $ 674,658 $ 725,594 24Football $ 1,389,828 $ 1,472,213 $ 2,730,668 $ 2,573,458 $ 1,614,787 $ 1,835,222 $ 5,735,283 $ 5,880,893 105Ice Hockey $ 548,440 $ 853,090 $ 538,447 $ 626,683 $ 354,863 $ 354,614 $ 1,441,750 $ 1,834,387 30Lacrosse (M) $ 184,265 $ 231,364 $ 336,267 $ 340,500 $ 105,040 $ 104,925 $ 625,572 $ 676,789 44Lacrosse (W) $ 153,059 $ 165,615 $ 391,941 $ 395,304 $ 141,000 $ 142,937 $ 686,000 $ 703,856 30Soccer (M) $ 126,412 $ 139,138 $ 78,272 $ 78,100 $ 95,719 $ 122,326 $ 300,402 $ 339,564 26Soccer (W) $ 167,120 $ 179,514 $ 463,659 $ 362,254 $ 144,000 $ 143,933 $ 774,779 $ 685,701 28Softball $ 155,064 $ 163,871 $ 404,729 $ 392,131 $ 218,270 $ 218,138 $ 778,063 $ 774,140 20Swimming (M) $ 135,574 $ 143,650 $ 73,580 $ 72,100 $ 74,268 $ 74,119 $ 283,422 $ 289,870 28Swimming (W) $ 100,622 $ 107,291 $ 335,818 $ 337,693 $ 80,335 $ 80,220 $ 516,775 $ 525,204 32Tennis (W) $ 102,241 $ 113,028 $ 274,082 $ 263,623 $ 73,259 $ 73,042 $ 449,582 $ 449,692 12Track M $ 134,323 $ 143,540 $ 99,866 $ 98,960 $ 83,601 $ 67,907 $ 317,791 $ 310,408 66Track W $ 108,915 $ 116,448 $ 338,320 $ 295,237 $ 106,190 $ 86,259 $ 553,425 $ 497,944 110
Sport Programs Subtotal $ 5,339,901 $ 6,217,332 $ 7,951,904 $ 7,756,039 $ 5,068,750 $ 5,175,743 $ 18,360,555 $ 19,149,114 720

Sen. Doc. No. 14-035 Page 2. Team Summary
Page 3. Expense FY 13 Detail
Page 4. Team Expense FY 14 Projected
Total Compensation FY13 Budget
Total Compensation
FY13 Final Actuals
Total Scholarships FY13
Budget
Total Scholarships FY13
Final Actuals Total Operating
FY13 Budget Total Operating
FY13 Final Actuals TOTAL FY13
BUDGET TOTAL FY13
FINAL ACTUALS
Post Season Subtotal $ 30,000 $ 41,157 $ - $ - $ 405,000 $ 286,898 $ 435,000 $ 328,056
Facilities $ 728,543 $ 773,552 $ - $ - $ 303,579 $ 227,078 $ 1,032,122 $ 1,000,630 Men and Women's Sports Game Ops $ - $ - $ - $ - $ 894,502 $ 1,024,506 $ 894,502 $ 1,024,506 Stadium $ - $ - $ - $ - $ 48,311 $ 61,425 $ 48,311 $ 61,425
Facilities/Game Ops Subtotal $ 728,543 $ 773,552 $ - $ - $ 1,246,392 $ 1,313,010 $ 1,974,935 $ 2,086,562
Academics $ 371,526 $ 391,458 $ - $ - $ 106,476 $ 149,555 $ 478,002 $ 541,013 Administration General (including benefits; utility and custodial recharges; one-time marketing campaign, etc) $ 590,905 $ 605,553 $ 551,275 $ 778,128 $ 1,078,616 $ 1,427,296 $ 2,220,797 $ 2,810,978 Business Office $ 315,505 $ 333,692 $ - $ - $ - $ - $ 315,505 $ 333,692 Camps $ - $ - $ - $ - $ 15,000 $ 22,839 $ 15,000 $ 22,839 Cheerleading $ 13,680 $ 13,752 $ - $ - $ 24,280 $ 20,994 $ 37,960 $ 34,746 Compliance $ 175,569 $ 180,940 $ - $ - $ - $ - $ 175,569 $ 180,940 Development $ 149,166 $ 161,421 $ - $ - $ - $ - $ 149,166 $ 161,421 External Relations $ 165,967 $ 176,448 $ - $ - $ - $ - $ 165,967 $ 176,448 Marketing and Sales $ 184,885 $ 201,876 $ - $ - $ 194,958 $ 183,359 $ 379,843 $ 385,235 Media Relations $ 179,487 $ 183,913 $ - $ - $ 118,584 $ 112,904 $ 298,071 $ 296,816 Radio and Television (Broadcasting) $ 95,453 $ 69,567 $ - $ - $ 19,821 $ 18,531 $ 115,275 $ 88,098 Sports Medicine $ 410,121 $ 434,038 $ - $ - $ 310,461 $ 331,055 $ 720,582 $ 765,093 Strength and Conditioning $ 163,365 $ 172,929 $ - $ - $ 29,742 $ 20,832 $ 193,107 $ 193,761 Ticket Operations $ 85,786 $ 90,142 $ - $ 63,895 $ 53,169 $ 149,681 $ 143,311
Administration/General Subtotal $ 2,901,416 $ 3,015,729 $ 551,275 $ 778,128 $ 1,961,833 $ 2,340,533 $ 5,414,524 $ 6,134,389
Subtotal Intercollegiate Expenses $ 8,999,859 $ 10,047,770 $ 8,503,180 $ 8,534,167 $ 8,681,974 $ 9,116,184 $ 26,185,013 $ 27,698,121
Campus Recreation $ 988,769 $ 1,022,085 $ - $ - $ 464,781 $ 368,139 $ 1,453,551 $ 1,390,224
TOTAL EXPENSES FY13 $ 9,988,629 $ 11,069,854 $ 8,503,180 $ 8,534,167 $ 9,146,756 $ 9,484,323 $ 27,638,564 $ 29,088,345
Total Compensation FY14 Projections
May 2013
Total Compensation FY14 Projections November 2013
Total Scholarships FY14 Projections
May 2013
Total Scholarships FY14 Projections November 2013
Total Operating FY14 Projections
May 2013
Total Operating FY14 Projections November 2013
TOTAL FY14 Projections May
2013
TOTAL FY14 Projections
November 2013
Roster Management
NumbersBaseball $ 146,391 $ 159,281 $ 81,990 $ 84,195 $ 198,657 $ 181,657 $ 427,037 $ 425,133 36Basketball (M) $ 1,323,914 $ 1,362,995 $ 546,192 $ 571,555 $ 1,034,370 $ 1,034,370 $ 2,904,476 $ 2,968,920 14Basketball (W) $ 599,053 $ 620,289 $ 630,221 $ 659,486 $ 498,256 $ 498,256 $ 1,727,530 $ 1,778,032 15Crew (W) $ 218,240 $ 215,203 $ 383,004 $ 394,742 $ 181,836 $ 181,836 $ 783,080 $ 791,781 65Cross Country (M) $ - $ - $ - $ - $ 28,061 $ 28,061 $ 28,061 $ 28,061 15Cross Country (W) $ - $ - $ - $ - $ 29,167 $ 29,167 $ 29,167 $ 29,167 20Field Hockey $ 160,301 $ 162,738 $ 437,314 $ 427,317 $ 144,070 $ 144,070 $ 741,685 $ 734,125 24Football $ 1,679,262 $ 1,679,413 $ 2,991,439 $ 3,118,804 $ 2,075,000 $ 2,075,000 $ 6,745,700 $ 6,873,217 105Ice Hockey $ 533,737 $ 550,742 $ 564,023 $ 579,196 $ 384,863 $ 384,863 $ 1,482,623 $ 1,514,800 30Lacrosse (M) $ 233,365 $ 237,459 $ 352,240 $ 361,715 $ 115,040 $ 115,040 $ 700,645 $ 714,215 44Lacrosse (W) $ 163,401 $ 166,268 $ 410,484 $ 427,317 $ 148,000 $ 148,000 $ 721,885 $ 741,585 30Soccer (M) $ 148,525 $ 136,719 $ 81,990 $ 84,195 $ 125,719 $ 110,719 $ 356,234 $ 331,633 26Soccer (W) $ 174,344 $ 178,323 $ 485,606 $ 505,895 $ 148,000 $ 144,000 $ 807,950 $ 828,218 28Softball $ 166,613 $ 162,855 $ 423,899 $ 442,033 $ 238,270 $ 227,170 $ 828,783 $ 832,059 20Swimming (M) $ 136,788 $ 139,052 $ 77,075 $ 79,149 $ 84,268 $ 89,268 $ 298,131 $ 307,468 28Swimming (W) $ 116,019 $ 117,918 $ 389,328 $ 400,519 $ 90,335 $ 95,335 $ 595,682 $ 613,772 32Tennis (W) $ 114,609 $ 115,946 $ 287,071 $ 314,310 $ 73,259 $ 73,259 $ 474,939 $ 503,515 12Track M $ 144,782 $ 147,322 $ 104,610 $ 107,424 $ 83,601 $ 87,901 $ 332,993 $ 342,647 66Track W $ 117,455 $ 119,516 $ 354,389 $ 363,938 $ 106,190 $ 106,190 $ 578,034 $ 589,644 110
Sport Programs Subtotal $ 6,176,797 $ 6,272,041 $ 8,600,874 $ 8,921,788 $ 5,786,963 $ 5,754,163 $ 20,564,634 $ 20,947,992 720
Total Compensation FY14 Projections May
2013
Total Compensation FY14 Projections November 2013
Total Scholarships FY14 Projections
May 2013
Total Scholarships FY14 Projections November 2013
Total Operating FY14 Projections
May 2013
Total Operating FY14 Projections November 2013
TOTAL FY14 Projections May
2013
TOTAL FY14 Projections
November 2013
Post Season Subtotal $ 50,000 $ 50,000 $ - $ - $ 350,000 $ 350,000 $ 400,000 $ 400,000
Facilities $ 777,315 $ 790,334 $ - $ - $ 303,579 $ 219,392 $ 1,080,895 $ 1,009,725 Men and Women's Sports Game Ops $ - $ - $ - $ - $ 954,502 $ 1,025,000 $ 954,502 $ 1,025,000 Stadium $ - $ - $ - $ - $ 48,311 $ 62,000 $ 48,311 $ 62,000
Facilities/Game Ops Subtotal $ 777,315 $ 790,334 $ - $ - $ 1,306,392 $ 1,306,392 $ 2,083,707 $ 2,096,725
Academics $ 419,733 $ 419,747 $ - $ - $ 156,476 $ 156,476 $ 576,209 $ 576,223
Administration General (including benefits; utility and custodial recharges; etc) $ 641,939 $ 744,647 $ 786,917 $ 793,847 $ 1,215,000 $ 1,193,333 $ 2,643,856 $ 2,731,827 Business Office $ 370,160 $ 295,627 $ - $ - $ - $ - $ 370,160 $ 295,627 Camps $ - $ - $ - $ - $ 15,000 $ 15,000 $ 15,000 $ 15,000 Cheerleading $ 13,680 $ 13,680 $ - $ - $ 24,280 $ 24,280 $ 37,960 $ 37,960 Compliance $ 206,558 $ 205,001 $ - $ - $ - $ - $ 206,558 $ 205,001 Development $ 164,737 $ 117,002 $ - $ - $ - $ - $ 164,737 $ 117,002 External Relations $ 177,921 $ 180,934 $ - $ - $ - $ - $ 177,921 $ 180,934 Marketing and Sales $ 212,918 $ 216,555 $ - $ - $ 192,010 $ 192,010 $ 404,928 $ 408,566 Media Relations $ 191,475 $ 195,557 $ - $ - $ 118,584 $ 118,584 $ 310,059 $ 314,141 Radio and Television (Broadcasting) $ 84,050 $ 82,255 $ - $ - $ 19,821 $ 24,821 $ 103,871 $ 107,076 Sports Medicine $ 442,979 $ 450,065 $ - $ - $ 419,561 $ 419,561 $ 862,540 $ 869,626 Strength and Conditioning $ 174,052 $ 176,364 $ - $ - $ 29,742 $ 29,742 $ 203,794 $ 206,106 Ticket Operations $ 89,254 $ 93,074 $ - $ - $ 63,895 $ 63,895 $ 153,148 $ 156,968
Administration/General Subtotal $ 3,189,456 $ 3,190,508 $ 786,917 $ 793,847 $ 2,254,369 $ 2,237,702 $ 6,230,741 $ 6,222,057
Subtotal Intercollegiate Expenses $ 10,193,568 $ 10,302,883 $ 9,387,790 $ 9,715,635 $ 9,697,724 $ 9,648,257 $ 29,279,082 $ 29,666,775
Campus Recreation $ 1,092,365 $ 1,086,474 $ - $ - $ 446,807 $ 446,807 $ 1,539,172 $ 1,533,280
TOTAL EXPENSES FY14 $ 11,285,933 $ 11,389,357 $ 9,387,790 $ 9,715,635 $ 10,144,530 $ 10,095,064 $ 30,818,254 $ 31,200,055

Sen. Doc. No. 14-035 Page 5. Administrative Expense Detail Projected 14
Page 6. Football Expenses Projected 13, Actual 13 and Projected 14
FY13 Expense Projections May
2013 FY13 Expense
Actuals
FY14 Expense Projections May
2013
FY14 Expense Projections
November 2013 Difference Comments
Athletic Student Aid (academic year) $ 2,549,677 $ 2,573,458 $ 2,991,439 $ 3,118,804 545,345$
FY13 did not use all scholarships; FY14 assume using all scholarships including 3.5 of new out-of-state scholarships (FY14 will be at NCAA max of 85 scholarships)
Compensation $ 1,425,812 $ 1,421,302 $ 1,629,262 $ 1,629,413 208,111$
addition of strength and conditioning coach for football, Molnar contractual obligations, and sales interns specifically assigned for football
Compensation (paid out of 100 Yard Club) $ 50,000 $ 50,910 $ 50,000 $ 50,000 (910)$ Guarantees $ 30,000 $ 30,000 $ - $ - (30,000)$ FY14 contracted guarantee amount is less than Fy13Guarantees (paid out of 100 Yard Club) $ 170,000 $ 170,000 $ 160,000 $ 160,000 (10,000)$
Recruiting $ 195,000 $ 191,902 $ 225,000 $ 230,000 38,098$ continued rise in costs of travel and continued growth in recruiting
Team Travel (including pre-season) $ 896,247 $ 901,772 $ 1,036,089 $ 968,684 66,912$
due to charter cost increase and pre-season cost structure change by University; actuals less than projected
Equipment, Uniforms and Supplies $ 187,450 $ 180,695 $ 170,000 $ 205,000 24,305$ 30K expense headsets; Equipment, Uniforms and Supplies (paid out of 100 Yard Club) $ 50,000 $ 45,573 $ 40,000 $ 40,000 (5,573)$ Game Expenses (officials) $ 98,855 $ 97,830 $ 97,235 $ 102,336 4,506$ Fund Raising, Marketing, and Promotion (printing) $ 30,000 $ 32,992 $ 30,000 $ 30,000 (2,992)$ Medical Expenses and Medical Insurance $ 16,000 $ 13,993 $ 16,000 $ 30,000 16,007$ guardian concussion caps and other preventative itemsMemberships and Dues $ 122,500 $ 122,500 $ 252,500 $ 252,500 130,000$ MAC bowl assessment fee Other Operating Expenses (AV, office, etc) $ 48,735 $ 47,964 $ 48,086 $ 56,481 8,516$
Football Schol, Comp, and Operating Budget Subtotal $ 5,870,276 $ 5,880,893 $ 6,745,610 $ 6,873,217 992,324$
Admin Football Expenses *1 $ 1,199,010 $ 1,016,128 $ 1,035,872 $ 908,000 (108,128)$ based on actuals in FY13 estimated reduction in Fy14 costs
Other Football Expenses Subtotal $ 1,199,010 $ 1,016,128 $ 1,035,872 $ 908,000 (108,128)$
TOTAL EXPENSES $ 7,069,286 $ 6,897,021 $ 7,781,482 $ 7,781,217 884,196$
Additional Female Scholarships $ 208,469 $ 208,469 $ 421,991 $ 427,196 218,726$ female scholarships addedUniv Expenses Towards Football Ad Campaign, Student
Busses, BBQ, etc $ 534,242 $ 534,242 $ 565,000 $ 778,330 244,088$ based on report from Univ Relations as reported in previous mtgs
TOTAL RELATED EXPENSES $ 742,711 $ 742,711 $ 986,991 $ 1,205,526 462,814$
*1 FY13 was based on FY12 actuals plus NCAA audit report which is accrual basedThe FY13 actuals of $1,016,128 is broken down as follows: $349,364 summer/winter/EE/Medical/Books $25,309 moving expenses $93,632 game and practice operational costs (overtime equip mgr and video coord; payroll for equip and video student staff; etc) $159,961 facility maintenance, repairs, rentals (includes costs for current support building as pay for any issues such as replacing roof, fencing, etc; off-campus office lease; etc) $61,922 other (admin travel to/from Gillette for meetings and games; AO on admin expenses; etc) $262,810 one-time marketing campaign (Gold Group and travel to/from Gillette for ticket sales) $63,130 one-time student bus transportation to Gillette*1 FY14 was based on FY13 projections less one-time Gillette and one-time marketing; plus increase in summer/winter/EE/medical/books FY14 revised projections of approx 908K is broken down as follows: 483K summer/winter/EE/Medical/Books 125K game and practice operational costs (overtime equip mgr and video coord; payroll for equip and video student staff; etc) 200K facility maintenance, repairs, rentals (includes costs for current support building as pay for any issues such as replacing roof, fencing, etc; off-campus office lease; etc) 100K other (admin travel to/from Gillette for meetings and games; AO on admin expenses; etc)
University Support *1Waivers
Student FeeProgram Generated
TOTAL FOOTBALL REVENUE
University Support Female ScholarshipsWaivers Female Scholarships
Allocation for Marketing and Student Busses/BBQTOTAL RELATED REVENUE
*1 In May had projected 522K in university support in Fy13 to cover projected deficit; this did not occur in FY13
FY13 Projections as
of May 2013 FY13 Final
Actuals
FY14 Projections as
of May 2013
FY14 Projections as of November
2013 1,406,694$ 20% 884,694$ 14% 1,615,262$ 21% 1,629,413$ 21%1,449,439$ 21% 1,451,153$ 22% 1,496,392$ 19% 1,512,289$ 19%2,167,997$ 31% 2,153,917$ 33% 1,990,218$ 26% 1,964,846$ 25%2,045,156$ 29% 1,995,633$ 31% 2,679,611$ 34% 2,674,669$ 34%7,069,286$ 100% 6,485,397$ 100% 7,781,482$ 100% 7,781,217$ 100%
161,517$ 161,517$ 321,379$ 321,379$ 46,953$ 46,953$ 100,613$ 105,817$
547,405$ 534,242$ 565,000$ 778,330$ 755,874$ 742,711$ 986,991$ 1,205,526$
*1 In May had projected 522K in university support in Fy13 to cover projected deficit; this did not occur in FY13

Sen. Doc. No. 14-035 A Comprehensive Approach to Valuing the University of Massachusetts Football Program
Brett Albert, Assistant Economist, REMI
February 20, 2013
Overview Valuing a college athletic program can be far more difficult than valuing a professional franchise. Value in professional sports is easier to deduce; put simply, one can just measure the profitability and on---‐‑field success of a franchise and weight both appropriately. With universities, however, disparate stakeholders and organizational demands make this process more nuanced and delicate. Therefore, I have developed a valuation methodology based off of the work of Chris Smith and Patrick Rishe at Forbes, and I’ve included recommendations about appropriate paths forward for the UMass program. Measuring the Academic and Athletic Value of the Football Program
This should be the most heavily weighted consideration in the equation, and it’s also one of the more straightforward sections as well. First, we deal with the tangible aspect: measure the football profit that is directed towards academic programs at the university. This can be considered the tangible academic value. Next, measure the football profit that is directed towards other athletic programs within the university. This can be considered the athletic value. In the case of UMass, however, this section should focus on the subsidization rate of the program due to the fact that football is not currently profitable at the university.
After the tangible aspect of academic value is measured, the intangible aspect must be addressed. This is an area of greater contention, but recent research by Michael Anderson published by the National Bureau of Economic Research has laid out ties between on---‐‑field success and academic prestige.i The most relevant results are below.
If a team improves its win total by 5 games from the year before:
§ Alumni athletic donations increase by $682,000 § Overall applications to the university increase by 677 applicants § The acceptance rate drops by 1.5 percentage points § In---‐‑state enrollment increases by 76 students § Incoming SAT scores increase by 9 points
In addition to the research by Anderson at NBER, Jonathan Orszag and Mark Israel at Compass Lexecon conducted research in 2009 to determine the connection between “football team expenditures” and increased winning percentages. They determined that a $1 million increase in expenditures is associated with a 617% increase in football winning percentage, which comes out to 0.8 games in a normal college season.ii
With this research considered, it appears clear that investing money in the UMass football program can yield results in the form of improved success on the field, and that improved success on the field can often improve the quality of both alumni relations and applicant qualifications. Going forward, however, the subsidization rate of the program appears to be the most crucial aspect in this section.
While it remains unlikely that UMass can become as profitable as major FBS programs in the short to medium term, it is very likely that they can reduce the subsidization rate of the program and turn a small profit. According to the NCAA, 58% of FBS football programs turned a profit in 2011.iii Therefore, it seems to reason that with the correct guidance going forward, reasonable expectations, a strategic long-term conference plans, UMass football can become a self-sufficient program. The good news for the program is that Coach Molnar’s staff has been recruiting well over the past two years. According to ESPN rankings they have signed 11 three-star recruits in the past two classes, compared to two

Sen. Doc. No. 14-035 total from 2008-11.iv Additionally, the staff has been aggressive on the 2014 recruiting trail. They currently have offers out to 30 high school juniors, five of whom register on the ESPN Watch List. This momentum from recruiting and increased investment into the program can yield financial returns in the short term for the program. As the program improves, higher ticket sales and increased ad revenue will cut into the subsidization rate. Along with alumni donations, these two revenue drivers are typically the largest and most important in college football finances. The key, however, is reasonable expectations. The non---‐‑conference schedule for UMass is particularly difficult this fall with away games at Big Ten Champion Wisconsin and Big 12 Champion Kansas State, plus a home game against Vanderbilt. The team is likely to enter conference play with a 1-3 record and only four manageable conference opponents: Akron, Miami (OH), Western Michigan, and Buffalo. A 5-7 record would be excellent, but a 3-9 or 4-8 mark is more likely.
In the 2014 and 2015 seasons, much of the younger talent in the program, such as freshman quarterback Mike Wegzyn and incoming running back Lorenzo Woodley, should make UMass more competitive with the upper echelon MAC programs.
The academic and athletic value of the UMass program is likely to increase as the program improves and becomes acclimated to the FBS level. While university subsidization appears imminent over the next few seasons, the program does show promise for both success on the field and overall self---‐‑sufficiency.
Conference Value
Over the past decade, massive television deals between conferences and networks such as Fox and ESPN have driven monumental conference realignment. These deals, which are upwards of $3 billion in the cases of the ACC and Big 12, offer programs considerable revenue sharing.v Many programs in the larger automatic qualifying conferences are currently looking at revenue shares of more than $20 million annually as a result of the television deals.
The MAC does not currently have this type of structure in place, but the conference shattered its revenue record last year due to Northern Illinois receiving a BCS bid. The Huskies brought the MAC approximately $13 million for their Orange Bowl bid, and six other conference members also received bowl bids that brought the conference anywhere between $325,000 to $1.2 million.vi On top of the stellar year for the MAC, the new 2014 college playoff format gives a major bowl bid to the highest ranked program from the top five non---‐‑automatic qualifying conferences. This group includes the Big East, MAC, Conference USA, Sun Belt, and Mountain West conferences. Even though this will pit MAC programs against top national programs such as Boise State, it still represents an opportunity for conference revenue sharing as the “Group of Five” has agreed to share bowl revenue amongst conference members.vii
While the MAC represents a great opportunity for UMass to build into a regional power in the New England area, it is unlikely that the program can ever be self---‐‑sufficient under the current revenue structure. According to the Boston Globe, UMass stands to gain approximately $75,000 in television revenue sharing from the MAC.viii In contrast, Boston College is set to gain about $17 million in revenue sharing through the ACC, a figure that is likely to be revised upwards in light of the conference’s new $3.6 billion television deal with ESPN. The short-term focus for UMass should be to build the program into a desirable acquisition, but the long-term focus must be conference realignment similar to what Temple University recently decided on.
This long---‐‑term strategy may be difficult to plan for currently due to the constant reshaping of college football conferences, but an opportunity is possible with two large conferences: the Big East and ACC. The Big East is the most logical route for UMass, especially considering the new television deal for the conference will earn them Around $25 million from either NBC or ESPN.ix Temple recently made the jump from the MAC to the Big East to increase their share of conference revenue and to fortify regional rivalries. This move would accomplish both goals for UMass as well. A move to the ACC would tie in a regional rivalry between UMass and Boston College and help the conference make up for the recent loss of Maryland to the Big Ten.

Sen. Doc. No. 14-035 Overall, strategic conference planning can be nearly impossible with today’s climate of schools eschewing conference loyalty and history for larger revenue shares, but it is a crucial aspect of planning if UMass intends to become a self---‐‑sufficient and profitable football program over time. Community Value
The last section of this valuation methodology deals with the value of the program to the local community in terms of tourism activity. The recent move of home games to Gillette Stadium gives us a unique opportunity to conduct a real---‐‑life counterfactual analysis.
The simplest approach to this valuation section is to measure the lost revenue to downtown shops in Amherst, Hadley and Northampton from 2011 to 2012 on home game days. This will give us a rough figure to use for impact research.
After we determine the amount of tourism revenue lost as a result of the games being played in Foxborough, we can run a number of different models to determine the direct, indirect, and induced effects of tourism spending in the area. REMI, IMPLAN, and RIMS II models could all be used for this section, with REMI being the most comprehensive tool and RIMS II being the least expensive.
Through using some variation of an Input---‐‑Output methodology, we could feed in the direct tourism spending into the core tourism industries; most notably, restaurants, retail trade, and lodging. After feeding in the direct spending, we would trace the flow of dollars through the I/O table to determine which industries would be indirectly impacted by a boost in tourism spending in the core industries. Finally, the industries that are directly and indirectly affected by a boost in tourism spending would likely hire more employees to meet this new consumer demand. The new employees hired would spend a portion of their paycheck on regional goods and services, thus giving us our induced effect.
Conclusion
The UMass football program faces an uphill battle as it tries to become both competitive on the field and self---‐‑sufficient within university finances. While the move to the FBS level contained inherent financial risks, the program does have clear avenues forward that can improve the athletic, academic, conference, and community value.

Sen. Doc. No. 14-035
Sources i Anderson. The Benefits of College Athletic Success: An Application of the Propensity Score Design with
Instrumental Variables. Working Paper Series, National Bureau of Economic Research, 2012. i i
J. Orszag and M. Israel. The empirical effects of collegiate athletics: An update based on 2004---‐‑2007 data. Technical Report, Compass Lexecon, 2009.
i i i
G. Brown. Report Shows Widening Financial Gap in Division I. NCAA, 2011. iv
http://espn.go.com/college---‐‑sports/football/recruiting/school/_/id/113/massachusetts---‐‑minutemen vC. Smith. College Football's Most Valuable Teams: Texas Longhorns On Top, Notre Dame Falls. Forbes, 2012.
vi
P. Rishe. MAC's Sugar Daddy, Northern Illinois, and Classic BCS BS. Forbes, 2012. v i i
B. Dicesare. UB, MAC to get boost from football playoff. The Buffalo News, 2012. vii i
B. Hohler. UMass football move loaded with financial risks. The Boston Globe, 2012. ix
B. McMurphy. Sources: ESPN has one week to act. ESPN, 2013.

Sen. Doc. No. 14-035
Campus Recreation Annual Use Report
(Covers Use Period FY 13 Fall 2012 through Summer 2013)
PARTICIPATIONS
FY10 FY11 FY12 FY13
*RECREATION 377,430 533,623 574,896 601,646
**INTRAMURALS 31, 501 28,386 27,694 26,980
***AQUATICS 13,248 12,131 13,499 15,439
FITNESS 12,879 29,822 54,372 61,458
*Combined numbers from the Recreation Center, Boyden Gym Free Play and Mullins Tennis
Courts
**FY13 numbers hampered by EEE restrictions
***Combined numbers from Totman and Boyden pools

Sen. Doc. No. 14-035
MORE #S FY13
• 588,025 Web Hits
• 368,012 IM League Hits
• 5,172 Memberships Sold
• 1,128 Personal Training Sessions
• 2,324 Intramural Contests
• 2,796 Group Fit Classes
• 375 Student Employees