2012-065 competitiveness of the eu egg industry
TRANSCRIPT
Competitiveness of the EU egg industry

Competitiveness
of the EU egg industry
P.L.M. van Horne
LEI report 2012-065
November 2012
Project code 2273000408
LEI Wageningen UR, The Hague

2
Het LEI kent de werkvelden: [DEZE WORDEN DOOR BUREAUREDACTEUR
INGEVOEGD]
Dit rapport maakt deel uit van het werkveld << Titel werkveld>>.

3
Competitiveness of the EU egg industry
Horne, P.L.M. van
LEI report 2012-065
ISBN/EAN: 978-90-8615-598-9
51 p., fig., tab., app.

4
This research has been carried out by commission of EUWEP (European
Union of wholesale eggs, egg products, poultry and game).
Photo cover: Ton Poortvliet/Hollandse Hoogte
This publication is available at www.wageningenUR.nl/en/lei
© LEI, part of Stichting Dienst Landbouwkundig Onderzoek (DLO foundation),
2012
Reproduction of contents, either whole or in part, is permitted with due refer-
ence to the source.
LEI is ISO 9001:2008 certified.

5
Contents
Preface 7
Summary 8
S.1 Key results 8 S.2 Complementary findings 10 S.3 Methodology 10
Samenvatting 12
S.1 Belangrijkste uitkomsten 12 S.2 Overige uitkomsten 14 S.3 Methode 14
1 Production costs of eggs in 2010 in selected countries 16
1.1 Production costs of eggs in some EU countries 16 1.2 Production costs of eggs in some non-EU countries 19 1.3 Processing costs of whole egg powder in some EU countries 21 1.4 Processing costs of whole egg powder in some non-EU countries 21 1.5 Total costs of production and transport of shell eggs 22 1.6 Total costs of production and transport of whole egg powder 23
2 Production costs of eggs in 2012 25
2.1 EU legislation 25 2.2 Increase in production costs of enriched cages as a result of Council
Directive 1999/74/EC 27 2.3 Costs of EU legislation in 2010 and 2012 29 2.4 Production costs and offer prices of shell eggs in 2012 31 2.5 Production costs and offer prices of whole egg powder in 2012 32
3 Results of different scenarios 34
3.1 Description of the scenarios 34 3.2 Shell eggs 35
3.2.1 Scenario 1 - Lower EU import tariff 35

6
3.2.2 Scenario 2 - Change in exchange rates 35 3.2.3 Scenario 3 - Combination 36
3.3 Whole egg powder 37 3.3.1 Scenario 1 - Lower EU import tariff 38 3.3.2 Scenario 2 - Change in exchange rates 38 3.3.3 Scenario 3 - Combination 39
4 Conclusions 41
Literature and data sources 44
Appendices 46
1 EU imports of eggs and egg products (tonnes of egg equivalent) 2007-
2011 46 2 Egg layer industry in the USA, Ukraine, Argentina and India 47 3 Main assumptions to calculate the production costs for producing
eggs in conventional cage, enriched cage and aviary housing
systems for laying hens 50 4 Development of exchange rate of the currency of Argentina, the USA,
Ukraine and India compared with the euro (January 2000 = 100%) 51

7
Preface
Within the European Union the use of conventional cages was prohibited from
1 January 2012. Because of animal welfare concerns the minimum standard for
the housing of laying hens is an enriched cage (Council Directive 1999/74/EC).
The egg sector in the EU is also confronted with additional costs as a result of
legislation on environmental protection and food safety. Countries outside the
EU do not have the same extensive legislation. At the same time the EU is in-
volved in multilateral (WTO) negotiations and bilateral (e.g. Mercosur, India,
Ukraine) negotiations, designed to further liberalise trade by either further reduc-
ing import tariffs or removing them altogether. This results in concerns on the
competitiveness of the EU egg industry.
In this report, the independent research institute LEI Wageningen UR pro-
vides the results of a study on the competitiveness of the EU egg sector. The
production costs for eggs and egg products are calculated for several EU and
non-EU countries. Based on the data for 2010, a projection is made towards
2012 after the implementation of Council Directive 1999/74/EC in the EU coun-
tries. With the 2012 situation several scenarios are described and the impact is
calculated to illustrate the impact of the increase in production costs within the
EU combined with different levels of import tariffs and a change in exchange
rates.
The study has been initiated and funded by EUWEP, the EU trade association
for Egg Packers, Traders and Processors. This report is an update of an earlier
study first published in February 2003. LEI wants to thank EUWEP for providing
the country data and for comments on the draft report.
L.C. van Staalduinen MSc
Managing Director LEI Wageningen UR

8
Summary
S.1 Key results
Egg producers in the EU have to comply with legislation dealing with
environmental protection, animal welfare and food safety. From 1 Jan-
uary 2012 keeping hens in conventional cages was prohibited and egg
producers had to change to either enriched cages or alternative hous-
ing systems. The result of all this legislation is an increase in the cost
of producing eggs. At the same time the EU is negotiating with other
countries or groups of countries to liberalise trade in agricultural prod-
ucts. These multi- or bilateral negotiations are designed to further lib-
eralise trade by either further reducing import tariffs or removing them
altogether. In this report the impact of lowering import tariffs on the
competitiveness of the EU egg industry is studied. The results show that
the offer price of whole egg powder in 2012 of some third countries
is close to the average EU price. Despite the current import tariffs on
whole egg powder, the third countries can be competitive on the EU
market. In a scenario with a 50% lower import tariff, all third countries
have a lower offer price of whole egg powder compared to the EU egg
industry.
The results for the situation in 2012 are presented in Figure S.1 and Figure S.2.
Figure S.1 provides the production costs of whole egg powder in the EU after
implementation of the EU welfare Directive 1999/74/EC and the addition of
transportation costs and the current import tariff compared to Ukraine, the US,
Argentina and India. Figure S.1 shows that import tariffs protect the EU from
large volumes of imports from third countries.
Figure S.2 illustrates the 'worst case scenario' with a 50% decrease in im-
port tariff and a 10% devaluation of the exchange rates for the non-EU currency.
In this situation all third countries have a lower offer price of whole egg powder
compared to the EU egg industry. In this situation large volumes of whole egg
powder will be imported from third countries.

9
Figure S.1 Offer price of whole egg powder in Germany from EU average
(horizontal line) and non-EU countries in cents per kilogram
in 2012
Figure S.2 Offer price of whole egg powder in Germany from EU
average (horizontal line) and non-EU countries in cents per
kilogram based on scenario 3: 50% lower import tariff
and 10% lower exchange rate
477
377 380 358 381
26
--
3
9 15 16
15
137 137 137
137
0
100
200
300
400
500
600
EU UKR USA ARG IND
cent
per
kg
production cost (excl EU-Directive) cost of EU-Directive
transport levy on imports
477
339 342 323 343
26
3
9 15 16
15 69 69
69 69
0
100
200
300
400
500
600
EU UKR USA ARG IND
cent
per
kg
production cost (excl EU-Directive) cost of EU-Directive
transport levy on imports

10
S.2 Complementary findings
The production costs of shell eggs produced in conventional cages in the EU
in 2010 was on average 84 eurocents per kg of eggs. Between the main egg
producing countries, the production costs of shell eggs in 2010 ranged from
88.8 eurocent per kg of eggs in the UK and 89.3 in Denmark to 79.0 in Spain
and 78.2 eurocent per kg of eggs in Poland. Compared to the average level
within the EU, the production costs for shell eggs in 2010 were lower in Ukraine
(79%), USA (75%), Argentina (72%) and India (81%).
For whole egg powder the illustrated non-EU countries were even more
competitive. Compared to the average level within the EU, the production costs
of whole egg powder in 2010 were lower in Ukraine (79%), USA (80%), Argentina
(75%) and India (80%). Because the cost of transportation of powder is low, the
offer price of whole egg powder from third countries is relatively low. However,
current import tariffs protect the EU from large amounts of imports from the il-
lustrated countries.
In the EU, egg producers have to comply with European legislation covering
environmental protection, animal welfare and food safety. The total costs of Eu-
ropean legislation based on the situation in 2012 is estimated to be more than
15% of the total production costs to produce eggs at farm level.
In Argentina, India and Ukraine there is no legislation on animal welfare and
laying hens are housed in conventional cages with a space allowance of 300 to
400 cm2 per hen. Between countries, regions and farms the density can change
due to expected market prices. Literature shows that purely from an economic
point of view 300 to 400 cm2 per hen gives the highest income for the egg pro-
ducer. In the USA at present, there is a proposal for federal legislation on laying
hen welfare, although it is by no means certain that this will be passed into law.
S.3 Methodology
In this report, LEI researched the production costs of shell eggs and whole egg
powder in seven EU egg producing countries: the Netherlands (NL), France (FR),
Spain (ES), Italy (IT), United Kingdom (UK), Poland (PL) and Denmark (DK) and the
non-EU countries: Ukraine (UKR), the USA, Argentina (ARG) and India (IND). In all
countries data were collected on prices (feed, young hens), technical results
(egg production, feed intake, mortality), investment (poultry house, cages) and
other costs (interest rate, labour, manure disposal). For egg processing, data
were collected on investment in buildings, equipment and labour cost. The base
11
year for the data was 2010. The total costs were converted to euros with the av-
erage exchange rate in the year 2010.
Based on the 2010 results, the situation towards 2012 was extrapolated.
For 2012, account was taken of the implementation of enriched cages, being
the minimum standard for egg production within the EU from 2012. Based on
extensive calculations, it was concluded that the production costs of eggs pro-
duced in enriched cages, compared to conventional cages providing 550 cm2
per hen (EU minimum standard from 2003), increased by 7%.
Based on the 2012 situation three scenarios were developed:
- a change in import tariffs for eggs and whole egg powder. A reduction of
50% to illustrate the result of any multi- or bilateral agreement of the EU;
- lower exchange rate for the currency of the non-EU countries. In the scenar-
ios a 10% lower exchange rate was assumed. A comparison of the ex-
change rate in 2012 and 2010 showed that for some non-EU countries this
was a realistic scenario;
- a combination of a 50% reduction of the import tariff and a 10% lower ex-
change rate.

12
Samenvatting
S.1 Belangrijkste uitkomsten
Eierproducenten in de EU moeten voldoen aan bepaalde wetgeving in-
zake milieubescherming, dierenwelzijn en voedselveiligheid. Vanaf 1 ja-
nuari 2012 werd het houden van kippen in traditionele kooien verboden
en moesten eierproducenten overstappen op verrijkte kooien of alterna-
tieve huisvesting. Het resultaat van deze wetgeving is een stijging van
de productiekosten van eieren. Tegelijkertijd onderhandelt de EU met
andere landen of groepen landen over de liberalisering van de handel in
landbouwproducten. Deze multi- of bilaterale onderhandelingen beogen
handel verder te liberaliseren door invoerheffingen verder te reduceren
of ze in hun geheel af te schaffen. In dit rapport wordt onderzoek ge-
daan naar de impact van het verlagen van invoerheffingen op de con-
currentiekracht van de Europese eierindustrie. De resultaten laten zien
dat de aanbiedingsprijs van heeleipoeder van sommige derde landen in
2012 dicht bij de gemiddelde prijs in de EU ligt. Ondanks de huidige in-
voerheffingen op heeleipoeder, kunnen deze derde landen toch concur-
reren op de EU-markt. In een scenario met 50% lagere invoerheffingen
hebben alle derde landen een lagere aanbiedingsprijs van heeleipoeder
in vergelijking met de Europese eierindustrie.
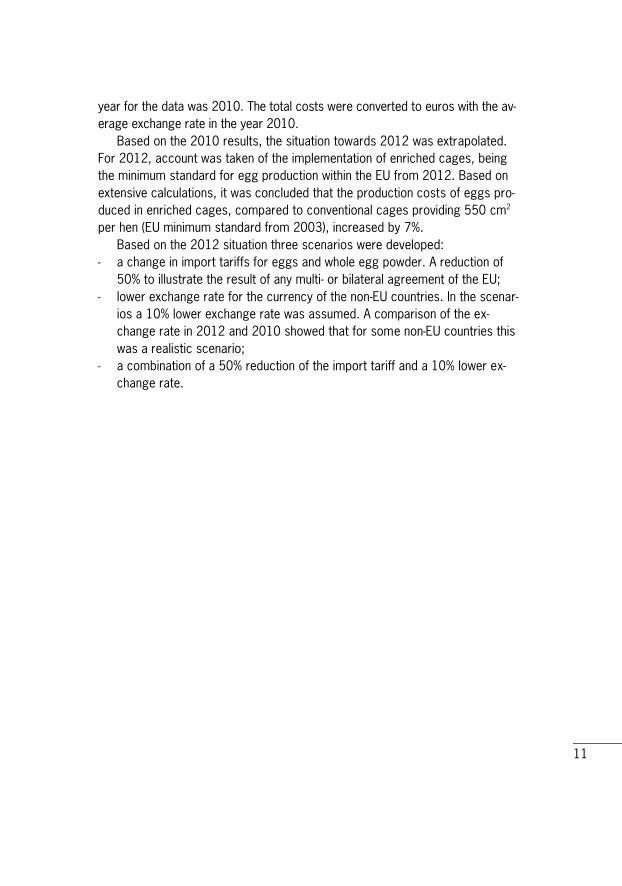
De resultaten voor de situatie in 2012 worden weergegeven in Figuur S.1 en Fi-
guur S.2. Figuur S.1 geeft de productiekosten van heeleipoeder in de EU na im-
plementatie van de Europese welzijnsrichtlijn 1999/74/EG en na bijtelling van
transportkosten en de huidige invoerheffingen ten opzichte van Oekraïne, de VS,
Argentinië en India. Uit Figuur S.1 blijkt dat invoerheffingen de EU beschermen
tegen grote hoeveelheden import uit derde landen.
Figuur S.2 illustreert het 'worst case scenario' met 50% lagere invoerhef-
fingen en een devaluatie van 10% van de wisselkoersen voor niet-EU-valuta. In
deze situatie hebben alle derde landen een lagere aanbiedingsprijs voor heelei-
poeder in vergelijking met de Europese eierindustrie en worden er grote hoe-
veelheden heeleipoeder uit derde landen geïmporteerd.
13
Figuur S.1 Aanbiedingsprijs van heeleipoeder in Duitsland afkomstig uit
de EU (gemiddeld genomen, horizontale lijn) en uit niet-EU-
landen in cent per kilogram in 2012
Figuur S.2 Aanbiedingsprijs van heeleipoeder in Duitsland afkomstig uit
de EU (gemiddeld genomen, horizontale lijn) en uit niet-EU-
landen in cent per kilogram, gebaseerd op scenario 3: 50%
lagere invoerheffingen en een 10% lagere wisselkoers
477
377 380 358 381
26
--
3
9 15 16
15
137 137 137
137
0
100
200
300
400
500
600
EU OEK VS ARG IND
cent
per
kg
productiekosten (excl. EU-richtlijn) kosten van de EU-richtlijn
transport invoerheffingen
477
339 342 323 343
26
3
9 15 16
15 69 69
69 69
0
100
200
300
400
500
600
EU OEK VS ARG IND
cent
per
kg
productiekosten (excl. EU-richtlijn) kosten van de EU-richtlijn
transport invoerheffingen

14
S.2 Overige uitkomsten
In 2010 waren de productiekosten van consumptie-eieren die zijn geproduceerd
in traditionele kooien in de EU gemiddeld 84 eurocent per kg eieren. In datzelf-
de jaar varieerden de productiekosten van consumptie-eieren in de belangrijkste
eierproducerende landen van 88,8 eurocent per kg eieren in het Verenigd Ko-
ninkrijk en 89,3 in Denemarken tot 79,0 in Spanje en 78,2 in Polen. Vergeleken
met het gemiddelde in de EU waren de productiekosten voor consumptie-eieren
in 2010 lager in Oekraïne (79%), de VS (75%), Argentinië (72%) en India (81%).
Voor heeleipoeder hadden deze niet-EU-landen zelfs een nog sterkere con-
currentiepositie. Vergeleken met het gemiddelde in de EU waren de productie-
kosten voor heeleipoeder in 2010 lager in Oekraïne (79%), de VS (80%),
Argentinië (75%) en India (80%). Omdat de transportkosten voor poeder laag
liggen, is de aanbiedingsprijs van heeleipoeder uit derde landen ook relatief
laag. De huidige invoerheffingen beschermen de EU echter tegen grote hoe-
veelheden import uit de betreffende landen.
In de EU moeten eierproducenten voldoen aan bepaalde Europese wetgeving
inzake milieubescherming, dierenwelzijn en voedselveiligheid. De totale kosten
van de Europese wetgeving op basis van de situatie in 2012 worden geschat op
meer dan 15% van de totale kosten voor het produceren van eieren op het pri-
maire bedrijf.
In Argentinië, India en Oekraïne is er geen wetgeving met betrekking tot die-
renwelzijn en worden leghennen gehouden in conventionele kooien met een op-
pervlakte per hen van 300 tot 400 cm2. De bezettingsdichtheid verschilt per
land, per regio en per bedrijf, afhankelijk van de verwachte marktprijs. Uit litera-
tuur blijkt dat 300 tot 400 cm2 per hen vanuit een economisch standpunt de
hoogste inkomsten oplevert voor eierproducenten. In de VS ligt er momenteel
een voorstel voor federale wetgeving met betrekking tot dierenwelzijn van leg-
hennen. Het is echter nog niet zeker of dit voorstel ook zal worden aangeno-
men.
S.3 Methode
Voor dit rapport deed het LEI onderzoek naar de productiekosten van consump-
tie-eieren en heeleipoeder in zeven eierproducerende EU-landen (Nederland (NL),
Frankrijk (FR), Spanje (ES), Italië (IT), het Verenigd Koninkrijk (UK), Polen (PL) en
Denemarken (DK)) en in enkele niet-EU-landen (Oekraïne (OEK), de VS, Argentinië
(ARG) en India (IND)). In alle landen werden gegevens verzameld over prijzen

15
(diervoeder, jonge hennen), technische resultaten (eiproductie, voeropname, uit-
val), investeringen (stallen, kooien) en overige kosten (rente, arbeid, mestaf-
voer). Voor de eiproductie werden gegevens verzameld over investeringen in
gebouwen, inrichting en arbeidskosten. Het basisjaar voor de gegevens was
2010. De totale kosten werden omgerekend naar euro's op basis van de ge-
middelde wisselkoers in 2010.
De situatie voor 2012 werd geëxtrapoleerd op basis van de resultaten voor
2010. Voor 2012 werd rekening gehouden met de implementatie van verrijkte
kooien, wat vanaf 2012 de minimumnorm is voor eiproductie in de EU. Op basis
van uitgebreide berekeningen werd geconcludeerd dat de productiekosten van
in verrijkte kooien geproduceerde eieren met 7% toenamen ten opzichte van in
conventionele kooien geproduceerde eieren met een oppervlakte van 550 cm2
per hen (EU minimumnorm van 2003).
Er zijn drie scenario's ontwikkeld met de situatie in 2012 als uitgangspunt:
- een wijziging in de invoerheffingen voor eieren en heeleipoeder. Een verla-
ging van 50% ter illustratie van het resultaat van een eventuele multi- of bila-
terale overeenkomst van de EU;
- een lagere wisselkoers voor de valuta van niet-EU-landen. In dit scenario
werd uitgegaan van een 10% lagere wisselkoers. Uit een vergelijking van de
wisselkoers in 2012 en 2010 bleek dat dit voor sommige niet-EU-landen een
realistisch scenario was;
- een combinatie van een verlaging van 50% van de invoerheffingen en een
10% lagere wisselkoers.

16
1 Production costs of eggs in 2010 in selected countries
1.1 Production costs of eggs in some EU countries
The production costs of shell eggs produced by hens housed in conventional
cages has been researched for the following countries: the Netherlands (NL),
France (FR), Spain (ES), Italy (IT), the UK, Poland (PL) and Denmark (DK). These
countries are the main egg producing countries within the EU. Germany is not
included because this country already prohibited conventional cages in 2010,
two years before the ban in other EU countries. The results presented in Fig-
ure 1.1 relate to the year 2010. All costs in this report are given in euros. Fig-
ure 1.1 also provides an insight into the build-up of primary production costs.
The production costs can be divided into six components: hen (cost of young
hen at 20 weeks, less the revenue from the spent hen), feed (feed costs during
the laying period), other (all other variable costs e.g. electricity and animal
health), labour (cost of the labour of the farmer or a farm worker), housing (de-
preciation, interest and maintenance cost on building and equipment) and gen-
eral (bookkeeping, clothing, insurance and, if relevant, manure disposal costs).
17
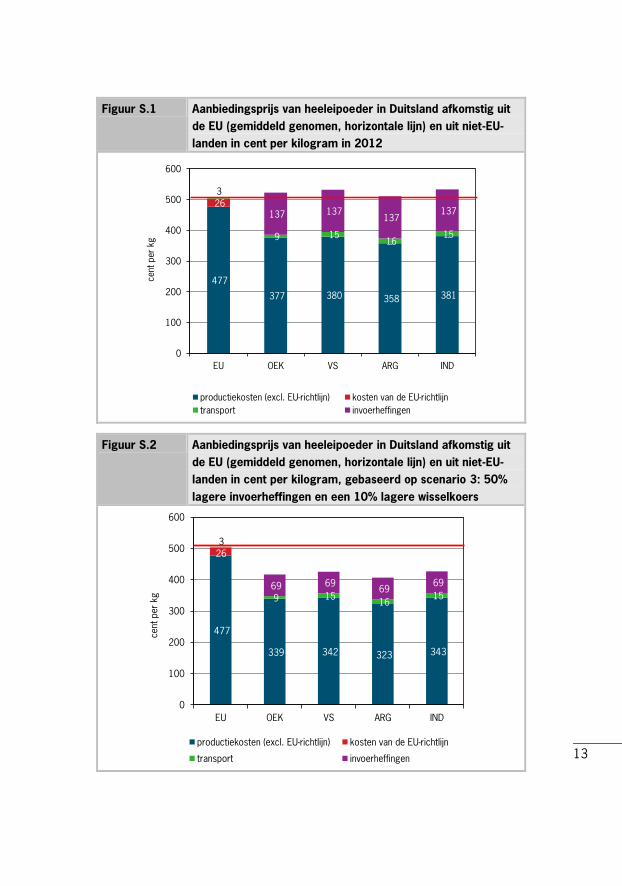
Figure 1.1 Cost of primary production in conventional cages in some
EU countries (cents per kilogram of eggs) in 2010
The costs of primary production (in cents per kilogram of eggs) are the
highest in the United Kingdom and Denmark. The cost in the Netherlands,
France and Italy are approximately the EU average of 84 cent per kg of eggs. In
Spain and Poland the cost of production is at the lowest level of the selected EU
countries.
In Table 1.1 the starting points are given which are used for the calculations.
Table 1.2 indicates the results.
15.0 18.0 16.0 17.0 18.7 15.423.5
44.249.0 48.6 48.5
53.2 49.8
43.3
0
10
20
30
40
50
60
70
80
90
100
NL FR ES IT UK PL DK
hen feed other labour housing general
cent
per
kg

18
Table 1.1 Starting points for egg production in some EU countries
in 2010
NL FR ES IT UK PL DK
Feed price (euro/100 kg) 22.0 23.0 23.5 24.0 24.8 23.5 21.8
Price/hen at 20 weeks (euro) 3.57 3.84 3.89 3.85 4.38 3.49 4.70
Laying period (days) 420 369 410 392 392 400 389
Eggs per hen housed 363 322 345 330 340 332 343
Egg weight (g) 61.4 62.3 64.0 63.0 62.5 63.0 61.6
Feed conversion 2.01 2.13 2.07 2.02 2.15 2.12 1.99
Mortality (%) 8.0 5.0 7.0 8.0 6.0 7.0 5.0
Table 1.2 Costs of primary production (in cents per kilogram of eggs)
in some EU countries in 2010
NL FR ES IT UK PL DK
Total costs inclusive labour 82.0 84.5 79.0 85.9 88.8 78.2 89.3
Total costs exclusive labour 77.4 80.5 75.7 82.1 85.7 76.0 84.7
Hen cost at 20 weeks 16.0 19.2 17.6 18.5 20.6 16.7 22.2
Feed 44.2 49.0 48.6 48.5 53.2 49.8 43.3
Other variable costs 6.5 5.5 4.8 6.5 6.5 4.7 7.0
Labour 4.5 4.0 3.2 3.8 3.2 2.2 4.7
Housing 8.0 7.0 5.7 7.5 6.1 5.5 8.3
General 1.1 1.0 0.9 1.0 1.1 0.8 1.1
Manure disposal 2.6 0.0 -0.2 1.7 0.0 -0.3 1.5
Revenue for spent hen -1.1 -1.1 -1.7 -1.5 -1.9 -1.3 1.2
The differences in costs for the primary production are mainly caused by dif-
ferences in feed costs, the price of young hens (pullets), housing costs and ma-
nure disposal costs. Within the EU countries the price of feed in the UK and Italy
are the highest and the prices in Denmark and the Netherlands are the lowest.
Despite the relatively expensive feed, young hens (pullets) are relatively cheap in
Poland (see Table 1.1). Poland also has the advantage of low labour costs and
the revenues for manure (see Table 1.2). While Dutch farms have good technical
results, the production costs in an EU context are relatively high. This is caused
by higher housing costs, but also particularly by high manure disposal costs. All
countries have a revenue for spent hens, except for Denmark, where egg pro-
ducers have to pay for rendering of spent hens. The average production costs
in the EU, based on these seven countries, is 84 cent per kg of eggs.

19
1.2 Production costs of eggs in some non-EU countries
The production costs of shell eggs for consumption has been researched for
the following non-EU countries: Ukraine (UKR), the USA, Argentina (ARG) and In-
dia (IND). The last three countries were the main exporters of eggs and egg prod-
ucts to the EU in 2011. Ukraine is selected based on the fact that this country
has the potential of becoming an exporter to the EU and because of its geo-
graphic location close to Poland and Germany. Appendix 1 gives an overview of
the main exporters of eggs and egg products (in egg equivalent) to the EU. These
data illustrate that the USA, Argentina and India are important exporters to the
EU. The production costs of the third countries in 2010 are presented in Fig-
ure 1.2. This figure also provides an insight into the make-up of primary produc-
tion costs, and includes a comparison with the average EU level. The hen costs
are defined as the hen cost at 20 weeks, less the revenue of the spent hen.
General costs are the actual general costs plus the manure disposal costs, or
less the revenue of manure (see table 1.4 for the details).
Figure 1.2 Cost of primary production in conventional cages in the EU
(average) and some non-EU countries (cents per kilogram
egg) in 2010
17.7 9.9 12.1 13.6 11.8
48.1
43.9 36.4 34.445.1
-10
0
10
20
30
40
50
60
70
80
90
EU UKR USA AR INDIA
cent
per
kg
hen feed other labour housing general

20
The costs of primary production in all four third countries are clearly lower
than in the EU. In the USA and Argentina the costs are 25% and 28% lower than
the EU level. The difference with Ukraine and India is smaller; the production
costs are 21% below the EU average of 84 cent per kg of eggs. Table 1.3
gives an overview of the starting points used for the calculation and Table 1.4
indicates the results.
Table 1.3 Starting points for egg production in some non-EU countries
in 2010
EU UKR USA ARG IND
Feed price (euro/100 kg) 23.2 20.5 17.7 15.3 18.9
Price per hen at 20 weeks (euro) 3.96 2.99 2.55 3.07 2.67
Laying period (days) 396 395 420 418 364
Eggs per hen housed 339 311 352 335 300
Egg weight (g) 62.5 63.5 60.0 62.5 55.0
Feed conversion 2.07 2.14 2.06 2.25 2.39
Mortality (%) 6.6 8.7 8.0 8.4 8.0
Table 1.4 Costs of primary production (in cents per kilogram of eggs) in
some non-EU countries in 2010
EU UKR USA ARG IND
Total costs inclusive labour 84.0 66.5 62.9 60.2 67.9
Total costs exclusive labour 80.3 63.5 59.6 57.3 64.5
Hen cost at 20 weeks 18.7 15.2 12.1 14.7 16.2
Feed 48.1 43.9 36.4 34.4 45.1
Other variable costs 5.9 4.0 4.3 4.0 4.7
Labour 3.7 3.0 3.3 2.9 3.4
Housing 6.9 5.1 6.0 4.8 3.7
General 1.0 0.6 0.9 0.6 0.5
Manure disposal 0.7 0.0 0.0 0.0 -1.3
Revenue of spent hen -1.0 -5.2 0.0 -1.1 -4.4
The differences in costs for the primary production are mainly caused by dif-
ferences in the costs of feed, young hens (pullets), labour and housing. For In-
dia, the revenues for manure disposal are also relevant. In Ukraine and India the
extra value of the spent hens means a substantial reduction of the net produc-
tion costs, compared to the EU.

21
1.3 Processing costs of whole egg powder in some EU countries
Besides the costs of primary production, the processing costs also play an im-
portant role in the international comparison of competitiveness. Figure 1.3 pro-
vides detailed information about the costs of production of whole egg powder,
in cents per kg of shell egg (input). The processing costs amount to approxi-
mately 25% of the costs of primary production. As Figure 1.3 shows, the level
of labour costs mainly determines the differences in processing costs between
the selected EU countries. The difference between the cost levels of the most
expensive country (Denmark) and the cheapest country (Poland) is 10% above
and 10% below the EU average.
Figure 1.3 Processing costs in some EU countries in cents per kilogram
of shell egg in 2010
1.4 Processing costs of whole egg powder in some non-EU countries
With regard to the processing costs in the non-EU countries, Figure 1.4 shows
that Ukraine and India are 22% and 25% cheaper than the average EU level,
mainly because of low labour costs. The total processing costs in Argentina
7.5 7.6 7.6 7.8 7.6 8.1 7.6
1.3 1.3 1.1 1.3 1.1 0.9 1.4
5.9 5.3 4.1 4.7 4.1
1.2
6.2
5.1 5.1 5.1
5.1 5.1
5.1
5.1
3.0 3.0 3.0
3.0 3.0
3.0
3.0
0
5
10
15
20
25
NL FR ES IT UK PL DK
machinery buildings labour energy/water/waste other
cent
per
kg s
heel egg

22
are 12% lower. The difference in processing costs in the EU and the USA is
very small.
Figure 1.4 Processing costs in EU (average) and some non-EU countries
in cents per kilogram of shell egg in 2010
1.5 Total costs of production and transport of shell eggs
In order to form an idea of the transport costs from the major production area
of a country to an EU market region, in this case Frankfurt am Main in Germany,
the transport costs have been added to the production costs on the basis of a
full load of shell eggs. For that purpose an offer price in Frankfurt am Main has
been calculated. The results clearly indicate that it was not possible for the egg
producers in the selected non-EU countries to compete in the supply of shell
eggs to Germany in 2010. The horizontal line indicates the EU level of total
costs, including the 3 cent/kg costs of transport to Frankfurt. Ukraine could be
a threat for EU egg producers, but the current 30 cents/kg tariff on imports
means that it is not cost effective for non-EU countries to export shell eggs to
the EU market. Figure 1.5 also shows that imports from American, Indian and
Argentine producers will be competitive in a situation if there were to be no im-
7.7 8.6 8.1 8.9 8.9
1.2 0.9 1.4 1.1 0.9
4.5 1.2
4,7 3.0
0.5
5.1
3.8
3.8 3.8
3.8
3.0
2.3
3.0
2.3
2.3
0
5
10
15
20
25
EU UKR USA ARG IND
cent
per
kg s
hell
egg
machinery buildings labour energy/water/waste other

23
port tariffs. However, a serious problem would be the quality of the eggs after
being transported long distances.
Figure 1.5 Offer price of shell eggs in Germany from EU (average) and
non-EU countries in cents per kilogram of shell egg in 2010
1.6 Total costs of production and transport of whole egg powder
For whole egg powder the calculated offer price in Frankfurt am Main in 2010 is
shown in Figure 1.6. This figure shows that for whole egg powder the competi-
tion of non-EU countries, especially Argentina, is a real threat. The tariff on im-
ports barely provides protection from Argentinian whole egg powder entering
the EU market. If there were to be no tariffs on imports, all suppliers of whole
egg powder from the non-EU countries illustrated would have been very compet-
itive on the EU market, already in 2010. It has to be recognised that, in contrast
to shell eggs, the product quality of egg powder is not affected after long dis-
tance transport.
84
66 63 6068
3
11 19 1918
3030 30
30
-
20
40
60
80
100
120
140
EU UKR USA ARG INDIA
cent
per
kg
production cost transport levy on imports

24
Figure 1.6 Offer price of whole egg powder in Germany from EU
(average) and non-EU countries (cents per kilogram) in 2010
477
377 380 358 381
3
9 1516
15
137 137137
137
0
100
200
300
400
500
600
EU UKR USA ARG INDIA
cent
per
kg
production cost transport levy on imports

25
2 Production costs of eggs in 2012
This chapter provides an overview of legislation in the EU, and the impact on the
production costs of eggs is presented. Special attention is given to Directive
99/74/EC, in which the housing systems for layers, implemented from January
2012, are described. In the last section, the total production costs and offer
price of shell eggs and whole egg powder are provided, based on the situation
in 2012.
2.1 EU legislation
Egg producers in the EU have to comply with a set of European legislation. This
legislation is the translation of societal choices made in the EU and especially
relates to environmental protection, animal welfare and food safety. In this sec-
tion, EU legislation directly relevant to the egg sector is briefly presented. It
should be noted that some countries choose to go beyond EU standards by im-
plementing more stringent national or regional legislation. This national legislation
is not, or just briefly, discussed in this chapter. In a report of the European Par-
liament, written by a group of research institutes, an overview is given of EU leg-
islation related to the livestock sector (Chotteau et al., 2009).
Environmental protection
In the EU measures are taken to limit the pollution of land, water and air. Di-
rective 91/676/EC protects land and water from high concentrates of nitrate
mainly by specifying a maximum amount of nitrogen per hectare that can be
applied. Different countries have additional national legislation to limit manure
spreading to certain periods or special soil types. This is especially relevant in
areas with a high concentration of pigs and poultry. Examples are the south and
east of the Netherlands, Flanders in Belgium, Bretagne in France, Catalonia in
Spain and the Po Valley in the north of Italy. As a result egg producers in these
areas have to pay manure disposal costs.
Directive 2001/81/EC gives National Emission Ceilings to ammonia emis-
sions for every member state. Some countries, for example the Netherlands and
Germany, have additional national regulations to reduce ammonia emissions
from poultry houses. To protect air quality, agricultural activities with a high pol-
lution potential are subject to authorisation under the IPPC Directive (2008/1/EC).

26
Food safety
Foodstuffs of animal origin may present microbiological and chemical risks.
Such risks require the adaption of rules of hygiene, traceability and labelling. For
the egg sector the Zoonoses Directive is especially relevant. Zoonoses Directive
2003/99/EC and Regulation 2160/2003 regulate sampling, monitoring and
control measures. Between member states, there is a large variation in Salmo-
nella prevalence. In response to the European Food Safety Authority (EFSA)
baseline study, each member state had to make a plan to reduce the salmonella
prevalence in laying flocks.
A large proportion of protein sources for poultry feed is imported from out-
side the EU. An increasing share of world production of soya crops is from ge-
netically modified hybrids. As a result of asynchronous EU approval of GM
crops, coupled with the operation of near zero tolerance, this is negatively af-
fecting the EU supply of feed ingredients (Backus et al., 2008), resulting in
higher feed costs.
In the EU the use of meat-and-bone meal is prohibited. The consequence is
higher disposal costs for slaughterhouses and higher costs for poultry feed.
Animal welfare
All member states have ratified the European Convention for animal protection
with principles relating to animal housing, feed and care appropriate to their
needs (98/58/EC). The aim is to spare animals all unnecessary suffering in
three main areas: farming, transport and slaughter. Minimum standards are es-
tablished to protect and to avoid competition distortions between producers in
various member states.
Especially relevant for the egg sector is Directive 99/74/EC, laying down
minimum standards for the protection of laying hens. The welfare Directive re-
quired that from 1 January 2003 the space allowance per hen in conventional
cages increased from 450 cm2 to 550 cm2 per hen. In 2012, laying hens can
only be kept in enriched cages or alternative (non-cage) systems. The enriched
cage gives each hen 750 cm2 surface area, increased cage height, a perch, a
nest box and litter. Since this change towards enriched cages has large conse-
quences for the sector, resulting in high additional costs, the impact of this Di-
rective is discussed in a separate section (see Section 2.2).
In the EU all mutilation is prohibited (annex of Directive 99/74/EC). However,
in order to prevent feather pecking and cannibalism, the member states may
authorise beak trimming provided it is carried out by qualified staff on chickens
that are less than 10 days old.

27
In general it can be stated that in non-EU countries the level of legislation
on environmental protection, food safety and animal welfare is non-existent or
at a very low level. Some countries, especially in the USA, have legislation on
food safety, and animal welfare issues are receiving more attention. Appendix 2
provides a short overview on the actual situation in the USA, Ukraine, Argentina
and India.
2.2 Increase in production costs of enriched cages as a result of Council
Directive 1999/74/EC
In June 1999 the European Agricultural Council decided that, after a transition
period, laying hens would be housed exclusively in so-called enriched cages or
in alternative (non-cage) systems. The enriched cage gives each hen 750 cm2
surface area, increased height, a perch, a nest box and litter. The alternative
system described in the EU Directive most resembles the aviary system. Each
hen has 1,100 cm2 living space, the surface area or part of the surface area of
the house is covered with litter and in the house there are enough nest boxes
and perches for the animals. In 2012 two different housing systems can be dis-
tinguished:
- enriched cages
In comparison to conventional battery cages the group size is enlarged.
The cage is complete with a nest box, perch and litter according to EU
standards;
- aviary systems
This system is based on floor accommodation (comparable to barn housing)
whereby via levels, the hens can also use the vertical space in the house.
The welfare Directive required that from 1 January 2003 the space allow-
ance per hen in conventional cages be increased from 450 cm2 to 550 cm2 per
hen.
Taking the 2003 situation as a starting point for 3 different situations, the
production costs of eggs were calculated: a conventional cage with 550 cm2
per hen (situation after 2003), an enriched cage (situation from 2012). Also the
non-cage system, based on the aviary, is included in the comparison.
The production costs of eggs have been calculated for all systems men-
tioned. Based on results at research stations, field data and expert opinions,
assumptions were made on labour input and investments for enriched cages
and aviary systems. It is evident that increasing the space allowance per bird

28
will lower the bird density per m2 of poultry house. As a result the investment
for housing and equipment will increase. For the enriched cage and the aviary,
the labour needs and investments for house and equipment per place per hen
are increasing. Table A3.1 in Appendix 3 provides the details.
The basic assumptions for the technical results are egg production, mortali-
ty and daily feed intake. Based on the experience on farms, it can be concluded
that there are no major differences between the conventional and the enriched
cage. In aviary systems the laying period is shorter. At the same time egg pro-
duction is slightly lower and feed intake and mortality are higher than in the
cage system. Table A3.2 in Appendix 3 gives the details.
On the basis of the accepted debit terms the costs for housing and equip-
ment are calculated for all housing systems. All variable costs are also calculat-
ed for each system (electricity, litter, etcetera). Table 2.1 provides the results.
In the enriched cage, the production costs in relation to the situation before
2012 (conventional cage accommodation with 550 cm2 per hen) are 7% higher.
In the aviary system this is +22%.
Table 2.1 Production costs (in euro) for various housing systems for
laying hens
Conventional cage Enriched cage Aviary
Cost (in euro) per hen housed
Hen (pullet at 17 weeks) 3.30 3.30 3.70
Feed 10.29 10.29 11.07
Other variable costs 1.29 1.51 1.39
Housing 1.91 2.75 3.08
Labour 0.99 1.10 1.51
General costs 0.37 0.41 0.51
Revenue spent hen 0.27 0.27 0.26
Total cost 17.89 19.10 20.99
Total cost per egg (eurocent) 5.26 5.62 6.44
Total cost per kg eggs (euro) 0.85 0.91 1.04
Increase (base 550cm2) 7 22
The conclusion is that after implementation of EU Directive 99/74/EC, the
housing system with enriched cages produces eggs at the lowest cost. Com-
pared to the situation before 2012 (with conventional cages), the production
costs of eggs have increased by 7%. The production costs in aviaries are higher

29
compared to enriched cages. This means the market price should be higher to
keep the income for the egg producer at a constant level. In this context it has
to be mentioned that other alternative housing systems, like free range and or-
ganic, have higher production costs than enriched cages and aviaries. Eggs
produced in these systems need an even higher bonus from the market to
compensate the egg producer for the additional costs.
2.3 Costs of EU legislation in 2010 and 2012
The poultry sector is governed by EU legislation and its implementation almost
always results in additional costs. The layer sector especially is dealing with
additional costs related to environmental protection, animal welfare and food
safety legislation. For the following aspects, an estimate was made of the
additional costs:
Environmental protection
- Manure disposal costs (as result of the N directive).
- Reduction of ammonia emissions (at manure application, manure storage
and in the poultry house).
Food safety
- Salmonella control. Cost of hygiene measures, collection of samples and
testing, and vaccination.
- Meat-and-bone meal (MBM). The ban on the use of meat-and-bone meal in the
EU results in higher feed costs.
- Genetic Modified Organisms (GMO). The strict rules in the EU on the use of
GMO crops results in higher feed costs.
Animal Welfare
- Beak trimming. Beak trimming of layers in the EU is only permitted up to
10 days of age. Compared to the situation without any legislation there will
be additional feed costs (higher feed intake during rearing) and higher mor-
tality rates.
- Density. Additional housing costs for increasing the space allowance per hen
from 450 cm2 to 550 cm2.
- Enriched cages. Costs of conversion from conventional to enriched cages.

30
For all these measures the additional costs are estimated. This estimate is
based on the research done in the Netherlands (Van Horne, 2008). Based on
this method the data are updated for the situation in 2010. For all measures
the average situation for all EU countries is given. However, it should be stated
that there can be a difference in the actual situation per country or per region.
Manure disposal costs are an example for this with high costs in certain concen-
tration areas and just low or no costs at all in other regions with a small number
of poultry farms. Figure 2.1 provides all the cost components of the specific
legislation. The additional costs directly related to EU legislation are 8.8% of the
total production costs of eggs in 2010.
Figure 2.1 Production costs directly related to EU legislation in 2010
A similar estimate of the additional costs is made for the situation in 2012.
In 2012 there are additional costs for housing hens in enriched cages. Also
there are some additional costs, for example, on the reduction of ammonia
emissions and extra costs for feed as a result of a growing shortage of EU-
approved GMO feed ingredients. Figure 2.2 provides the results for 2012. The
additional costs directly related to EU legislation are 15.1% of the total produc-
tion costs of eggs in 2012.
1.2%
0.2%
1.2%
1.2%
0.6%
1.0%
3.5%
91.2% 8.8%
N directive ammonia emission salmonella meat and bonemeal
gmo beaktrimming density (550 cm2) production cost basic

31
Figure 2.2 Production costs directly related to EU legislation in 2012
2.4 Production costs and offer prices of shell eggs in 2012
The situation in 2012 is based on housing laying hens in enriched cages and
keeping hens according to all the EU legislation on environmental protection,
food safety and animal welfare. In Figure 2.3 the production costs of shell eggs
in the EU are compared to Ukraine, the USA, Argentina and India. Based on the
production costs, the additional cost of enriched cages and the transport costs,
the offer prices of shell eggs in Frankfurt am Main (Germany) are presented. The
horizontal line indicates the EU level of total costs including transport. Fig-
ure 2.3 shows that the import tariffs can protect the EU from imports of shell
eggs from third countries.
1.1%0.3%1.1%1.1%
0.7%0.9%
3.3%
6.6%
84.9% 15.1%
N directive ammonia emission salmonella
meat and bonemeal gmo beaktrimming
density (550 cm2) enriched cages production cost basic

32
Figure 2.3 Offer price of shell eggs in Germany from EU average
(horizontal line) and non-EU countries in cents per kilogram
of egg in 2012
2.5 Production costs and offer prices of whole egg powder in 2012
In Figure 2.4 the production costs of whole egg powder in the EU are compared
to Ukraine, the USA, Argentina and India. Based on the production costs of
whole egg powder, the additional costs of enriched cages and the transport
costs, the offer price of whole egg powder in Frankfurt am Main (Germany) is
presented. The horizontal line indicates the EU level of total costs including
transport. Figure 2.4 shows that the import tariffs can protect the EU from im-
ports of whole egg powder from third countries. However, the offer price of
whole egg powder from Argentina is equal to the EU offer price. Despite the EU
import tariffs, all third countries have an offer price for whole egg powder close
to the EU price.
84
66 63 60 68
6
-
3
11 19 19 18
30 30 30 30
0
20
40
60
80
100
120
140
EU UKR USA ARG IND
cent
per
kg
production cost (excl EU-Directive) cost of EU-Directive
transport levy on imports

33
Figure 2.4 Offer price of whole egg powder in Germany from EU average
(horizontal line) and non-EU countries in cents per kilogram
in 2012
477
377 380 358 381
26
--
3
9 15 16
15
137 137 137
137
0
100
200
300
400
500
600
EU UKR USA ARG IND
cent
per
kg
production cost (excl EU-Directive) cost of EU-Directive
transport levy on imports

34
3 Results of different scenarios
3.1 Description of the scenarios
To show the impact of a possible change in import tariffs and a change in the
exchange rate on the competitiveness of EU egg producers and egg proces-
sors, three scenarios for the future have been developed:
1. a change in the EU import tariff on egg and egg products, as a possible re-
sult of a new multilateral (WTO) agreement or bilateral agreement; in this
scenario a reduction in the import tariff of 50% is taken as an example to il-
lustrate the impact;
2. a change in exchange rates of the US dollar, Argentine peso, Ukrainian hryv-
nia and Indian rupee. In this scenario a 10% lower exchange rate for the cur-
rencies of the non-EU-countries is assumed. The average exchange rate in
2010 was used to convert the production costs of all countries to euros. In
Appendix 4 the development of the exchange rate of some non-EU countries
is given. The graph in Appendix 4 illustrates that a 10% lower exchange rate
is a realistic scenario;
3. a combination of a lower import tariff (scenario 1) and a lower exchange rate
of the third countries' currencies illustrated (scenario 2). This is the 'worst-
case' scenario.
In this chapter these three scenarios have been examined for shell eggs
(Section 3.2) and for whole egg powder (Section 3.3). In all figures, the EU level
is an average of the seven EU countries shown in Chapter 1.

35
3.2 Shell eggs
3.2.1 Scenario 1 - Lower EU import tariff
In the first scenario the impact of a 50% lower tariff on imports into the EU has
been examined.
Figure 3.1 Offer price of shell eggs in Germany from EU average
(horizontal line) and non-EU countries in cents per kilogram
of egg (scenario 1: 50% lower import tariff)
As Figure 3.1 illustrates, in this scenario Ukraine would be the most compet-
itive supplier of shell eggs to Frankfurt in 2012. The result of the lowering of the
import tariff is that Ukraine can almost compete on the EU market. Other non-EU
countries would not be competitive on the EU market.
3.2.2 Scenario 2 - Change in exchange rates
This second scenario evaluates the consequences of 10% lower exchange rates
of the currencies of all non-EU countries.
84
66 63 60 68
6
-
3
11 19 19 18
15 15 15
15
0
20
40
60
80
100
120
EU UKR USA ARG IND
cent
per
kg
production cost (excl EU-Directive) cost of EU-Directive
transport levy on imports

36
Figure 3.2 Offer price of shell eggs in Germany from EU average
(horizontal line) and non-EU countries in cents per kilogram
of egg (scenario 2: 10% lower exchange rates)
Lower exchange rates have less impact than the lower import tariffs of sce-
nario 1. Figure 3.2 shows that in the case of 10% lower exchange rates, the
non-EU countries would still be no real competition on the EU market.
3.2.3 Scenario 3 - Combination
The third scenario is a combination of the previous scenarios: 50% lower import
tariffs (scenario 1) and also 10% lower exchange rates of all non-EU currencies
(scenario 2). In fact this third scenario is a 'worst-case scenario'.
84
60 57 54 61
6
-
3
11 19 19 18
30 30 30
30
0
20
40
60
80
100
120
EU UKR USA ARG IND
cent
per
kg
production cost (excl EU-Directive) cost of EU-Directive
transport levy on imports
37
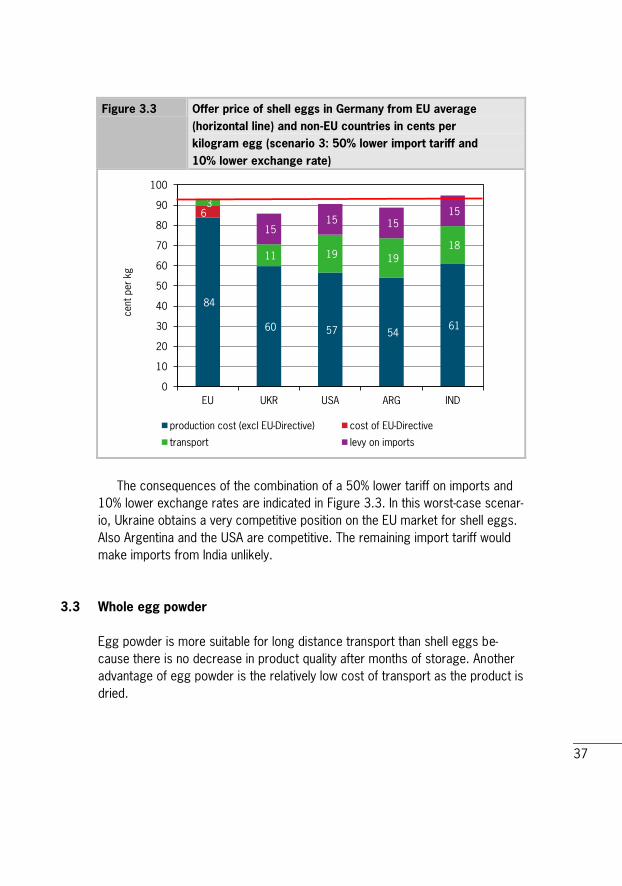
Figure 3.3 Offer price of shell eggs in Germany from EU average
(horizontal line) and non-EU countries in cents per
kilogram egg (scenario 3: 50% lower import tariff and
10% lower exchange rate)
The consequences of the combination of a 50% lower tariff on imports and
10% lower exchange rates are indicated in Figure 3.3. In this worst-case scenar-
io, Ukraine obtains a very competitive position on the EU market for shell eggs.
Also Argentina and the USA are competitive. The remaining import tariff would
make imports from India unlikely.
3.3 Whole egg powder
Egg powder is more suitable for long distance transport than shell eggs be-
cause there is no decrease in product quality after months of storage. Another
advantage of egg powder is the relatively low cost of transport as the product is
dried.
84
60 57 54 61
3
11 19 19
18
15 15 15
15
0
10
20
30
40
50
60
70
80
90
100
EU UKR USA ARG IND
cent
per
kg
production cost (excl EU-Directive) cost of EU-Directive
transport levy on imports
6

38
3.3.1 Scenario 1 - Lower EU import tariff
In the first scenario a 50% lower import tariff on imports into the EU has been
examined. Figure 3.4 shows that a 50% lower import tariff will mean that in
2012 all the non-EU-countries can be relatively cheap suppliers of egg powder
to Frankfurt. The total costs of production, transport and import tariffs of all
third countries are clearly below the average EU level.
Figure 3.4 Offer price of whole egg powder in Germany from EU
average (horizontal line) and non-EU countries in cents
per kilogram (scenario 1: 50% lower import tariff)
3.3.2 Scenario 2 - Change in exchange rates
This second scenario evaluates the consequences of 10% lower exchange rates
of all non-EU currencies. In Figure 3.5 the impact of lower exchange rates is
shown. Also in this scenario in 2012 all non-EU countries can be relatively cheap
suppliers of whole egg powder in Frankfurt. The total costs of production, trans-
port and tariffs would be below the average EU level. However, this scenario
has less impact than the previous scenario with the lower import tariff.
477
377 380 358 381
26 3
9 15 16
15 69 69
69 69
0
100
200
300
400
500
600
EU USA ARG
cent
per
kg
production cost (excl EU-Directive) cost of EU-Directive
transport levy on imports
EU UKR USA ARG IND

39
Figure 3.5 Offer price of whole egg powder in Germany from EU
average (horizontal line) and non-EU countries in cents
per kilogram (scenario 2: 10% lower exchange rate)
3.3.3 Scenario 3 - Combination
This worst-case scenario is a combination of the previous two scenarios: 50%
lower import tariffs (scenario 1) and also 10% lower exchange rates of all non-
EU currencies (scenario 2). The consequences of this combination are illustrat-
ed in Figure 3.6. In this worst-case scenario all non-EU countries would be very
cheap suppliers of whole egg powder to the EU market. Offer prices in Frankfurt
could be 16% (India) to even 20% (Argentina) below the average EU level.
477
339 342 323 343
26
-
3
9 15 16
15
137 137 137
137
0
100
200
300
400
500
600
EU UKR USA ARG IND
cent
per
kg
production cost (excl EU-Directive) cost of EU-Directive
transport levy on imports

40
Figure 3.6 Offer price of whole egg powder in Germany from EU
average (horizontal line) and non-EU countries in cents
per kilogram (scenario 3: 50% lower import tariff and
10% lower exchange rate)
477
339 342 323 343
26
3
9 15 16
15 69 69
69 69
0
100
200
300
400
500
600
EU UKR USA ARG IND
cent
per
kg
production cost (excl EU-Directive) cost of EU-Directive
transport levy on imports

41
4 Conclusions
Production costs in 2010 within the EU
The production costs of shell eggs produced in conventional cages have been
calculated for seven EU countries: the Netherlands (NL), France (FR), Spain (ES),
Italy (IT), the UK, Poland (PL) and Denmark (DK). Between these main egg pro-
ducing countries, the production costs of shell eggs in 2010 ranged from
88.8 eurocents per kg of eggs in the UK and 89.3 eurocents in Denmark to
79.0 in Spain and 78.2 eurocents per kg of eggs in Poland. The average for
those seven countries is 84 eurocents per kg. The processing costs for whole
egg powder also differ within the EU countries from 23.3 eurocents per kg of
shell eggs (input) in Denmark to 18.3 eurocents per kg of shell eggs (input) in
Poland.
Production costs in 2010 in non-EU countries
Compared to the average level within the EU, the production costs for shell
eggs in 2010 was lower in Ukraine (79%), USA (75%), Argentina (72%) and India
(81%). As a result of the costs of transportation, import tariffs and also the ef-
fects on product quality (from the USA, Argentina and India) there are barely any
imports of shell eggs from those countries to the EU. For whole egg powder the
illustrated non-EU countries are more competitive. Compared to the average
level within the EU, the production costs of whole egg powder in 2010 were
lower in Ukraine (79%), USA (80%), Argentina (75%) and India (80%). Because
the costs of transportation of powder are low, the offer price of whole egg
powder from third countries is relatively low. However, current import tariffs
protect the EU from large quantities of imports from the illustrated countries.
EU legislation
In the EU, egg producers have to comply with European legislation. This legisla-
tion deals with environmental protection, animal welfare and food safety. In 2010
the additional costs of EU legislation were estimated to be almost 9% of the to-
tal production costs of eggs at farm level. In these calculations the following leg-
islation was taken into account:
42
- environmental protection
N directive to protect land and water and the reduction of ammonia emis-
sions to protect air.
- food safety
Reduction of Salmonella prevalence, ban on meat-and-bone meal in poultry
feed and regulations on GMO feed ingredients.
- animal welfare
Minimum standards on space allowance and legislation on beak trimming.
In January 2012 EU Council Directive 1999/74/EC 'welfare of laying hens'
was fully implemented on EU egg laying farms. There has been a 7% increase in
the costs of production as the industry moved from conventional cages to en-
riched cages. The total costs of European legislation based on the situation in
2012 is estimated to be more than 15% of the total production costs to pro-
duce eggs at farm level.
Situation in 2012
For shell eggs delivered to the German market, Ukraine, the USA, Argentina and
India cannot compete on price. This is a result of the high costs of transporta-
tion and import tariffs. For whole egg powder the results are different. In 2012
the offer price of whole egg powder from Argentina is close to the average EU
price. Despite the import tariffs on whole egg powder, the third countries are
competitive on the EU market. In recent years the EU imported egg powder
from the USA, Argentina and India. As a result of changes in actual egg prices
on the local market in third countries and fluctuations in exchange rates of for-
eign currencies to the euro, the volumes imported can change from year to
year. In 2010 and 2011 the main exporters of egg powder to the EU were Ar-
gentina and the USA.
Scenarios
To show the impact of a possible change in import tariffs and a change in ex-
change rate on the competitiveness of the EU egg industry, some scenarios for
the future have been developed. In the first scenario a 50% lower import tariff
on eggs and egg products was taken as an example to illustrate the impact of
any multi- or bilateral agreement with lower import tariffs. The results show that
in this scenario all third countries have a lower offer price of whole egg powder
compared to the EU egg industry. The same conclusion is valid in the second

43
scenario with a 10% lower exchange rate, and for the third scenario with a
combination of a 50% lower import tariff and a 10% lower exchange rate.
Welfare legislation in non-EU countries
In the countries outside the EU illustrated in this report there is only the USA
where there is a voluntary programme to increase the space allowance per hen
towards 432 cm2. In Argentina, India and Ukraine there is no legislation on laying
hen welfare and hens are kept in conventional cages with a space allowance of
300 to 400 cm2 per hen. Between countries, regions and farms, the density can
change due to expected market prices (high density when high egg prices are
expected), climate (lower density in hot areas) and housing systems (open or
climate controlled houses). American literature shows that purely from an eco-
nomic point of view, 300 to 400 cm2 per hen gives the highest income for the
egg producer (Bell, 2000).

44
Literature and data sources
Literature
Backus, G.B.C, P. Berkhout, D. Eaton, L. Franke, A.J de Kleijn, B. Lotz,
E.M. van Mil, P. Roza and W. Uffelman 2008. EU policy on GMO's: a quick scan
of the economic consequences. Report 2008-070. The Hague: LEI.
Bell, D.B. December 31 2000. Economic implications of reducing cage density
in the U.S. Cooperative Extension of the University of California. An economic
update, number 234.
Bracke, M. et al. September 2009. Animal Welfare in a Global Perspective.
Report 240. Lelystad: Wageningen UR Livestock Research. The Netherlands.
Chotteau, M.P. et al. August 2009. The impact of increased operating costs on
meat livestock in the EU. Report IP/B/agri/IC/2008-132. European Parliament.
Committee on Agriculture and rural development. Brussels.
Horne, P.L.M. van December 2008. Production cost of table eggs: an
international comparison. LEI report 2008-071 (in Dutch). The Hague.
Horne, P.L.M. van and N. Bondt 2003. Impact of EU Council Directive
99/74/EC 'Welfare of laying hens' on the competitiveness of the EU egg
industry. Report 2.03.04. The Hague: LEI.
IEC September 2011. International Egg market. Annual review. London:
International Egg Commission.
Shane, S.M. 2003. The US Poultry Industry 2003 in review. World Poultry
Vol. 19. No 12.
UBA, September 2009. Animal welfare: Argentina as a stakeholder. Report:
Layers. School of Agronomy. University of Buenos Aires.

45
Data sources
The basic data for calculating the production costs were obtained from several
organisations, institutes and companies in the countries. The following are the
main sources per country:
Netherlands Agricultural Economics Research Institute (LEI)
France Institut Technique de l'Aviculture (ITAVI)
Spain Asociacion Espanola de Productores de Huevos (ASEPHRU)
Italy Unione Nazionale dell'Avicoltura (UNA)
Vito Mastrangelo, consultant
UK British Egg Industry Council (BEIC)
Poland LEI: personal communication, study tour, agricultural counselor
Denmark Dansk Landsbrug
Ukraine Hendrix Poultry Breeders
LEI: personal communication, study tour
USA Egg Industry Center at Iowa State University
International Egg Commission, annual review
Argentina School of Agronomy of the University of Buenos Aires (UBA)
LEI report 2010-005 The poultry and pig sector in Argentina.
Agrivalue S.A. Egg production in Argentina, summer 2011
International Egg Commission, annual review
India National Egg Co-ordination Committee (NECC)
International Egg Commission, annual review

46
Appendix 1 EU imports of eggs and egg products (tonnes of egg
equivalent) 2007-2011
Figure A1.1 Overview of the main exporters of eggs and egg products
(in egg equivalent) to the EU
Source: EU market situation for eggs and poultry, management committee (February 2012).
0
5
10
15
20
25
30
35
40
45
50
2007 2008 2009 2010 2011
Argentina USA India Total

47
Appendix 2 Egg layer industry in the USA, Ukraine, Argentina and India
USA
Egg production in the USA is mainly concentrated in the Mid-West of the coun-
try. In the commercial egg industry numerous independent producers are mar-
keting on a local basis, applying price competition as a major component of
their marketing strategy. It is estimated that the top 10 egg producers, each
with more than 5 million layers, represent 44% of the industry. These compa-
nies have the 'economies of scale' and have a high efficiency in production,
marketing and distribution (Shane, 2003). The USA is a large exporter of eggs
and egg products.
The issue of animal welfare has become a more significant consumer con-
cern in the USA in recent years. Although there is hardly any legislation with re-
gard to poultry welfare, the producers' organisation United Egg Producers (UEP)
has established voluntary guidelines to gradually improve the welfare of laying
hens. The guidelines include provisions for more space for layers in cages,
conditions for moulting and standards for beak trimming. Within the UEP pro-
gramme the birds have more space in the cage. The space per bird is sup-
posed to increase year on year and was 432 cm2 from January 2009 for white
layers. White layers constitute 93% of the total layer population. Participating
producers will be audited annually through an independent certification pro-
gramme. At this point the market for alternative eggs in the USA is still very low
- around 5% - compared to countries in North-West Europe (Bracke et al., 2009).
Proposed federal legislation (2011 proposal) would set national standards
for egg production in the USA with conventional cages to be replaced, after a
transition period of 15 to 18 years, with enriched housing systems that provide
each hen double the amount of space (similar to the 2012 EU standards).
Ukraine
Ukraine is one of the new eastern neighbours of the EU. After Ukraine became
independent in 1991 the principles of the free market economy were intro-
duced. Since the poultry sector was privatised in 1998, it has shown remarka-
ble progress.

48
Although all major poultry breeds can be found in the country, bird perfor-
mance often lags behind their capabilities. However, in recent years perfor-
mance has improved as a result of better management, improved feed quality
and modern health service. With good production results Ukraine could become
a competitive producer of shell eggs and egg products on the markets in the
neighbouring EU countries.
In Ukraine there is no governmental legislation for a minimum space allow-
ance for laying hens. It is estimated that on the farms the hens have between
300 and 400 cm2 per bird. In modern equipment the space allowance is lower
than in the old locally produced cages. Some farms with imported equipment
put 7 hens in a 50 by 50 cm cage, which is 357 cm2 per hen. The stocking
density also depends on the expected price level. When egg prices are ex-
pected to be high, farmers tend to put an extra hen in a cage.
Argentina
The egg industry in Argentina is growing steadily in terms of production, value
and exports. Egg processing has also been growing, currently accounting for
11% of total production. It is one of the most dynamic sub-sectors in terms of
foreign markets and has contributed to reversing the country’s situation from
being an importer of egg products to being an emergent exporter.
No legislation regulating specific animal welfare practices for laying hens ex-
ists in Argentina. In 2009 a survey was conducted and interviews with produc-
ers and businessmen in the egg sector were held. The survey was undertaken
by the University of Buenos Aires and included 30 operations (UBA, 2009). Fac-
tors directly related to layer welfare include space allowances and methods of
beak trimming. All farms in the survey kept layers in cages. The type of cage
differed between farms. The average space allowance was 372 cm2 per hen.
However, there was a wide range from 278 cm2 (8 companies) to 500 cm2 per
hen (1 company). All surveyed farms used pullets that had their beaks trimmed.
The average age at which this was performed was 12 days with a range of
6 to 28 days. The beak trimming also differed in how much of the beak was
trimmed, with the majority of farms trimming between one quarter and one third
of the beak.

49
India
India is a large egg producer and exports shell eggs and dried egg products. A
number of egg powder plants have been developed for export. There are
20,000 farms around the country. The farm size varies from 5,000 birds per
farm to a maximum of 500,000 birds. Most of the farms keep the laying hens
until 76 weeks and forced moulting is not practiced in India. Although western
breeds are used in India, the local breed BV-300 has a high market share. This
breed is completely acclimatised to the Indian agro climatic and feed conditions,
resulting in high egg production.
All commercial layers kept on modern farms have open sided houses where
birds are housed in 3 to 4 rows and three-tier conventional cages. The standard
cage size for 3 birds is 37.5 cm by 30 cm. The space allowance is 375 cm2
per bird. This is much lower than the current EU standard of 750 cm2 per bird.
Animal welfare standards do not exist. Animal welfare is not an issue for the
government in India and in real life improving animal welfare is limited by the
poverty of a great part of the population and the life philosophy within the Hindu
culture (Bracke, 2009). The growing population in India will increase the local
market for poultry products, making export efforts unnecessary for Indian pro-
ducers. However, some of the larger companies are exporting egg powder to
the EU and Japan. This can be achieved as a result of the low production costs.
50
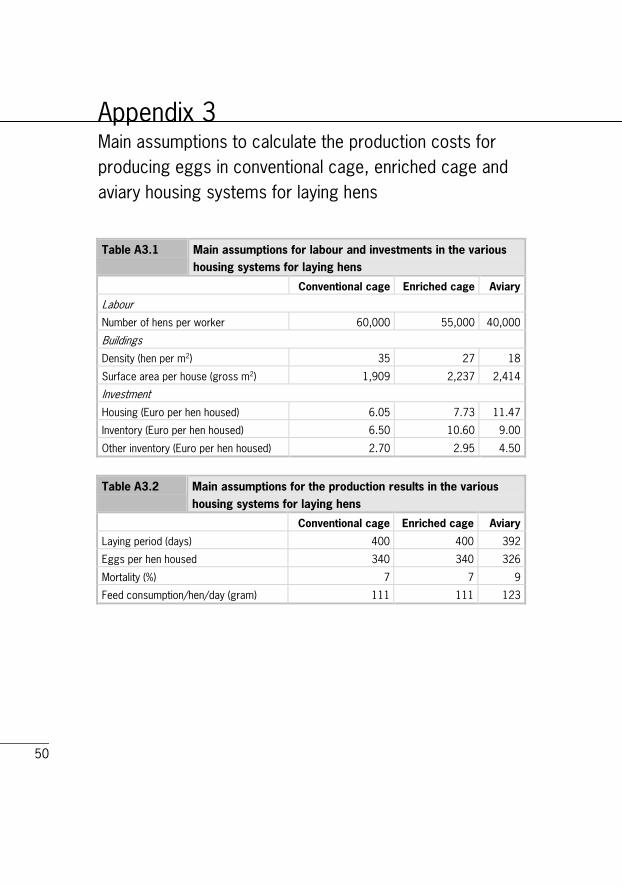
Appendix 3 Main assumptions to calculate the production costs for
producing eggs in conventional cage, enriched cage and
aviary housing systems for laying hens
Table A3.1 Main assumptions for labour and investments in the various
housing systems for laying hens
Conventional cage Enriched cage Aviary
Labour
Number of hens per worker 60,000 55,000 40,000
Buildings
Density (hen per m2) 35 27 18
Surface area per house (gross m2) 1,909 2,237 2,414
Investment
Housing (Euro per hen housed) 6.05 7.73 11.47
Inventory (Euro per hen housed) 6.50 10.60 9.00
Other inventory (Euro per hen housed) 2.70 2.95 4.50
Table A3.2 Main assumptions for the production results in the various
housing systems for laying hens
Conventional cage Enriched cage Aviary
Laying period (days) 400 400 392
Eggs per hen housed 340 340 326
Mortality (%) 7 7 9
Feed consumption/hen/day (gram) 111 111 123

51
Appendix 4 Development of exchange rate of the currency of
Argentina, the USA, Ukraine and India compared with
the euro (January 2000 = 100%)
Figure A4.1 Development of the exchange rate of some non-EU countries
50%
60%
70%
80%
90%
100%
110%
jan/
07
mrt
/07
mei/
07
jul/
07
sep/0
7
nov/
07
jan/
08
mrt
/08
mei/
08
jul/
08
sep/0
8
nov/
08
jan/0
9
mrt
/09
mei/
09
jul/
09
sep/0
9
nov/
09
jan/
10
mrt
/10
mei/
10
jul/
10
sep/1
0
nov/
10
jan/
11
mrt
/11
mei/
11
jul/
11
sep/1
1Argentina USA Ukraine India

LEI report 2012-065
LEI Wageningen UR develops economic expertise for government bodies and industry in the field of food, agriculture and the natural environment. By means of independent research, LEI offers its customers a solid basis for socially and strategically justifiable policy choices.
Together with the Department of Social Sciences and the Wageningen UR, Centre for Development Innovation, LEI Wageningen UR forms the Social Sciences Group.
More information: www.wageningenUR.nl/en/lei