2012-06-29 cord.si (s&p capital i) cordlife initiation
DESCRIPTION
2012-06-29 CORD.SI (S&P Capital I) Cordlife initiation.pdfTRANSCRIPT

This report is for information purposes and should not be considered a solicitation to buy or sell any security. Neither Standard & Poor’s nor any other
party guarantees its accuracy or makes warranties regarding results from its usage. Redistribution is prohibited without written permission. Copyright ©
2012. All required disclosures and analyst certification appears on the last 3 pages of this report. Additional information is available on request.
June 29, 2012
Cordlife Group Initiation Banking for the future
Strong market position in Singapore and Hong Kong. Cordlife is the
market leader in private cord blood banking in Singapore and is
among the top three players in Hong Kong. The group’s strong market
position and reputation will enable it to benefit from growing demand
for cord blood banking services.
Expanding prospects. Cordlife plans to leverage on its established
brand and market leadership to grow its position further in existing
markets. To this end, it will intensify marketing activities to promote
awareness towards the benefits of cord blood banking and will
increase its capacity through new proposed headquarters and
facilities at Yishun A’Posh Bizhub. The company also intends to
diversify into complementary services such as offering umbilical cord
tissue banking in Singapore and will grow through accretive
acquisitions in selected markets.
Higher penetration rate to drive industry growth. While the number
of resident births in Singapore and Hong Kong are expected to remain
stable over the next few years, the deepening of penetration rates in
both the markets will drive demand for cord blood banking.
Higher revenue for 9MFY12 (Jun.), margin under pressure.
Cordlife’s 9MFY12 net profit declined to SGD4.6 mln (-25.4%YoY)
mainly a result of: (i) lower gross margin attributed to higher cost of
testing brought by a change in the AABB standards; and (ii) higher
administration costs from IPO and director fees. The group announced
an interim net DPS of SG1.8 cents and a special DPS of SG0.2 cents.
Key Fundamentals
FYE Jun. 30 Jun-09 Jun-10 Jun-11Revenue 22.6 28.2 25.7 EBIT 7.1 8.4 7.2 EBITDA Margin % 32.6 31.3 30.3 Net Income 6.2 8.3 8.5 Basic EPS (SG cents)* 2.66 3.55 3.64 Price/Earnings (x) 19.4 14.5 14.1 EPS Growth % N.A. 33.7 2.47 DPS (SG cents) N.A. N.A. N.A.Dividend yield % N.A. N.A. N.A.Price/Book value (x)* 4.45 3.63 2.95 Return on equity % N.A. 27.6 23.0 Return on assets % N.A. 16.3 14.8 Total Debt:Equity % 3.8 2.7 2.1 Source: Company data, S&P Capital IQ *Based on 232.7 mln post IPO shares in issue
GICS: Healthcare/Healthcare Equipment and Services
Business Summary: Cordlife Group Ltd, an investment holding company, provides cord
blood banking and umbilical cord tissue banking services.
Country of Incorporation: Singapore
Head Office Location: 61 Science Park Road, No. 05-16/17/18, The Galen Singapore
Science Park II, Singapore 117525.
Place of Operation: Singapore, Hong Kong and Shenzhen
Website: www.cordlife.com
IR Contact: Ms. Dolores Phua | [email protected]
| +65-6534 5122
CURRENT PRICE:
SGD0.515
Lau Seu Yee/Lee Wee Sieng
Equity Analyst
65 6239 6391
Key statistics
52-week Price Range 0.80 / 0.43Avg Vol - 12 months ('000 shares) 2,232.5Price performance (%) - 1 month 15.7
- 3 month N.A.- 12 month N.A.
No. of Outstanding shares (mln) 232.7Free Float (%) 61.6
Market Cap (SGD mln) 119.8Enterprise value (SGD mln) 88.2
Major shareholders (%)China Stem Cells (East) Co Ltd 10.5
City Challenge Global Ltd 9.4Coop International Pte Ltd 8.8
Source: Company data, S&P Capital IQ

2
Standard & Poor’s
June 29, 2012 Cordlife Group Ltd
Share Price Performance
Cordlife Group Share Price Chart
Source: S&P Capital IQ
There is limited share price history since Cordlife was recently listed (on Mar. 29,
2012). As such, we can only compare its one-month share price performance with
the STI and its peers.
Comparative Performance
Cordlife GroupFTSE Straits Times Index
China Cord Blood Corp. Stemlife Bhd Bionet Corp.
1 Month 15.73% 2.14% -1.14% 5.95% 26.91%3 Month N.A. -5.61% -6.81% 56.14% 13.29%6 Month N.A. 6.77% 20.37% 56.14% 22.24%Source: S&P Capital IQ
Share Price Performance Details
Current Price 0.515 52-week Hi/Low 0.80/0.43 10-day Avg Volume (mln) 4.10427 Price 1 Month Ago 0.445 1 Month Price Performance 15.73% Price 3 Months Ago N.A. 3 Month Price Performance N.A. Price 6 Months Ago N.A. 6 Month Price Performance N.A. Price 12 Months Ago N.A. 12 Month Price Performance N.A. Market Capitalization (SGD mln) 119.8 Beta N.A.
Source: S&P Capital IQ
0.40
0.50
0.60
0.70
0.80
Price 30 Day Moving Average
0306090120150180
29‐Mar 8‐Apr 18‐Apr 28‐Apr 8‐May 18‐May 28‐May 7‐Jun 17‐Jun 27‐Jun
Volume Vol ('mln)
Price (SGD)

3
Standard & Poor’s
June 29, 2012 Cordlife Group Ltd
Financial Performance
Recent interim performance: Cordlife’s 9MFY12 (Jun.) net profit dropped 25.4%
YoY to SGD4.6 mln in spite of 14.2% YoY increase in total revenue. The higher
revenue was attributed to: (i) an increase in the provision of cord blood banking
services driven by a rise in the number of client deliveries, from about 4,900 in
9MFY11 to 5,300 in 9MFY12; and (ii) provision of new cord tissue banking services
in Hong Kong which commenced in March 2011.
The group’s profitability was however, weakened by a lower gross margin of
68.8% (-2.1%-pts) as a result of increase in cost of testing brought about by a
change in the AABB standards. In addition, margins were affected by higher
administrative expenses (+76.8% YoY) due to IPO expenses and increase in
headcount and director fees. This was partially offset by higher associate’s
income of SGD1.4 mln (+32.3% YoY) due to the growth of Guangzhou Tianhe
Nuoya’s business as new customers signed up each year.
Cordlife’s balance sheet remains healthy as at 9MFY12 with minimal total debt to
equity ratio of about 3%. As at end-9MFY12, total borrowings increased to about
SGD2.0 mln (from SGD0.8 mln end-FY11). Given this is matched by a healthy cash
& cash equivalents of SGD33.6 mln (an increase of 742% from FY11 level), the
group remains in net cash position in 9MFY12. Operating cash flow remains
positive while listing proceeds help add to the overall increase in cash and
equivalents. The additional loan drawn down is to finance the A’Posh Bizhub
property which is presently under construction.
Detailed Profit & Loss
SGD mln Fiscal Nine Months Ending Mar-12 Mar-11 YoY (%) Revenue 21.3 18.7 14.2 Cost of sales (6.6) (5.4) 22.5 Gross profit 14.7 13.2 10.8 Gross profit margin 68.8% 70.9% Other operating income 0.1 0.3 (72.0) Selling and marketing expenses (4.9) (4.2) 16.6 Administrative expenses (6.9) (3.9) 76.8 Profit from operations/EBIT 2.9 5.4 (45.8) EBIT margin 13.7% 28.8% Share of results in associate 1.4 1.1 32.3 Finance income 1.0 0.8 29.5 Finance costs (0.0) (0.0) (97.5) Profit before tax 5.4 7.2 (25.4) PBT Margin 25.3% 38.7% Income tax (0.8) (1.0) (25.1) Effective tax rate 14.3% 14.3% Net profit attributable to equity holders 4.6 6.2 (25.4) As reported EPS (SG cents) 1.98 2.66 (25.4) Share capital (mln) 232.7 232.7 Weighted share capital (mln) 232.7 232.7 Source: Company data, S&P Capital IQ Research

4
Standard & Poor’s
June 29, 2012 Cordlife Group Ltd
Income Statement (SGD mln)
FYE June 30 2009 2010 2011 Total Revenue 22.6 28.2 25.7 Growth Over Prior Year N.A. 24.7% -8.8% Gross Profit 16.4 20.5 18.3 Margin % 72.6% 72.8% 71.1% EBITDA 7.4 8.8 7.8 Margin % 32.6% 31.3% 30.3% EBIT 7.1 8.4 7.2 Margin % 31.4% 29.9% 28.1% Earnings from Cont. Ops. 6.5 8.4 8.5 Margin % 29.0% 29.9% 33.0% Net Income 6.2 8.3 8.5 Margin % 27.4% 29.4% 33.0% Basic EPS* 2.7 3.6 3.6
Key Growth and Fundamental Ratios
FYE June 30 2009 2010 2011 EPS Growth (%) N.A. 33.7 2.6 Sales Growth (%) N.A. 24.7 -8.8 Asset Turnover (x) N.A. 0.6 0.5 Inventory Turnover (x) N.A. 32.9 31.1 Receivables Turnover (x) N.A. 3.4 3.6 Effective Tax Rate (%) 15.2 15.4 14.7 Total Debt to Equity (%) 3.8 2.7 2.1 Interest Coverage (x) 283.5 183.0 167.7 Quick Ratio (x) 1.8 0.9 1.4 Current Ratio (x) 2.1 1.0 1.6 Payout Ratio (%) 0.0 0.0 0.0 Debt to Capital (%) 3.7 2.6 2.0
Balance Sheet (SGD mln)
FYE June 30 2009 2010 2011 Current Assets 24.5 21.0 12.9 Fixed Assets 0.8 2.0 4.3 Other LT Assets 17.5 35.8 38.2 Total Assets 42.7 58.8 55.4 Current Liabilities 11.8 21.2 8.0 Total Liabilities 14.5 25.8 14.8 Share capital 25.7 25.7 25.7 Shareholder's Equity 28.3 33.0 40.6 Cash and Cash Equivalents 7.0 8.2 4.0 Total Debt 1.1 0.9 0.8 Net Cash/(Debt) 5.9 7.3 3.2
Cash Flow (SGD mln)
FYE June 30 2009 2010 2011 Cash from Operations 3.8 8.3 8.0 Capital Expenditure (0.4) (1.6) (3.1) Cash from Investing (3.2) (16.2) (4.4) Total Debt Issued 1.9 9.5 5.4 Total Debt Repaid (0.6) (0.0) (12.6) Cash from Financing 1.3 9.5 (7.3) Change in Cash 2.0 1.4 (3.3) Cash flow per share (SG cents)* 1.6 3.6 3.5 Source: Company data, S&P Equity Research estimates * Based on 232.7 mln post IPO shares in issue

5
Standard & Poor’s
June 29, 2012 Cordlife Group Ltd
Industry Characteristics and Outlook
Summary: Cord blood banking is a consolidated industry in Singapore and Hong
Kong (Cordlife’s two key markets) dominated by a few key players and has
relatively high entry barriers. Demand for cord blood banking is dependent on: (i)
number of births and (ii) public acceptance of cord blood banking. The number of
births for Singapore and Hong Kong residents has been relatively stable in the
past five years and will likely remain flat in the next few years. The key
uncertainty in the Hong Kong market lies with a potential ban in mainland PRC
expectant mothers giving birth in Hong Kong. Nevertheless, the growth in cord
blood banking is expected to be driven by an increase in penetration rate in the
respective markets helped by increasing public acceptance of cord blood banking.
Brief description of cord blood banking: Cord blood banking involves the
processing, testing, cryopreservation and storage of umbilical cord blood which
is collected at birth. Stem cells from cord blood can be used to treat diseases
such as leukaemia, cerebral palsy, blood and immune system disorders.
Key revenue drivers: Cordlife’s revenue is mainly driven by its storage volume of
cord blood banking which is determined by: (i) number of births; (ii) penetration
rate of cord blood banking; and (iii) its market share.
The number of new births in a country will directly dictate the overall market size
of cord blood banking industry in the country. In Singapore, the number of births
was relatively stable in the past five years averaging 39,301 (CAGR of 0.7% during
2006-2011). Going forward, Deloitte & Touche Financial Advisory Services
(DTFAS) expect the Singapore births growth to remain fairly flat. In Hong Kong,
the number of births has been increasing at a steady rate (CAGR of 7.8%) during
2006-2011, growing to 95,400 in 2011 from 65,600 in 2006. The growth in births
was driven by an influx of mainland PRC expectant mothers which increased to
43,982 in 2011 from 26,132 in 2006. In recent news, the chief executive-elect
proposed a ban on mainland women giving birth in Hong Kong from 2013 which
may adversely affect the potential market for cord blood banking in Hong Kong.
In contrast, the annual birth numbers among Hong Kong residents have been
relatively stable, ranging from 43,000 to 49,000 in the past few years and is
expected to remain stable over the next few years.
Singapore and Hong Kong total live births and YoY growth (2006-2011)
Source: Singapore Department of Statistics, Census and Statistics Department – Hong Kong SAR
Singapore
05,000
10,00015,00020,00025,00030,00035,00040,00045,00050,000
2006 2007 2008 2009 2010 2011-12.0%
-10.0%
-8.0%
-6.0%
-4.0%
-2.0%
0.0%
2.0%
4.0%
6.0%
Total Births
Total Births YoY
Hong Kong
010,00020,00030,00040,00050,00060,00070,00080,00090,000
100,000
2006 2007 2008 2009 2010 2011-12.0%
-9.0%
-6.0%
-3.0%
0.0%
3.0%
6.0%
9.0%
12.0%
15.0%
Total Births
Total Births YoY

6
Standard & Poor’s
June 29, 2012 Cordlife Group Ltd
Penetration rate of private cord blood banking is measured as annual incremental
units of cord blood stored in private banks divided by annual number of new
births. Factors influencing the penetration rate in a particular market include: (i)
public awareness and acceptance; (ii) favorable regulatory environment and
Government subsidies; and (iii) cord blood applications and potential uses.
According to DTFAS, Singapore is a relatively mature cord blood banking market
with a penetration rate of 24% in 2010 and a CAGR of 16% during 2007-2010. The
strong CAGR was partly due to a government subsidy of 50% of the collection fee
through “child development co-saving” scheme. Looking forward, DTFAS expects
penetration rate of private cord blood banking market in Singapore to grow to
38% in 2015 with a CAGR of around 9% for 2011-2015.
In Hong Kong, the penetration rate was estimated to be 11.5% in 2010 and a
CAGR of 15% during 2007-2010. DTFAS projected penetration rate to increase to
20.6% in 2015 with a CAGR of 10% for 2011-2015, helped by higher visibility of
cord blood banking.
Singapore and Hong Kong Penetration Rate and Incremental Storage Volume in
Private Sector (2007-2015F)
Source: DTFAS Market Research
While total new births combined with penetration rate will determine the size of
cord blood banking industry in the respective country, Cordlife’s market share
will determine the firm’s storage volume which directly drives its revenue stream.
Cordlife had an estimated market share of around 62% and 28% of the Singapore
and Hong Kong private cord blood banking market respectively in 2010.
Competitive Landscape and Pressure
The cord blood banking industry in Singapore and Hong Kong is consolidated and
has relatively high entry barriers such as cord blood banking licensing, reputation
and networking with hospitals. In Singapore, there are only three cord blood
banks: one public (Singapore Cord Blood Bank) and two private (Cordlife and
StemCord). Both the private blood banks began operations in Singapore in the
early 2000s. Cordlife is the larger player with market share of 62% and storage
capacity of 60,000 units. StemCord has market share of 38% and storage capacity
of 40,000 units.
Singapore
0
2000
4000
6000
8000
10000
12000
14000
16000
2007 2010 2015F0.0%
5.0%
10.0%
15.0%
20.0%
25.0%
30.0%
35.0%
40.0%
Incremental storage vol. (private) Penetration rate (private)
Hong Kong
0
1000
2000
3000
4000
5000
6000
7000
8000
9000
2007 2010 2015F0.0%
5.0%
10.0%
15.0%
20.0%
25.0%
Incremental storage vol. (private) Penetration rate (private)

7
Standard & Poor’s
June 29, 2012 Cordlife Group Ltd
In Hong Kong, the top three players (Cordlife, Cryolife and Healthbaby) accounted
for more than 90% in terms of incremental and cumulative storage volume in the
private sector. Cyrolife had the most cumulative storage units, but less
incremental storage units than Healthbaby and Cordlife in 2010. Healthbaby had
the highest annual incremental storage units, followed by Cordlife. Healthybaby,
Cordlife and Cyrolife are estimated to have 45%, 28% and 23% of market share (in
terms of incremental storage), respectively in 2010.
Pricing structure
The following two tables highlight the pricing structure of key private cord blood
banks in Singapore and Hong Kong.
Pricing structure of key private cord blood banks in Singapore and Hong Kong
Private cord blood banks - Singapore Private cord blood banks - Hong Kong
Collection fee or
one-time fee Annual storage fee Storage period
Collection fee or
one-time fee Annual storage fee Storage period
Cordlife Option (i) SGD1,950 SGD250 21 years Cordlife Option (i) HKD19,000 HKD1,500 18 years
Option (ii) SGD4,200 SGD250 (from year 11 ) 21 years Option (ii) HKD23,500 HKD1,500 (from year 5 ) 18 years
Option (iii) SGD6,200 No annual fees 21 years Option (iii) HKD29,500 HKD1,500 (from year 10 ) 18 years
Option (iv) HKD36,000 No annual fees 18 years
Stemcord SGD1,580 SGD275 5 years or more
Usually 21 years Cyrolife Option (i) HKD37,400 No annual fees 18 years
Option (ii) HKD41,500 No annual fees 23 years
Option (iii) HKD45,380 No annual fees 28 years
Healthbaby HKD38,000 No annual fees 18 years
Source: DTFAS Market Research, Company website
Key Operating Costs
Cordlife’s key operating costs are: (i) cost of sales, (ii) selling & marketing
expenses and (iii) administrative expenses. The cost of sales relates to expenses
incurred in processing and storage of cord blood and includes costs of various
tests carried out, direct labour & material costs and overheads such as laboratory
and storage rental expenses. Cost of sales accounted for 27.2%, 28.9% and 31.2%
of revenue for FY10, FY11 and 9MFY12, respectively. The increase in cost of sales
in 9MFY12 was partly due to higher cost of additional blood testing required to
meet a change in AABB standards.
Selling & marketing expenses include advertising and promotion expenses,
marketing staff salaries and commission expenses. It accounted for 20.1%, 22.9%
and 23.1% of revenue for FY10, FY11 and 9MFY12, respectively. Administrative
expenses include salaries of administrative and finance staff, rental expenses,
consultancy expenses and depreciation of office equipment. It accounted for
23.3%, 21.6% and 32.3% of revenue for FY10, FY11 and 9MFY12, respectively. The
higher administrative expenses in 9MFY12 were mainly due to the one-off IPO
expenses of SGD1.3 mln incurred in 3QFY12.

8
Standard & Poor’s
June 29, 2012 Cordlife Group Ltd
Breakdown of key operating costs and margin for FY10, FY11 and 9MFY12
FY10
27.20%
20.10%
23.30%
29.40%
FY11
28.90%
22.90%21.60%
26.60%
Cost of sales Selling & marketing expenses Administrative expenses Operating margin
9MFY12
31.20%
23.10%
13.40%
32.30%
Source: Company data
Key Risks
Regulatory risks: Cord blood banking industry is regulated by the respective
countries’ health authorities and global accreditation bodies. Any adverse
changes in regulatory policies, guidelines or requirements may impact the
industry. For example, a change in blood testing requirements by AABB resulted
in a cost increase of SGD120 per cord blood unit. In addition, a ban or significant
reduction in quota for mainland PRC mothers giving birth in Hong Kong will
reduce its potential market in Hong Kong.
Technology and alternative medical treatment risks: Future medical or
technological advances may render cord blood banking irrelevant. Although it is
currently possible to collect stem cells from other bodily sources such as bone
marrow, it involves surgical procedures and may potentially cause side effects. If
medical advances enable cheaper or more effective ways to collect and store
stem cells, cord blood banking may be made redundant. New medical treatments
superior to the use of cord blood in medical treatment may also eliminate the
need for cord blood banking.
Reputation risks: Any inadequacies or problems with Cordlife’s cord blood
banking services or the cord blood banking industry in general resulting in bad
publicity or tarnishing of reputation will decrease the demand for its cord blood
banking services.
Credit risks associated with instalment customers: Cordlife is exposed to delay
or default on payments by its customers who are on annual payment options. Its
annual payment customers accounted for 40.3% and 39.2% of its total customers
in FY10 and FY11, respectively. Nevertheless, the default rates had been low at
0.1% and 0.2% of its total customers in FY10 and FY11, respectively.
Foreign exchange risks: As Cordlife has significant operations in Hong Kong, it
is exposed to foreign exchange translation risk as its reporting currency is in
SGD. 28.0% and 25.2% of its total revenue in FY10 and FY11, respectively were
denominated in HKD.

9
Standard & Poor’s
June 29, 2012 Cordlife Group Ltd
Cordlife’s Growth Strategy
Cordlife will continue to leverage on its established brand, expertise and market
leadership to grow its core business in Singapore and Hong Kong. To this end, it
intends to intensify certain marketing activities which are aimed at promoting
awareness towards the benefits of cord blood banking in these markets. It will
also be increasing its current capacity and the recently acquired 22,000 sq.ft.
space in A’Posh Bizhub in Yishun will enable storage of up to about 650,000 cord
blood units when completed by year-end. Cordlife’s key growth plans include the
following:
Capitalise on strategic investment in the PRC for growth in Hong Kong
For growth in Hong Kong, Cordlife will continue to capitalise on its co-marketing
arrangement with China Cord Blood which gives it access to PRC expectant
mothers in Beijing, Guangdong and Zhejiang provinces who intend to deliver in
Hong Kong. For 2012, the Hong Kong government has set a quota of 31,000
places in maternity wards for mainland women in private hospitals and 3,400 in
public hospitals in response to public pressure. The management believes that in
the event if the government bars mainland Chinese women from giving birth in
Hong Kong, the company’s strong brand, track record and rising public
awareness of cord blood banking should help weather this potential change in
government regulations. In addition, the ban - if imposed - will not apply to
mainland Chinese women married to Hong Kong residents.
Leverage on expanded clinical use
As medical development expands the therapeutic utility of cord blood banking,
the perceived value of cord blood banking will be enhanced. The company
actively keeps abreast of research in the area of clinical utility of cord blood and
seeks to update it customers on these developments on a periodic basis.
Diversify into secondary and complementary services
The company was the first to introduce the automated processing system in
Singapore and Hong Kong. It is currently exploring the possibility of offering
umbilical cord tissue banking services in Singapore and has begun discussions
with MOH in relation to the licensing requirements for the provision of such a
service. The company also intends to grow its services through collaborations, in-
licensing and strategic alliances as opposed to in-house research and
development programme, and considers Singapore an ideal place for such
activities, given the depth of public biomedical research and pro-collaboration
attitudes of research institutions.
Growth through accretive acquisitions in selected markets
Cordlife is actively seeking opportunities to broaden its service offering and
expand its geographical coverage in Asia through accretive acquisitions in
selected markets around the region. In connection with its demerger from CBB
(listed on the Australian Stock Exchange and previously known as Cygenics
Limited), the company has entered into the ROFR agreement in which it was
granted right of first refusal (“ROFR”) to acquire CBB’s business in Indonesia,
India and Philippines.

10
Standard & Poor’s
June 29, 2012 Cordlife Group Ltd
Strengths
Market Leadership. According to the Market Research Report conducted by
DTFAS, the market share held by Cordlife in Singapore and Hong Kong in
2010 is approximately 62% and 28%, respectively.
Clinical Leadership. It is believed that Cordlife is one of the first private cord
blood banks in Singapore and amongst the first in Hong Kong to have issued
cord blood units stored with the company for transplants and other
therapeutic use.
Quality Leadership. Cordlife was one of the first in Singapore and amongst
the first in Asia to be accredited by AABB and have remained accredited
since 2005. Its Hong Kong facility has been certified ISO:9001 since August
2007 and was accredited by AABB in October 2011.
Technology Leadership. Cordlife was one of the first to adopt the automated
processing system in Singapore and Hong Kong and is constantly seeking to
improve services through the use of technology which will improve the utility
of the cord blood units.
Experienced Management Team. The management, led by its Executive
Director and CEO, Mr Yee Pinh Jeremy, is supported by a team of key
executives who are experienced and competent in their respective functions.
Established brand and distribution networks. Cordlife maintains
collaborative relationships or arrangements with major private hospitals and
several clinics in Singapore and Hong Kong. It also has a collaborative
agreement with China Cord Blood Corporation to market Cordlife Hong
Kong’s cord blood banking services to Chinese expectant mothers planning
to deliver their babies in Hong Kong.
Weaknesses
Dependence on the two key markets, Singapore and Hong Kong exposes
Cordlife to concentrated geographical risks markets such as adverse
economic conditions, weaker consumer confidence/spending and
unfavorable regulatory changes.
Growth of the business is dependent on the fertility level as well as
population base in its key markets, Singapore and Hong Kong. Whilst
Singapore is facing stagnating and low birth rates, Hong Kong’s birth rates
have been supported by an influx of mainland mothers. In 2011, nearly 47%
of over 95,000 newborns in Hong Kong, or about 44,000 were born to
mainland women. Of the estimated 44,000 mainland women who gave birth
in Hong Kong, 33,000 went to private hospitals. The possible ban by the Hong
Kong authorities to prevent mainland Chinese women from giving birth in
Hong Kong may affect the potential market for cord blood banking in the
country.
Industry is competitive with a few established cord blood banking service
providers already operating in the same region and there is potential influx
of new entrants. In addition, there is the choice of selecting public cord blood
banking. This leaves limited flexibility in enhancing profit margins and
passing through rising costs.

11
Standard & Poor’s
June 29, 2012 Cordlife Group Ltd
Significant capital investment to keep pace with technological advances.
The evolving cord blood banking industry coupled with increasing
competition requires key capital investment to continuously enhance existing
infrastructure and keep pace with technological developments.
Management Guidance
Management remains cautiously optimistic on the forward demand for its cord
blood banking services. Despite worries on the debt crisis in Europe and
uncertainties in the economic environment, Cordlife’s management is confident
of sustaining its profitability with its strong market position and brand equity
coupled with favourable industry factors. The positive industry factors include the
following:
Singapore’s private cord blood banking is expected to keep growing. As the
larger of only two private cord blood banking service providers in Singapore,
it is in a good position to benefit from deepening penetration rates of cord
blood banking in the country. As provided in the industry section earlier, the
penetration level of private cord blood banking is expected to rise 38% by
2015 from 24% in 2010 (Source: DTFAS). With Cordlife’s larger space at its
new headquarters and facility at Yishun, A’ Posh Bizhub, this should further
entrench its leadership position in Singapore.
Similarly, Cordlife is expected to benefit from deepening penetration rates in
Hong Kong, which are expected to rise from 11.5% in 2010 to 20.6% in 2015
(Source: DTFAS). Leading players, of which Cordlife is one of the top three in
terms of market share, are driving this growth by raising the visibility of cord
blood banking. Cordlife launch of the umbilical cord tissue banking in March
2011 offers an additional service to potential customers.
The group has also benefited from its indirect 10% shareholding in
Guangzhou Tianhe Nuoya. The nationwide penetration rate for private cord
blood banks in China is expected to increase from 0.5% in 2010 to 1.4% in
2015 (Source: DTFAS).
As for the possible ban by authorities to prevent pregnant women from mainland
China from giving birth in Hong Kong, management believes that its strong
brand, solid track record and leadership position should provide it with a firm
footing to weather this potential regulatory change. Furthermore, the ban, if
imposed, will not apply to mainland Chinese women married to Hong Kong
residents. With the relatively stable annual birth numbers among Hong Kong
residents ranging from 43,000 to 49,000, this should provide a substantial pool of
potential customers.

12
Standard & Poor’s
June 29, 2012 Cordlife Group Ltd
Peer Comparison
The following charts show Cordlife’s fundamental performance and valuation
ratios relative to its listed peers with similar business activities in the region.
China Cord Blood Corp is a NYSE-listed company that owns stakes in cord blood
banks in Beijing, Guangdong, Zhejiang and Shandong. Bionet Corp, a Taiwan-
listed company is engaged in cell tissue banking and cell therapy which operates
primarily in Taiwan. Stemlife, listed in Bursa Malaysia is involved in stem cell
banking and therapeutics. Cryo-Save Group listed on the NYSE Euronext
Amsterdam operates as a family stem cell bank in Europe, Asia and Africa. While
Cordlife’s listing history is short, its profitability and capital efficiency ratios
compare favourably with its peers.
Cordlife’s annual sales growth declined in FY11 due to decrease in client
deliveries caused by the leading-on effects arising from the deteriorating global
economic condition. In spite of lower revenues, Cordlife managed to register a
small growth in its EPS due to efficient cost management and higher contribution
from associate’s income. The EPS growth rates for Bionet and Stemlife were not
meaningful as the two companies swung between profits and losses in the past
few years. Cordlife has managed its costs relatively well over the past years
showing healthy profit margins compared to its listed peers. Cordlife’s balance
sheet also appears healthy with a minimal debt/equity ratio of 2.1% in FY11.
Annual Sales Growth (%) Annual EPS Growth (%)
(50)
(30)
(10)
10
30
50
2009 2010 2011
(120)
(80)
(40)
-
40
80
120
160
200
2009 2010 2011
Source: S&P Capital IQ
PER (X) Gearing (%)
On the PER valuation parameter, Cordlife has relatively short history as it was listed only in March 2012. Meanwhile, the company has a healthy balance sheet with minimal debt/equity ratio.
-
5
10
15
20
25
30
35
40
45
2009 2010 2011
Debt/Equity
-
2
4
6
8
10
2009 2010 2011
Source: S&P Capital IQ
Cordlife Group Limited(SGX:P8A)
China Cord BloodCorporation (NYSE:CO)
Bionet Corp (GTSM:1784)
Stemlife Berhad(KLSE:STEMLFE)
Cryo-Save Group N.V.(ENXTAM:CRYO)

13
Standard & Poor’s
June 29, 2012 Cordlife Group Ltd
EBITDA Margin (%) Net Profit Margin (%)
Cordlife has managed its cost relatively well, showing healthy EBITDA and net profit margins as compared to its listed peers.
(30)
(20)
(10)
-
10
20
30
40
50
2009 2010 2011
(25)
(10)
5
20
35
2009 2010 2011
Source: S&P Capital IQ
Note: For the charts above, all the companies are based on their latest FY11 results except China Cord Blood Corporation which is based on the recently released FY12 results (year-end March).
P/B vs. ROE comparisons shows that Cordlife is priced relatively attractively based on its 9MFY12 annualised results. It is trading at a reasonable P/B of 1.6x supported by an above average ROE.
P/B (x) vs. ROE (%)
2.4x, 10.1Stemlife
2.1x, 2.0Bionet
1.6x, 10.6Cordlife
1.0x, 12.2China Cord
Blood
0.7x, 4.9Cryo-Save
0.0
2.0
4.0
6.0
8.0
10.0
12.0
14.0
0.0x 0.5x 1.0x 1.5x 2.0x 2.5x
P/B
ROE
Source: S&P Capital IQ
Note: Given that Cordlife’s share base has increased following its recent listing, for peer comparison, we have used Cordlife’s annualised 9MFY12 results to compute P/B and ROE ratios based on the post-listing share capital and shareholders’ equity.

14
Standard & Poor’s
June 29, 2012 Cordlife Group Ltd
Company Background
Cordlife is primarily involved in cord blood banking which comprises collection at
birth, processing, testing, cryopreservation and storage of umbilical cord blood
units. It also provides umbilical cord tissue banking (currently only in Hong
Kong). The group is one of the first private cord blood banks in Asia. Currently,
the group provides cord blood banking services in Singapore and Hong Kong but
has also catered to clients from Indonesia, Macau and Philippines via cooperation
agreements. In addition it has a marketing collaboration agreement with China
Cord Blood to gain access to mainland PRC expectant mothers planning to deliver
in Hong Kong. It also owns an indirect 10% stake in Guangzhou Tianhe Nuoya
which has the sole license to operate cord blood banking in Guangdong, PRC.
Cordlife was incorporated in Singapore on May 2, 2001 and received license from
Ministry of Health to operate in June 2002. The group entered Hong Kong and the
PRC markets through Cordlife Hong Kong in March 2005. Cordlife was demerged
from its holding company, CBB on Jun. 30, 2011. Subsequently it listed on the
Singapore Exchange on Mar. 29, 2012.
Currently, Cordlife has stored in excess of 35,000 cord blood units in its
processing facilities located in Singapore and Hong Kong. The group is the larger
of only two private cord blood banks in Singapore and is amongst the three
market leaders for private cord banks in Hong Kong. It is estimated to have a 62%
and 28% market share in private cord blood banking market in 2010 in Singapore
and Hong Kong respectively.
Over the years, Cordlife has received a number of awards and accreditations such
as: (i) American Association of Blood Banks (AABB) accreditation for its
Singapore and Hong Kong facilities since September 2005 and October 2011
respectively; (ii) ISO9001 certification for its Hong Kong facility since August
2007; and (iii) Top Pregnant/Baby Products Award 2011 by Pregnancy Magazine.
Cordlife’s management is led by its chief executive officer & executive director,
Mr Yee Pinh Jeremy, who has been instrumental in the development and
management of the group over the past ten years. The other executive officers in
the group are Ms Gwendolene Yeo (general manager of Singapore operations),
Ms Emily Cheung (general manager of Cordlife Hong Kong) and Ms Thet Hnin Yi
(financial controller). Ms Yeo and Ms Cheung have been with the group for more
than seven years.

15
Standard & Poor’s
June 29, 2012 Cordlife Group Ltd
Shareholding Structure
Public
62%
Substantial
Shareholders
38%
Source: S&P Capital IQ
Significant Shareholders
Common Shares
Equivalent Held
% of Common Shares
Outstanding
Market Value (SGD mln)
China Stem Cells (East) Company Limited 24,366,666 10.47 12.55 City Challenge Global Limited 21,800,000 9.37 11.23 Coop International Pte. Ltd. 20,450,000 8.79 10.53
Source: Company data, S&P Capital IQ
Corporate Governance and Board of Directors
The board comprises six members, of which three are independent directors.
There is a separation of the non-executive chairman and CEO roles. Independent
directors chair key committees: audit, nominating and remuneration, and form a
majority in the audit committee (three out of three), nominating committee (two
out of three) and remuneration committee (two out of three).
Board of Directors
Name Title Date Joined
Dr Ho Choon Hou Chairman and non-executive director June 2011 Mr Yee Pinh Jeremy Executive director and chief executive officer June 2011 Ms Jin Lu Non-executive director July 2011 Mr Ho Sheng Lead independent director July 2011 Dr Goh Jin Hian Independent director July 2011 Mr Ng Tiak Soon Independent director November 2011
Source: Company data, S&P Capital IQ
16
Standard & Poor’s
June 29, 2012 Cordlife Group Ltd
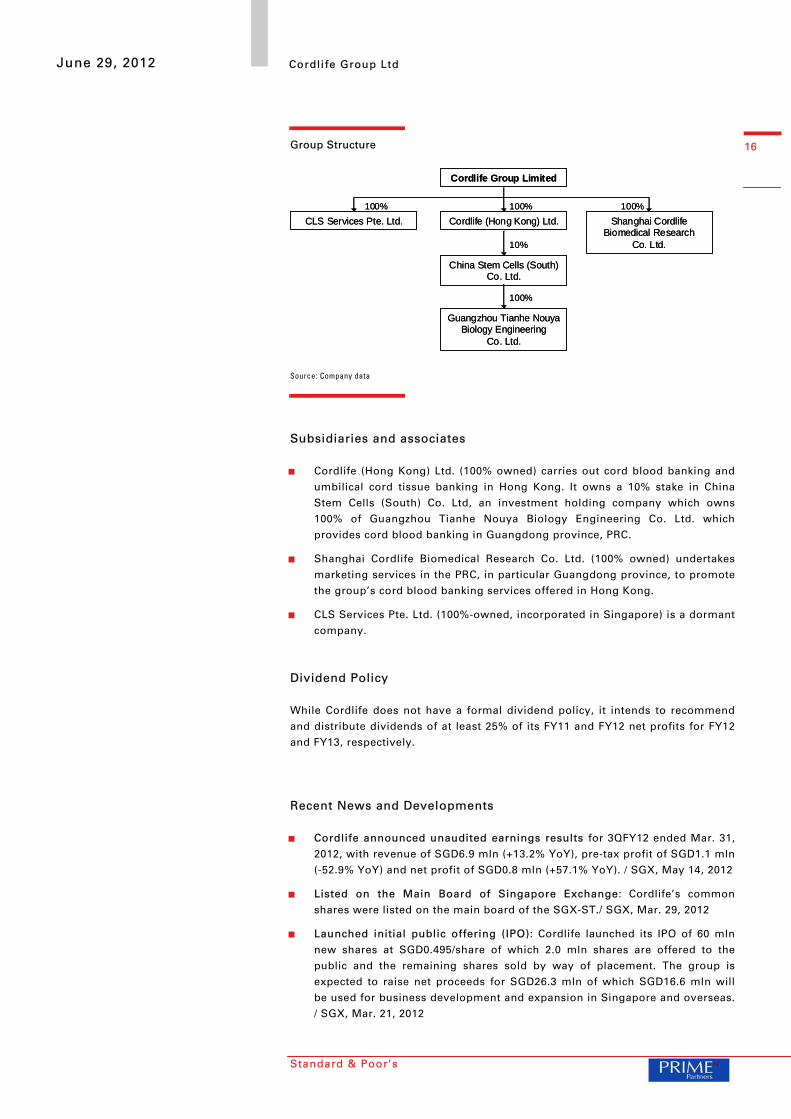
Group Structure
Source: Company data
Subsidiaries and associates
Cordlife (Hong Kong) Ltd. (100% owned) carries out cord blood banking and
umbilical cord tissue banking in Hong Kong. It owns a 10% stake in China
Stem Cells (South) Co. Ltd, an investment holding company which owns
100% of Guangzhou Tianhe Nouya Biology Engineering Co. Ltd. which
provides cord blood banking in Guangdong province, PRC.
Shanghai Cordlife Biomedical Research Co. Ltd. (100% owned) undertakes
marketing services in the PRC, in particular Guangdong province, to promote
the group’s cord blood banking services offered in Hong Kong.
CLS Services Pte. Ltd. (100%-owned, incorporated in Singapore) is a dormant
company.
Dividend Policy
While Cordlife does not have a formal dividend policy, it intends to recommend
and distribute dividends of at least 25% of its FY11 and FY12 net profits for FY12
and FY13, respectively.
Recent News and Developments
Cordlife announced unaudited earnings results for 3QFY12 ended Mar. 31,
2012, with revenue of SGD6.9 mln (+13.2% YoY), pre-tax profit of SGD1.1 mln
(-52.9% YoY) and net profit of SGD0.8 mln (+57.1% YoY). / SGX, May 14, 2012
Listed on the Main Board of Singapore Exchange: Cordlife’s common
shares were listed on the main board of the SGX-ST./ SGX, Mar. 29, 2012
Launched initial public offering (IPO): Cordlife launched its IPO of 60 mln
new shares at SGD0.495/share of which 2.0 mln shares are offered to the
public and the remaining shares sold by way of placement. The group is
expected to raise net proceeds for SGD26.3 mln of which SGD16.6 mln will
be used for business development and expansion in Singapore and overseas.
/ SGX, Mar. 21, 2012
Cordlife Group Limited
CLS Services Pte. Ltd. Cordlife (Hong Kong) Ltd. Shanghai CordlifeBiomedical Research
Co. Ltd.
China Stem Cells (South) Co. Ltd.
Guangzhou Tianhe NouyaBiology Engineering
Co. Ltd.
100% 100% 100%
100%
10%
Cordlife Group Limited
CLS Services Pte. Ltd. Cordlife (Hong Kong) Ltd. Shanghai CordlifeBiomedical Research
Co. Ltd.
China Stem Cells (South) Co. Ltd.
Guangzhou Tianhe NouyaBiology Engineering
Co. Ltd.
100% 100% 100%
100%
10%

17
Standard & Poor’s
June 29, 2012 Cordlife Group Ltd
Glossary
S&P STARS - Since January 1, 1987, S&P Capital IQ Equity Research has ranked a
universe of U.S. common stocks, ADRs (American Depositary Receipts), and ADSs
(American Depositary Shares) based on a given equity’s potential for future
performance. Similarly, S&P Capital IQ Equity Research has used STARS®
methodology to rank Asian and European equities since June 30, 2002. Under
proprietary STARS (STock Appreciation Ranking System), S&P equity analysts rank
equities according to their individual forecast of an equity’s future total return
potential versus the expected total return of a relevant benchmark (e.g., a regional
index (S&P Asia 50 Index, S&P Europe 350® Index or S&P 500® Index)), based on a
12-month time horizon. STARS was designed to meet the needs of investors looking
to put their investment decisions in perspective. Data used to assist in determining
the STARS ranking may be the result of the analyst’s own models as well as internal
proprietary models resulting from dynamic data inputs.
S&P Quality Rankings (also known as S&P Earnings & Dividend Rankings)-
Growth and stability of earnings and dividends are deemed key elements in
establishing S&P’s earnings and dividend rankings for common stocks, which are
designed to capsulize the nature of this record in a single symbol. It should be noted,
however, that the process also takes into consideration certain adjustments and
modifications deemed desirable in establishing such rankings. The final score for
each stock is measured against a scoring matrix determined by analysis of the scores
of a large and representative sample of stocks. The range of scores in the array of
this sample has been aligned with the following ladder of rankings:
A+ Highest B+ Average C Lowest
A High B Below Average D In Reorganization
A- Above Average B- Lower NR Not Ranked
S&P Issuer Credit Rating - A Standard & Poor’s Issuer Credit Rating is a current
opinion of an obligor’s overall financial capacity (its creditworthiness) to pay its
financial obligations. This opinion focuses on the obligor’s capacity and willingness
to meet its financial commitments as they come due. It does not apply to any specific
financial obligation, as it does not take into account the nature of and provisions of
the obligation, its standing in bankruptcy or liquidation, statutory preferences, or the
legality and enforceability of the obligation. In addition, it does not take into account
the creditworthiness of the guarantors, insurers, or other forms of credit
enhancement on the obligation.
S&P Capital IQ EPS Estimates – S&P Capital IQ earnings per share (EPS) estimates
reflect analyst projections of future EPS from continuing operations, and generally
exclude various items that are viewed as special, non-recurring, or extraordinary.
Also, S&P Capital IQ EPS estimates reflect either forecasts of S&P Capital IQ equity
analysts; or, the consensus (average) EPS estimate, which are independently
compiled by Capital IQ, a data provider to S&P Capital IQ Equity Research. Among
the items typically excluded from EPS estimates are asset sale gains; impairment,
restructuring or merger-related charges; legal and insurance settlements; in process
research and development expenses; gains or losses on the extinguishment of debt;
the cumulative effect of accounting changes; and earnings related to operations that
have been classified by the company as discontinued. The inclusion of some items,
such as stock option expense and recurring types of other charges, may vary, and
depend on such factors as industry practice, analyst judgment, and the extent to
which some types of data is disclosed by companies.
S&P Core Earnings – S&P Capital IQ Core Earnings is a uniform methodology for
adjusting operating earnings by focusing on a company's after-tax earnings
generated from its principal businesses. Included in the S&P Capital IQ definition are
employee stock option grant expenses, pension costs, restructuring charges from
ongoing operations, write-downs of depreciable or amortizable operating assets,
purchased research and development, M&A related expenses and unrealized
gains/losses from hedging activities. Excluded from the definition are pension gains,
impairment of goodwill charges, gains or losses from asset sales, reversal of prior-
year charges and provision from litigation or insurance settlements.
S&P 12 Month Target Price – The S&P Capital IQ equity analyst’s projection of the
market price a given security will command 12 months hence, based on a
combination of intrinsic, relative, and private market valuation metrics, including
S&P Fair Value.
S&P Capital IQ Equity Research – S&P Capital IQ Equity Research U.S. includes
Standard & Poor’s Investment Advisory Services LLC; Standard & Poor’s Equity
Research Services Europe includes McGraw-Hill Financial Research Europe Limited
trading as Standard & Poor’s; Standard & Poor’s Equity Research Services Asia
includes McGraw-Hill Financial Singapore Pte. Limited’s offices in Singapore,
Standard & Poor’s Investment Advisory Services (HK) Limited in Hong Kong,
Standard & Poor’s Malaysia Sdn Bhd, and Standard & Poor’s Information Services
(Australia) Pty Ltd.
Abbreviations Used in S&P Capital IQ Equity Research Reports
CAGR- Compound Annual Growth Rate
CAPEX- Capital Expenditures
CY- Calendar Year
DCF- Discounted Cash Flow
EBIT- Earnings Before Interest and Taxes
EBITDA- Earnings Before Interest, Taxes, Depreciation and Amortization
EPS- Earnings Per Share
EV- Enterprise Value
FCF- Free Cash Flow
FFO- Funds From Operations
FY- Fiscal Year
P/E- Price/Earnings
PEG Ratio- P/E-to-Growth Ratio
PV- Present Value
R&D- Research & Development
ROE- Return on Equity
ROI- Return on Investment
ROIC- Return on Invested Capital
ROA- Return on Assets
SG&A- Selling, General & Administrative Expenses
WACC- Weighted Average Cost of Capital
Dividends on American Depository Receipts (ADRs) and American Depository
Shares (ADSs) are net of taxes (paid in the country of origin).
Disclosures/Disclaimers
Required Disclosures In contrast to the qualitative STARS recommendations covered in this report, which
are determined and assigned by S&P Capital IQ equity analysts, S&P’s quantitative
evaluations are derived from S&P’s proprietary Fair Value quantitative model. In
particular, the Fair Value Ranking methodology is a relative ranking methodology,
whereas the STARS methodology is not. Because the Fair Value model and the
STARS methodology reflect different criteria, assumptions and analytical methods,
quantitative evaluations may at times differ from (or even contradict) an equity
analyst’s STARS recommendations. As a quantitative model, Fair Value relies on
history and consensus estimates and does not introduce an element of subjectivity
as can be the case with equity analysts in assigning STARS recommendations.
S&P Global STARS Distribution In North America
As of March 31, 2012, research analysts at S&P Capital IQ Equity Research North
America recommended 34.5% of issuers with buy recommendations, 57.9% with
hold recommendations and 7.6% with sell recommendations.
In Europe
As of March 31, 2012, research analysts at S&P Capital IQ Equity Research Europe
recommended 30.1% of issuers with buy recommendations, 49.4% with hold
recommendations and 20.5% with sell recommendations.

18
Standard & Poor’s
June 29, 2012 Cordlife Group Ltd
In Asia
As of March 31, 2012, research analysts at S&P Capital IQ Equity Research Asia
recommended 35.9% of issuers with buy recommendations, 54.3% with hold
recommendations and 9.8% with sell recommendations.
Globally
As of March 31, 2012, research analysts at S&P Capital IQ Equity Research globally
recommended 34.0% of issuers with buy recommendations, 56.3% with hold
recommendations and 9.7% with sell recommendations.
Additional information is available upon request.
Other Disclosures This report has been prepared and issued by S&P Capital IQ and/or one of its
affiliates. In the United States, research reports are prepared by Standard & Poor’s
Investment Advisory Services LLC (“SPIAS”). In the United States, research reports
are issued by Standard & Poor’s (“S&P”); in the United Kingdom by McGraw-Hill
Financial Research Europe Limited, which is authorized and regulated by the
Financial Services Authority and trades as Standard & Poor’s; in Hong Kong by
Standard & Poor’s Investment Advisory Services (HK) Limited, which is regulated by
the Hong Kong Securities Futures Commission; in Singapore by McGraw-Hill
Financial Singapore Pte. Limited (MHFSPL), which is regulated by the Monetary
Authority of Singapore; in Malaysia by Standard & Poor’s Malaysia Sdn Bhd
(“S&PM”), which is regulated by the Securities Commission; in Australia by Standard
& Poor’s Information Services (Australia) Pty Ltd (“SPIS”), which is regulated by the
Australian Securities & Investments Commission; and in Korea by SPIAS, which is
also registered in Korea as a cross-border investment advisory company.
The research and analytical services performed by SPIAS, McGraw-Hill Financial
Research Europe Limited, MHFSPL, S&PM, and SPIS are each conducted separately
from any other analytical activity of S&P Capital IQ.
S&P Capital IQ or an affiliate may license certain intellectual property or provide
pricing or other services to, or otherwise have a financial interest in, certain issuers
of securities, including exchange-traded investments whose investment objective is
to substantially replicate the returns of a proprietary Standard & Poor's index, such
as the S&P 500. In cases where S&P Capital IQ or an affiliate is paid fees that are tied
to the amount of assets that are invested in the fund or the volume of trading activity
in the fund, investment in the fund will generally result in S&P Capital IQ or an
affiliate earning compensation in addition to the subscription fees or other
compensation for services rendered by S&P Capital IQ. A reference to a particular
investment or security by S&P Capital IQ and/or one of its affiliates is not a
recommendation to buy, sell, or hold such investment or security, nor is it
considered to be investment advice.
Indexes are unmanaged, statistical composites and their returns do not include
payment of any sales charges or fees an investor would pay to purchase the
securities they represent. Such costs would lower performance. It is not possible to
invest directly in an index.
S&P Capital IQ and its affiliates provide a wide range of services to, or relating to,
many organizations, including issuers of securities, investment advisers, broker-
dealers, investment banks, other financial institutions and financial intermediaries,
and accordingly may receive fees or other economic benefits from those
organizations, including organizations whose securities or services they may
recommend, rate, include in model portfolios, evaluate or otherwise address.
For details on the S&P Capital IQ research objectivity and conflict-of-interest policies,
please visit:
http://www.standardandpoors.com/products-services/equity-research-main/en/us/
For a list of companies mentioned in this report with whom S&P Capital IQ and/or
one of its affiliates has had business relationships within the past year, please go to:
http://www.standardandpoors.com/products-
services/articles/en/us/?assetID=1245187982940
Standard & Poor's and its affiliates provide a wide range of services to, or relating to,
many organizations, including issuers of securities, investment advisers, broker-
dealers, investment banks, other financial institutions and financial intermediaries,
and accordingly may receive fees or other economic benefits from those
organizations, including organizations whose securities or services they may
recommend, rate, include in model portfolios, evaluate or otherwise address.
S&P has received compensation from one or more institutions, each in the range of
SGD 16,000 to SGD 25,000, for the right to distribute and co-brand S&P’s research
on this company.
Disclaimers With respect to reports issued to clients in a language other than English and in the
case of inconsistencies between the English and translated versions of a report, the
English version prevails. Neither S&P Capital IQ nor its affiliates guarantee the
accuracy of the translation. Assumptions, opinions and estimates constitute our
judgment as of the date of this material and are subject to change without notice.
Past performance is not necessarily indicative of future results.
S&P Capital IQ, its affiliates, and any third-party providers, as well as their
directors, officers, shareholders, employees or agents (collectively S&P Parties) do
not guarantee the accuracy, completeness or adequacy of this material, and S&P
Parties shall have no liability for any errors, omissions, or interruptions therein,
regardless of the cause, or for the results obtained from the use of the information
provided by the S&P Parties. S&P PARTIES DISCLAIM ANY AND ALL EXPRESS OR
IMPLIED WARRANTIES, INCLUDING, BUT NOT LIMITED TO, ANY WARRANTIES OF
MERCHANTABILITY, SUITABILITY OR FITNESS FOR A PARTICULAR PURPOSE OR
USE. In no event shall S&P Parties be liable to any party for any direct, indirect,
incidental, exemplary, compensatory, punitive, special or consequential damages,
costs, expenses, legal fees, or losses (including, without limitation, lost income or
lost profits and opportunity costs) in connection with any use of the information
contained in this document even if advised of the possibility of such damages.
Capital IQ is a business of S&P Capital IQ.
Ratings from Standard & Poor’s Ratings Services are statements of opinion as of
the date they are expressed and not statements of fact or recommendations to
purchase, hold, or sell any securities or to make any investment decisions.
Standard & Poor’s assumes no obligation to update its opinions following
publication in any form or format. Standard & Poor’s ratings should not be relied
on and are not substitutes for the skill, judgment and experience of the user, its
management, employees, advisors and/or clients when making investment and
other business decisions. Standard & Poor’s rating opinions do not address the
suitability of any security. Standard & Poor’s does not act as a fiduciary. While
Standard & Poor’s has obtained information from sources it believes to be reliable,
Standard & Poor’s does not perform an audit and undertakes no duty of due
diligence or independent verification of any information it receives.
S&P Capital IQ keeps certain activities of its business units separate from each
other in order to preserve the independence and objectivity of their respective
activities. As a result, certain business units of S&P Capital IQ may have
information that is not available to other S&P Capital IQ business units. S&P Capital
IQ has established policies and procedures to maintain the confidentiality of certain
non-public information received in connection with each analytical process.
Standard & Poor’s Ratings Services did not participate in the development of this
report. Standard & Poor’s may receive compensation for its ratings and certain
credit-related analyses, normally from issuers or underwriters of securities or from
obligors. Standard & Poor’s reserves the right to disseminate its opinions and
analyses. Standard & Poor’s public ratings and analyses are made available on its
Web sites, www.standardandpoors.com (free of charge), and
www.ratingsdirect.com and www.globalcreditportal.com (subscription), and may
be distributed through other means, including via Standard & Poor’s publications
and third-party redistributors. Additional information about our ratings fees is
available at www.standardandpoors.com/usratingsfees .
This material is not intended as an offer or solicitation for the purchase or sale of
any security or other financial instrument. Securities, financial instruments or
strategies mentioned herein may not be suitable for all investors. Any opinions
expressed herein are given in good faith, are subject to change without notice, and
are only current as of the stated date of their issue. Prices, values, or income from
any securities or investments mentioned in this report may fall against the interests

19
Standard & Poor’s
June 29, 2012 Cordlife Group Ltd
of the investor and the investor may get back less than the amount invested. Where
an investment is described as being likely to yield income, please note that the
amount of income that the investor will receive from such an investment may
fluctuate. Where an investment or security is denominated in a different currency to
the investor’s currency of reference, changes in rates of exchange may have an
adverse effect on the value, price or income of or from that investment to the
investor. The information contained in this report does not constitute advice on the
tax consequences of making any particular investment decision. This material is not
intended for any specific investor and does not take into account your particular
investment objectives, financial situations or needs and is not intended as a
recommendation of particular securities, financial instruments or strategies to you.
Before acting on any recommendation in this material, you should consider whether
it is suitable for your particular circumstances and, if necessary, seek professional
advice.
This document does not constitute an offer of services in jurisdictions where S&P
Capital IQ or its affiliates do not have the necessary licenses.
For residents of the U.K. - This report is only directed at and should only be relied on
by persons outside of the United Kingdom or persons who are inside the United
Kingdom and who have professional experience in matters relating to investments or
who are high net worth persons, as defined in Article 19(5) or Article 49(2) (a) to (d) of
the Financial Services and Markets Act 2000 (Financial Promotion) Order 2005,
respectively.
For residents of Singapore - Anything herein that may be construed as a
recommendation is intended for general circulation and does not take into account
the specific investment objectives, financial situation or particular needs of any
particular person. Advice should be sought from a financial adviser regarding the
suitability of an investment, taking into account the specific investment objectives,
financial situation or particular needs of any person in receipt of the
recommendation, before the person makes a commitment to purchase the
investment product.
For residents of Malaysia - All queries in relation to this report should be referred to
Ching Wah Tam and Ahmad Halim.
For residents of Indonesia - This research report does not constitute an offering
document and it should not be construed as an offer of securities in Indonesia, and
that any such securities will only be offered or sold through a financial institution.
For residents of the Philippines - The securities being offered or sold have not been
registered with the Securities and Exchange Commission under the Securities
Regulation Code of the Philippines. Any future offer or sale thereof is subject to
registration requirements under the Code unless such offer or sale qualifies as an
exempt transaction.
Canadian investors should be aware that any specific securities discussed in this
research report can only be purchased in Canada through a Canadian registered
dealer and, if such securities are not available in the secondary market, they can only
be purchased by eligible private placement purchasers on a basis that is exempt
from the prospectus requirements of Canadian securities law and will be subject to
resale restrictions.
For residents of Australia – This report is distributed by Standard & Poor’s
Information Services (Australia) Pty Ltd (“SPIS”) in Australia.
Any express or implied opinion contained in this report is limited to "General Advice"
and based solely on consideration of the investment merits of the financial product(s)
alone. The information in this report has not been prepared for use by retail investors
and has been prepared without taking account of any particular person's financial or
investment objectives, financial situation or needs. Before acting on any advice, any
person using the advice should consider its appropriateness having regard to their
own or their clients' objectives, financial situation and needs. You should obtain a
Product Disclosure Statement relating to the product and consider the statement
before making any decision or recommendation about whether to acquire the
product. Each opinion must be weighed solely as one factor in any investment
decision made by or on behalf of any adviser and any such adviser must accordingly
make their own assessment taking into account an individual's particular
circumstances.
SPIS holds an Australian Financial Services Licence Number 258896. Please refer to
the SPIS Financial Services Guide for more information at
www.fundsinsights.com.au.
STANDARD & POOR’S, S&P, S&P 500, S&P Europe 350 and STARS
are registered trademarks of Standard & Poor’s Financial Services
LLC.
PrimePartners Disclaimer
Without prejudice to and without limiting the generality of the foregoing
disclosures and disclaimers:
PrimePartners Corporate Finance Pte Ltd (“PPCF”) is licensed for the provision of
corporate finance advisory services and dealing in securities in Singapore and has
been appointed as the sponsor of this company.
In connection with the foregoing, PPCF has the right to distribute and co-brand
S&P’s research on this company, and PPCF has been named and included in this
report solely on such basis.
No publication, dissemination, provision, delivery or circulation of this report (or
any information or material herein) by PCPF and/or any of its affiliates, employees,
directors, shareholders, officers, agents or representatives (collectively the “PPCF
Entities”) shall in any way be deemed or construed as the provision of any advice
and/or recommendation on this company and/or any of its securities or as the issue
or promulgation of any research analyses or research reports on this company
and/or any of its securities by the PPCF Entities, and the PPCF Entities expressly
disclaims any responsibility or liability for the same.
The PPCF Entities do not warrant or represent or guarantee the accuracy,
completeness or adequacy of this report (or any information or material herein),
and the PPCF Entities shall have no liability for any errors, omissions or
interruptions therein, regardless of the cause, or for the results obtained from the
use of this report (or any information or material herein). PPCF Entities disclaims
all express or implied warranties, including but not limited to, any warranties of
merchantability, suitability or fitness for a particular purpose or use. In no event
shall PPCF Entities be liable to any party for any direct or indirect, incidental,
exemplary, compensatory, punitive, special or consequential damages, costs and
expenses, legal fees, or losses (including without limitation, lost income or lost
profits and opportunity costs) in connection with any use or reliance on this report
(or any information or material herein) even if advised of the possibility of such
damages.
Where this report is in relation to a company that is to be listed:
(i) No publication or dissemination of this report to any person shall be made
during the period commencing on the Blackout Commencement Date (as defined
below) and concluding on a date on which its shares are listed on the relevant stock
exchange in Singapore, and/or any other applicable blackout period(s) specified in
the relevant laws and regulations (including orders, notifications, notices,
guidelines, codes and practice notes of the Monetary Authority of Singapore).
“Blackout Commencement Date” means the date falling no later than fourteen (14)
days prior to the date a prospectus or offer document in respect of the initial public
offering of shares of the issuer is to be lodged with the relevant authority in
Singapore under the SFA.
No publication or dissemination of this report shall be made to any person unless
such person falls within the definition of institutional investors under the Securities
and Futures Act of Singapore (Chapter 289) (“SFA”) for purposes of investing in the
issuer and has requested for this report.
No publication or dissemination of this report (or any information or material
herein) in any country or countries outside Singapore shall be made unless the
publication and dissemination of this report (or any information or material herein)
does not infringe upon any law, code or other requirement of that country or
countries.

20
Standard & Poor’s
June 29, 2012 Cordlife Group Ltd
No reproduction, publication or dissemination of this report (or any information or
material herein) shall be made by any person to whom this report is provided or any
person who otherwise comes into receipt or possession of such report.
This report (and the information and material herein) is not intended as an offer or
solicitation for the purchase or sale of any security or other financial instrument.
Securities, financial instruments or strategies mentioned herein may not be suitable
for all investors. Any opinions expressed herein are given in good faith, are subject
to change without notice, and are only current s of the stated date of their issue.
Prices, values, or income from any securities or investments mentioned in this report
may fall against the interests of the investor and the investor may get back less than
the amount invested. Where an investment is described as being likely to yield
income, please note that the amount of income that the investor will receive from
such an investment may fluctuate. Where an investment or security is denominated
in a different currency to the investor’s currency of reference, changes in rates of
exchange may have an adverse effect on the value, price or income of or from that
investment to the investor. The information contained in this report does not
constitute advice on tax consequences of making any particular investment decision.
This report (and the information and material herein) is not intended for any specific
investor and does not take into account your particular investment objectives,
financial situations or needs and is not intended as recommendation or particular
securities, financial instruments or strategies to you. Before acting on any
recommendation in this material, you should consider whether it is suitable for your
particular circumstances and, if necessary, seek professional advice.
This document does not constitute an offer of services in jurisdictions where PPCF or
its affiliates do not have the necessary licences.
For residents of Singapore- Anything herein that may be construed as a
recommendation is intended for general circulation and does not take into account
the specific investment objectives, financial situation or particular needs of particular
needs of any particular person. Advice should be sought from a financial adviser
regarding the suitability of an investment, taking into account the specific investment
objectives, financial situation or particular needs of any person in receipt of the
recommendation, before the person makes a commitment to purchase the
investment product.