2011 ny investor conference v8 - commercebank.com
TRANSCRIPT
INVESTOR OVERVIEWFebruary 2011February 2011
Charles KimExecutive Vice President and Chief Financial Officer
Jeffery AberdeenController
Nicole RoseManager Mergers and Acquisitions

CAUTIONARY STATEMENT
A b f t t t ill b ki i t ti dA number of statements we will be making in our presentation andin the accompanying slides are “forward-looking statements”within the meaning of the Private Securities Litigation Reform Actof 1995, such as statements of the Corporation’s plans, goals,
bj i i j i i d i iobjectives, expectations, projections, estimates and intentions.These forward-looking statements involve significant risks anduncertainties and are subject to change based on various factors(some of which are beyond the Corporation’s control). Factorsthat could cause the Corporation’s actual results to differmaterially from such forward-looking statements made herein orby management of the Corporation are set forth in theCorporation’s Third Quarter Report on Form 10-Q and theCorporation’s Current Reports on Form 8-K.
1

S C it B k 145 i th i d t $18 billi i t
ABOUT COMMERCE BANCSHARES
Lower Midwest Footprint – over 370 banking locations and 4,979 employees• 71% of 2010 pre-tax profits from five key markets
Super-Community Bank – over 145 years in the industry – $18 billion in assets
p p y• Denver and Tulsa markets added in 2007• Lending presence in Nashville and Cincinnati • Commercial Payment Services offered in 48 states
Major Markets- Kansas City- St. Louis- Wichita
S i fi ld
Performance – CAGR
20102010 1010
St. Louis & Kansas CityDeposit Market Share**
2010
- Springfield- Peoria/Bloomington
20102010 10yr10yr
EPS*EPS* 28%28% 4%4%
Cash Div*Cash Div* 3%3% 9%9%
Stock PriceStock Price 8%8% 4%4%
2010US Bancorp 12% BoA 11% Commerce 8% UMB 5%
Total ReturnTotal Return 10%10% 6%6%UMB 5%Others 64%
*Per share figures have been restated for 5% stock dividend distributed on 12/20/10**Source: FDIC 2010 Deposit Data 2

ABOUT OUR MARKETS
KKansas City St. Louis Denver Tulsa Outstate1
2010 Population (000’s) 2,031 2,835 2,582 930 1,759
5-Year Projected Growth 4.0% 1.7% 7.2% 3.5% 3.9%
CBI M kCBI Market Penetration2 23.8% 19.3% 0.4% 0.5% 15.5%
Median Household $57 $54 $62 $47 N/AIncome (000’s)$57 $54 $62 $47 N/A
Unemployment rate3 9.1% 9.5% 8.7% 7.5% 8.2%
2009 FDIC CBI Deposits (000’s)
$4,508 $4,308 $80 $109 $2,501
Deposit Share 11.7% 6.9% 2.8% 0.7% 6.6%1.Outstate includes Wichita, Springfield, Columbia, Peoria and Bloomington2. 2010 households in county with CBI branch3. U.S. Bureau of Labor Statistics as of November 2010Source: Nielsen and U.S. Bureau of Labor Statistics 3

SUPER-COMMUNITY BANK PLATFORM
Super-Regional Back End
A More Nimble Format … With Higher Service Focus
Community Bank Front End Super-Regional Back End • Sophisticated payment processing systems• Broad consumer product offerings• Private banking; trust; capital markets
Community Bank Front End• Flat organization – quick decisions• Employees embrace strong culture• Award winning customer service
K l d f t d k t • Competitive on unit costs• Knowledge of customers and markets reduces risk
A Strategy that Builds Results for Tomorrow• Sales across business lines
Focus on people/talent development• Focus on people/talent development• Investment in technology• Top quartile credit quality metrics• Disciplined approach to acquisitionsp pp q
4
SUPERIOR EMPLOYEE ENGAGEMENT
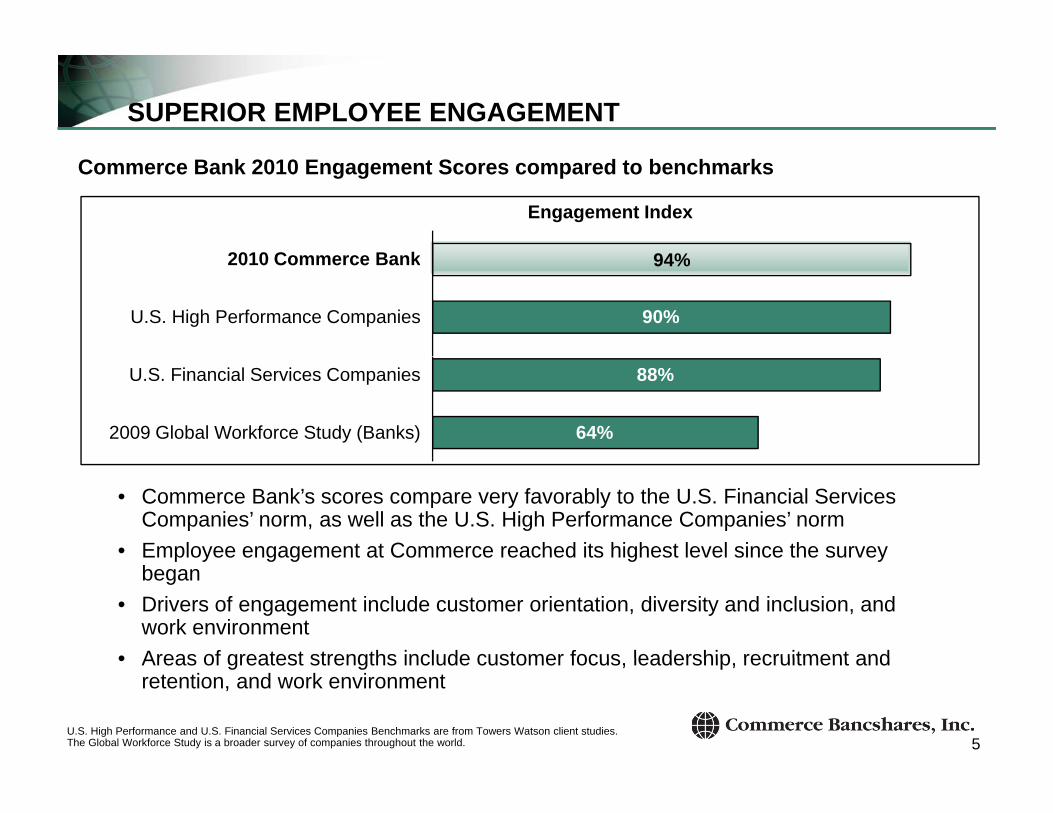
94%2010 Commerce Bank
Engagement Index
Commerce Bank 2010 Engagement Scores compared to benchmarks
94%
U.S. High Performance Companies 90%
2010 Commerce Bank
2009 Global Workforce Study (Banks) 64%
U.S. Financial Services Companies 88%
• Commerce Bank’s scores compare very favorably to the U.S. Financial Services Companies’ norm, as well as the U.S. High Performance Companies’ norm
• Employee engagement at Commerce reached its highest level since the survey p y g g g ybegan
• Drivers of engagement include customer orientation, diversity and inclusion, and work environment
• Areas of greatest strengths include customer focus leadership recruitment and
U.S. High Performance and U.S. Financial Services Companies Benchmarks are from Towers Watson client studies. The Global Workforce Study is a broader survey of companies throughout the world.
• Areas of greatest strengths include customer focus, leadership, recruitment and retention, and work environment
5

INDUSTRY RECOGNITION AND CUSTOMER SATISFACTION
Commerce Bank Ranked Highest Customer Satisfaction
America’s Best Banks by Forbes Magazine 2010 J.D. Power Retail Banking Results
Commerce ranked in the top ten on the list of America's Best Banks by Highest Customer Satisfaction
with Retail Banking in the Midwest Region Three Years in a Row*
the list of America s Best Banks by Forbes Magazine
Commerce Score = 809 Co e ce Sco e 809Midwest Bank Average = 746 Competitors of note: UMB = 765, Nat City/PNC = 761, US Bank = 748, BOA = 723, Regions = 717
Recognized as one of the best regional banks in America for overall
2010 Greenwich Excellence Award
regional banks in America for overall customer satisfaction.
*Commerce Bank received the highest numerical score among retail banks in the Midwest region in the proprietary J.D. Power and Associates 2008-2010 Retail Banking Satisfaction StudiesSM, tied in 2009. 2010 study based on a total of 47,673 total responses measuring 18 providers in the Midwest region(IA, IL, KS, MO, MN, WI) and measures opinions of consumers with their primary banking provider. Proprietary study results are based on experiences and perceptions of consumers surveyed in January 2010. Your experiences may vary. Visit jdpower.com. 6

DIVERSE REVENUE SOURCES
• Balanced mix of interest and non-interest income• Meaningful contribution from wealth management and card businesses
Commerce Bank Peer Banks*
14%
Commerce Bank
4%
7%
Peer Banks
10% 61%
7%
8% 68%
6%
9%1%
10%
3%1%
Card incomeWealth management
OtherService charges
Fees & commissionNet interest income
Note: Excludes Gains and Losses on SecuritiesSource: Financial Information Systems; Data as of 9/30/10
* Peer Banks include: ASBC, BOKF, Central Bancompany, CYN, CFR, FMER, MBFI, PVTB, TCB, UMBF, WTFC, ZION
7

IMPROVED EARNINGS RESULT FROM LOWER PROVISION AND GOOD EXPENSE CONTROL
($ in millions) 2008 2009 201009 vs. 10 % change
Net Interest Income $593 $636 $646 2%Non-Interest Income 376 396 405 2%
Total Revenue $968 $1,032 $1,051 2%Securities Gains/(Losses) 30 (7) (2) (75%)Non-Interest Expense (615) (621) (631) 2%Provision for Loan Losses (109) (161) (100) (38%)Pre-Tax Income 274 243 318 31%
Income Taxes (85) (74) (96) 30%
Net Income $189 $169 $222 31%
Dil t d EPS* $2 24 $1 97 $2 52 28%Diluted EPS* $2.24 $1.97 $2.52 28%
ROA 1.15% 0.96% 1.22%
ROE 11.8% 9.8% 11.2%
Efficiency Ratio 63.1% 59.9% 59.7%
*Restated for 5% stock dividend on 12/20/2010 8

GROWTH IN CARD AND COMMERCE TRUST COMPANY DRIVE TOP LINE GROWTH
($ in millions) 2008 2009 201009 vs. 10% change
Interest Income $850 $790 $729 (8%)( )Interest Expense $257 $154 $83 (46%)
Net Interest Income $593 $636 $646 2%
Contribution fromContribution from …Deposit fees 110 106 93 (12%)Cards 114 122 149 22%T t 80 77 81 5%Trust 80 77 81 5%
Bond Trading & Brokerage 28 33 30 (9%)
Other 44 58 52 (10%)
Non-Interest Income $376 $396 $405 2%
Total Revenue $969 $1,032 $1,051 2%
9

CONTINUED FOCUS ON EXPENSE MANAGEMENT
($ in millions) 2008 2009 201009 vs. 10% change
Salaries & Benefits $334 $346 $347 0%$ $ $ 0%
Occupancy 46 46 47 2%
Equipment 25 26 23 (9%)
Supplies & Communications 35 32 27 (16%)
Data Processing 56 62 68 10%
Other 93 85 93 8%Other 93 85 93 8%
Subtotal: Controllable Expense $589 $597 $604 1%
Deposit Insurance 2 27 19 (30%)
Non-recurring* 24 (2) 7
Total Non-Interest Expense $615 $622 $631 1%
* Excludes partial reversal of VISA litigation expenses in all three years and loss on auction rate securities of $33 million in 2008
10

INVESTMENT PORTFOLIO: HIGH QUALITY, DIVERSE, SHORT DURATION
ARCsAsset Backed
12/31/2009 PORTFOLIO
Unrealized Gain $72 million12/31/2010 PORTFOLIO
Agency2.8%
Treasury6.1%
2.3%33.4%
Unrealized Gain $72 millionInvestment Grade 96.9%
Duration2007 2 07 yrs
Total investments $7.4 billionUnrealized gain $130 million12 mo maturities $2.1 billionCorporate 2.4%
2007 2.07 yrs2008 2.39 yrs2009 2.09 yrs
DurationDec 2010 2.08 yrsDec 2009 2.09 yrsDec 2008 2.39 yrs
8.7%8 7%
Municipal13.2%
Agency MBS
31.0%
8.7%8.7%
Non-Agency MBS
Source: InTrader 11

SLIGHT INCREASE IN C&I LOANS WHILE UTILIZATION RATES REMAIN LOW
Loan Trends$ in thousands
Bal
ance
s
50.00%
60.00%
3,500,000
4,000,000
zatio
n R
ate
sine
ss L
oan
30.00%
40.00%
2,500,000
3,000,000
Util
iz
uart
erly
Bus
0 00%
10.00%
20.00%
1 500 000
2,000,000
,500,000
Qu 0.00%1,500,000
4Q103Q102Q101Q104Q093Q092Q091Q094Q083Q082Q081Q08
Business Loan BalancesUtilization Rate
12

EARNINGS PERFORMANCE SIGNIFICANTLY ABOVE PEERS AND LARGE BANKS
Return on Assets Return on Equity
Financial Returns
CBSH 2010
CBSH 2010 ROE
1.19%
0.96%
1.15%
1.00%1.10%1.20%
10.98%
9.76%
11.81%
10.00%11.00%12.00%
Return on Assets Return on Equity
8 57%
ROA1.22%
ROE11.15%
0 49%
0.69%
0.60%0.70%0.80%0.90%
6.75%6.95%
6.00%7.00%8.00%9.00%0.86% 8.57%
7.17%0.65%
0.49%0.42%
0.27%
0.20%0.30%0.40%0.50%
4.11%3.24%
2.00%3.00%4.00%5.00%
0.00%0.10%
Sept YTD 2010
200920080.00%1.00%
Sept YTD 2010
20092008
*Peer Banks include: ASBC, BOKF, CYN, CFR, FMER, MBFI, PVTB, TCB, UMBF, WTFC, ZION **Large banks include: JP Morgan, Citigroup, BoA, Wells Fargo, US Bancorp, Regions, Fifth Third, M&I, PNC, State StreetSource: SNL Financial
Large Banks**Peer Banks*Commerce Bank
13

STRONG AND QUALITY CAPITAL POSITION
14 3%16.0%
18.0%
13 8%14.3%
17.7%1.6%
Rat
io
3.0%
11.5%12.3%
13.2%14.3%
3 1%3.5%3.1%
3.8% 0.4%0.4%
10.0%
12.0%
14.0%
0.2%
13.8%
2.9%
12.8%
1.4%
0.8%12.1%0.9%
14.0%
1.1%
1.3%2.3%
10.0%0.9%
10.3%0.8%
13.4%1.1%
10.8%
djus
ted
Ass
ets
3.9%3.3%3.1%
4.0%
6.0%
8.0%
6.7%7.2%7.5%7.7%8.6%8.6%9.1%9.6%
12.2%12.2%
Cap
ital /
Ris
k A
d
0.0%
2.0%
6.7%
FITBHBANRFZIONKEYCMATCBFMER MIASBC CFRBOKFUMBFCBSH
Tier
1 C
Among bank holding companies over $10 billion, CBSH is Moody’s highest rated (B+) for financial strength*
Tier 1 CommonTARP PreferredTruPSOther
*Moody’s as of 12/13/2010; Tied with two other banksSource: SNL Financial; Data as of 9/30/2010
for financial strength
14
DIVERSIFIED LOAN PORTFOLIO
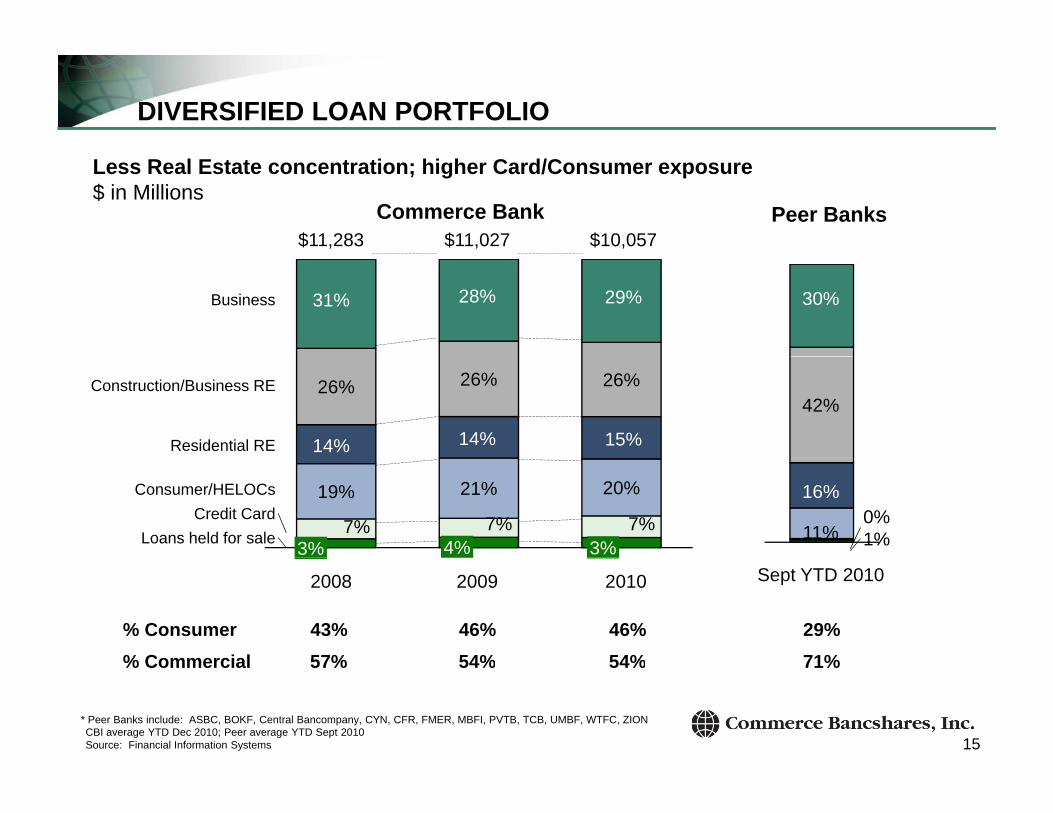
Commerce Bank Peer Banks$11,027 $10,057$11,283
Less Real Estate concentration; higher Card/Consumer exposure$ in Millions
30%Business 29%28%31%
42%26% 26% 26%
Residential RE
Construction/Business RE
15%14%14%
1%0%
11%
16%
7% 7% 7%
19% 21% 20%
Loans held for saleCredit Card
Consumer/HELOCs
4% 3%3%Sept YTD 20102009 20102008
% Consumer 43% 46% 46% 29%% Commercial 57% 54% 54% 71%% Commercial 57% 54% 54% 71%
CBI average YTD Dec 2010; Peer average YTD Sept 2010 Source: Financial Information Systems
* Peer Banks include: ASBC, BOKF, Central Bancompany, CYN, CFR, FMER, MBFI, PVTB, TCB, UMBF, WTFC, ZION
15

RESERVES REMAIN STRONG; WHILE NPAs CONTINUE DOWNWARD TREND
Reser e co erage among ind str 's best
1 2%1.4%
$200
$240
Reserve coverage among industry's best
0.6%0.8%1.0%1.2%
$120
$160
$200
s to
Loa
ns
Mill
ions
0.0%0.2%0.4%
$0
$40
$80
NPA
's
$ in
'05 '06 '07 '08 09 1Q10 2Q10 3Q10 4Q10
$ Allow for Loan Loss $ Non-Perform Assets
% NPA to Total Loans
• NPAs at 6/30/10 decreased by $19 million in 2010; now 1% of total loans• Reserve coverage of 203% of NPAs at 12/31/10• Reserve coverage of 203% of NPAs at 12/31/10
16

Largest 100CBINet Charge-Off Rates for CBI vs. Other Banks
CHARGE-OFFS CONSISTENTLY BETTER THAN INDUSTRY
3.00%
3.50%
Largest 100CBI
3.00%
3.50%
Business C&I Net C/OsNet Charge Off Rates for CBI vs. Other Banks
2.59%2.65% 2.51%
3.42%
2.78% 2.72% 2.80%
Commercial R/E Net C/Os
1.00%
1.50%
2.00%
2.50%
1.00%
1.50%
2.00%
2.50%1.97% 1.78% 1.65%
2.51%
0 44%0.74%
0 39%0.80%
1.58% 1.70%
0.00%
0.50%
Sep‐10Jun‐10Mar‐10Dec‐09Sep‐090.00%
0.50%
Sep‐10Jun‐10Mar‐10Dec‐09Sep‐09
Credit Card Net C/Os
0.11%0.44%
Consumer Net C/Os Credit Card Net C/Os
0.29%0.05%
0.39% 0.23%
3.00%
3.50%
4.00%
9 00%
10.00%
11.00%
12.00%
3.33%3.15%
2 63%
10.32%9.42%
10.16%10.98%
8.53%
Consumer Net C/Os Credit Card Net C/Os
1.50%
2.00%
2.50%
5.00%
6.00%
7.00%
8.00%
9.00%2.63%
2.18%6.55%
1.59%1.90%1.86%
2.24%
1.72%1.50%
6.85% 6.50% 6.94% 6.70%
17
1.00%
Sep‐10Jun‐10Mar‐10Dec‐09Sep‐094.00%
Sep‐10Jun‐10Mar‐10Dec‐09Sep‐09
Source: Federal Reserve

Description
OUR AREAS OF FOCUS REFLECT THE CHALLENGES AND OPPORTUNITIES THAT WE SEE IN THE MARKETPLACE
• Add high quality loans across lending categories, at appropriate spreads
Description
Build new customer
Grow quality loans
A i d i d i h l l i hirelationships Build relationship deposits
• Acquire and retain deposits that are truly relationship-based
Manage and develop • Invest in developing talent
Maintain our distinctive
Enhance operating productivity
• Continuously improve cost discipline• Emphasize sales force effectiveness
Manage and develop talent • Manage productivity
advantagesproductivity
Reinvigorate fee income
• Replace lost fee income from changes in regulation and customer behavior
• Align fees with value to customers
Invest in high return business
Expand payments systems business
• Continue emphasis on commercial card, merchant, and treasury businesses
• Develop and pilot new products
G • Capitalize on market disruption to acquire new customersbusiness Grow money management
Capitalize on market disruption to acquire new customers• Deepen relationships with existing CTC and bank
customers
18

RETAIL - 2011 PLAN HIGHLIGHTS
CORE RETAIL STRATEGIESCORE RETAIL STRATEGIESCORE RETAIL STRATEGIESCORE RETAIL STRATEGIES
Create new revenue streams from
Refine marketing strategy and
Drive for improved productivity
Accelerate Channel Innovation
Align spending with new revenue
Manage Critical Issues for Customer /streams from
product lines and/or services
strategy and customer experience to drive more business
productivity, empowerment and accountability of our frontline
Innovation new revenue paradigm
for Customer / Support / Service / Infrastructure
business of our frontline staff
2011 Key Initiatives2011 Key Initiatives
• Re-energize direct lending model• New products / “apps” to expand revenue streams (electronic stmt. histories)
I t d d b h l t l t t t l lt t l
2011 Key Initiatives2011 Key Initiatives
• Introduced new branch sales tools to generate greater cross sales results; new customer sales• Generate more revenue through online channel• Address branch costs – right number branch locations; refine branch operating costs• Proactively address regulatory issues (overdraft debit)Proactively address regulatory issues (overdraft, debit)
19

LEVERAGE ONLINE CHANNEL: OVER 60% OF RETAIL CUSTOMERS ACTIVELY USE ONLINE BANKING
We expect to drive revenue with various approaches:We expect to drive revenue with various approaches:
• Open and fund Deposit accounts
• Apply for loans
Open accounts • Apply for loans
• Apply for credit cards
Example:
Online check shopping• Shop for new and re-order existing
• Increases spend per order
Sell add-on services
p p25%
• Incremental $200k+ per year
• e-Statement and Reg E• Existing marketing
campaigns
Cross-sell with targeted marketing
• Create custom messages and offers
20

RETAIL - ALIGN SPENDING WITH CURRENT REVENUE MODEL
G l R d t hil
Core Retail2010 Expenses = $235 million
Goal: Reduce costs while maintaining sales/service/risk management expectations
F l j t d t$67 million
$64 million
• Formal projects underway to re-engineer operating models
• Examples:St ffi d l i l l–Staffing model – universal employee
–Self-service delivery options at branches
• Reduced 2010 expenses $18 million (6%)
$104 million
(6%)
Direct expenseProcessing costsAdminstrative costs
21

COMMERCIAL - OPPORTUNITIES FOR LOAN GROWTH
Working capital tili ation %• Working capital utilization %
• Industry opportunities Healthcare
25%
2007-2010 Loan Growth Trend
Agribusiness Beverage Distribution
• New markets16%
21%20%
25%
Denver Tulsa Cincinnati9%
16%
10%
15%
Nashville
• Refinancing CMBS transactions
• Asset purchases0%
5%
• Asset purchases
• Tax advantage loan programs
• Government programs
0%Beverage AgribusinessHealthcare
SBA/USDA/MO Link
YTD Average Balance 22

COMMERCIAL – OPPORTUNITIES FOR LOAN GROWTH
23

COMMERCIAL - DEPOSITS & THE PAYMENT SYSTEM
• Focus on payments processing$3 500
Deposit Growth Trend
Wholesale lockbox processing
Remote deposit volume up 13%
Enhancing online banking platform
$3,500
3,000
2,500
+32%
Enhancing online banking platform
• Transition from paper to electronic
Procurement card
2,000
1,500
ACH
Check conversion
• Evaluating Reg Q impact
500
1,000
0 • Evaluating Reg Q impact
• Focused calling for Merchant Bankcard2008
020102009
Non-InterestInterest
24

COMMERCE TRUST COMPANY – OVERVIEW
• $25 billion in assets under administration
As one of the largest trust companies in the US, The Commerce Trust Company excels at providing objective financial advice, exceptional personal service and comprehensive wealth management solutions.
$25 billion in assets under administration• Ranked #27 based on assets under management*• A team of over 470 and the average officer has 15 years of experience• 100+ years in the business
A growth opportunity for Commerce Bank• Third consecutive year of record asset management sales ($8.1 million)• Achieved all time highs in account retention and client satisfaction scores• Achieved all time highs in account retention and client satisfaction scores• Private banking deposits growth of 20% in 2010 for a total of $1.3 billion in deposits;
loans total $671 million• Strong investment performance from both proprietary & open architecture portfolios
C B d F d k d t 5 b t i k dj t d b d t l f d– Commerce Bond Fund ranked among top 5 best risk adjusted bond mutual funds by Smart Money Magazine (Oct. 2010)
• Fee waivers of $6 million per year continue on short-term client assets due to low interest rates
• Ultra high net worth (Family Office) trust business expanding; assets now total $5.9 billion
25*Source: FDIC - Fiduciary related assets as of Sept 30, 2010

COMMERCE TRUST COMPANY – 2011 INITIATIVES
Target Markets for Enhanced Institutional Trust Services
• Retirement Plan Services/401(k)– $5 - $50 million in assets
• Fixed Income Management– Hospitals, insurance, colleges and
– Complex plan designs– Poor advisor support
• Investment ConsultingFoundations corporations insurance
universities– $10 million and up
• Specialized Nonprofit ServicesBack office support– Foundations, corporations, insurance
– $10 - $100 million– Underserved by consulting
community
– Back office support– Charitable gift administration– Needs that go beyond money
management
• Target Emerging Wealth Segment ($100 to $500k)
Restructure of Commerce Brokerage/Integration with CTC
• Synergies will allow for new product development for brokerage customers• Greater financial planning & investment tools to serve clients• Improved technology for back office will lower costs while offering more competitive
products
26

CARD PRODUCTS – A LEADER IN THE PAYMENTS INDUSTRY
Among US Banks, Nilson Ranks Commerce Bank:
Debit / PrepaidDebit / Prepaid Card#33 Debit Card Issuer
Consumer Card
Merchant
#25 Consumer Card Issuer
Merchant Services#13 Bank Acquirer*
Commercial Card
#9 Purchasing Card Issuer
* Excludes non-bank acquirers 27
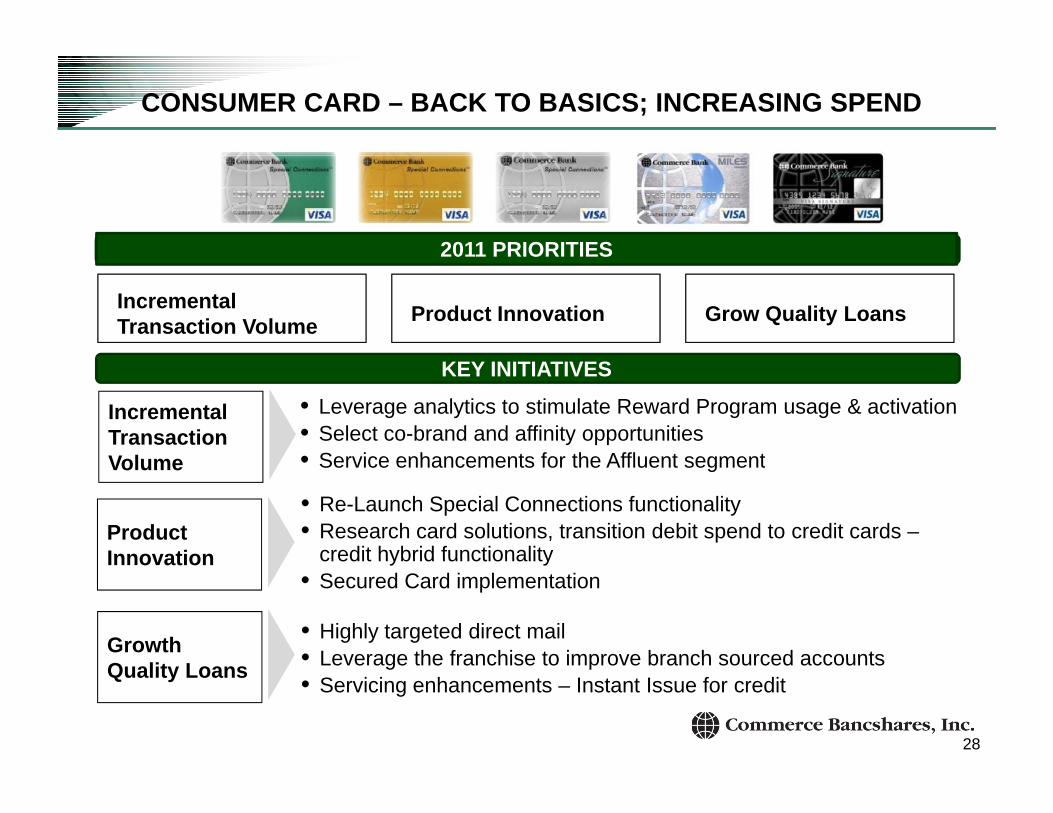
CONSUMER CARD – BACK TO BASICS; INCREASING SPEND
2011 PRIORITIES
Incremental Transaction Volume Product Innovation Grow Quality Loans
2011 PRIORITIES
KEY INITIATIVES
Incremental Transaction V l
• Leverage analytics to stimulate Reward Program usage & activation• Select co-brand and affinity opportunities• Service enhancements for the Affluent segmentVolume • Service enhancements for the Affluent segment
Product Innovation
• Re-Launch Special Connections functionality• Research card solutions, transition debit spend to credit cards –
credit hybrid functionalityInnovation credit hybrid functionality• Secured Card implementation
Growth • Highly targeted direct mail• Leverage the franchise to improve branch sourced accountsQuality Loans • Leverage the franchise to improve branch sourced accounts• Servicing enhancements – Instant Issue for credit
28

STRONG RESULTS IN COMMERCIAL CARD & OPPORTUNITIES IN MERCHANT PROCESSING WARRANT CONTINUED INVESTMENT
Commercial C d
• 40 sales reps covering territories across 48 states• CCX Volume grew to over $1 6 billion with a 148%
2011 PLAN HIGHLIGHTS
Card expansion
• CCX Volume grew to over $1.6 billion with a 148% growth rate and now comprises ½ of entire portfolio
Medical • Sold 93 hospitals in 2010, representing over $1.1 billion
in potential spenderci
al
rd
KEY INIIATIVESverticalp p
• Goal to add over 100 new hospital clients in2011
S d
• B2B Electronic Invoice Presentment and Payment Product• Natural extension to AP product offering
Com
me
Car
Syncada by VisaNatural extension to AP product offering– Implement and Launch Product – Select current clients for pilot and sign 10 total clients
Referral • Leverage internal referral networks (Commercial bank Referral network
g (and Retail Bank) to drive Merchant sales
Industry and t dM
erch
ant
roce
ssin
g
• Cost effectively provide access to hundreds of leads– Signed three associations in 2010 representing over
trade associations
M Pr 700 hospitals and more than 100 self-storage companies
29

PRODUCT OPPORTUNITIES IN THE PAYMENTS SYSTEM
• Reduces costs• Combines payment processes for all
suppliers
Payment
suppliers• Provides automated expense allocation• Enhances supplier relationships with
standard data processes and on-time payments
Commerce Bank Advantagespayments
• Easy access to data through a single online system
Processing• Expands payment product offering
• Creates tighter paymentonline system• Removes manual processes allowing for
efficient enforcement of compliance and controls
• Ensures on time payments eliminating
• Creates tighter payment integration with our customers
• Generates additional• Ensures on time payments eliminating late payment penalties
O ti i t t f b d
Financing
• Generates additional revenue income
• Optimizes payment terms for buyers and suppliers while maximizing working capital
30

M&A POSTURE
• We are strategic buyers
• Focus on opportunities to round out our existing core footprint
• Augment expansion markets if strategic fits become available
• FDIC deals increasingly less attractive
• Healthy bank sales may present opportunities in future
• Targeted loan purchases; management lift outs could be
CAPITALIZING ON OUR POSITION OF STRENGTH:
• Targeted loan purchases; management lift-outs could be attractive
CAPITALIZING ON OUR POSITION OF STRENGTH: ORGANIC GROWTH IS PRIORITY ONE
31

RECAP OF THEMES…
• 2011: Credit picture much improved, but still a h ll i i t f b kchallenging revenue environment for banks
• Commerce well positioned; emphasis on revenue and operating modelsand operating models
• Areas of focus:–Creating new customer relationships–Creating new customer relationships–Building on our strengths People, operations, products
– Investing in high return businessesInvesting in high return businesses
32

EARNINGS RECOVER IN 2010, THOUGH REVENUES MAY BE CHALLENGED
$3.00
$12 00
$13.00 Revenue Per Share Earnings Per Share
$2.20
$2.60
$10 00
$11.00
$12.00
r Sha
re
r Sha
re
$1.80
$
$8 00
$9.00
$10.00
arni
ngs
Per
even
ue P
er
$1 00
$1.40
$6 00
$7.00
$8.00 EaR
$1.00 $6.00 2001 2002 2003 2004 2005 2006 2007 2008 2009 2010
Dividends per share* $0.39 $0.42 $0.53 $0.65 $0.72 $0.77 $0.82 $0.86 $0.87 $0.90
*Restated for 5% stock dividend distributed in December 2010
per share*
33

CONTINUING COMMITMENT TO SHAREHOLDER RETURN
T t l h h ld t *Total shareholder returns*Indexed, 12/31/1999 = 100
180200 COMMERCE
BANK
120140160180
S&P 500INDEX
BANK
6080
100INDEXNASDAQBANKS
402000 2002 2004 2006 2008 2010
Annualized returns*Percent
3 yr3 yr 5 yr5 yr 10 yr10 yrCBSHCBSH 3.3%3.3% 1.7%1.7% 6.4%6.4%S&P 500S&P 500 (2.9%)(2.9%) 2.3%2.3% 1.4%1.4%
*Assumes reinvested dividendsSource: NASDAQ & S&P
NASDAQ BanksNASDAQ Banks (10.3%)(10.3%) (8.5%)(8.5%) 0.2%0.2%
34