2011 national wetland condition assessment (nwca) · 2011 national wetland condition assessment...
TRANSCRIPT

2011 National Wetland Condition Assessment (NWCA)
USDA, NRCS State Soil Scientists MeetingColumbia, SC
March 30, 2010
Michael Scozzafava, National CoordinatorWetlands Monitoring and Assessment Team
U.S. EPA, Office of Wetlands, Oceans, and Watersheds

Presentation Outline
Overview of EPA National Aquatic Resource Surveys
Overview of National Wetland Condition Assessment
Opportunities for Collaboration with NRCS State Soil Scientists
National Aquatic Resource Surveys (NARS)
Independent reviews highlight monitoring limitations GAO, Heinz Center, NRC, etc Existing data inadequate for statistically-valid
characterization of water quality condition in U.S.
EPA Monitoring Initiative Conduct Nation Aquatic Resource Surveys using a
statistical sampling design
Enhance State and Tribal monitoring programs

National Aquatic Resource Survey Schedule
FY07 FY08 FY09 FY10 FY11 FY12 FY13
Lakes Field Lab, data Report Research Design Field Lab, data
Rivers Design Field Lab, data Report* Research Design Field
Streams Research Design Field Lab, data Report Research Design
Coastal Report Research Design Field Lab, data Report Research
Wetlands Research Research Research Design Field Lab,data Report
*The rivers and streams results will be combined into one report issued in 2011, that covers condition of both rivers and streams and changes in stream condition since the baseline report that was finalized in 2006.

What is the Condition of the Nation’s Wetlands?Existing sources of information do not provide a sufficient answer to this
question.
10 States reported
1.8 million acres
1.5% of the estimated 107 million acres in the conterminous United States
2005 FWS Wetland Status & Trends Report(Trends in Wetland Acreage)
2004 CWA 305b Report
-458,000
-290,000
-58,550
+32,000
-500,000
-400,000
-300,000
-200,000
-100,000
0
100,000
1950s-1970s 1970s-1980s 1980s-1990s 1998-2004
Time Period
Average Annual Net Loss and Gain Estimates for Wetlands in the Conterminous United States, 1954-2000
Gains
Losses
Acr
es

National Wetland Condition Assessment Goals
1. Produce a national report that describes the ecological condition of the nation’s wetlands.
2. Help States and Tribes implement wetland monitoring and assessment programs.
3. Advance the science of wetlands monitoring and assessment.
Using the NWCA Results
Establish the national baseline of wetland condition.
Improve NRCS Hydric Soils Database
Coordinate with the U.S. FWS Wetland (acreage) Status and Trends program.
Enhance State and Tribal wetland monitoring programs
Identify wetland types and ecoregions that are especially degraded
Identify the stressors most commonly associated with degraded wetland conditions.
Inform development of ecologically-meaningful performance standards to direct restoration and improvement activities.
Explore ways to quantify the ecosystem services that are derived from wetlands and their restoration.

2011 NWCA Site Map
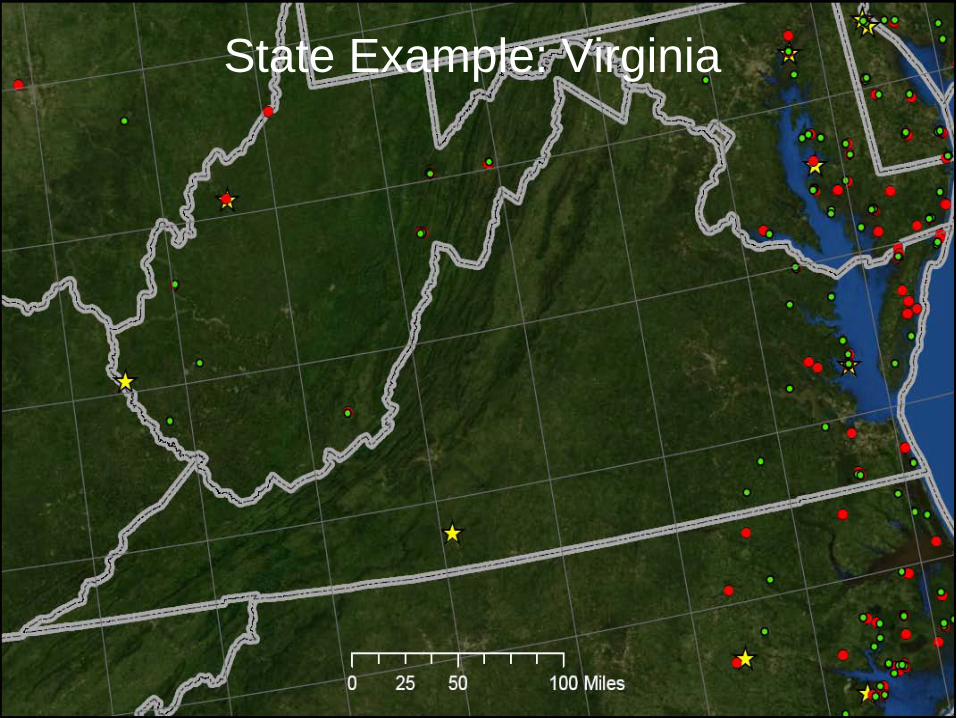
State Example: Virginia
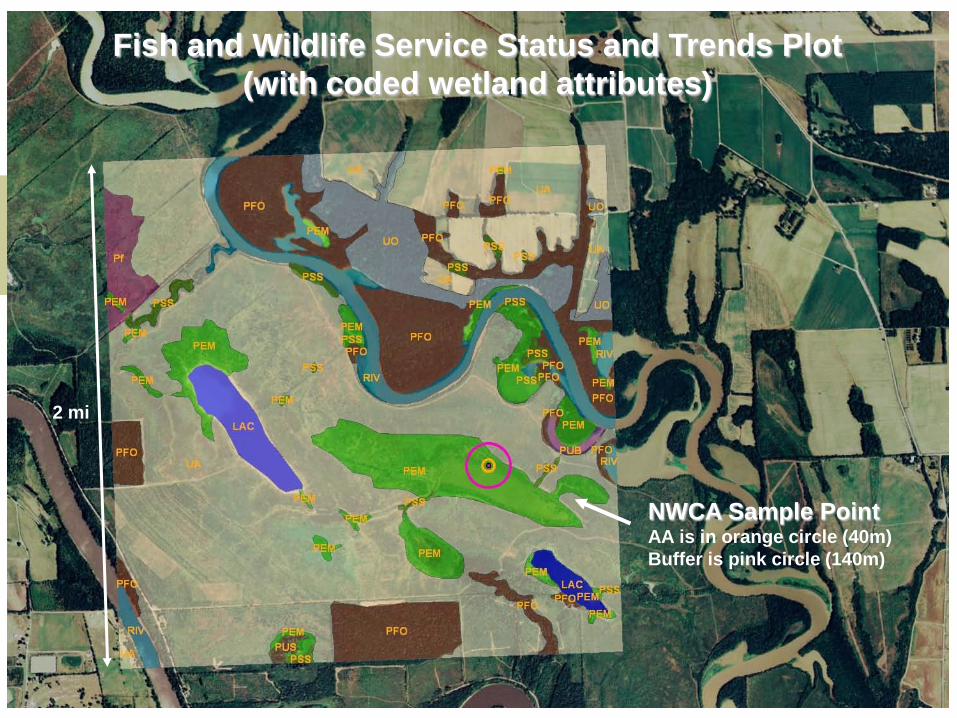
Fish and Wildlife Service Status and Trends Plot(with coded wetland attributes)
2 mi
NWCA Sample PointAA is in orange circle (40m)Buffer is pink circle (140m)
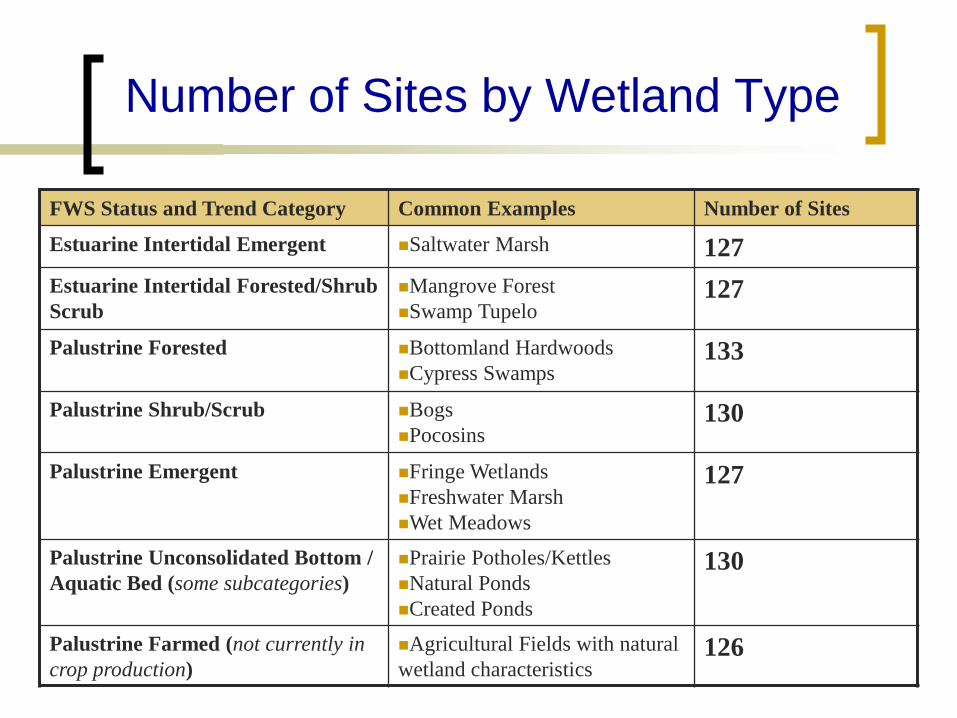
Number of Sites by Wetland Type
FWS Status and Trend Category Common Examples Number of Sites
Estuarine Intertidal Emergent Saltwater Marsh 127Estuarine Intertidal Forested/Shrub Scrub
Mangrove ForestSwamp Tupelo
127
Palustrine Forested Bottomland HardwoodsCypress Swamps
133
Palustrine Shrub/Scrub BogsPocosins
130
Palustrine Emergent Fringe WetlandsFreshwater MarshWet Meadows
127
Palustrine Unconsolidated Bottom / Aquatic Bed (some subcategories)
Prairie Potholes/KettlesNatural PondsCreated Ponds
130
Palustrine Farmed (not currently in crop production)
Agricultural Fields with natural wetland characteristics
126
Summary of Field and Laboratory Logistics and Protocols
Acknowledgments:
Mary Kentula, Teresa Magee, Janet Nestlerode, EPA ORDRegina Poeske and Mary Anne Theising, EPA Regional OfficesGregg Lomnicky, Sandy Bryce, Howard Bruner, Dynamac, Inc. Elizabeth Riley, Gregg Serenbetz, and Chris Faulkner, EPA OW
Larry West, Lenore Vasilas, Chris Smith, Phil King, Richard Ferguson, Mike Wilson, Richard Pullman, Rebecca Burt, Jon Hempel, Thomas Reinsch, NRCS
John Galbraith, VTU and Mike Vepraskas, NCSU
National Wetland Monitoring and Assessment Work Group
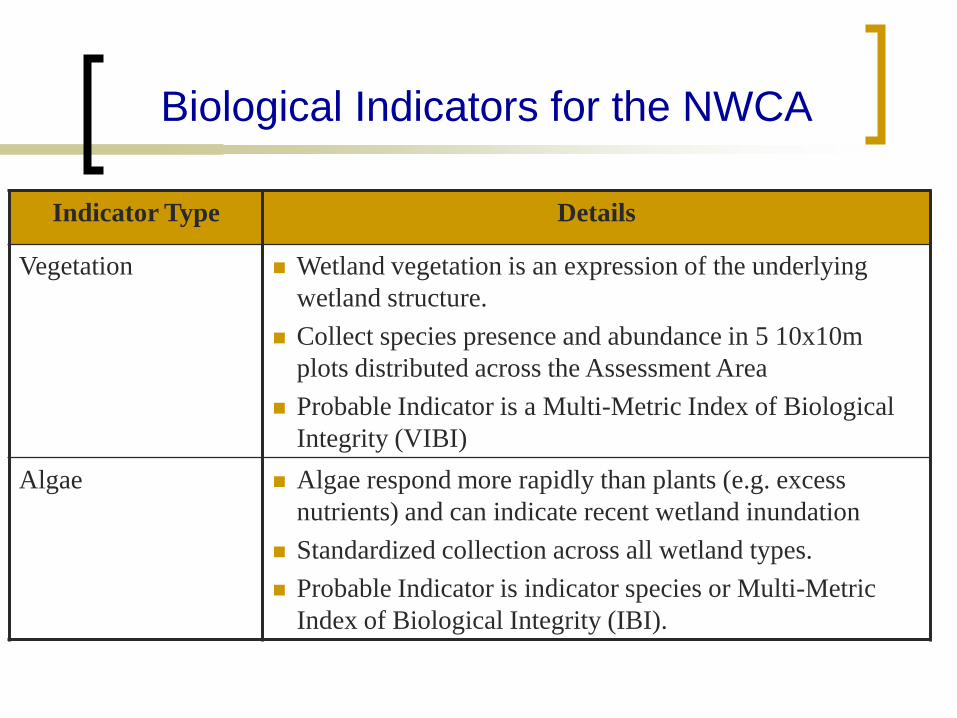
Biological Indicators for the NWCA
Indicator Type Details
Vegetation Wetland vegetation is an expression of the underlying wetland structure.
Collect species presence and abundance in 5 10x10m plots distributed across the Assessment Area
Probable Indicator is a Multi-Metric Index of Biological Integrity (VIBI)
Algae Algae respond more rapidly than plants (e.g. excess nutrients) and can indicate recent wetland inundation
Standardized collection across all wetland types. Probable Indicator is indicator species or Multi-Metric
Index of Biological Integrity (IBI).
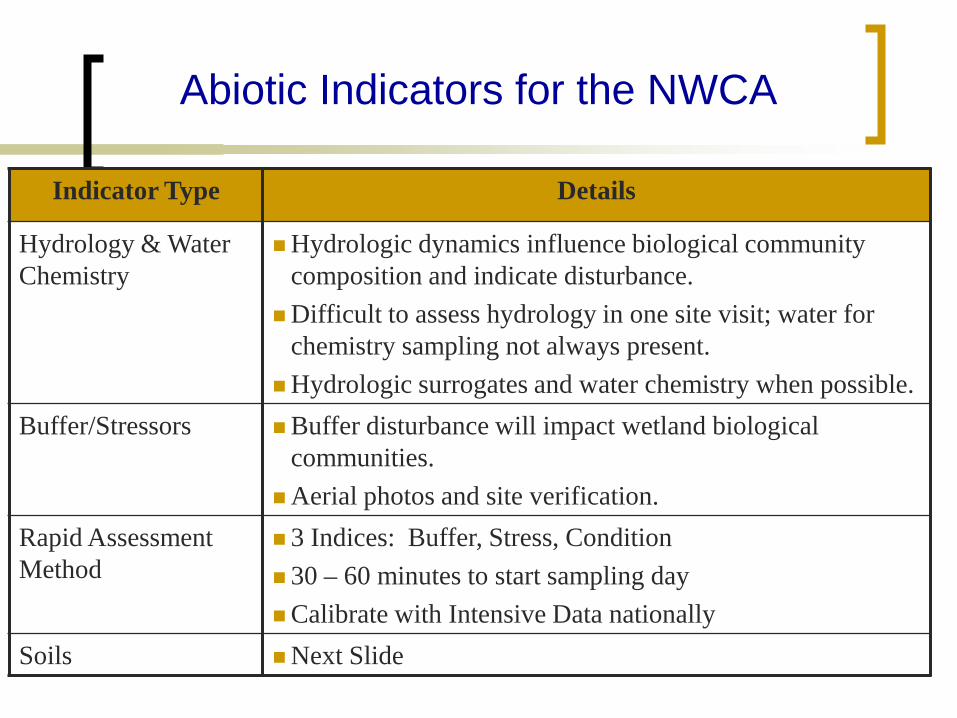
Abiotic Indicators for the NWCA
Indicator Type Details
Hydrology & Water Chemistry
Hydrologic dynamics influence biological community composition and indicate disturbance.
Difficult to assess hydrology in one site visit; water for chemistry sampling not always present.
Hydrologic surrogates and water chemistry when possible.Buffer/Stressors Buffer disturbance will impact wetland biological
communities. Aerial photos and site verification.
Rapid Assessment Method
3 Indices: Buffer, Stress, Condition 30 – 60 minutes to start sampling dayCalibrate with Intensive Data nationally
Soils Next Slide
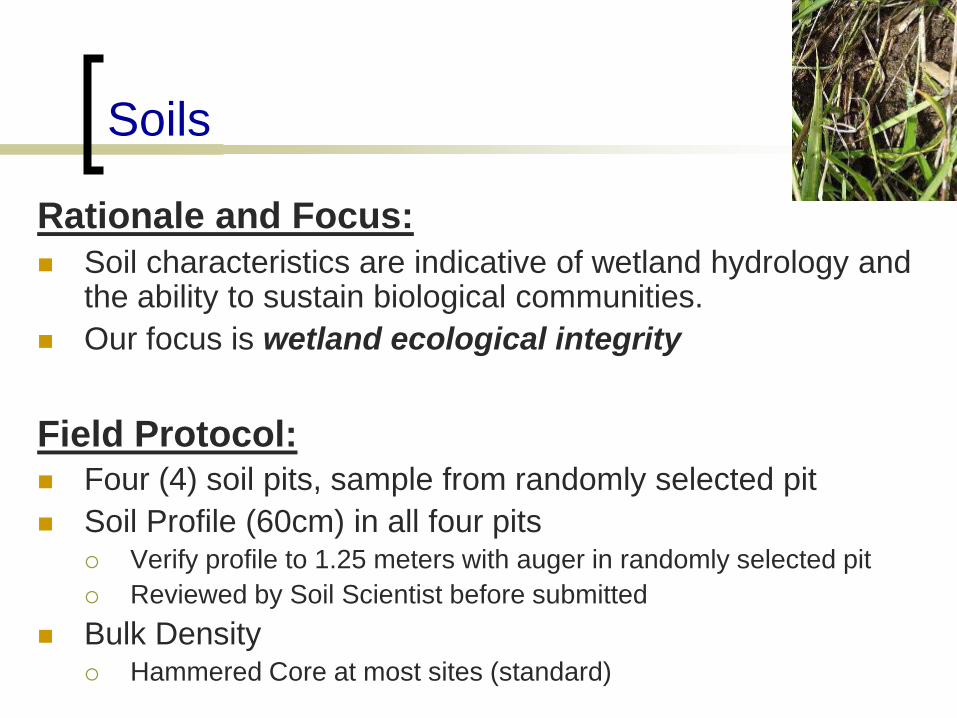
Soils
Rationale and Focus: Soil characteristics are indicative of wetland hydrology and
the ability to sustain biological communities. Our focus is wetland ecological integrity
Field Protocol: Four (4) soil pits, sample from randomly selected pit Soil Profile (60cm) in all four pits
Verify profile to 1.25 meters with auger in randomly selected pit Reviewed by Soil Scientist before submitted
Bulk Density Hammered Core at most sites (standard)
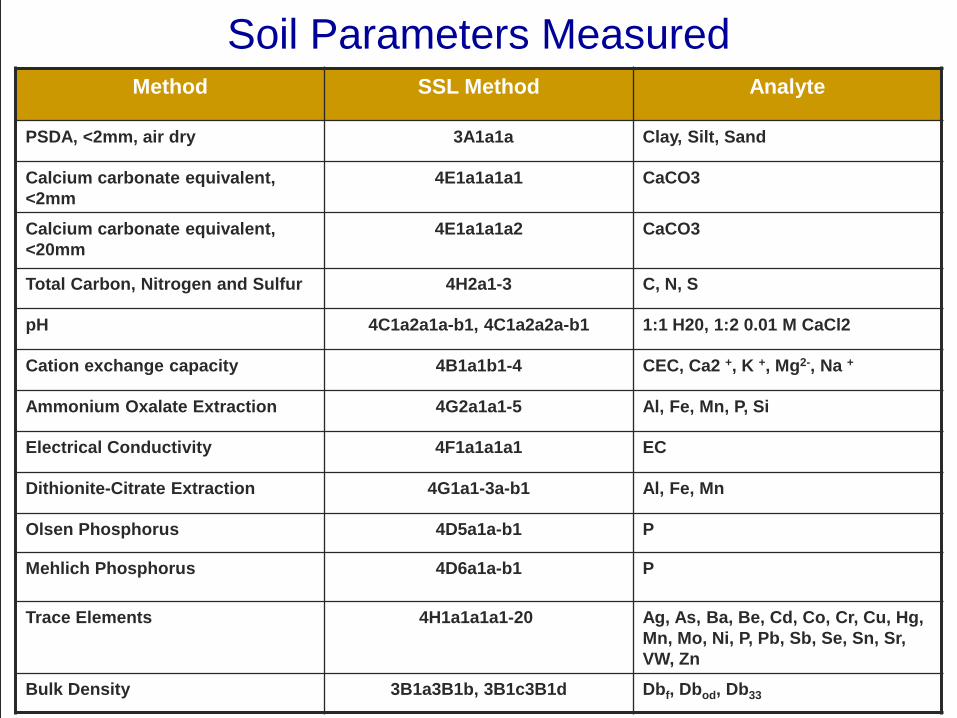
Soil Parameters MeasuredMethod SSL Method Analyte
PSDA, <2mm, air dry 3A1a1a Clay, Silt, Sand
Calcium carbonate equivalent, <2mm
4E1a1a1a1 CaCO3
Calcium carbonate equivalent, <20mm
4E1a1a1a2 CaCO3
Total Carbon, Nitrogen and Sulfur 4H2a1-3 C, N, S
pH 4C1a2a1a-b1, 4C1a2a2a-b1 1:1 H20, 1:2 0.01 M CaCl2
Cation exchange capacity 4B1a1b1-4 CEC, Ca2 +, K +, Mg2-, Na +
Ammonium Oxalate Extraction 4G2a1a1-5 Al, Fe, Mn, P, Si
Electrical Conductivity 4F1a1a1a1 EC
Dithionite-Citrate Extraction 4G1a1-3a-b1 Al, Fe, Mn
Olsen Phosphorus 4D5a1a-b1 P
Mehlich Phosphorus 4D6a1a-b1 P
Trace Elements 4H1a1a1a1-20 Ag, As, Ba, Be, Cd, Co, Cr, Cu, Hg, Mn, Mo, Ni, P, Pb, Sb, Se, Sn, Sr, VW, Zn
Bulk Density 3B1a3B1b, 3B1c3B1d Dbf, Dbod, Db33
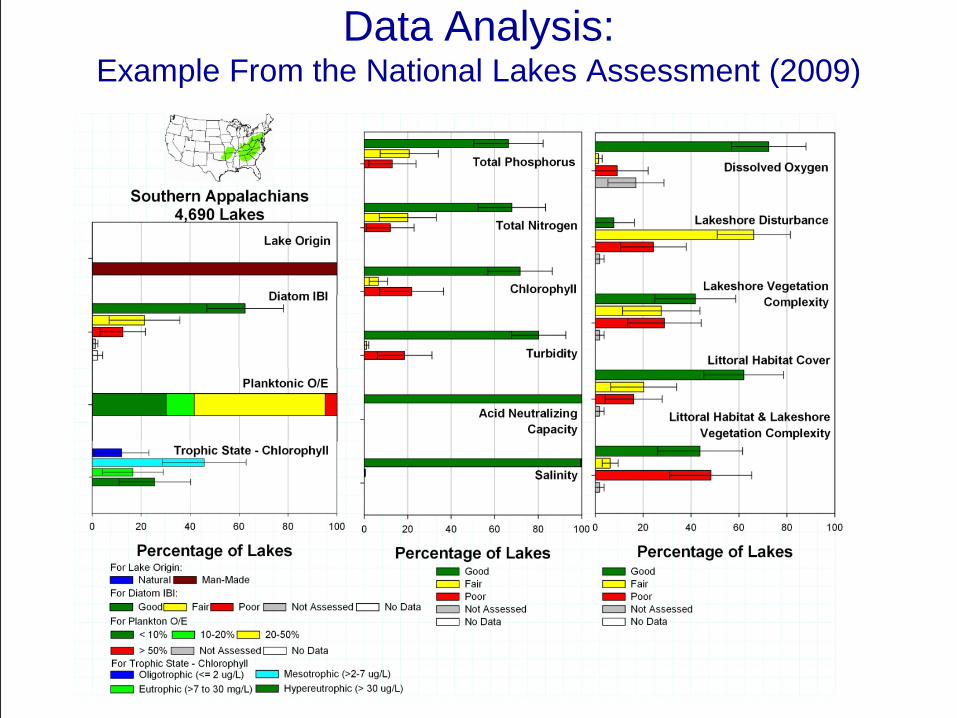
Data Analysis:Example From the National Lakes Assessment (2009)

NWCA Field Crews States, Tribes, or Contractors
Federal Partners where possible
Four Person Crew: One Day for Sampling Vegetation Team – All Vegetation Sampling
Botanist/Ecologist – Education and Training in Botany
Botanist Assistant – No specific expertise
AA/Buffer Team – All Other Indicators No specific expertise required Wetland delineation experience
recommended Soils experience recommended but not
required
Photo courtesy of Janet Nestlerode
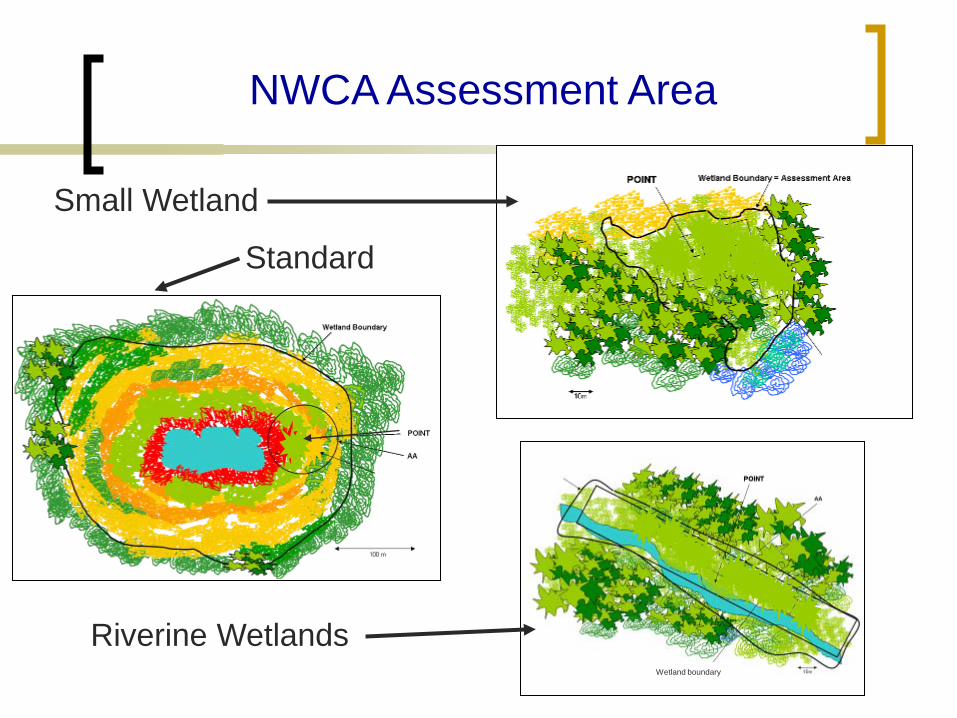
NWCA Assessment Area
Small Wetland
Standard
Riverine WetlandsWetland boundary

10m2
1m2
10m3.16m1.00m
100-m2 Veg Plot
Quadrat Nest B –NE most corner
Quadrat Nest A –SW most corner
Vegetation Data
•Species Occurrence
•Percent Cover
Vegetation Plot
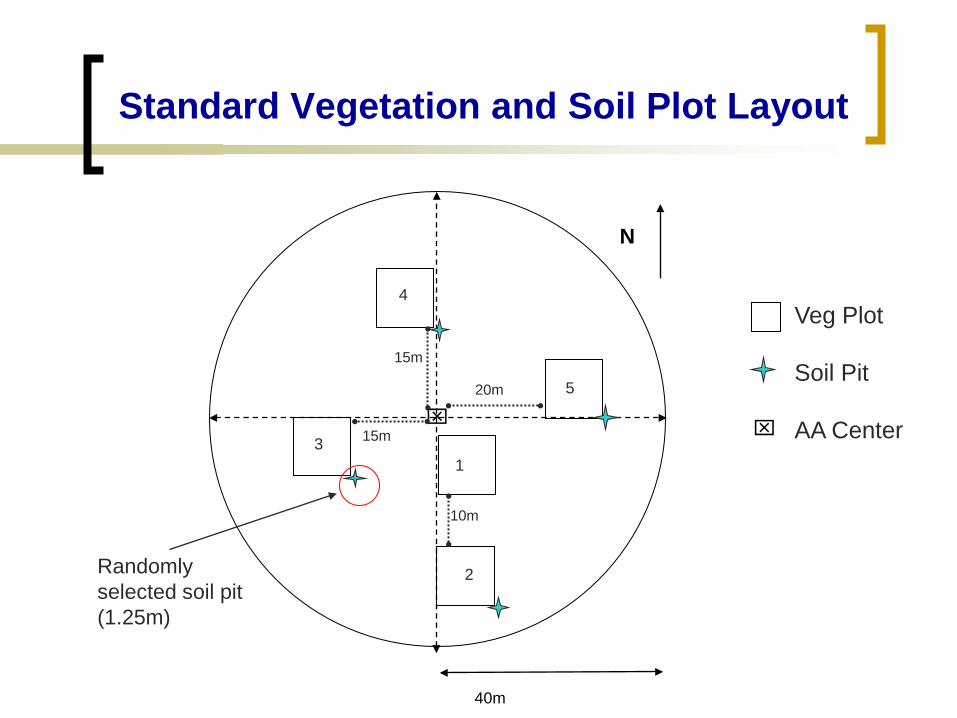
Standard Vegetation and Soil Plot Layout
40m
4
N
3
2
1
5
15m
15m
20m
10m
Veg Plot
Soil Pit
AA Center
Randomly selected soil pit (1.25m)

Examples of Soil Pit Locations in a Small Wetland
Veg Plot
Soil Pit
AA Center
Randomly selected soil pit (1.25m)
Example AA ≈ 0.22ha20
m
1
2 34
5
Example AA ≈ 0.14ha
1
4
23
5

Collaboration with NRCS State Soil Scientists is Vital
Ensure the data we collect is high quality, defensible and useful for EPA and NRCS Report wetland condition nationally Build NRCS Hydric Soils database
Provide Knowledge for Unique or Problem Soils “Tricks of the Trade” Specialized Sampling and Excavation Equipment

Collaboration with NRCS State Soil Scientists
Minimal Level of Collaboration (hoping for) Feedback on Field Protocols
Assist State Field Crews with Desktop Reconnaissance Identify sites with potential problem soils and provide
suggestions on how to sample.
Interact with agricultural community to help field crews secure access to sites
QA/QC on Soil Profiles Check and/or correct soil profile before final submission
Collaboration with NRCS State Soil Scientists
Highest Level of Collaboration Participate in State and Regional Trainings
4-day trainings will cover all NWCA protocols, including soils
States may request more detailed trainings from you
Assist States with Field Sampling All sites in your state OR Only “problem” sites
EPA – NRCS – State Coordination Process
Regina Poeske, EPA Philadelphia Oversee coordination efforts between states and NRCS
Timeline Spring 2010: States contact NRCS State Soil Scientists Summer 2010: Begin initial site reconnaissance Fall 2010: Finalize plan for NRCS involvement Spring 2011: Site recon and Field Crew Training Summer 2011: Field Sampling Fall 2011: Laboratory QA/QC Procedures Spring 2012: Data Analysis and Interpretation
We Need Your Help!
Opportunity to collaborate on a mutually beneficial national project
NRCS clearly has soils expertise and experience that EPA does not
Available for questions in Group 2 Tomorrow Morning
Revised Field and Lab Protocols Available 4/15/10 Final Testing and Review this Summer Feedback on Unique Situations and “Tricks of the Trade.”
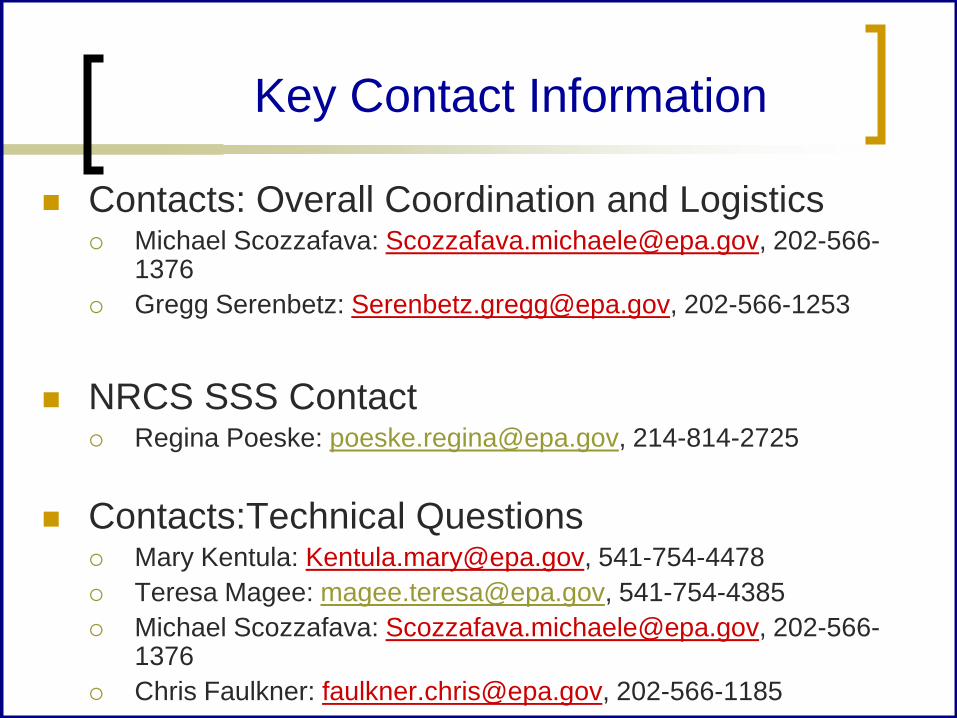
Key Contact Information
Contacts: Overall Coordination and Logistics Michael Scozzafava: [email protected], 202-566-
1376 Gregg Serenbetz: [email protected], 202-566-1253
NRCS SSS Contact Regina Poeske: [email protected], 214-814-2725
Contacts:Technical Questions Mary Kentula: [email protected], 541-754-4478 Teresa Magee: [email protected], 541-754-4385 Michael Scozzafava: [email protected], 202-566-
1376 Chris Faulkner: [email protected], 202-566-1185