2011 interim results and strategic overview - investis...
TRANSCRIPT
2011 Interim results and strategic overview
Charter International plc
26 July 2011

Cautionary statement
This presentation is being furnished for information purposes only and does not constitute or form part of, and should not be construed as, an offer, invitation or recommendation for the sale, purchase or issue of any shares or other securities in Charter International plc (“Charter”) or any of its subsidiaries and neither it nor any part of it shall form the basis of , or be relied upon in connection with, any investment decision, contract or commitment whatsoever.
The information set out herein may be subject to amendment without notice, and such information may change materially. No representation, warranty or undertaking, express or implied, is or will be made or given by Charter, any of its subsidiaries or any of its or their directors, officers, employees, agents or advisers or any other person as to the accuracy, completeness, reasonableness or fairness of the information or opinions contained in this presentation or provided in connection therewith and any reliance you decide to place on them will be at your sole risk. Charter, its subsidiaries and any of its or their directors, officers, employees, agents or advisers, save with respect to any liability for fraud, expressly disclaim any and all liability which may be based on the information or opinions set out in this presentation or provided in connection therewith and any errors therein or omissions therefrom.
In particular, but without limitation, the statements and projections with respect to Charter’s performance contained in this presentation have been prepared by Charter on the basis of management figures arrived at as part of Charter’s budget and forecasting process and reflect various assumptions, expectations, beliefs and estimates of Charter which may or may not prove to be accurate or realistic. Such statements and projections are not guarantees of future performance, and involve risks, uncertainties and other important factors that may cause Charter’s actual results, performance or achievements to be materially different from those anticipated by such statements and projections. Without prejudice to the foregoing, none of Charter, its subsidiaries or any of its or their directors, officers, employees, agents or advisers accept any liability whatsoever (in negligence or otherwise) for any loss howsoever arising, whether directly or indirectly, from use of this presentation or its contents or otherwise arising in connection therewith.
This presentation does not constitute a recommendation regarding the securities of Charter.
Charter International plc | 2011 Interim results presentation 2

Lars Emilson
Chairman

Overview
Introduction and operational changes Lars Emilson and Gareth Rhys Williams
First half 2011 financial performance Robert Careless
ESAB strategic overview Brendan Colgan
Howden strategic overview Bob Cleland
Concluding comments Lars Emilson
Charter International plc | 2011 Interim results presentation 4
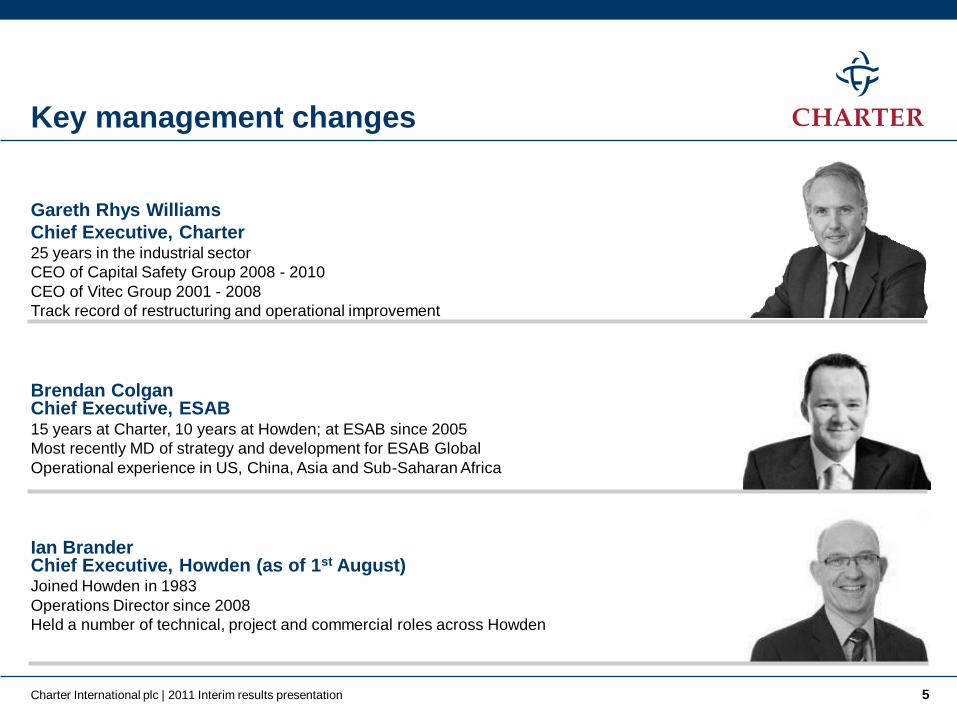
Key management changes
Gareth Rhys Williams
Chief Executive, Charter 25 years in the industrial sector
CEO of Capital Safety Group 2008 - 2010
CEO of Vitec Group 2001 - 2008
Track record of restructuring and operational improvement
Brendan Colgan Chief Executive, ESAB 15 years at Charter, 10 years at Howden; at ESAB since 2005
Most recently MD of strategy and development for ESAB Global
Operational experience in US, China, Asia and Sub-Saharan Africa
Ian Brander Chief Executive, Howden (as of 1st August) Joined Howden in 1983
Operations Director since 2008
Held a number of technical, project and commercial roles across Howden
Charter International plc | 2011 Interim results presentation 5
Chief Executive
Gareth Rhys Williams
First impressions
Significant opportunity to grow and improve
• Both businesses are well respected global leaders with exciting positions in developing markets
• Both have a history of innovation and technical expertise
• Operating management in both divisions are energetic and have a clear grasp of what needs doing
• ESAB has clear targets to significantly improve its margin and working capital performance, including an increased target of £38 million cost savings
• ESAB’s new management is already making the changes needed
• Howden is enjoying a record order book with the potential to grow much further organically and by acquisition
• Howden’s recent investments in management infrastructure are now in place to support £1bn business
Charter International plc | 2011 Interim results presentation 7

My agenda
Charter International plc | 2011 Interim results presentation 8
Expose full value potential while driving operational
performance
• Work with the Board and our advisers to maximise shareholder value by
examining all available strategic options
• Work with management to:
- Maintain ESAB’s growth path by improving our customers’ experience
- Drive margins at ESAB
- Improve working capital performance, particularly within ESAB
- Drive growth and margins at Howden
• Ensure the full value of these businesses is recognised
Robert Careless
Finance Director

6 months ended 30 June 2011 2010 Change
Revenue (£m) 946.5 840.4 12.6%
Adjusted operating profit (£m) 75.2 72.7 3.4%
Adjusted profit before tax (£m) 75.6 73.3 3.1%
Adjusted earnings per share (pence)* 33.6 32.8 2.4%
Basic earnings per share (pence) 19.3 30.4 (36.5%)
Dividend per share (pence) 8.0 7.5 6.7%
* After an effective tax rate of 17.5% (1H 2010: 18.5%)
Financial highlights
Charter International plc | 2011 Interim results presentation 10
Increased
revenue, profit and
EPS
Increase in interim
dividend of 6.7%

6 months ended 30 June, £m 2011 2010 Change
ESAB 658.7 558.8 17.9%
Howden 287.8 281.6 2.2%
Revenue 946.5 840.4 12.6%
ESAB 40.8 50.1 (18.6%)
Howden 38.9 28.8 35.1%
Central operations (4.5) (6.2) 27.4%
Adjusted operating profit 75.2 72.7 3.4%
Share of post tax profits of associates
and joint ventures
2.3 1.8 27.8%
Adjusted operating margin
ESAB 6.2% 9.0%
Howden 13.5% 10.2%
Overview of business performance
Charter International plc | 2011 Interim results presentation 11
Howden performed
ahead of
expectations, with
adjusted operating
profit up £10.1
million
ESAB showed
good revenue
progression; action
being taken on
margins

Exceptional items
Charter International plc | 2011 Interim results presentation 12
Restructuring well
underway
ESAB 1H 2011
restructuring cost
includes £7 million
relating to US factory
closure
Expected ESAB
restructuring
charges:
- 2H 2011: £12 million
- 2012: £13 million
6 months ended 30 June, £m 2011 2010
Restructuring costs
ESAB (15.9) (7.9)
Howden - -
Central operations (1.3) -
(17.2) (7.9)
Add back: cessation of post-retirement medical
benefits (US) - 8.5
Past service post-retirement pension benefits net
credit (UK) 6.2 -
Total exceptional items (11.0) 0.6
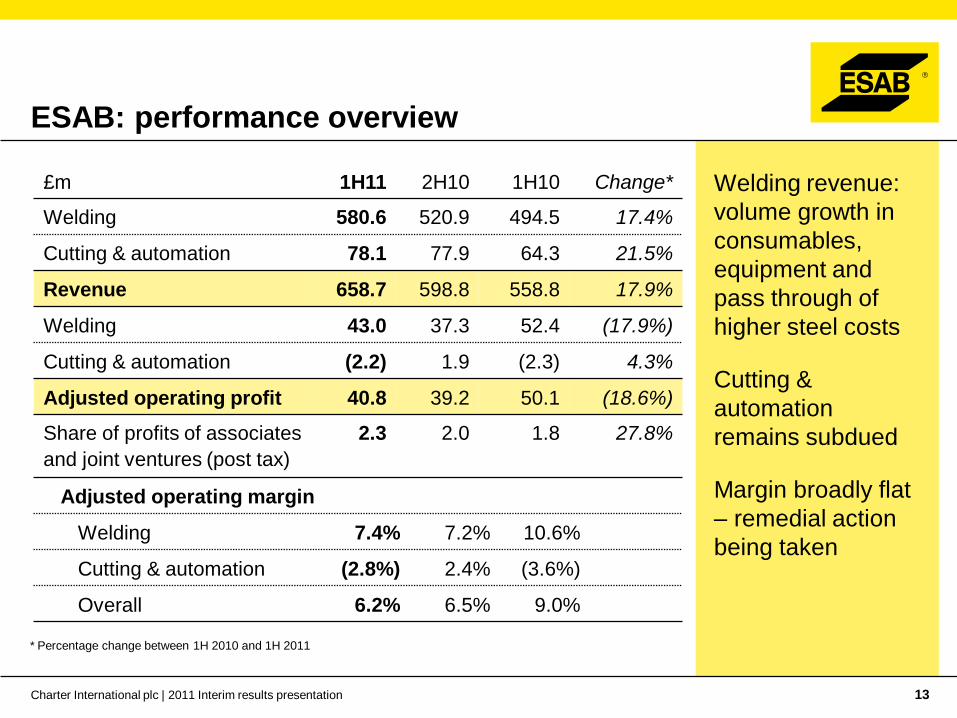
ESAB: performance overview
Charter International plc | 2011 Interim results presentation 13
Welding revenue:
volume growth in
consumables,
equipment and
pass through of
higher steel costs
Cutting &
automation
remains subdued
Margin broadly flat
– remedial action
being taken
£m 1H11 2H10 1H10 Change*
Welding 580.6 520.9 494.5 17.4%
Cutting & automation 78.1 77.9 64.3 21.5%
Revenue 658.7 598.8 558.8 17.9%
Welding 43.0 37.3 52.4 (17.9%)
Cutting & automation (2.2) 1.9 (2.3) 4.3%
Adjusted operating profit 40.8 39.2 50.1 (18.6%)
Share of profits of associates
and joint ventures (post tax)
2.3 2.0 1.8 27.8%
Adjusted operating margin
Welding 7.4% 7.2% 10.6%
Cutting & automation (2.8%) 2.4% (3.6%)
Overall 6.2% 6.5% 9.0%
* Percentage change between 1H 2010 and 1H 2011
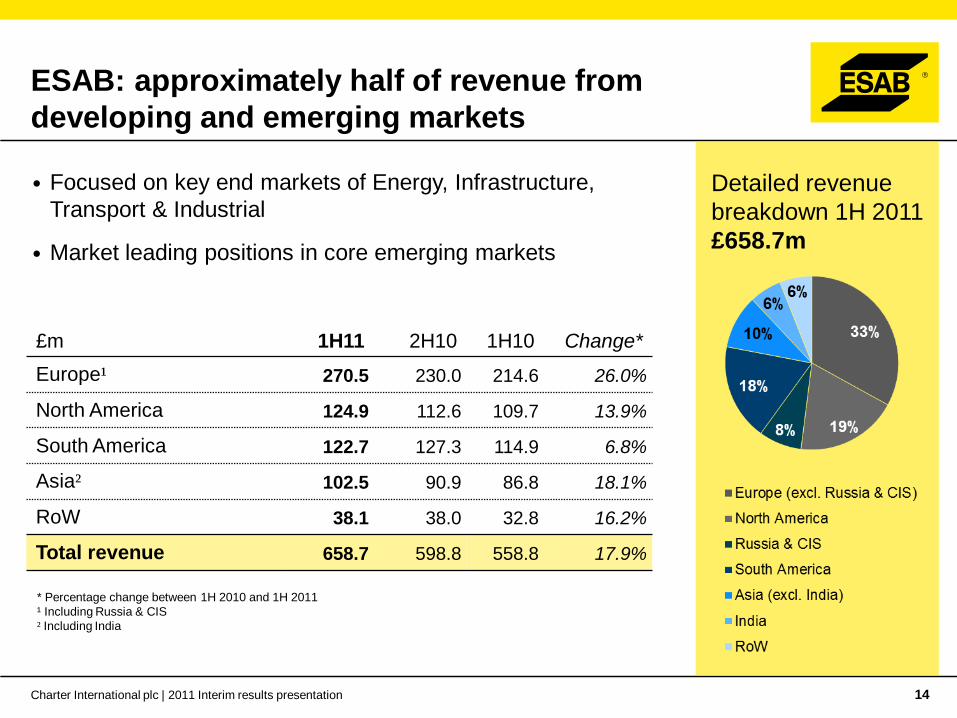
ESAB: approximately half of revenue from
developing and emerging markets
Charter International plc | 2011 Interim results presentation 14
• Focused on key end markets of Energy, Infrastructure,
Transport & Industrial
• Market leading positions in core emerging markets
Detailed revenue
breakdown 1H 2011
£658.7m
£m 1H11 2H10 1H10 Change*
Europe¹ 270.5 230.0 214.6 26.0%
North America 124.9 112.6 109.7 13.9%
South America 122.7 127.3 114.9 6.8%
Asia² 102.5 90.9 86.8 18.1%
RoW 38.1 38.0 32.8 16.2%
Total revenue 658.7 598.8 558.8 17.9%
* Percentage change between 1H 2010 and 1H 2011
¹ Including Russia & CIS
² Including India

Howden: performance overview
• Strong first contribution of £4m (since March 2011) from Thomassen – ahead of expectations
• Aftermarket delivered a strong performance - an increase of 22.5% in revenue compared to 1H 2010
Howden revenue
1H 2011 £287.8m
£m 1H11 2H10 1H10 Change*
New equipment 171.3 171.5 186.5 (8.2%)
Aftermarket 116.5 108.9 95.1 22.5%
Revenue 287.8 280.4 281.6 2.2%
Adjusted operating profit 38.9 39.0 28.8 35.1%
Adjusted operating margin 13.5% 13.9% 10.2%
Charter International plc | 2011 Interim results presentation 15
* Percentage change between 1H 2010 and 1H 2011

Howden: record order book
Charter International plc | 2011 Interim results presentation 16
Order book
includes £62 million
from Thomassen
Bookings up by
approximately 50%
on 1H 2010
“Book to bill” up 43
ppts on 1H 2010, at
138% versus 95%
in 1H 2010
£m 1H11 2H10 1H10
Balance brought forward 423.8 438.9 441.1
Net orders booked 397.5 265.0 266.4
Acquisitions 58.2 - 2.2
Sales (287.8) (280.4) (281.6)
Foreign exchange impact 0.2 0.3 10.8
Balance carried forward 591.9 423.8 438.9
Ratio of bookings to sales
(“book to bill”) 138% 95% 95%
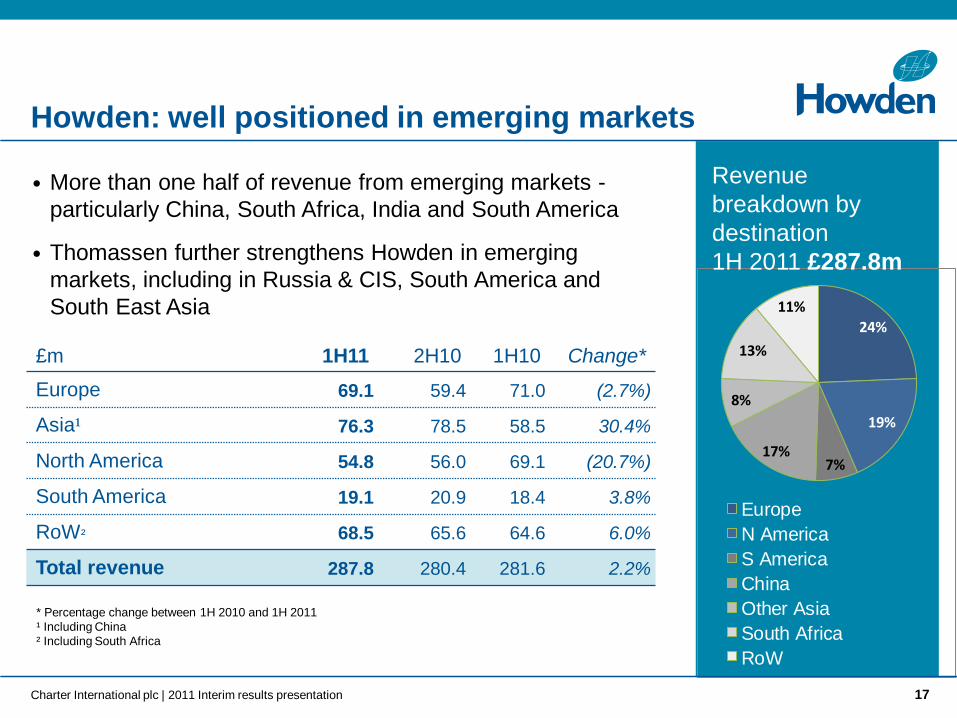
Howden: well positioned in emerging markets
• More than one half of revenue from emerging markets -
particularly China, South Africa, India and South America
• Thomassen further strengthens Howden in emerging
markets, including in Russia & CIS, South America and
South East Asia
£m 1H11 2H10 1H10 Change*
Europe 69.1 59.4 71.0 (2.7%)
Asia¹ 76.3 78.5 58.5 30.4%
North America 54.8 56.0 69.1 (20.7%)
South America 19.1 20.9 18.4 3.8%
RoW² 68.5 65.6 64.6 6.0%
Total revenue 287.8 280.4 281.6 2.2%
24%
19%
7%17%
8%
13%
11%
Europe
N America
S America
China
Other Asia
South Africa
RoW
Revenue
breakdown by
destination
1H 2011 £287.8m
Charter International plc | 2011 Interim results presentation 17
* Percentage change between 1H 2010 and 1H 2011
¹ Including China
² Including South Africa

Cash flow reflecting growth by acquisition
Charter International plc | 2011 Interim results presentation 18
Net cash outflow of
£157m primarily
reflecting
acquisitions
(£93m) and
working capital
(£57m)
Modest period end
gearing with net
debt of £155
million
£m 1H11 2H10 1H10
Operating profit 40.8 69.1 69.3
Depreciation and amortisation and
impairment 45.6 19.9 22.2
Net working capital (increase)/decrease (57.4) (16.1) (32.7)
Other items1 (18.9) (27.7) (18.5)
Cash generated from operations 10.1 45.2 40.3
Capital expenditure and capitalised
development costs
(28.2) (28.0) (34.1)
Acquisitions (92.7) - (0.8)
Tax (15.9) (17.0) (19.5)
Dividends paid to equity shareholders (25.9) (12.5) (24.2)
Other2 (4.5) (0.2) 1.7
Net cash absorption (157.1) (12.5) (36.6)
1 Other items include retirement benefit obligations, other provisions, share based payments, loss/(profit) on sale of
business and fixed assets. 2 Other items include finance charges, investment in associates and joint ventures, dividend received from
associates and joint ventures, dividends paid to minority shareholders, issue of share capital and currency
variations.
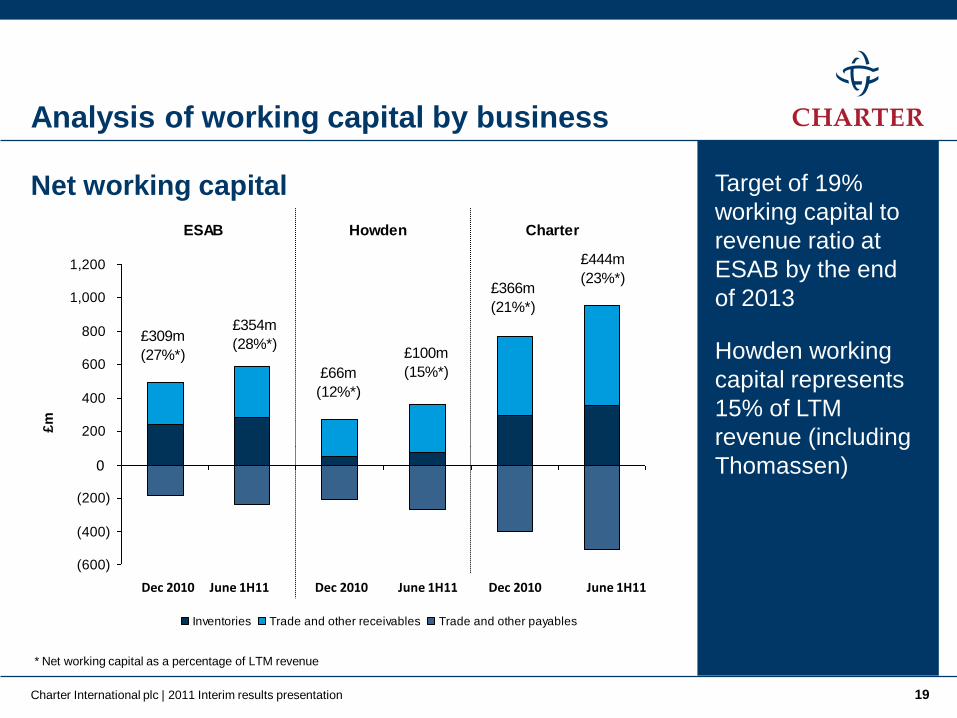
(600)
(400)
(200)
-
200
400
600
800
1,000
1,200
2010 1H11 2010 1H11 2010 1H11
£m
Inventories Trade and other receivables Trade and other payables
£354m
(28%*)£100m
(15%*)
£444m
(23%*)£366m
(21%*)
£66m
(12%*)
£309m
(27%*)
ESAB CharterHowden
Analysis of working capital by business
Target of 19%
working capital to
revenue ratio at
ESAB by the end
of 2013
Howden working
capital represents
15% of LTM
revenue (including
Thomassen)
* Net working capital as a percentage of LTM revenue
Net working capital
Charter International plc | 2011 Interim results presentation 19
0
Dec 2010 Dec 2010 Dec 2010 June 1H11 June 1H11 June 1H11
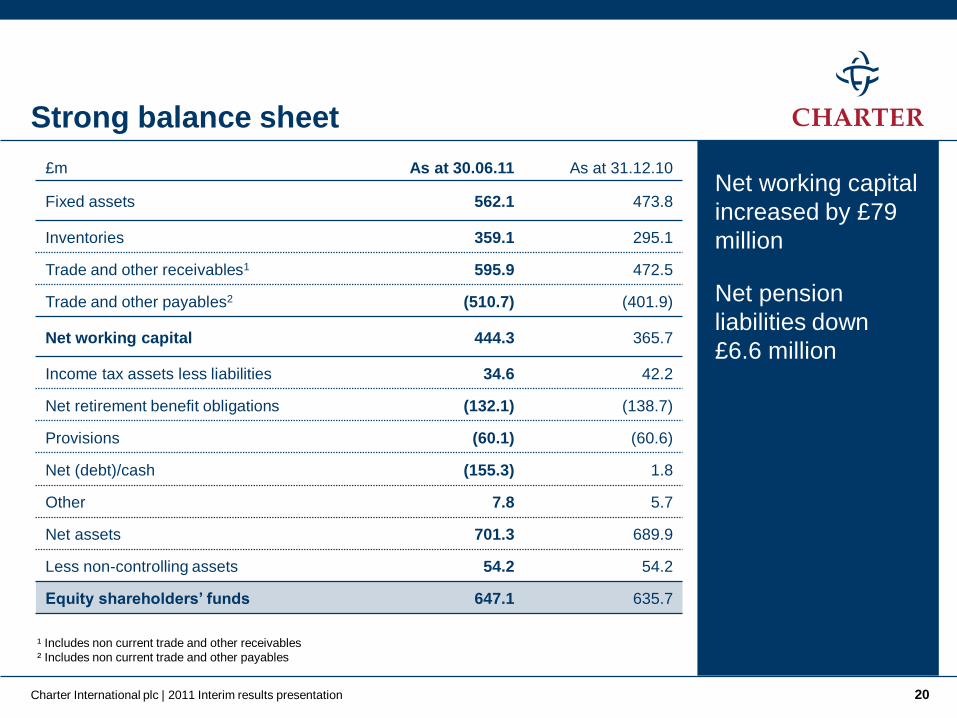
Strong balance sheet
Net working capital
increased by £79
million
Net pension
liabilities down
£6.6 million
£m As at 30.06.11 As at 31.12.10
Fixed assets 562.1 473.8
Inventories 359.1 295.1
Trade and other receivables1 595.9 472.5
Trade and other payables2 (510.7) (401.9)
Net working capital 444.3 365.7
Income tax assets less liabilities 34.6 42.2
Net retirement benefit obligations (132.1) (138.7)
Provisions (60.1) (60.6)
Net (debt)/cash (155.3) 1.8
Other 7.8 5.7
Net assets 701.3 689.9
Less non-controlling assets 54.2 54.2
Equity shareholders’ funds 647.1 635.7
Charter International plc | 2011 Interim results presentation 20
¹ Includes non current trade and other receivables
² Includes non current trade and other payables

Dividend
Charter International plc | 2011 Interim results presentation 21
Interim dividend
per share
(p)
Final dividend
per share
(p)
Total
dividend
(p)
2008 7.0 14.0 21.0
2009 7.0 14.5 21.5
2010 7.5 15.5 23.0
2011 8.0 - -
Increased interim
dividend of 8.0
pence per share

Strategic Overview
Brendan Colgan
CEO ESAB

Challenges & targets
Margin & working capital improvement
Revenue & growth
Team to deliver performance and transformation
Conclusion
Agenda
Charter International plc | 2011 Interim results presentation 23
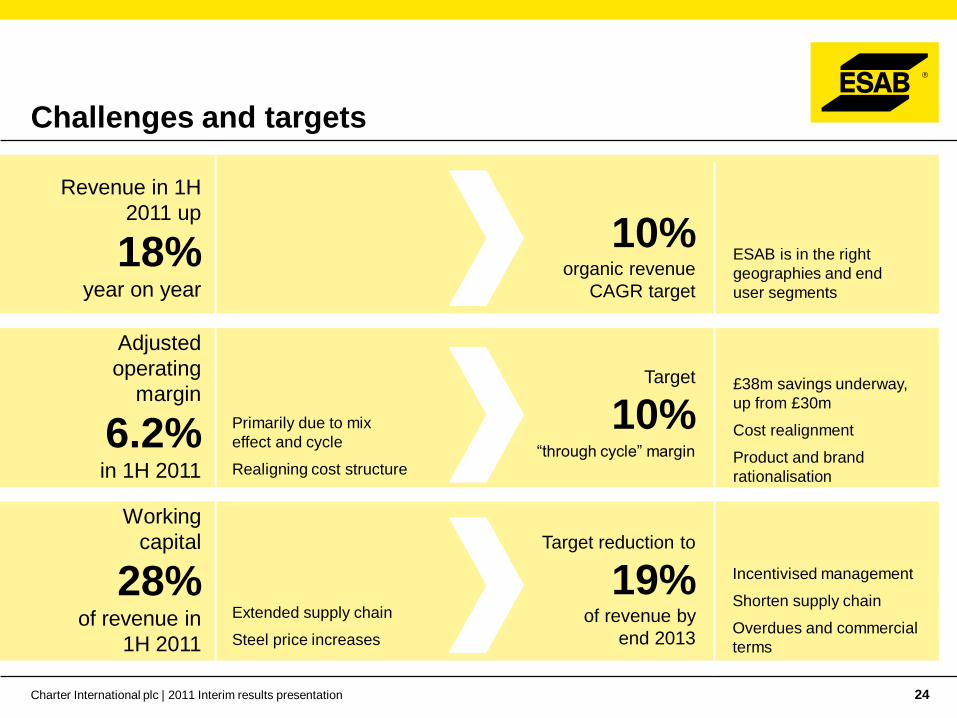
Challenges and targets
Charter International plc | 2011 Interim results presentation 24
10% organic revenue
CAGR target
Revenue in 1H
2011 up
18% year on year
ESAB is in the right
geographies and end
user segments
Adjusted
operating
margin
6.2% in 1H 2011
Primarily due to mix
effect and cycle
Realigning cost structure
Target
10% “through cycle” margin
£38m savings underway,
up from £30m
Cost realignment
Product and brand
rationalisation
Working
capital
28% of revenue in
1H 2011
Extended supply chain
Steel price increases
Target reduction to
19% of revenue by
end 2013
Incentivised management
Shorten supply chain
Overdues and commercial
terms

Adjusted operating profit bridge
Charter International plc | 2011 Interim results presentation 25
9.0%¹
6.2%¹
¹ Adjusted operating profit margin

Europe: restoring performance
Charter International plc | 2011 Interim results presentation
Market dynamics
Low growth market
Highly competitive
Segment cycles
(product and
geography mix)
Restoring ESAB’s
performance
Product offering and cost ● Product portfolio
rationalisation
● Lower production and
distribution costs
Improved customer service
More agile and reliable
supply chain
Overhead reduction ● Including new B2B and
customer webshop
ESAB challenges
2010/11
Pricing/market share ● Product, production and
distribution cost
Customer disruption from
distribution changes ● 17 warehouses reduced to 3,
completed July 2011
Management disruption from
structural reorganisation ● Consolidation of all 28 admin
centres and
8 IT systems (end 2012)
26

Cost reduction: £38m up from £30m Savings of £38m have been identified
- Majority underway
- To be completed by mid-2013
Year end run rate:
- 2011: £15m
- 2012: £35m
Income statement benefits:
- 2011: £5m
- 2012: £25m
Related exceptional charges:
- £7m in 1H 2011 completed
- £12m in 2H 2011
- £13m in 2012
Actions being implemented
South
America
Capital
business
Central
overheads
Europe
overheads
North
America
capacity Europe
capacity
Further cost
savings being
examined
£4.7m
£4.2m
£13.8m
£3.3m
£5.4m
£6.4m
Additional actions
Implied 3.3 percentage points margin
improvement on 2010 revenue
Charter International plc | 2011 Interim results presentation 27
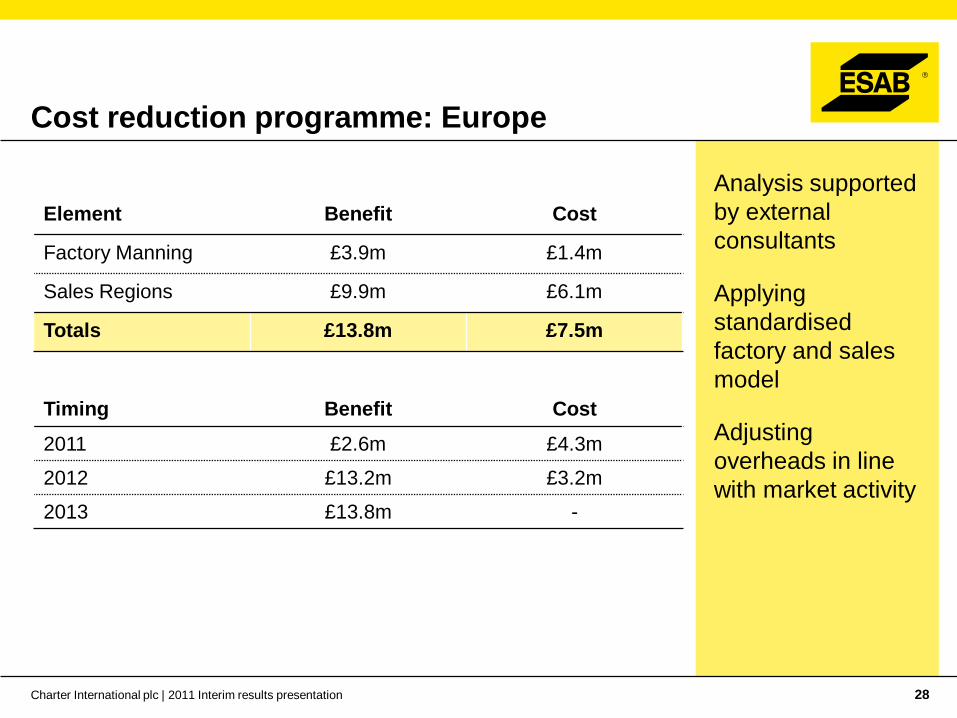
Cost reduction programme: Europe
Analysis supported
by external
consultants
Applying
standardised
factory and sales
model
Adjusting
overheads in line
with market activity
Element Benefit Cost
Factory Manning £3.9m £1.4m
Sales Regions £9.9m £6.1m
Totals £13.8m £7.5m
Timing Benefit Cost
2011 £2.6m £4.3m
2012 £13.2m £3.2m
2013 £13.8m -
Charter International plc | 2011 Interim results presentation 28

Capacity realignment: Europe
£6.4m cost savings identified
Anticipated working capital reduction
• Transfer capacity to Russia
- Shorten supply chain
- Reduce logistics and duty costs
- Service market growth
- Synergy with existing footprint
(Sychevsky)
• Capacity consolidation
- Reduce fixed overhead
24 month project to mid-2013
RUSSIA
Export
16%
£92m
Europe
84%
£501m
Export
23%
£130m
Europe
77%
£435m
2008A 2011E
European exports have increased
Charter International plc | 2011 Interim results presentation 29
Transfer of capacity by mid-2013
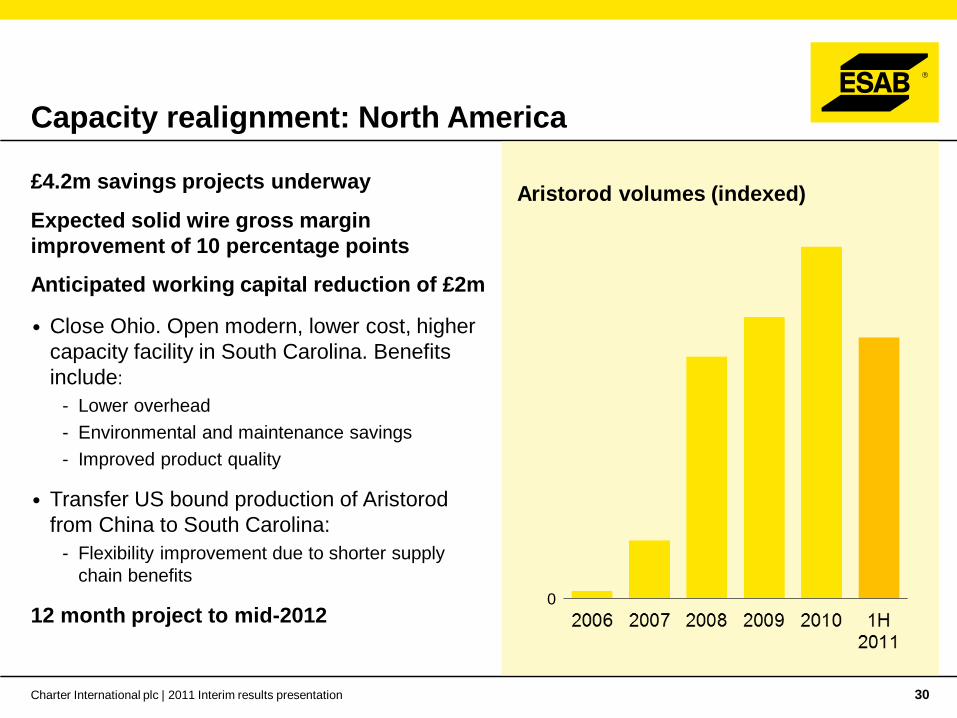
Aristorod volumes (indexed)
Capacity realignment: North America
£4.2m savings projects underway
Expected solid wire gross margin
improvement of 10 percentage points
Anticipated working capital reduction of £2m
• Close Ohio. Open modern, lower cost, higher
capacity facility in South Carolina. Benefits
include:
- Lower overhead
- Environmental and maintenance savings
- Improved product quality
• Transfer US bound production of Aristorod
from China to South Carolina:
- Flexibility improvement due to shorter supply
chain benefits
12 month project to mid-2012
Charter International plc | 2011 Interim results presentation 30
0
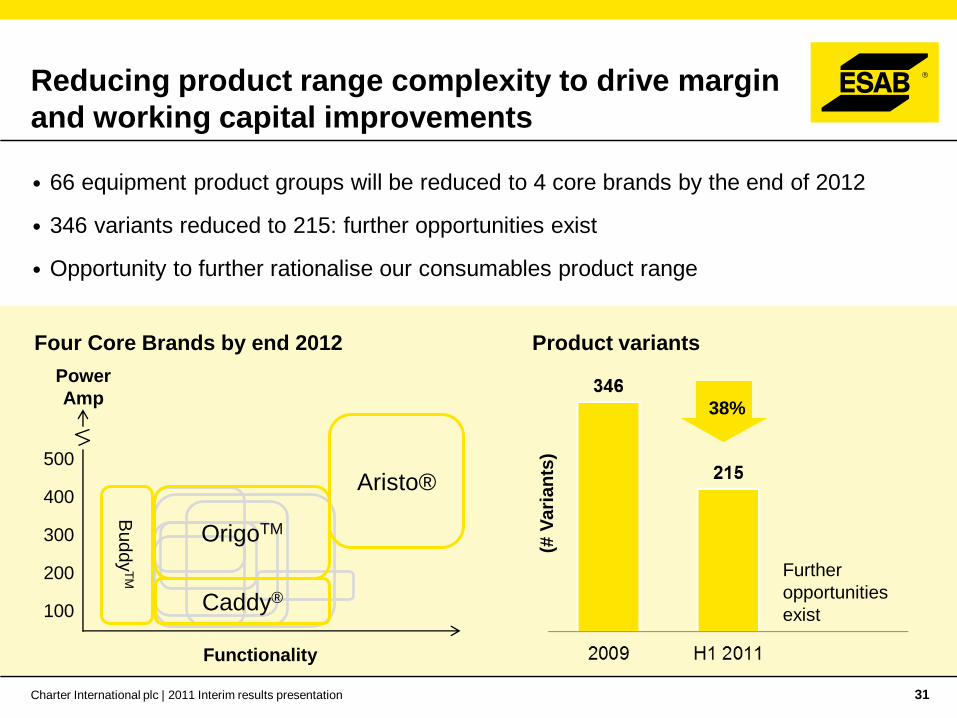
Reducing product range complexity to drive margin
and working capital improvements
• 66 equipment product groups will be reduced to 4 core brands by the end of 2012
• 346 variants reduced to 215: further opportunities exist
• Opportunity to further rationalise our consumables product range
Four Core Brands by end 2012
Aristo®
Caddy®
OrigoTM
100
200
300
500
400
Power
Amp
Functionality
Buddy
TM
Product variants
Further
opportunities
exist
(# V
ari
an
ts)
38%
Charter International plc | 2011 Interim results presentation 31

Targeting 19% working capital to revenue
by end of 2013
Management
Incentives
New Supply Chain
management
Charter International plc | 2011 Interim results presentation 32
Portfolio rationalisation
Reduction of slow moving
stock
Capacity realignment to
shorten supply chain
1H 2011 2013 Target
-3%
-8% -9% Trade
Payables
28%
15% 20%
-5%
Trade
receivables
15%
23%
-8% Inventory 19%
3%
1%
Reduce overdue debt
Improved commercial terms
-6%
Portfolio rationalisation
Other

Estimated growth in steel consumption CAGR 2011 – 2016
European Union - 27 3.7%
European Union - other 4.4%
CIS 4.5%
Russia 4.9%
North America 4.6%
South & Central America 4.2%
China 4.0%
India 7.0%
World 4.3%
ESAB markets are growing
Global steel
growth: 4.3%
CAGR 2011 to
2016
Drivers of steel
consumption
- Urbanisation
- Population growth
- Industrialisation
Charter International plc | 2011 Interim results presentation 33
Source: AME Group
Welding industry trends: positive for ESAB
Growth opportunities driven by customer requirements:
• Materials are getting lighter, stronger, thicker and thinner
• High performance products to meet extreme conditions
• Drive to increase productivity and automation to improve cost and quality
• Skills shortages encourage further automation
• Emphasis on service and reliability
Charter International plc | 2011 Interim results presentation 34
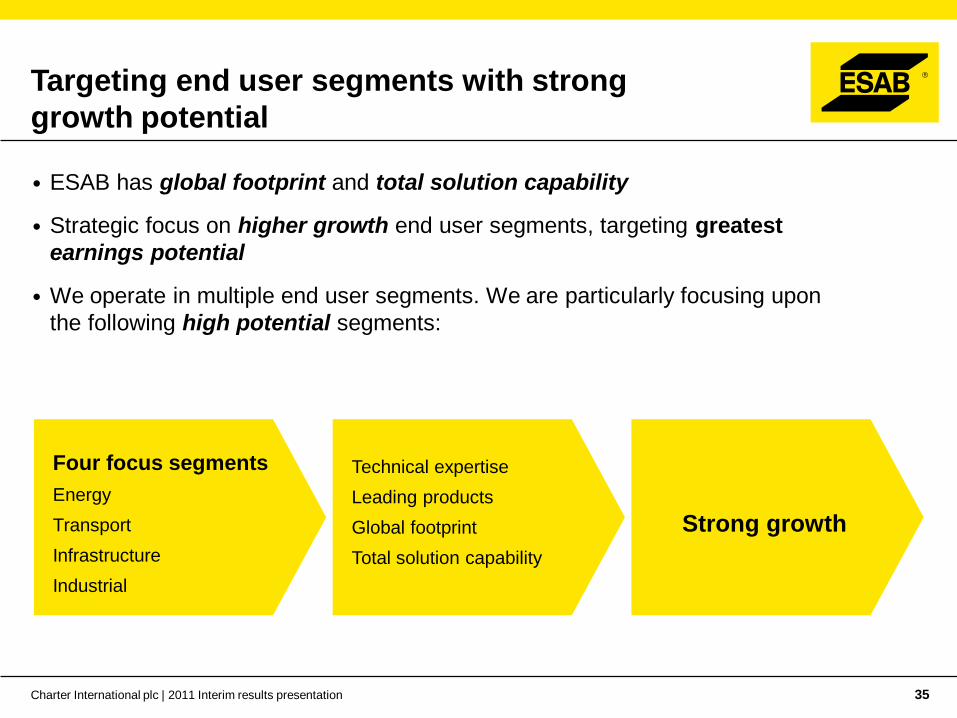
Four focus segments
Energy
Transport
Infrastructure
Industrial
Technical expertise
Leading products
Global footprint
Total solution capability
Strong growth
Targeting end user segments with strong
growth potential
• ESAB has global footprint and total solution capability
• Strategic focus on higher growth end user segments, targeting greatest
earnings potential
• We operate in multiple end user segments. We are particularly focusing upon
the following high potential segments:
Charter International plc | 2011 Interim results presentation 35
Source: Frost & Sullivan, 2010
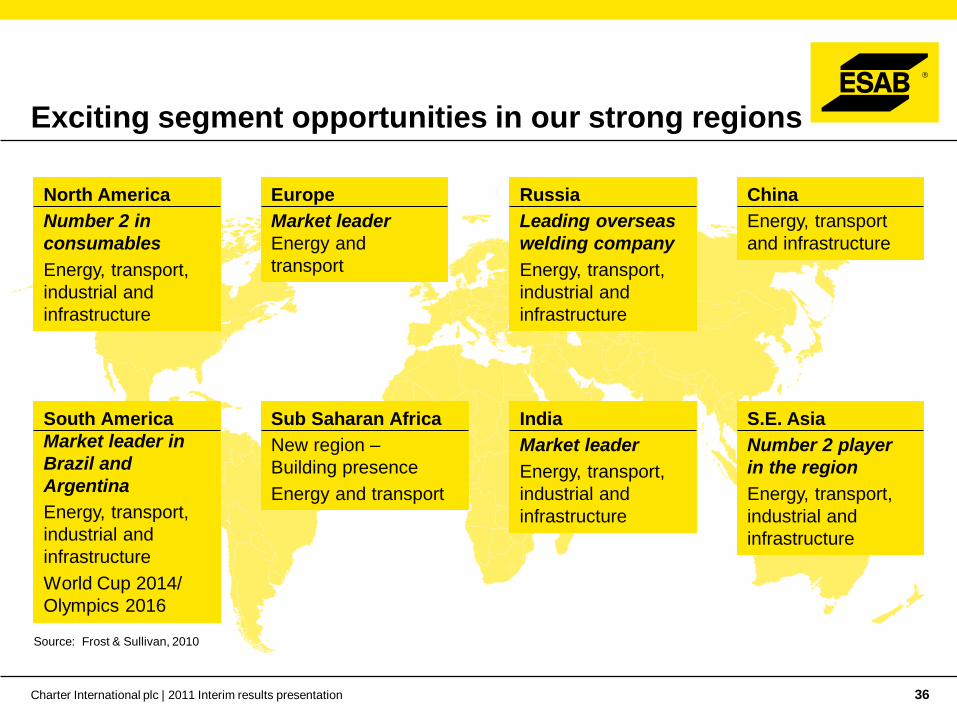
Exciting segment opportunities in our strong regions
North America
Number 2 in
consumables
Energy, transport,
industrial and
infrastructure
Europe
Market leader
Energy and
transport
Russia
Leading overseas
welding company
Energy, transport,
industrial and
infrastructure
China
Energy, transport
and infrastructure
India
Market leader
Energy, transport,
industrial and
infrastructure
S.E. Asia
Number 2 player
in the region
Energy, transport,
industrial and
infrastructure
Sub Saharan Africa
New region –
Building presence
Energy and transport
South America
Market leader in
Brazil and
Argentina
Energy, transport,
industrial and
infrastructure
World Cup 2014/
Olympics 2016
Charter International plc | 2011 Interim results presentation 36
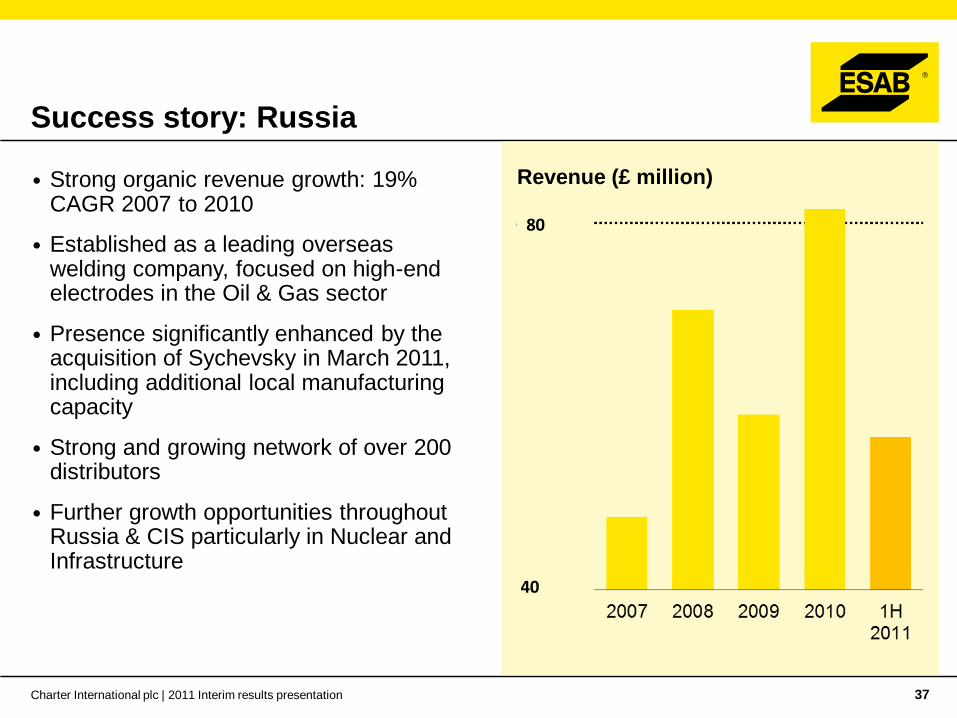
Success story: Russia
• Strong organic revenue growth: 19% CAGR 2007 to 2010
• Established as a leading overseas welding company, focused on high-end electrodes in the Oil & Gas sector
• Presence significantly enhanced by the acquisition of Sychevsky in March 2011, including additional local manufacturing capacity
• Strong and growing network of over 200 distributors
• Further growth opportunities throughout Russia & CIS particularly in Nuclear and Infrastructure
Revenue (£ million)
Charter International plc | 2011 Interim results presentation 37
80
40

ESAB
benefits
• Targeted energy and
offshore segments
• Grow share
• Improve margin
Customer
benefits
• Reduced energy
costs
• Increased
productivity
Growth from process evolution and innovation
Charter International plc | 2011 Interim results presentation 38
Electrode
Submerged Arc Wire
Solid Wire
Cored Wire
Submerged Arc Wire + ICE Aristorod
• ICE product launching in September
• Patent pending
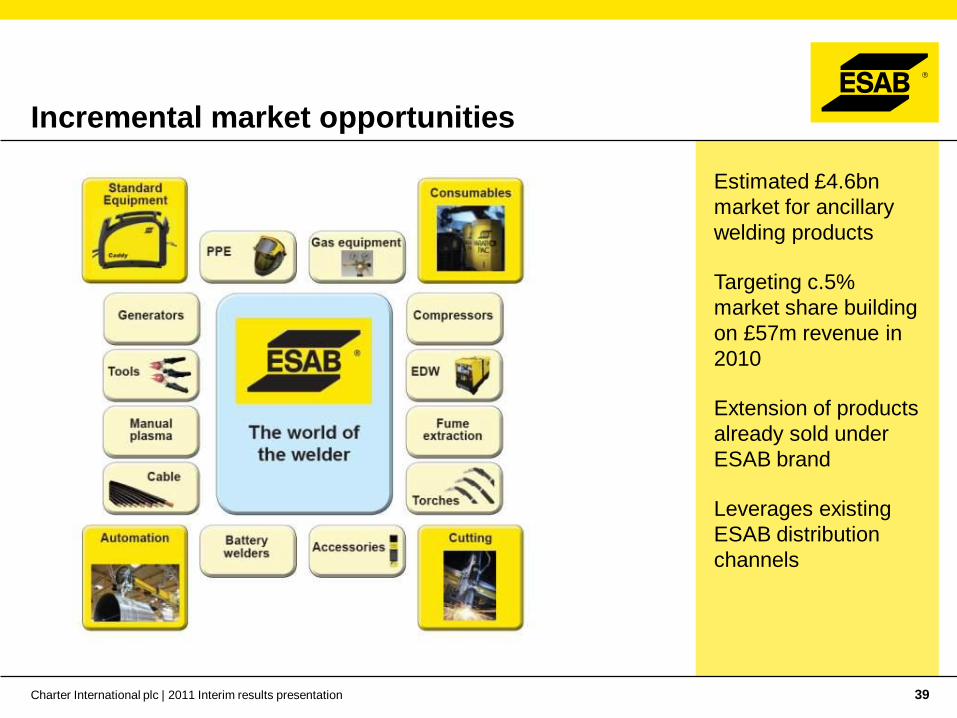
Incremental market opportunities
Estimated £4.6bn
market for ancillary
welding products
Targeting c.5%
market share building
on £57m revenue in
2010
Extension of products
already sold under
ESAB brand
Leverages existing
ESAB distribution
channels
Charter International plc | 2011 Interim results presentation 39

Developing our presence in South America
ESAB revenues in South America of
£242m in 2010, representing 21% of
ESAB revenue
ESAB grown strongly in Brazil and is a
leading player in South American
welding industry
Condor acquisition
A leading Gas Apparatus company in
Brazil
• Efficient manufacturing
• New products
• Available capacity
Synergies:
Sales channels
Supply chain
Charter International plc | 2011 Interim results presentation 40

Driving market share through enhanced
customer service
Strong world wide
platform
Increased
market share
Leading international products well known
and recognised in many geographies
Global reach trading in 122 countries, through
an extensive distribution network
Local presence of ESAB operations
Ability to offer complete range of welding
products
Industry acknowledged technical expertise
“Mastery of the welding arc” metallurgy and
chemistry
Best-in-class* and award winning technical
and customer service
Innovative, new product range
Enhanced customer
service
Charter International plc | 2011 Interim results presentation 41
* Frost & Sullivan Award

• Cost savings
• Focus on growth segments
• Product portfolio initiatives
• Supply chain and customer service
• Leverage from growth and cyclical recovery
Our path to 10% “through cycle” margin target
6.2%
10%
Charter International plc | 2011 Interim results presentation 42

New
European
Management
New Support
Functions
Team to deliver performance and transformation
ESAB now has its own dedicated CEO
New European leadership
Regions focused on delivering growth and business performance
Heads of Consumables and Equipment focused on driving portfolio development
New Supply Chain and Operations functions to drive operational excellence across the group
Brendan Colgan
CEO ESAB
ESAB
Geographic
Regions
Head of
Consumables
Products
Head of
Equipment
Products
ESAB
Supply Chain
ESAB
Operations
Charter International plc | 2011 Interim results presentation 43

Conclusion
Growth Leading positions and great potential
Margins Clear actions and initiatives to deliver improvement
Working capital Re-align and drive improved performance
Management Team to deliver transformation
Organic revenue
target:
10% CAGR
Adjusted operating
margin target:
10% “through cycle”
Working capital
target:
19% of revenue by end
of 2013
Charter International plc | 2011 Interim results presentation 44
Strategic Overview
Bob Cleland
CEO Howden
Agenda
Strategic objectives
Order book
Growth and margin improvement
• Market growth
• Aftermarket growth
• Compressors
• Execution and technical excellence
Summary
Charter International plc | 2011 Interim results presentation 46

Strategic objectives
Key strategic objectives underpin growth and margin targets:
• Organic revenue CAGR of 10%+
• Medium to long-term adjusted operating margin target of 14%
Charter International plc | 2011 Interim results presentation 47

Order intake: strong momentum
The last six months
have seen a
significant increase
in order intake
Rolling LTM order intake £m
400
450
500
550
600
650
700
Jan-1
0
Feb-1
0
Mar-
10
Apr-
10
May-1
0
Jun-1
0
Jul-10
Aug-1
0
Sep-1
0
Oct-
10
Nov-1
0
Dec-1
0
Jan-1
1
Feb-1
1
Mar-
11
Apr-
11
May-1
1
Jun-1
1
£m
Howden Thomassen
Charter International plc | 2011 Interim results presentation 48

Breakdown of increase in order intake
Increased order
intake reflects
successful
diversification of
Howden’s business
1H 2011 order intake vs. 1H 2010
Compressors
(Oil & Gas/Petrochem)
£22m
South Africa
Power/Mining/Environment
£13m
Australia (Mining)
£15m
Thomassen
£21m
Aftermarket
£24m
Denmark Power
£12m
Emerging Processes
£8m
N. America Transport
£4m
South America Steel / Industrial
£6m
China
£5m
Europe
£5m
Charter International plc | 2011 Interim results presentation 49

“Developed”
37% 40%
37%
“Emerging”
63%
60% 63%
Record order book
New equipment
order book -
130% of 2010 new
equipment sales
Thomassen –
£62m of the order
book, at end
1H 2011
Order book -
63% from emerging
markets
Charter International plc | 2011 Interim results presentation 50

Diversifying our end user base
Howden has
successfully
diversified away
from coal-fired
power generation
into new segments,
while maintaining
growth at a CAGR
of 10%
Charter International plc | 2011 Interim results presentation 51
¹ Pro forma for the acquisition of Thomassen
² In 2010, c.81% of Howden’s sales to the Oil & Gas / petrochemical industry were from compressors
³ In 2010, c.98% of Howden’s total sales in Coal power were fans and heat exchangers
Howden revenue 2005 vs. 2010 and 2010 Pro
Forma for Thomassen

Global energy, regulation and resources drive
our growth
Coal
- Estimated opportunity for Howden in
2010 of c£600m
- Coal is the dominant fuel for electricity
generation with a 41% share in 2008*
- China and India will dominate
- Howden is a market leader in fans and
rotary heat exchangers
Oil & Gas
- Estimated opportunity for Howden in
2010 (including Thomassen) of c£1.9bn
- Worldwide oil demand estimated to rise
by 1.5mb/d in 2012
- Howden compressors used upstream
and downstream
World primary energy demand by fuel
(Mtoe)
* Source: World Energy Outlook 2010© OECD/IEA, 2010
Charter International plc | 2011 Interim results presentation 52
CAGR
1980 -
2008
CAGR
2008 -
2035
2.0% 2.5%
4.9% 2.2%
2.7% 1.4%
1.0% 0.5%
2.2% 0.6%
* Source: World Energy Outlook 2010© OECD/IEA, 2010
Global energy, regulation and resources
drive our growth (cont.)
South African Air Quality Act (effective from 1st April 2010) • Potential £1bn+ opportunity over the next 10 to 15 years
• Howden products – Fabric Filters, Booster Fans, Gas Scrubbers
US Emission Control Legislation • c.£300m opportunity over five years from 2012 • New US EPA rules - a significant market with up to 73GW (20% of the coal fleet)
requiring upgrading
Mining • c. £200m per annum opportunity • Rising demand for coal and strong precious metal prices are key market drivers • Howden Products – Ventilation fans and mine cooling plant
Iron & Steel • c. £60 million per annum opportunity • Iron ore price reached all time high of $178/tonne – one of the drivers being Chinese
consumption • Requirement is for large heavy duty fans for sinter and pellet plants
Charter International plc | 2011 Interim results presentation 53

0
50
100
150
200
250
2006 2007 2008 2009 2010
£m
Aftermarket: continued target of 10%+ CAGR
Aftermarket
business is
expected to
continue to grow at
10%+ CAGR
Aftermarket
revenue grew by
22% in 1H 2011
versus 1H 2010,
12% excluding
Thomassen
Charter International plc | 2011 Interim results presentation 54
Howden aftermarket revenue development £m
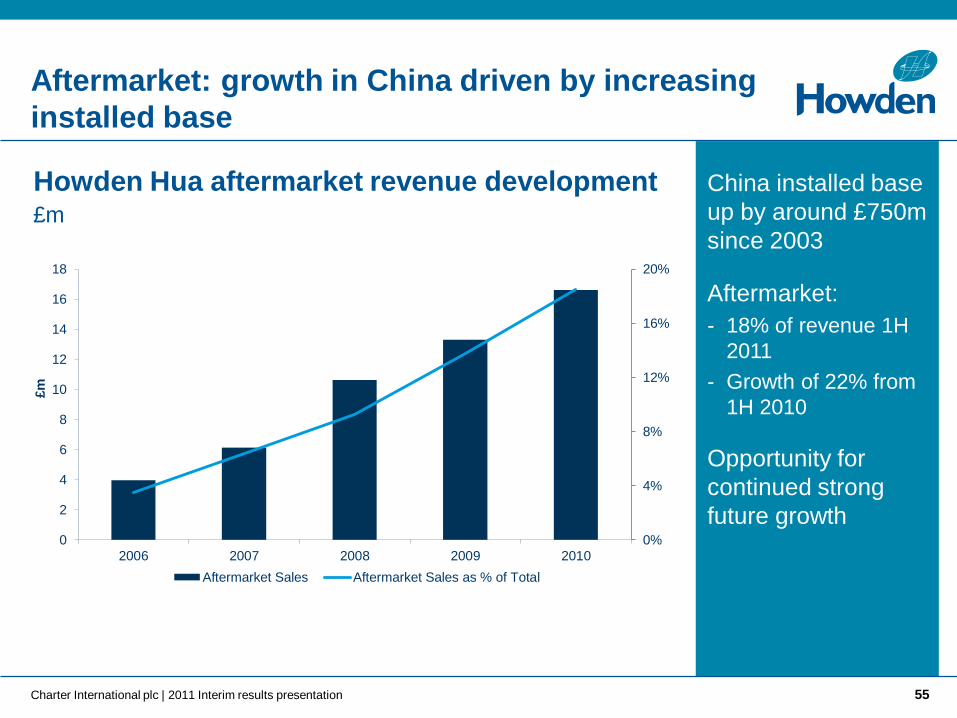
Aftermarket: growth in China driven by increasing
installed base
China installed base
up by around £750m
since 2003
Aftermarket:
- 18% of revenue 1H
2011
- Growth of 22% from
1H 2010
Opportunity for
continued strong
future growth
Howden Hua aftermarket revenue development £m
Charter International plc | 2011 Interim results presentation 55
0%
4%
8%
12%
16%
20%
0
2
4
6
8
10
12
14
16
18
2006 2007 2008 2009 2010
£m
Aftermarket Sales Aftermarket Sales as % of Total
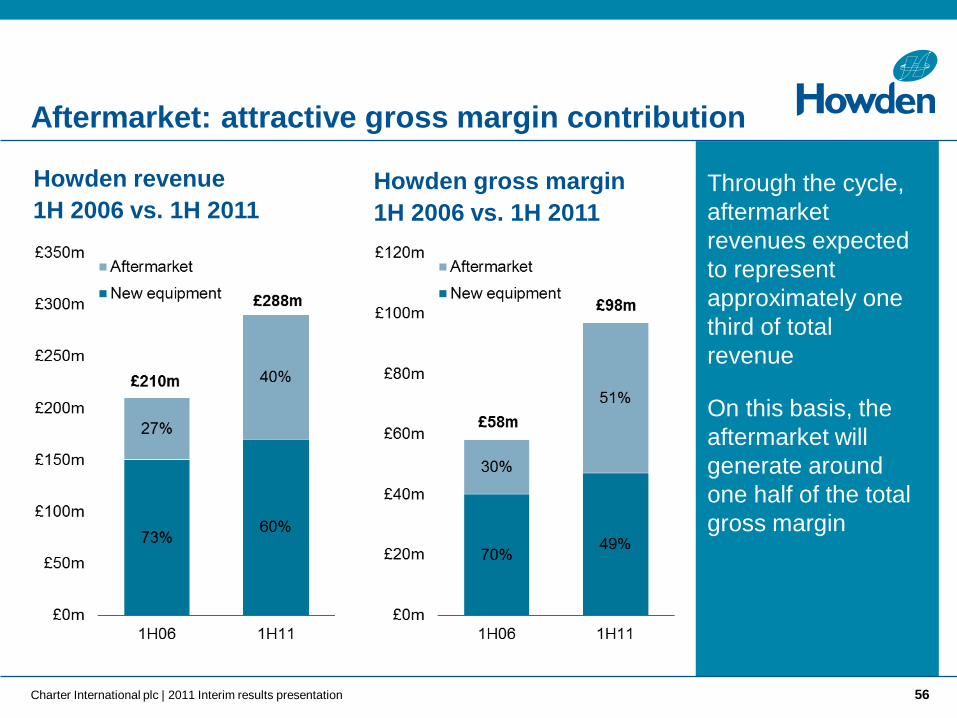
Aftermarket: attractive gross margin contribution
Through the cycle,
aftermarket
revenues expected
to represent
approximately one
third of total
revenue
On this basis, the
aftermarket will
generate around
one half of the total
gross margin
Charter International plc | 2011 Interim results presentation 56
Howden revenue
1H 2006 vs. 1H 2011
Howden gross margin
1H 2006 vs. 1H 2011

Significant expansion of compressor business
Expansion of compressor
business achieved through:
Geographic development
- A leading position in emerging markets
(c.75% of 2010 pro forma sales,
including Thomassen)
Product development - £3m invested
in current projects
Acquisitions - including Thomassen
in March 2011 0
50
100
150
200
250
2006 2007 2008 2009 2010 PF
Howden Thomassen
Howden compressor revenue £m
Charter International plc | 2011 Interim results presentation 57
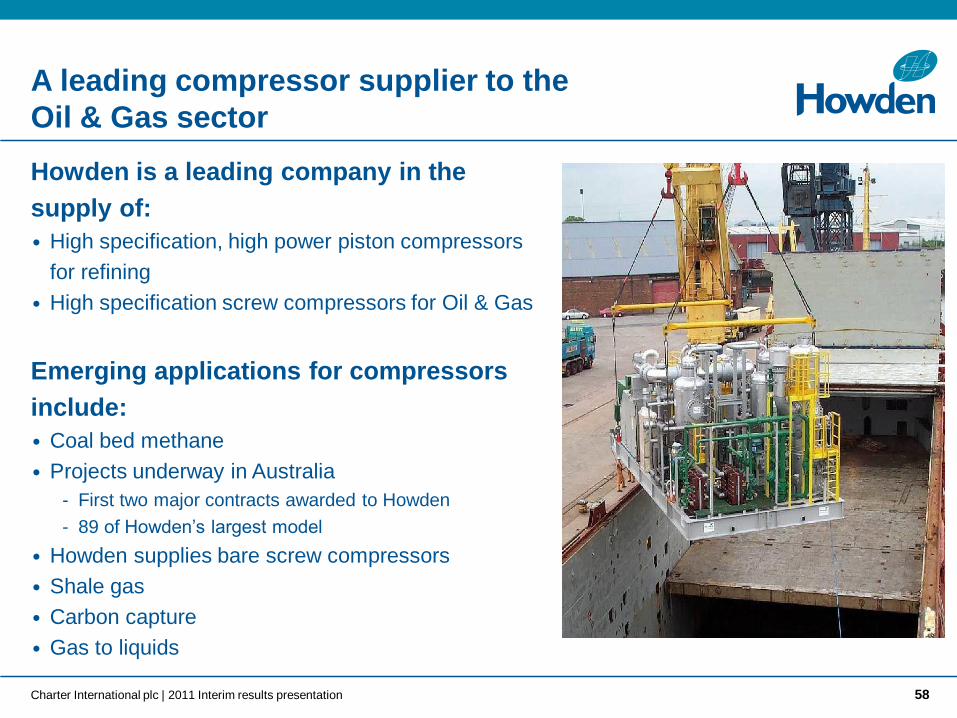
A leading compressor supplier to the
Oil & Gas sector
Howden is a leading company in the
supply of:
• High specification, high power piston compressors
for refining
• High specification screw compressors for Oil & Gas
Emerging applications for compressors
include:
• Coal bed methane
• Projects underway in Australia
- First two major contracts awarded to Howden
- 89 of Howden’s largest model
• Howden supplies bare screw compressors
• Shale gas
• Carbon capture
• Gas to liquids
Charter International plc | 2011 Interim results presentation 58

Acquisition of Thomassen Compression Systems –
ahead of expectations
Acquired in March 2011 for a consideration of €100 million, debt funded
• Strong product and geographic fit; combined group has full piston compressor product range and global coverage
• Aftermarket approximately a third of revenue
• Financial benefits:
- Expected to enhance earnings per share from
2011 onwards¹
- Expected to at least match Charter’s cost of
capital in 2012 and to be value enhancing
thereafter
- Synergies amounting to at least £5m per annum
by 2014
• Integration is progressing to plan and financial performance is ahead of budget
Charter International plc | 2011 Interim results presentation 59
¹ This statement should not be interpreted to mean that earnings per share will necessarily be
greater than in 2010

Growth strategy: well positioned in
BRIC economies
Current order book
China Howden has been present in China since 1994
5 plants; 900 employees; 235 graduate engineers
1H 2011 performance ahead of budget
£122m
India JV with Larsen & Toubro winning power market contracts
Strong opportunities in steel and Oil & Gas
£49m
Brazil New facility opened in 2010 – Strong order book
Thomassen strengthens position in Oil & Gas
£32m
Russia & CIS Thomassen strengthens position in Oil & Gas £25m
BRIC total £228m
Charter International plc | 2011 Interim results presentation 60

Growth strategy: focus on resource rich
Africa and Australia
Charter International plc | 2011 Interim results presentation 61
Current order book
Africa Supplier to ESKOM (RSA – power utility)
BEE certified
Opportunities for deep mining throughout Africa
£76m
Australia Mining
Coal-bed methane
Compressor packages for Oil & Gas applications
£20m
Total £96m

Execution and supply chain
excellence drives margin improvement
New build project margins improved
by over 5 percentage points since
2008 through execution excellence:
- International supply chain
- LEAN programme
- Contract management
Strong operational flexibility:
- Subcontractors account for
approximately 50% of man-hours with
growing footprint in emerging markets
New build project margin progression
Charter International plc | 2011 Interim results presentation 62
22.9%
25.1%
25.9%
28.2%
20
21
22
23
24
25
26
27
28
29
2008 2009 2010 1H11
%
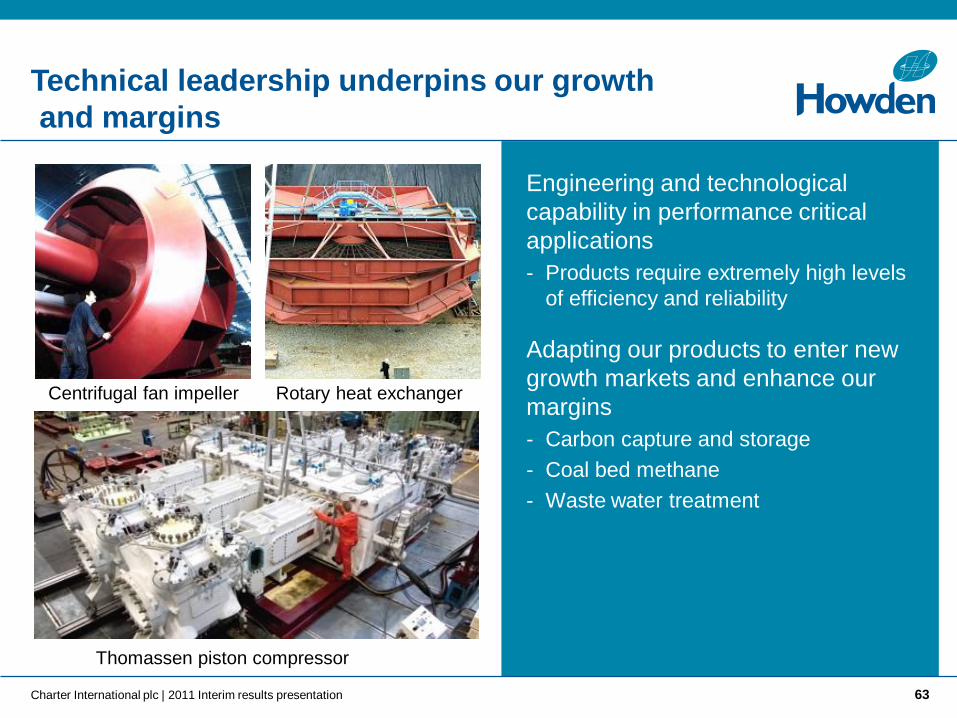
Technical leadership underpins our growth
and margins
Engineering and technological
capability in performance critical
applications
- Products require extremely high levels
of efficiency and reliability
Adapting our products to enter new
growth markets and enhance our
margins
- Carbon capture and storage
- Coal bed methane
- Waste water treatment
Centrifugal fan impeller Rotary heat exchanger
Thomassen piston compressor
Charter International plc | 2011 Interim results presentation 63

Investment in overhead to support strategic growth
£m 2007 2010
Business development 0.7 4.1
Product/process 0.1 1.2
Global strategic initiatives - 5.0
Global infrastructure 4.0 10.5
Divisional infrastructure - 3.2
Total 4.8 24.0
Net increase + 19.2
Howden has been
investing in its
overhead to support
future growth and
£1bn revenue
target adopted in
2007
Limited incremental
overheads will be
required for
planned future
growth
Charter International plc | 2011 Interim results presentation 64

Medium to long-term margin improvement target
Howden’s objective is to achieve an adjusted operating margin
of 14 per cent in the medium to long-term
• Based on aftermarket remaining approximately one third of total revenue
• Howden’s target is to deliver improved adjusted operating margins principally reflecting the following:
Improved margins from Thomassen synergies 0.4%
Supply chain and LEAN manufacturing 0.5%
Operational leverage 1.5%
Total adjusted margin improvement 2.4%
Charter International plc | 2011 Interim results presentation 65

Strong and consistent cash generation
Note: Cash conversion is defined as operating cash flow divided by adjusted operating profit
Low working capital
and strong cash
conversion
- Supply Chain sub-
contracting model
- Stage payments
through contract life
Cash conversion
Charter International plc | 2011 Interim results presentation 66
85% 91%
83%
2008 2009 2010

Strategic objectives
Organic revenue CAGR of 10%+
Medium to long-term adjusted
operating margin target of 14%
Summary: strategic objectives
Howden’s key strategic objectives underpin our growth and
margin targets:
Key Drivers
End-user diversification
Aftermarket revenue growth
Capitalise on strength in compressors
Further development in BRICs and
other emerging markets
Focus on resource driven economies -
South Africa, Australia
Further development of contract
execution and supply chain
Charter International plc | 2011 Interim results presentation 67

Outlook
“The Board of Charter is confident in the full year performance of the Company.
ESAB's second half outlook remains unchanged with the Board confident of performance in line with its previous expectations. Howden performed well in the first half of the year and the substantial growth in its order book in this period underpins a robust second half performance.
Looking forward to 2012, the Board believes that both businesses are well set to make further material progress. For ESAB, the benefits of its restructuring programme will materially enhance performance. We expect Howden to benefit from its current momentum, most obviously evidenced by its growing order book and the strong performance of newly acquired Thomassen.
For the medium to longer term, the Board believes that it has two attractively-positioned global businesses with substantial exposure to emerging markets and growing end-user industries. Both businesses are implementing plans to deliver growth and margin enhancement. ESAB is strongly positioned to recover going forward. Howden is set to continue its current growth and is well placed to benefit from recent investment in its business.
We look to the future with confidence.”
Charter International plc | 2011 Interim results presentation 68

Concluding comments
Two global businesses with market-leading positions
Strong opportunities for growth
Clear path to margin enhancement
Focus on cash conversion
Full range of strategic options being explored to maximise
shareholder value
Charter International plc | 2011 Interim results presentation 69

Q&A

Appendix

Currency translation effects
6 months ended 30 June
As reported
2011
£m
Underlying
movement at
constant
exchange
2010
translated at
2011
Exchange
Currency
Fluctuations
As reported
2010
£m
Revenue
ESAB 658.7 98.3 560.4 1.6 558.8
Howden 287.8 5.4 282.4 0.8 281.6
Total revenue 946.5 103.7 842.8 2.4 840.4
ESAB 40.8 (9.8) 50.6 0.5 50.1
Howden 38.9 10.0 28.9 0.1 28.8
Central companies (4.5) 1.7 (6.2) - (6.2)
Adjusted operating profit 75.2 1.9 73.3 0.6 72.7
Charter International plc | 2011 Interim results presentation 72

Adjusting items
2011 2010
Earnings
Earnings
per share Earnings
Earnings
per share
6 months ended 30 June £m pence £m pence
Unadjusted results 32.3 19.3 50.8 30.4
Exceptional items
Restructuring 17.2 10.3 7.9 4.7
Post retirement benefit post service credit (6.2) (3.7) - -
Post retirement benefit curtailment gain - - (8.5) (5.1)
Acquisition costs 1.6 1.0 0.1 0.1
Amortisation and impairment of acquired goodwill
and intangibles 21.8 13.1 3.9 2.3
Net finance charge – retirement benefit obligations 0.8 0.5 2.1 1.3
Retranslation of intercompany loan balances (7.1)) (4.3) (1.9) (1.1)
Taxation on adjusting items (3.1) (1.9) 0.5 0.3
Minority share of adjusting items (1.2) (0.7) (0.1) (0.1)
Adjusted results 56.1 33.6 54.8 32.8
Charter International plc | 2011 Interim results presentation 73
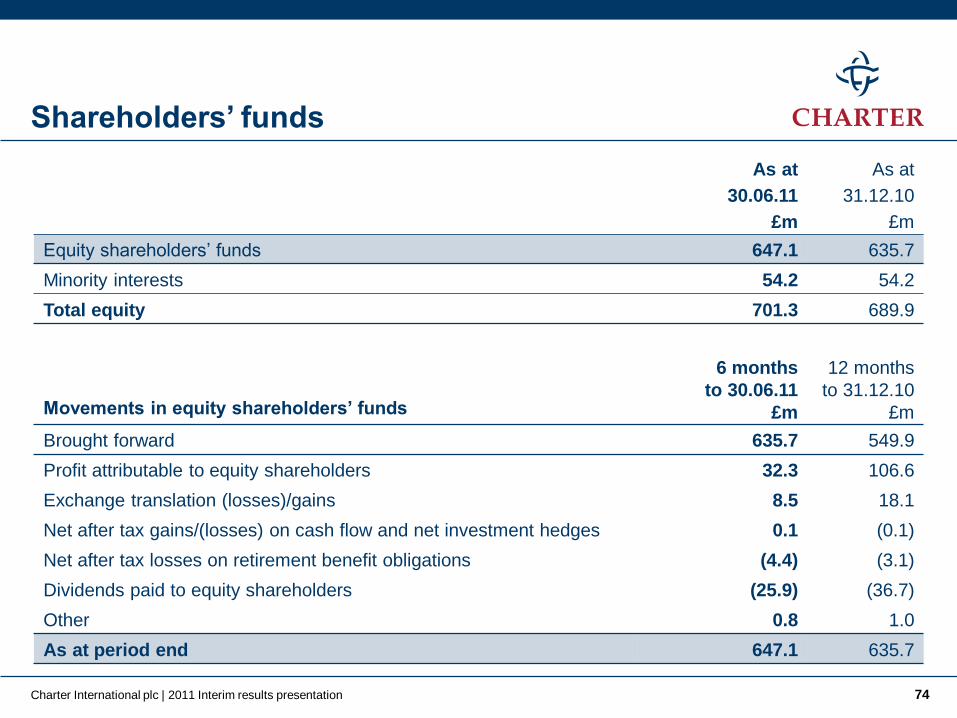
Shareholders’ funds
As at As at
30.06.11 31.12.10
£m £m
Equity shareholders’ funds 647.1 635.7
Minority interests 54.2 54.2
Total equity 701.3 689.9
Movements in equity shareholders’ funds
6 months
to 30.06.11
£m
12 months
to 31.12.10
£m
Brought forward 635.7 549.9
Profit attributable to equity shareholders 32.3 106.6
Exchange translation (losses)/gains 8.5 18.1
Net after tax gains/(losses) on cash flow and net investment hedges 0.1 (0.1)
Net after tax losses on retirement benefit obligations (4.4) (3.1)
Dividends paid to equity shareholders (25.9) (36.7)
Other 0.8 1.0
As at period end 647.1 635.7
Charter International plc | 2011 Interim results presentation 74

* Excluded from calculation of adjusted earnings per share
** Experience adjustment on plan assets and liabilities, plus changes in assumptions in relation to plan liabilities
6 months to 12 months to
30.06.11 31.12.10
£m £m
Net opening balance 138.7 (162.2)
Income statement
Operating profit 5.4 8.3
Net finance charge – retirement benefit obligations* (0.8) (4.1)
4.6 4.2
Net actuarial losses** (5.7) 1.0
Exchange adjustments (1.1) (3.0)
Contributions paid 9.0 21.3
Acquisitions (0.2) -
Net movement during the period 6.6 23.5
Net closing balance (132.1) (138.7)
Fair value of plan assets 602.0 594.2
Net retirement benefit obligations
Charter International plc | 2011 Interim results presentation 75
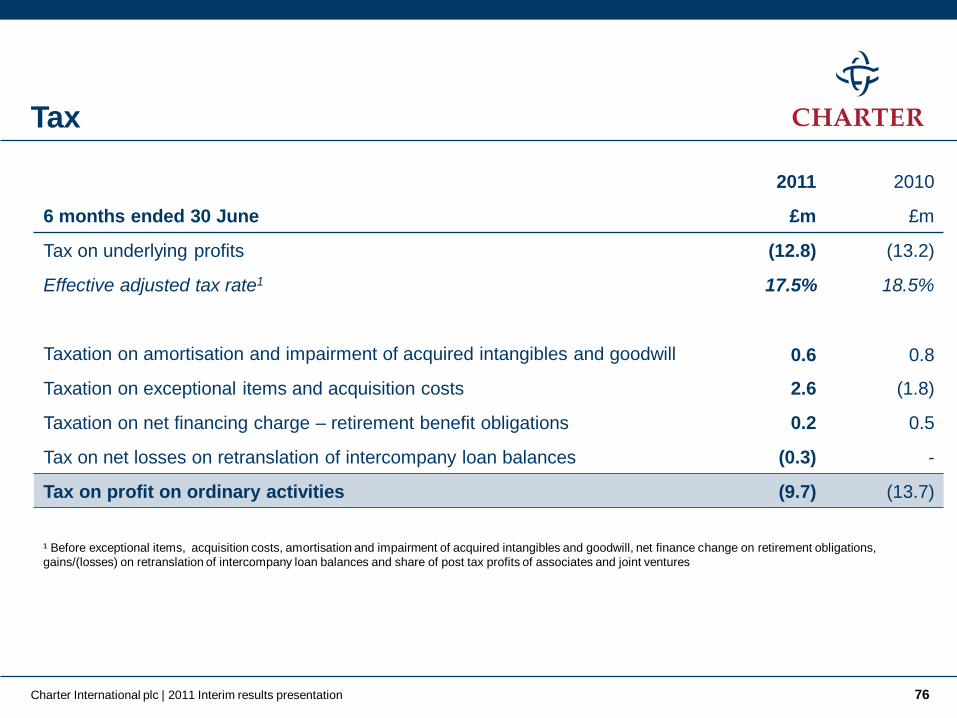
Tax
¹ Before exceptional items, acquisition costs, amortisation and impairment of acquired intangibles and goodwill, net finance change on retirement obligations,
gains/(losses) on retranslation of intercompany loan balances and share of post tax profits of associates and joint ventures
2011 2010
6 months ended 30 June £m £m
Tax on underlying profits (12.8) (13.2)
Effective adjusted tax rate1 17.5% 18.5%
Taxation on amortisation and impairment of acquired intangibles and goodwill 0.6 0.8
Taxation on exceptional items and acquisition costs 2.6 (1.8)
Taxation on net financing charge – retirement benefit obligations 0.2 0.5
Tax on net losses on retranslation of intercompany loan balances (0.3) -
Tax on profit on ordinary activities (9.7) (13.7)
Charter International plc | 2011 Interim results presentation 76

Net working capital movement
Charter International plc | 2011 Interim results presentation 77
£m
Net working capital as at 1 January 2011 365.7
Acquisitions 15.6
Exchange 6.9
Cash flow - working capital 57.4
Cash flow - other (1.3)
Net working capital as at 30 June 2011 444.3
New senior management: detailed biographies
Charter International plc | 2011 Interim results presentation 78
Gareth Rhys Williams
Chief Executive, Charter
Over 25 years experience in the industrial sector. From 2001 to 2008 he was CEO of Vitec Group plc, where he
delivered significant shareholder value by restructuring and growing the business both organically and through
acquisition and by expansion into faster growing markets.
Recruited by Candover in July 2008 to manage Capital Safety Group Ltd, one of the world’s leading fall protection
businesses, he joined at a time of shrinking order books and profitability. By improving factory performance and
customer focus, and by driving product innovation he turned the business around and returned it to growth, before
leaving when Candover transitioned to Arle Capital Partners.
Originally trained as an engineer, he gained his MBA from INSEAD, following which he ran a number of business
units for Bowater, now Rexam, between 1990 and 1996, in the UK and US, before moving to BPB plc where he was
responsible for Central Europe.
He is a fellow of the Institution of Mechanical Engineering and of the Institution of Engineering and Technology, and a
Companion of the Chartered Management Institute.

New senior management: detailed biographies
Brendan Colgan
Chief Executive, ESAB
Appointed Chief Executive of ESAB in June 2011;
before that he was Managing Director of Strategy &
Development for ESAB Global with executive
responsibility for China, North & South East Asia, Sub-
Saharan Africa, the Middle East and North America.
Previously CEO of ESAB North America, where he
delivered rehabilitation of the Consumables
manufacturing operations. Focused the organisation on
securing growth, margin improvement as well as end to
end supply chain improvements to customer service
and working capital.
Spent ten years at Howden, with management roles
globally, including UK (contract execution & margin
management); Mexico (power market contract
execution); Australia and Asia and North America
(restructuring and turnarounds to improve margins,
financial integrity and performance).
Degree in accounting from the University of Ulster, is a
Harvard AMP Graduate and a Fellow of The Chartered
Institute of Management Accountants.
Charter International plc | 2011 Interim results presentation 79
Ian Brander
Chief Executive, Howden (as of 1st August)
Joined Howden in 1983. Worked first in design, then
engineering management and project management. Held
a number of General Management positions in Howden
from 1994 to 2006 including 8 years in the compressor
business. Appointed Technology Director in 2006 and
member of the Howden Board in 2007.
Appointed Operations Director of Howden in 2008. From
long and varied experience in Howden Ian has extensive
knowledge of its products, markets, customers and
operations. Graduated from the University of Strathclyde
in Mechanical Engineering.