2011 interim report - restaurant brands · 2011 interim report ... consumer sentiment is not...
TRANSCRIPT

1
2011 Interim ReportHalf Year Ended
13 September 2010

2
3
Key Points
» Net profit after tax for the half year (excluding non-trading items) was $13.9 million (50.3% up on prior year). Reported profit (including non-trading items) was $13.5 million, up 51.9% on prior year.
» Total revenues of $176.6 million were 3.9% up on prior year, with same store sales up 4.9% for the half, still driven primarily by KFC.
» Earnings strongly improved across all three brands to a total EBITDA of $34.0 million, an increase of $6.4 million (or 23.3%) on the previous half year as the benefits of improving sales, higher efficiencies and reduced input costs flowed through.
» Directors have declared a fully imputed interim dividend payable on 26 November 2010 of 7.0 cents per ordinary share, up 55.6% on last year.

2
Group Operating ResultsRestaurant Brands’ unaudited net profit after tax (excluding non-trading items) for the half year ended 13 September 2010 was $13.9 million, a 50.3% increase on the prior year’s result of $9.2 million. Reported profit was $13.5 million (13.8 cents per share), 51.9% up on prior year.
All three brands recorded higher profits, with KFC EBITDA up $4.8 million (20.1%), Pizza Hut improving by $0.9 million (42.5%) and Starbucks Coffee up $0.6 million (47.9%).
Some leverage from higher sales (in the case of KFC), some gains from closures of poorer performing stores (in the case of Pizza Hut and Starbucks Coffee) and improved operational efficiencies and lower input prices across all three brands contributed to the enhanced result. Total brand EBITDA was up $6.4 million (23.3%) on the previous half year.
Total operating revenue at $176.6 million was 3.9% up on prior year, with KFC sales growth of $8.8 million partially offset by a decline in Pizza Hut and Starbucks Coffee sales of $1.6 million and $0.6 million respectively. Overall total group same store sales however continued to grow at 4.9%.
Directors are pleased with the continuing improvement in performance with the $4.7 million (50.3%) increase in profit for this half year rolling over a $4.4 million (89.4%) improvement in the 2009/10 half year.
Net Profit After Tax (NPAT) ($NZm) 1H 2009 1H 2010 1H 2011
NPAT including non-trading items 2.6 8.9 13.5
NPAT excluding non-trading items 4.9 9.2 13.9
strong result
strongresult
3
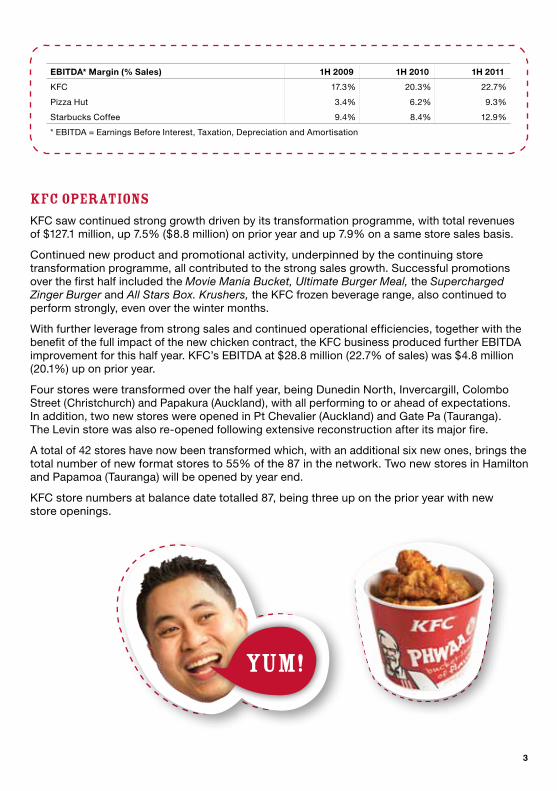
KFC OperationsKFC saw continued strong growth driven by its transformation programme, with total revenues of $127.1 million, up 7.5% ($8.8 million) on prior year and up 7.9% on a same store sales basis.
Continued new product and promotional activity, underpinned by the continuing store transformation programme, all contributed to the strong sales growth. Successful promotions over the first half included the Movie Mania Bucket, Ultimate Burger Meal, the Supercharged Zinger Burger and All Stars Box. Krushers, the KFC frozen beverage range, also continued to perform strongly, even over the winter months.
With further leverage from strong sales and continued operational efficiencies, together with the benefit of the full impact of the new chicken contract, the KFC business produced further EBITDA improvement for this half year. KFC’s EBITDA at $28.8 million (22.7% of sales) was $4.8 million (20.1%) up on prior year.
Four stores were transformed over the half year, being Dunedin North, Invercargill, Colombo Street (Christchurch) and Papakura (Auckland), with all performing to or ahead of expectations. In addition, two new stores were opened in Pt Chevalier (Auckland) and Gate Pa (Tauranga). The Levin store was also re-opened following extensive reconstruction after its major fire.
A total of 42 stores have now been transformed which, with an additional six new ones, brings the total number of new format stores to 55% of the 87 in the network. Two new stores in Hamilton and Papamoa (Tauranga) will be opened by year end.
KFC store numbers at balance date totalled 87, being three up on the prior year with new store openings.
EBITDA* Margin (% Sales) 1H 2009 1H 2010 1H 2011
KFC 17.3% 20.3% 22.7%
Pizza Hut 3.4% 6.2% 9.3%
Starbucks Coffee 9.4% 8.4% 12.9%
* EBITDA = Earnings Before Interest, Taxation, Depreciation and Amortisation
KFC BUCKET
YUM!
4
Pizza HutPizza Hut saw a continuation of the strong earnings growth that commenced in 2009. The EBITDA of $3.1 million for the half year increased $0.9 million or 42.5% on last year (which was 85.9% up on the year before). Pizza Hut EBITDA margin hit 9.3% of sales, driven by strong operational controls over wastage and labour, loss prevention initiatives, changes to menu with higher margin products and closures of unprofitable stores.
Total sales were down over the period with a drop of $1.6 million (4.6%) to $33.8 million. This was a function of lower store numbers with closures of three loss making red roof restaurants. Same store sales were down 2.9%.
Pizza Hut finished the half with 88 stores of which four were red roof restaurants.
A number of new products were released over the half, including the very successful Big New Yorker pizza, Garlic Bites pizza and Cheesy Garlic Bread. There were also a number of new flavour variants introduced such as BBQ Smokehouse and Angus Beef. The re-launch of the More-4-All and Pizza Mia pizzas also contributed to overall sales.
The Pizza Hut store sell down programme continues with the first store (Nelson) sold after balance date and one further expected to be sold before the end of November.
Starbucks CoffeeContinued improvements in operating efficiencies, the benefit of a strong exchange rate and the closure of some poor performing stores all assisted in enhancing profitability for the Starbucks Coffee operation. The business produced a solid EBITDA of $2.0 million for the half, up $0.6 million or 47.9% on last year. The Starbucks EBITDA margin as a % of sales is now running at 12.9%.
Sales were down by $0.6 million or 3.8% on last year with three less stores, but rose 0.5% on a same store basis, returning to positive growth in the second quarter after five quarters of decline. Sales for the half year totalled $15.5 million.
Store numbers were 39 at balance date, three down on prior year.
PIZZA HUT BOX
STARBUCKSHOT CUP

5
Corporate & OtherGeneral and administration expenses at $7.2 million were marginally ($0.2 million) up on the prior half year. There have been some minor headcount increases as the underlying businesses have grown, and higher levels of incentive payments as the company enjoys higher levels of profitability. G&A costs, however, represent just over 4% of total revenues, within acceptable limits.
Interest expense at $0.6 million continues to fall ($0.2 million down) against prior year as a result of lower debt levels, despite some increase in interest rates.
The company renewed its facility (reduced to $35 million) with Westpac Banking Corporation for a further two years commencing 10 September.
Non-Trading CostsNon-trading items of $0.6 million primarily comprised asset write offs and make good costs on store closures, partly offset by insurance proceeds received for the KFC Levin store rebuild.
Cash Flow & Balance SheetTotal assets at $114.6 million were $11.6 million higher than the previous year end, with property, plant and equipment at $83.0 million versus $73.4 million, mainly as a result of the acceleration in KFC transformation expenditure. There were no substantial write downs on intangibles as all three brands continued to maintain enterprise values well in excess of their carrying values.
Total liabilities at $59.8 million were $5.5 million down on the full year balance, with total bank debt down $5.1 million to $12.6 million. Creditors and accruals, however, were up by $11.3 million with the timing of creditor payments (20th of the month) contributing to the significant increase.
Debt has been re-classified as non-current with the renewal of the bank facility on 10 September for a further two years.
Operating cash flows of $26.0 million were slightly up on the previous half year’s $23.4 million and in line with the improved profitability and timing differences in creditors’ payments.
Cash outflows from investing activities were significantly up on the previous half year, mainly because of KFC transformation expenditure. They totalled $13.4 million compared with $4.5 million for the first half last year.
Higher levels of dividend impacted financing cash flows with $7.8 million paid to shareholders over the half year versus $3.9 million in the previous half.
6
DividendThe improved profit performance and stronger balance sheet have led directors to declare an interim dividend of 7.0 cents per share (55.6% up on last year).
The dividend will be paid on Friday 26 November 2010 to all shareholders on the register at 5pm on Friday 12 November 2010. For overseas shareholders, a supplementary dividend of 1.2353 cents per share will be paid at the same time.
Directors have elected to continue to suspend the dividend reinvestment plan for the time being, but will review this again prior to the declaration of a final dividend.
OutlookWhilst Restaurant Brands has continued to enjoy solid profit growth in the first half of the year, directors re-affirm their previous guidance; that the company will make a full year profit (excluding non-trading items) of $24-26 million for the 2010/11 year.
Economic storm clouds still remain on the horizon and the full impact of the GST increase versus lower direct tax rates has yet to work through into consumer spending. Consumer sentiment is not bullish.
The KFC business will continue to deliver solid profits into the second half year; it will, however, be rolling over some very strong second half results from the prior year. Pizza Hut will maintain the operational improvements of the first half, but will see some input price increases. Continued improvement in Starbucks Coffee sales is also expected towards the end of the financial year; however, margin growth will be limited by input price increases.
KFC transformation spend will continue with another four stores to be transformed (and two new stores opened) by year end. Pizza Hut stores will continue to be sold to franchisees over the balance of the year.
NPAT for the second half of the current year will be consistent with the 2009/10 half year result.
Sales First Half (NZ$m) 1H 2006 1H 2007 1H 2008 1H 2009 1H 2010 1H 2011
KFC 90.8 95.8 106.2 110.4 118.2 127.1
Pizza Hut 49.9 44.1 40.5 34.6 35.4 33.8
Starbucks Coffee 14.3 16.3 17.4 17.3 16.1 15.4
Total Store Sales 155.0 156.2 164.1 162.3 169.7 176.3

7
8
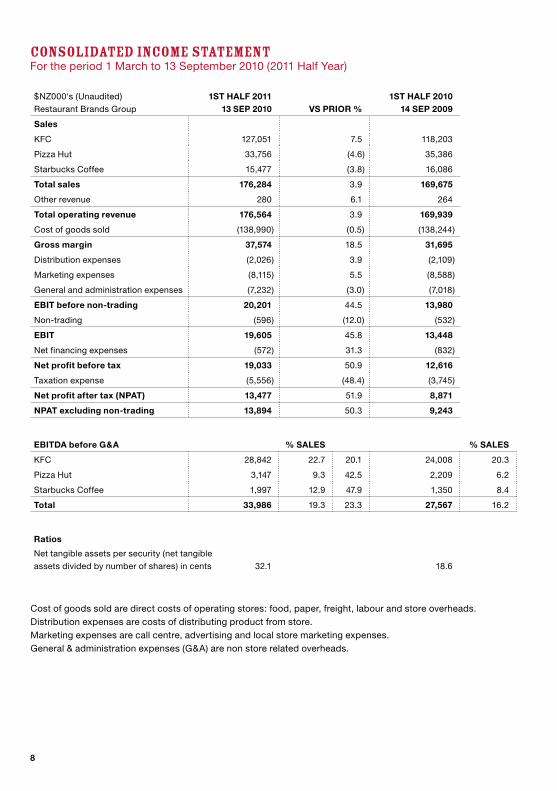
$NZ000's (Unaudited)
Restaurant Brands Group
1ST HALF 2011 13 SEP 2010 VS PRIOR %
1ST HALF 2010 14 SEP 2009
Sales
KFC 127,051 7.5 118,203
Pizza Hut 33,756 (4.6) 35,386
Starbucks Coffee 15,477 (3.8) 16,086
Total sales 176,284 3.9 169,675
Other revenue 280 6.1 264
Total operating revenue 176,564 3.9 169,939
Cost of goods sold (138,990) (0.5) (138,244)
Gross margin 37,574 18.5 31,695
Distribution expenses (2,026) 3.9 (2,109)
Marketing expenses (8,115) 5.5 (8,588)
General and administration expenses (7,232) (3.0) (7,018)
EBIT before non-trading 20,201 44.5 13,980
Non-trading (596) (12.0) (532)
EBIT 19,605 45.8 13,448
Net financing expenses (572) 31.3 (832)
Net profit before tax 19,033 50.9 12,616
Taxation expense (5,556) (48.4) (3,745)
Net profit after tax (NPAT) 13,477 51.9 8,871
NPAT excluding non-trading 13,894 50.3 9,243
EBITDA before G&A % SALES % SALES
KFC 28,842 22.7 20.1 24,008 20.3
Pizza Hut 3,147 9.3 42.5 2,209 6.2
Starbucks Coffee 1,997 12.9 47.9 1,350 8.4
Total 33,986 19.3 23.3 27,567 16.2
Ratios
Net tangible assets per security (net tangible
assets divided by number of shares) in cents 32.1 18.6
CONSOlIDATED INCOME STATEMENTFor the period 1 March to 13 September 2010 (2011 Half Year)
Cost of goods sold are direct costs of operating stores: food, paper, freight, labour and store overheads. Distribution expenses are costs of distributing product from store. Marketing expenses are call centre, advertising and local store marketing expenses. General & administration expenses (G&A) are non store related overheads.

GROUP GROUP
2011 Half Year
Unaudited
2010 Half Year
Unaudited
2010 Full Year
AuditedNote
$NZ000's
176,284 Store sales revenue 169,675 317,849
280 Other revenue 264 495
176,564 Total operating revenue 169,939 318,344
(138,990) Cost of goods sold (138,244) (255,136)
37,574 Gross profit 31,695 63,208
(2,026) Distribution expenses (2,109) (3,781)
(8,115) Marketing expenses (8,588) (16,716)
(7,232) General and administration expenses (7,018) (12,945)
20,201 EBIT before non-trading 13,980 29,766
(596) Non-trading (532) (558)
19,605 Earnings before interest and taxation (EBIT) 13,448 29,208
- Interest revenue - 32
(572) Interest expense (832) (1,474)
(572) Net financing expenses (832) (1,442)
19,033 Profit before taxation 12,616 27,766
(5,556) Taxation expense (3,745) (8,230)
13,477 Profit after taxation attributable to shareholders 8,871 19,536
Other comprehensive income:
4 Exchange differences on translating foreign operations 16 (1)
(211) Derivative hedging reserve 337 203
63
Income tax relating to components
of other comprehensive income (101) (61)
(144)Other comprehensive income for the half year, net of tax 252 141
13,333Total comprehensive income for the half year attributable to shareholders 9,123 19,677
13.82 Basic earnings per share (cents) 6 9.13 20.11
13.78 Diluted earnings per share (cents) 6 9.13 20.09
STATEMENT OF COMPREHENSIvE INCOMEFor the period 1 March to 13 September 2010 (2011 Half Year)
NICE ONE!
NICE ONE!
9

STATEMENT OF CHANGES IN EqUITYFor the period 1 March to 13 September 2010 (2011 Half Year)
SHARE CAPITAL
SHARE OPTION
RESERVE
FOREIGN CURRENCY
TRANSLATION RESERVE
DERIVATIVE HEDGING RESERVE
RETAINED EARNINGS TOTAL
Group $NZ000's
Audited balance as at 28 February 2009 25,622 79 69 - 11,292 37,062
Comprehensive income
Profit after taxation attributable
to shareholders - - - - 8,871 8,871
Other comprehensive income
Movement in foreign currency
translation reserve - - 16 - - 16
Movement in derivative hedging reserve - - - 236 - 236
Total other comprehensive income - - 16 236 - 252
Total comprehensive income - - 16 236 8,871 9,123
Transactions with owners
Net dividends distributed - - - - (3,885) (3,885)
Total transactions with owners - - - - (3,885) (3,885)
Unaudited balance as at 14 September 2009 25,622 79 85 236 16,278 42,300
Comprehensive income
Profit after taxation attributable
to shareholders - - - - 10,665 10,665
Other comprehensive income
Movement in foreign currency
translation reserve - - (17) - - (17)
Movement in derivative hedging reserve - - - (94) - (94)
Total other comprehensive income - - (17) (94) - (111)
Total comprehensive income - - (17) (94) 10,665 10,554
Transactions with owners
Shares issued on exercise of options 199 (11) - - - 188
Net dividends distributed - - - - (4,372) (4,372)
Total transactions with owners 199 (11) - - (4,372) (4,184)
Audited balance as at 28 February 2010 25,821 68 68 142 22,571 48,670
10
11
SHARE CAPITAL
SHARE OPTION
RESERVE
FOREIGN CURRENCY
TRANSLATION RESERVE
DERIVATIVE HEDGING RESERVE
RETAINED EARNINGS TOTAL
Group $NZ000's
Audited balance as at 28 February 2009 25,622 79 69 - 11,292 37,062
Comprehensive income
Profit after taxation attributable
to shareholders - - - - 8,871 8,871
Other comprehensive income
Movement in foreign currency
translation reserve - - 16 - - 16
Movement in derivative hedging reserve - - - 236 - 236
Total other comprehensive income - - 16 236 - 252
Total comprehensive income - - 16 236 8,871 9,123
Transactions with owners
Net dividends distributed - - - - (3,885) (3,885)
Total transactions with owners - - - - (3,885) (3,885)
Unaudited balance as at 14 September 2009 25,622 79 85 236 16,278 42,300
Comprehensive income
Profit after taxation attributable
to shareholders - - - - 10,665 10,665
Other comprehensive income
Movement in foreign currency
translation reserve - - (17) - - (17)
Movement in derivative hedging reserve - - - (94) - (94)
Total other comprehensive income - - (17) (94) - (111)
Total comprehensive income - - (17) (94) 10,665 10,554
Transactions with owners
Shares issued on exercise of options 199 (11) - - - 188
Net dividends distributed - - - - (4,372) (4,372)
Total transactions with owners 199 (11) - - (4,372) (4,184)
Audited balance as at 28 February 2010 25,821 68 68 142 22,571 48,670
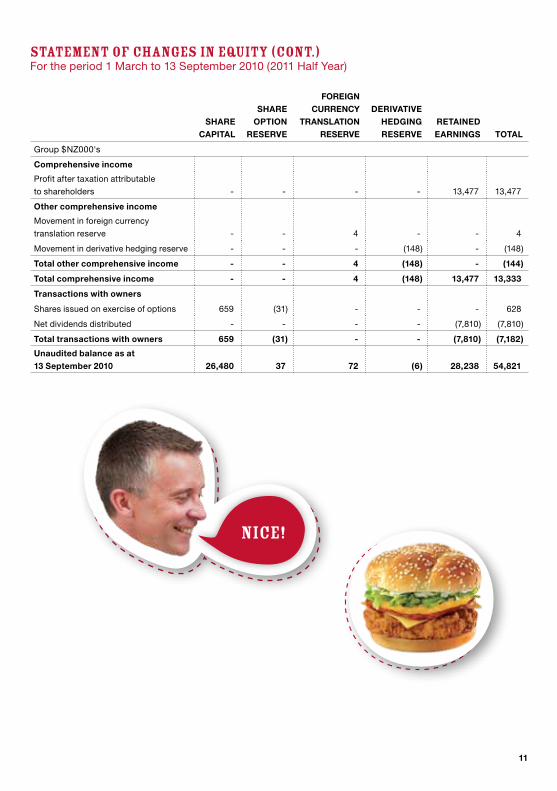
STATEMENT OF CHANGES IN EqUITY (CONT.) For the period 1 March to 13 September 2010 (2011 Half Year)
SHARE CAPITAL
SHARE OPTION
RESERVE
FOREIGN CURRENCY
TRANSLATION RESERVE
DERIVATIVE HEDGING RESERVE
RETAINED EARNINGS TOTAL
Group $NZ000's
Comprehensive income
Profit after taxation attributable
to shareholders - - - - 13,477 13,477
Other comprehensive income
Movement in foreign currency
translation reserve - - 4 - - 4
Movement in derivative hedging reserve - - - (148) - (148)
Total other comprehensive income - - 4 (148) - (144)
Total comprehensive income - - 4 (148) 13,477 13,333
Transactions with owners
Shares issued on exercise of options 659 (31) - - - 628
Net dividends distributed - - - - (7,810) (7,810)
Total transactions with owners 659 (31) - - (7,810) (7,182)
Unaudited balance as at 13 September 2010 26,480 37 72 (6) 28,238 54,821
BBq Bacon&CHEESE BURGER
NICE!
12
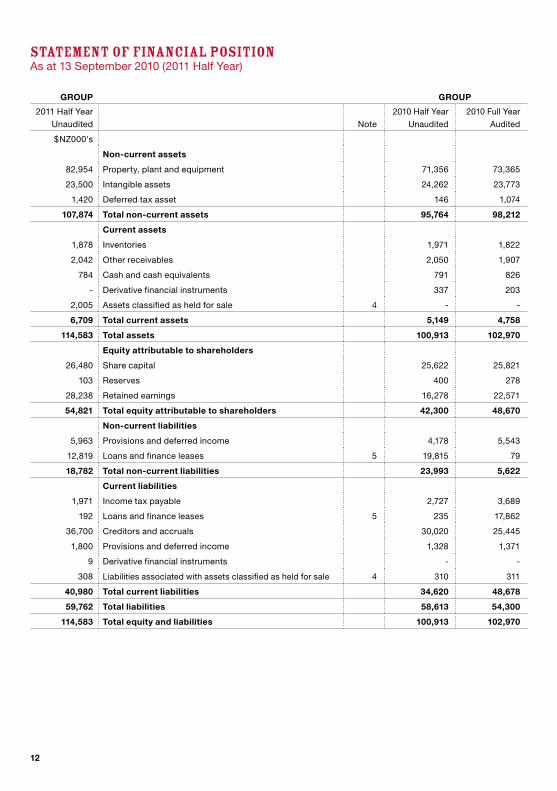
STATEMENT OF FINANCIAl POSITION As at 13 September 2010 (2011 Half Year)
GROUP GROUP
2011 Half Year
Unaudited Note
2010 Half Year
Unaudited
2010 Full Year
Audited
$NZ000's
Non-current assets
82,954 Property, plant and equipment 71,356 73,365
23,500 Intangible assets 24,262 23,773
1,420 Deferred tax asset 146 1,074
107,874 Total non-current assets 95,764 98,212
Current assets
1,878 Inventories 1,971 1,822
2,042 Other receivables 2,050 1,907
784 Cash and cash equivalents 791 826
- Derivative financial instruments 337 203
2,005 Assets classified as held for sale 4 - -
6,709 Total current assets 5,149 4,758
114,583 Total assets 100,913 102,970
Equity attributable to shareholders
26,480 Share capital 25,622 25,821
103 Reserves 400 278
28,238 Retained earnings 16,278 22,571
54,821 Total equity attributable to shareholders 42,300 48,670
Non-current liabilities
5,963 Provisions and deferred income 4,178 5,543
12,819 Loans and finance leases 5 19,815 79
18,782 Total non-current liabilities 23,993 5,622
Current liabilities
1,971 Income tax payable 2,727 3,689
192 Loans and finance leases 5 235 17,862
36,700 Creditors and accruals 30,020 25,445
1,800 Provisions and deferred income 1,328 1,371
9 Derivative financial instruments - -
308 Liabilities associated with assets classified as held for sale 4 310 311
40,980 Total current liabilities 34,620 48,678
59,762 Total liabilities 58,613 54,300
114,583 Total equity and liabilities 100,913 102,970
13
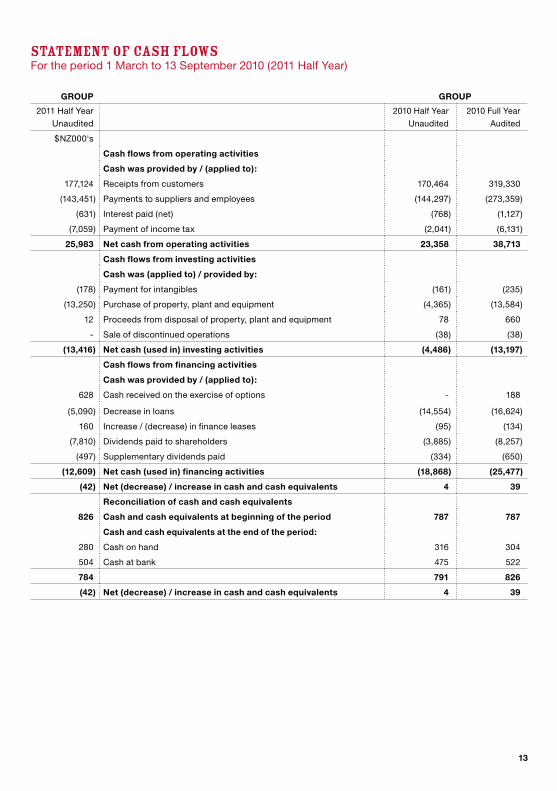
STATEMENT OF CASH FlOwS For the period 1 March to 13 September 2010 (2011 Half Year)
GROUP GROUP
2011 Half Year
Unaudited
2010 Half Year
Unaudited
2010 Full Year
Audited
$NZ000's
Cash flows from operating activities
Cash was provided by / (applied to):
177,124 Receipts from customers 170,464 319,330
(143,451) Payments to suppliers and employees (144,297) (273,359)
(631) Interest paid (net) (768) (1,127)
(7,059) Payment of income tax (2,041) (6,131)
25,983 Net cash from operating activities 23,358 38,713
Cash flows from investing activities
Cash was (applied to) / provided by:
(178) Payment for intangibles (161) (235)
(13,250) Purchase of property, plant and equipment (4,365) (13,584)
12 Proceeds from disposal of property, plant and equipment 78 660
- Sale of discontinued operations (38) (38)
(13,416) Net cash (used in) investing activities (4,486) (13,197)
Cash flows from financing activities
Cash was provided by / (applied to):
628 Cash received on the exercise of options - 188
(5,090) Decrease in loans (14,554) (16,624)
160 Increase / (decrease) in finance leases (95) (134)
(7,810) Dividends paid to shareholders (3,885) (8,257)
(497) Supplementary dividends paid (334) (650)
(12,609) Net cash (used in) financing activities (18,868) (25,477)
(42) Net (decrease) / increase in cash and cash equivalents 4 39
Reconciliation of cash and cash equivalents
826 Cash and cash equivalents at beginning of the period 787 787
Cash and cash equivalents at the end of the period:
280 Cash on hand 316 304
504 Cash at bank 475 522
784 791 826
(42) Net (decrease) / increase in cash and cash equivalents 4 39

14
STATEMENT OF CASH FlOwS (CONT.)For the period 1 March to 13 September 2010 (2011 Half Year)
GROUP GROUP
2011 Half Year
Unaudited
2010 Half Year
Unaudited
2010 Full Year
Audited
$NZ000's
13,477 Profit after taxation 8,871 19,536
Add items classified as investing / financing activities:
217 Loss on disposal of property, plant and equipment 345 433
- Other non-operating costs of exiting Pizza Hut Victoria 38 38
217 383 471
Add / (less) non-cash items:
6,681 Depreciation 6,563 12,003
464 Increase / (decrease) in provisions (459) (119)
443 Amortisation of intangible assets 591 1,094
8 Write off of franchise fees - 57
266 Impairment of property, plant and equipment 294 396
(346) Net increase in deferred tax asset (505) (1,433)
63 Tax effect of derivative financial instruments (101) (61)
7,579 6,383 11,937
Add / (less) movement in working capital:
(56) (Increase) / decrease in inventories 127 276
(135) Increase in other debtors and prepayments (361) (218)
6,122 Increase in trade creditors and other payables 5,645 3,123
(1,718) (Decrease) / increase in income tax payable 1,976 2,938
497 Decrease in income tax 334 650
4,710 7,721 6,769
25,983 Net cash from operating activities 23,358 38,713
The following is a reconciliation of profit after taxation to net cash from operating activities:

15
NOTES TO THE FINANCIAl STATEMENTSFor the period 1 March to 13 September 2010 (2011 Half Year)
GROUP GROUP
2011 Half Year
Unaudited
2010 Half Year
Unaudited
2010 Full Year
Audited
$NZ000's
Profit before taxation (consolidated business)
The profit before taxation is calculated after charging
the following items:
10,500 Royalties paid 10,100 18,919
9,532 Operating lease expenses 9,721 18,072
217 Net loss on disposal of property, plant and equipment 345 433
Non-trading items comprise:
709 Other store closure costs 85 592
(445) Other store closure costs - insurance proceeds - (626)
66 Other store relocation and refurbishment costs 219 329
266 Impairment of property, plant and equipment 294 396
- Other revenue (66) (133)
596 532 558
1. Profit before taxation
THAT’SGOOD!
16
NOTES TO THE FINANCIAl STATEMENTS (CONT.)For the period 1 March to 13 September 2010 (2011 Half Year)
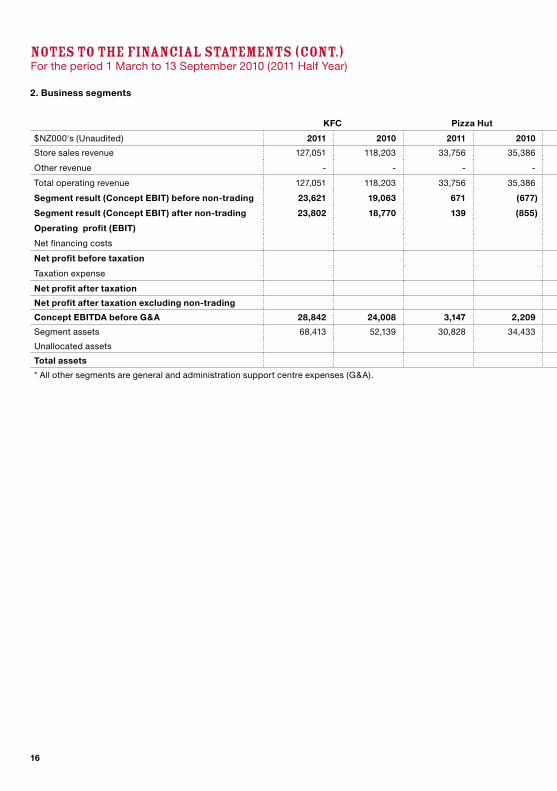
2. Business segments
KFC Pizza Hut Starbucks Coffee All other segments * Consolidated Half Year Full Year
$NZ000's (Unaudited) 2011 2010 2011 2010 2011 2010 2011 2010 2011 2010 2010
Store sales revenue 127,051 118,203 33,756 35,386 15,477 16,086 - - 176,284 169,675 317,849
Other revenue - - - - - - 280 264 280 264 495
Total operating revenue 127,051 118,203 33,756 35,386 15,477 16,086 280 264 176,564 169,939 318,344
Segment result (Concept EBIT) before non-trading 23,621 19,063 671 (677) 671 (189) (4,762) (4,217) 20,201 13,980 29,766
Segment result (Concept EBIT) after non-trading 23,802 18,770 139 (855) 426 (250) (4,762) (4,217) 19,605 13,448 29,208
Operating profit (EBIT) 19,605 13,448 29,208
Net financing costs (572) (832) (1,442)
Net profit before taxation 19,033 12,616 27,766
Taxation expense (5,556) (3,745) (8,230)
Net profit after taxation 13,477 8,871 19,536
Net profit after taxation excluding non-trading 13,894 9,243 19,926
Concept EBITDA before G&A 28,842 24,008 3,147 2,209 1,997 1,350 - - 33,986 27,567 54,895
Segment assets 68,413 52,139 30,828 34,433 7,989 9,869 1,102 1,148 108,332 97,589 98,960
Unallocated assets 6,251 3,324 4,010
Total assets 114,583 100,913 102,970
* All other segments are general and administration support centre expenses (G&A).

17
KFC Pizza Hut Starbucks Coffee All other segments * Consolidated Half Year Full Year
$NZ000's (Unaudited) 2011 2010 2011 2010 2011 2010 2011 2010 2011 2010 2010
Store sales revenue 127,051 118,203 33,756 35,386 15,477 16,086 - - 176,284 169,675 317,849
Other revenue - - - - - - 280 264 280 264 495
Total operating revenue 127,051 118,203 33,756 35,386 15,477 16,086 280 264 176,564 169,939 318,344
Segment result (Concept EBIT) before non-trading 23,621 19,063 671 (677) 671 (189) (4,762) (4,217) 20,201 13,980 29,766
Segment result (Concept EBIT) after non-trading 23,802 18,770 139 (855) 426 (250) (4,762) (4,217) 19,605 13,448 29,208
Operating profit (EBIT) 19,605 13,448 29,208
Net financing costs (572) (832) (1,442)
Net profit before taxation 19,033 12,616 27,766
Taxation expense (5,556) (3,745) (8,230)
Net profit after taxation 13,477 8,871 19,536
Net profit after taxation excluding non-trading 13,894 9,243 19,926
Concept EBITDA before G&A 28,842 24,008 3,147 2,209 1,997 1,350 - - 33,986 27,567 54,895
Segment assets 68,413 52,139 30,828 34,433 7,989 9,869 1,102 1,148 108,332 97,589 98,960
Unallocated assets 6,251 3,324 4,010
Total assets 114,583 100,913 102,970
* All other segments are general and administration support centre expenses (G&A).
CONTINUED IMPROvEMENT
CONTINUED IMPROvEMENT

18
NOTES TO THE FINANCIAl STATEMENTS (CONT.)For the period 1 March to 13 September 2010 (2011 Half Year)
3. Basis of preparation These unaudited financial statements for the 28 week period ended 13 September 2010 have been prepared in accordance with generally accepted accounting practice in New Zealand and NZ IAS 34, Interim Financial Statements, and should be read in conjunction with the financial statements published in the Annual Report for the period ended 28 February 2010 (referred to in these statements as “2010 Full Year”). These unaudited financial statements also comply with International Accounting Standard 34 Interim Financial Reporting (IAS 34). The accounting policies applied are consistent with those of the 2010 Full Year financial statements.
Restaurant Brands New Zealand Limited (the “Company” or “Parent”) together with its subsidiaries (the “Group”) operate quick service and takeaway restaurant concepts.
The Group divides its financial year into thirteen 4-week periods. These interim financial statements are for the first 7 periods (28 weeks) of the year ending on 13 September 2010 (2010:28 weeks ending on 14 September 2009). The second half will be for 6 periods (24 weeks).
The interim financial statements presented are those of the Group. The Company is a limited liability company incorporated and domiciled in New Zealand, is registered under the Companies Act 1993, and is an issuer in terms of the Securities Act 1978 and the Financial Reporting Act 1993. The Group is designated as a profit oriented entity for financial reporting purposes.
To ensure consistency with current period, comparative figures have been restated where appropriate. 4. Assets held for sale and discontinued operations
Sale of stores The directors approved the sale of the KFC Pt Chevalier store during the current financial year. The assets relating to the sale have been presented as held for sale as set out below:
The sale is expected to be completed by December 2010.
GROUP
$NZ000's
2011 Half Year
Unaudited
2010 Half Year
Unaudited
2010 Full Year
Audited
Assets classified as held for sale:
Property, plant and equipment 2,005 - -
19
NOTES TO THE FINANCIAl STATEMENTS (CONT.)For the period 1 March to 13 September 2010 (2011 Half Year)
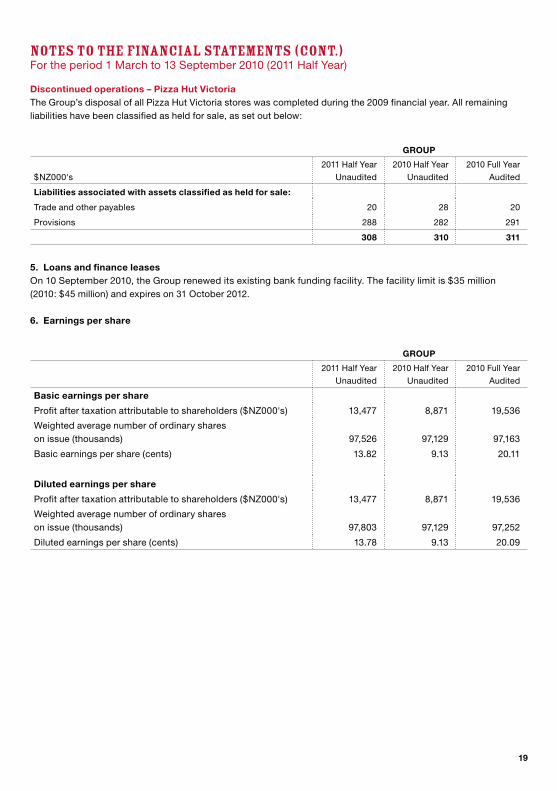
5. Loans and finance leases On 10 September 2010, the Group renewed its existing bank funding facility. The facility limit is $35 million (2010: $45 million) and expires on 31 October 2012. 6. Earnings per share
Discontinued operations – Pizza Hut Victoria The Group’s disposal of all Pizza Hut Victoria stores was completed during the 2009 financial year. All remaining liabilities have been classified as held for sale, as set out below:
GROUP
$NZ000's
2011 Half Year
Unaudited
2010 Half Year
Unaudited
2010 Full Year
Audited
Liabilities associated with assets classified as held for sale:
Trade and other payables 20 28 20
Provisions 288 282 291
308 310 311
GROUP
2011 Half Year
Unaudited
2010 Half Year
Unaudited
2010 Full Year
Audited
Basic earnings per share
Profit after taxation attributable to shareholders ($NZ000's) 13,477 8,871 19,536
Weighted average number of ordinary shares on issue (thousands) 97,526 97,129 97,163
Basic earnings per share (cents) 13.82 9.13 20.11
Diluted earnings per share
Profit after taxation attributable to shareholders ($NZ000's) 13,477 8,871 19,536
Weighted average number of ordinary shares on issue (thousands) 97,803 97,129 97,252
Diluted earnings per share (cents) 13.78 9.13 20.09

20
Shares on issue As at 13 September 2010, the total number of ordinary shares on issue was 97,704,468 (2010: 97,128,956).
7. Property, plant and equipment
Acquisitions and disposals During the half year ended 13 September 2010, the Group acquired assets with a total cost of $19.0 million (2010: $6.8 million) and disposed of assets with a total cost of $2.1 million (2010: $0.9 million). 8. Related party transactions
Subsidiaries During the period, the Parent received advances from its subsidiary company by way of inter-company group loans. In presenting the interim financial statements of the Group, the effect of inter-company transactions and balances have been eliminated. All inter-company group loans in the Parent are non-interest bearing and repayable on demand.
Other transactions with entities with key management or entities related to them During the period the Group made stock purchases of $0.2 million (2010: $0.1 million) from Charlie’s Group Limited, a company of which Company director Ted van Arkel is chairman. There was nil owing at balance date (2010: nil).
Key management and director compensation Key management personnel compensation comprised short-term benefits for the period of $1.7 million (2010: $0.8 million) and other long-term benefits of $6,000 (2010: $7,000).
Fees paid to directors for the period were $0.1 million (2010: $0.1 million). 9. Capital commitments The Group had capital commitments totalling $8.1 million (2010: $5.4 million) which are not provided for in these financial statements. 10. Contingencies Provision has been made in the ordinary course of business for all known and probable future claims but not for such claims that cannot presently be reliably measured. 11. Post balance date events
Dividends The directors have declared an interim dividend of 7.0 cents per share (2010: 4.5 cents) or $6.8 million (2010: $4.4 million). A supplementary dividend of 1.24 cents per share will be paid to overseas shareholders when the dividend is paid.
Sale of store On 12 October 2010 the Company sold the Pizza Hut Nelson store to an independent franchisee.
NOTES TO THE FINANCIAl STATEMENTS (CONT.)For the period 1 March to 13 September 2010 (2011 Half Year)

CORPORATE DIRECTORY Directors:E K (Ted) van Arkel (Chairman)Danny DiabDavid Alan PilkingtonSue Helen Suckling
Registered Office:Level 3, Westpac Building, Central Park,666 Great South Road, Penrose, Auckland, New Zealand
Share Registrar:Computershare Investor Services LimitedPrivate Bag 92119Auckland 1020, New ZealandTelephone: (09) 488 8700
Auditors:PricewaterhouseCoopers
Solicitors:Bell GullyHarmos Horton LuskMeredith Connell
Bankers:Westpac Banking Corporation
Contact Details:Postal Address:P O Box 22-749, Otahuhu,Auckland 1640, New Zealand
Telephone: (09) 525 8700Fax: (09) 525 8711E-mail: [email protected]
FINANCIAl CAlENDAR Interim Dividend Paid:26 November 2010
Financial Year End:28 February 2011
Annual Profit Announcement:April 2011

22