2011 financial results - euler hermes 2q07 3q07 4q07 1q08 2q08 3q08 4q08 1q09 2q09 3q09 4q09 1q10...
TRANSCRIPT
2011 Financial ResultsFinancial Analysts – 16th February 2012
© Copyright Euler Hermes 24Q11 Financial Results
© Copyright Euler Hermes
Contents
1 2011 highlights
2 Commercial overview
3 Risk overview
4 4Q 2011 Financial results
5 12M 2011 Financial results
6 Dividend, Return on equity & Solvency margin
7 Appendices

2011 highlights

© Copyright Euler Hermes 44Q11 Financial Results
2011 financial highlights
Top line is at a historical high
2011 net combined ratio remains at low level
€2,275mn (+6%)
12M11
70.0% (+1.3pts)
Ordinary operating profit is strong €472mn (stable)
… and yields an attractive dividend of €4.40 per share dividend yield 8.7%
Net income is up 12% against last year… €330mn(+12%)
© Copyright Euler Hermes 54Q11 Financial Results
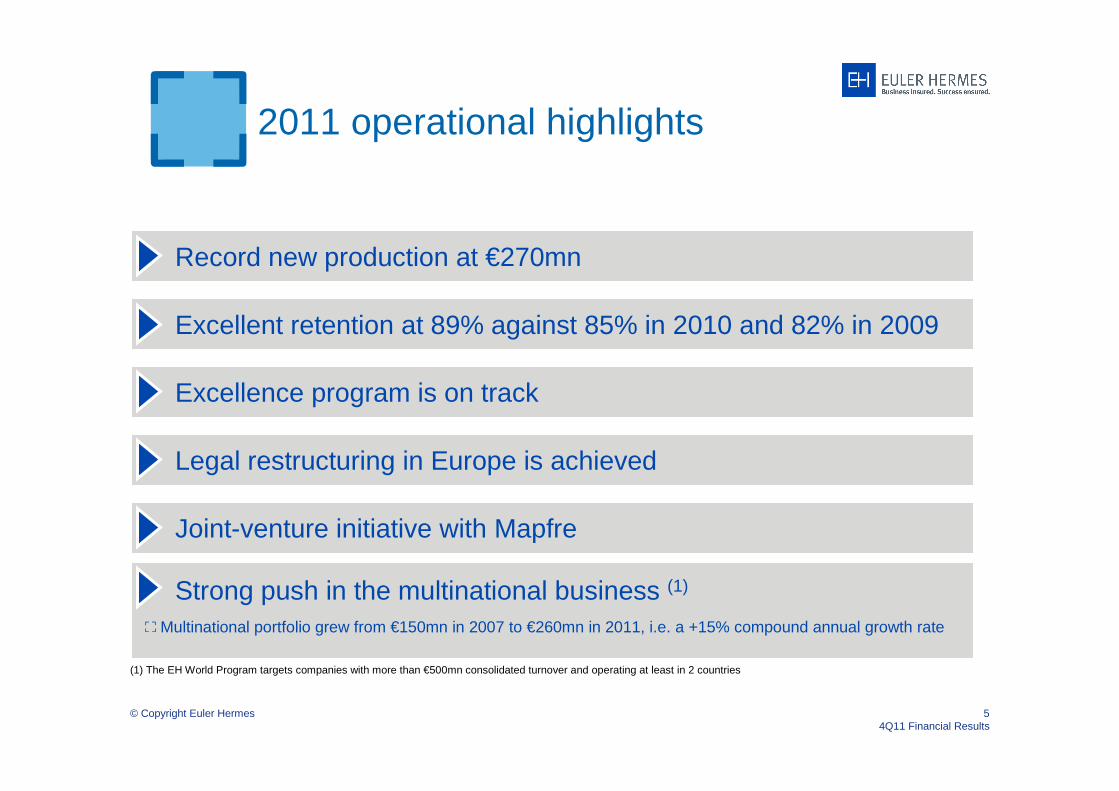
2011 operational highlights
Record new production at €270mn
Excellent retention at 89% against 85% in 2010 and 82% in 2009
Excellence program is on track
Strong push in the multinational business (1)
Legal restructuring in Europe is achieved
Joint-venture initiative with Mapfre
Multinational portfolio grew from €150mn in 2007 to €260mn in 2011, i.e. a +15% compound annual growth rate
(1) The EH World Program targets companies with more than €500mn consolidated turnover and operating at least in 2 countries

Commercial Overview
© Copyright Euler Hermes 74Q11 Financial Results
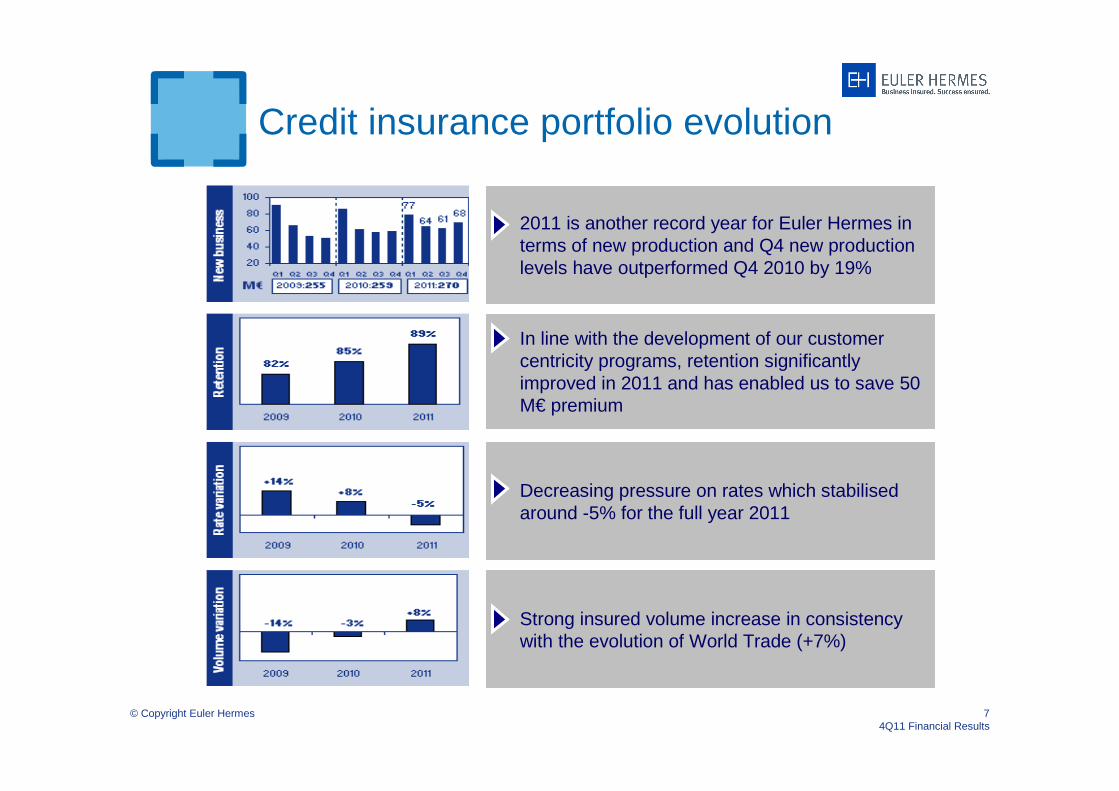
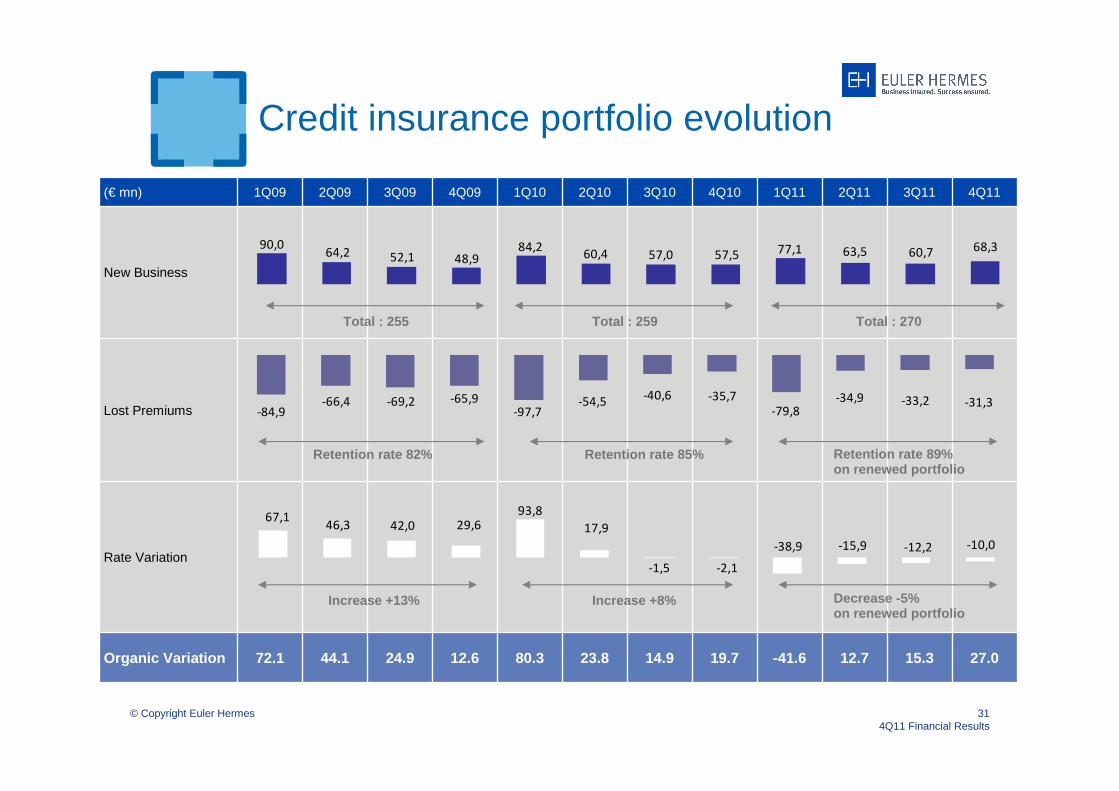
Credit insurance portfolio evolution
In line with the development of our customer centricity programs, retention significantly improved in 2011 and has enabled us to save 50 M€ premium
Decreasing pressure on rates which stabilised around -5% for the full year 2011
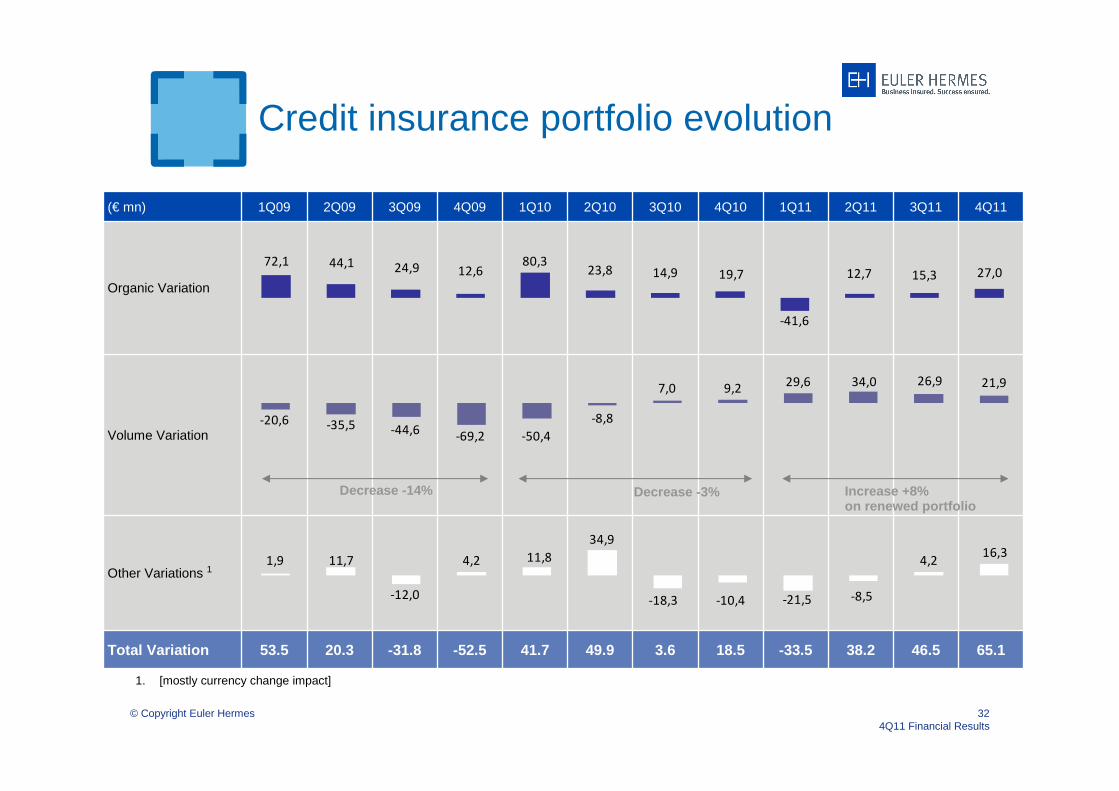
Strong insured volume increase in consistency with the evolution of World Trade (+7%)
2011 is another record year for Euler Hermes in terms of new production and Q4 new production levels have outperformed Q4 2010 by 19%

Risk Overview
© Copyright Euler Hermes 94Q11 Financial Results
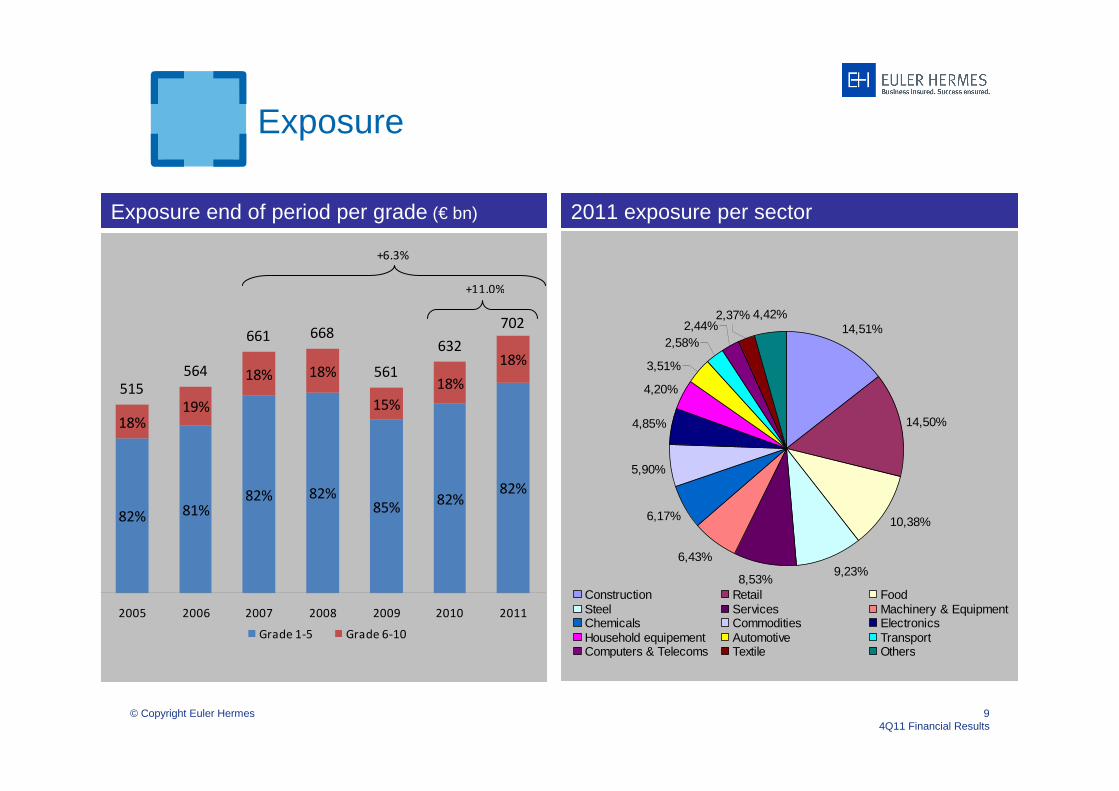
Exposure
2011 exposure per sectorExposure end of period per grade (€ bn)
515
564
661 668
561
632
702
82%82%
85%82%82%
81%82%
18%
18%
15%
18%18%
19%18%
2005 2006 2007 2008 2009 2010 2011
Grade 1-5 Grade 6-10Total
+11.0%
+6.3%
14,51%
14,50%
10,38%
9,23%8,53%
6,43%
6,17%
5,90%
4,85%
4,20%
3,51%
2,58%2,44%
2,37% 4,42%
Construction Retail FoodSteel Services Machinery & EquipmentChemicals Commodities ElectronicsHousehold equipement Automotive TransportComputers & Telecoms Textile Others
© Copyright Euler Hermes 104Q11 Financial Results
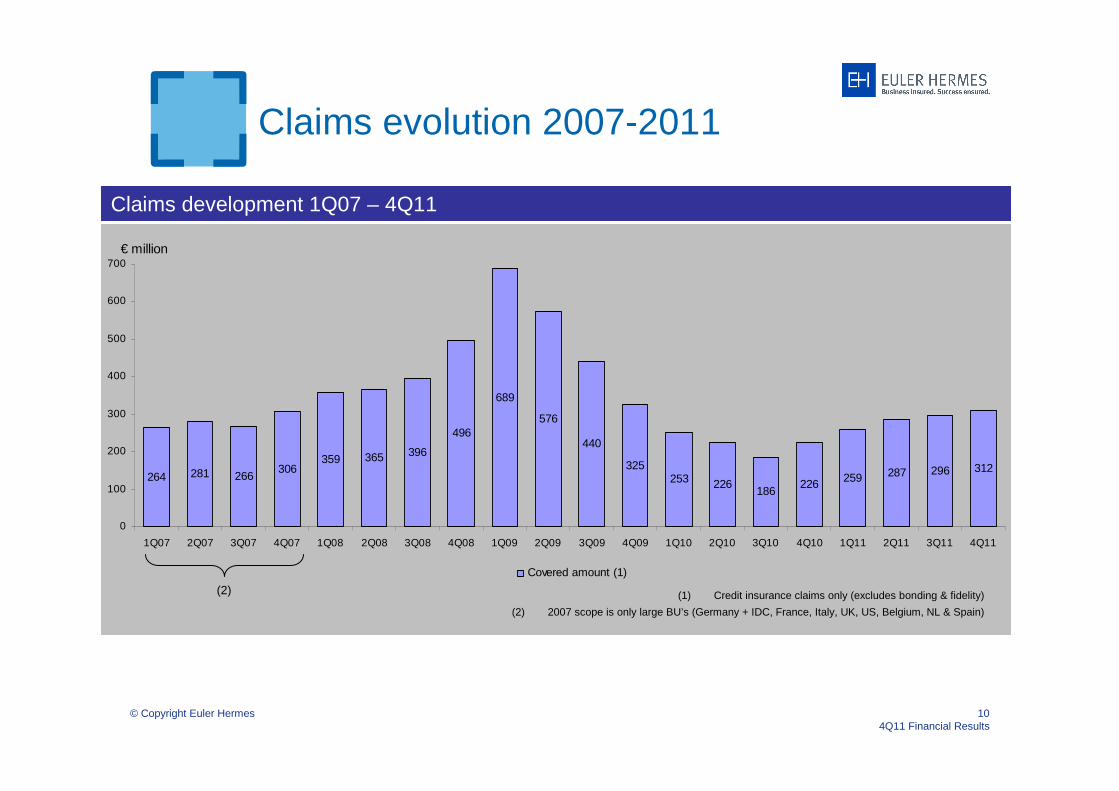
Claims evolution 2007-2011
Claims development 1Q07 – 4Q11
(1) Credit insurance claims only (excludes bonding & fidelity)
(2) 2007 scope is only large BU’s (Germany + IDC, France, Italy, UK, US, Belgium, NL & Spain)
(2)
264 281 266306
359 365 396
496
689
576
440
325253 226
186226 259 287 296 312
0
100
200
300
400
500
600
700
1Q07 2Q07 3Q07 4Q07 1Q08 2Q08 3Q08 4Q08 1Q09 2Q09 3Q09 4Q09 1Q10 2Q10 3Q10 4Q10 1Q11 2Q11 3Q11 4Q11
Covered amount (1)
€ million
4Q 2011 Financial results
12
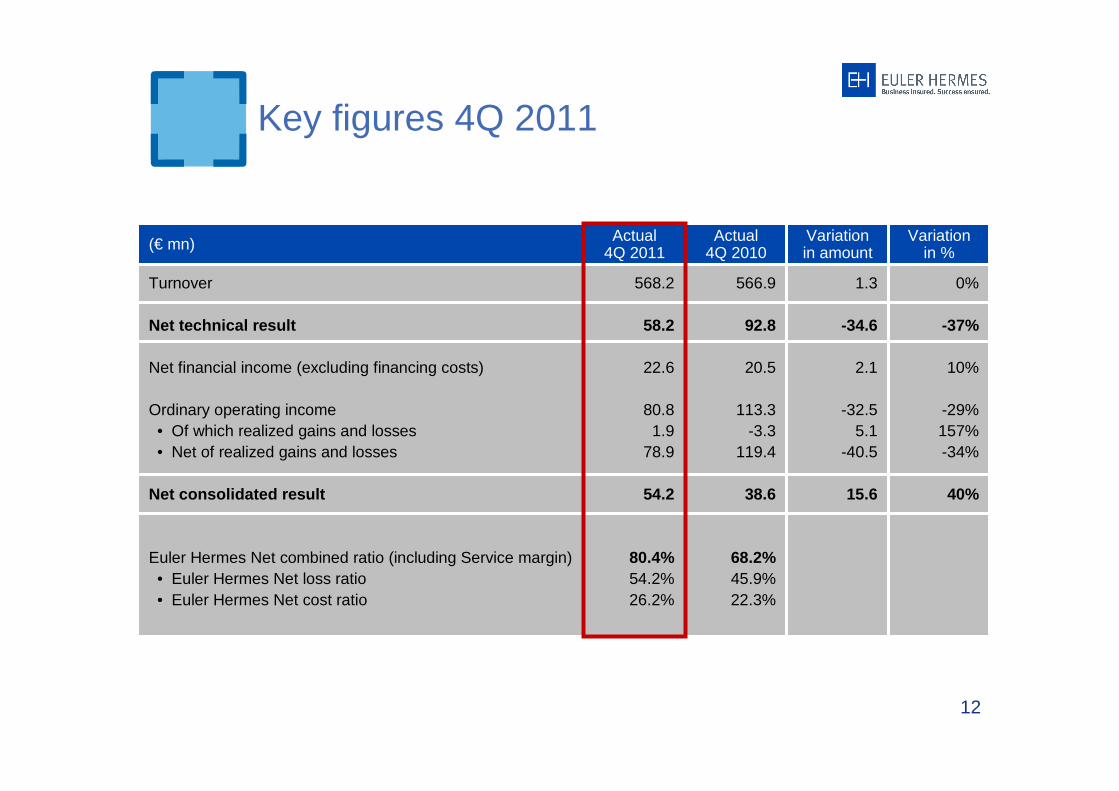
Key figures 4Q 2011
(€ mn) Variationin amount
1.3
-34.6
2.1
-32.55.1
-40.5
15.6
Variation in %
0%
-37%
10%
-29%157%-34%
40%
Actual 4Q 2011
568.2
58.2
22.6
80.81.9
78.9
54.2
80.4%54.2%26.2%
Actual4Q 2010
566.9
92.8
20.5
113.3-3.3
119.4
38.6
68.2%45.9%22.3%
Turnover
Net technical result
Net financial income (excluding financing costs)
Ordinary operating income• Of which realized gains and losses• Net of realized gains and losses
Net consolidated result
Euler Hermes Net combined ratio (including Service margin)• Euler Hermes Net loss ratio• Euler Hermes Net cost ratio
© Copyright Euler Hermes 134Q11 Financial Results
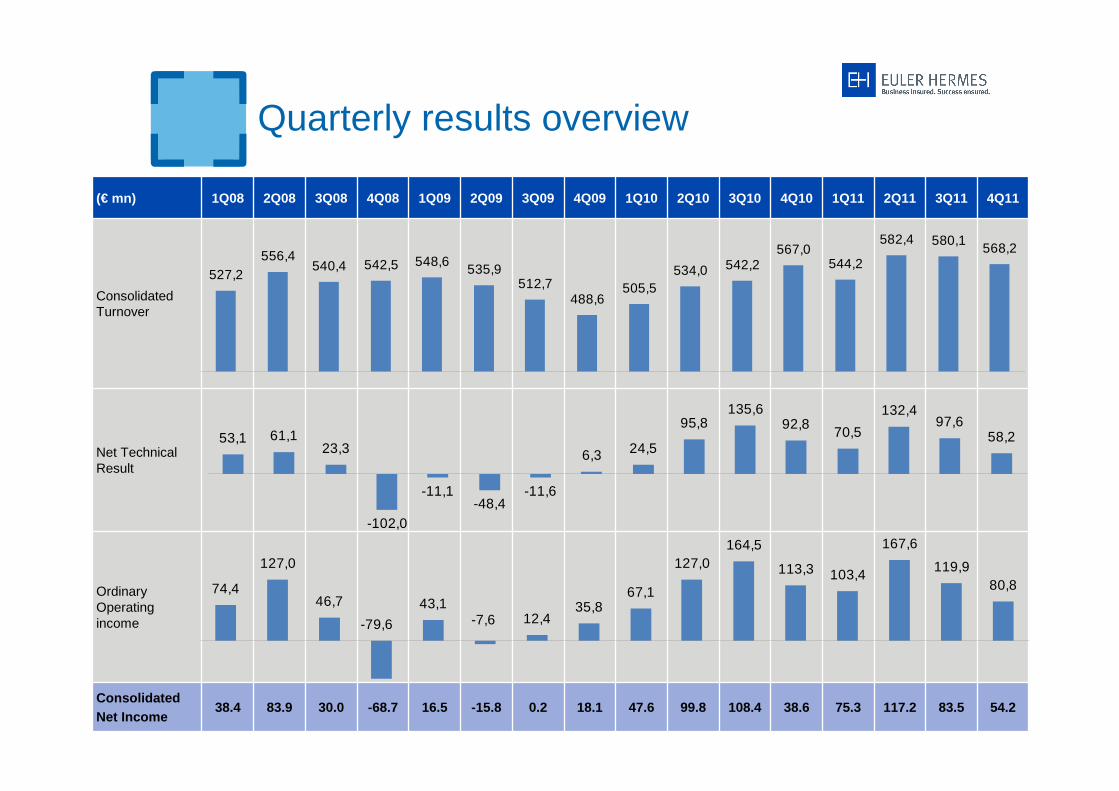
Quarterly results overview
83.5
3Q11
117.2
2Q11
75.3
1Q11
38.6
4Q10(€ mn) 1Q08 2Q08 3Q08 4Q08 1Q09 2Q09 3Q09 4Q09 1Q10 2Q10 3Q10 4Q11
Consolidated Turnover
Net Technical Result
Ordinary Operating income
Consolidated Net Income
38.4 83.9 30.0 -68.7 16.5 -15.8 0.2 18.1 47.6 99.8 108.4 54.2
74,4
127,0
46,7 43,112,4
35,867,1
127,0164,5
113,3 103,4
167,6
119,980,8
-7,6-79,6
53,1 61,123,3
-102,0
-11,1-48,4
-11,6
6,3 24,5
95,8135,6
92,870,5
132,497,6
58,2
527,2556,4
540,4 542,5 548,6535,9
512,7488,6
505,5534,0 542,2
567,0544,2
582,4 580,1568,2
© Copyright Euler Hermes 144Q11 Financial Results
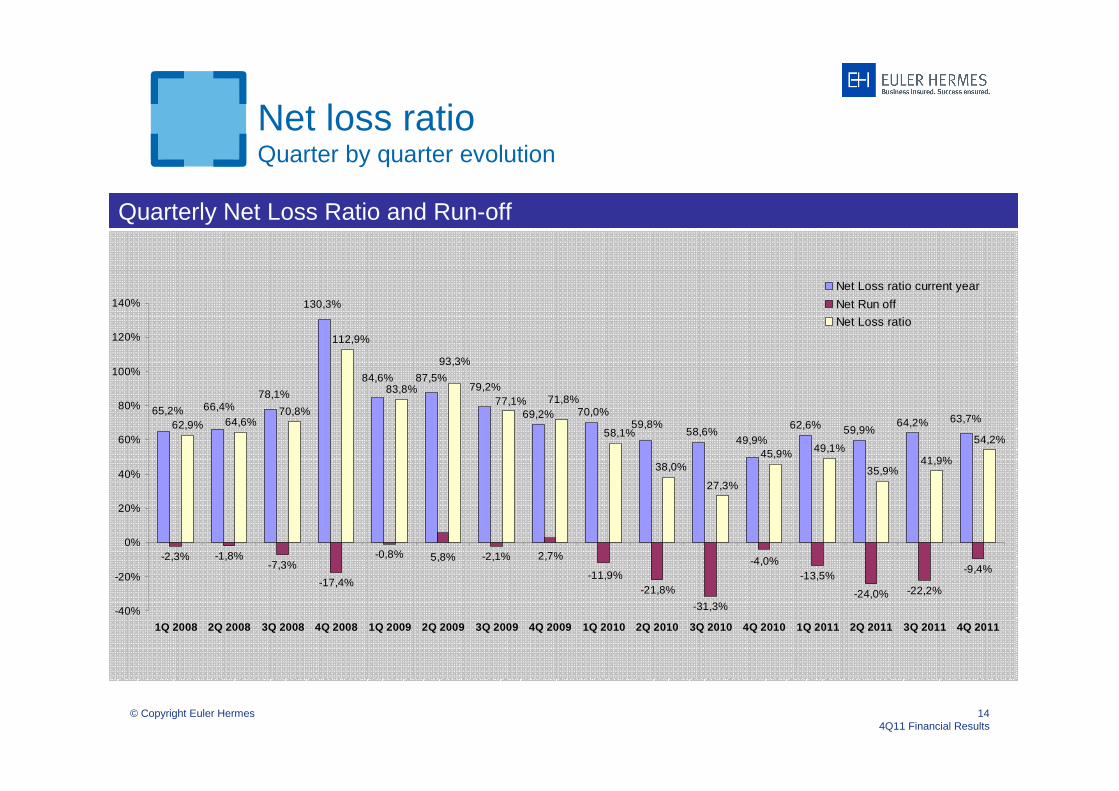
Net loss ratioQuarter by quarter evolution
69,2%62,6% 59,9%
64,2%
-2,3% -1,8%-7,3%
-17,4%
-0,8% -2,1%
-31,3%
-13,5%
-24,0% -22,2%
-9,4%
62,9% 64,6%70,8%
83,8%
27,3%
49,1%
35,9%41,9%
54,2%49,9%
59,8%
66,4%63,7%
58,6%
65,2% 70,0%
79,2%87,5%84,6%
130,3%
78,1%
2,7%5,8% -4,0%
-21,8%-11,9%
112,9%
58,1%
93,3%
45,9%38,0%
77,1% 71,8%
-40%
-20%
0%
20%
40%
60%
80%
100%
120%
140%
1Q 2008 2Q 2008 3Q 2008 4Q 2008 1Q 2009 2Q 2009 3Q 2009 4Q 2009 1Q 2010 2Q 2010 3Q 2010 4Q 2010 1Q 2011 2Q 2011 3Q 2011 4Q 2011
Net Loss ratio current year
Net Run off
Net Loss ratio
Quarterly Net Loss Ratio and Run-off
© Copyright Euler Hermes 154Q11 Financial Results
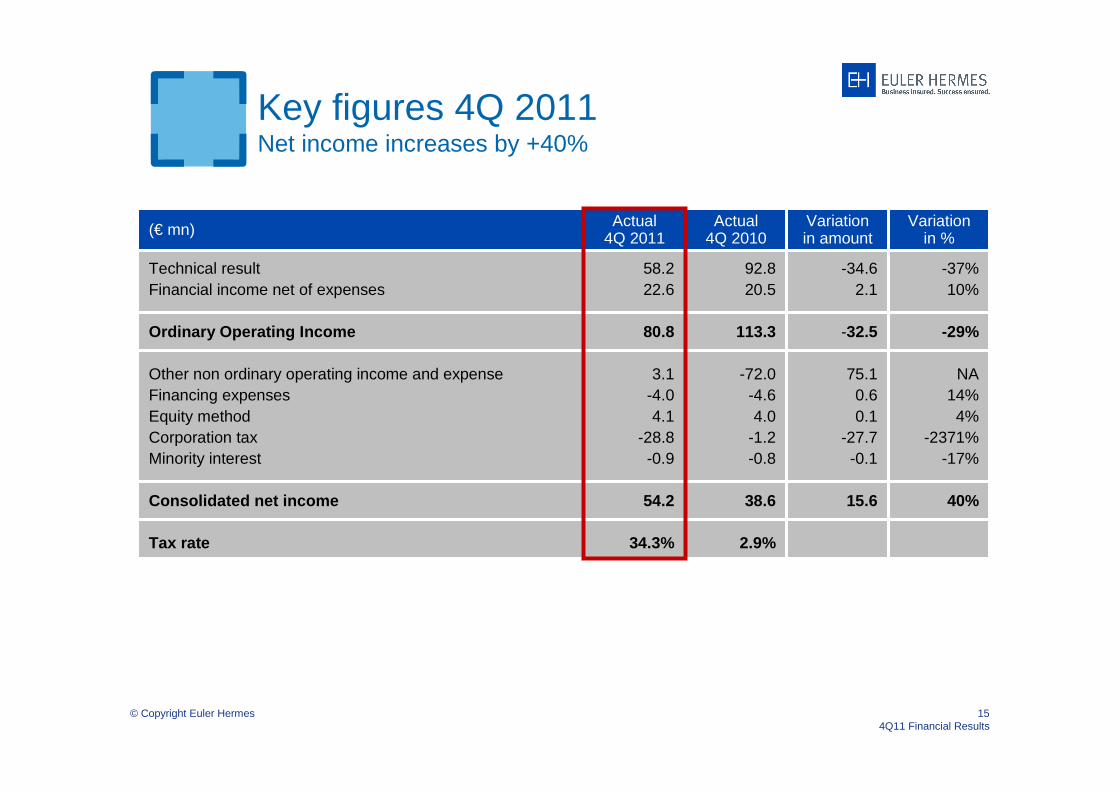
Key figures 4Q 2011Net income increases by +40%
-34.62.1
-32.5
75.10.60.1
-27.7-0.1
15.6
-37%10%
-29%
NA14%4%
-2371%-17%
40%
58.222.6
80.8
3.1-4.04.1
-28.8-0.9
54.2
34.3%
92.820.5
113.3
-72.0-4.64.0
-1.2-0.8
38.6
2.9%
Technical resultFinancial income net of expenses
Ordinary Operating Income
Other non ordinary operating income and expenseFinancing expensesEquity methodCorporation taxMinority interest
Consolidated net income
Tax rate
(€ mn) Variationin amount
Variation in %
Actual 4Q 2011
Actual4Q 2010

12M 2011 Financial results
17
127.2
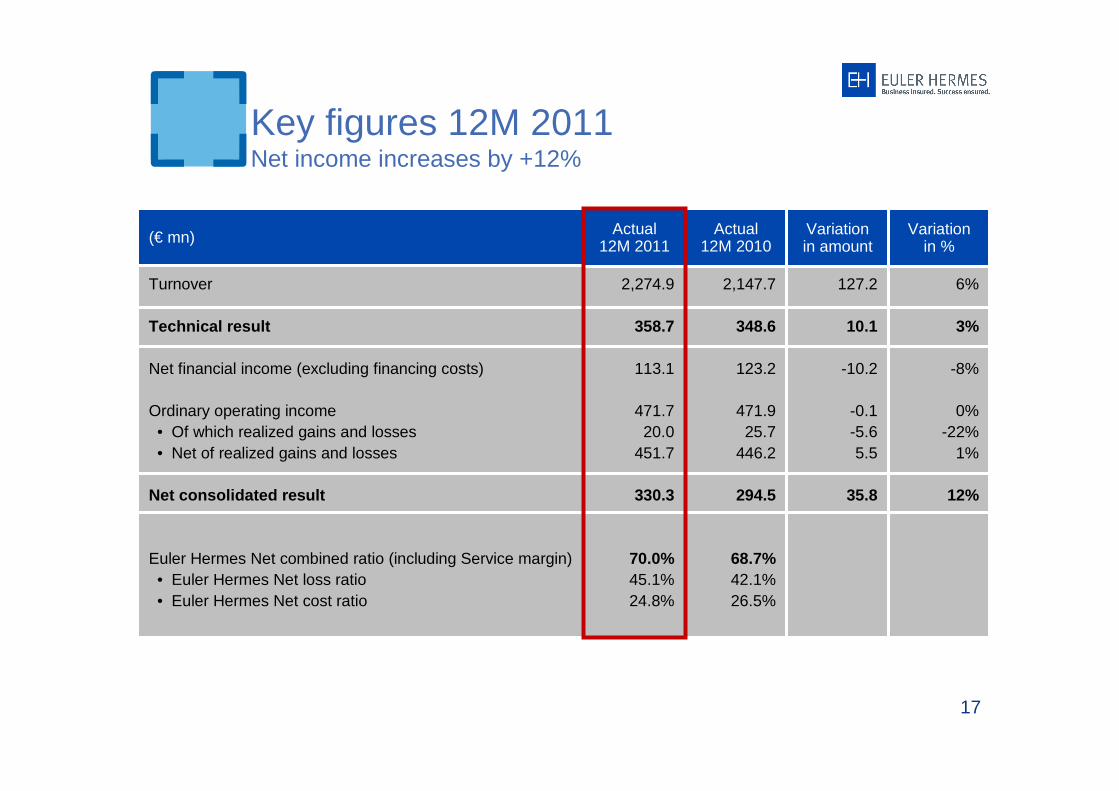
10.1
-10.2
-0.1-5.65.5
35.8
6%
3%
-8%
0%-22%
1%
12%
2,274.9
358.7
113.1
471.720.0
451.7
330.3
70.0%45.1%24.8%
2,147.7
348.6
123.2
471.925.7
446.2
294.5
68.7%42.1%26.5%
Turnover
Technical result
Net financial income (excluding financing costs)
Ordinary operating income• Of which realized gains and losses• Net of realized gains and losses
Net consolidated result
Euler Hermes Net combined ratio (including Service margin)• Euler Hermes Net loss ratio• Euler Hermes Net cost ratio
(€ mn) Variationin amount
Variation in %
Actual12M 2011
Actual12M 2010
Key figures 12M 2011Net income increases by +12%
18
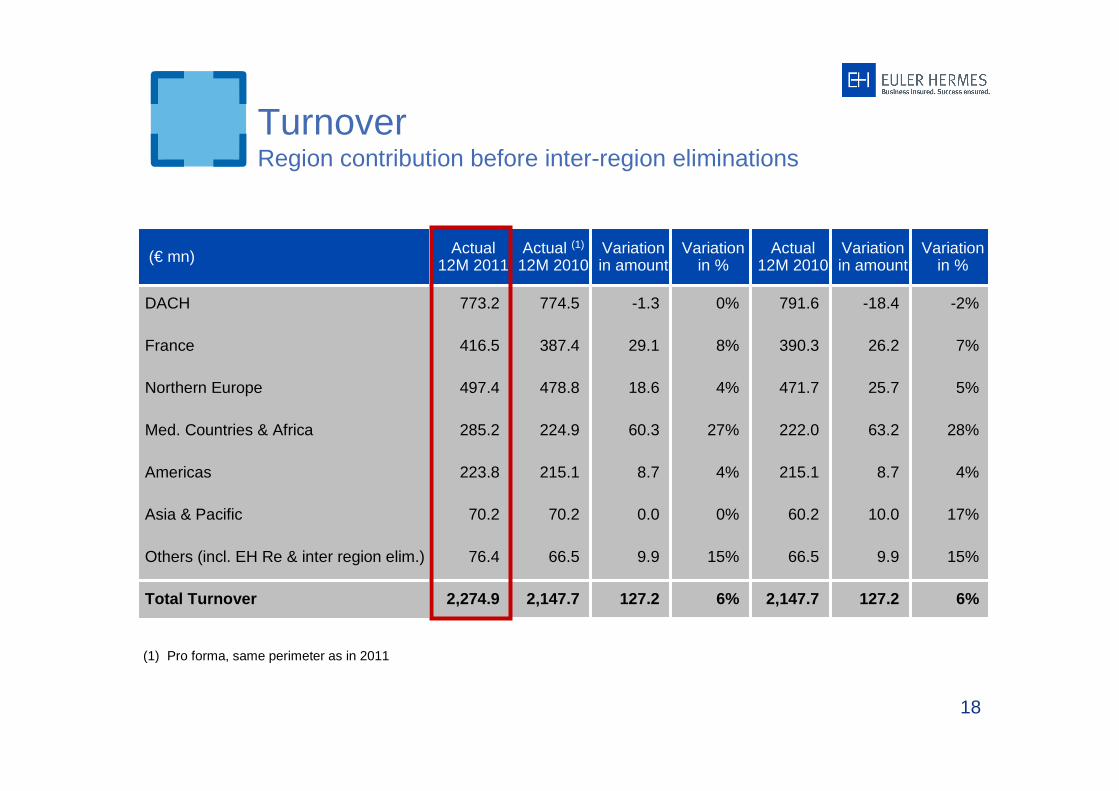
(1) Pro forma, same perimeter as in 2011
(€ mn)
DACH
France
Northern Europe
Med. Countries & Africa
Americas
Asia & Pacific
Others (incl. EH Re & inter region elim.)
Total Turnover
Variationin amount
-18.4
26.2
25.7
63.2
8.7
10.0
9.9
127.2
Variation in %
-2%
7%
5%
28%
4%
17%
15%
6%
Variation in %
0%
8%
4%
27%
4%
0%
15%
6%
Actual 12M 2010
791.6
390.3
471.7
222.0
215.1
60.2
66.5
2,147.7
Variationin amount
-1.3
29.1
18.6
60.3
8.7
0.0
9.9
127.2
Actual 12M 2011
773.2
416.5
497.4
285.2
223.8
70.2
76.4
2,274.9
Actual (1)
12M 2010
774.5
387.4
478.8
224.9
215.1
70.2
66.5
2,147.7
TurnoverRegion contribution before inter-region eliminations
© Copyright Euler Hermes 194Q11 Financial Results
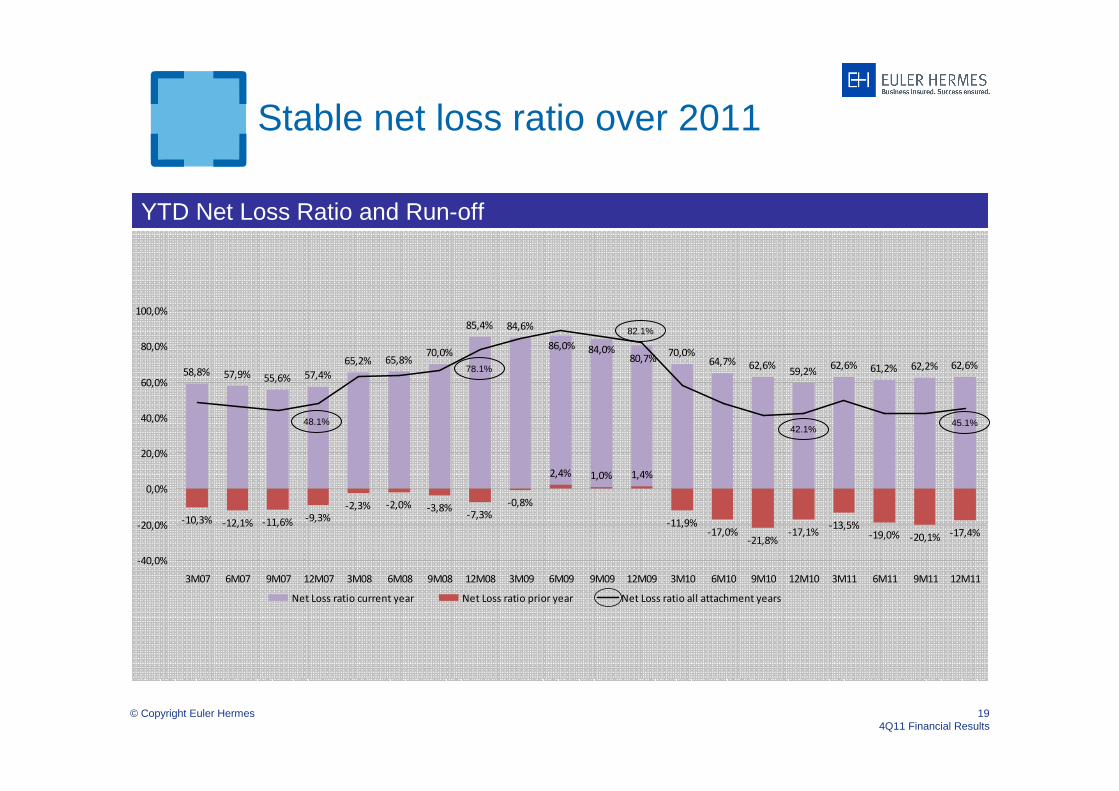
YTD Net Loss Ratio and Run-off
Stable net loss ratio over 2011
58,8% 57,9% 55,6% 57,4%
65,2% 65,8%70,0%
85,4% 84,6%
70,0%64,7% 62,6%
59,2%62,6% 61,2% 62,2% 62,6%
-10,3% -12,1% -11,6% -9,3%-2,3% -2,0% -3,8%
-7,3%-0,8%
2,4% 1,0% 1,4%
-11,9%-17,0%
-21,8%-17,1%
-13,5%-19,0% -20,1% -17,4%
80,7%84,0%86,0%
-40,0%
-20,0%
0,0%
20,0%
40,0%
60,0%
80,0%
100,0%
3M07 6M07 9M07 12M07 3M08 6M08 9M08 12M08 3M09 6M09 9M09 12M09 3M10 6M10 9M10 12M10 3M11 6M11 9M11 12M11
Net Loss ratio current year Net Loss ratio prior year Net Loss ratio all attachment years
45.1%42.1%
82.1%
78.1%
48.1%
© Copyright Euler Hermes 204Q11 Financial Results
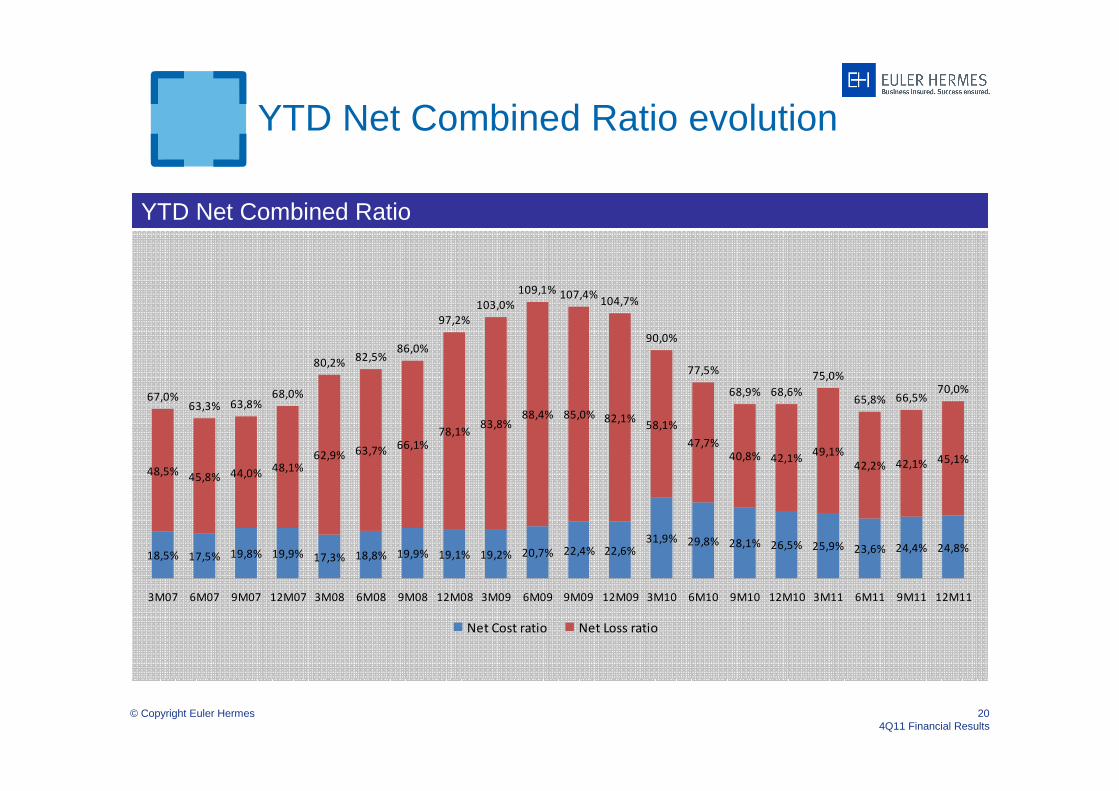
YTD Net Combined Ratio
YTD Net Combined Ratio evolution
18,5% 17,5% 19,8% 19,9% 17,3% 18,8% 19,9% 19,1% 19,2% 20,7% 22,4% 22,6%31,9% 29,8% 28,1% 26,5% 25,9% 23,6% 24,4% 24,8%
48,5%45,8% 44,0%
48,1%62,9% 63,7%
66,1%78,1%
83,8%88,4% 85,0% 82,1%
58,1%
47,7%40,8% 42,1%
49,1%
42,2% 42,1% 45,1%
67,0%63,3% 63,8%
68,0%
80,2%82,5%
86,0%
97,2%
103,0%
109,1% 107,4%104,7%
90,0%
77,5%
68,9% 68,6%
75,0%
65,8% 66,5%70,0%
3M07 6M07 9M07 12M07 3M08 6M08 9M08 12M08 3M09 6M09 9M09 12M09 3M10 6M10 9M10 12M10 3M11 6M11 9M11 12M11
Net Cost ratio Net Loss ratio
© Copyright Euler Hermes 214Q11 Financial Results
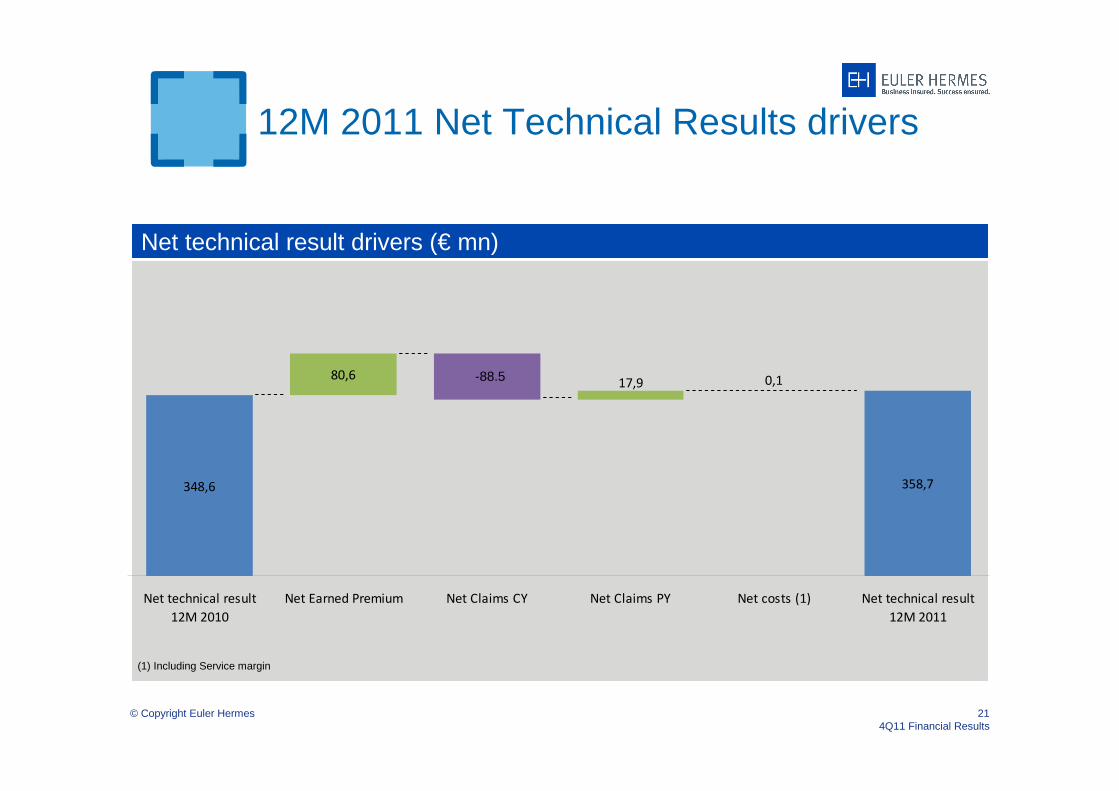
12M 2011 Net Technical Results drivers
Net technical result drivers (€ mn)
(1) Including Service margin
358,7
80,6
348,6
17,9 0,1
Net technical result
12M 2010
Net Earned Premium Net Claims CY Net Claims PY Net costs (1) Net technical result
12M 2011
-88.5
© Copyright Euler Hermes 224Q11 Financial Results
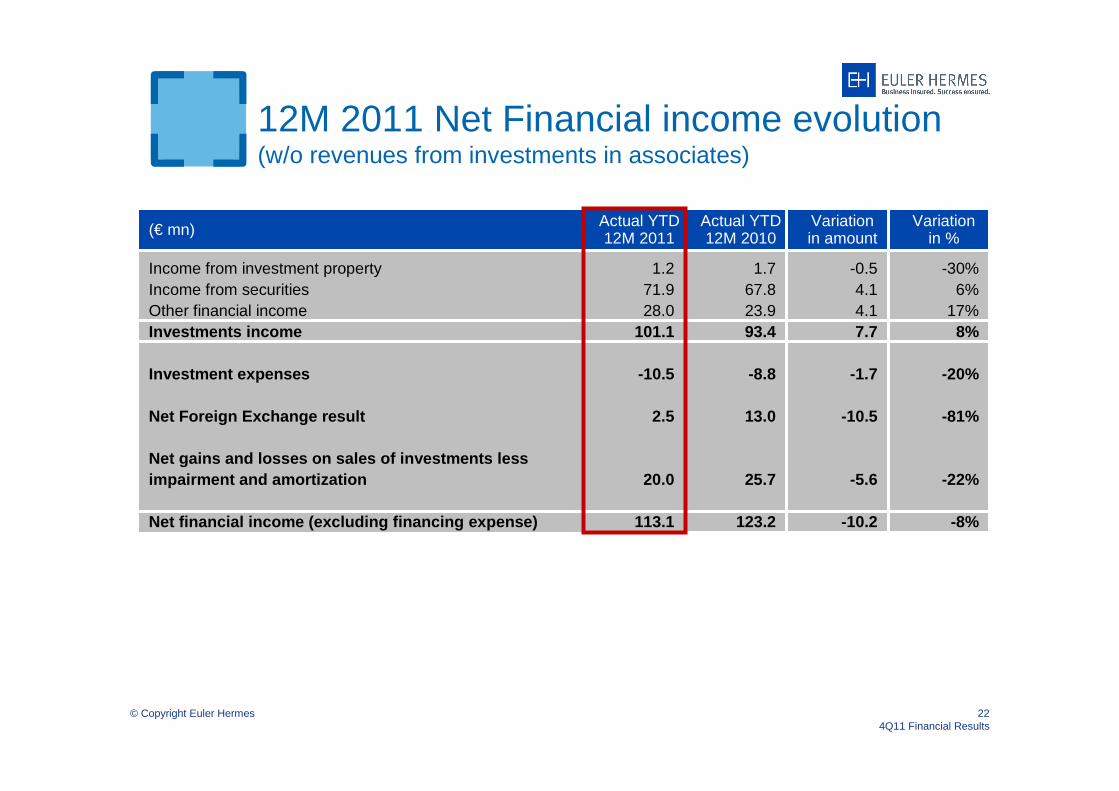
12M 2011 Net Financial income evolution(w/o revenues from investments in associates)
-0.54.14.17.7
-1.7
-10.5
-5.6
-10.2
-30%6%
17%8%
-20%
-81%
-22%
-8%
1.271.928.0
101.1
-10.5
2.5
20.0
113.1
1.767.823.993.4
-8.8
13.0
25.7
123.2
Income from investment propertyIncome from securitiesOther financial incomeInvestments income
Investment expenses
Net Foreign Exchange result
Net gains and losses on sales of investments less impairment and amortization
Net financial income (excluding financing expense)
(€ mn) Variationin amount
Variation in %
Actual YTD12M 2011
Actual YTD12M 2010
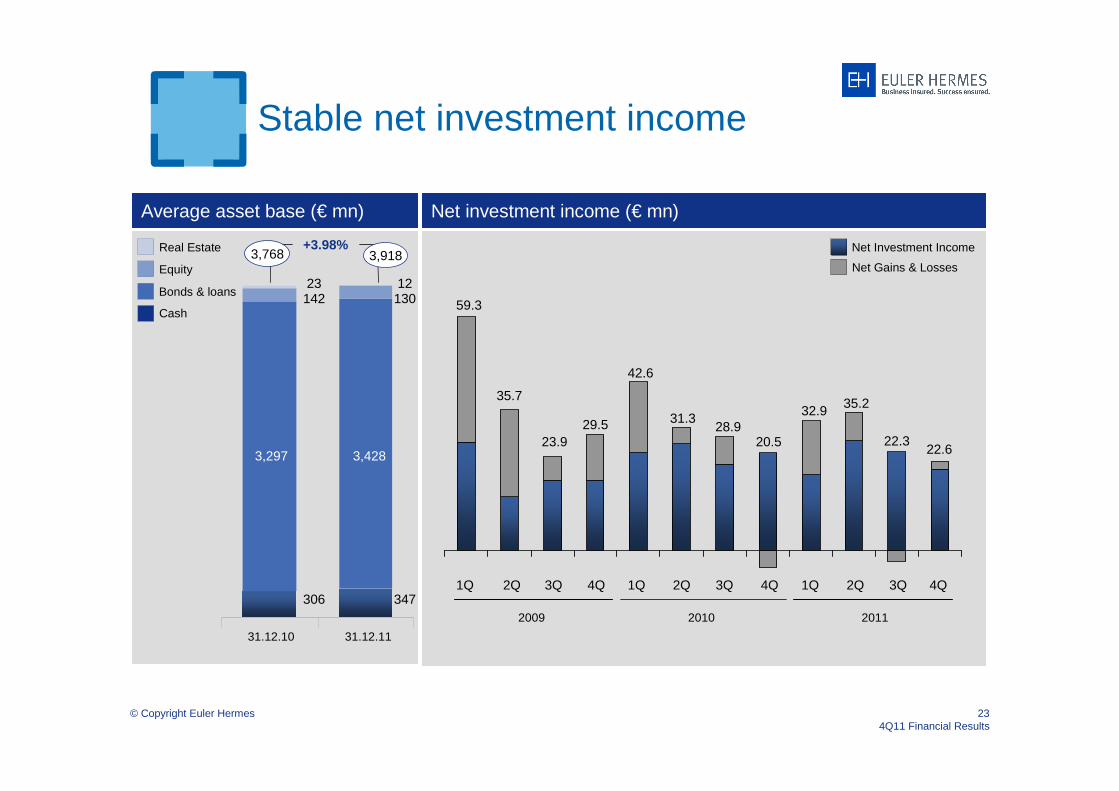
© Copyright Euler Hermes 234Q11 Financial Results
Stable net investment income
Average asset base (€ mn)
31.12.10 31.12.11
Net investment income (€ mn)
2009
1Q 2Q 3Q 4Q
2011
1Q
Bonds & loans
Cash
Real Estate +3.98%
Equity
3,297 3,428
14223
13012
306 347
31.3
59.3
35.7
23.929.5
42.6
28.920.5
32.9
2010
1Q 2Q 3Q 4Q
3,9183,768 Net Investment Income
Net Gains & Losses
35.2
2Q 3Q
22.3
4Q
22.6
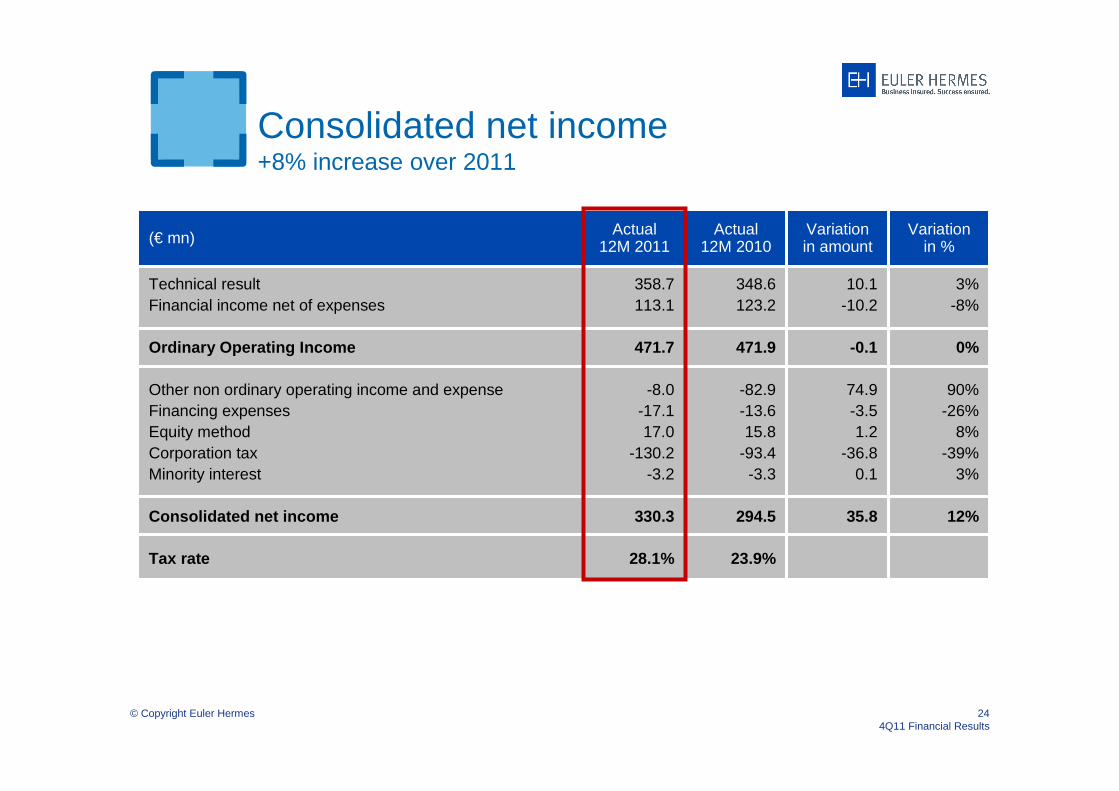
© Copyright Euler Hermes 244Q11 Financial Results
Consolidated net income+8% increase over 2011
10.1-10.2
-0.1
74.9-3.51.2
-36.80.1
35.8
3%-8%
0%
90%-26%
8%-39%
3%
12%
358.7113.1
471.7
-8.0-17.117.0
-130.2-3.2
330.3
28.1%
348.6123.2
471.9
-82.9-13.615.8
-93.4-3.3
294.5
23.9%
Technical resultFinancial income net of expenses
Ordinary Operating Income
Other non ordinary operating income and expenseFinancing expensesEquity methodCorporation taxMinority interest
Consolidated net income
Tax rate
(€ mn) Variationin amount
Variation in %
Actual12M 2011
Actual12M 2010
Dividend, Return on equity& Solvency margin
© Copyright Euler Hermes 264Q11 Financial Results
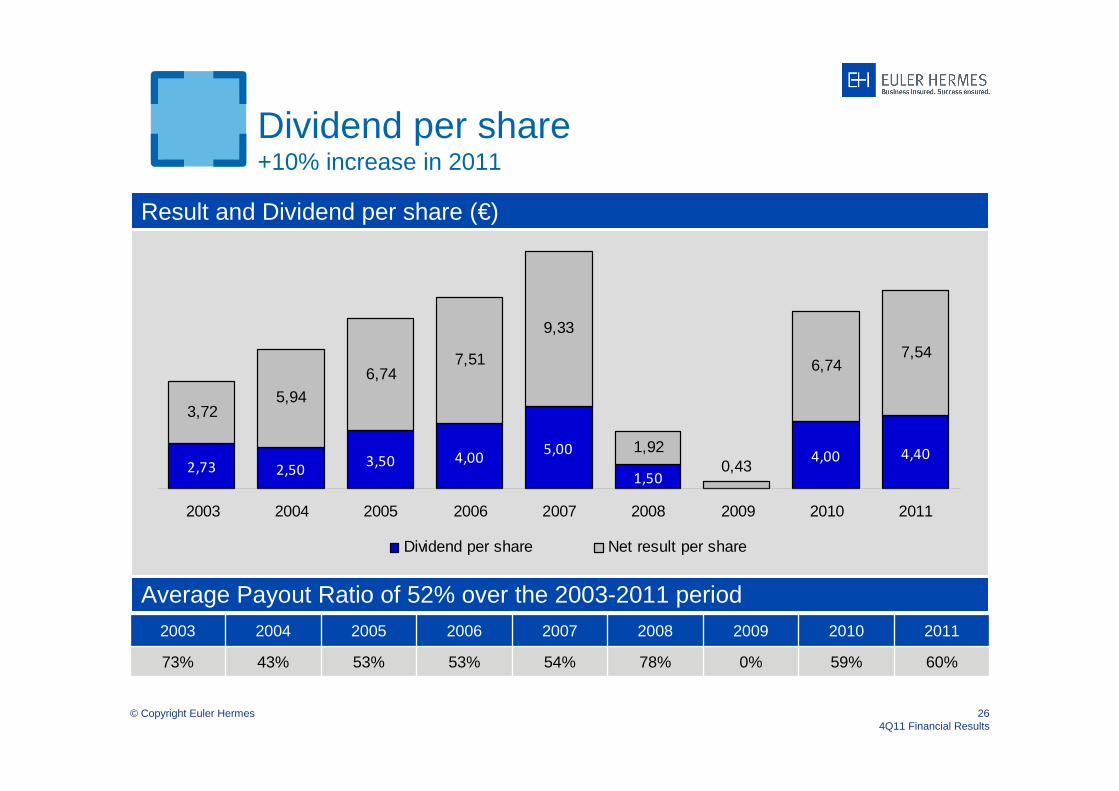
Dividend per share+10% increase in 2011
Result and Dividend per share (€)
59%
20102003 2004 2005 2006 2007 2008 2009 2011
73% 43% 53% 53% 54% 78% 0% 60%
Average Payout Ratio of 52% over the 2003-2011 period
2,73 2,503,50 4,00
5,00
1,50
4,00 4,400,43
7,546,74
1,92
9,33
7,516,74
5,943,72
2003 2004 2005 2006 2007 2008 2009 2010 2011
Dividend per share Net result per share
© Copyright Euler Hermes 274Q11 Financial Results
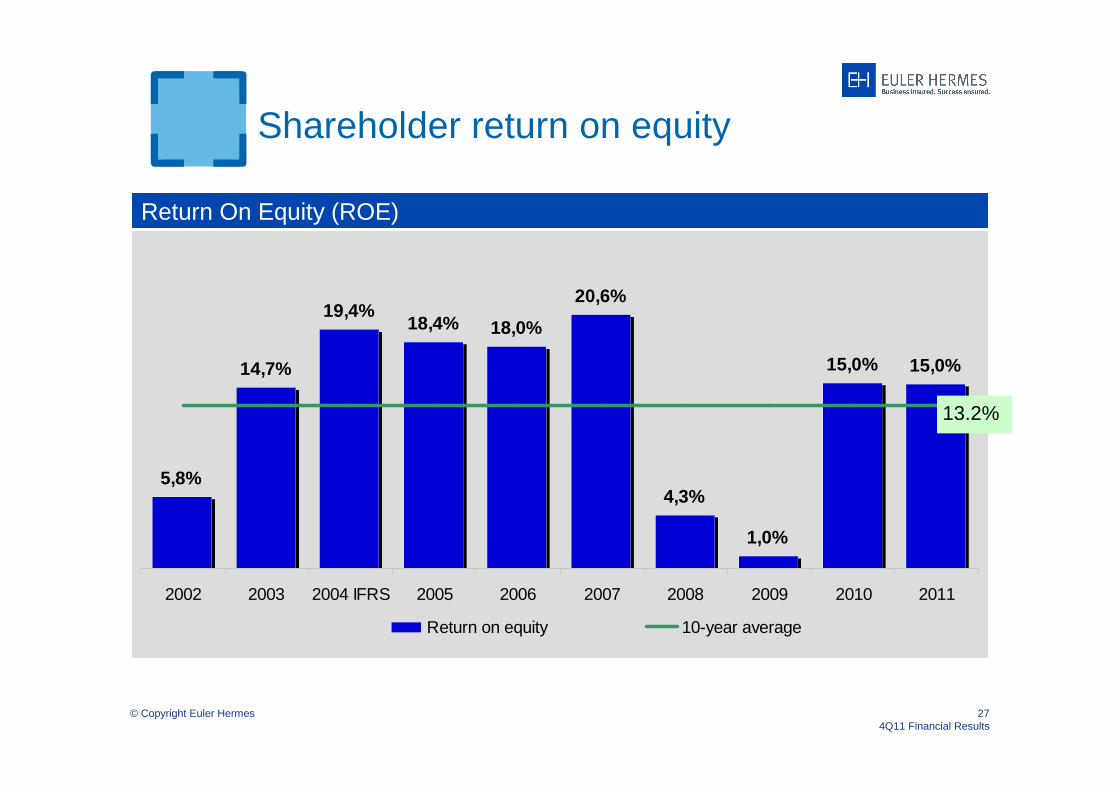
Shareholder return on equity
Return On Equity (ROE)
5,8%
14,7%
19,4%18,4% 18,0%
20,6%
4,3%
1,0%
15,0% 15,0%
2002 2003 2004 IFRS 2005 2006 2007 2008 2009 2010 2011
Return on equity 10-year average
13.2%
© Copyright Euler Hermes 284Q11 Financial Results
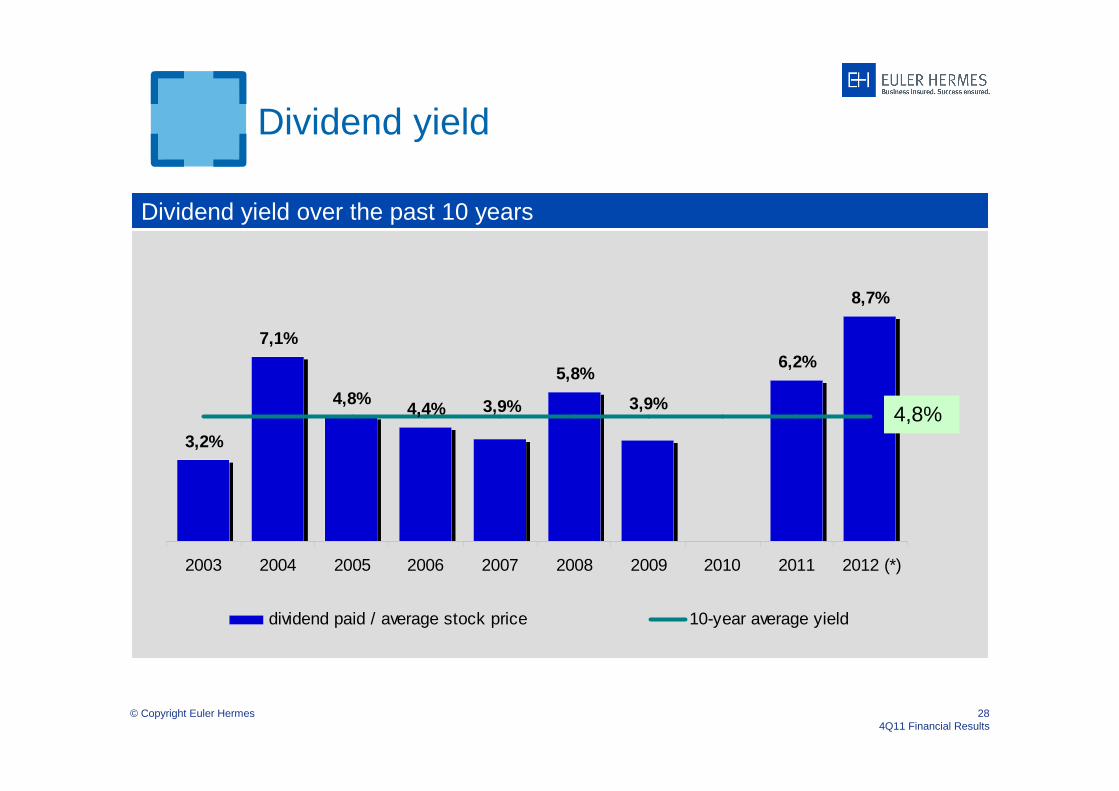
Dividend yield
Dividend yield over the past 10 years
3,2%
7,1%
4,8%4,4%
5,8%6,2%
8,7%
3,9%3,9%
2003 2004 2005 2006 2007 2008 2009 2010 2011 2012 (*)
dividend paid / average stock price 10-year average yield
4,8%
© Copyright Euler Hermes 294Q11 Financial Results
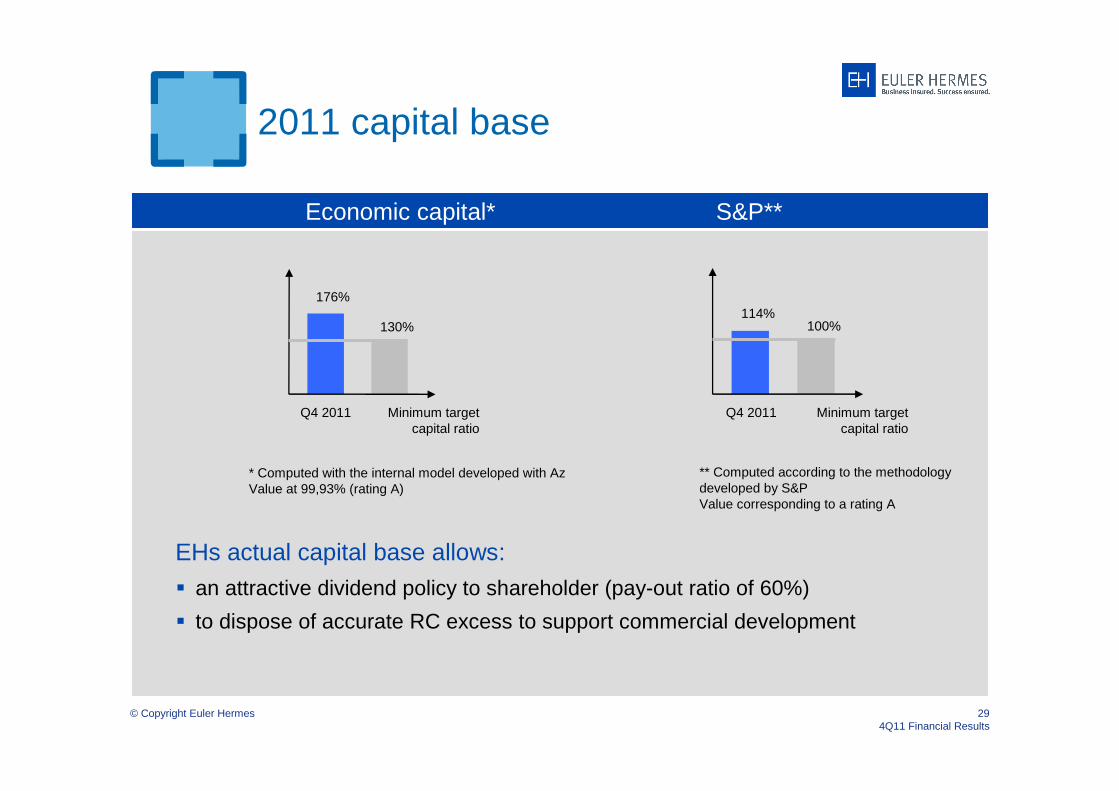
Economic capital* S&P**
EHs actual capital base allows:
� an attractive dividend policy to shareholder (pay-out ratio of 60%)
� to dispose of accurate RC excess to support commercial development
* Computed with the internal model developed with AzValue at 99,93% (rating A)
176%
130%
Q4 2011 Minimum target capital ratio
** Computed according to the methodology developed by S&PValue corresponding to a rating A
114%100%
Q4 2011 Minimum target capital ratio
2011 capital base

Appendices
© Copyright Euler Hermes 314Q11 Financial Results
15.3
3Q11
12.7
2Q11(€ mn) 1Q09 2Q09 3Q09 4Q09 1Q10 2Q10 3Q10 4Q10 1Q11 4Q11
New Business
Lost Premiums
Rate Variation
Organic Variation 72.1 44.1 24.9 12.6 80.3 23.8 14.9 19.7 -41.6 27.0
Total : 255 Total : 259
Retention rate 82% Retention rate 85%
Increase +13% Increase +8% Decrease -5%on renewed portfolio
Retention rate 89%on renewed portfolio
Total : 270
-31,3-33,2-34,9-79,8
-35,7-54,5-97,7
-65,9-69,2-84,9
-66,4-40,6
57,064,290,0
52,1 48,984,2
60,4 57,5 77,1 63,5 60,7 68,3
-10,0
-1,5
46,367,1
42,0 29,693,8
17,9
-2,1
-38,9 -15,9 -12,2
Credit insurance portfolio evolution
© Copyright Euler Hermes 324Q11 Financial Results
1. [mostly currency change impact]
46.5
3Q11
38.2
2Q11(€ mn) 1Q09 2Q09 3Q09 4Q09 1Q10 2Q10 3Q10 4Q10 1Q11 4Q11
Organic Variation
Volume Variation
Other Variations 1
Total Variation 53.5 20.3 -31.8 -52.5 41.7 49.9 3.6 18.5 -33.5 65.1
Decrease -14% Decrease -3% Increase +8%on renewed portfolio
21,97,0
-35,5-20,6-44,6
-69,2 -50,4
-8,8
9,229,6 34,0 26,9
16,34,2
-8,5-21,5-10,4
34,9
11,84,2
-12,0
1,9 11,7
-18,3
14,944,172,1
24,9 12,680,3
23,8 19,7
-41,6
12,7 15,3 27,0
Credit insurance portfolio evolution
© Copyright Euler Hermes 334Q11 Financial Results
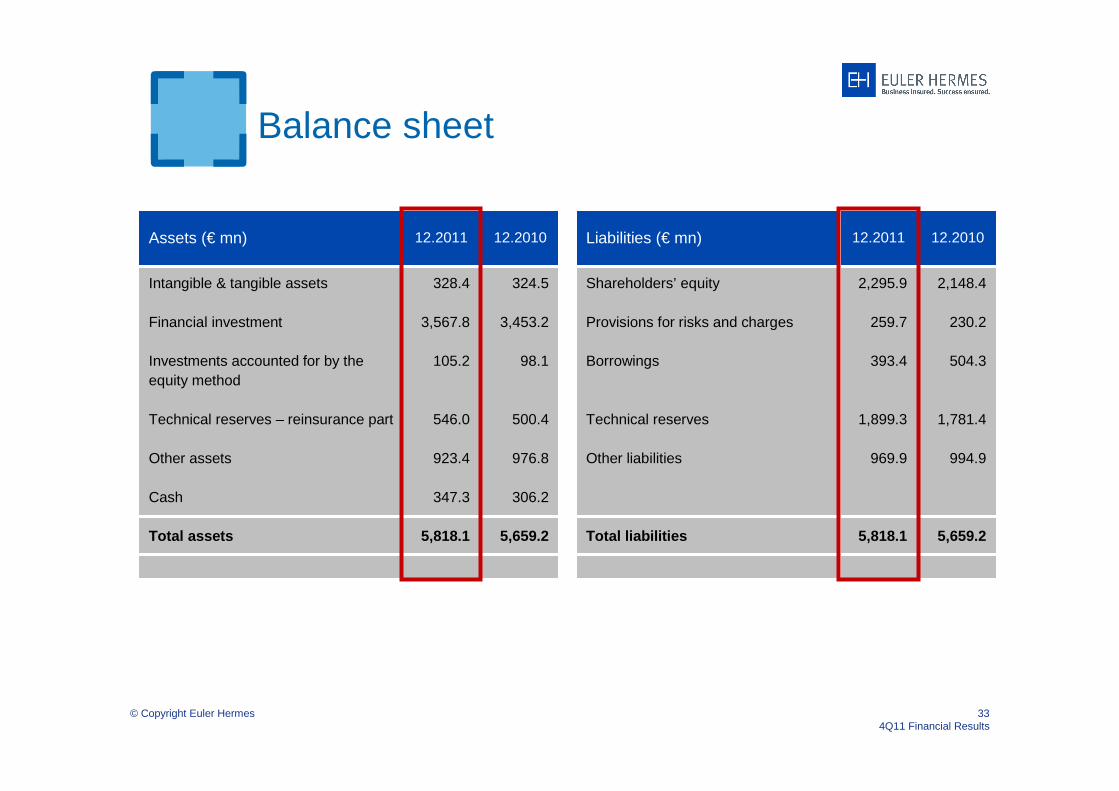
Balance sheet
328.4
3,567.8
105.2
546.0
923.4
347.3
5,818.1
324.5
3,453.2
98.1
500.4
976.8
306.2
5,659.2
Intangible & tangible assets
Financial investment
Investments accounted for by the equity method
Technical reserves – reinsurance part
Other assets
Cash
Total assets
Assets (€ mn) 12.2011 12.2010
2,295.9
259.7
393.4
1,899.3
969.9
5,818.1
2,148.4
230.2
504.3
1,781.4
994.9
5,659.2
Shareholders’ equity
Provisions for risks and charges
Borrowings
Technical reserves
Other liabilities
Total liabilities
Liabilities (€ mn) 12.2011 12.2010
© Copyright Euler Hermes 344Q11 Financial Results
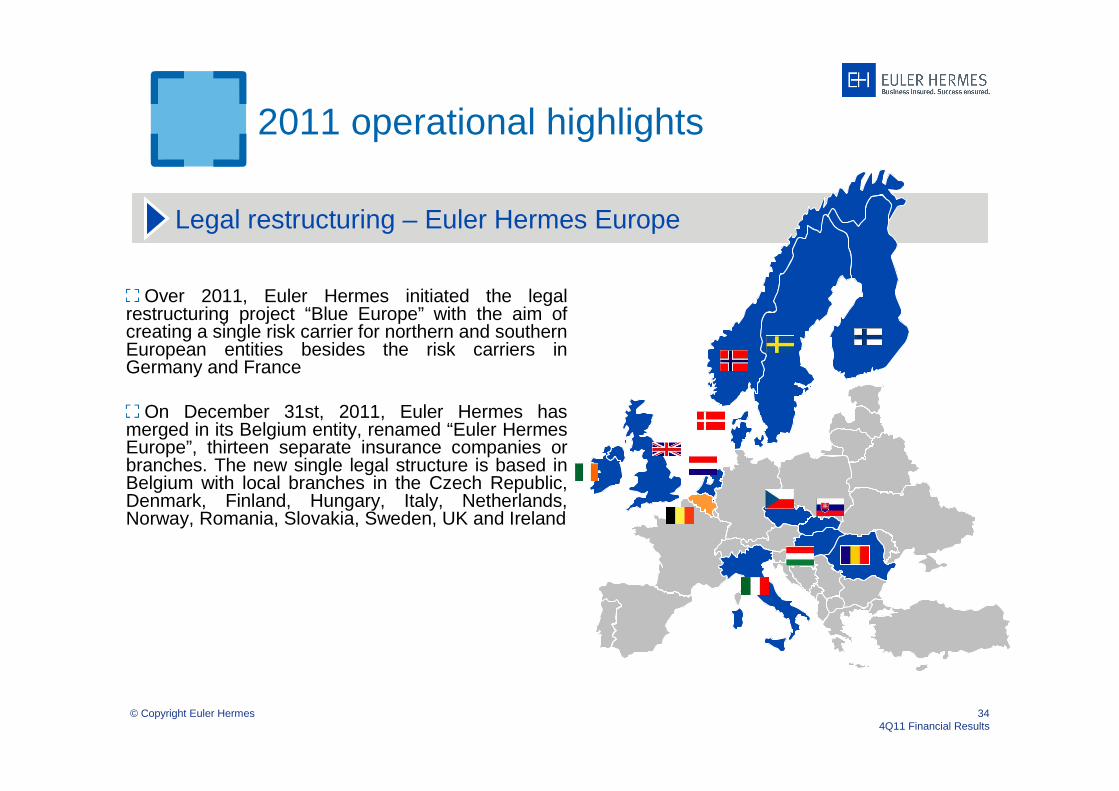
2011 operational highlights
Legal restructuring – Euler Hermes Europe
Over 2011, Euler Hermes initiated the legal restructuring project “Blue Europe” with the aim of creating a single risk carrier for northern and southern European entities besides the risk carriers in Germany and France
On December 31st, 2011, Euler Hermes has merged in its Belgium entity, renamed “Euler Hermes Europe”, thirteen separate insurance companies or branches. The new single legal structure is based in Belgium with local branches in the Czech Republic, Denmark, Finland, Hungary, Italy, Netherlands, Norway, Romania, Slovakia, Sweden, UK and Ireland
© Copyright Euler Hermes 354Q11 Financial Results
2011 operational highlights
Joint-venture with Mapfre
In 2011, Euler Hermes signed a memorandum of understanding with Spanish insurer Mapfre to build a strategic alliance
This joint venture will help Euler Hermes to grow in Iberian and Latin American markets
Mapfre will play its role as a strong distribution and sales partner and Euler Hermes will bring its expertise in credit risk underwriting, its systems, rules and standards
364Q11 Financial Results
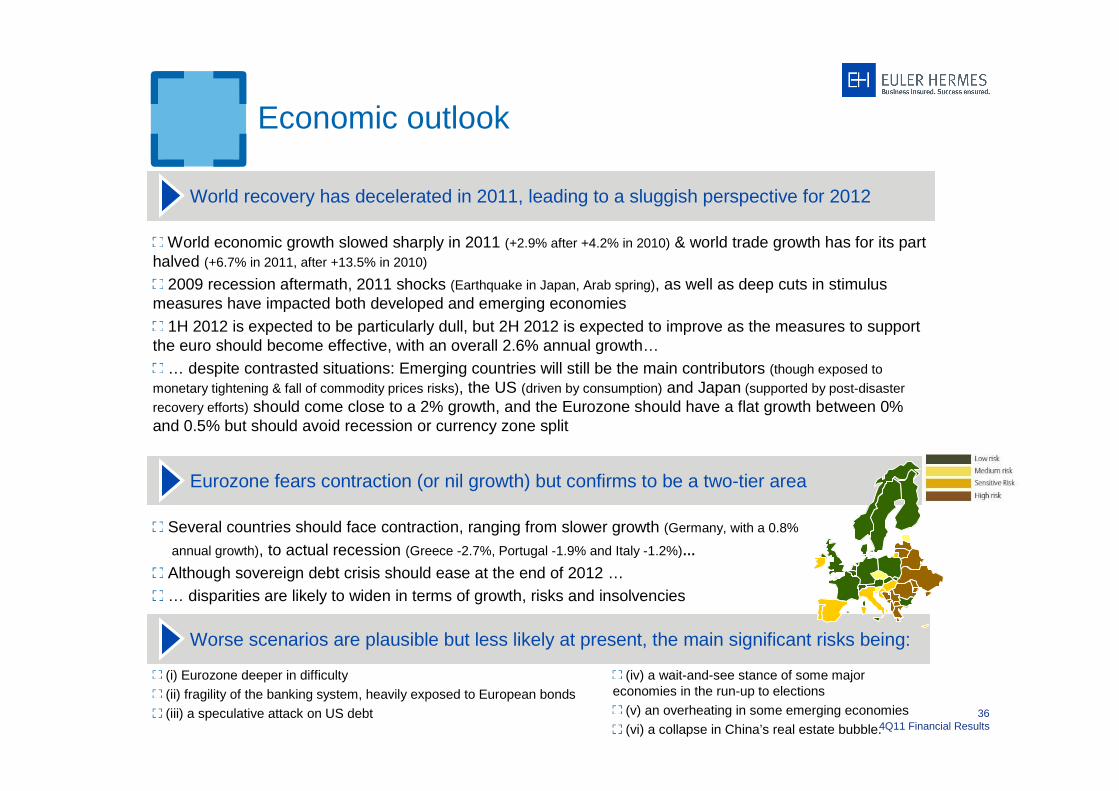
Eurozone fears contraction (or nil growth) but confirms to be a two-tier area
World recovery has decelerated in 2011, leading to a sluggish perspective for 2012
Economic outlook
World economic growth slowed sharply in 2011 (+2.9% after +4.2% in 2010) & world trade growth has for its part halved (+6.7% in 2011, after +13.5% in 2010)
2009 recession aftermath, 2011 shocks (Earthquake in Japan, Arab spring), as well as deep cuts in stimulus measures have impacted both developed and emerging economies
1H 2012 is expected to be particularly dull, but 2H 2012 is expected to improve as the measures to support the euro should become effective, with an overall 2.6% annual growth…
… despite contrasted situations: Emerging countries will still be the main contributors (though exposed to
monetary tightening & fall of commodity prices risks), the US (driven by consumption) and Japan (supported by post-disaster
recovery efforts) should come close to a 2% growth, and the Eurozone should have a flat growth between 0% and 0.5% but should avoid recession or currency zone split
Several countries should face contraction, ranging from slower growth (Germany, with a 0.8%
annual growth), to actual recession (Greece -2.7%, Portugal -1.9% and Italy -1.2%)…
Although sovereign debt crisis should ease at the end of 2012 …… disparities are likely to widen in terms of growth, risks and insolvencies
Worse scenarios are plausible but less likely at present, the main significant risks being:
(i) Eurozone deeper in difficulty
(ii) fragility of the banking system, heavily exposed to European bonds
(iii) a speculative attack on US debt
(iv) a wait-and-see stance of some major economies in the run-up to elections
(v) an overheating in some emerging economies
(vi) a collapse in China’s real estate bubble.
© Copyright Euler Hermes 374Q11 Financial Results
90
100
110
120
130
140
150
160
170
00 01 02 03 04 05 06 07 08 09 10 11 12
world industrial output
world trade ofmerchandises
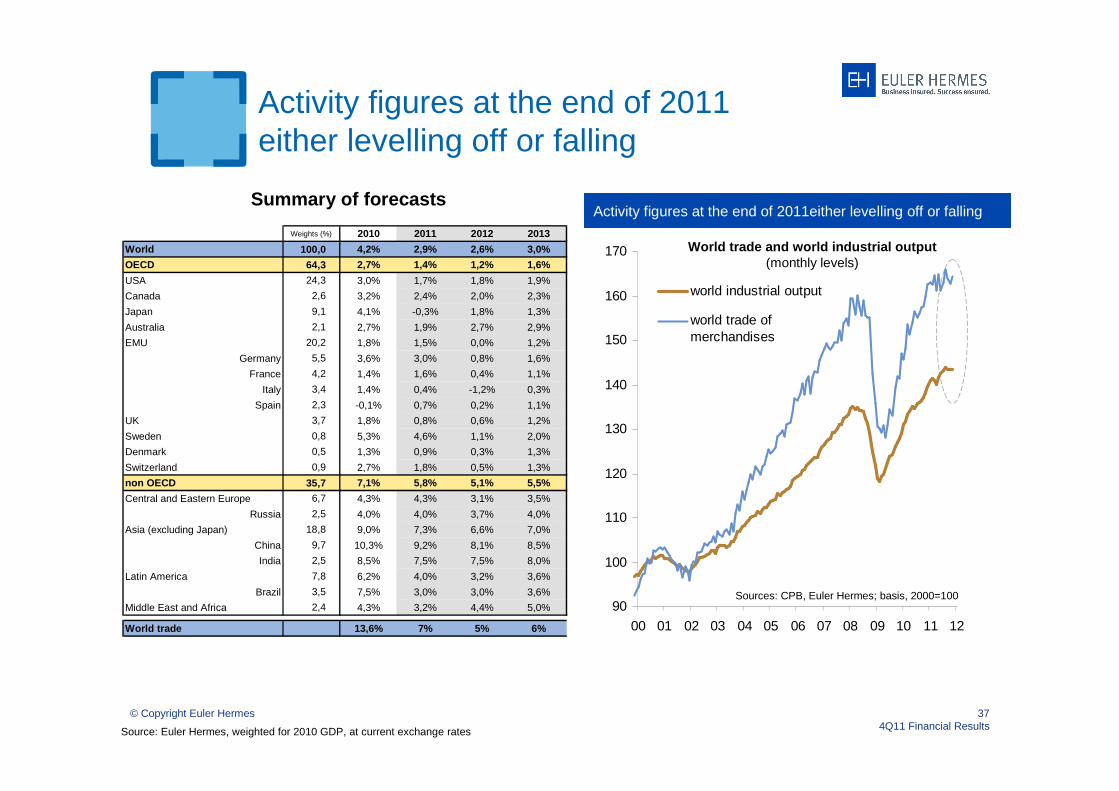
Activity figures at the end of 2011either levelling off or falling
Source: Euler Hermes, weighted for 2010 GDP, at current exchange rates
Summary of forecastsActivity figures at the end of 2011either levelling off or falling
World trade and world industrial output(monthly levels)
Sources: CPB, Euler Hermes; basis, 2000=100
Weights (%) 2010 2011 2012 2013
World 100,0 4,2% 2,9% 2,6% 3,0%
OECD 64,3 2,7% 1,4% 1,2% 1,6%
USA 24,3 3,0% 1,7% 1,8% 1,9%
Canada 2,6 3,2% 2,4% 2,0% 2,3%
Japan 9,1 4,1% -0,3% 1,8% 1,3%
Australia 2,1 2,7% 1,9% 2,7% 2,9%
EMU 20,2 1,8% 1,5% 0,0% 1,2%
Germany 5,5 3,6% 3,0% 0,8% 1,6%
France 4,2 1,4% 1,6% 0,4% 1,1%
Italy 3,4 1,4% 0,4% -1,2% 0,3%
Spain 2,3 -0,1% 0,7% 0,2% 1,1%
UK 3,7 1,8% 0,8% 0,6% 1,2%
Sweden 0,8 5,3% 4,6% 1,1% 2,0%
Denmark 0,5 1,3% 0,9% 0,3% 1,3%
Switzerland 0,9 2,7% 1,8% 0,5% 1,3%
non OECD 35,7 7,1% 5,8% 5,1% 5,5%
Central and Eastern Europe 6,7 4,3% 4,3% 3,1% 3,5%
Russia 2,5 4,0% 4,0% 3,7% 4,0%
Asia (excluding Japan) 18,8 9,0% 7,3% 6,6% 7,0%
China 9,7 10,3% 9,2% 8,1% 8,5%
India 2,5 8,5% 7,5% 7,5% 8,0%
Latin America 7,8 6,2% 4,0% 3,2% 3,6%
Brazil 3,5 7,5% 3,0% 3,0% 3,6%
Middle East and Africa 2,4 4,3% 3,2% 4,4% 5,0%
World trade 13,6% 7% 5% 6%
© Copyright Euler Hermes 384Q11 Financial Results
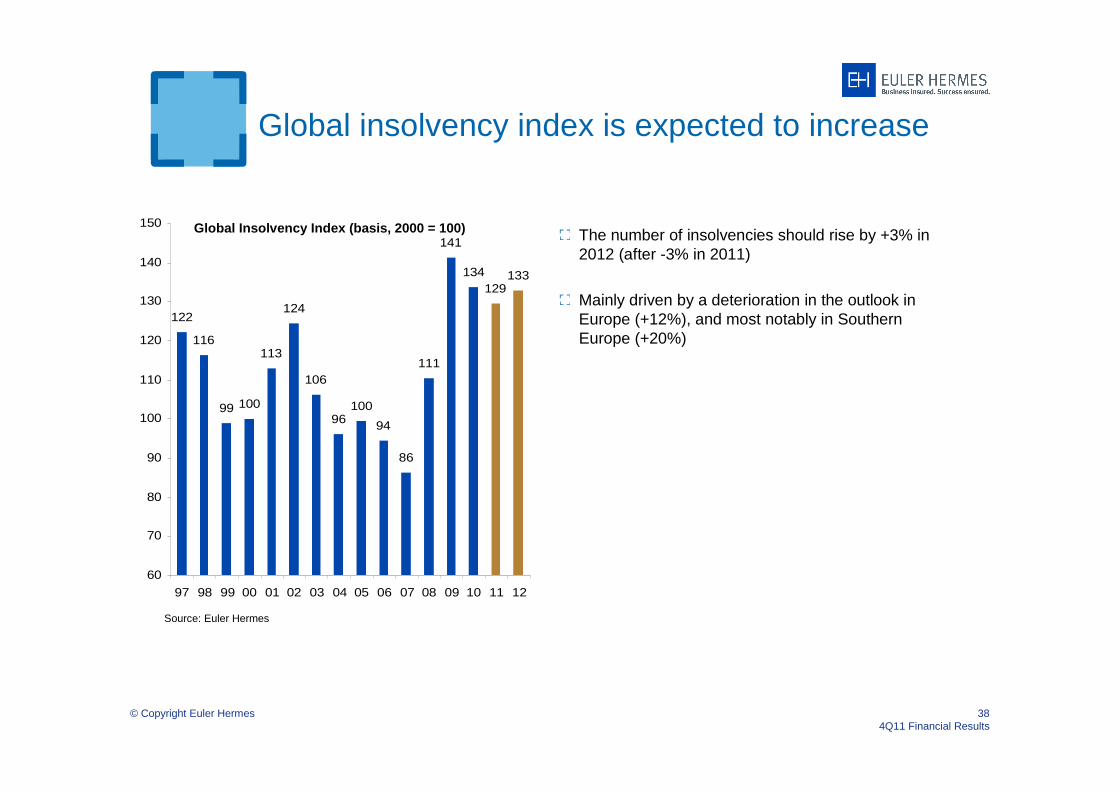
Global insolvency index is expected to increase
Global Insolvency Index (basis, 2000 = 100)
122
116
99 100
113
124
106
96100
94
86
111
141
134129
133
60
70
80
90
100
110
120
130
140
150
97 98 99 00 01 02 03 04 05 06 07 08 09 10 11 12
Source: Euler Hermes
The number of insolvencies should rise by +3% in 2012 (after -3% in 2011)
Mainly driven by a deterioration in the outlook in Europe (+12%), and most notably in Southern Europe (+20%)
© Copyright Euler Hermes 394Q11 Financial Results
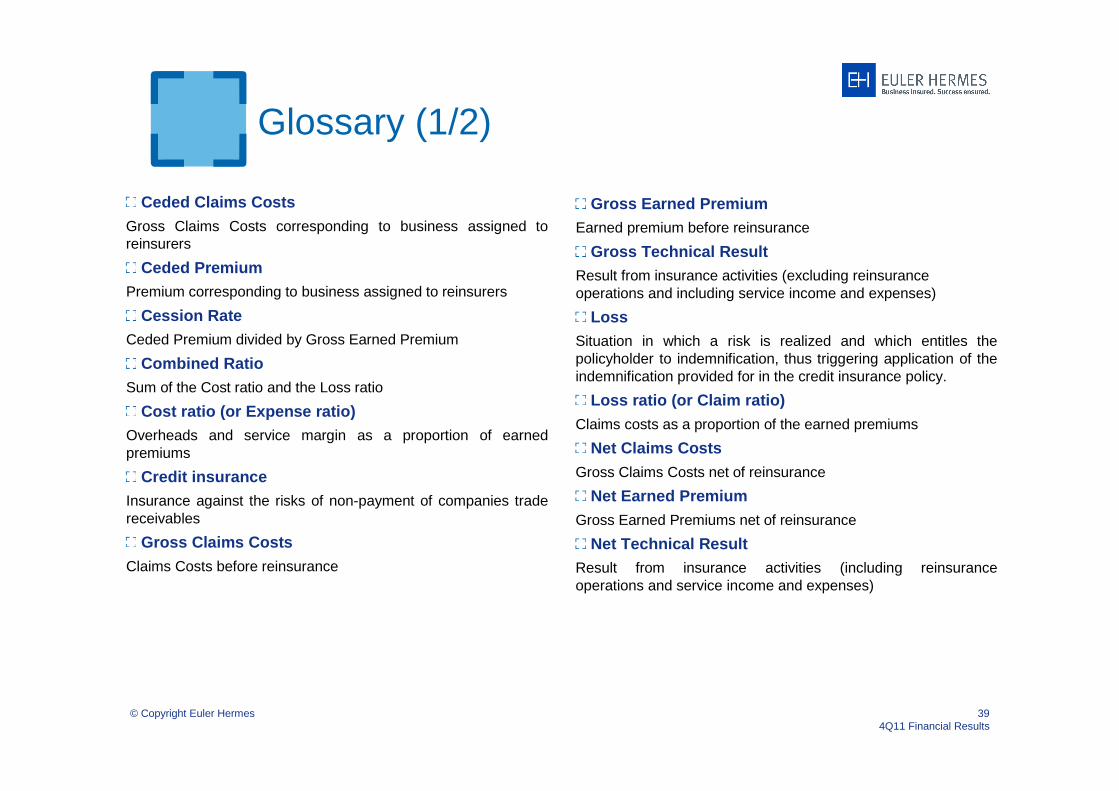
Glossary (1/2)
Ceded Claims CostsGross Claims Costs corresponding to business assigned to reinsurers
Ceded PremiumPremium corresponding to business assigned to reinsurers
Cession RateCeded Premium divided by Gross Earned Premium
Combined RatioSum of the Cost ratio and the Loss ratio
Cost ratio (or Expense ratio)Overheads and service margin as a proportion of earned premiums
Credit insuranceInsurance against the risks of non-payment of companies trade receivables
Gross Claims CostsClaims Costs before reinsurance
Gross Earned PremiumEarned premium before reinsurance
Gross Technical ResultResult from insurance activities (excluding reinsurance operations and including service income and expenses)
LossSituation in which a risk is realized and which entitles the policyholder to indemnification, thus triggering application of the indemnification provided for in the credit insurance policy.
Loss ratio (or Claim ratio)Claims costs as a proportion of the earned premiums
Net Claims CostsGross Claims Costs net of reinsurance
Net Earned PremiumGross Earned Premiums net of reinsurance
Net Technical ResultResult from insurance activities (including reinsurance operations and service income and expenses)
© Copyright Euler Hermes 404Q11 Financial Results
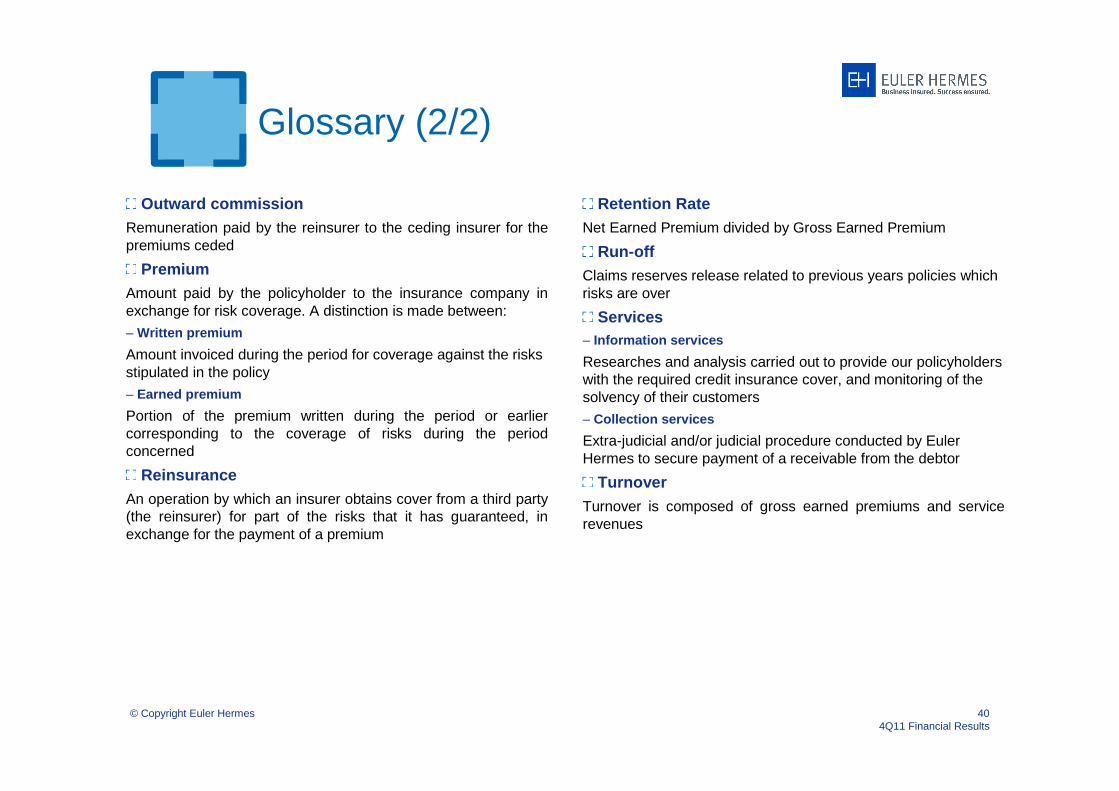
Glossary (2/2)
Outward commissionRemuneration paid by the reinsurer to the ceding insurer for thepremiums ceded
PremiumAmount paid by the policyholder to the insurance company in exchange for risk coverage. A distinction is made between:
– Written premium
Amount invoiced during the period for coverage against the risksstipulated in the policy
– Earned premium
Portion of the premium written during the period or earlier corresponding to the coverage of risks during the period concerned
ReinsuranceAn operation by which an insurer obtains cover from a third party (the reinsurer) for part of the risks that it has guaranteed, inexchange for the payment of a premium
Retention Rate Net Earned Premium divided by Gross Earned Premium
Run-offClaims reserves release related to previous years policies whichrisks are over
Services– Information services
Researches and analysis carried out to provide our policyholderswith the required credit insurance cover, and monitoring of the solvency of their customers
– Collection services
Extra-judicial and/or judicial procedure conducted by Euler Hermes to secure payment of a receivable from the debtor
TurnoverTurnover is composed of gross earned premiums and service revenues
© Copyright Euler Hermes 414Q11 Financial Results
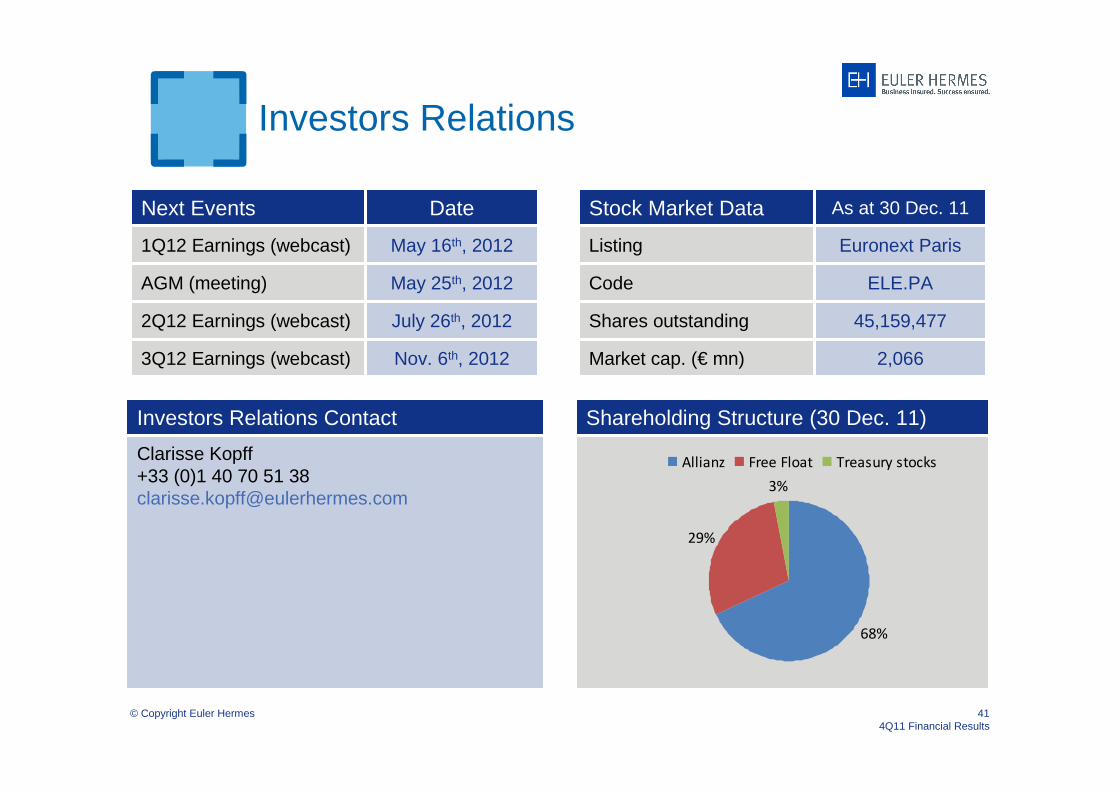
Investors Relations
1Q12 Earnings (webcast)
Next Events Date
May 16th, 2012
Clarisse Kopff+33 (0)1 40 70 51 [email protected]
Investors Relations Contact Shareholding Structure (30 Dec. 11)
Listing
Code
Shares outstanding
Market cap. (€ mn)
Stock Market Data As at 30 Dec. 11
Euronext Paris
ELE.PA
45,159,477
2,066
68%
29%
3%
Allianz Free Float Treasury stocks
AGM (meeting) May 25th, 2012
2Q12 Earnings (webcast) July 26th, 2012
3Q12 Earnings (webcast) Nov. 6th, 2012