2011 facts and figures
TRANSCRIPT

Ibrahim Forum 2011
African Agriculture: From Meeting Needs To Creating Wealth
Agriculture Africa Biofuels Technology Rural
Infrastructure Maputo Declaration SeedsFertiliser Capital Intra-African trade SuNutrition River basins Crops Livestock Hunger Research Arable Food loss Smallholder Green Revolution AGRA Supply power Rural Commodities Land
Supply Women Youth ExpConflicts Land NEPADAfrican Union Equity
Governance Precipitation REC NEPAD Food security ExL’Aquila Purchasing power CAADP Exports t rade Agribusiness MalnutritionAfrican Agriculture:
From Meeting Needs To Creating WealthTunis, November 2011Revised Edition

Food For thought
2.4 billion more people to feed by 2050
one tractor per 320 people economically active in agriculture
79% of Africa’s arable land remains uncultivated
1.2 billion more African citizens by 2050
27 African countries have signed CAAdP compacts
Annual post-harvest grain losses in sub-Saharan Africa average $4 billion
15,500 litres of water are required to produce 1kg of beef
40% of the unemployed in Africa are young people
16% of Africa’s land is arable, the largest share in the world
rate of youth inactivity is 62% in North Africa and 42% in sub-Saharan Africa
the Congo basin is shared by 11 countries and discharges 40,000 m3 of water
into the Atlantic ocean every second
only nine African countries have reached the Maputo target
Biofuel production could require 35 million hectares of land by 2030
Population of 30 African countries will more than double by 2050
half the population on every continent will be living in cities by 2050
3.5 million more tractors are needed to put Africa on a par with other regions
227 million hectares of developing countries’ land has been sold, leased or
licensed since 2001
It takes eight times more water to produce coffee than tea
Nine of the top 20 economies in the world also feature in the 10 countries
with largest agricultural output
Africa’s transboundary river basins contain 93% of its total surface water
resources
global production of ethanol more than tripled between 2000 and 2010
It takes one litre of water to grow one calorie of food
World’s top five agribusinesses have a combined turnover of $285 billion,
equal to the gdP of Columbia
Women grow 80% - 90% of the food in sub-Saharan Africa but own less than
2% of all land
1 INCreASINg deMANd: A MArKet WIth hIgh PoteNtIAL 2
MORE PEOPLE TO FEED 2
MORE PEOPLE LIVING IN CITIES 3
WHAT’S IN STORE FOR AFRICA? 5
MORE MONEY FOR FOOD? 6
TOWARDS SECURE FOOD? 7
FOCUS: HOW MANY HUNGRY PEOPLE? 7
CHANGING NUTRITION MODELS 8
CONFLICTING DEMANDS 9
SPOTLIGHT: THE WATER-ENERGY-FOOD NEXUS 10
2 deCreASINg SuPPLY: eVerYWhere But AFrICA? 11AGRICULTURE: THE NEW PATH TO GROWTH? 11
AFRICAN LAND: WORLD’S GREATEST RESERVES 13
LAND ACQUISITIONS: DRIVERS, OPPORTUNITIES, THREATS 20
SPOTLIGHT: LAND DEALS – IN WHOSE INTEREST? 22
AFRICAN WATER: MAKING GOOD CHOICES 23
SPOTLIGHT: WATER PRINTS AND FOOD CHOICES 26
3 groWINg IMBALANCeS: A NeW geoStrAtegIC ISSue 27RISING PRICES, GROWING VOLATILITY 27
A NEW SPECULATION BUBBLE? 29
FOOD INSECURITY AND INFLATION: TRIGGERS FOR SOCIAL UNREST AND REGIONAL CONFLICTS? 30
SPOTLIGHT: IMPACT OF CLIMATE CHANGE 33
4 FroM Food SeCurItY to CreAtINg WeALth: hoW to MAKe It hAPPeN IN AFrICA 34COUNTING ASSETS 34
FILLING THE GAPS 35
RESEARCH: TOO MANY INSTITUTIONS, NOT ENOUGH RESOURCES 38
SPOTLIGHT: A GREEN REVOLUTION IN AFRICA? 39
5 AgrICuLture ANd Food: doINg BuSINeSS, AttrACtINg INVeStMeNt 41MAKING MONEY FROM AGRICULTURE 41
AGRIBUSINESS IN AFRICA 43
A “NEW FRONTIER” FOR PRIVATE FINANCE 45
SPOTLIGHT: INTRA-AFRICAN TRADE 47
6 FroM CoMMItMeNtS to IMPLeMeNtAtIoN: SettINg AN AgeNdA 49PROMOTING AGRICULTURE ON THE INTERNATIONAL AGENDA 49
MAKING AGRICULTURE A PUBLIC PRIORITY IN AFRICA 52
SPOTLIGHT: EUROPEAN COMMON AGRICULTURAL POLICY 55
ANNEX: REGIONAL ECONOMIC COMMUNITY - FACTCARDS 56
REFERENCES 60
ACRONYMS 62
A large range of sources have been used in the creation of this document - see References at the end of the report. Where significant amounts of data have been drawn
from a single source, citations are provided as footnotes.
The Mo Ibrahim Foundation is committed to making data freely available and accessible to all citizens of the continent and interested stakeholders. We welcome and
encourage any accurate reproduction, translation and dissemination of this material. The material must be attributed to © Mo Ibrahim Foundation.
The Mo Ibrahim Foundation gives special thanks to Vimbai Mutandwa, and to Liz Wilson and Katy Wilson from Agriculture for Impact, Imperial College London, for
contributing their time and knowledge to this research.
CoNteNtS
1
More PeoPLe to Feed
2
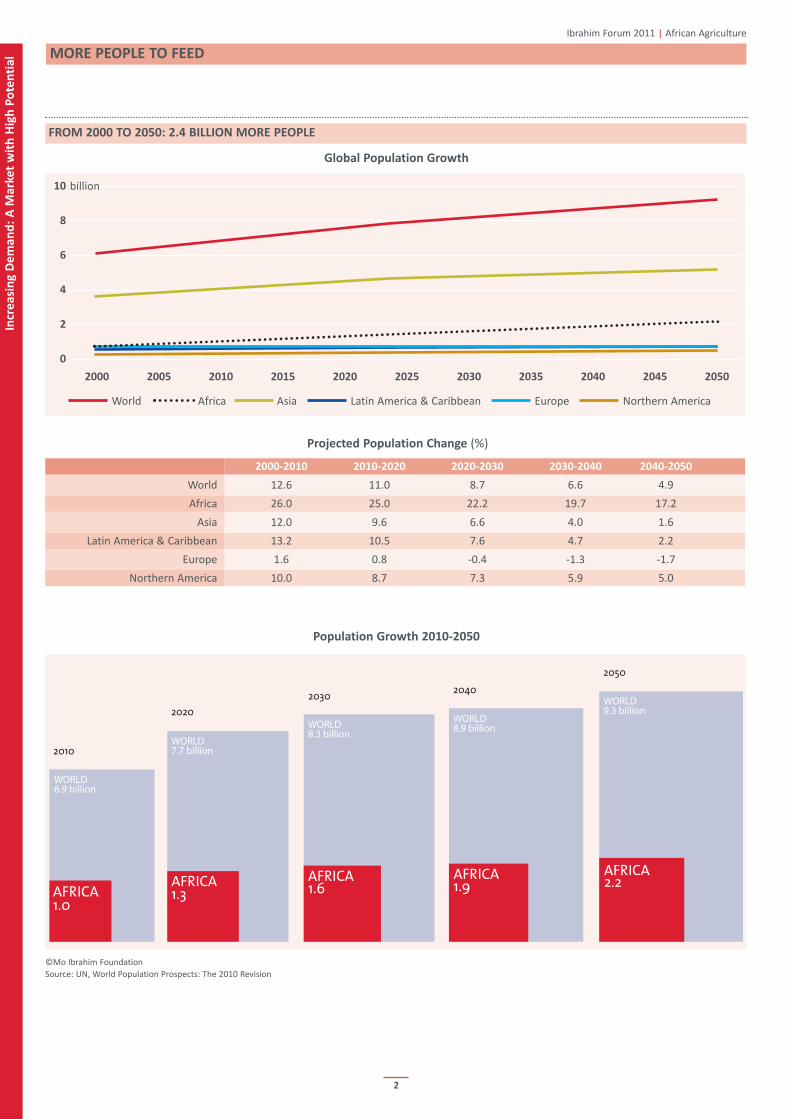
FroM 2000 to 2050: 2.4 BILLIoN More PeoPLe
©Mo Ibrahim FoundationSource: UN, World Population Prospects: The 2010 Revision
Incr
ea
sin
g d
em
an
d:
A M
ark
et
wit
h h
igh
Po
ten
tia
l
global Population growth
Projected Population Change (%)
2000-2010 2010-2020 2020-2030 2030-2040 2040-2050
World 12.6 11.0 8.7 6.6 4.9
Africa 26.0 25.0 22.2 19.7 17.2
Asia 12.0 9.6 6.6 4.0 1.6
Latin America & Caribbean 13.2 10.5 7.6 4.7 2.2
Europe 1.6 0.8 -0.4 -1.3 -1.7
Northern America 10.0 8.7 7.3 5.9 5.0
2000 2005 2010 2015 2020 2025 2030 2035 2040 2045 2050
World Africa Asia Latin America & Caribbean Europe Northern America
10
8
6
4
2
0
Ibrahim Forum 2011 | African Agriculture
billion
AFRICA1.0
2010
WORLD6.9 billion
AFRICA1.3
2020
WORLD7.7 billion
2030
AFRICA1.6
WORLD8.3 billion
2040
AFRICA1.9
WORLD8.9 billion
2050
AFRICA2.2
WORLD9.3 billion
Population growth 2010-2050

More PeoPLe LIVINg IN CItIeS
3
Incr
ea
sin
g d
em
an
d:
A M
ark
et
wit
h h
igh
Po
ten
tia
l
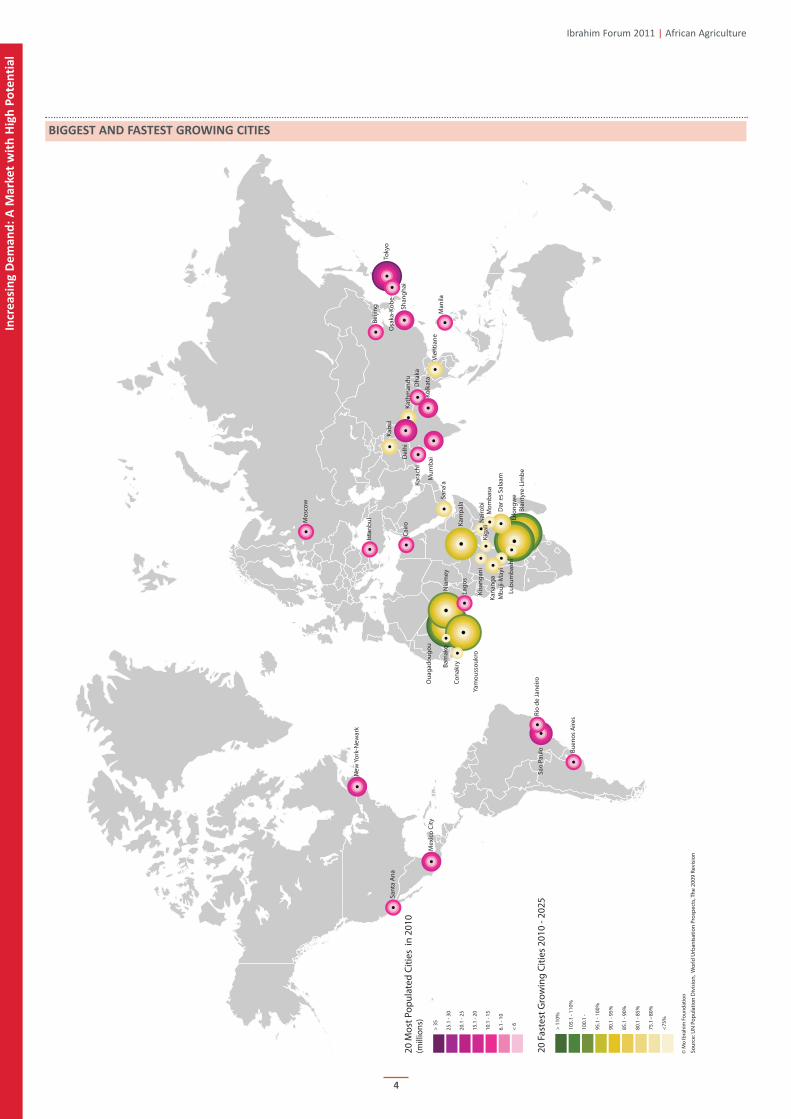
BY 2050: hALF the PoPuLAtIoN oN eVerY CoNtINeNt WILL Be LIVINg IN CItIeS
Urbanisation brings major changes in demand for agricultural and food products. Urban expansion requires more food to be transported and
distributed within cities and increases demand for water.
- The rate of global urbanisation is expected to increase to 70% by 2050.
- Africa and Asia are projected to experience the largest growth in their urban populations.
Source: UN, World Population Prospects: The 2010 Revision
- Between 2010 and 2025, 16 of the top 20 fastest growing cities in the world will be in Africa.
- The population of five of the fastest growing cities will double.
* Only cities with population above 750,000 are considered.Source: UN, World Urbanisation Prospects: The 2009 Revision
urban Population as % of total Population
2010 2020 2030 2040 2050
World Africa Asia Latin America & Caribbean Europe Northern America
100
90
80
70
60
50
40
30
20
10
0
Biggest Cities in the World
20 Most Populated Cities in 2010 20 Fastest growing Cities* 2010 - 2025
City Population (millions) City % change
Tokyo 36.7 Ouagadougou 127.1
Delhi 22.2 Lilongwe 106.4
São Paulo 20.3 Blantyre-Limbe 106.2
Mumbai 20.0 Yamoussoukro 103.0
Mexico City 19.5 Niamey 101.0
New York-Newark 19.4 Kampala 99.5
Shanghai 16.6 Dar es Salaam 85.2
Kolkata 15.6 Kathmandu 84.7
Dhaka 14.6 Kabul 84.6
Karachi 13.1 Sana'a 83.4
Buenos Aires 13.1 Vientiane 80.6
Los Angeles-Long Beach-Santa Ana 12.8 Kananga 80.3
Beijing 12.4 Kigali 79.9
Rio de Janeiro 11.9 Kisangani 79.8
Manila 11.6 Mombasa 79.0
Osaka-Kobe 11.3 Mbuji-Mayi 78.6
Cairo 11.0 Lubumbashi 77.8
Lagos 10.6 Nairobi 77.3
Moscow 10.5 Conakry 75.8
Istanbul 10.5 Bamako 74.9
Ibrahim Forum 2011 | African Agriculture
4
BIggeSt ANd FASteSt groWINg CItIeS
Incr
ea
sin
g d
em
an
d:
A M
ark
et
wit
h h
igh
Po
ten
tia
l
Ibrahim Forum 2011 | African Agriculture
20 M
ost P
opul
ated
Citi
es i
n 20
10(m
illio
ns)
< 6
6.1
- 10
10.1
- 15
15.1
- 20
20.1
- 25
25.1
- 30
> 35
Sour
ce: U
N P
opul
atio
n D
ivis
ion,
Wor
ld U
rban
isat
ion
Pros
pect
s, Th
e 20
09 R
evis
ion
Toky
o
Mos
cow
Del
hi
Sao
Paul
o
Mum
bai
Mex
ico
City
New
Yor
k-N
ewar
k
Shan
ghai
Kolk
ata
Dha
kaKa
rach
i
Buen
os A
ires
Sant
a A
na
Beiji
ng
Rio
de Ja
neiro
Man
ila
Osa
ka-K
obe
Cairo
Ista
nbul
80.1
- 85
%
75.1
- 80
%
<75%
85.1
- 90
%
90.1
- 95
%
95.1
- 10
0%
100.
1 -
105.
1 - 1
10%
> 11
0%
20 F
aste
st G
row
ing
Citie
s 20
10 -
2025
Cona
kryBa
mak
oN
iam
ey
Yam
ouss
oukr
o
Oua
gado
ugou
Kisa
ngan
i
Kana
nga
Mbu
ji-M
ayi
Lubu
mba
shi
Blan
tyre
-Lim
beLi
long
we
Dar
es
Sala
am
Mom
basa
Nai
robi
Kam
pala
Kiga
li
Sana
'aVi
entia
ne
Kath
man
du
Kabu
l
Bigg
est a
nd F
aste
st G
row
ing
Citie
s
© M
o Ib
rahi
m F
ound
atio
n
Lago
s

WhAt’S IN Store For AFrICA?
5
BetWeeN 2010 ANd 2050
Sources: UN, World Population Prospects: The 2010 Revision and WDI
Incr
ea
sin
g d
em
an
d:
A M
ark
et
wit
h h
igh
Po
ten
tia
l
1.2 Billion More African Citizens
2010 2020 2030 2040 2050
450
400
350
300
250
200
150
100
50
0
half of Africa's Population Will Be Living In Cities By 2030
2000 2005 2010 2015 2020 2025 2030 2035 2040 2045 2050
Ibrahim Forum 2011 | African Agriculture
Alg
eria
An
gola
Ben
inB
ots
wan
aB
urk
ina
Faso
Bu
run
di
Cam
ero
on
Cap
e V
erd
eC
entr
al A
fric
an R
ep.
Ch
adC
om
oro
sC
on
goC
ôte
d'Iv
oir
eC
on
go, D
R.
Djib
ou
tiEg
ypt
Equ
ato
rial
Gu
inea
Erit
rea
Eth
iop
iaG
abo
nG
amb
iaG
han
aG
uin
eaG
uin
ea-B
issa
uKe
nya
Leso
tho
Lib
eria
Lib
yaM
adag
asca
rM
alaw
iM
ali
Mau
rita
nia
Mau
riti
us
Mo
rocc
oM
ozam
biq
ue
Nam
ibia
Nig
erN
iger
iaR
wan
da
São
To
mé
& P
rín
cip
eSe
neg
alSe
ych
elle
sSi
erra
Leo
ne
Som
alia
Sou
th A
fric
aSu
dan
Swaz
ilan
dTo
goTu
nis
iaU
gan
da
Tan
zan
iaW
este
rn S
ahar
aZa
mb
iaZi
mb
abw
e
30 African Countries Will More than double their Populations
300
250
200
150
100
50
0
Nig
erZa
mb
iaM
alaw
iTa
nza
nia
Som
alia
Bu
rkin
a Fa
soU
gan
da
Mal
iM
adag
asca
rN
iger
iaB
enin
Rw
and
aC
had
Lib
eria
Keny
aG
amb
iaC
om
oro
sG
uin
eaSe
neg
alC
on
go, D
R.
An
gola
Erit
rea
Co
ngo
Moz
amb
iqu
eEq
uat
ori
al G
uin
eaG
uin
ea-B
issa
uSu
dan
Cô
te d
'Ivo
ire
Mau
rita
nia
Gh
ana
Cam
ero
on
Cen
tral
Afr
ican
Rep
.Si
erra
Leo
ne
Gab
on
Togo
Djib
ou
tiSã
o T
om
é &
Prí
nci
pe
Eth
iop
iaZi
mb
abw
eB
uru
nd
iN
amib
iaEg
ypt
Swaz
ilan
dLi
bya
Alg
eria
Leso
tho
Cap
e V
erd
eB
ots
wan
aM
oro
cco
Tun
isia
Sou
th A
fric
aSe
ych
elle
sM
auri
tiu
s
% c
han
ge
Rural Population Urban Population
36% 38% 40% 42% 45% 47% 50% 53% 56% 59% 62%
millions

More MoNeY For Food?
6
Ibrahim Forum 2011 | African Agriculture
Purchasing power has increased since 1990, with growing middle classes in emerging economies.
In Africa, GDP per capita has been growing steadily since 2000. In 2000 about 59 million African households earned at least $5,000, the point at
which families begin to spend half of their income on non-food items.
With increasing numbers of Africans living in urban areas, the number of households with discretionary income is projected to increase by 50%
to 128 million over the next decade.
By 2030, 18 African cities could have a combined spending power of $1.3 trillion1.
Countries Showing Consistent growth in Annual gdP per Capita (%)
2001 2002 2003 2004 2005 2006 2007 2008 2009 2010
Sierra Leone 13.8 21.8 4.1 2.7 3.0 3.8 3.5 3.0 0.9 2.7
Mozambique 9.0 5.9 3.2 5.1 5.7 6.0 4.7 4.3 4.0 4.8
Cape Verde 2.0 2.8 4.5 -2.1 10.4 8.9 7.6 5.3 2.7 4.5
Tanzania 3.3 4.4 4.0 5.0 4.5 3.8 4.1 4.4 3.0 3.9
Nigeria 0.6 -0.9 7.6 7.9 2.8 3.6 3.8 3.4 4.4 5.2
São Tomé & Príncipe . 9.8 3.8 5.0 4.1 5.1 4.4 4.2 2.3 2.7
Uganda 1.9 5.3 3.1 3.4 2.9 7.2 4.9 5.2 3.8 1.9
Tunisia 3.7 0.5 4.9 5.1 3.0 4.6 5.3 3.6 2.0 2.6
Morocco 6.2 2.1 5.1 3.6 1.9 6.6 1.6 4.5 3.9 2.2
Egypt 1.7 0.5 1.3 2.2 2.6 4.9 5.2 5.3 5.3 3.4
Ghana 1.5 2.0 2.7 3.1 3.4 3.9 3.9 5.9 2.2 4.1
Zambia 2.4 0.9 2.7 3.0 2.9 3.6 3.5 2.9 3.5 5.9
Mali 8.8 1.0 4.2 -1.0 2.8 2.1 1.1 1.8 1.3 1.4
WorLd 3.1
Source: EIU CountryData
Africa’s Population growth 2010-2050
©Mo Ibrahim FoundationSource: United Nations, World Population Prospects: The 2010 Revision.
1 McKinsey Global Institute, 2010
ALGERIA
BOTSWANA
BURKINA FASO
CAMEROON
CAPE VERDE
SAO TOME & PRINCIPE
CHAD
COMOROS
DEMOCRATIC REPUBLIC OF CONGO
ANGOLA
CONGO
CENTRAL AFRICAN REPUBLIC
COTE D'IVOIRE
DJIBOUTI
EQUATORIAL GUINEA
ETHOPIA
GABON
GHANA
GUINEAGUINEA-BISSAU
SOUTH AFRICALESOTHO
LIBERIA
LIBYA
EGYPT
MADAGASCAR
MAURITANIA
MALI
MAURITIUS
MOROCCO
MOZAMBIQUE
NIGER
NIGERIABENIN
SENEGALGAMBIA
SEYCHELLES
SIERRA LEONE
SOMALIA
KENYA
SUDAN
SOUTHSUDAN
ERITREA
SWAZILAND
NAMIBIA
TOGO
TUNISIA
UGANDA
RWANDA
ZAMBIA
TANZANIA
MALAWI
ZIMBABWE
BURUNDI
0 - 20%
21 - 40%
41 - 60%
61 - 80%
81 - 100%
101 - 120%
121 - 140%
141 - 160%
> 160%
Average Growth 2010 - 2050
20102050
180,000
90,00030,000
15,00090030075
Total Population
Incr
ea
sin
g d
em
an
d:
A M
ark
et
wit
h h
igh
Po
ten
tia
l

Incr
ea
sin
g d
em
an
d:
A M
ark
et
wit
h h
igh
Po
ten
tia
ltoWArdS SeCure Food?
7
Food security exists “when all people at all times have access to sufficient, safe, nutritious food to maintain a healthy and active life”2.
It encompasses:
- Food availability: sufficient quantities of food available on a consistent basis.
- Food access: sufficient resources to obtain appropriate food for a nutritious diet.
- Food use: appropriate use based on knowledge of basic nutrition and care, as well as adequate water and sanitation.
eAtINg eNough?
hunger
- There are 925 million undernourished people in the world, equivalent to the population of Africa or the population of North America
and Europe combined. 240 million of them live in sub-Saharan Africa.
- Five million children under five die each year from undernutrition.
- One in four children - approximately 146 million - in developing countries are underweight.
- the cost of hunger to developing nations is estimated to be $450 billion per year.
- In Africa the greatest levels of hunger are found in Burundi, Chad, Democratic Republic of Congo and Eritrea: more than half of the
populations of these four countries are undernourished3.
- Between 1990 and 2010, Democratic Republic of Congo has experienced the greatest deterioration in food security. Three out of four
of its population are now undernourished3.
- In Burundi, Ethiopia, Madagascar, Malawi and Rwanda, more than half of children are stunted (low height for their age) .
- Angola, Ethiopia, Ghana and Mozambique have made the most absolute progress in Global Hunger Indices between 1990 and 2010.
Focus: how Many hungry People?
In 2010 the World had 6.9 billion people, 3.5 billion city dwellers and over 900 million hungry people... Africa had 1 billion people,
400 million city dwellers and over 240 million hungry…
In 2050 the World will have 2.4 billion more people, 2.8 billion more city dwellers…How many more hungry?
Africa will have 1.2 billion more people, approximately 800 million more city dwellers…How many more hungry?
eAtINg WeLL?
Malnutrition
Good nutrition requires more than having enough to eat. This means:
- Knowledge of basic nutrition.
- Essential nutrients in appropriate amounts.
- Equitable access to nutritious foods.
- Malnutrition during the first 1000 days of life is largely irreversible.
- Child malnutrition leads to poor growth, poor physical and mental development and increased morbidity.
- Iron deficiency affects an estimated two billion people. eradicating iron deficiency can improve productivity levels by as much as 20%.
- Iodine deficiency is the greatest single cause of mental retardation and brain damage, affecting 1.9 billion people. It can easily and
cheaply be prevented by adding iodine to salt.
- Malnutrition is a major contributor to the burden and cost of diseases.
- Malnutrition worsens the cases of people affected by HIV/AIDS, tuberculosis and malaria.
- Non-Communicable Disease (NCD) deaths are projected to increase by 15% between 2010 and 2020, with the greatest increases in
Africa. NCDs are estimated to cause more than 3.9 million deaths in Africa by 2020.
- The prevalence of raised blood pressure is highest in Africa, 46% for both sexes combined.
- obesity is a growing disease in Africa, in line with hIV and malnutrition. Malnutrition and obesity can co-exist at the same time and
in the same country.
- In South Africa, ⅓ of men and more than ½ of women are overweight or obese.
- In Morocco 40% of the population are overweight and in Kenya 12%.
- Somalia has the 12th highest number of cardiovascular disease deaths in the world, 601 per 100,000 population. Sudan and egypt
are ranked 16th and 18th respectively.
- type II diabetes is becoming increasingly prevalent and concerning in Africa. In 2009 17% of the population (20-79) of Mauritius
had diabetes, the highest proportion in the world.
2 World Food Summit, 19963 Measured by the Global Hunger Index
Ibrahim Forum 2011 | African Agriculture
>150
110 - 12990 - 109
70 - 8950 - 69
30 - 49<30
130 - 149
Bovine Meat
Sheep and Goat Meat
Milk
Average Consumption (kcal/person/day)
Produce
© MO IBRAHIM FOUNDATION
CAPE VERDEMAURITANIA
ALGERIA
MOROCCO
TUNISIA
EGYPTLIBYA
MALI NIGER
BURKINA FASO
WORLD AVERAGE
CHAD SUDAN ERITREA
SOMALIA
KENYA
CENTRAL AFRICAN REPUBLIC
SEYCHELLES
BOTSWANANAMIBIA
SWAZILAND
LESOTHOSOUTH AFRICA
MAURITIUS
SENEGAL
ChANgINg NutrItIoN ModeLS
8
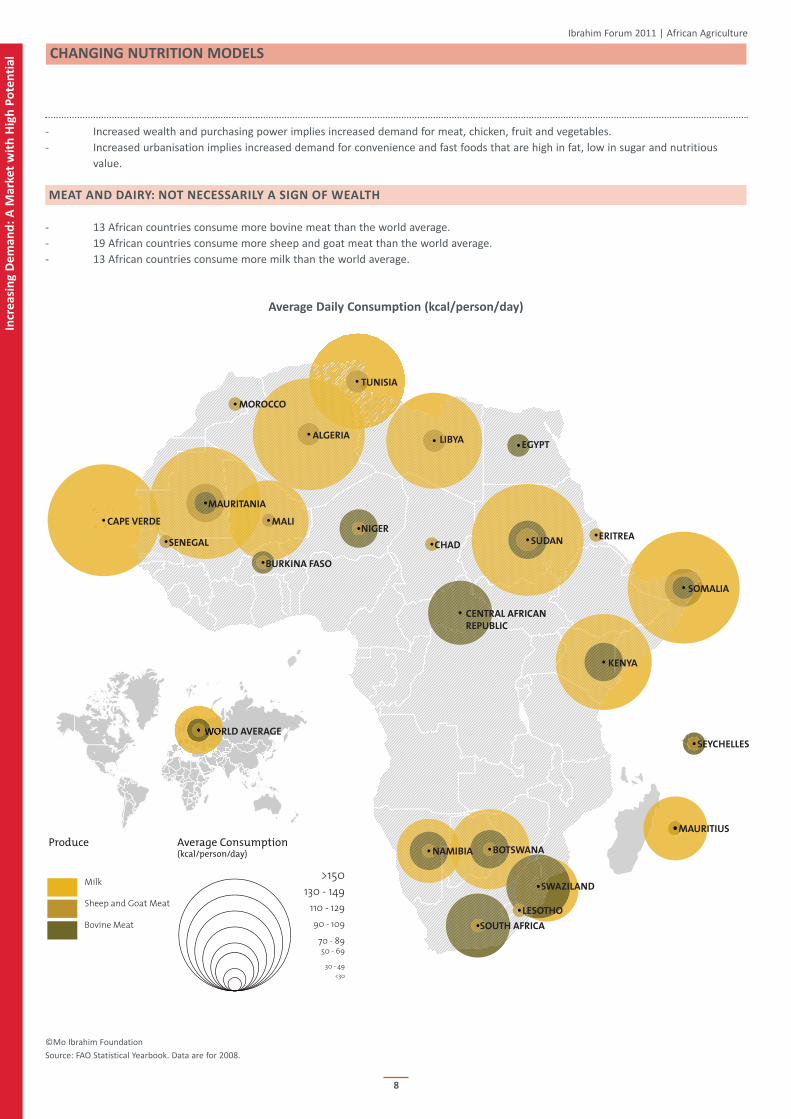
- Increased wealth and purchasing power implies increased demand for meat, chicken, fruit and vegetables.
- Increased urbanisation implies increased demand for convenience and fast foods that are high in fat, low in sugar and nutritious
value.
MeAt ANd dAIrY: Not NeCeSSArILY A SIgN oF WeALth
- 13 African countries consume more bovine meat than the world average.
- 19 African countries consume more sheep and goat meat than the world average.
- 13 African countries consume more milk than the world average.
Average daily Consumption (kcal/person/day)
©Mo Ibrahim Foundation
Source: FAO Statistical Yearbook. Data are for 2008.
Ibrahim Forum 2011 | African Agriculture
Incr
ea
sin
g d
em
an
d:
A M
ark
et
wit
h h
igh
Po
ten
tia
l
Incr
ea
sin
g d
em
an
d:
A M
ark
et
wit
h h
igh
Po
ten
tia
lCoNFLICtINg deMANdS
9
BIoFueLS
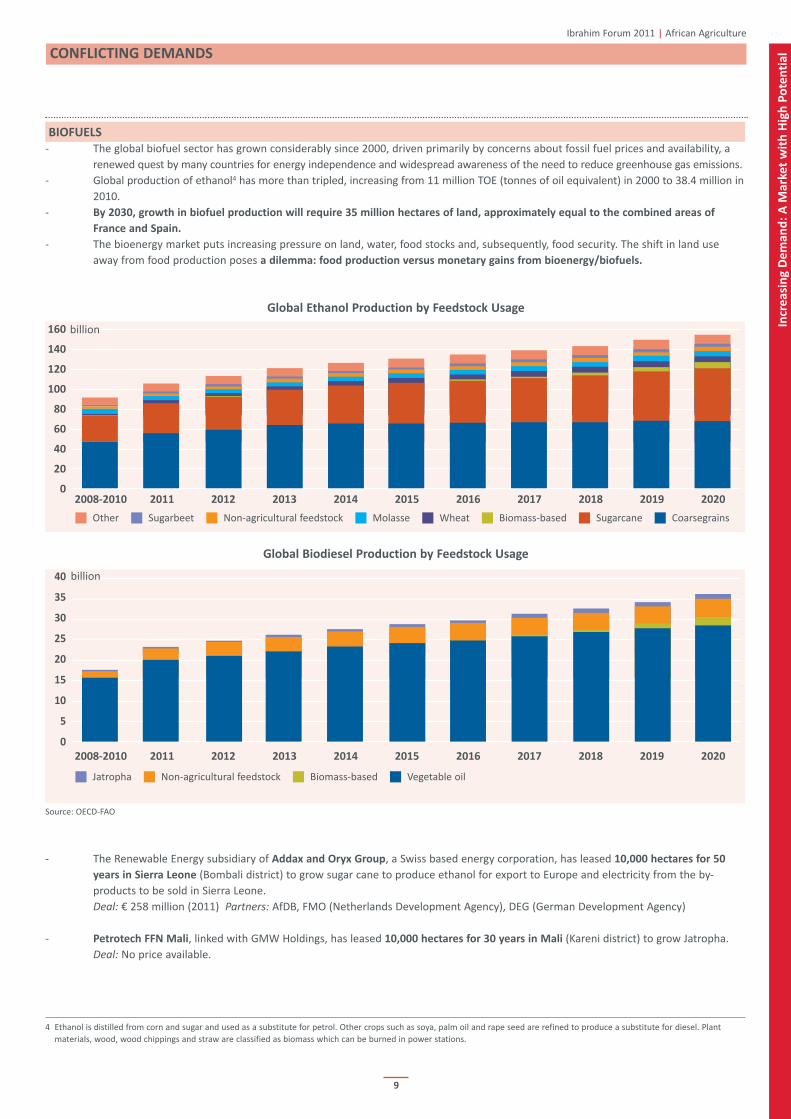
- The global biofuel sector has grown considerably since 2000, driven primarily by concerns about fossil fuel prices and availability, a
renewed quest by many countries for energy independence and widespread awareness of the need to reduce greenhouse gas emissions.
- Global production of ethanol4 has more than tripled, increasing from 11 million TOE (tonnes of oil equivalent) in 2000 to 38.4 million in
2010.
- By 2030, growth in biofuel production will require 35 million hectares of land, approximately equal to the combined areas of
France and Spain.
- The bioenergy market puts increasing pressure on land, water, food stocks and, subsequently, food security. The shift in land use
away from food production poses a dilemma: food production versus monetary gains from bioenergy/biofuels.
global ethanol Production by Feedstock usage
global Biodiesel Production by Feedstock usage
Source: OECD-FAO
- The Renewable Energy subsidiary of Addax and oryx group, a Swiss based energy corporation, has leased 10,000 hectares for 50
years in Sierra Leone (Bombali district) to grow sugar cane to produce ethanol for export to Europe and electricity from the by-
products to be sold in Sierra Leone.
Deal: € 258 million (2011) Partners: AfDB, FMO (Netherlands Development Agency), DEG (German Development Agency)
- Petrotech FFN Mali, linked with GMW Holdings, has leased 10,000 hectares for 30 years in Mali (Kareni district) to grow Jatropha.
Deal: No price available.
4 Ethanol is distilled from corn and sugar and used as a substitute for petrol. Other crops such as soya, palm oil and rape seed are refined to produce a substitute for diesel. Plantmaterials, wood, wood chippings and straw are classified as biomass which can be burned in power stations.
2008-2010 2011 2012 2013 2014 2015 2016 2017 2018 2019 2020
g Other g Sugarbeet g Non-agricultural feedstock g Molasse g Wheat g Biomass-based g Sugarcane g Coarsegrains
160
140
120
100
80
60
40
20
0
Ibrahim Forum 2011 | African Agriculture
billion
2008-2010 2011 2012 2013 2014 2015 2016 2017 2018 2019 2020
g Jatropha g Non-agricultural feedstock g Biomass-based g Vegetable oil
40
35
30
25
20
15
10
5
0
billion

10
Incr
ea
sin
g d
em
an
d:
A M
ark
et
wit
h h
igh
Po
ten
tia
l
Ibrahim Forum 2011 | African Agriculture
EnergySecurity
FoodSecurity
WaterSecurity
ChronicShortages
ChronicShortages
WaterCrisis
EconomicDamage
Social Unrest
Social Unrest
Social Unrest
EnvironmentalPressures
EnergyCrisis
FoodCrisis
Population and Economic
Growth
GeopoliticalCon!ict
groWINg drug CroPS?
- Africa ranks among the regions with the highest number and volume of annual local cannabis seizures.
- It is estimated that Africa accounts for ¼ of global cannabis production.
- There are 14 major producers in Africa: Benin, Côte d’Ivoire, Democratic Republic of Congo, Egypt, Ghana, Guinea, Malawi, Morocco,
Nigeria, South Africa, Swaziland, Tanzania, Togo and Zambia.
SPotLIght: the WAter-eNergY-Food NexuS
- Production of food requires water and energy, and is sensitive to the cost of energy inputs.
- Water extraction and distribution requires energy.
- Energy production requires water and food.
©Mo Ibrahim Foundation
Source: WEF, 2011
AgrICuLture: the NeW PAth to groWth?
11
de
cre
asi
ng
Su
pp
ly:
eve
ryw
he
re b
ut
in A
fric
a?
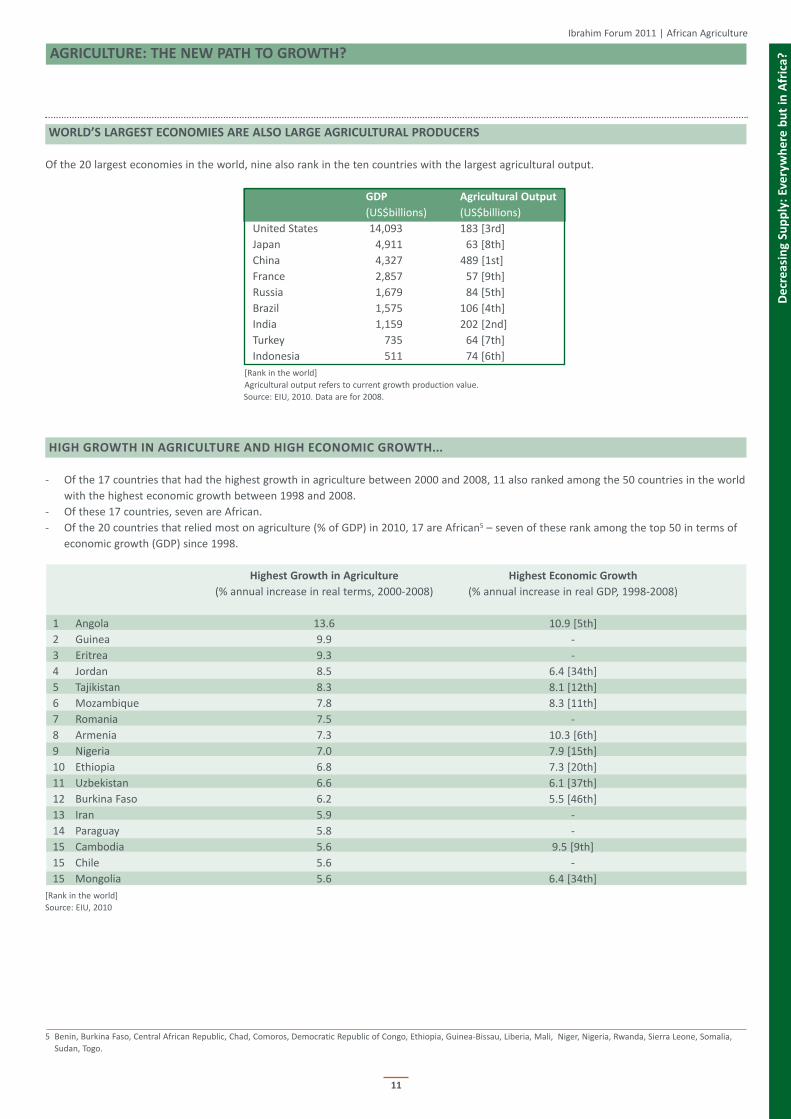
WorLd’S LArgeSt eCoNoMIeS Are ALSo LArge AgrICuLturAL ProduCerS
Of the 20 largest economies in the world, nine also rank in the ten countries with the largest agricultural output.
gdP Agricultural output
(US$billions) (US$billions)
United States 14,093 183 [3rd]
Japan 4,911 63 [8th]
China 4,327 489 [1st]
France 2,857 57 [9th]
Russia 1,679 84 [5th]
Brazil 1,575 106 [4th]
India 1,159 202 [2nd]
Turkey 735 64 [7th]
Indonesia 511 74 [6th]
[Rank in the world]Agricultural output refers to current growth production value. Source: EIU, 2010. Data are for 2008.
hIgh groWth IN AgrICuLture ANd hIgh eCoNoMIC groWth...
- Of the 17 countries that had the highest growth in agriculture between 2000 and 2008, 11 also ranked among the 50 countries in the world
with the highest economic growth between 1998 and 2008.
- Of these 17 countries, seven are African.
- Of the 20 countries that relied most on agriculture (% of GDP) in 2010, 17 are African5 – seven of these rank among the top 50 in terms of
economic growth (GDP) since 1998.
highest growth in Agriculture highest economic growth
(% annual increase in real terms, 2000-2008) (% annual increase in real GDP, 1998-2008)
1 Angola 13.6 10.9 [5th]
2 Guinea 9.9 -
3 Eritrea 9.3 -
4 Jordan 8.5 6.4 [34th]
5 Tajikistan 8.3 8.1 [12th]
6 Mozambique 7.8 8.3 [11th]
7 Romania 7.5 -
8 Armenia 7.3 10.3 [6th]
9 Nigeria 7.0 7.9 [15th]
10 Ethiopia 6.8 7.3 [20th]
11 Uzbekistan 6.6 6.1 [37th]
12 Burkina Faso 6.2 5.5 [46th]
13 Iran 5.9 -
14 Paraguay 5.8 -
15 Cambodia 5.6 9.5 [9th]
15 Chile 5.6 -
15 Mongolia 5.6 6.4 [34th]
[Rank in the world]Source: EIU, 2010
5 Benin, Burkina Faso, Central African Republic, Chad, Comoros, Democratic Republic of Congo, Ethiopia, Guinea-Bissau, Liberia, Mali, Niger, Nigeria, Rwanda, Sierra Leone, Somalia,Sudan, Togo.
Ibrahim Forum 2011 | African Agriculture

12
de
cre
asi
ng
Su
pp
ly:
eve
ryw
he
re b
ut
in A
fric
a?
... WhILe AgrICuLture MAKeS uP LeSS thAN 2% oF gdP IN MANY deVeLoPed CouNtrIeS
*African countries ranking among 50 with highest economic growth in real GDP (1998 – 2008). Only countries with population above 500,000 are considered.
Source: EIU CountryData and CIA World Factbook. Data for Puerto Rico are from 2005; Luxembourg from 2007 and Cambodia from 2009.
Ibrahim Forum 2011 | African Agriculture
Agriculture as % of gdP (2010)
Bottom 20 countries top 20 countries
1 Hong Kong 0.0 1 Liberia 76.9
1 Singapore 0.0 2 Somalia 60.2
3 Qatar 0.1 3 Chad* 56.0
3 Macau 0.1 4 Guinea Bissau 55.2
5 Kuwait 0.3 5 Central African Republic 53.8
6 Luxembourg 0.4 6 Sierra Leone* 50.9
6 Trinidad and Tobago 0.4 7 Ethiopia* 50.0
8 Bahrain 0.5 8 Togo 46.1
9 Belgium 0.7 9 Sudan* 44.6
9 United Kingdom 0.7 10 Burma 43.1
10 UAE 0.9 11 Comoros 41.8
10 Germany 0.9 12 Mali 39.0
13 Puerto Rico 1.0 13 Democratic Republic of Congo 38.7
14 United States 1.1 14 Niger 37.0
15 Denmark 1.2 15 Benin 35.9
16 Switzerland 1.3 16 Nigeria* 35.6
17 Japan 1.4 17 Burkina Faso* 34.1
17 Taiwan 1.4 18 Rwanda* 33.6
19 Austria 1.5 19 Cambodia 33.4
20 Oman 1.6 20 Nepal 32.8
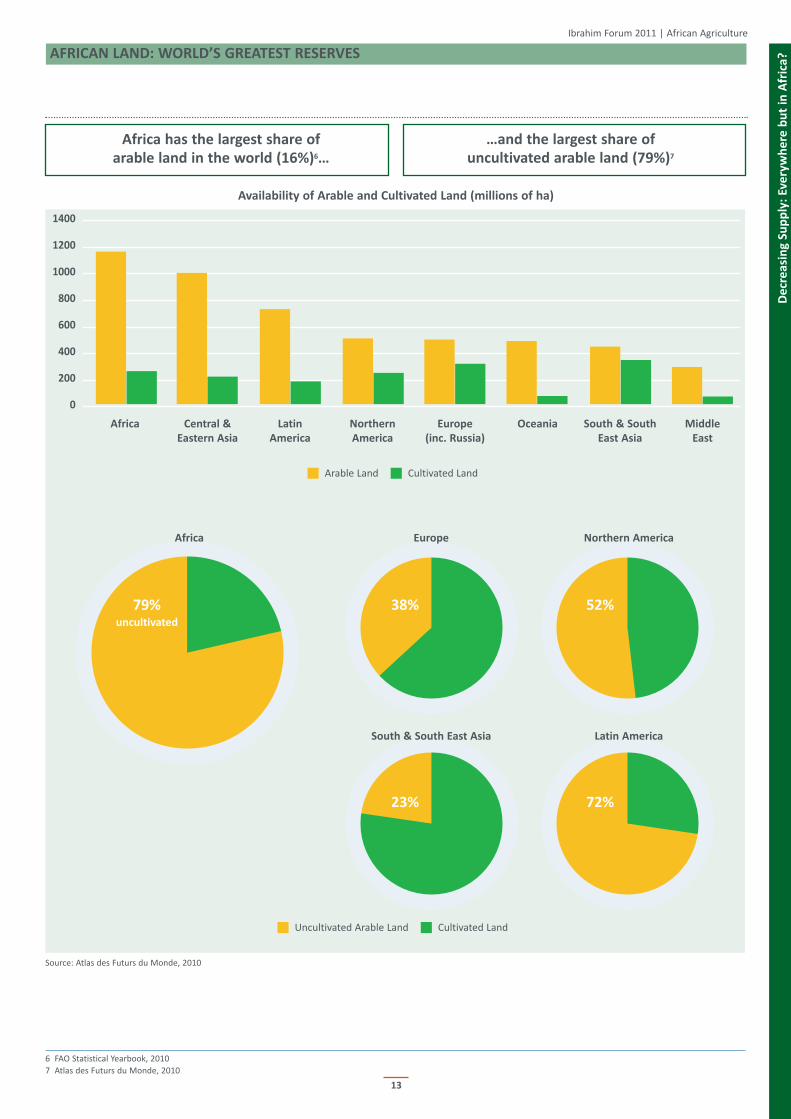
AFrICAN LANd: WorLd’S greAteSt reSerVeS
13
de
cre
asi
ng
Su
pp
ly:
eve
ryw
he
re b
ut
in A
fric
a?
Availability of Arable and Cultivated Land (millions of ha)
Source: Atlas des Futurs du Monde, 2010
6 FAO Statistical Yearbook, 20107 Atlas des Futurs du Monde, 2010
Ibrahim Forum 2011 | African Agriculture
Africa has the largest share of arable land in the world (16%)6…
…and the largest share of uncultivated arable land (79%)7
Africa Central &
eastern Asia
Latin
America
Northern
America
europe
(inc. russia)
oceania South & South
east Asia
Middle
east
g Uncultivated Arable Land g Cultivated Land
g Arable Land g Cultivated Land
1400
1200
1000
800
600
400
200
0
79%uncultivated
38% 52%
23% 72%
Latin AmericaSouth & South east Asia
europe Northern AmericaAfrica

14
de
cre
asi
ng
Su
pp
ly:
eve
ryw
he
re b
ut
in A
fric
a?
Source: FAO Statistical Yearbook, 2010. Data are for 2008.
Africa’s Land distribution
Land Area Arable Land Permanent Crops Pastoral land
(1000 ha) % of % of % of % of % of % of % of % of
Africa national continental continental national continental national continental
land land arable land land perm. crops land pastural land
Algeria 238,174 8.1 3.1 0.3 3.4 0.4 3.3 13.8 3.6Sudan 237,600 8.1 8.7 0.7 9.3 0.1 0.7 49.3 13.0Congo, DR. 226,705 7.7 3.0 0.2 3.0 0.3 2.7 6.6 1.7Libya 175,954 6.0 1.0 0.1 0.8 0.2 1.1 7.7 1.5Niger 126,670 4.3 11.4 0.5 6.5 0.0 0.2 22.7 3.2Chad 125,920 4.3 3.4 0.1 1.9 0.0 0.1 35.7 5.0Angola 124,670 4.2 2.7 0.1 1.5 0.2 1.0 43.3 6.0Mali 122,019 4.2 4.0 0.2 2.2 0.1 0.5 28.4 3.8South Africa 121,447 4.1 11.9 0.5 6.5 0.8 3.4 69.1 9.3Mauritania 103,070 3.5 0.4 0.0 0.2 0.0 0.0 38.1 4.3Ethiopia 100,000 3.4 13.6 0.5 6.1 0.9 3.2 20.0 2.2Egypt 99,545 3.4 2.8 0.1 1.2 0.8 2.7 . .Nigeria 91,077 3.1 41.2 1.3 16.8 3.3 10.7 41.7 4.2Tanzania 88,580 3.0 10.8 0.3 4.3 1.5 4.8 27.1 2.7Namibia 82,329 2.8 1.0 0.0 0.4 0.0 0.0 46.2 4.2Mozambique 78,638 2.7 5.7 0.2 2.0 0.3 0.9 56.0 4.9Zambia 74,339 2.5 3.2 0.1 1.1 0.0 0.1 26.9 2.2Somalia 62,734 2.1 1.6 0.0 0.4 0.0 0.1 68.5 4.8Central African Rep. 62,298 2.1 3.1 0.1 0.9 0.1 0.3 5.1 0.4Madagascar 58,154 2.0 5.1 0.1 1.3 1.0 2.1 64.1 4.1Kenya 56,914 1.9 9.3 0.2 2.4 0.9 1.8 37.4 2.4Botswana 56,673 1.9 0.4 0.0 0.1 0.0 0.0 45.2 2.8Cameroon 47,271 1.6 12.6 0.2 2.7 2.5 4.3 4.2 0.2Morocco 44,630 1.5 18.0 0.3 3.6 2.1 3.3 47.1 2.3Zimbabwe 38,685 1.3 9.6 0.1 1.7 0.3 0.4 31.3 1.3Congo 34,150 1.2 1.4 0.0 0.2 0.2 0.2 29.3 1.1Côte d'Ivoire 31,800 1.1 8.8 0.1 1.3 13.4 15.2 41.5 1.5Burkina Faso 27,360 0.9 23.0 0.2 2.8 0.2 0.2 21.9 0.7Gabon 25,767 0.9 1.3 0.0 0.1 0.6 0.5 18.1 0.5Guinea 24,572 0.8 9.8 0.1 1.1 2.8 2.5 43.5 1.2Ghana 22,754 0.8 19.3 0.1 2.0 12.5 10.2 36.7 0.9Uganda 19,710 0.7 28.7 0.2 2.5 11.4 8.0 25.9 0.6Senegal 19,253 0.7 18.2 0.1 1.6 0.3 0.2 29.1 0.6Tunisia 15,536 0.5 18.2 0.1 1.3 14.2 7.9 31.2 0.5Benin 11,062 0.4 23.1 0.1 1.1 2.7 1.1 5.0 0.1Eritrea 10,100 0.3 6.6 0.0 0.3 0.0 0.0 68.3 0.8Liberia 9,632 0.3 4.2 0.0 0.2 2.3 0.8 20.8 0.2Malawi 9,408 0.3 37.2 0.1 1.6 1.3 0.4 19.7 0.2Sierra Leone 7,162 0.2 25.1 0.1 0.8 1.9 0.5 30.7 0.2Togo 5,439 0.2 45.2 0.1 1.1 3.1 0.6 18.4 0.1Lesotho 3,036 0.1 11.7 0.0 0.2 0.1 0.0 65.9 0.2Guinea-Bissau 2,812 0.1 10.7 0.0 0.1 8.9 0.9 38.4 0.1Equatorial Guinea 2,805 0.1 4.7 0.0 0.1 2.7 0.3 3.7 0.0Burundi 2,568 0.1 35.0 0.0 0.4 15.2 1.4 35.0 0.1Rwanda 2,467 0.1 52.3 0.0 0.6 11.3 1.0 18.2 0.0Swaziland 1,720 0.1 10.3 0.0 0.1 0.8 0.0 60.0 0.1Gambia 1,000 <0.1 39.0 0.0 0.2 0.5 0.0 26.0 0.0Cape Verde 403 <0.1 16.1 0.0 0.0 0.7 0.0 6.2 0.0Mauritius 203 <0.1 42.9 0.0 0.0 2.0 0.0 3.4 0.0Comoros 186 <0.1 43.0 0.0 0.0 29.6 0.2 8.1 0.0São Tomé & Príncipe 96 <0.1 9.4 0.0 0.0 46.9 0.2 1.0 0.0Seychelles 46 <0.1 2.2 0.0 0.0 6.5 0.0 . .
Ibrahim Forum 2011 | African Agriculture

15
de
cre
asi
ng
Su
pp
ly:
eve
ryw
he
re b
ut
in A
fric
a?
LANd PoteNtIAL: AFrICA’S toP teN
©Mo Ibrahim Foundation
Source: FAO Statistical Yearbook. Data are for 2008.
Ibrahim Forum 2011 | African Agriculture
SOUTH AFRICA69.1% pastoral land
ALGERIA
NIGERIA41.2% arable landTOGO
45.2% arable landSIERRA LEONE25.1% arable land
GAMBIA39% arable land
MAURITANIA
MALI
LIBYA
UGANDA28.7% arable land
RWANDA52.3% arable land BURUNDI
35% arable land
SUDAN49.3% pastoral land
ERITREA68.3% pastoral land
SOMALIA68.5% pastoral land
LESOTHO65.9% pastoral land
SWAZILAND60% pastoral land
MOROCCO47.1% pastoral land
NAMIBIA46.2% pastoral land
COMOROS43% arable land
DEMOCRATIC REPUBLIC OF CONGO
ANGOLA
MADAGASCAR64.1% pastoral land
MAURITIUS42.9% arable land
CHADNIGER
MOZAMBIQUE56% pastoral land
MALAWI37.2% pastoral land
Countries with largest land area and proportion of pastoral land
Largest 10 countries by proportion of arable land
Largest 10 countries by proportion of pastoral land
Largest 10 countries by land areaKEY
16
de
cre
asi
ng
Su
pp
ly:
eve
ryw
he
re b
ut
in A
fric
a?
Ibrahim Forum 2011 | African Agriculture
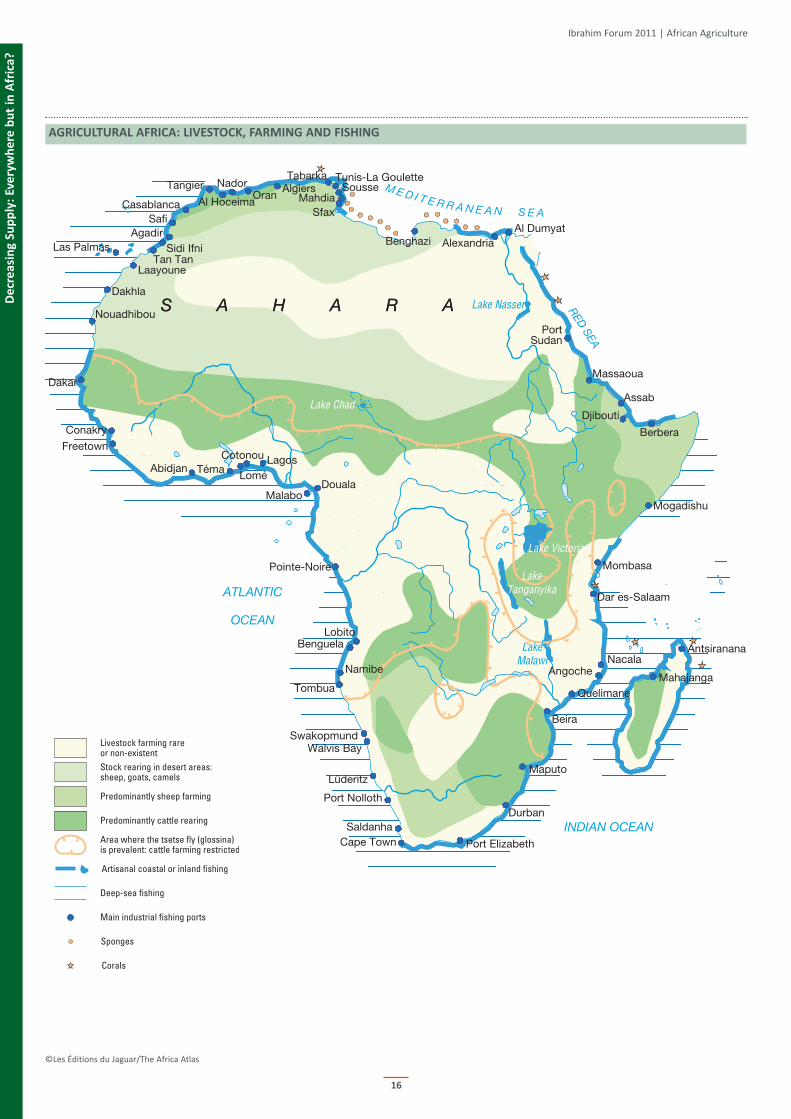
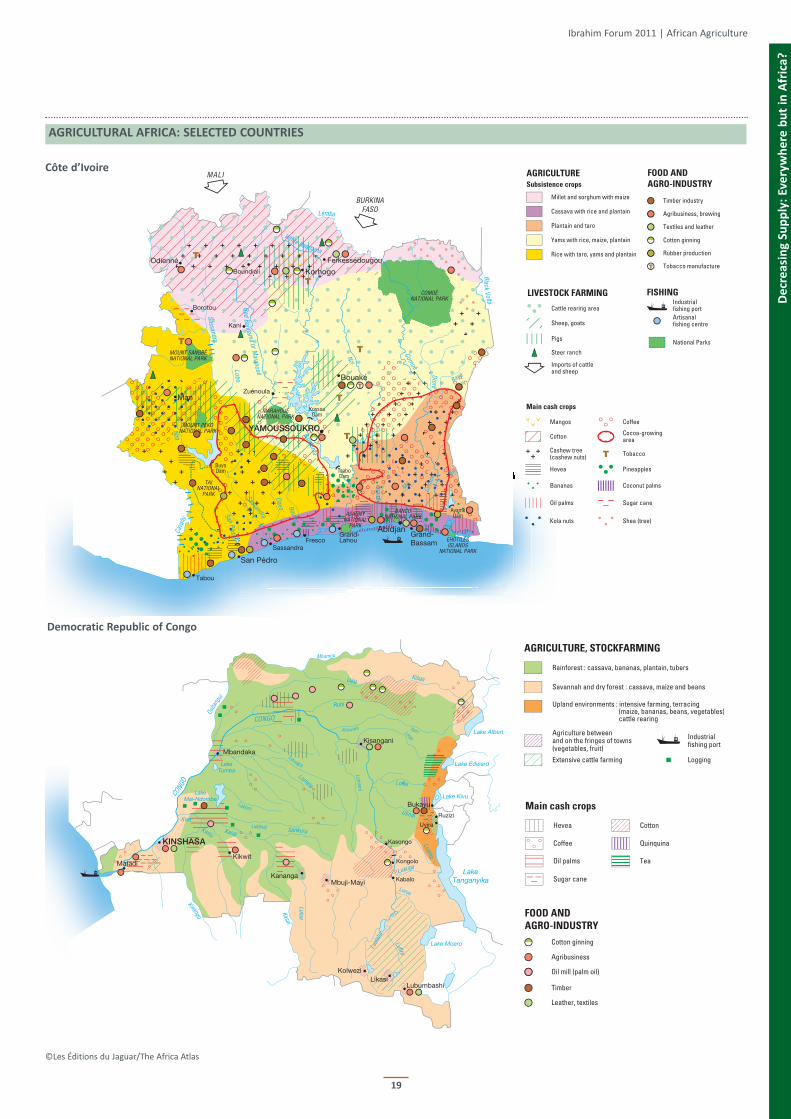
AgrICuLturAL AFrICA: LIVeStoCK, FArMINg ANd FIShINg
©Les Éditions du Jaguar/The Africa Atlas

17
de
cre
asi
ng
Su
pp
ly:
eve
ryw
he
re b
ut
in A
fric
a?
Ibrahim Forum 2011 | African Agriculture
AgrICuLturAL AFrICA: AgrICuLture ANd CoMMerCIAL CroPS
©Les Éditions du Jaguar/The Africa Atlas

18
de
cre
asi
ng
Su
pp
ly:
eve
ryw
he
re b
ut
in A
fric
a?
Ibrahim Forum 2011 | African Agriculture
Nigeria
Sudan and South Sudan
AgrICuLturAL AFrICA: SeLeCted CouNtrIeS
©Les Éditions du Jaguar/The Africa Atlas
19
de
cre
asi
ng
Su
pp
ly:
eve
ryw
he
re b
ut
in A
fric
a?
Ibrahim Forum 2011 | African Agriculture
AgrICuLturAL AFrICA: SeLeCted CouNtrIeS
©Les Éditions du Jaguar/The Africa Atlas
Côte d’Ivoire
democratic republic of Congo

de
cre
asi
ng
Su
pp
ly:
eve
ryw
he
re b
ut
in A
fric
a? LANd ACquISItIoNS: drIVerS, oPPortuNItIeS, threAtS
20
227 million hectares of developing countries’ land have been sold, leased and licensed to international investors in large scale land deals since
2001. In 2009 alone 60 million hectares were purchased or leased in Africa8.
drIVerS
8 Oxfam, 2011; Oakland Institute, 2011.9 Analysis of 56 million hectares of large scale deals concluded nothing had been done with 80% of the land involved (Oakland Institute, 2011).
Ibrahim Forum 2011 | African Agriculture
Securing Food Supply
Due to sky-rocketing prices in 2008 that
increased import bills and inflation rates;
harsh climatic conditions; poor soils; and
scarce land and water.
tirana declaration, Albania, May 2011
Approved by more than 45 countries, the declaration reiterates the need to promote secure and equitable access to and control of land for
the poor to reduce poverty, promote sustainable development and contribute to identity, dignity and inclusion, and denounces the growing
practice of “land grabbing”, and includes a commonly agreed upon definition:
“Land grabbing refers to land acquisitions which either violate human rights, flout the principle of free, prior and informed consent of the
affected land users; ignore the impacts on social and economic and gender relations and on the environment; avoid transparent contracts
with clear and binding commitments on employment and benefit sharing; are not based on democratic planning, independent oversight and
meaningful participation.”
PoteNtIAL threAtS
• Bargaining power in negotiations is often on the side of the foreign firms especially when supported by host state or local elites.
• Traditional rights of local communities over the land are often overlooked and many countries do not have legal or procedural
mechanisms to protect these rights.
• Lack of transparency in negotiations of land deals can foster corruption.
• Women and pastoralists are often not included in land deals.
• Reduced likelihood of achieving food self-sufficiency as governments outsource the means for food production.
• Threats to biodiversity, carbon stocks and land and water resources from intensive agriculture production.
• environmental conflicts from incentives offered to encourage investment, or inappropriate resource-intensive farming practices.
• Land banking - Speculative purchases of land which is left idle9.
PoteNtIAL oPPortuNItIeS
• Macro economic benefits – GDP growth and increased government revenues.
• Increased agricultural productivity.
• Employment opportunities – creation of on-farm and off-farm jobs.
• Development of rural infrastructure.
• Resources for new agricultural technologies and practices.
• Poverty reduction – construction of schools, training facilities and health centres.
Securing New Financial Investments
Investments in farmland are promising and
secure in terms of rising demand for food
and fuel. Private equity groups have
established ‘farmland funds’, buying up
portfolios of land in numerous countries
and promising their clients returns of 30%
per annum over a five-year period.
Securing Fuel Supply
Surging demand for agro-fuels, including
biofuels produced from ethanol and
sugarcane, are being driven by energy and
manufacturing.

21
International Acquisitions of Agricultural Land in Africa
Investor Country Land investment target Country
Arable land Acquired land Total land Acquired land Population Investor target Arable Land Acquired land Total land Acquired land Population
(millions as % of investor (millions as % of (millions) (millions as % of target (millions as % of target (millions)
of ha) arable land of ha) investor land (millions of ha) of ha) arable land of ha) land
108.6 2.6 932.7 0.3 1338.3 China* 2.80 DRC 6.7 41.8 226.7 1.2 66.0
2.8 31.0 99.5 0.9 81.1 Egypt 0.86 Uganda 5.7 15.2 19.7 4.4 33.4
158.1 0.5 297.3 0.3 1170.9 India 0.77 Ethiopia 13.6 5.6 100.0 0.8 82.9
1.6 45.1 9.7 7.2 48.9 South Korea 0.70 Sudan 20.7 3.4 237.6 0.3 43.6
3.4 14.5 215.0 0.2 27.4 Saudi Arabia 0.50 Tanzania 9.6 5.2 88.6 0.6 44.8
0.1 581.5 8.4 4.5 7.5 UAE 0.38 Sudan 20.7 1.8 237.6 0.2 43.6
108.6 0.1 932.7 <0.1 1338.3 China 0.10 Zimbabwe 3.7 2.7 38.7 0.3 12.6
1.8 5.7 176.0 0.1 6.4 Libya 0.10 Mali 4.9 2.1 122.0 0.1 15.4
<0.1 307.7 1.2 3.5 1.8 Qatar 0.04 Kenya 5.3 0.8 56.9 0.1 40.5
0.1 16.7 8.8 0.3 6.0 Jordan 0.03 Sudan 20.7 0.1 237.6 <0.1 43.6
2.8 0.7 99.5 <0.1 81.1 Egypt 0.02 Ethiopia 13.6 0.1 100.0 <0.1 82.9
1.8 1.0 176.0 <0.1 6.4 Libya 0.02 Liberia 0.4 4.3 9.6 0.2 4.0
3.4 0.3 215.0 <0.1 27.4 Saudi Arabia 0.01 Sudan 20.7 <0.1 237.6 <0.1 43.6
108.6 <0.1 932.7 <0.1 1338.3 China 0.01 Cameroon 6.0 0.2 47.3 <0.1 19.6
©Mo Ibrahim FoundationData for land area are from 2008 and for population from 2010. Information on investment deals refers to 2007 to 2009 and includes leased and purchased land. *Refers to ZTE International, a publicly owned Chinese corporation.Sources: Atlas des Futurs du Monde, 2010; IFPRI, 2009; FAOSTAT and WDI
Ibrahim Forum 2011 | African Agriculture
de
cre
asi
ng
Su
pp
ly:
eve
ryw
he
re b
ut
in A
fric
a?
LIBYA
SOUTH
©
MALI
LIBERIA CAMEROON
SUDAN
SOUTH SUDAN
INDIA
765,000 ha
QATAR
40,000 ha
UNITED ARAB EMIRATES
378,000 ha
JORDAN
25,000 ha100,000 ha
17,000 ha
CHINA
2.8 million ha
10,000 ha
101,171 ha
500,000 ha
10,117 ha
SAUDI ARABIA
700,000 ha
SOUTH KOREA
DEMOCRATIC REPUBLIC OF
CONGO
ZIMBABWE
TANZANIA
KENYAUGANDA
ETHIOPIA
20,000 ha
860,100 ha
EGYPT

de
cre
asi
ng
Su
pp
ly:
eve
ryw
he
re b
ut
in A
fric
a? SPotLIght: LANd deALS - IN WhoSe INtereSt?
22
the NeW hotSPot |South Sudan
- The World Bank estimates that the Government of Sudan transferred nearly 4 million hectares of land to private investors from 2004 to
2009, mostly in southern Sudan.
- Between 2007 and 2010 in South Sudan, various actors have sought or acquired at least 2.64 million hectares of land, an area larger than
rwanda, for agricultural projects, biofuel development and forestry10.
Investor Location Focus Land and Lease
Nile Trading and Development Lainya Biofuels, 600,000 ha (plus extension up to 1million ha); community owned
(USA) Carbon Credits land; 49 year lease; $25,000 in fees for state government; 40-50%
of profits for local co-ops.
Canadian Economic Development Juba Agriculture 12,200 ha (trial planting on 105 ha); government owned land;
Assistance for Southern Sudan No lease.
Citadel Capital, Sudan Egyptian Gwit, Pariang Agriculture, 105,000 ha; community owned land; 25 year lease; $125,000 for
Agricultural Company (Egypt), Carbon Credits state government.
Concord Agriculture (Australia)
Prince Budr Bin Sultan Gwit Agriculture 105,000 ha; community owned land; 25 year lease; $125,000 for
(Saudi Arabia) state government.
Source: Deng, 2011
PoLItICAL CrISIS trIgger | Madagascar
Investor Focus Land and Lease Issues
Daewoo Logistics (South Korea) Maize and palm oil 1.3 million ha (over half of Deal fuelled protests against the President,
production. Madagascar’s arable land); who was forced out of office in 2008.
Lease: unknown. The deal was cancelled.
LANd For Free? | ethiopia, Mali, Mozambique11
Investor Location Focus Land and Lease Issues
Libyan Africa Mali (Office Rice and cattle. 100,000 ha free of charge - Lack of governance and transparency
Investment Portfolio du Niger) for 50 years. - Risk of agricultural output being exported
Saudi Star Agriculture Ethiopia Projected 1 million 10,000 ha, free of land rent - Forests and farmland lost
Development PLC (Gambella) tons of rice, maize, for 60 years. - Forced relocation of people in villages
teff, sugarcane - No land tenure security over ancestral lands
and oilseed.
Emvest Asset Mozambique Irrigation of virgin 2000 ha at “nominal cost” - Community members forced to release
Management (Matuba) land to develop for 50 years (plus additional farmland
into arable land fiscal incentives for Emvest). - Failure to deliver well-being to community;
for food production. - Lack of transparency
Source: Oakland Institute, 2011
WeSterN uNIVerSItIeS INVeStINg | tanzania
Investor Focus Land and Lease Issues
Iowa State University with Large scale crop Approx. 325,117 ha. - Closing down of two of the
Summit Group and Global cultivation, beef and Iowa State University will conduct the feasibility settlements that are being
Agricultural Financial Fund poultry production studies including soil sampling and climate, acquired, that hold 162,000
of the Pharos Group with and biofuel rainfall and landscape analysis. Also proposes a people
AgriSOL Energy LLC production farmer outreach and agricultural extension - Economic independence of
programme with Tanzania’s Sokoine University local smallholders
of Agriculture.
Source: Oakland Institute, 2011
10 Deng, 2011 (Norwegian People’s Aid)11 Data refers to 2008, 2010, 2011 respectively.
Ibrahim Forum 2011 | African Agriculture
AFrICAN WAter: MAKINg good ChoICeS
23
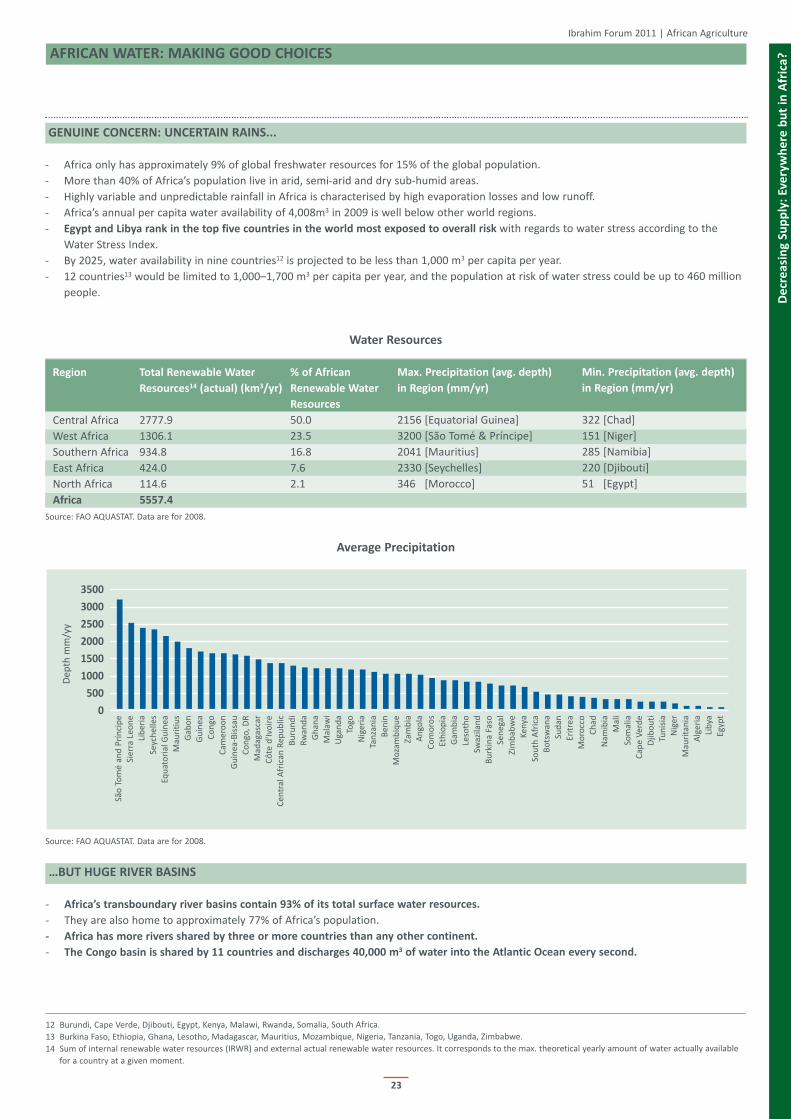
geNuINe CoNCerN: uNCertAIN rAINS...
- Africa only has approximately 9% of global freshwater resources for 15% of the global population.
- More than 40% of Africa’s population live in arid, semi-arid and dry sub-humid areas.
- Highly variable and unpredictable rainfall in Africa is characterised by high evaporation losses and low runoff.
- Africa’s annual per capita water availability of 4,008m3 in 2009 is well below other world regions.
- egypt and Libya rank in the top five countries in the world most exposed to overall risk with regards to water stress according to the
Water Stress Index.
- By 2025, water availability in nine countries12 is projected to be less than 1,000 m3 per capita per year.
- 12 countries13 would be limited to 1,000–1,700 m3 per capita per year, and the population at risk of water stress could be up to 460 million
people.
Water resources
region total renewable Water % of African Max. Precipitation (avg. depth) Min. Precipitation (avg. depth)
resources14 (actual) (km3/yr) renewable Water in region (mm/yr) in region (mm/yr)
resources
Central Africa 2777.9 50.0 2156 [Equatorial Guinea] 322 [Chad]
West Africa 1306.1 23.5 3200 [São Tomé & Príncipe] 151 [Niger]
Southern Africa 934.8 16.8 2041 [Mauritius] 285 [Namibia]
East Africa 424.0 7.6 2330 [Seychelles] 220 [Djibouti]
North Africa 114.6 2.1 346 [Morocco] 51 [Egypt]
Africa 5557.4
Source: FAO AQUASTAT. Data are for 2008.
Average Precipitation
Source: FAO AQUASTAT. Data are for 2008.
…But huge rIVer BASINS
- Africa’s transboundary river basins contain 93% of its total surface water resources.
- They are also home to approximately 77% of Africa’s population.
- Africa has more rivers shared by three or more countries than any other continent.
- the Congo basin is shared by 11 countries and discharges 40,000 m3 of water into the Atlantic ocean every second.
12 Burundi, Cape Verde, Djibouti, Egypt, Kenya, Malawi, Rwanda, Somalia, South Africa.
13 Burkina Faso, Ethiopia, Ghana, Lesotho, Madagascar, Mauritius, Mozambique, Nigeria, Tanzania, Togo, Uganda, Zimbabwe.
14 Sum of internal renewable water resources (IRWR) and external actual renewable water resources. It corresponds to the max. theoretical yearly amount of water actually available
for a country at a given moment.
Ibrahim Forum 2011 | African Agriculture
de
cre
asi
ng
Su
pp
ly:
eve
ryw
he
re b
ut
in A
fric
a?
3500
3000
2500
2000
1500
1000
500
0
Dep
th m
m/y
y
São
To
mé
and
Prí
nci
pe
Sier
ra L
eon
eLi
ber
iaSe
ych
elle
sEq
uat
ori
al G
uin
eaM
auri
tiu
sG
abo
nG
uin
eaC
on
goC
amer
oo
nG
uin
ea-B
issa
uC
on
go, D
RM
adag
asca
rC
ôte
d'Iv
oir
eC
entr
al A
fric
an R
epu
blic
Bu
run
di
Rw
and
aG
han
aM
alaw
iU
gan
da
Togo
Nig
eria
Tan
zan
iaB
enin
Moz
amb
iqu
eZa
mb
iaA
ngo
laC
om
oro
sEt
hio
pia
Gam
bia
Leso
tho
Swaz
ilan
dB
urk
ina
Faso
Sen
egal
Zim
bab
we
Keny
aSo
uth
Afr
ica
Bo
tsw
ana
Sud
anEr
itre
aM
oro
cco
Ch
adN
amib
iaM
ali
Som
alia
Cap
e V
erd
eD
jibo
uti
Tun
isia
Nig
erM
auri
tan
iaA
lger
iaLi
bya
Egyp
t

de
cre
asi
ng
Su
pp
ly:
eve
ryw
he
re b
ut
in A
fric
a?
24
A greAt regIoNAL PoteNtIAL: the 13 rIVer BASINS
Ibrahim Forum 2011 | African Agriculture
Transboundary River Basin
Lakes
Rivers
KEY Africa’s River Basins
1. Senegal2. Volta3. Niger4. Chad5. Nile6. Ogooue7. Congo8. Turkana9. Jubashabelle10. Zambezi11. Okavango12. Limpopo13. Orange
Regional Body: Orange-Senqu River Commission (ORASECOM) (2000)- All riparian countries% of Africa's surface area: Approx 3%
Population: Approximately 15.7 million
ALGERIA
BOTSWANA
BURKINA FASO
CAMEROON
SAO TOME & PRINCIPE
CHAD
COMOROS
DEMOCRATIC REPUBLIC OF CONGO
ANGOLA
CONGO
COTE D'IVOIRE
DJIBOUTI
EQUATORIAL GUINEA
ETHOPIA
GABON
GHANA
GUINEA
GUINEA-BISSAU
SOUTH AFRICA
LESOTHO
LIBERIA
LIBYA
EGYPT
MADAGASCAR
MAURITANIA
MALI
MOROCCO
MOZAMBIQUE
NIGER
NIGERIA
BENIN
SENEGAL
GAMBIA
SIERRA LEONE
SOMALIA
KENYA
SUDAN
SOUTHSUDAN
ERITREA
SWAZILAND
NAMIBIA
TOGO
TUNISIA
UGANDA
WESTERN SAHARA
RWANDA
ZAMBIA
TANZANIA
MALAWI
ZIMBABWE
BURUNDI
CENTRAL AFRICAN REPUBLIC
CAPE VERDE
MAURITIUS
SEYCHELLES
Source: UNEP, 2010 and respectiveRegional Body websites
Riparian Countries (4): Bostwana, Lesotho, Namibia, South Africa
10. Zambezi River Basin
Riparian Countries (8): Angola, Botswana, Malawi, Mozambique, Namibia, Tanzania, Zambia, Zimbabwe
Regional Body: Zambezi Watercourse Commission(ZAMCOM) (2004) - All riparian countries
% of Africa's surface area: 4.5%
Population: Approximately 40 million
11. Okavango Delta Basin
13. Orange River Basin
Riparian Countries (3): Angola, Botswana, NamibiaRegional Body: The Permanent Okavango River Basin Water Commission (OKACOM) (1994)- All riparian countries
% of Africa's surface area: Approximately 1%
Population: Less than 1.5 million
7. Congo River Basin
Riparian Countries (10): Angola, Burundi, Cameroon, Central African Republic, Democratic Republic of Congo, Gabon, Congo, Rwanda, Tanzania, ZambiaRegional Body: Commission Internationale du Bassin Congo-Oubangui-Sangha (CICOS) (1999) - All riparian countries except Angola, Burundi, Rwanda, Tanzania, Zambia
% of Africa's surface area: Over 12%
Population: Approximately 100 million
1. Senegal River Basin
Riparian Countries (4): Guinea, Mali, Mauritania, SenegalRegional Body: Organization for the Development of the Senegal River basin (OMVS) - All riparian countries except Guinea
% of Africa's surface area: Over 1.6%
Population: Approximately 3.5 million
4. Lake Chad Basin
Riparian Countries (8): Algeria, Central African Republic, Cameroon, Chad, Libya, Niger, Nigeria, SudanRegional Body: Lake Chad Basin Commission (1964) - All riparian countries except Algeria, Libya, Sudan
Population: Approximately 46 million
% of Africa's surface area: Over 8%
5. Nile River Basin
Riparian Countries (9): Burundi, DemocraticRepublic of Congo, Egypt, Ethiopia, Kenya,
Rwanda, Sudan, Tanzania, Uganda
Regional Body: Nile Basin Initiative (NBI) (1999) - All riparian countries
Eritrea is as an observer.
% of Africa's surface area: Approx 10%
Population: Approximately 360 million
© Mo Ibrahim Foundation

25
WAter MANAgeMeNt: MAKINg good ChoICeS
Agriculture accounts for approximately 3,100 billion m3 or 71% of water withdrawals today in the world - without efficiency gain this will
increase to 4,500 billion m3 by 2030. It is estimated to take one litre of water to grow one calorie of food.
Food production needs to increase to meet the demands of a growing, increasingly urbanised population. Countries need to ensure water is
used intelligently, and that increased food production is based on a sensible and sustainable water management strategy to make the best use
out of a resource that is in high demand.
Sustainable Water Solutions
- Water harvesting, supplemental irrigation, conservation tillage and the use of small scale technologies e.g. motorised and treadle pumps.
- Improving soil and land management practices.
- Enhancing ecosystems by improving agricultural practices and raising awareness of the value of ecosystems and biodiversity as
agricultural inputs.
- Building capacity to develop rainwater management strategies and equipping farmers with the knowledge and skills to exploit rainwater
and improve water productivity.
Ibrahim Forum 2011 | African Agriculture
rain-fed Agriculture
Covers 82% of cropland worldwide and produces 60% of the crops.
Accounts for nearly 96% of the cropland in Africa.
With reliable rainfall and productive soils it can have some of the highestyields. However, in dry and tropical, arid and semi-arid regions, yields areoften low. Climate change is an additional threat.
Greenwater efficiency is very low - only 15 % of the terrestrial rainwater is
used by plants for the production of food, fodder and fibre in sub-Saharan
Africa, partly due to excessive losses caused by poor land managementpractices.
The IPCC estimates that if global average temperatures rise by 3°C, yieldsfrom rain-fed agriculture could be reduced by up to 50% in Africa.
Yields can be increased by improving, and investing in, water management.
Irrigation
Covers 18% of cropland worldwide and produces 40% of the crops.
Irrigated land in Africa is 4% of cropland.
two thirds of Africa's irrigated land is found in 3 countries: Madagascar,
South Africa and Sudan.
Irrigation increases yields of most crops by 100% to 400%.
Sub-Saharan Africa extracts less than 2% of available water for all uses.Irrigation and drainage will be an important source of productivity growthespecially in sub-Saharan Africa where there are untapped water resources.
Lack of investment in irrigation contributes to expansion of rain-fedagriculture on to marginal lands with unreliable rainfall.
de
cre
asi
ng
Su
pp
ly:
eve
ryw
he
re b
ut
in A
fric
a?
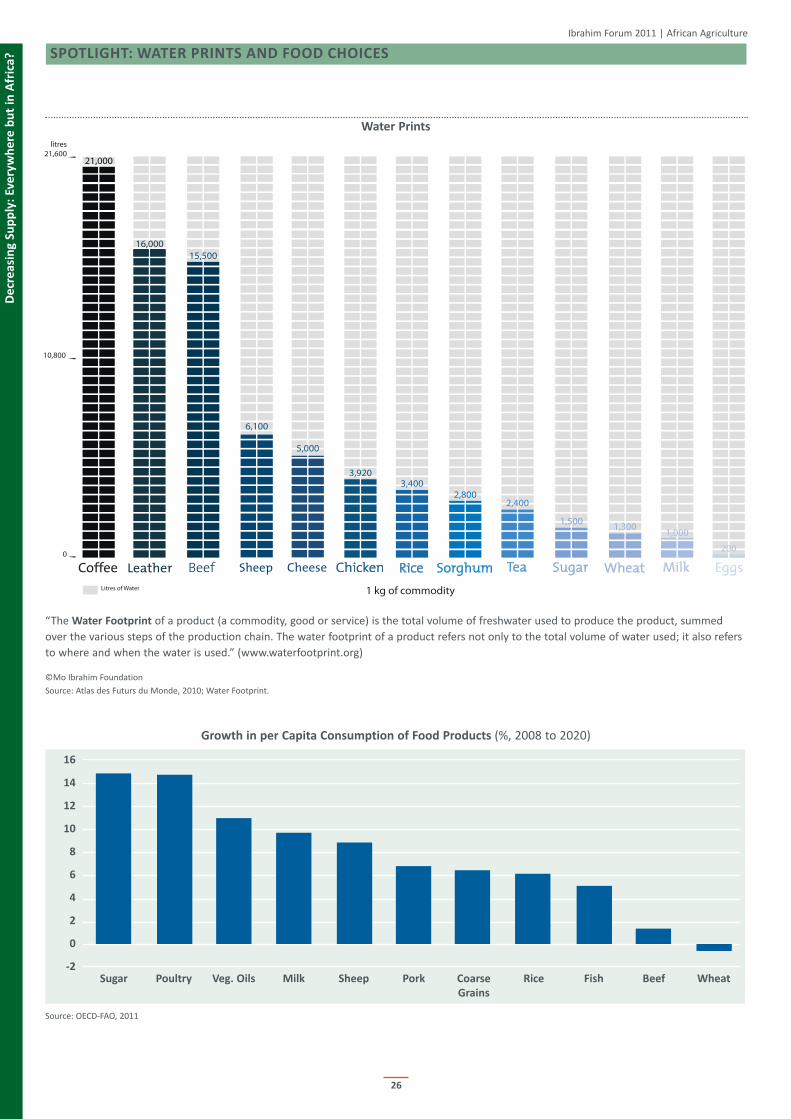
SPotLIght: WAter PrINtS ANd Food ChoICeS
26
de
cre
asi
ng
Su
pp
ly:
eve
ryw
he
re b
ut
in A
fric
a?
Water Prints
Ibrahim Forum 2011 | African Agriculture
litres21,600
10,800
0
16,000
21,000
15,500
3,920
2,800
1,500 1,3001,000
200
Litres of Water 1 kg of commodity
3,400
2,400
6,100
5,000
growth in per Capita Consumption of Food Products (%, 2008 to 2020)
Source: OECD-FAO, 2011
Sugar Poultry Veg. oils Milk Sheep Pork Coarse
grains
rice Fish Beef Wheat
16
14
12
10
8
6
4
2
0
-2
“The Water Footprint of a product (a commodity, good or service) is the total volume of freshwater used to produce the product, summed
over the various steps of the production chain. The water footprint of a product refers not only to the total volume of water used; it also refers
to where and when the water is used.” (www.waterfootprint.org)
©Mo Ibrahim Foundation
Source: Atlas des Futurs du Monde, 2010; Water Footprint.

gro
win
g I
mb
ala
nce
s: A
Ne
w g
eo
stra
teg
ic I
ssu
erISINg PrICeS, groWINg VoLAtILItY
27
PrICeS: hIgher ANd More VoLAtILe
Source: IMF
Source: FAOSTAT
Agricultural Commodity Price Changes since 2000
Of the 20 highest increases in commodity prices between 2000 and 2009, 12 were agricultural commodities.
Commodity % change
4th Cocoa +283.9
6th Sugar +202.7
7th Rice +180.2
9th Palm oil +156.5
11th Soya oil +147.3
14th Wheat +110.2
15th Soybeans +108.2
16th Corn +100.3
17th Soybean meal +85.7
18th Lamb +74.1
19th Coconut oil +70.5
20th Tea +68.5
Source: EIU, 2010
2001 2002 2003 2004 2005 2006 2007 2008 2009 2010 Jan 11
Cocoa beans Sugar Rice Palm oil Soybean oil
450%
400%
350%
300%
250%
200%
150%
100%
50%
0%
-50%
Ibrahim Forum 2011 | African Agriculture
Aug 11
Agricultural Commodity Indices (2000 = 100)
2000 2001 2002 2003 2004 2005 2006 2007 2008 2009 2010 Jan 11
Food Price Index Meat Price Index Dairy Price Index
Cereals Price Index Oils Price Index Sugar Price Index
450
400
350
300
250
200
150
100
50
0
Sep 11

gro
win
g I
mb
ala
nce
s: A
Ne
w g
eo
stra
teg
ic I
ssu
e
28
eNergY PrICeS IMPACt heAVILY oN Food ProduCtIoN CoStS
The cost of food production is directly linked to oil prices since fuel, including natural gas, is used in all stages of the agricultural production
cycle - from sowing and fertilising, to harvesting and distribution. Biofuels have strengthened this link.
Crude oil15 prices in January 2011 were over 280% higher than in 2000 and 26% higher than in January 2010. The cost of fertilisers rose 40% on
average in the past year. Trade value of fertilisers has soared since 2003.
Fuel prices in Bujumbura, Harare, Kinshasa, Mogadishu and Nairobi increased by more than 20% between July 2010 and July 2011. In Addis
Ababa over the same period, they rose by approximately 70%.
Source: FAOSTAT
ALL AgrICuLturAL CoMModItY PrICeS WILL Be hIgher oN AVerAge IN the Next deCAde
Source: OECD-FAO, 2011
15 Crude Oil (petroleum), dated Brent, light blend 38 API, US$ per barrel - IMF, 2011.
Ibrahim Forum 2011 | African Agriculture
Fertiliser trade Values (uS$ millions)
1990 1991 1992 1993 1994 1995 1996 1997 1998 1999 2000 2001 2002 2003 2004 2005 2006 2007 2008 2009
35
30
25
20
15
10
5
0
Change in Average Nominal Prices in 2011 (% relative to 2001-2010 base period)
Ethanol Butter Poultry Veg. Oils Maize RawSugar
Fish Rice Pigmeat Oilseeds Beef Wheat
100
80
60
40
20
0
Fertilisers manufactured Natural phosphates Nitrogenous fertilisers
Phosphate fertilisers Potash fertilisers

A NeW SPeCuLAtIoN BuBBLe?
29
A growing number of experts now link the rising volatility of agricultural commodities since 2006 to financial intermediation and speculation by
banks and hedge funds on futures markets, triggering heated debate. Between 2003 and 2008, there was 250 times more investment in
commodity index funds, which rose from $13 billion to $317 billion. The World Bank now recognises the role played by the ‘financialisation of
commodities’ in price surges and declines and notes that price variability has overwhelmed price trends for important commodities16.
By exempting commodity futures trading from regulatory oversight, the Commodity Futures Modernization Act of 2000 (CFMA) has made this
type of speculation possible. Although the Dodd-Frank Act has since included reforms to regulate commodity futures, the Commodity Futures
Trading Commission (CFTC) has so far failed to reach agreement on implementation. The French G20 Presidency placed this issue on the global
agenda, and the European Commission, under Commissioner Michel Barnier’s direction, has recently initiated measures to regulate derivative
markets and short selling.
Index speculators have bought more commodities futures contracts in the last five years than any other group of market participant and are
now the single most dominant force in commodity futures markets17.
- Between September 2010 and September 2011, the average daily volume for Corn Calendar Swaps rose by 249%.
- Over the same period the average daily volume for Oilseed complex futures was 90% higher and for Grain and Oilseed futures was
34% higher.
Source: CME, 2011
16 Baffis and Haniotis, 2010
17 IATP, 2011
Average daily Volume of grain and oilseed Combined Futures and options (contracts)
1,400,000
1,200,000
1,000,000
800,000
600,000
400,000
200,000
0
Ibrahim Forum 2011 | African Agriculture
Jan
00
Aug
00
Mar
01
Oct
01
May
02
Dec
02
Jul 0
3
Feb
04
Sep
04
Apr
05
Nov
05
Jun
06
Jan
07
Aug
07
Mar
08
Oct
08
May
09
Dec
09
Jul 1
0
Feb
11
Sep
11
g Futures g Options
Average daily Volume of Corn, Soybean and Wheat options (contracts)
300,000
250,000
200,000
150,000
100,000
50,000
0
Jan
00
Aug
00
Mar
01
Oct
01
May
02
Dec
02
Jul 0
3
Feb
04
Sep
04
Apr
05
Nov
05
Jun
06
Jan
07
Aug
07
Mar
08
Oct
08
May
09
Dec
09
Jul 1
0
Feb
11
Sep
11
g Corn g Soybean Complex g Wheatg
row
ing
Im
ba
lan
ces:
A N
ew
ge
ost
rate
gic
Iss
ue
gro
win
g I
mb
ala
nce
s: A
Ne
w g
eo
stra
teg
ic I
ssu
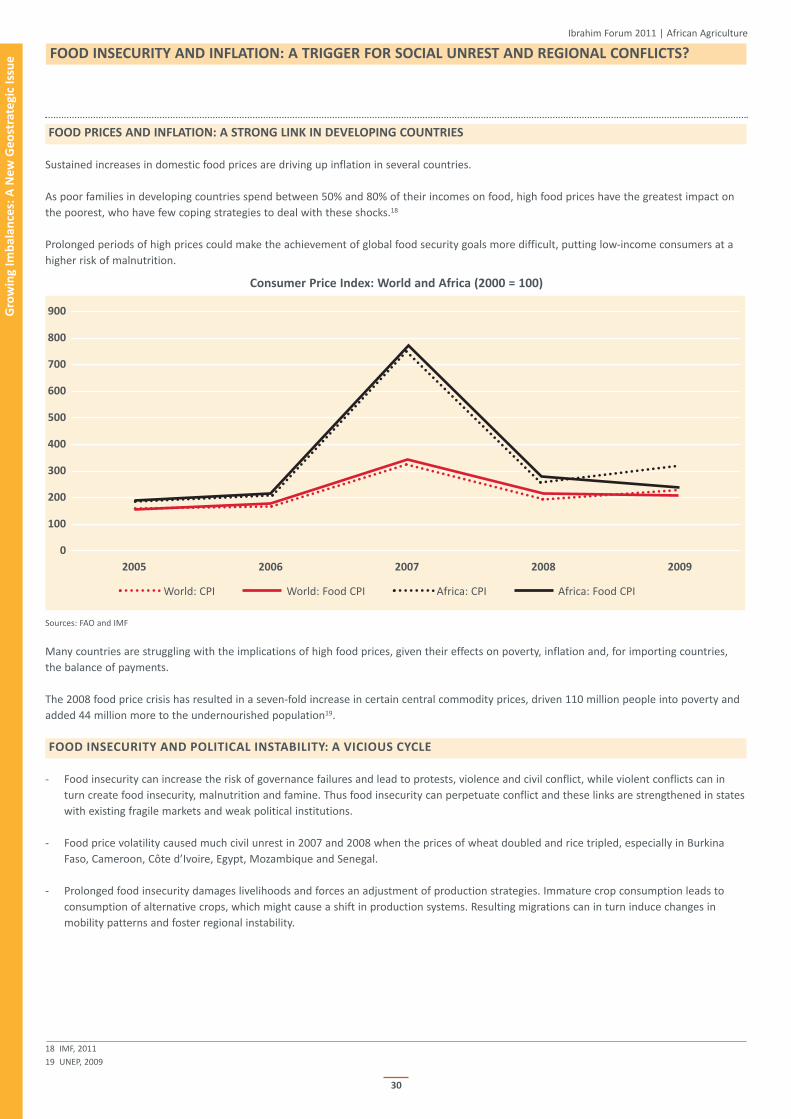
e Food INSeCurItY ANd INFLAtIoN: A trIgger For SoCIAL uNreSt ANd regIoNAL CoNFLICtS?
30
Food PrICeS ANd INFLAtIoN: A StroNg LINK IN deVeLoPINg CouNtrIeS
Sustained increases in domestic food prices are driving up inflation in several countries.
As poor families in developing countries spend between 50% and 80% of their incomes on food, high food prices have the greatest impact on
the poorest, who have few coping strategies to deal with these shocks.18
Prolonged periods of high prices could make the achievement of global food security goals more difficult, putting low-income consumers at a
higher risk of malnutrition.
Sources: FAO and IMF
Many countries are struggling with the implications of high food prices, given their effects on poverty, inflation and, for importing countries,
the balance of payments.
The 2008 food price crisis has resulted in a seven-fold increase in certain central commodity prices, driven 110 million people into poverty and
added 44 million more to the undernourished population19.
Food INSeCurItY ANd PoLItICAL INStABILItY: A VICIouS CYCLe
- Food insecurity can increase the risk of governance failures and lead to protests, violence and civil conflict, while violent conflicts can in
turn create food insecurity, malnutrition and famine. Thus food insecurity can perpetuate conflict and these links are strengthened in states
with existing fragile markets and weak political institutions.
- Food price volatility caused much civil unrest in 2007 and 2008 when the prices of wheat doubled and rice tripled, especially in Burkina
Faso, Cameroon, Côte d’Ivoire, Egypt, Mozambique and Senegal.
- Prolonged food insecurity damages livelihoods and forces an adjustment of production strategies. Immature crop consumption leads to
consumption of alternative crops, which might cause a shift in production systems. Resulting migrations can in turn induce changes in
mobility patterns and foster regional instability.
18 IMF, 2011
19 UNEP, 2009
Consumer Price Index: World and Africa (2000 = 100)
2005 2006 2007 2008 2009
World: CPI World: Food CPI Africa: CPI Africa: Food CPI
900
800
700
600
500
400
300
200
100
0
Ibrahim Forum 2011 | African Agriculture
31
Ibrahim Forum 2011 | African Agriculture
gro
win
g I
mb
ala
nce
s: A
Ne
w g
eo
stra
teg
ic I
ssu
e
the trIgger eFFeCt: SoMe exAMPLeS
tunisia
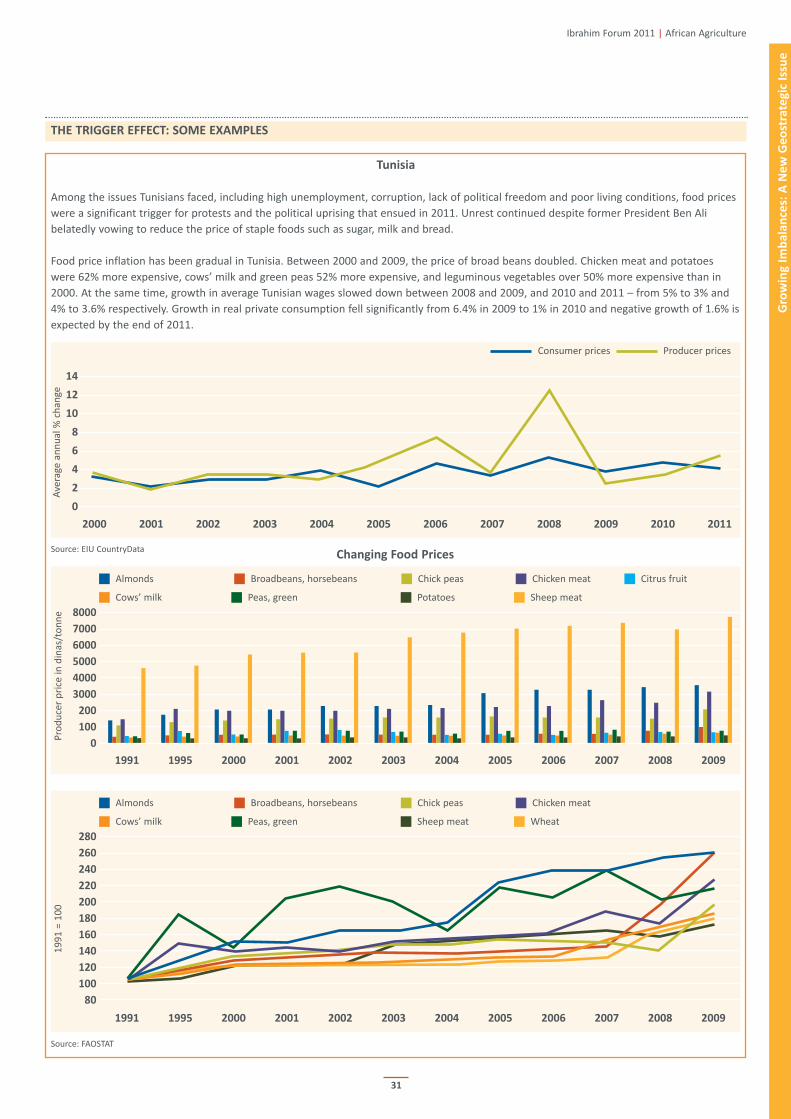
Among the issues Tunisians faced, including high unemployment, corruption, lack of political freedom and poor living conditions, food prices
were a significant trigger for protests and the political uprising that ensued in 2011. Unrest continued despite former President Ben Ali
belatedly vowing to reduce the price of staple foods such as sugar, milk and bread.
Food price inflation has been gradual in Tunisia. Between 2000 and 2009, the price of broad beans doubled. Chicken meat and potatoes
were 62% more expensive, cows’ milk and green peas 52% more expensive, and leguminous vegetables over 50% more expensive than in
2000. At the same time, growth in average Tunisian wages slowed down between 2008 and 2009, and 2010 and 2011 – from 5% to 3% and
4% to 3.6% respectively. Growth in real private consumption fell significantly from 6.4% in 2009 to 1% in 2010 and negative growth of 1.6% is
expected by the end of 2011.
Source: EIU CountryData
Source: FAOSTAT
2000 2001 2002 2003 2004 2005 2006 2007 2008 2009 2010 2011
14
12
10
8
6
4
2
0
Consumer prices Producer prices
1991 1995 2000 2001 2002 2003 2004 2005 2006 2007 2008 2009
8000
7000
6000
5000
4000
3000
200
100
0
g Almonds g Broadbeans, horsebeans g Chick peas g Chicken meat g Citrus fruit
g Cows’ milk g Peas, green g Potatoes g Sheep meat
Changing Food Prices
Pro
du
cer
pri
ce in
din
as/t
on
ne
1991 1995 2000 2001 2002 2003 2004 2005 2006 2007 2008 2009
280
260
240
220
200
180
160
140
120
100
80
g Almonds g Broadbeans, horsebeans g Chick peas g Chicken meat
g Cows’ milk g Peas, green g Sheep meat g Wheat
1991
= 1
00A
vera
ge a
nn
ual
% c
han
ge
gro
win
g I
mb
ala
nce
s: A
Ne
w g
eo
stra
teg
ic I
ssu
e
32
Ibrahim Forum 2011 | African Agriculture
Sudan
South Sudan| Food security deteriorated in 2010 after conflict and displacements from a mix of inter-ethnic/tribal tensions, historical
hostilities, revenge attacks and cattle raiding.
Continuous dry spells throughout 2010 led to consumption of early maturing crops, which has impacted prices into 2011. In the border
region of Malakal, the price of the main staple, sorghum, increased by over 17% in one month (June to July 2011). As a result of restricted
trade with Sudan, food prices range between 7% and 67% higher than a year earlier.
darfur | The food crisis in Darfur is a result of the conflict that began as a communal resource conflict over land and water and is also a
legacy of the devastating north-south civil war.
In Malakal and Darfur, food crises are still looming. Food availability has been significantly reduced due to on-going violence. Added to this,
erratic rainfall threatens the harvest season and the prices of staple foods are set to increase steeply. The further disruption that this may
cause to seasonal migration could re-fuel tensions between nomadic herders and farmers over water and land resources, in addition to the
possibility of an outbreak of livestock disease.
east Africa
Once again, following a familiar pattern, the Horn of Africa is facing an on-going food crisis following the failure of the late 2010 rains. The
combination of devastating drought in the arid and semi-arid areas of the region alongside lack of governance on food security issues,
conflict, civil unrest and heavy displacements has affected all countries of the region.
The number of severely affected people is now estimated at 4.8 million in Ethiopia, 3.7 million in Somalia and Kenya, and 200,000 in
Djibouti. The current emergency status is not expected to improve to less severe crisis status until the end of 2011. The acute malnutrition
rate has exceeded 40% in some areas of Somalia among children less than five years of age.20
Preceding these crisis levels, poor secondary season crops meant that domestic prices of key staple foods were soaring, fuel prices were
increasing and stock levels were at a record low. High cereal prices are being sustained because of negative expectations over the outcome
of the 2011 main season harvests and high international prices of wheat.
The price of maize doubled between June 2010 and 2011 in Kampala, Kigali and Mogadishu. Cereal prices are now at record levels. In Kenya,
cereal price levels in August remained up to three times higher than 2010, exacerbated by high fuel prices and an export ban imposed by
Tanzania. In Tanzania, the price of maize in August was more than 50% higher than a year earlier.
Somalia | The upward trend in cereal prices since August 2010 reflects the drought-reduced output, failure of the Deyr season crop
(harvested in February), and sharply increased fuel prices, as well as hyperinflation, local currency depreciation and persistent insecurity.
Prices of red sorghum and white maize have increased by 240% and 154% respectively in the last year and prices of imported commodities
(rice, sugar, vegetable oil, wheat flour) are much higher than a year ago.
Famine has now been declared in six areas. However, famine is not the result of soaring prices alone. Aside from the failed Deyr rains and
below average primary season rains (April to June 2011) causing crop and livestock losses, internal displacement, civil unrest, and instability
have all played crucial roles. Food security crises have been historically recurrent. In 1992 the same elements of drought and war set off a
famine that killed hundreds of thousands of people and started a cycle of international intervention.
20 Food Price Watch, 2011

SPotLIght: IMPACt oF CLIMAte ChANge
33
Global climate change may impact food production in numerous ways: changing overall growing conditions due to rainfall distribution and
temperature changes, reducing crop yields and agricultural productivity, increasing the incidence of pest attacks, decreasing availability of
water and through extreme weather conditions (droughts, floods and storms).
Source: Adapted from Stern Review, 2008
- In Africa, between 75 and 250 million more people will be exposed to increased water stress by 2020 due to climate change.
- For smallholder farmers, climate change means they cannot rely on traditional patterns for agricultural production, such as rainy
seasons and predicting temperatures.
- The frequency and intensity of floods and droughts lessen recovery time and place, further importance on accumulation of
knowledge and skills for climate change adaptation. Changes in rainfall also mean changes in growing seasons and crops.
how to reverse the Impacts
- Adaptation – activities that enable people and ecosystems to adjust and reduce their vulnerability to the impact of climate change.
- Mitigation – measures taken to reduce or eliminate greenhouse gas emissions into the atmosphere including: energy efficiency and
conservation; switching to cleaner and renewable energy sources; capturing methane from coal mines and landfill sites; and changing
land-use practices.
- technologies – cleaner and more advanced tools and plants that can tolerate climate variability better. Research and development,
information exchange and training that create farming systems more resilient to climate change.
- Financing – ensuring policies encourage private and public investment into more climate friendly alternative technologies and spread
the risk across the private and public sectors.
Ibrahim Forum 2011 | African Agriculture
0⁰C +1⁰C +2⁰C +3⁰C +4⁰C +5⁰C +6⁰C
Food
Water
extreme
weather
events
risk of
irreversible
changes
Falling crop yields in many areas
rising intensity of storms, forest fires, droughts, flooding and heat waves
Increasing risk of dangerous feedbacks and abrupt, large-scale shifts in the climate system
Possible rising yields in some high latitude areas
decrease in water availabilty in many areas
rise in sea levels threatens major cities
Small mountain glaciers disappear, impacting water supply
Falling yields in many developed regions
gro
win
g I
mb
ala
nce
s: A
Ne
w g
eo
stra
teg
ic I
ssu
e
temperature Change

CouNtINg ASSetS
34
A rurAL CoNtINeNt
In 2020, Africa's rural population as % of total population will still be higher than the world average and over twice that of europe.
rural population (%)
2010 2020
Africa 60.0 55.4
Asia 57.8 52.8
Europe 27.2 24.6
Latin America and the Caribbean 20.4 17.4
Northern America 17.9 15.4
World 49.5 45.6
Source: FAOSTAT
MAINLY SMALLhoLderS
- Small-scale producers contribute over 90% of Africa’s agricultural production.
- More than ⅔ of Africans depend on small or micro-scale farming as their primary source of livelihood.
- 80% of smallholders own less than two hectares of land.
- Developing smallholder farming means ensuring food security, alleviating poverty and preventing unruly urbanisation.
Maximising smallholders’ potential
- Increase their access to finance and business, marketing and technical skills, as well as ICTs.
- Increase their influence on, and incorporate local knowledge and skills into, agricultural research agendas.
- Increase their access to natural resources and inputs, such as fertilisers, improved seeds and planting material.
- Share information about markets and strengthen vulnerability to economic stresses, particularly to commodity price volatility.
- Mitigate risks and promote adaptation to increase security in the face of weather shocks and climate change.
A YouNg MAJorItY
- Two thirds of Africa's population are aged under 25 years
- Youth aged 15-24 make up 20% of the total population of Africa.
- 70% of Africa’s youth live in rural areas.
- Youth inactivity rates in North Africa and sub-Saharan Africa are 62% and 42%.
- Youth make up 40% of the total unemployed in Africa.
- They account for 60% of total employment in agriculture in Africa.
- By 2040 Africa will be home to one in five of the world’s young, and will have the largest working age population.
WorKINg WoMeN
- Women comprise over 50% of the agricultural labour force in sub-Saharan Africa.
- In sub-Saharan Africa, women grow 80-90% of the food.
- Women own less than 2% of all land in Africa.
- They receive less than 10% of all credit going to small farmers and have access to only 5% of the resources provided through
extension services.
- Giving women the same access as men to agricultural inputs could increase yields by 20-30%, reducing the number of hungry people
in the world by 100-150 million.
Fro
m F
oo
d S
ecu
rity
to
Cre
ati
ng
We
alt
h:
ho
w t
o m
ake
it
ha
pp
en
in
Afr
ica
Ibrahim Forum 2011 | African Agriculture

FILLINg the gAPS
35
Fro
m F
oo
d S
ecu
rity
to
Cre
ati
ng
We
alt
h:
ho
w t
o m
ake
it
ha
pp
en
in
Afr
ica
Ibrahim Forum 2011 | African Agriculture
SeCurINg LANd rIghtS
- More than 90% of land remains outside any formal legal system in Africa.
- Inheritance laws and customary practices in some countries exclude individuals, specifically women and orphaned children, from inheriting
property.
- With the increasing trend in land acquisitions, there is significant risk of marginalisation of the land rights of African communities.
Framework and guidelines on Land Policy in Africa (2009)
Launched by the AU, AfDB and UNECA, this framework was endorsed by the Joint Conference of Ministers of Agriculture, Land and Livestock
held in April 2009 in Addis Ababa, Ethiopia. The AU21 followed this with the adoption of the “Declaration on Land Issues and Challenges in
Africa”.
Principles which should inform land policies in African member states include:
- Offering a basis for commitment by member states to the formulation and operationalisation of land policies
- Promoting consensus for shared principles as the basis for securing access to land for all users
- Emphasising the need for popular participation in land policy formulation and implementation
- Proposing standards for best practices for land policy reforms and benchmarks for performance
- Articulating a policy framework for addressing emerging issues and trends relating to land resources
- Providing a basis for more coherent partnership between states, citizens and development partners in land policy formulation and
implementation
- Establishing general principles to engage partners to mobilise resources to build capacity for land policy reform processes
- Developing guidelines for regional convergence on the sustainable management and utilisation of land and related resources
Best Practice: the Land tenure reform Act (2007) in Burkina Faso
A new policy, adopted in 2007, and a specific law for rural land tenure in 2009, have given communities the opportunity to draw on local
custom to develop a land tenure charter that regulates their use of common resources. These new laws provide distinctive programmes to
allocate developed land to the youth, women, and herders. The law emphasises the importance of conflict resolution with regards to land
tenure, making negotiation mandatory before any dispute can undergo legal proceedings.
MeChANISINg ProduCtIoN
Average tractors per 100km2 of arable land
World: 200 South Asia: 129 Africa: 13
Source: Kormawa, 2011
In 2007 there were approximately 626,000 tractors in Africa, for over 200 million people economically active in agriculture22, which represents
approximately one tractor per 320 people economically active in agriculture. Currently, it is estimated that 3.5 million tractors would be needed
to bring Africa up to the level of other regions.23
Mechanisation on Some National Agendas
Farmers’ cooperatives for pooling agricultural machinery
- Benin: A system of cooperatives was launched in 1995. At end of 2009, 116 of these were highly active.
training for technicians and users of agricultural equipment
- Congo: Government is subsidising training of youth to drive farm vehicles at the Institute of Rural Development.
- Cameroon: 2000 drivers and mechanics are being trained on the fringe of an assembly plant at Ebolowa.
- Madagascar: Agricultural machinery centre at Antsirabe is establishing a training institute for engineers in agri-mechanisation.
Local manufacturing and assembly of machinery
- Mali: In 2009 an assembly plant for tractors and accessories was opened at Samanko, in partnership with an Indian company.
- Chad: An industrial plant for assembling tractors has started operations in N’Djamena.
21 13th Ordinary Session of the African Union Assembly of Heads of State and Government, July 2009, Sirte, Libya.22 FAO Statistical Yearbook, 201023 SPORE, 2011
36
PreVeNtINg Food LoSSeS
- In developing countries more than 40% of food losses occur at post-harvest and processing stages.
- Post-harvest losses of food cereals in sub-Saharan Africa are estimated at 25% of the total crop harvested.
Food Losses in developing Countries
Causes Solutions
Failure to comply with minimum food safety standards; poor and Development of knowledge and the capacity of food chain
unhygienic handling and storage conditions; and lack of adequate operators to apply safe food handling practices and storage hygiene.
temperature control cause food to become unsafe for consumption. Funds and loans to facilitate the diffusion of better storage containers.
Lack of infrastructure for adequate transportation, storage, cooling Improvement of infrastructure - roads, energy and markets.
and selling put fresh products like fruits, vegetables, meat and fish Private sector investments can also improve storage, cold chain
at risk of being spoilt due to climatic conditions. facilities and transportation.
Lack of facilities with the capacity to process and preserve fresh Creation of a better investment climate to stimulate private sector
farm produce. investment in the food industry and to work more closely with
farmers to address supply issues.
Inadequate market systems and an insufficient number of wholesale, Introduction of more marketing cooperatives, that provide a
supermarket and retail facilities providing suitable storage point for assembling produce from small farmers and preparing
and sales conditions for food products. commodities for transportation to markets and other distribution
channels.
grain Losses in Sub-Saharan Africa
Physical grain losses, prior to processing, can range from 10% to 20%.
Post-harvest grain losses in sub-Saharan Africa could total $4 billion per year. this lost food:
- could meet the minimum annual food requirements of at least 48 million people
- is on a par with the value of annual cereal imports24
It is estimated that with a 1% reduction in post-harvest losses, annual gains of $40 million are possible.
24 Annual cereal imports of sub-Saharan Africa had a value of $3 to $7 billion between 2000 and 2007.
Fro
m F
oo
d S
ecu
rity
to
Cre
ati
ng
We
alt
h:
ho
w t
o m
ake
it
ha
pp
en
in
Afr
ica
Ibrahim Forum 2011 | African Agriculture
37
Fro
m F
oo
d S
ecu
rity
to
Cre
ati
ng
We
alt
h:
ho
w t
o m
ake
it
ha
pp
en
in
Afr
ica
Ibrahim Forum 2011 | African Agriculture
CoNNeCtINg FArMerS
technology
Monitoring world food supply, production and shortages Monitoring agriculture and soil
remote sensing infrastructure including high resolution radiometers, Stand-alone sensors which measure air temperature,
and imaging spectrometers (on satellites and aircraft). atmospheric pressure and humidity.
ICt equipment including PCs, PDAs, servers, mainframes, network ubiquitous Sensor Networks (USN) whose sensor nodes are
databases and software for food security analysis. placed in the field.
geographic Information Systems (GIS) to store and analyse statistical telemetry units transmitting air temperature, humidity and solar
data and integrate varying databases. radiation using cellular networks.
Potential for e-Agriculture
- rural radio – achieves wide coverage and is relatively inexpensive, e.g. FAO Rural Radio in Africa.
- SMS technology – mobile phone and web-based services that help farmers achieve better yields and secure better prices by sharing
knowledge regarding weather forecasts and local price information direct to their phones, e.g. Esoko (formally Tradenet).
- telecentres – provide rural populations with access to the internet, telephone and fax services and enhance communication with
potential buyers, e.g. Buwama Community Multimedia Centre in Uganda and the regional Southern Africa Telecentre Network in
Zambia.
- e-learning – rural education and online toolkits to train individuals and support institutions and networks in the effective
management of agricultural information e.g. Information Management Resource Kit (IMARK), led by the FAO in partnership with
organisations such as the Technical Centre for Agricultural and Rural Cooperation ACP-EU.
Best Practice: esoko
Established in Ghana under the name Tradenet, Esoko works with partners in over 15 countries, offering businesses and farmers the
opportunity to cost-effectively share information. The Esoko software offers many services including SMS alerts regarding food prices and
weather forecasts to field polling via SMS. The platform is available in English, French, Arabic and Portuguese.
- Success is demonstrated in ghana where the use of the esoko SMS alert service has improved revenue of grain and fruit farmers
by 40%.
- USAID has recently begun working with Esoko to integrate Malawian smallholder famers into more efficient national and regional
markets, though the distribution of prices of commodities via SMS.
early Warning Systems
Designed to alert different actors to potential food security related problems. Systems already in operation include:
global regional
gIeWS – Global Information and Early Warning System (FAO) gMFS – Global Monitoring for Food Security (ESA)
FeWS Net – Famine Early Warning Systems Network (USAID) reWS – Regional Early Warning System (REWS) (SADC)
VAM – Vulnerability Analysis and Mapping (WFP) ICPAC – IGAD Climate Prediction and Applications Centre (IGAD)
MArS – Monitoring Agriculture Resources Unit – FOODSEC action (EC/JRC)

Fro
m F
oo
d S
ecu
rity
to
Cre
ati
ng
We
alt
h:
ho
w t
o m
ake
it
ha
pp
en
in
Afr
ica reSeArCh: too MANY INStItutIoNS, Not eNough reSourCeS
38
Ibrahim Forum 2011 | African Agriculture
global Forum on Agricultural research (gFAr)
Established in 1996, GFAR is a stakeholder-led initiative that serves as a forum for discussion and action on critical issues related to agricultural
research for development. Financial support is provided through a multi-donor trust fund maintained at the FAO. GFAR operates through six
independently managed regional fora, with Africa represented through FARA.
Forum for Agricultural research in Africa (FArA)
Established in 2001, FARA’s three founding members are ASARECA (Association for Strengthening Agricultural Research in East and Central
Africa), WECARD (West and Central African Council for Agricultural Research and Development) and SADC-FANR (Southern African
Development Community-Food Agriculture and Natural Resources). Its responsibilities include advocacy and resource mobilisation, supporting
networking for the implementation of CAADP Pillar IV, promoting compliance with FAAP principles and engaging with the global community,
especially with GFAR and CGIAR.
regional universities Forum for Capacity Building in Agriculture (ruForuM)
Established in 2004, RUFORUM is a consortium of 29 universities in Eastern, Central and Southern Africa. Its mandate is to oversee graduate
training and networks of specialisation in COMESA countries and it operates through research and training programmes. The RUFORUM post-
graduate training programme is designed to augment the pool of agricultural researchers and policy professionals in sub-Saharan Africa by
supporting graduate studies in agriculture and related fields and by enhancing capabilities in member universities. RUFORUM offers regional
MSc/M.Phil programmes, PhD programmes, Student Field Attachment Programmes and short targeted courses.
universities, Businesses, and research in Agricultural Innovation (uniBrAIN)
UniBRAIN aims to address African universities’ insufficient capacity to meet the needs of industry, by promoting agricultural innovation and
improving tertiary agribusiness education on the continent. The initiative is being implemented by a consortium led by FARA. It promotes
innovation by improving the flow of technology and knowledge, by removing barriers between actors in the value chains, and linking university
education, research and business in sustainable agriculture.
African Women in Agricultural research and development (AWArd)
Established in 2008, AWARD aims to help women increase their contributions in the fight against hunger and poverty in sub-Saharan Africa. It is
a professional development program offering fellowships that strengthen the research and leadership skills of African women in agricultural
science, thus empowering them to contribute more effectively to poverty alleviation and food security. Fellows remain in their place of
employment or study, while benefiting from mentoring partnerships, building science skills, developing leadership capacity and having their
learning tracked, monitored and evaluated.
Best Practice: Brazil and China | Between u$1 - 2 billion on Agriculture research
- The Brazilian Research Institution Embrapa has an agricultural research and development budget of approximately $1.1 billion.
- China’s agricultural research budget has increased by nearly 10% since 2001, totalling $1.8 billion in 2007.
dAtA ANd StAtIStICS: A huge gAP
Agro-sectors need information regarding land use, commodity prices, climatic changes and natural forecasts.
Strengthening capacity at the country level
- Developing capacity and increasing human capital within the units responsible for collection, compilation, analysis and dissemination
of agricultural statistics.
- Improving capacity to appropriately analyse data for use in policy formulation.
- Increasing the allocation of funds from development partners and national budgets for agricultural statistics.
- Facilitating institutional coordination to ensure harmonisation of data sources.
- Increasing access to adequate technical tools, statistical methodology and survey framework.
- Encouraging respondents to engage with questionnaires used by institutions to collect data.
- Encouraging ministries of agriculture and related organisations responsible for sectors such as land, water use and fisheries to liaise
with each other.
Sharing capacity at the regional level
- African Commission on Agricultural Statistics (AFCAS) brings together statistics officials from FAO member countries in Africa, who are
responsible for the development of agricultural statistics in their respective countries. Through bi-annual meetings, ideas on the state
of food and agricultural statistics are reviewed and exchanged and member countries are advised on the development of their
agricultural statistical systems.
SPotLIght: A greeN reVoLutIoN IN AFrICA?
39
Ibrahim Forum 2011 | African Agriculture
Key Aspects of a ‘green revolution for Africa’
- Scale up proven techniques in small-scale irrigation and water harvesting to provide “more crop per drop”.
- Develop improved food crops through publicly-funded research focused specifically on Africa.
- Restore soil health through agroforestry techniques and organic and mineral fertilisers.
- Electrification and access to information technologies, such as cell phones, to increase rural productivity.
- Home-grown school feeding programs to provide nutritionally balanced meals, further stimulating demand from local farmers.
- Social safety nets, from grain reserves to early warning systems, to protect the most vulnerable.25
Alliance for a green revolution in Africa (AgrA)
Established in 2006 through a partnership between The Rockefeller Foundation and the Bill and Melinda Gates Foundation with additional
funding from DFID. Three main goals to be achieved by 2020:
- Reduce food insecurity by 50% in at least 20 countries.
- Double the incomes of 20 million smallholder families.
- Put 15 countries on track for attaining and sustaining a uniquely African Green Revolution; one which supports smallholder farmers,
protects the environment, and helps farmers adapt to climate change.
AgrA’s Integrated Approach – Five Pillars:
- Seeds Programme - supports the breeding of improved seeds and works to ensure access to quality seeds.
- Soil health Programme - improves farm productivity by increasing access to locally appropriate soil nutrients and encouraging soil
and water management.
- Market Access Programme - aims to expand market access for smallholder farmers.
- Policy and Partnerships Programme - aims to ensure support for smallholder farmers on a national, regional and global level and
establish effective partnerships to organise resources and expertise.
- Initiative on Innovative Finance - works with Africa's financial institutions and other partners to increase access to low interest loans
for smallholders and agribusinesses.
Best Practice: Agricultural Input Subsidy Programme (AISP), Malawi
After a severe drought in 2005, the government of Malawi introduced an input subsidy programme. With a state coupon the price of a bag of
fertiliser fell from 6,500 kwacha to 900 kwacha and a 2kg bag of hybrid maize seed from 600 kwacha to 30 kwacha.
Despite donor reluctance to support the programme, it was a huge success. It is estimated to have raised national maize production from 26%
to 60%. Per capita maize output increased from 145kg in 2004 to 258kg in 2007.
The programme has contributed to wider economic growth and poverty reduction through increased food availability and higher real wages.
25 2004 meeting of a group of African Heads of State and Government.
Fro
m F
oo
d S
ecu
rity
to
Cre
ati
ng
We
alt
h:
ho
w t
o m
ake
it
ha
pp
en
in
Afr
ica

40
Fro
m F
oo
d S
ecu
rity
to
Cre
ati
ng
We
alt
h:
ho
w t
o m
ake
it
ha
pp
en
in
Afr
ica
Ibrahim Forum 2011 | African Agriculture
the greeN reVoLutIoN IN ASIA: MIxed IMPACtS?
In response to widespread malnutrition and hunger and severe climatic conditions in Asia by the mid-1960s, the Rockefeller and Ford
Foundations led the way in developing technology that increased agricultural productivity. Improvements in productivity were facilitated by the
introduction of high yielding crop varieties (HYVs), enhanced management techniques and increased use of pesticides and fertilisers.
The breeding of improved varieties of rice and wheat led to dramatic yield increases: by 1970, 20% of wheat area and 30% of rice area in Asian
countries were planted with HYVs and by 1990 the share had increased to about 70% for both crops. Between 1970 and 1995, cereal and
calorie availability per capita in the region increased by nearly 30%.
Sources: IFPRI, 2002 and BBC, 2010
Potential Impacts for Africa26
- Learning from this experience, Africa could increase the value of its agricultural output from $280 billion to approximately $500
billion by 2020 and $880 billion by 2030.
- The value of the continent’s agricultural production could grow twice as fast over the next 20 years as it has over the last decade.
- Nearly three quarters of the absolute increase in output could occur in the 11 countries with the largest commercial farming
opportunities: Angola, Cameroon, Côte d’Ivoire, Ethiopia, Ghana, Kenya, Madagascar, Mozambique, Nigeria, Sudan, and Tanzania.
26 McKinsey Global Institute, 2011
Positive impacts
Doubling of rice and wheat yields increased farmers' incomes.
Increased farmers’ incomes led to a general increase in demand for
goods and services and stimulated rural non-farm economy which
generated higher returns and employment.
Real per capita incomes doubled in Asia.
Absolute number of people in poverty fell from 1.2 billion in 1975
to 825 million in 1995, despite 60% increase in population.
Smallholder farmers benefitted from increased production, greater
employment opportunities and higher wages.
Negative impacts
Smallholder farmers lagged behind larger farm holders, and were
negatively affected by lower product prices, higher input prices
and efforts to increase rents and force tenants off land.
Unnecessary mechanisation pushed down rural wages and
employment.
The Green Revolution only spread in irrigated and high potential
rain fed areas. Regions without sufficient water were excluded.
Environmental damage from excessive use of fertilisers and
pesticides polluted waterways, poisoned agricultural workers and
killed wildlife.
Increased irrigation led to salt build up and abandonment of best
farming lands.
Groundwater levels retreated in areas where more water was being
pumped for irrigation than could be renewed by rainfall.
Heavy dependence on a few major cereal varieties resulted in loss
of biodiversity on farms.
Researchers found that cumulative global emissions since 1850
would have been one third as much without the Green Revolution’s
higher yields.

MAKINg MoNeY FroM AgrICuLture
41
World’s top 10 Agricultural Producers
Country World rank for Agriculture gdP Population
(global rank select commodities production value from agriculture active in agriculture
in gdP) (uS$ billions) (%) (%)
1st Wheat, Rice, Tea, Cotton
China (3) 2nd Coarse grains 780 10.2 60.8
3rd Major oil seeds, Raw sugar
1st Sorghum, Maize, Cows’ milk
united States (1) 2nd Tomatoes, Hens’ eggs 267 1.1 1.6
3rd Wheat, Onions, Sugar beet
1st Papayas, Mangoes, Millet
India (10) 2nd Wheat, Rice, Sugar cane, Tea 218 18.5 54.4
3rd Tobacco, Hens’ eggs
1st Oranges, Sugar cane, Coffee
Brazil (8) 2nd Soya beans, Papayas, Tobacco 124 5.8 11.0
3rd Castor oil seed, Gums natural, Pepper
2nd Onions (green)
Japan (2) 3rd Spinach, Persimmons 92 1.4 2.2
4th Hens’ eggs, Tangerines
1st Cloves, Palm oil, Coconuts
Indonesia (18) 2nd Cocoa beans, Pepper, Nuts 71 15.3 41.4
3rd Rice (paddy), Ginger, Avocados
1st Barley, Raspberries, Gooseberries
russia (12) 2nd Carrots and turnips, Peas (dry), 69 4.0 8.0
3rd Pumpkins, Potatoes, Rye
1st Sugar beet, Mixed grain
France (5) 2nd String beans, Hempseed, Duck meat 67 2.0 2.0
3rd Mixed grain, Barley, Broad beans
1st Melonseed, Yams, Cassava
Nigeria (44) 2nd Citrus fruit, Okra, Sweet potatoes 65 30.0 24.9
3rd Palm oil, Maize, Goat meat
1st Apricots, Hazelnuts, Cherries
turkey (17) 2nd Chick peas, Watermelons, Strawberries 65 9.6 32.3
3rd Walnuts (with shell), Chillies, Honey
Sources: FAOSTAT, WDI and CIA World Factbook. Data are for 2008 and 2009, except for % GDP from agriculture, which are from 2010.
Ag
ricu
ltu
re a
nd
Fo
od
: d
oin
g B
usi
ne
ss,
Att
ract
ing
In
vest
me
nt
Ibrahim Forum 2011 | African Agriculture

Ag
ricu
ltu
re a
nd
Fo
od
: d
oin
g B
usi
ne
ss,
Att
ract
ing
In
vest
me
nt
42
World’s top 5 Agribusinesses
turnover Market employees Activities
(uS$bn) Capitalisation
(uS$bn)
Cargill (USA) 119.5 - 138,000 Buying, processing and distributing grains, oilseeds and other commodities;
providing crop and livestock producers with products and services; and
providing food and beverage manufacturers with ingredients.
Africa Presence | Algeria, Côte d’Ivoire, Egypt, Ghana, Kenya, Malawi, Morocco,
South Africa, Zambia, Zimbabwe.
Archer Daniels 69 20 30,000 Transporting, storing and processing corn, oilseeds, wheat and cocoa into
Midland (USA) products for food, animal feed and chemical and energy uses.
Africa Presence | Cameroon, Côte d'Ivoire and Ghana.
Bunge (Bermuda) 46 9 32,000 Originating oilseeds and grains; crushing oilseeds and sugarcane for food and
energy; milling wheat and corn for food processors, bakeries, breweries; and
selling fertiliser to farmers.
Africa Presence | Egypt, Morocco, South Africa.
Wilmar International 30 34 88,000 Cultivating oil palm; crushing oilseeds, refining edible oils; manufacturing
(Singapore) sugar, speciality fats, oleochemicals and biodiesel; and processing grains.
Africa Presence | Cameroon, Congo, Côte d'Ivoire, Egypt, Ethiopia, Ghana,
Kenya, Mozambique, South Africa, Togo.
Louis Dreyfus 20 - 34,000 Processing, trading and merchandising of agriculture and energy commodities.
Commodities (France) Africa Presence | Angola, Burkina Faso, Burundi, Cameroon, Côte d'Ivoire,
Egypt, Ghana, Kenya, Madagascar, Mali, Senegal, South Africa, Tanzania, Uganda.
Sources: Financial Times, 2010; Forbes, 2011 and Yahoo Finance
World’s top 10 Food Processing Companies
rank turnover (uS$bn ) Market Capitalisation (uS$bn) employees
26th Nestlé (Switzerland) 112 196 -
103rd Unilever (Netherlands) 59 103 163,000
105th Kraft Foods (USA) 49 63 -
198th Archer Daniels (USA) 69 20 30,000
218th Danone (France) 23 33 100,995
269th Wilmar International (Singapore) 30 34 88,000
373rd Bunge (Bermuda) 46 9 32,000
410th General Mills (USA) 15 25 35,000
517th Kellogg’s (USA) 12 20 30,645
567th Association British Foods (UK) 16 20 97,000
Rankings based on profits in the World’s top 2000 companies.Sources: Bloomberg; Forbes, 2011 and Yahoo Finance
Ibrahim Forum 2011 | African Agriculture
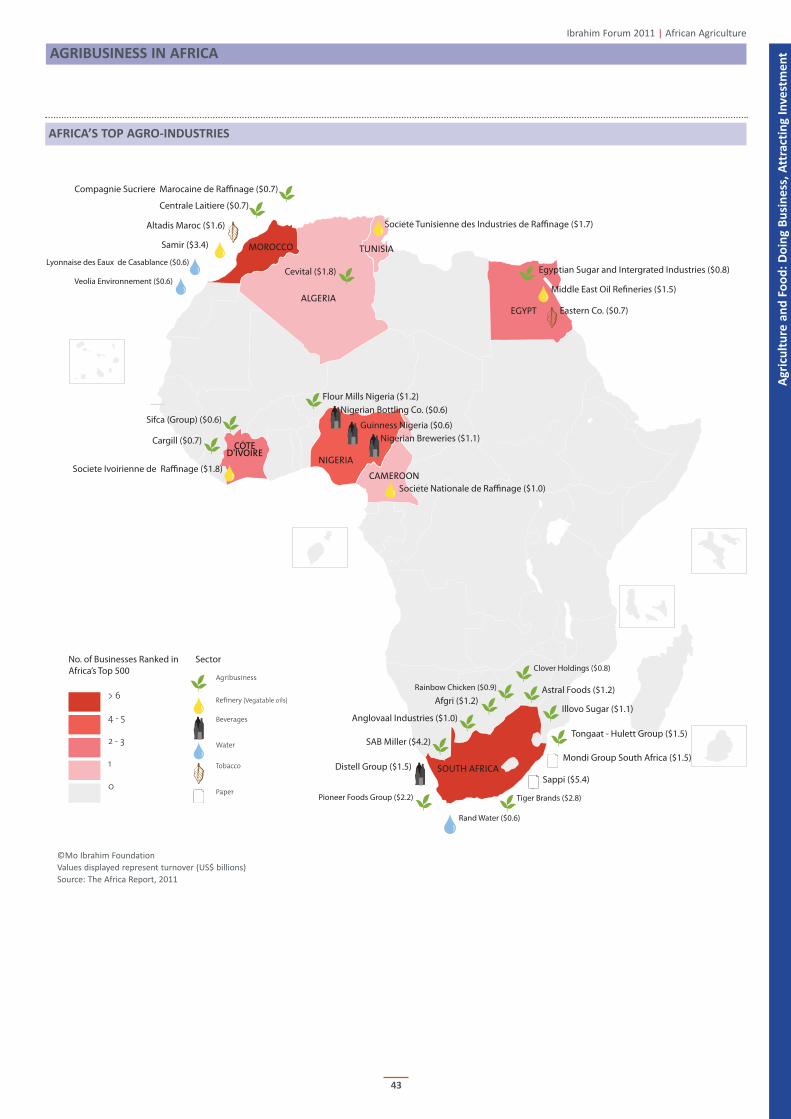
AgrIBuSINeSS IN AFrICA
43
Ibrahim Forum 2011 | African Agriculture
EGYPT
Middle East Oil Re�neries ($1.5)
Eastern Co. ($0.7)
Egyptian Sugar and Intergrated Industries ($0.8)
Societe Tunisienne des Industries de Ra!nage ($1.7)
ALGERIA
Cevital ($1.8)
TUNISIA
CAMEROONSociete Nationale de Ra!nage ($1.0)
COTE D'IVOIRECargill ($0.7)
Sifca (Group) ($0.6)
Pioneer Foods Group ($2.2)
Societe Ivoirienne de Ra!nage ($1.8)NIGERIA
Nigerian Bottling Co. ($0.6)
Guinness Nigeria ($0.6)Nigerian Breweries ($1.1)
Flour Mills Nigeria ($1.2)
Astral Foods ($1.2)Afgri ($1.2)
Clover Holdings ($0.8)
Illovo Sugar ($1.1)
Rainbow Chicken ($0.9)
Anglovaal Industries ($1.0)
Rand Water ($0.6)
MOROCCOSamir ($3.4)
Altadis Maroc ($1.6)
Centrale Laitiere ($0.7)
Compagnie Sucriere Marocaine de Ra!nage ($0.7)
Lyonnaise des Eaux de Casablance ($0.6)
Veolia Environnement ($0.6)
SOUTH AFRICA
Tiger Brands ($2.8)
Mondi Group South Africa ($1.5)
Tongaat - Hulett Group ($1.5)SAB Miller ($4.2)
Distell Group ($1.5)Sappi ($5.4)0
1
2 - 3
4 - 5
> 6
No. of Businesses Ranked inAfrica’s Top 500
Sector
Agribusiness
Refinery (Vegatable oils)
Beverages
Water
Tobacco
Paper
Ag
ricu
ltu
re a
nd
Fo
od
: d
oin
g B
usi
ne
ss,
Att
ract
ing
In
vest
me
nt
AFrICA’S toP Agro-INduStrIeS
©Mo Ibrahim FoundationValues displayed represent turnover (US$ billions)Source: The Africa Report, 2011
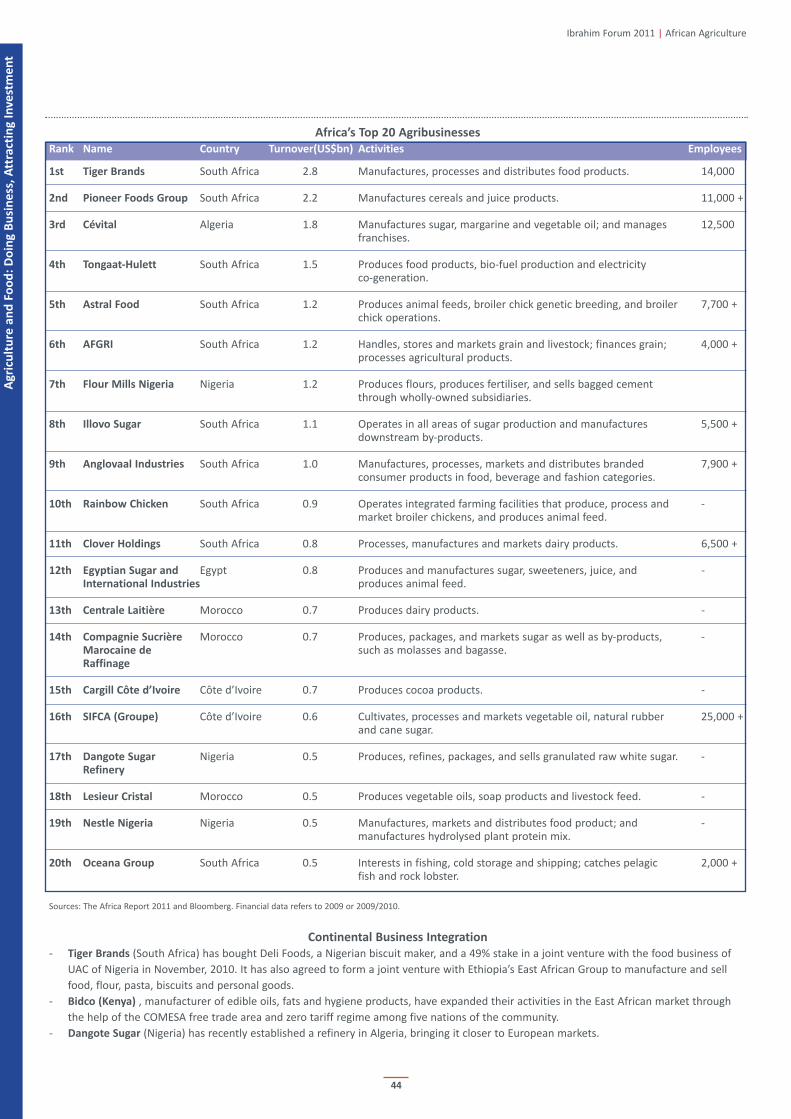
Ag
ricu
ltu
re a
nd
Fo
od
: d
oin
g B
usi
ne
ss,
Att
ract
ing
In
vest
me
nt
44
Africa’s top 20 Agribusinesses
rank Name Country turnover(uS$bn) Activities employees
1st tiger Brands South Africa 2.8 Manufactures, processes and distributes food products. 14,000
2nd Pioneer Foods group South Africa 2.2 Manufactures cereals and juice products. 11,000 +
3rd Cévital Algeria 1.8 Manufactures sugar, margarine and vegetable oil; and manages 12,500franchises.
4th tongaat-hulett South Africa 1.5 Produces food products, bio-fuel production and electricityco-generation.
5th Astral Food South Africa 1.2 Produces animal feeds, broiler chick genetic breeding, and broiler 7,700 +chick operations.
6th AFgrI South Africa 1.2 Handles, stores and markets grain and livestock; finances grain; 4,000 +processes agricultural products.
7th Flour Mills Nigeria Nigeria 1.2 Produces flours, produces fertiliser, and sells bagged cement through wholly-owned subsidiaries.
8th Illovo Sugar South Africa 1.1 Operates in all areas of sugar production and manufactures 5,500 +downstream by-products.
9th Anglovaal Industries South Africa 1.0 Manufactures, processes, markets and distributes branded 7,900 +consumer products in food, beverage and fashion categories.
10th rainbow Chicken South Africa 0.9 Operates integrated farming facilities that produce, process and -market broiler chickens, and produces animal feed.
11th Clover holdings South Africa 0.8 Processes, manufactures and markets dairy products. 6,500 +
12th egyptian Sugar and Egypt 0.8 Produces and manufactures sugar, sweeteners, juice, and -International Industries produces animal feed.
13th Centrale Laitière Morocco 0.7 Produces dairy products. -
14th Compagnie Sucrière Morocco 0.7 Produces, packages, and markets sugar as well as by-products, -Marocaine de such as molasses and bagasse.raffinage
15th Cargill Côte d’Ivoire Côte d’Ivoire 0.7 Produces cocoa products. -
16th SIFCA (groupe) Côte d’Ivoire 0.6 Cultivates, processes and markets vegetable oil, natural rubber 25,000 +and cane sugar.
17th dangote Sugar Nigeria 0.5 Produces, refines, packages, and sells granulated raw white sugar. -refinery
18th Lesieur Cristal Morocco 0.5 Produces vegetable oils, soap products and livestock feed. -
19th Nestle Nigeria Nigeria 0.5 Manufactures, markets and distributes food product; and -manufactures hydrolysed plant protein mix.
20th oceana group South Africa 0.5 Interests in fishing, cold storage and shipping; catches pelagic 2,000 +fish and rock lobster.
Sources: The Africa Report 2011 and Bloomberg. Financial data refers to 2009 or 2009/2010.
Continental Business Integration
- tiger Brands (South Africa) has bought Deli Foods, a Nigerian biscuit maker, and a 49% stake in a joint venture with the food business of
UAC of Nigeria in November, 2010. It has also agreed to form a joint venture with Ethiopia’s East African Group to manufacture and sell
food, flour, pasta, biscuits and personal goods.
- Bidco (Kenya) , manufacturer of edible oils, fats and hygiene products, have expanded their activities in the East African market through
the help of the COMESA free trade area and zero tariff regime among five nations of the community.
- dangote Sugar (Nigeria) has recently established a refinery in Algeria, bringing it closer to European markets.
Ibrahim Forum 2011 | African Agriculture
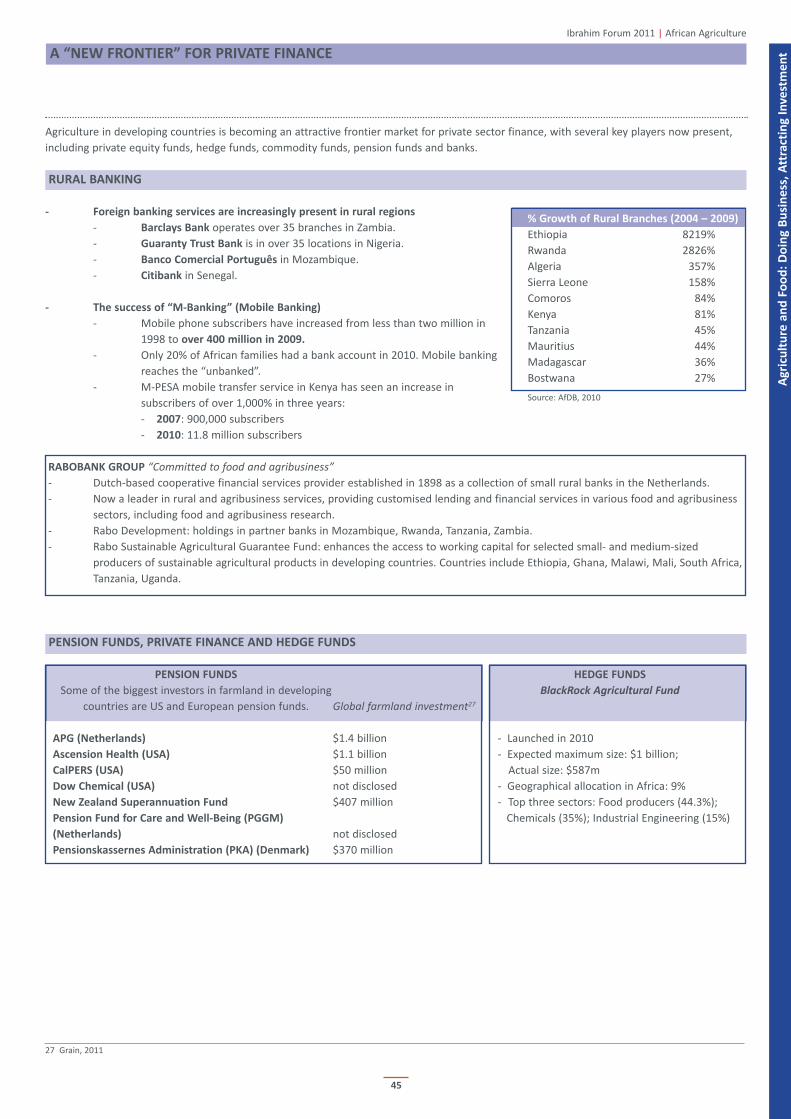
A “NeW FroNtIer” For PrIVAte FINANCe
45
Ibrahim Forum 2011 | African Agriculture
% growth of rural Branches (2004 – 2009)
Ethiopia 8219%
Rwanda 2826%
Algeria 357%
Sierra Leone 158%
Comoros 84%
Kenya 81%
Tanzania 45%
Mauritius 44%
Madagascar 36%
Bostwana 27%
Source: AfDB, 2010
Ag
ricu
ltu
re a
nd
Fo
od
: d
oin
g B
usi
ne
ss,
Att
ract
ing
In
vest
me
nt
Agriculture in developing countries is becoming an attractive frontier market for private sector finance, with several key players now present,
including private equity funds, hedge funds, commodity funds, pension funds and banks.
rurAL BANKINg
- Foreign banking services are increasingly present in rural regions
- Barclays Bank operates over 35 branches in Zambia.
- guaranty trust Bank is in over 35 locations in Nigeria.
- Banco Comercial Português in Mozambique.
- Citibank in Senegal.
- the success of “M-Banking” (Mobile Banking)
- Mobile phone subscribers have increased from less than two million in
1998 to over 400 million in 2009.
- Only 20% of African families had a bank account in 2010. Mobile banking
reaches the “unbanked”.
- M-PESA mobile transfer service in Kenya has seen an increase in
subscribers of over 1,000% in three years:
- 2007: 900,000 subscribers
- 2010: 11.8 million subscribers
rABoBANK grouP “Committed to food and agribusiness”
- Dutch-based cooperative financial services provider established in 1898 as a collection of small rural banks in the Netherlands.
- Now a leader in rural and agribusiness services, providing customised lending and financial services in various food and agribusiness
sectors, including food and agribusiness research.
- Rabo Development: holdings in partner banks in Mozambique, Rwanda, Tanzania, Zambia.
- Rabo Sustainable Agricultural Guarantee Fund: enhances the access to working capital for selected small- and medium-sized
producers of sustainable agricultural products in developing countries. Countries include Ethiopia, Ghana, Malawi, Mali, South Africa,
Tanzania, Uganda.
PeNSIoN FuNdS, PrIVAte FINANCe ANd hedge FuNdS
PeNSIoN FuNdS hedge FuNdS
Some of the biggest investors in farmland in developing BlackRock Agricultural Fund
countries are US and European pension funds. Global farmland investment27
APg (Netherlands) $1.4 billion - Launched in 2010
Ascension health (uSA) $1.1 billion - Expected maximum size: $1 billion;
CalPerS (uSA) $50 million Actual size: $587m
dow Chemical (uSA) not disclosed - Geographical allocation in Africa: 9%
New Zealand Superannuation Fund $407 million - Top three sectors: Food producers (44.3%);
Pension Fund for Care and Well-Being (PggM) Chemicals (35%); Industrial Engineering (15%)
(Netherlands) not disclosed
Pensionskassernes Administration (PKA) (denmark) $370 million
27 Grain, 2011
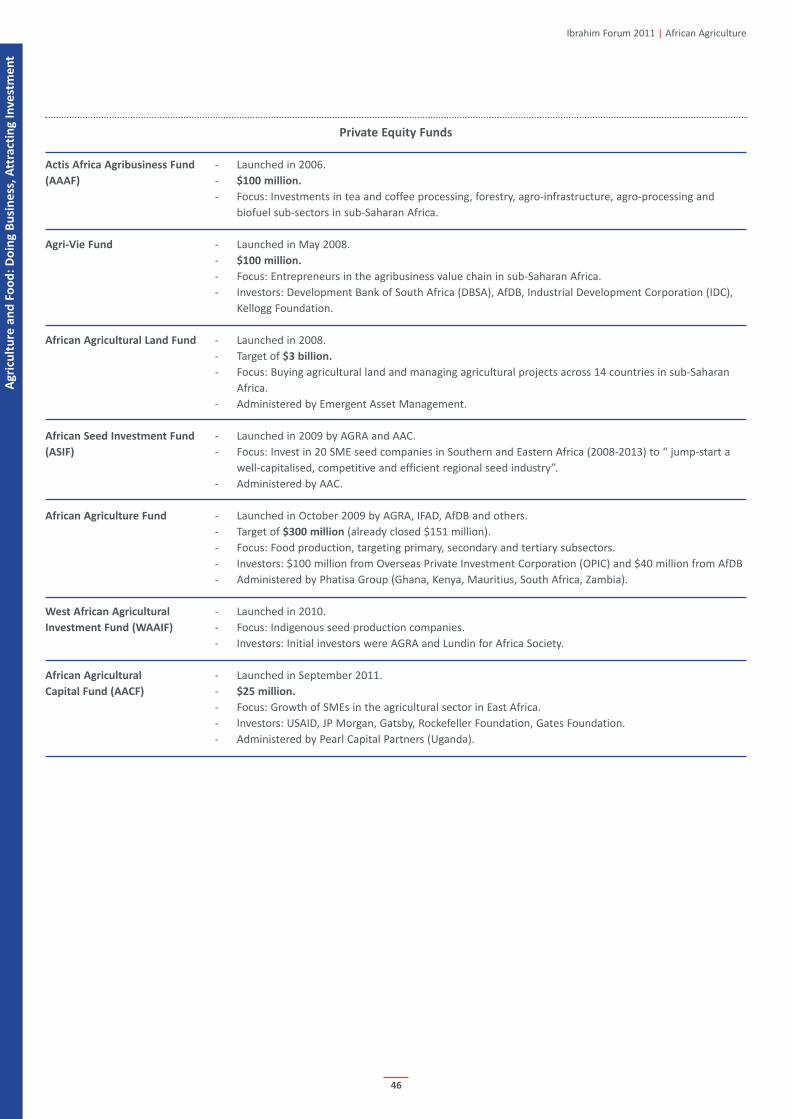
Ag
ricu
ltu
re a
nd
Fo
od
: d
oin
g B
usi
ne
ss,
Att
ract
ing
In
vest
me
nt
46
Private equity Funds
Actis Africa Agribusiness Fund - Launched in 2006.
(AAAF) - $100 million.
- Focus: Investments in tea and coffee processing, forestry, agro-infrastructure, agro-processing and
biofuel sub-sectors in sub-Saharan Africa.
Agri-Vie Fund - Launched in May 2008.
- $100 million.
- Focus: Entrepreneurs in the agribusiness value chain in sub-Saharan Africa.
- Investors: Development Bank of South Africa (DBSA), AfDB, Industrial Development Corporation (IDC),
Kellogg Foundation.
African Agricultural Land Fund - Launched in 2008.
- Target of $3 billion.
- Focus: Buying agricultural land and managing agricultural projects across 14 countries in sub-Saharan
Africa.
- Administered by Emergent Asset Management.
African Seed Investment Fund - Launched in 2009 by AGRA and AAC.
(ASIF) - Focus: Invest in 20 SME seed companies in Southern and Eastern Africa (2008-2013) to “ jump-start a
well-capitalised, competitive and efficient regional seed industry”.
- Administered by AAC.
African Agriculture Fund - Launched in October 2009 by AGRA, IFAD, AfDB and others.
- Target of $300 million (already closed $151 million).
- Focus: Food production, targeting primary, secondary and tertiary subsectors.
- Investors: $100 million from Overseas Private Investment Corporation (OPIC) and $40 million from AfDB
- Administered by Phatisa Group (Ghana, Kenya, Mauritius, South Africa, Zambia).
West African Agricultural - Launched in 2010.
Investment Fund (WAAIF) - Focus: Indigenous seed production companies.
- Investors: Initial investors were AGRA and Lundin for Africa Society.
African Agricultural - Launched in September 2011.
Capital Fund (AACF) - $25 million.
- Focus: Growth of SMEs in the agricultural sector in East Africa.
- Investors: USAID, JP Morgan, Gatsby, Rockefeller Foundation, Gates Foundation.
- Administered by Pearl Capital Partners (Uganda).
Ibrahim Forum 2011 | African Agriculture

Ag
ricu
ltu
re a
nd
Fo
od
: d
oin
g B
usi
ne
ss,
Att
ract
ing
In
vest
me
ntSPotLIght: INtrA-AFrICAN trAde
47
LoWer the Food BILL oF AFrICA
- over ⅔ of African countries are net importers of agricultural products.
- only 14 countries are net exporters: Burundi, Cameroon, Côte d'Ivoire, Ethiopia, Ghana, Guinea-Bissau, Kenya, Malawi, Rwanda, South
Africa, Swaziland, Tanzania, Uganda and Zambia.
- On average between 2000 and 2005, the annual food trade bill of the continent was $17.3 billion of exports and $24 billion of imports,
leading to an average annual deficit of $6.6 billion.28
- There was a steep rise in the food import bill between 2001 and 2006 from nearly $20 billion to more than $33 billion.
- It is estimated that Africa imports about 28% of its calorie requirements. the major imports are wheat (58%), rice (41%) and oils (54%).
Source: FAO Statistical Yearbook, 2010. Data are for 2008.28 UNECA, 2009
Algeria
Egypt
Morocco
Nigeria
Angola
Libya
Senegal
Sudan
Tunisia
Congo, DR.
Somalia
Botswana
Mauritania
Congo
Mauritius
Benin
Gabon
Mozambique
Niger
Madagascar
Guinea
Cape Verde
Sierra Leone
Lesotho
Namibia
Liberia
Gambia
Zimbabwe
Seychelles
Equatorial Guinea
Mali
Eritrea
Chad
Comoros
Togo
São Tomé and Príncipe
Burkina Faso
Central African Rep.
Ethiopia
Burundi
Guinea-Bissau
Swaziland
Zambia
Rwanda
Ghana
Uganda
Tanzania
Cameroon
Malawi
South Africa
Kenya
Côte d'Ivoire
Net Agricultural trade (US$, millions)
Ibrahim Forum 2011 | African Agriculture
-10,000 -8,000 -6,000 -4,000 -2,000 0 2,000 4,000
-7,709-6,838
-3,238-2,544
-2,363-2,258
-1,541-1,087-1,002
-903-460-459-446-402-375-341-310-287-238-207-206-193-185-137-132-120
-95-93-85-82-66-64-56-47-25-23-21-10
48293264112221249311338
503565
1,3253,137
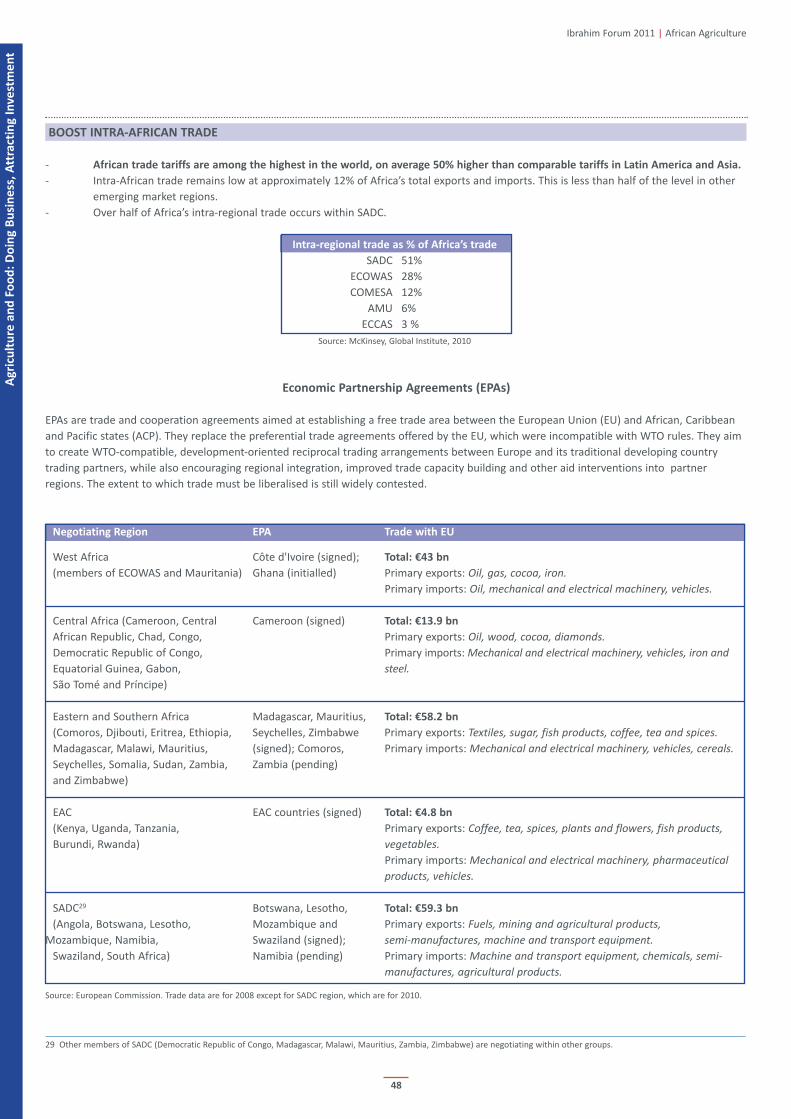
48
BooSt INtrA-AFrICAN trAde
- African trade tariffs are among the highest in the world, on average 50% higher than comparable tariffs in Latin America and Asia.
- Intra-African trade remains low at approximately 12% of Africa’s total exports and imports. This is less than half of the level in other
emerging market regions.
- Over half of Africa’s intra-regional trade occurs within SADC.
Intra-regional trade as % of Africa’s trade
SADC 51%
ECOWAS 28%
COMESA 12%
AMU 6%
ECCAS 3 %
Source: McKinsey, Global Institute, 2010
economic Partnership Agreements (ePAs)
EPAs are trade and cooperation agreements aimed at establishing a free trade area between the European Union (EU) and African, Caribbean
and Pacific states (ACP). They replace the preferential trade agreements offered by the EU, which were incompatible with WTO rules. They aim
to create WTO-compatible, development-oriented reciprocal trading arrangements between Europe and its traditional developing country
trading partners, while also encouraging regional integration, improved trade capacity building and other aid interventions into partner
regions. The extent to which trade must be liberalised is still widely contested.
Negotiating region ePA trade with eu
West Africa Côte d'Ivoire (signed); total: €43 bn
(members of ECOWAS and Mauritania) Ghana (initialled) Primary exports: Oil, gas, cocoa, iron.
Primary imports: Oil, mechanical and electrical machinery, vehicles.
Central Africa (Cameroon, Central Cameroon (signed) total: €13.9 bn
African Republic, Chad, Congo, Primary exports: Oil, wood, cocoa, diamonds.
Democratic Republic of Congo, Primary imports: Mechanical and electrical machinery, vehicles, iron and
Equatorial Guinea, Gabon, steel.
São Tomé and Príncipe)
Eastern and Southern Africa Madagascar, Mauritius, total: €58.2 bn
(Comoros, Djibouti, Eritrea, Ethiopia, Seychelles, Zimbabwe Primary exports: Textiles, sugar, fish products, coffee, tea and spices.
Madagascar, Malawi, Mauritius, (signed); Comoros, Primary imports: Mechanical and electrical machinery, vehicles, cereals.
Seychelles, Somalia, Sudan, Zambia, Zambia (pending)
and Zimbabwe)
EAC EAC countries (signed) total: €4.8 bn
(Kenya, Uganda, Tanzania, Primary exports: Coffee, tea, spices, plants and flowers, fish products,
Burundi, Rwanda) vegetables.
Primary imports: Mechanical and electrical machinery, pharmaceutical
products, vehicles.
SADC29 Botswana, Lesotho, total: €59.3 bn
(Angola, Botswana, Lesotho, Mozambique and Primary exports: Fuels, mining and agricultural products,
Mozambique, Namibia, Swaziland (signed); semi-manufactures, machine and transport equipment.
Swaziland, South Africa) Namibia (pending) Primary imports: Machine and transport equipment, chemicals, semi-
manufactures, agricultural products.
Source: European Commission. Trade data are for 2008 except for SADC region, which are for 2010.
29 Other members of SADC (Democratic Republic of Congo, Madagascar, Malawi, Mauritius, Zambia, Zimbabwe) are negotiating within other groups.
Ibrahim Forum 2011 | African Agriculture
Ag
ricu
ltu
re a
nd
Fo
od
: d
oin
g B
usi
ne
ss,
Att
ract
ing
In
vest
me
nt
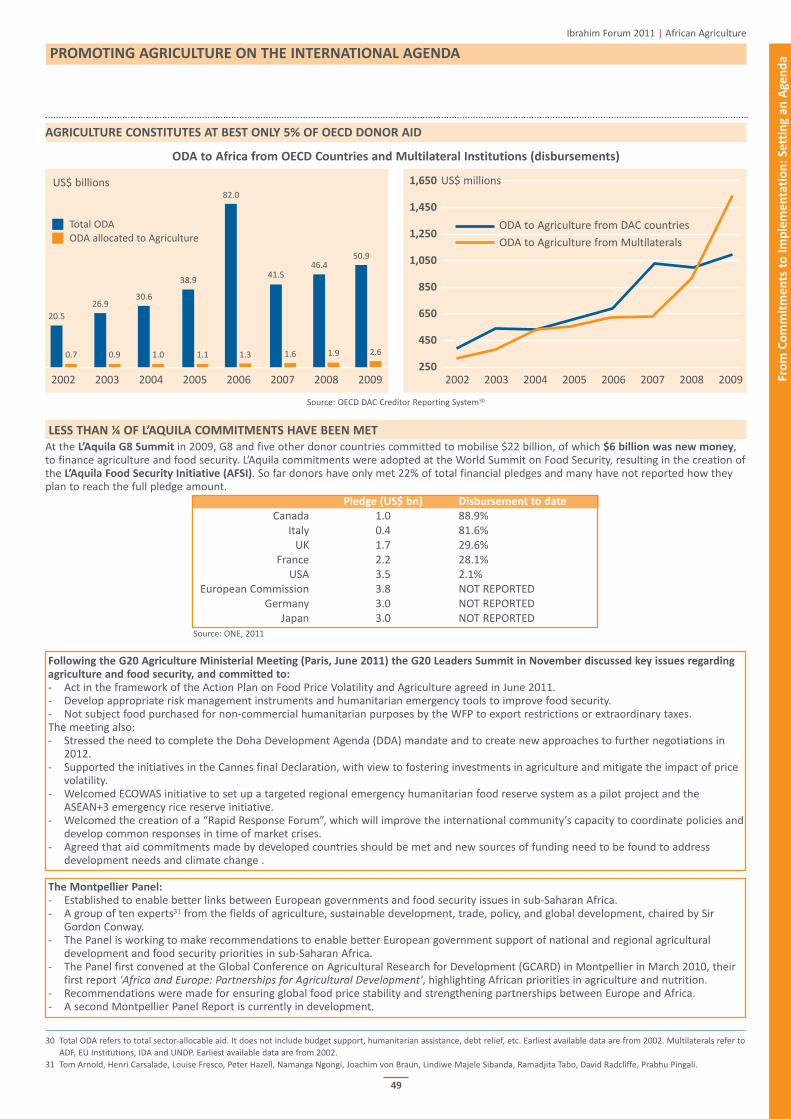
Fro
m C
om
mit
me
nts
to
Im
ple
me
nta
tio
n:
Se
ttin
g a
n A
gen
daProMotINg AgrICuLture oN the INterNAtIoNAL AgeNdA
49
AgrICuLture CoNStItuteS At BeSt oNLY 5% oF oeCd doNor AId
odA to Africa from oeCd Countries and Multilateral Institutions (disbursements)
Source: OECD DAC Creditor Reporting System30
LeSS thAN ¼ oF L’AquILA CoMMItMeNtS hAVe BeeN Met
At the L’Aquila g8 Summit in 2009, G8 and five other donor countries committed to mobilise $22 billion, of which $6 billion was new money, to finance agriculture and food security. L’Aquila commitments were adopted at the World Summit on Food Security, resulting in the creation ofthe L’Aquila Food Security Initiative (AFSI). So far donors have only met 22% of total financial pledges and many have not reported how theyplan to reach the full pledge amount.
Pledge (uS$ bn) disbursement to date
Canada 1.0 88.9%Italy 0.4 81.6%
UK 1.7 29.6%France 2.2 28.1%
USA 3.5 2.1%European Commission 3.8 NOT REPORTED
Germany 3.0 NOT REPORTEDJapan 3.0 NOT REPORTED
Source: ONE, 2011
Following the g20 Agriculture Ministerial Meeting (Paris, June 2011) the g20 Leaders Summit in November discussed key issues regardingagriculture and food security, and committed to:- Act in the framework of the Action Plan on Food Price Volatility and Agriculture agreed in June 2011. - Develop appropriate risk management instruments and humanitarian emergency tools to improve food security.- Not subject food purchased for non-commercial humanitarian purposes by the WFP to export restrictions or extraordinary taxes.The meeting also:- Stressed the need to complete the Doha Development Agenda (DDA) mandate and to create new approaches to further negotiations in
2012. - Supported the initiatives in the Cannes final Declaration, with view to fostering investments in agriculture and mitigate the impact of price
volatility.- Welcomed ECOWAS initiative to set up a targeted regional emergency humanitarian food reserve system as a pilot project and the
ASEAN+3 emergency rice reserve initiative.- Welcomed the creation of a “Rapid Response Forum”, which will improve the international community’s capacity to coordinate policies and
develop common responses in time of market crises. - Agreed that aid commitments made by developed countries should be met and new sources of funding need to be found to address
development needs and climate change .
the Montpellier Panel: - Established to enable better links between European governments and food security issues in sub-Saharan Africa.- A group of ten experts31 from the fields of agriculture, sustainable development, trade, policy, and global development, chaired by Sir
Gordon Conway. - The Panel is working to make recommendations to enable better European government support of national and regional agricultural
development and food security priorities in sub-Saharan Africa. - The Panel first convened at the Global Conference on Agricultural Research for Development (GCARD) in Montpellier in March 2010, their
first report 'Africa and Europe: Partnerships for Agricultural Development', highlighting African priorities in agriculture and nutrition. - Recommendations were made for ensuring global food price stability and strengthening partnerships between Europe and Africa. - A second Montpellier Panel Report is currently in development.
30 Total ODA refers to total sector-allocable aid. It does not include budget support, humanitarian assistance, debt relief, etc. Earliest available data are from 2002. Multilaterals refer toADF, EU Institutions, IDA and UNDP. Earliest available data are from 2002.
31 Tom Arnold, Henri Carsalade, Louise Fresco, Peter Hazell, Namanga Ngongi, Joachim von Braun, Lindiwe Majele Sibanda, Ramadjita Tabo, David Radcliffe, Prabhu Pingali.
Ibrahim Forum 2011 | African Agriculture
2002 2003 2004 2005 2006 2007 2008 2009 2002 2003 2004 2005 2006 2007 2008 2009
ODA to Agriculture from DAC countries
ODA to Agriculture from Multilaterals
20.5
0.7
26.9
0.9
30.6
1.0
38.9
1.1
82.0
1.3
41.5
1.6
46.4
1.9
50.9
2.6
g Total ODAg ODA allocated to Agriculture
US$ billions 1,650
1,450
1,250
1,050
850
650
450
250
US$ millions
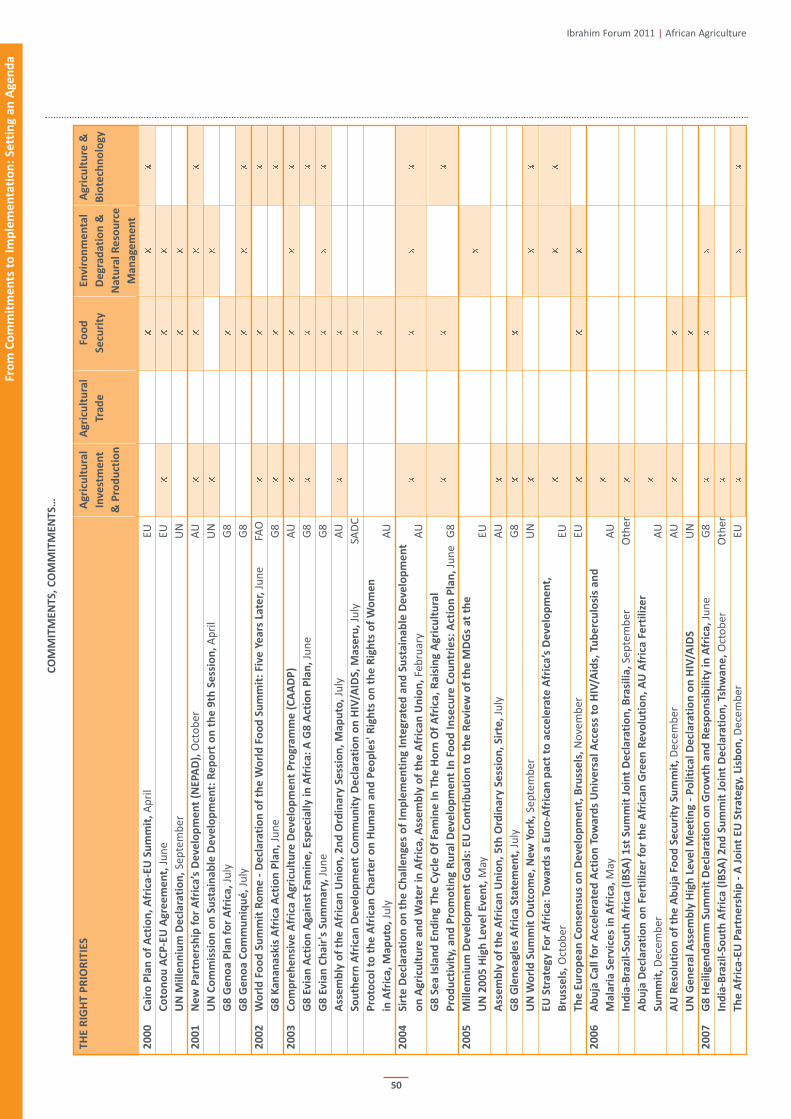
50
Ibrahim Forum 2011 | African Agriculture
Fro
m C
om
mit
me
nts
to
Im
ple
me
nta
tio
n:
Se
ttin
g a
n A
gen
da
Co
MM
ItM
eN
tS
, C
oM
MIt
Me
Nt
S…
th
e r
Igh
t P
rIo
rIt
IeS
Ag
ricu
ltu
ral
Ag
ricu
ltu
ral
Foo
d
en
vir
on
me
nta
l A
gri
cult
ure
&
Inve
stm
en
ttr
ad
eS
ecu
rity
de
gra
da
tio
n &
B
iote
chn
olo
gy
& P
rod
uct
ion
Na
tura
l r
eso
urc
e
Ma
na
gem
en
t
20
00
Ca
iro
Pla
n o
f A
ctio
n,
Afr
ica
-eu
Su
mm
it,
Ap
ril
EUx
xx
Co
ton
ou
AC
P-e
u A
gre
em
en
t,Ju
ne
EUx
xx
uN
Mil
len
niu
m d
ecl
ara
tio
n,
Sep
tem
ber
UN
xx
20
01
Ne
w P
art
ne
rsh
ip f
or
Afr
ica
’s d
eve
lop
me
nt
(Ne
PAd
),O
cto
ber
AU
xx
xx
uN
Co
mm
issi
on
on
Su
sta
ina
ble
de
velo
pm
en
t: r
ep
ort
on
th
e 9
th S
ess
ion
,A
pri
lU
Nx
x
g8
ge
no
a P
lan
fo
r A
fric
a,
July
G8
x
g8
ge
no
a C
om
mu
niq
ué
,Ju
lyG
8x
xx
20
02
Wo
rld
Fo
od
Su
mm
it r
om
e -
de
cla
rati
on
of
the
Wo
rld
Fo
od
Su
mm
it:
Five
Ye
ars
La
ter,
Jun
eFA
Ox
xx
g8
Ka
na
na
skis
Afr
ica
Act
ion
Pla
n,
Jun
eG
8x
xx
20
03
Co
mp
reh
en
sive
Afr
ica
Ag
ricu
ltu
re d
eve
lop
me
nt
Pro
gra
mm
e (
CA
Ad
P)
AU
xx
xx
g8
ev
ian
Act
ion
Aga
inst
Fa
min
e,
esp
eci
all
y i
n A
fric
a:
A g
8 A
ctio
n P
lan
,Ju
ne
G8
xx
x
g8
ev
ian
Ch
air
's S
um
ma
ry,
Jun
eG
8x
xx
Ass
em
bly
of
the
Afr
ica
n u
nio
n,
2n
d o
rdin
ary
Se
ssio
n,
Ma
pu
to,
July
AU
xx
So
uth
ern
Afr
ica
n d
eve
lop
me
nt
Co
mm
un
ity
de
cla
rati
on
on
hIV
/AId
S,
Ma
seru
,Ju
lySA
DC
x
Pro
toco
l to
th
e A
fric
an
Ch
art
er
on
hu
ma
n a
nd
Pe
op
les'
rig
hts
on
th
e r
igh
ts o
f W
om
en
in A
fric
a,
Ma
pu
to,
July
AU
x
20
04
Sir
te d
ecl
ara
tio
n o
n t
he
Ch
all
en
ges
of
Imp
lem
en
tin
g I
nte
gra
ted
an
d S
ust
ain
ab
le d
eve
lop
me
nt
on
Ag
ricu
ltu
re a
nd
Wa
ter
in A
fric
a,
Ass
em
bly
of
the
Afr
ica
n u
nio
n,
Feb
ruar
yA
Ux
xx
x
g8
Se
a I
sla
nd
en
din
g t
he
Cyc
le o
f Fa
min
e I
n t
he
ho
rn o
f A
fric
a,
ra
isin
g A
gri
cult
ura
l
Pro
du
ctiv
ity,
an
d P
rom
oti
ng
ru
ral
de
velo
pm
en
t In
Fo
od
In
secu
re C
ou
ntr
ies:
Act
ion
Pla
n,
Jun
eG
8x
xx
20
05
Mil
len
niu
m d
eve
lop
me
nt
go
als
: e
u C
on
trib
uti
on
to
th
e r
ev
iew
of
the
Md
gs
at
the
uN
20
05
hig
h L
eve
l ev
en
t,M
ayEU
x
Ass
em
bly
of
the
Afr
ica
n u
nio
n,
5th
ord
ina
ry S
ess
ion
, S
irte
,Ju
lyA
Ux
g8
gle
ne
ag
les
Afr
ica
Sta
tem
en
t,Ju
lyG
8x
x
uN
Wo
rld
Su
mm
it o
utc
om
e,
Ne
w Y
ork
,Se
pte
mb
erU
Nx
xx
eu
Str
ate
gy
Fo
r A
fric
a:
tow
ard
s a
eu
ro-A
fric
an
pa
ct t
o a
cce
lera
te A
fric
a’s
de
velo
pm
en
t,
Bru
sse
ls,
Oct
ob
erEU
xx
x
th
e e
uro
pe
an
Co
nse
nsu
s o
n d
eve
lop
me
nt,
Bru
sse
ls,
No
vem
ber
EU
xx
x
20
06
Ab
uja
Ca
ll f
or
Acc
ele
rate
d A
ctio
n t
ow
ard
s u
niv
ers
al
Acc
ess
to
hIV
/Aid
s, t
ub
erc
ulo
sis
an
d
Ma
lari
a S
erv
ice
s in
Afr
ica
,M
ayA
Ux
Ind
ia-B
razi
l-S
ou
th A
fric
a (
IBSA
) 1
st S
um
mit
Jo
int
de
cla
rati
on
, B
rasi
lia
,Se
pte
mb
erO
ther
x
Ab
uja
de
cla
rati
on
on
Fe
rtil
ize
r fo
r th
e A
fric
an
gre
en
re
volu
tio
n,
Au
Afr
ica
Fe
rtil
ize
r
Su
mm
it,
Dec
emb
erA
Ux
Au
re
solu
tio
n o
f th
e A
bu
ja F
oo
d S
ecu
rity
Su
mm
it,
Dec
emb
erA
Ux
x
uN
ge
ne
ral
Ass
em
bly
hig
h L
eve
l M
ee
tin
g -
Po
liti
cal
de
cla
rati
on
on
hIV
/AId
S
UN
x
20
07
g8
he
ilig
en
da
mm
Su
mm
it d
ecl
ara
tio
n o
n g
row
th a
nd
re
spo
nsi
bil
ity
in
Afr
ica
,Ju
ne
G
8x
xx
Ind
ia-B
razi
l-S
ou
th A
fric
a (
IBSA
) 2
nd
Su
mm
it J
oin
t d
ecl
ara
tio
n,
tsh
wa
ne
,O
cto
ber
Oth
erx
th
e A
fric
a-e
u P
art
ne
rsh
ip -
A J
oin
t e
u S
tra
teg
y, L
isb
on
,D
ecem
ber
EUx
xx

51
Ibrahim Forum 2011 | African Agriculture
Fro
m C
om
mit
me
nts
to
Im
ple
me
nta
tio
n:
Se
ttin
g a
n A
gen
da
20
08
Ind
ia-B
razi
l-So
uth
Afr
ica
(IB
SA)
dia
logu
e F
oru
m,
Som
ers
et
We
st M
inis
teri
al
Co
mm
un
iqu
é,
May
Oth
erx
de
cla
rati
on
of
the
hig
h-L
eve
l C
on
fere
nce
on
Wo
rld
Fo
od
Se
curi
ty:
the
Ch
all
en
ges
of
Cli
ma
te C
ha
nge
an
d B
ioe
ne
rgy,
Jun
eFA
Ox
x
Bru
sse
ls e
uro
pe
an
Co
un
cil
- P
resi
de
ncy
Co
ncl
usi
on
s,Ju
ne
EUx
x
g8
ho
kka
ido
Le
ad
er
Sta
tem
en
t o
n g
lob
al
Foo
d S
ecu
rity
, Ju
ne
G8
xx
xx
Ass
em
bly
of
the
Afr
ica
n u
nio
n 1
1th
ord
ina
ry S
ess
ion
, S
ha
rm e
l-S
he
ikh
,30
Ju
ne-
1 Ju
lyA
Ux
x
Ind
ia-B
razi
l-S
ou
th A
fric
a (
IBSA
) d
ialo
gu
e F
oru
m,
3rd
Su
mm
it J
oin
t d
ecl
ara
tio
n,
Ne
w d
elh
i, O
cto
ber
Oth
erx
x
g2
0 W
ash
ingt
on
de
cla
rati
on
of
the
Su
mm
it o
n F
ina
nci
al
Ma
rke
ts a
nd
th
e W
orl
d e
con
om
y,N
ovG
20x
20
09
Win
dh
oe
k h
igh
-Le
vel
Min
iste
ria
l d
ecl
ara
tio
n o
n A
fric
an
Ag
ricu
ltu
re i
n t
he
21
st C
en
tury
:
Me
eti
ng
th
e C
ha
lle
nge
s, M
ak
ing
a S
ust
ain
ab
le g
ree
n r
evo
luti
on
, Fe
bru
ary
UN
xx
xx
x
g2
0 L
on
do
n g
lob
al
Pla
n f
or
re
cove
ry a
nd
re
form
,A
pri
lG
20x
Co
un
cil
Co
ncl
usi
on
s o
n S
up
po
rtin
g d
eve
lop
ing
Co
un
trie
s in
Co
pin
g w
ith
th
e C
risi
s, B
russ
els
,M
ayEU
x
Ass
em
bly
of
the
Afr
ica
n u
nio
n 1
3th
ord
ina
ry S
ess
ion
, S
irte
,Ju
lyA
Ux
xx
g8
L'A
qu
ila
Ch
air
's S
um
ma
ry,
July
G8
xx
g8
L’A
qu
ila
Jo
int
Sta
tem
en
t o
n g
lob
al
Foo
d S
ecu
rity
, Ju
lyG
8x
x
g8
L'A
qu
ila
Pro
mo
tin
g t
he
glo
ba
l A
gen
da
: S
tate
me
nt,
July
G8
x
g8
L'A
qu
ila
re
spo
nsi
ble
Le
ad
ers
hip
fo
r a
Su
sta
ina
ble
Fu
ture
: S
tate
me
nt,
July
G8
xx
xx
g2
0 L
on
do
n M
ee
tin
g o
f Fi
na
nce
Min
iste
rs a
nd
Ce
ntr
al B
an
k g
ove
rno
rs:
Co
mm
un
iqu
é,S
epte
mbe
rG
20x
g2
0 P
itts
bu
rgh
Su
mm
it L
ea
de
rs'
Sta
tem
en
t,Se
pte
mb
erG
20x
xx
x
Bru
sse
ls e
uro
pe
an
Co
un
cil
– P
resi
de
ncy
Co
ncl
usi
on
s,O
cto
ber
EU
x
eu
-uS
Su
mm
it d
ecl
ara
tio
n,
No
vem
ber
EUx
x
5th
CA
dd
P P
art
ne
rsh
ip P
latf
orm
me
eti
ng
, C
om
mu
niq
ué
, A
bu
ja,
No
vem
ber
AU
xx
Wo
rld
Su
mm
it o
n F
oo
d S
ecu
rity
, r
om
e:
de
cla
rati
on
,N
ove
mb
erFA
Ox
xx
x
20
10
Ass
em
bly
of
the
Afr
ica
n u
nio
n,
14
th o
rdin
ary
Se
ssio
n,
Ad
dis
Ab
ab
a,
31 J
anu
ary-
2 Fe
bru
ary
AU
x
g8
de
velo
pm
en
t M
inis
ters
’ M
ee
tin
g C
ha
ir’s
Su
mm
ary
, h
ali
fax,
Ap
ril
G8
x
g2
0 C
om
mu
niq
ué
Me
eti
ng
of
Fin
an
ce M
inis
ters
an
d C
en
tra
l B
an
k g
ove
rno
rs,
Bu
san
,Ju
ne
G20
xx
g2
0 t
oro
nto
Su
mm
it d
ecl
ara
tio
n,
Jun
eG
20x
g8
Mu
sko
ka d
ecl
ara
tio
n:
re
cove
ry a
nd
Ne
w B
eg
inn
ing
s,Ju
ne
G8
x
uN
Su
mm
it:
Mil
len
niu
m d
eve
lop
me
nt
go
als
hig
h L
eve
l P
len
ary
Me
eti
ng
of
the
ge
ne
ral
Ass
em
bly
65
th S
ess
ion
: o
utc
om
e d
ocu
me
nt,
Ne
w Y
ork
, Se
pte
mb
erU
Nx
xx
x x
g2
0 S
eo
ul
Su
mm
it L
ea
de
r’s
de
cla
rati
on
,N
ove
mb
erG
20x
g2
0 S
eo
ul
de
velo
pm
en
t C
on
sen
sus
for
Sh
are
d g
row
th (
An
ne
x I)
,N
ove
mb
erG
20x
g2
0 S
eo
ul
Mu
lti-
Yea
r A
ctio
n P
lan
on
de
velo
pm
en
t (A
nn
ex
II),
No
vem
ber
G20
xx
x
g2
0 S
eo
ul
Su
mm
it d
ocu
me
nt:
Fra
me
wo
rk f
or
Str
on
g,
Su
sta
ina
ble
an
d B
ala
nce
d g
row
th,
No
vG
20x
x
3rd
Afr
ica
-eu
Su
mm
it,
trip
oli
de
cla
rati
on
,N
ove
mb
erEU
x
uN
Cli
ma
te C
ha
nge
Co
nfe
ren
ce,
Co
P-1
6,
ou
tco
me
of
the
wo
rk o
f th
e A
d h
oc
Wo
rkin
g g
rou
p
on
lo
ng
-te
rm C
oo
pe
rati
ve A
ctio
n u
nd
er
the
Co
nve
nti
on
, C
an
cun
,29
No
vem
ber
-10
Dec
emb
erU
Nx
x
20
11
exe
cuti
ve C
ou
nci
l o
f th
e A
fric
an
un
ion
, 1
8th
ord
ina
ry S
ess
ion
, A
dd
is A
ba
ba
,Ja
nu
ary
AU
x
g8
de
au
vil
le,
g8
/Afr
ica
Jo
int
de
cla
rati
on
Sh
are
d V
alu
es,
Sh
are
d r
esp
on
sib
ilit
ies,
May
G8
x
no
. o
f m
en
tio
ns:
42
75
12
31
9
Sou
rce:
Co
mm
it4A
fric
a

MAKINg AgrICuLture A PuBLIC PrIorItY IN AFrICA
52
StreNgtheN the FoCuS oN AgrICuLture oN NAtIoNAL AgeNdAS
Public expenditure allocated to agriculture in Africa accounted for 7.3% on average, in 200732. More countries have reduced their expenditure
allocations to agriculture since 1990 than have increased them, with the greatest reductions in Botswana, Egypt, Kenya, Lesotho, Malawi,
Mauritius, Tunisia33.
Proportion of total Public expenditure in Agriculture (%)
Source: SPEED
Some countries nonetheless have increased the proportion of public expenditure directed towards agriculture over this period. Between 1990
and 2007, public expenditure for agriculture increased by 37% in Zimbabwe, 7.5% in Ethiopia, 5.5% in Zambia and 1.7% in Uganda.
Proportion of total Public expenditure in Agriculture in 200733 (%)
Source: SPEED
10% oF NAtIoNAL BudgetArY reSourCeS: AN uNMet CoNtINeNtAL CoMMItMeNt?
- Maputo declaration on Agriculture and Food Security in Africa (July 2003)
At the 2nd Ordinary Assembly of the African Union, African Heads of State and Government committed to allocate at least 10 % of national
budgets to agriculture and rural development policy implementation within five years (2008).
In 2011, three years after the deadline – only nine countries have reached that target
Burkina Faso, Ethiopia, Ghana, Guinea, Malawi, Mali, Niger, Rwanda, Senegal
- Comprehensive Africa Agriculture development Programme (CAAdP)
Launched by the New Partnership for Africa’s Development (NEPAD) in 2003, CAADP Compacts endorse the Maputo Declaration and focus on
improving food security and nutrition, and increasing incomes. Countries are targeted to increase agricultural productivity by at least 6%
annually. To benefit from donor funding each country is required to develop its own project and ensure that it aligns with the CAADP programme.
27 countries have signed CAAdP Compacts
Benin, Burkina Faso, Burundi, Cape Verde, Cô te d’Ivoire, Democratic Republic of Congo, Ethiopia, Gambia, Ghana, Guinea, Guinea-Bissau,
Kenya, Liberia, Mali, Malawi, Mauritania, Niger, Nigeria, Rwanda, Senegal, Seychelles, Sierra Leone, Swaziland, Togo, Uganda, Tanzania, Zambia
32 Based on 15 countries for which data are available. Most recent data are for 200733 Data available for 15 countries: Botswana, Egypt, Ethiopia, Ghana, Kenya, Lesotho, Malawi, Mauritius, Morocco, Nigeria, Swaziland, Tunisia, Uganda, Zambia and Zimbabwe.
Fro
m C
om
mit
me
nts
to
Im
ple
me
nta
tio
n:
Se
ttin
g a
n A
gen
da
Ibrahim Forum 2011 | African Agriculture
1990 1991 1992 1993 1994 1995 1996 1997 1998 1999 2000 2001 2002 2003 2004 2005 2006 2007
Botswana
Egypt
Kenya
Lesotho
Malawi
Mauritius
Tunisia
14
12
10
8
6
4
2
Zim
babw
e
Ethi
opia
Zam
bia
Tuni
sia
Swaz
iland
Mal
awi
Ugand
a
Keny
a
Leso
tho
Egyp
t
Botsw
ana
Mau
ritiu
s
Mor
occo
Niger
ia
Ghana
48.8
14.48.3 6.0 4.4 4.1 4.0 3.4 3.2 3.0 2.7 2.7 2.0 2.0 0.4

53
Fro
m C
om
mit
me
nts
to
Im
ple
me
nta
tio
n:
Se
ttin
g a
n A
gen
da
Best Practice: rwanda’s CAAdP Commitment
- Rwanda was the first country to sign a CAADP Compact.
- Agricultural spending by the government has gone from 3% in 2005 to 7% in 2010.
- To implement the Compact, the government developed the Strategic Plan for the Transformation of Agriculture (PSTA) II, which aligns
development partners with the government’s strategies and tactics.
- PSTA II consists of four programmes ($847.5 million):
1. Program 1 ($658 million): intensification of sustainable production systems.
2. Program II ($42 million): support for the professional development of producers.
3. Program III ($128 million): promoting commodity chain and agribusiness development.
4. Program IV (19.5 million): support for institutional development.
Source: Montpellier Panel Report, 2010
AFrICAN INStItutIoNS ANd NetWorKS
regional economic Communities: the Agricultural Factcard
AgrICuLturAL total Youth Youth as gdP urban Land Arable Agriculture Agriculture Agriculture Labour
PoLICY population population proportion population area land as proportion imports exports force in
functioning (15-24) of total growth of gdP agriculture
not functioning population % total % total
millions millions % US$, billions annual % ha, millions ha, millions annual % imports exports % total
AMu - 87.8 17.4 19.8 360.9 2.1 577.4 20.5 9.2 18.8 3.8 28.8
CeNSAd - 549.8 108.2 19.7 830.6 3.4 1497.2 133.9 31.9 22.6 24.0 66.4
CoMeSA Agricultural 443.4 90.5 20.4 497.3 3.2 1114.3 72.2 22.9 15.5 31.5 64.8
Policy (CAP)
eAC Agricultural and 137.8 28.2 20.4 78.7 4.6 170.2 22.7 27.8 11.6 57.7 84.0
Rural Development
Policy (ARDP)
eCCAS Agricultural Policy 135.1 27.4 20.3 170.3 3.6 652.3 24.1 23.7 13.4 16.8 77.6
for Central Africa
eCoWAS Action Plan on 300.8 59.2 19.7 304.9 3.7 503.0 84.2 35.9 24.1 29.5 75.0
Agricultural Policy
for West Africa
(ECOWAP)
IgAd Regional Food 210.7 43.0 20.4 141.2 3.8 477.0 46.3 33.9 24.9 38.7 78.6
Security Strategy
SAdC Regional 273.4 55.5 20.3 574.8 3.1 964.6 52.9 16.0 11.9 15.3 56.7
Agricultural Policy
(RAP)
For further information, refer to individual REC Factcards (Annex) and Technical Notes (References).
Ibrahim Forum 2011 | African Agriculture

54
regional Farmers’ Networks
union Maghrébine des Agriculteurs (uMAgrI) – 1989
- Based in Tunis, includes the five national agricultural organisations in the region (Algeria, Libya, Mauritania, Morocco, Tunisia).
- Aims to integrate agricultural development policies of member countries, improve trade, and encourage scientific research.
Southern African Confederation of Agricultural unions (SACAu) – 1992
- Aims to strengthen the capabilities of farmers’ organisations on regional and international matters.
- Membership is open to national farmers’ unions and regional commodity associations in Southern Africa.
- Granted observer status for CoP17.
réseau des organisations Paysannes et de Producteurs de l’Afrique de l’ouest (roPPA) – 2000
- Launched in Benin and based in Burkina Faso.
- Aims to promote and defend the values of competitive and sustainable agriculture and promote
partnerships between low income rural farmers’ organisations and agricultural producers.
- Initially comprised of the ten Francophone countries of West Africa then opened to all ECOWAS
countries.
east Africa Farmers’ Federation (eAFF) – 2001
- Aims to develop a prosperous and cohesive farming community in East Africa.
- Organises farming concerns and interests in order to achieve regional cohesiveness and
improve their status.
Plateforme régionale des organisations Paysannes d’Afrique Centrale (ProrAC) – 2005
- Launched in Cameroon.
- Aims to promote and defend smallholder farmers by building institutional capacity and
supporting peasant organisations at local, national and regional levels.
- Particular focus on youth employment and encouraging women leaders.
Pan African Farmers Forum (PAFFo) – 2010
- Launched in Lilongwe, Malawi by the five regional farmers’ organisations:
- Réseau des Organisations Paysannes et de Producteurs de l’Afrique de l’Ouest (ROPPA)
- Southern African Confederation of Agricultural Unions (SACAU)
- Eastern Africa Farmers’ Federation (EAFF)
- Union Maghrébine des Agriculteurs (UMAGRI)
- Plateforme régionale des organisations Paysannes d’Afrique Centrale (PROPAC)
- Aims to represent farmers and involve them in the review and formulation of public policy at regional and continental levels.
Southern African Cotton Producers Association (SACP) – 2011
- Launched under the auspices of SACAU.
- Aims to stimulate the production of cotton; act as a government advisory body and as an industry forum; and develop small-scale
cotton farming.
- Partners eight national cotton producer countries: Madagascar, Malawi, Mozambique, South Africa, Swaziland, Tanzania, Zambia,
Zimbabwe.
Best Practice: Cape Verde - From Famine to Food Security
- Cape Verde is arid and mineral deficient, with a poor resource base. Despite being mostly rural, agriculture accounts for only 9% of GDP.
- 16% of land is arable and less than 11% is suitable for crop production. Pastoral land makes up 6% of Cape Verde’s land area and
permanent crops less than 1%. Water shortages are exacerbated by cycles of long-term drought.
- To ensure Cape Verde’s history of famine is firmly in the past, food security is embedded as a core element of the national agenda:
Support to Food Security and School Nutrition (supported by FAO, UNICEF, WFP and WHO).
- Aims to help the Government of Cape Verde and Cape Verdean Foundation for Social and Educational Action (FICASE) to achieve
the MDGs and ensure the quality of child education and the food and nutritional security of children.
- Promotes nutritional security through the education system through the diversification of school meals with local produce and school
gardens.
- Sustains economic opportunities for domestic producers.
National Strategy for Food Security (eNSA) 2002 - 2005
- Aims to assure the population access to health services and food through enabling conditions for sustainable food security and
nutrition.
Fro
m C
om
mit
me
nts
to
Im
ple
me
nta
tio
n:
Se
ttin
g a
n A
gen
da
Ibrahim Forum 2011 | African Agriculture
Pretoria declaration (2004)
established by 5 regional organisations
An agriculture sector favourable to
family farmers is:
- “One that guarantees food,
employment and revenue to the
family farmers in a sustainable
manner
- One that provides and adds value to
products for industrial purpose
- One that generates solidarity and
social security
- One that adds value to our
traditional experiences
- One that ensures equitable access
to production resources and
sustainable management of natural
resources”

SPotLIght: euroPeAN CoMMoN AgrICuLturAL PoLICY: €55 billion per year, 40% of overall budget
55
Fro
m C
om
mit
me
nts
to
Im
ple
me
nta
tio
n:
Se
ttin
g a
n A
gen
da
The Common Agricultural Policy (CAP) was originally established to improve agricultural productivity to enable a stable supply of affordable
food and to ensure that the European Union (EU) had a viable agricultural sector.
CAP aims to promote agriculture throughout the EU by increasing farmers’ incomes and supporting the provision of public goods. It is funded
by the European Commission (EC) budget.
- represents 40% of the total eC budget and around 0.5% of the EU region’s GDP. Approximately €7.7 billion is spent annually on rural
development.
- Costs approximately €55 billion annually.
- The cost has remained at around €50 billion over the past 15 years.
- Budget for 2010 = €43.8 billion. It has been reduced by 3% for 2011.
- Cereals, beef/veal and dairy products account for a high proportion of CAP funding.
- Is twice the value of African exports of agricultural goods.
- Germany is the largest net contributor to the EU budget. Greece, Portugal and Spain are the biggest beneficiaries.
- Nearly ¾ of eu farmers have an annual income under £5,000. Incomes in the agricultural sector are just 50% of the average in other
sectors.
Context
The creation of CAP followed the signing of the Treaty of Rome in 1957. CAP began operating in 1962 when market unity, community
preference and financial solidarity had been established. The six member states individually intervened strongly in their agricultural sectors,
which posed an obstacle to free trade in goods.
Mechanisms
Import levies – Set at a level to raise the world market price up to the EU target price. (Target price is chosen as the maximum desirable price
for those goods within the EU).
Import quotas – Used to restrict the quantity of food being imported into the EU. Certain non-members, who have negotiated quotas, are able
to sell certain goods within the area without tariffs.
Internal intervention price – If the internal market price falls below the intervention level then the EU will buy up goods to raise the price to
the intervention level.
direct subsidies – Paid to farmers, originally intended to encourage them to choose to grow crops attracting subsidies and maintain home-
sourced supplies.
Production quotas – Introduced to prevent overproduction of some foods that attracted subsidies in excess of market prices. The need to store
and dispose of excess produce was wasteful of resources and brought CAP into disrepute. A secondary market evolved especially in the sale of
milk quotas.
Set-aside – Farmers paid to leave land fallow. Currently suspended following rising prices for some commodities and increasing interest in
biofuel crops. Land which was set-aside was often difficult to farm.
Benefits for european Farmers
- CAP supplements farmer incomes to ensure they make a suitable living, in order to guarantee the survival of rural communities.
- Open public debate and consultations which are taken into consideration through constant reforms.
- Provides research budgets that stimulate innovation and development for productivity improvements.
- Farmers are guaranteed prices for certain commodities. For example, the price for European sugar is three times higher than the world
price.
threats for Africa34
- The surplus goods that are a production outcome of CAP are often dumped in developing countries. Local farmers are prevented from
selling their own goods because European produce is sold at a lower price.
- Thousands of tonnes of surplus powdered milk from the EU are dumped in West African countries at a cheaper price than local cattle
owners can sell for.
- European preferences for chicken breasts and legs means that thighs and wings are often frozen and exported to Africa, where they are
sold at discounted prices.
- Chicken farmers in Senegal and Ghana which previously supplied most of their country’s demand saw their market share shrink to 11% in
2006 because subsidised imports were 50% cheaper.
- Mozambique loses more than £70 million a year due to restrictions on importing into Europe and with cheap European exports being
dumped in the country.
- A reported 12,000 workers in Swaziland have lost their jobs because of the inability of local industry to compete.
34 The Independent, 2006
Ibrahim Forum 2011 | African Agriculture

Annex: regIoNAL eCoNoMIC CoMMuNItY - FACtCArdS
56
Community of Sahel-Saharan States – CeN-SAd
total Population 549.8 million
Youth Population (age 15 – 24) 108.2 million (19.7% of total population)
gdP (current US$) 830.6 billion
urban Population growth (annual) 3.4%
Land Area (ha) 1497.2 million
Arable Land (ha) 133.9 million
Agriculture Contribution to gdP (annual) 31.9%
Agricultural Imports (% of total) 22.6%
Agricultural exports (% of total) 24.0%
Labour Force in Agriculture (% of total) 66.4%35
Agricultural resources Cassava, cattle meat, cotton, cocoa beans, fruits and vegetables, groundnuts, gum arabic,
maize, millet, palm oil, peanuts, rice, roots and tubers, sorghum, sugar, wheat
Country implementation of CAAdP (16/28) Signed: Benin, Burkina Faso, Côte d’Ivoire, Gambia, Ghana, Guinea, Guinea-Bissau,
Liberia, Mali, Mauritania, Niger, Nigeria, Kenya, Senegal, Sierra Leone, Togo
Succeeded: Burkina Faso, Eritrea, Gambia, Guinea-Bissau, Nigeria, Senegal
Country commitment to Maputo (6/28) Burkina Faso, Ghana, Guinea, Mali, Niger and Senegal
regional agricultural policy None
28 member states: Benin, Burkina Faso, Central African Republic, Chad, Comoros, Côte d’Ivoire, Djibouti, Egypt, Eritrea, Gambia, Ghana, Guinea,
Guinea-Bissau, Kenya, Liberia, Libya, Mali, Mauritania, Morocco, Niger, Nigeria, São Tomé and Príncipe, Senegal, Sierra Leone, Somalia, Sudan,
Togo, Tunisia.
Common Market for eastern and Southern Africa – CoMeSA
total Population 443.4 million
Youth Population (age 15 – 24) 90.5 million (20.4% of total population)
gdP (current US$) 497.3 billion
urban Population growth (annual) 3.2%
Land Area (ha) 1114.3 million
Arable Land (ha) 72.2 million
Agriculture Contribution to gdP (annual) 22.9%
Agricultural Imports (% of total) 15.5%
Agricultural exports (% of total) 31.5%
Labour Force in Agriculture (% of total) 64.8%36
Agricultural resources Cotton, fruits and vegetables, gum arabic, maize, millet, palm oil, peanuts, rice, roots and
tubers, sorghum, sugar, wheat
Country implementation of CAAdP (10/19) Signed: Burundi, Democratic Republic of Congo, Ethiopia, Kenya, Malawi, Seychelles,
Swaziland, Rwanda, Uganda, Zambia
Succeeded: Eritrea
Country commitment to Maputo (3/19) Ethiopia, Malawi and Rwanda
regional agricultural policy CoMeSA Agricultural Policy (CAP) supports national to regional approach to regional
food security issues and is based on opening up the region to free flowing agricultural
trade and establishing policies and systems that allow for conducive trade environment.
The CoMeSA Agricultural Programmes aim to position the region as a supplier of
primary and processed agricultural goods to global markets.
19 member states: Burundi, Comoros, Democratic Republic of Congo, Djibouti, Egypt, Eritrea, Ethiopia, Kenya, Libya, Madagascar, Malawi,
Mauritius, Rwanda, Seychelles, Sudan, Swaziland, Uganda, Zambia, Zimbabwe.
35 Labour force participation in agriculture average calculation does not include data for Benin, Central African Republic, Djibouti, São Tomé and Príncipe, Sierra Leone.36 Labour force participation in agriculture average calculation does not include data for Democratic Republic of Congo, Djibouti and Madagascar.
Fro
m C
om
mit
me
nts
to
Im
ple
me
nta
tio
n:
Se
ttin
g a
n A
gen
da
Ibrahim Forum 2011 | African Agriculture

57
Fro
m C
om
mit
me
nts
to
Im
ple
me
nta
tio
n:
Se
ttin
g a
n A
gen
da
east African Community – eAC
total Population 137.8 million
Youth Population (age 15 – 24) 28.2 million (20.4% of total population)
gdP (current US$) 78.7 billion
urban Population growth (annual) 4.6%
Land Area (ha) 170.2 million
Arable Land (ha) 22.7 million
Agriculture Contribution to gdP (annual) 27.8%
Agricultural Imports (% of total) 11.6%
Agricultural exports (% of total) 57.7%
Labour Force in Agriculture (% of total) 84%
Agricultural resources Cassava, cattle meat, cashew nuts, coffee, cotton, flowers, palm oil, peanuts, pyrethrum,
rice, sisal, sugar cane, tea
Country implementation of CAAdP (5/5) Signed: All
Succeeded: Tanzania
Country commitment to Maputo (1/5) Rwanda
regional agricultural policy eAC Agriculture and rural development Policy (eAC–ArdP) aims at accelerating
agricultural sector development through improving food security; accelerating irrigation
development; strengthening early warning systems and research and training; increasing
trade; and improving physical infrastructure.
The Food Security Action Plan (2011 – 2015) – February, 2011 was developed to guide
implementation of programmes emanating from the EAC Treaty to achieve food security
and rational agricultural production.
Five member states: Burundi, Kenya, Rwanda, Tanzania, Uganda.
economic Community of Central African States – eCCAS (CeeAC)
total Population 135.1 million
Youth Population (age 15 – 24) 27.4 million (20.3% of total population)
gdP (current US$) 170.3 billion
urban Population growth (annual) 3.6%
Land Area (ha) 652.3 million
Arable Land (ha) 24.1 million
Agriculture Contribution to gdP (annual) 23.7%
Agricultural Imports (% of total) 13.4%
Agricultural exports (% of total) 16.8%
Labour Force in Agriculture (% of total) 77.6%37
Agricultural resources Cacao, cattle, cassava, cocoa, coffee, corn, cotton, groundnuts, gum arabic, maize, millet,
sawmill, sorghum, palm oil, rice, rubber
Country implementation of CAAdP (2/10) Signed: Burundi, Democratic Republic of Congo
Succeeded: Angola, Congo
Country commitment to Maputo (0/10) None
regional agricultural policy Agricultural policy for Central Africa (CAP-eCCAS) and regional Programme for food
security are reference frameworks for agricultural policies and address the pillars of
CAADP. Aim to support and harmonise national agricultural policies and emphasises the
potential for production and capacity for trade in the region.
Not yet finalised.
10 member states: Angola, Burundi, Cameroon, Central African Republic, Chad, Congo, Democratic Republic of Congo, Equatorial Guinea,
Gabon, São Tomé and Príncipe.
37 Labour force participation in agriculture average calculation does not include data for Central African Republic, Congo, Democratic Republic of Congo, Equatorial Guinea and SãoTomé and Príncipe.
Ibrahim Forum 2011 | African Agriculture
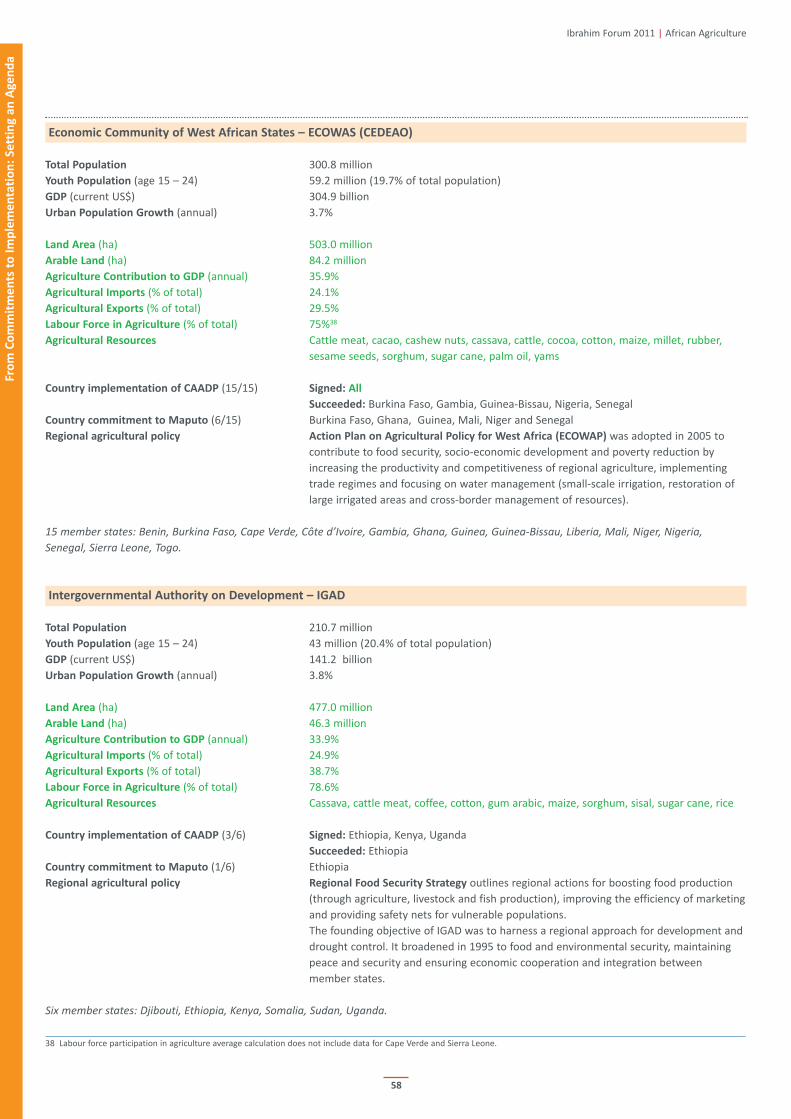
58
economic Community of West African States – eCoWAS (CedeAo)
total Population 300.8 million
Youth Population (age 15 – 24) 59.2 million (19.7% of total population)
gdP (current US$) 304.9 billion
urban Population growth (annual) 3.7%
Land Area (ha) 503.0 million
Arable Land (ha) 84.2 million
Agriculture Contribution to gdP (annual) 35.9%
Agricultural Imports (% of total) 24.1%
Agricultural exports (% of total) 29.5%
Labour Force in Agriculture (% of total) 75%38
Agricultural resources Cattle meat, cacao, cashew nuts, cassava, cattle, cocoa, cotton, maize, millet, rubber,
sesame seeds, sorghum, sugar cane, palm oil, yams
Country implementation of CAAdP (15/15) Signed: All
Succeeded: Burkina Faso, Gambia, Guinea-Bissau, Nigeria, Senegal
Country commitment to Maputo (6/15) Burkina Faso, Ghana, Guinea, Mali, Niger and Senegal
regional agricultural policy Action Plan on Agricultural Policy for West Africa (eCoWAP) was adopted in 2005 to
contribute to food security, socio-economic development and poverty reduction by
increasing the productivity and competitiveness of regional agriculture, implementing
trade regimes and focusing on water management (small-scale irrigation, restoration of
large irrigated areas and cross-border management of resources).
15 member states: Benin, Burkina Faso, Cape Verde, Côte d’Ivoire, Gambia, Ghana, Guinea, Guinea-Bissau, Liberia, Mali, Niger, Nigeria,
Senegal, Sierra Leone, Togo.
Intergovernmental Authority on development – IgAd
total Population 210.7 million
Youth Population (age 15 – 24) 43 million (20.4% of total population)
gdP (current US$) 141.2 billion
urban Population growth (annual) 3.8%
Land Area (ha) 477.0 million
Arable Land (ha) 46.3 million
Agriculture Contribution to gdP (annual) 33.9%
Agricultural Imports (% of total) 24.9%
Agricultural exports (% of total) 38.7%
Labour Force in Agriculture (% of total) 78.6%
Agricultural resources Cassava, cattle meat, coffee, cotton, gum arabic, maize, sorghum, sisal, sugar cane, rice
Country implementation of CAAdP (3/6) Signed: Ethiopia, Kenya, Uganda
Succeeded: Ethiopia
Country commitment to Maputo (1/6) Ethiopia
regional agricultural policy regional Food Security Strategy outlines regional actions for boosting food production
(through agriculture, livestock and fish production), improving the efficiency of marketing
and providing safety nets for vulnerable populations.
The founding objective of IGAD was to harness a regional approach for development and
drought control. It broadened in 1995 to food and environmental security, maintaining
peace and security and ensuring economic cooperation and integration between
member states.
Six member states: Djibouti, Ethiopia, Kenya, Somalia, Sudan, Uganda.
38 Labour force participation in agriculture average calculation does not include data for Cape Verde and Sierra Leone.
Fro
m C
om
mit
me
nts
to
Im
ple
me
nta
tio
n:
Se
ttin
g a
n A
gen
da
Ibrahim Forum 2011 | African Agriculture

59
Fro
m C
om
mit
me
nts
to
Im
ple
me
nta
tio
n:
Se
ttin
g a
n A
gen
da
Southern African development Community – SAdC
total Population 273.4 million
Youth Population (age 15 – 24) 55.5 million (20.3% of total population)
gdP (current US$) 574.8 billion
urban Population growth (annual) 3.1%
Land Area (ha) 964.6 million
Arable Land (ha) 52.9 million
Agriculture Contribution to gdP (annual) 16%
Agricultural Imports (% of total) 11.9%
Agricultural exports (% of total) 15.3%
Labour Force in Agriculture (% of total) 56.7%39
Agricultural resources Cattle meat, cotton, fruit and vegetables, maize, peanuts, soybeans, sugar cane, tea,
wheat
Country implementation of CAAdP (6/15) Signed: Democratic Republic of Congo, Malawi, Seychelles, Swaziland, Tanzania, Zambia
Succeeded: Angola, Tanzania
Country commitment to Maputo (1/15) Malawi
regional agricultural policy regional Agricultural Policy (rAP) defines common agreed objectives to support actions
in the agricultural sector at national and regional levels, in support of regional integration
and in order to contribute to the attainment of the SADC Customs Union. Intended to
implement existing declarations and frameworks of the common market. Commenced in
March 2008. Not yet finalised.
15 member states: Angola, Botswana, Democratic Republic of Congo, Lesotho, Madagascar, Malawi, Mauritius, Mozambique, Namibia,
Seychelles, South Africa, Swaziland, Tanzania, Zambia, Zimbabwe.
Arab Maghreb union – AMu (uMA) INACtIVe
total Population 87.8 million
Youth Population (age 15 – 24) 17.4 million (19.8% of total population)
gdP (current US$) 360.9 billion
urban Population growth (annual) 2.1 %
Land Area (ha) 577.4 million
Arable Land (ha) 20.5 million
Agriculture Contribution to gdP (annual) 9.2%
Agricultural Imports (% of total) 18.8%
Agricultural exports (% of total) 3.8%
Labour Force in Agriculture (% of total) 28.8%
Agricultural resources Almonds, cereals, fruits and vegetables, hides and skins, oils (olive, soybean, sunflower),
sorghum, sugar cane, vineyards, wheat
Country implementation of CAAdP (1/5) Signed: Mauritania
Succeeded: None
Country commitment to Maputo (0/5) None
regional agricultural policy None
Five member states: Algeria, Libya, Mauritania, Morocco, Tunisia.
39 Labour force participation in agriculture average calculation does not include data for Botswana, Democratic Republic of Congo and Madagascar
Ibrahim Forum 2011 | African Agriculture

60
reFereNCeS
Action Aid (2011) Smallholder-led Sustainable Agriculture, 10 June, Action Aid International Briefing. Africa Progress Panel (2011) The Transformative Power of Partnerships: Africa Progress Report 2011. Agrisud International (2010) Agro-ecology, best practice.
Bachelier, B. (2011) The G20 agricultural agenda: an opportunity for world agriculture? FARM. Baffis, J. and Haniotis, T. (2010) Placing the 2008/09 commodity price boom into perspective, World Bank Policy Research Working Paper No. 5371.Bates, B.C., Kundzewicz, Z.W., Wu, S., and Palutikof, J.P. (Eds.) (2008) Climate Change and Water, June, IPCC Technical Paper VI.Ben Yahmed, D. and Houstin, N. (Eds.) (2009) Atlas de l’Afrique, Les Éditions du Jaguar.Bertini, C. (2011) Girls Grow: A Vital Force in Rural Economies, A Girls Count Report on Adolescent Girls, The Chicago Council on Global Affairs. Blein, R., Soulé, B.G., Dupaigre, B. F. and Yérima, B. (2008) Les potentialités agricoles de l’Afrique de l’Ouest (CEDEAO), FARM.Brinkman, H. and Hendrix, C. (2011) Food Insecurity and Violent Conflict: Causes, Consequences and Addressing the Challenges, World Food Programme.CAADP (2009) How are countries measuring up to the Maputo Declaration? June, CAADP Policy Brief. Chalmin, P. (Ed.) (2011) Les Marchés Mondiaux: le printemps des peuples et la malédiction des matières premières, Economica.Cline, W. R. (2007) Global Warming and Agriculture, Impact Estimates by Country, Centre for Global Development.CoDA, AfDB, UNECA, AU (2011) Land Policy and FDI in Africa, 7 June, Policy Forum in Lisbon.Collier, P. and Dercon, S. (2009) African Agriculture in 50 years: Smallholders in a Rapidly Changing World?, Expert Meeting on How to Feed the World in 2050, FAO.Concern Worldwide, IFPRI and Welthungerhilfe (2011) Global Hunger Index, The challenge of hunger: Taming price spikes and excessive food price volatility, IFPRI.Cotula, L. (2011) Land deals in Africa: What is in the contracts?, International Institute for Environment and Development.De Schutter, O. (2010) Food Commodities Speculation and Food Price Crises: Regulation to reduce the risks of price volatility, UN Special Report on the Right to Food.Deininger, K. and Byerlee, D. (2011) Rising Global Interest in Farmland: Can it yield sustainable and equitable benefits?, Agriculture and Rural Development, The
World Bank. Deng, D. K. (2011) The New Frontier: A baseline survey of large-scale land-based investment in Southern Sudan, Norwegian People’s Aid.EIU (2010) Pocket World in Figures, 2011 Edition.FAO (2009) Foreign Investment in Developing Country Agriculture – The Emerging Role of Private Sector Finance. Foreign Commodity and Trade Policy Research
Working Paper No. 28. FAO (2009) Growing More Food Using – Using Less Water.
FAO (2009) How to Feed the World in 2050.FAO (2010) Deepening the Dialogue: Agriculture and Nutrition Collaboration to Enhance Global Food Security, Summary Report from the Open Forum held on 1
November.FAO (2010) The State of Food Insecurity in the World, Addressing food insecurity in protracted crisis.
FAO (2011) Food Outlook – Global Market Analysis.
FAO (2011) Global Food Losses and Food Waste.
FAO (2011) The State of Food and Agriculture 2010-2011 – Women in Agriculture: Closing the gender gap for development.
FAO and OECD (2011) with IFAD, IMF,OECD, UNCTAD, WFP, the World Bank, the WTO, IFPRI and the UN HLTF: Price Volatility in Food and Agricultural Markets:
Policy Responses, 2 June.FAO and UNIDO (2008) Agricultural mechanization in Africa...Time for action, Planning investment for enhanced agricultural productivity, Report of an Expert
Group Meeting, Vienna.FAO, World Bank and Natural Resources Institute (2011) Missing Food: The Case of Postharvest Grain Losses in Sub-Saharan Africa, April.Future Agricultures (2011) Land Grabbing in Africa and the New Politics of Food, June, Policy Brief 041. GRAIN (2011) Pension Funds: Key Players in the Global Farmland Grab, June. Gaufichon, L., Prioul, J.L. and Bachelier, B. (2010) What are the prospects for genetic improvement in drought-tolerant crops? FARM.Government Office for Science, London (2011) The Future of Food and Farming: Challenges and choices for global sustainability, Final Project Report.Helbling, T. and Roache, S. (2011) Rising Prices on the Menu, March, Finance and Development, Vol 48 (1), IMF.IATP (2011) Excessive Speculation in Agriculture Commodities: Selected writings from 2008-2011. IEA (2010) World Energy Outlook 2010.
IFAD (2011) Rural Poverty Report 2011.
IFAD (2011) Women and rural development, June.IFPRI (2002) Green Revolution: Curse or Blessing?
ILO (2010) Global Employment Trends for Youth: Special issue on the impact of the global economic crisis on youth, August.International Land Coalition (2011) Tirana Declaration, ‘Securing land access for the poor in times of intensified natural resources competition’, 27 May.ITU (2009) ICTs and Food Security, July (rev.). ITU-T Technology Water Report.Matondi, P. B., Havnevik, K. and Atakilte, B. (2011) Biofuels, Land Grabbing and Food Security in Africa, The Nordic Africa Institute.McKinsey Global Institute (2010) Lions on the move: the progress and potential of African economies, June.Meinzen-Dick, R. & von Braun, J. (2009) ‘Land Grabbing’ by Foreign Investors in Developing Countries: Risks and Opportunities, April, IRPRI Policy Brief 13.Molden, D. (Ed.) (2007) Water for food, Water for life: A Comprehensive Assessment of Water Management in Agriculture International Water Management Institute.Montpellier Panel Report (2010) Africa and Europe: Partnerships for Agricultural Development, April, Agriculture for Impact, Imperial College London.OECD-FAO (2011) Agricultural Outlook 2011-2020, 17 June.Ondiege, P. (2010) Mobile Banking in Africa: Taking the Bank to the People, Africa Economic Brief, December, Vol 1 (8), AfDB. ONE (2011) Agriculture Accountability: Holding Donors to their L’Aquila Promises.
Oxfam (2011) Growing a Better Future: Food justice in a resource constrained world.
Oxfam (2011) Land and Power: The growing scandal surrounding the new wave of investments in land, 22 September, Briefing Paper 151.Raisson, V. (2010) Atlas des Futurs du Monde, Robert Laffont.Starke, L. (2011) State of the World 2011: Innovations that Nourish the Planet.
Stern Review (2008) International assessment of agricultural science and technology.
The Hunger Project (2008) Factsheet: Women Farmers and Food Security.
The MDG Centre (2004) Africa’s Green Revolution: A call to action, Innovative Approaches to Meet the Hunger Millennium Development Goal in Africa, Earth Institute, Columbia University.
The Oakland Institute (2011) Special Investigation: Understanding Land Investment Deals in Africa, 20 July.UN Department of Economic and Social Affairs (2009) Trends in Sustainable Development 2008-2009, Agriculture, rural development, land, desertification and drought.UN Department of Economic and Social Affairs, Population Division, World Population Prospects: The 2010 Revision.UN Department of Economic and Social Affairs, Population Division, World Urbanization Prospects: The 2009 Revision. UNECA (2009) The Status of Food Security in Africa, October, available at: http://www.uneca.org/csd/csd6/StatusFood Security-inAfrica.pdfUNECA (2010) Assessing Regional Integration in Africa IV – ARIA IV : Enhancing Intra-African Trade, May, Addis Ababa.UNEP (2009) The Environmental Food Crisis Report: The environment’s role in averting future food crises, A UNEP Rapid Response Assessment.
Ibrahim Forum 2011 | African Agriculture
61
UNEP (2010) Africa Water Atlas, Division of Early Warning and Assessment (DEWA).
UNEP (2010) Africa Water Atlas: Improving the Quantity, Quality and Use of Africa’s Water.
UNODC (2011) World Drugs Report 2011.
USAID (2011) Achieving Nutritional Impact and Food Security through Agriculture: resources for linking agricultural food security and nutrition, Infant and Young Child Nutrition Project.
Wiggins, S. (2009) Can the Smallholder Model Delivery Poverty Reduction and Food Security for a Rapidly Growing Population in Africa? Expert Meeting on How to Feed the World in 2050, FAO.
World Bank (2010) Can Africa Trade with Africa? Yes, but…, 10 October, available at: http://go.worldbank.org/FB44RAJU90World Bank (2011) Food Price Watch, Poverty Reduction and Equity, August.World Economic Forum (2011) Water Security, The Water-Food-Energy-Climate Nexus, World Economic Forum Water Initiative.
other ArtICLeS ANd WeBSIteS
All Africa News (2010) AfDB Commits Usd 40 Million in the African Agriculture Fund, 19 May, available at: http://allafrica.com/ stories/201005191015.htmlAssociation for Progressive Communications (2010) Telecentres in Uganda do not appeal to rural women, 21 January, available at:
http://www.apc.org/en/node/9815BBC News (2004) Obesity epidemic 'out of control', 31 October, available at: http://news.bbc.co.uk/1 /hi/world/africa/3969693.stmBBC News (2010) Green Revolutions diet of big carbon savings, 14 June, available at: http://www.bbc. co.uk/news/10314458Bunge Annual Report (2010) Growing World.
Cargill Annual Report (2011) Working to Feed the World.
Chicago Markets Exchange (2011) Monthly Agricultural Review: A Global Trading Summary of Grain, Oilseed and Livestock Markets, September, available at: http://www.cmegroup.com/trading/agricultural/files/ magu.pdf
Commit4Africa: http://www.commit4africa.org/Esoko (2011) Using Esoko grain farmers in Malawi will connect to new markets for the first time, 15 May, Press Release. Famine Early Warning Systems Network: http://www.fews.net/Pages/default.aspxFANRPAN (2010) Fund to invest in improved seed production, 22 July, available at: http://www.fanrpan.org/news/7508/themes /hiv_aidsFinancial Times (2010) Agribusiness: All you can eat, 18 May.Forbes (2011) The World’s Biggest Public Companies, Special Report, April.The Independent (2006) EU subsidies deny Africa's farmers of their livelihood, May.Jeune Afrique (2011) Ou Va l’Agriculture Africaine, September, Dossier spécial, No. 2646.Making It (2011) Agribusiness: Africa’s way out of poverty, 15 June, available at: http://www.makingitmagazine.net/?p=3464Maplecroft (2010) Key economies of Australia, India, China and USA at ‘high risk’ from water stress, 11 November, Maplecroft News, available at:
http://maplecroft.com/about/news/water-stress.html NEPAD, Comprehensive Africa Agriculture Development Programme (CAADP): http://www.nepad-caadp.net/Nestle Annual Report (2010).Private Equity Africa (2011) Phatisa gets $100m from OPIC, 1 July, available at: http://www.privateequityafrica.com/ funds/phatisa-gets-100m-from-opic/Share4Dev (2008) Telecentre: knowledge sharing in rural Africa, June, available at: http://www.share4dev.info/ kb/documents/4344.pdfSpore (2011) Agricultural mechanisation: energy of hope, December 2010/January No. 150.Spore (2011) Modernising farms: paths to success, August/September Special Issue No. 154.The Africa Report (2011) Top 500 African Companies, February, Issue No. 27.The Economist (2011) A Special Report on Feeding the World, 24 February.The Independent (2008) Malawi's farming revolution sets the pace in Africa, 5 May.Thompson Reuters Foundation (2011) Climate Conversations - Enticing Africa’s youth to agriculture, 7 October, available at:
http://www.trust.org/alertnet/blogs/climate-conversations/enticing-africas-youth-to-agriculture/Water Footprint Network: www.waterfootprint.orgWorldCrops (2011) Fertiliser prices nearing 2008 levels, 28 June, available at: http://www.worldcrops.com/6009-worldcrops-fertiliser-prices-nearing-2008-levels/
dAtABASeS
Bloomberg: www.bloomberg.com CIA – World Factbook: https://www.cia.gov/library/publications/the-world-factbook/EIU – Country Data: http://eiu.com FAO – AQUASTAT: http://www.fao.org/nr/water/aquastat/data/query/index.htmlFAO Statistical Yearbook 2010: http://www.fao.org/economic/ess/ess-publications/ess-yearbook/ess-yearbook2010/en/FAOSTAT: http://faostat.fao.org/ILO – Key Indicators of the Labour Market (KILM) http://kilm.ilo.org/KILMnet/IFPRI – SPEED: http://www.ifpri.org/book-39/ourwork/programs/priorities-public-investment/speed-databaseIMF (for commodity prices): http://www.imf.org/external/np/res/commod/index.aspxOECD.stat – OECD DAC Creditor Reporting: http://stats.oecd.org/Index.aspxWB – WDI: http://databank.worldbank.org/ddp/home.do?Step=12&id=4&CNO=2Yahoo Finance: http://uk.finance.yahoo.com/
teChNICAL NoteS For reC FACtCArdS
Data expressed as the combined total for member states within a Regional Economic Community (population, land area, arable land, GDP, agricultural resources)or the average (urban population growth, agricultural contribution to GDP, imports, exports, labour force in agriculture).Land area, population and urbanisation data refer to 2010. No data for South Sudan. GDP data in current US$ refer to 2010, except for Djibouti and Libya whichrefer to 2009. No data for Somalia and South Sudan. Source: World Bank, World Development IndicatorsYouth population data refer to 2010. No data for Djibouti, São Tomé and Príncipe, Seychelles and South Sudan. Source: International Labour Organisation, KeyIndicators of the Labour Market (KILM) database.Agriculture output data refer to 2010. No data for South Sudan. Source: EIU Country Data Tool; CIA World Factbook.Arable land and agriculture import and export data refer to 2008. No data for Djibouti and South Sudan. Source: FAO Statistical Yearbook 2010Labour force participation in agriculture data are for the latest available year which varies for each country. No data for Benin, Botswana, Cape Verde, CentralAfrican Republic, Democratic Republic of Congo, Congo, Djibouti, Equatorial Guinea, Madagascar, São Tomé and Príncipe, Sierra Leone and South Sudan. Source:CIA World Factbook.Agricultural resources data are from 2010 or the latest available year. Source: Atlas de l’Afrique, Les Éditions du Jaguar; FAOSTATRespective REC websites and ARIA IV, 2010, were also used.
Ibrahim Forum 2011 | African Agriculture

62
ACroNYMSAAAF Actis Africa Agribusiness FundAAC African Agricultural Capital ACP African, Caribbean and Pacific Group of StatesADF African Development FundAFCAS African Commission on Agricultural StatisticsAfDB African Development Bank AGRA Alliance for a Green Revolution in Africa AMU Arab Maghreb UnionASARECA Association for Strengthening Agricultural Research in Eastern and Central Africa ASIF African Seed Investment FundAU African UnionAWARD African Women in Agricultural Research and DevelopmentCAADP Comprehensive Africa Agriculture Development ProgrammeCAP Common Agricultural PolicyCEN-SAD Community of Sahel-Saharan StatesCGIAR Consultative Group on International Agricultural Research CIA Central Intelligence AgencyDAC Development Assistance CommitteeDEWA Division of Early Warning Assessment DFID Department for International DevelopmentEAC East African CommunityEAFF Eastern Africa Farmers’ FederationEC European Commission ECCAS Economic Community of Central African StatesECOWAS Economic Community of West African StatesEIU Economist Intelligence UnitEPA Economic Partnership AgreementEU European UnionFAO Food and Agriculture OrganizationFARA Forum for Agricultural Research in AfricaFANRPAN Food Agriculture and Natural Resources Policy Analysis NetworkG8 Group of Eight (Canada, France, Germany, Italy, Japan, Russia, UK, USA)G20 Group of Twenty (Argentina, Australia, Brazil, Canada, China, EU, France, Germany, India, Indonesia, Italy, Japan, Mexico, Russia, South
Africa, South Korea, Saudi Arabia, Turkey, UK, USA)GCARD Global Conferences on Agricultural Research for DevelopmentIATP Institute for Agriculture and Trade Policy ICT Information and communication technologyIDA International Development AssociationIFAD International Fund for Agricultural Development IFPRI International Food Policy Research Institute IIED International Institute for Environment and DevelopmentILO International Labour OrganizationIMF International Monetary Fund IPCC Intergovernmental Panel on Climate ChangeITU International Telecommunication Union NEPAD New Partnership for Africa's Development OECD Organisation for Economic Co-operation and Development PAFFO Pan-African Farmers’ ForumPROPAC Plateforme Régionale des Organisations Paysannes d’Afrique CentraleREC Regional Economic CommunityROPPA Réseau des Organisations Paysannes et de Producteurs de l’Afrique de l’OuestRUFORUM Regional Universities Forum for Capacity Building in AgricultureSACAU Southern African Confederation of Agricultural UnionsSACP Southern African Cotton Producers AssociationSADC Southern African Development CommunitySADC-FANR Southern African Development Community – Food, Agriculture and Natural ResourcesSPEED Statistics of Public Expenditure for Economic DevelopmentUMAGRI Union Maghrébine des AgriculteursUN United NationsUNCTAD United Nations Conference on Trade and DevelopmentUNDP United Nations Development ProgrammeUNECA United Nations Economic Commission for AfricaUNEP United Nations Environment Programme UNFPA United Nations Population FundUNHLTF United Nations High Level Task ForceUNiBRAIN Universities, Business and Research in Agricultural Innovation UNIDO United Nations Industrial Development OrganizationUNODC United Nations Office on Drugs and CrimeUSAID United States Agency for International Development WAAIF West African Agricultural Investment FundWEF World Economic Forum WECARD West and Central African Council for Agricultural Research and Development WFP World Food ProgrammeWDI World Development IndicatorsWHO World Health OrganizationWTO World Trade Organization
Ibrahim Forum 2011 | African Agriculture

63
Ibrahim Forum 2011 | African Agriculture

64
Ibrahim Forum 2011 | African Agriculture

Food For thought
one in seven people are hungry in the world
12 of the 20 highest commodity price increases since 2000 are agricultural commodities
Small or micro-scale farming is the primary source of livelihood for over ⅔ of Africans
60 million hectares of land was purchased or leased to foreign entities in Africa in 2009
80% of smallholders in Africa own less than two hectares of land
Small-scale farmers contribute over 90% of Africa’s agricultural production
the cost of fertilisers rose 40% on average in the past year
half of Africa's population will be living in cities by 2030
one in five of the world’s young people will be African in 2040
70% of Africa’s youth live in rural areas
18 African cities could have a combined spending power of $1.3 trillion by 2030
Less than 5% of oeCd donor aid has been allocated to agriculture since 2002
Youth make up 60% of all employment in African agriculture
More than 90% of African land remains outside the formal legal system
Sub-Saharan Africa’s post-harvest grain losses could total $4 billion a year
Women represent over 50% of the agricultural labour force in sub-Saharan Africa
In sub-Saharan Africa 25% of food cereal harvests are lost post-harvest
Somalia has the 12th highest cardiovascular disease deaths in the world and consumes
more meat and dairy than the global average
top 20 African agribusinesses have a combined turnover of $21.6 billion, equal to the gdP
of Cameroon
the African food import bill rose from $20 billion to over $33 billion between 2001 and
2006
250 times more investment in commodity index funds between 2003 and 2008
european Common Agricultural Policy uses 40% of european Commission budget
13 African countries are consuming more meat than the global average
16 of the world’s fastest growing cities in the next 15 years will be African
Africa will have the largest working age population in the world by 2040
over ⅔ of African countries are net importers of agricultural products
Africa imports approximately 28% of its calorie requirements
there are over 925 million hungry people in the world
249% increase in average daily volume for Corn Calendar Swaps since 2010
the value of post grain losses in sub-Saharan Africa is equivalent to the value of annual
cereal imports in the region
Less than ¼ of L’Aquila commitments have been met
African trade tariffs are the highest in the world and 50% higher on average than
comparable tariffs in Latin America and Asia
China and Brazil spend $1.8 billion and $1.1 billion respectively per year on agricultural
research

re
gio
na
l e
con
om
ic C
om
mu
nit
ies
– F
act
Ca
rds