2011 default report - lane clark & peacock
TRANSCRIPT

NOT FOR REDISTRIBUTION
Index Partner 2011 Industry Partner
2011 Default Report
Turning the Lights On
INCO
MPLETE
CHALL
ENGED FAIR
GOOD
CHALLENGED
INCOM
PLETE FAIR
CHALLENGED
INCOM
PLETE FAIR
GOODGOOD
CHALLENGED
INCOM
PLETE FAIR
GOOD
Benchmarking the effectiveness of Default Strategies
More information inside.
Introducing The Vault Rating

DCISIONS | 2011 DEFAULT REPORT
32
ContentsThank you to all the schemes who have joined ourdata community. These include:
3
2011 Category Leaders 04
Foreword by Paul Thornton 07
Foreword by Mark Ashworth 08
Foreword by Tim Banks 09
Introduction 10
Continued Growth in the DCisions Community 12
UK and US Compared 13
Attitude and Reliance on Default 15
Asset Allocation 16
Growth Phase 16
De-Risking 19
At Retirement 20
Objective Setting and Responsibility 21
Consultant Satisfaction 25
Engagement 26
Range of Choice 27
Contribution Levels 28
Closing Observation – A Checklist to Consider 29
The Vault Scorecard 30
AllianceBernstein – Helping you make the most of DC 32
About DCisions 33
Terms and Conditions of Use 34
To be involved in the next cycle of the DCisionsDefault Report, see contact details on page 33 orvisit: www.dcisions.com/vault
Aberdeen AssetManagementAegon UKAetna AgustaWestlandAkzo NobelAlliance BootsAlliance & LeicesterAllianz InsuranceAtkins UKBaker TillyB&CEBarclaysBayerBlackRockBNY MellonBOCBank of AmericaMerrill LynchBUPACable & Wireless Cemex
CentricaChurch of EnglandColt TechnologiesCombined NuclearPension Plan CSCDeloitteDHL Dow CorningDuPont ExperianFidelity NationalFinancialFirstEnergy FiservHachetteHendersonsHiscoxHome Retail GroupHewlett PackardHSBCIBM
IntercontinentalHotels JIB Pension Scheme John Lewis KBRKeyCorpKingfisherKuehne+NagelLegal & GeneralL-3 CommunicationsLane, Clark andPeacockLV=Marks & SpencerMission SupportAllianceMotorolaMouchelNATSNetwork Rail NEXTNordstrom
NovartisOracleOrangePearsonPwCBritish RailRSASainsbury'sSantanderSchrodersSociete GeneraleSomerfieldTelegraphThomas MillerTUI (First Choice)UnileverUnisysUnited UtilitiesVodafoneWincantonXerox
5
DCISIONS | 2011 DEFAULT REPORT
4
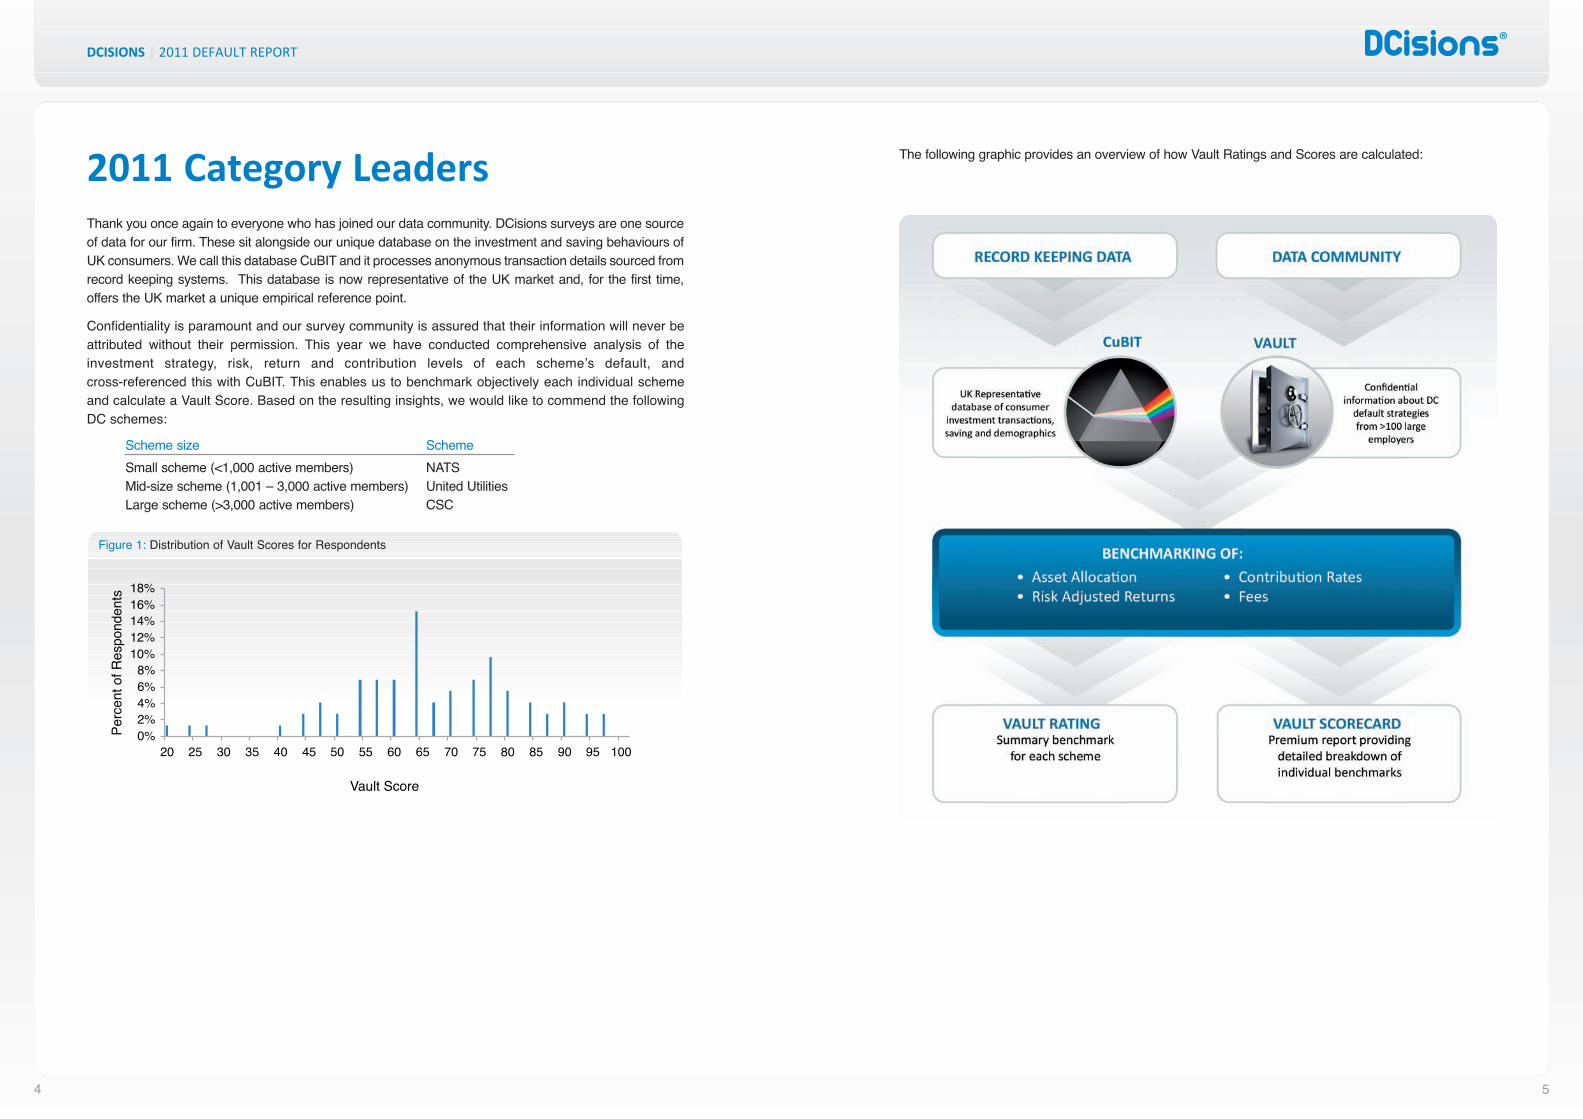
2011 Category LeadersThank you once again to everyone who has joined our data community. DCisions surveys are one sourceof data for our firm. These sit alongside our unique database on the investment and saving behaviours ofUK consumers. We call this database CuBIT and it processes anonymous transaction details sourced fromrecord keeping systems. This database is now representative of the UK market and, for the first time,offers the UK market a unique empirical reference point.
Confidentiality is paramount and our survey community is assured that their information will never beattributed without their permission. This year we have conducted comprehensive analysis of theinvestment strategy, risk, return and contribution levels of each scheme’s default, and cross-referenced this with CuBIT. This enables us to benchmark objectively each individual schemeand calculate a Vault Score. Based on the resulting insights, we would like to commend the followingDC schemes:
Scheme size SchemeSmall scheme (<1,000 active members) NATSMid-size scheme (1,001 – 3,000 active members) United UtilitiesLarge scheme (>3,000 active members) CSC
Perc
ento
fRes
pond
ents
0%2%4%6%8%
10%12%14%16%18%
20 25 30 35 40 45 50 55 60 65 70 75 80 85 90 95 100
Vault Score
Figure 1: Distribution of Vault Scores for Respondents
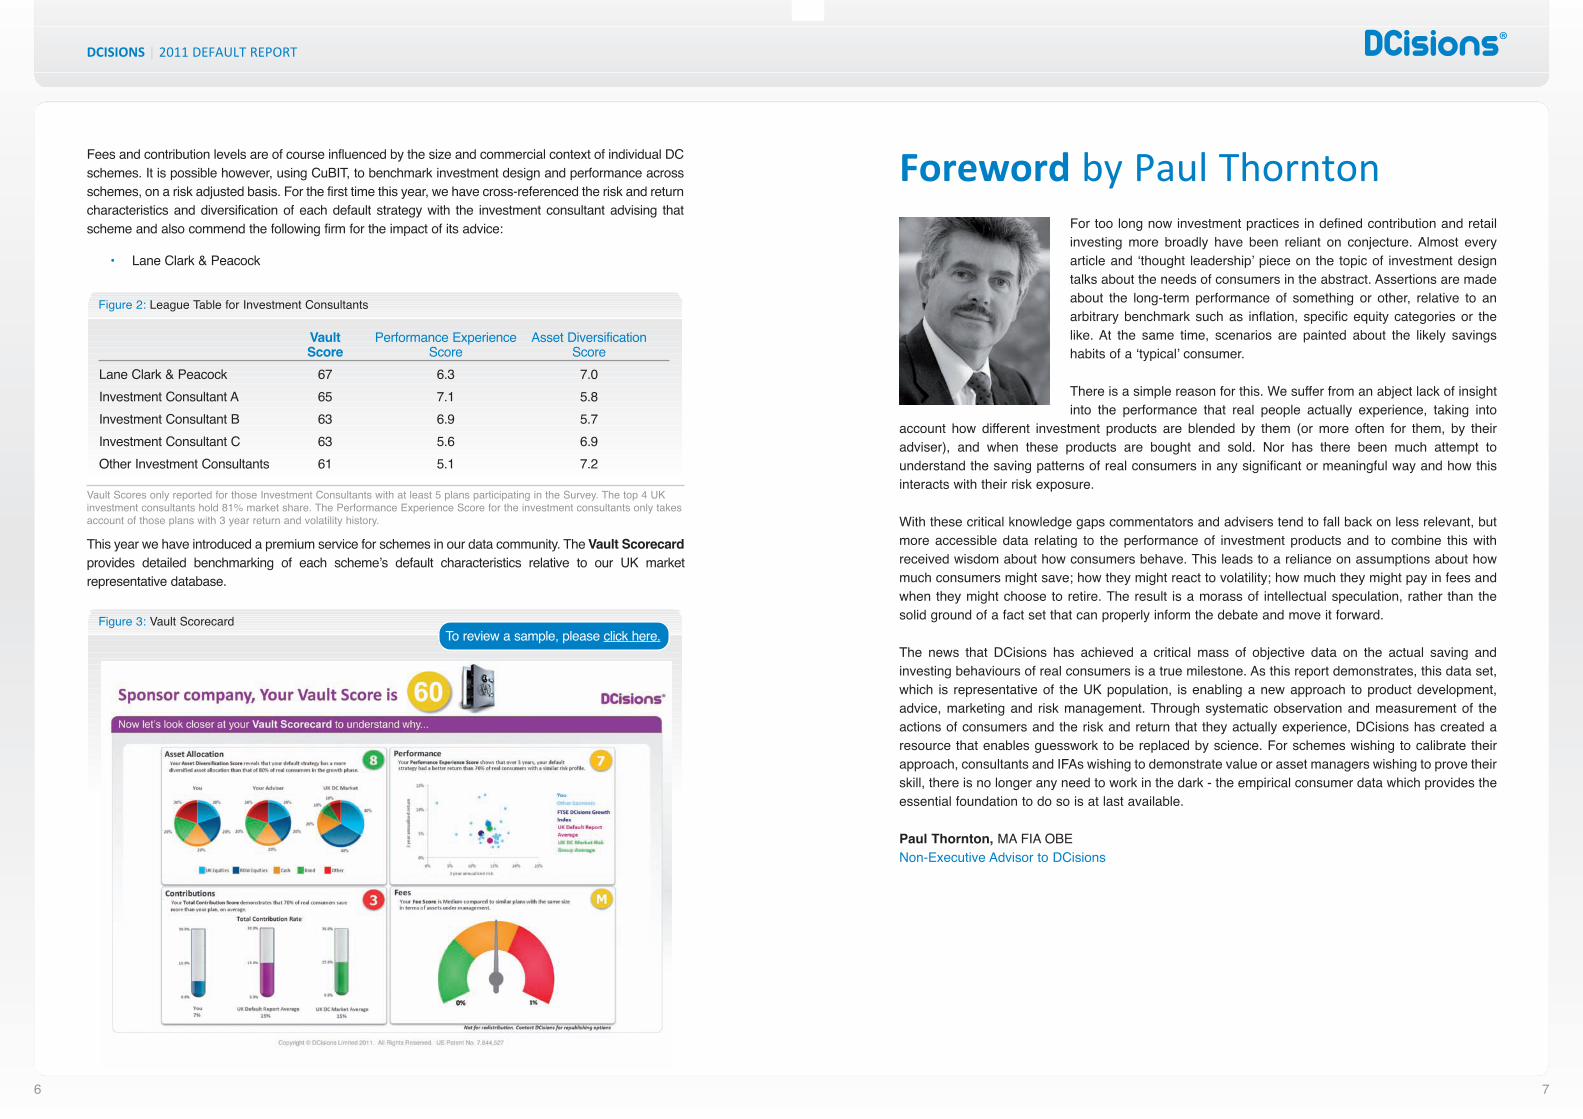
The following graphic provides an overview of how Vault Ratings and Scores are calculated:
DCISIONS | 2011 DEFAULT REPORT
76
Foreword by Paul ThorntonFor too long now investment practices in defined contribution and retailinvesting more broadly have been reliant on conjecture. Almost everyarticle and ‘thought leadership’ piece on the topic of investment designtalks about the needs of consumers in the abstract. Assertions are madeabout the long-term performance of something or other, relative to anarbitrary benchmark such as inflation, specific equity categories or thelike. At the same time, scenarios are painted about the likely savingshabits of a ‘typical’ consumer.
There is a simple reason for this. We suffer from an abject lack of insightinto the performance that real people actually experience, taking into
account how different investment products are blended by them (or more often for them, by theiradviser), and when these products are bought and sold. Nor has there been much attempt tounderstand the saving patterns of real consumers in any significant or meaningful way and how thisinteracts with their risk exposure.
With these critical knowledge gaps commentators and advisers tend to fall back on less relevant, butmore accessible data relating to the performance of investment products and to combine this withreceived wisdom about how consumers behave. This leads to a reliance on assumptions about howmuch consumers might save; how they might react to volatility; how much they might pay in fees andwhen they might choose to retire. The result is a morass of intellectual speculation, rather than thesolid ground of a fact set that can properly inform the debate and move it forward.
The news that DCisions has achieved a critical mass of objective data on the actual saving andinvesting behaviours of real consumers is a true milestone. As this report demonstrates, this data set,which is representative of the UK population, is enabling a new approach to product development,advice, marketing and risk management. Through systematic observation and measurement of theactions of consumers and the risk and return that they actually experience, DCisions has created aresource that enables guesswork to be replaced by science. For schemes wishing to calibrate theirapproach, consultants and IFAs wishing to demonstrate value or asset managers wishing to prove theirskill, there is no longer any need to work in the dark - the empirical consumer data which provides theessential foundation to do so is at last available.
Paul Thornton, MA FIA OBENon-Executive Advisor to DCisions
Fees and contribution levels are of course influenced by the size and commercial context of individual DCschemes. It is possible however, using CuBIT, to benchmark investment design and performance acrossschemes, on a risk adjusted basis. For the first time this year, we have cross-referenced the risk and returncharacteristics and diversification of each default strategy with the investment consultant advising thatscheme and also commend the following firm for the impact of its advice:
• Lane Clark & Peacock
This year we have introduced a premium service for schemes in our data community. The Vault Scorecardprovides detailed benchmarking of each scheme’s default characteristics relative to our UK marketrepresentative database.
Figure 2: League Table for Investment Consultants
Vault Scores only reported for those Investment Consultants with at least 5 plans participating in the Survey. The top 4 UKinvestment consultants hold 81% market share. The Performance Experience Score for the investment consultants only takesaccount of those plans with 3 year return and volatility history.
Vault Performance Experience Asset DiversificationScore Score Score
Lane Clark & Peacock 67 6.3 7.0Investment Consultant A 65 7.1 5.8Investment Consultant B 63 6.9 5.7Investment Consultant C 63 5.6 6.9Other Investment Consultants 61 5.1 7.2
Figure 3: Vault ScorecardTo review a sample, please click here.
DCISIONS | 2011 DEFAULT REPORT
8
Foreword by Tim BanksDCisions would like to thank Alliance Bernstein for sponsoringthe 2011 DCisions Default Report.
At Alliance Bernstein, we recognise the importance of this report and thedebate it seeks to promote, in ensuring that DC members get the bestpossible outcome from the savings they make. As the report shows, theoutcome will be to a large extent a function of the success of each DC plan’sdefault fund, to generate superior age-appropriate risk-adjusted returns.
It appears to us that the world of investment design is ready to move on, toadopt more innovative structures, combining the best features from aroundthe globe into default investment funds. Furthermore, it needs to reflect the
changing retirement landscape, including the ending of the default retirement age and the fact that flexibleretirement is becoming more prevalent. Against that background, we believe the traditional method oflifestyling appears too inflexible and end-point sensitive to cope.
With the adoption of the target date structure by NEST we are seeing increased interest in intelligentflexible solutions that can accommodate these changes and be easily and cheaply adapted through time.
Flexible target date solutions combine simplicity for members with the investment complexity necessary toachieve superior member outcomes. A majority of members will naturally look to the trustees or plansponsor to provide the investment expertise they so clearly lack. A one-fund-for-life approach deliveredthrough a target date fund is a simple concept for members to understand, allowing all of the investmentsophistication to go on ‘under the bonnet’ from the member’s perspective.
From a governance perspective, trustees and plan sponsors need to understand the member’s journeythrough time. A target date approach enables this, the performance of each target date fund being thereturn their members actually experience.
In our view, the best default funds will need to incorporate diversification and dynamism, and an ability tochange seamlessly through time.
Diversification should not be limited to the various asset classes but should extend to the fund managersused for each of those asset classes. As managers come in and out of favour, the ability to seamlesslychange individual components of the default and incorporate the best investment ideas is important.
Similarly, no longer is a static asset allocation through time an appropriate solution. Volatile markets meanthat a static glide path can lead to the misalignment of portfolio risk with members’ risk capacity. We believethat funds should be dynamically managed on an age appropriate basis to smooth the journey formembers through time, to ensure that they do not overreact to short term fluctuations.
Finally we welcome the DWP and TPR consultation on governance, believing that very few plan sponsorsand trustees understand that they are the ‘asset allocation’ manager, directly affecting member outcomes.A clarification of the roles and responsibilities will benefit all in delivering the next generation of solutions.
Tim BanksHead of Sales and Client Relations Alliance Bernstein, Defined Contribution InvestmentsSee p.32 for further details
9
Foreword by Mark AshworthThis report is a valuable factual resource for those responsible for thedesign and operation of DC schemes. It is also a valuable prompt forthought and debate.
There are no easy answers for DC investors (be they members, or schemedesigners). This reflects two key facts. First, most members are probablycontributing too little to be able to look forward to an adequate pension withthe degree of confidence which they would like. Secondly, availableinvestment strategies appear to veer between low risk and low return andhigh risk with (only) possibly high return. These observations are clearlyrelated. A safe strategy allied with low contributions implies confident penury
in old age. Whilst a risky strategy coupled with low contributions implies a very uncertain, and quitepossibly penurious future.
Faced with these stark and unpalatable choices, we are seeking a third way which combines acceptablerisk with adequate returns. Hence the increased interest in and adoption of diversified growth strategiesand target date funds. The middle way, of acceptable risk and acceptable returns, may exist. We mustcertainly continue to seek it, and to refine our investment thinking and products. This is a vital and jointchallenge for all concerned. However, my personal hunch, and fear, is that there is only so much that canbe achieved by investment strategy alone. I suspect that, unless we couple our new investmentapproaches, as revealed in this report, with greater contributions than are reported in this report, we willnot find a robust and viable answer to the need which nearly all DC members share of planning for acomfortable retirement, with confidence.
I recognise how unpalatable it is for most, and that it is impossible for many, to increase their contributions.However, there are steps which can be taken to increase contribution levels. The insight of behaviouralfinance can be helpful here, as well as in designing investments strategy. An example is the “save moretomorrow” approach which takes advantage of the human willingness - as attested by St Augustine – tobe good in the future even though we live today as if the future will never arrive.
I would like to end with a personal suggestion, and plea. It would be enormously helpful if DC memberscould purchase a (possibly limited) amount of pension which would be certain (or as near to certain as canbe achieved). If built up year by year, this could provide a firm (and very low risk) basis on which to planfor retirement. These foundation stones used to be called deferred annuities. I would encourageinvestment professionals, as well as the Government, to respond to this challenge. We all need to give ourDC members, and fellow citizens, the tools. Then they can finish the job.
Mark AshworthPensions Director, Law Debenture

11
The market turmoil of recent years threw into sharp relief some of these issues and it is perhaps worrying thatas markets stabilise, the data reveals attitudes have changed significantly, with fewer than 40pc of plansintending to review their default strategy or reduce its equity exposure this year, down from 54pc in 2010.
DCISIONS | 2011 DEFAULT REPORT
10
1
2
3
IntroductionWe believe that the DC market is in need of some illumination.There are three reasons why DCisions data is making an important contribution to the efficiency ofworkplace savings arrangements:
There is no single right answer when it comes to investing someone else’s money. Asset allocation decisions in default strategies require calibration to give them context.The source of advice on default design is arguably the most significant driver of theoutcome. Traditional fund manager analysis is inadequate.A robust understanding of risk is needed in order to make sense of return figures. Anempirical data set reflecting both the risk and the return delivered to consumers isessential to inform ongoing governance and risk management.
The game is changing and it is no longer acceptable simply to ensure that a DC default strategy hits itsbenchmark. Consumers largely do not care about benchmarks, they care about outcomes and as DCschemes mature, consumers will increasingly scrutinise the quality of investment stewardship from theiremployer. Missing a well-devised investment objective could prove substantially superior to hitting a plainvanilla index target, in terms of the ultimate value delivered to consumers. In short, the days of hidingbehind simple benchmarks are numbered.
Figuring out what asset allocation approach best fits the needs of employees, setting a well-consideredobjective that drives the right asset allocation behaviour, and assigning responsibility for this assetallocation are vital. This report shows that the nature of objective setting is changing and that the choice(conscious or not) about who holds primary responsibility for asset allocation is critical.In short, this report should help to turn on the lights.
Data Partner Benefits
Data partners are entitled to FTSE DCisions index privileges,without charge. To learn more and to gain access please visit
www.dcisions.com/vault
Figure 4: Distribution of UK Plans Considering Changing Their Default Strategy
2010 2011
18%
36%
46%
15%
24%61%
n Intend to reduce equityn Intend to review strategyn Do not intend to change
strategy

DCISIONS | 2011 DEFAULT REPORT
1312
Continued Growth in theDCisions CommunityThe average headcount of the UK DC plans in this year’s Report is 9,200 employees, across a totalof 103 plans, representing collective assets of £17 billion. The underlying community of DC schemeshas more than tripled since 2007:
This year we have added insights from our US data set to provide the additional benefit of cross-market comparison. The average headcount of the US DC plans is 28,000 employees, across a total of 75 plans. This is a very small number of plans relative to the US as a whole however itprovides insight into developments in some of the largest DC schemes in one of the world’s mostadvanced markets.
Figure 6: 3-Year Risk and Return Outcome (Growth Phase*)
Figure 5: UK Survey Composition
328,000460,000 495,000
630,000
950,000
2007 2008 2009 2010 2011Number of plans 31 43 45 62 103Assets under 6.8 6.9 8.3 10.7 17.2management (£M)
n Plan Members
UK and US ComparedWhile the data is sourced primarily from large plans, some interesting differences emerge with respectto the concentration in the market for different services.
There is considerable scope for more competition andefficiency in the UK market
The US exhibits greater diversity in the array of consultants and asset managersand more consolidation in record keeping services. The larger asset pool in the USarguably has driven a more competitive market for investment management andadvice, and greater economies of scale in record keeping. The proportion of whitelabeled solutions in the UK is also significantly higher. The UK workplace pensions
market is already struggling to deliver services profitably and this trend runs the risk of adding furthercost and complexity. Trustees and employers must satisfy themselves that blending and white labelingadds value. The IMA’s case studies on these issues and other potential conflicts of interest are a usefulreference point: http://www.investmentuk.org/assets/files/press/2008/ConflictsCaseStudies.pdf
UK figures based on GBP returns. US figures based on USD returns.
*Growth Phase represents investment outcomes for members at least 15 years from retirement.
UK US

15
DCISIONS | 2011 DEFAULT REPORT
14
Attitude and Reliance on DefaultDefault solutions are perceived favourably by themajority of schemes
The perceived risk from reliance on default solutions continues to declinesignificantly, while the level of investment decision making has remained lowover the last five years. Where schemes do perceive a risk, they tend to exhibita relatively higher default rate.
Figure 7: Market Concentration for Top 3 Players
* Concentration by number of plans** Concentration by assets under management
Figure 8: Proportion of Customised Solutions
Figures include solutions that are bespoke by the investment consultant and white-labeled by the platform provider.
71%
n UK n USInvestment Consultant* Investment Managers** Record Keepers*
38%
74%
51%35%
59%
29%
13%
44%
30%
n UK n US2010 2011 2007 2008 2009 2010 2011
82%81%80%79%78%77%76%75%74%
80%79%
81%
78%79%
Figure 9: Average UK Default Rates
Figure 10: UK Perception of Risk Associated with Reliance on Default Solutions
Figure 11: UK Default Rates by Risk Perception
n Perceived Risk n No Perceived Risk
60%2009 40%
55%2010 45%
41%2011 59%
87%76%
Perceived Risk No Perceived Risk

DCISIONS | 2011 DEFAULT REPORT
1716
Figure 13: 3-Year Risk and Return Outcome for UK Investment Consultants as at December 2010 (Growth Phase*)Asset Allocation
PART I | GROWTH PHASE
Adviser selection has a significant influence on asset allocation
Asset allocations remain heavily tilted towards equities during the growthphase, with an average total equity allocation in excess of 80pc. The USexhibits a much higher degree of home bias with more than two thirds of thetotal equity position allocated to the domestic market. Asset allocations
continue to vary widely depending on which investment consultant is selected, leading to significantvariations in the risk and return experienced by employees across DC plans.
While three years is a limited period to observe performance, many of the solutions implemented donot have longer track records. It will be important to see how performance evolves as further timepasses; however the following three year observations do offer valuable insight into the different levelsof risk exposure across workplace schemes.
Figure 12: Average Asset Allocation for the UK Market, UK Default and US Default as at December 2010(Growth Phase*)
UK DC Market (CuBIT) UK Default US Default
59%
n Cashn Bondsn Domestic
Equitiesn International
Equitiesn Property,
Commoditiesand Alternative Assets
12%24%
43%
7%
43%57%
8%29%
4%1%
4%3%
4%2%
0%0%
5.0%4.5%4.0%3.5%3.0%2.5%2.0%1.5%1.0%0.5%0.0%
14.0% 15.0% 16.0% 17.0% 18.0% 19.0% 20.0% 21.0% 22.0%
3-year annualised volatility (risk)
3-ye
aran
nuali
sed
retu
rn
UK Default AverageCuBITFTSE DCisions Growth IndexConsultant 1Consultant 2Consultant 3Consultant 4Other Investment ConsultantsNo Consultant Influential
Figures reported for those UK respondents who cited a specific investment consultant as being influential in the design of theirdefault solution. Investment consultants with less than 5 plans in the sample have been aggregated into ‘Other InvestmentConsultants’. Figures based on GBP returns.
*At least 15 years from retirement.
Figure 13a: Consultant 1 Asset Allocation: Figure 13b: Consultant 3 Asset Allocation:
Asset allocation applies only to those plans with 3 year return and volatility history.
Consultant 1 Consultant 3
n Cashn Bondsn Domestic
Equitiesn International
Equitiesn Property,
Commoditiesand Alternative Assets
49%
5%6%
40%51% 46%
1%1%1%
*At least 15 years from retirement.

DCISIONS | 2011 DEFAULT REPORT
1918
Figure 16: Distribution of Plans Using Target Date Solutions
Figure 17: Average Number of De-risking Years in UK Default Strategies
PART II | DE-RISKING
The US has shown rapid adoption of target dateapproaches while the UK continues to rely heavily onlifestyling
In the UK, operationally intensive ‘lifestyling’ remains the most commonapproach to managing the glide path towards retirement, with a typical de-risking period of 8 years. In contrast, in the US market, the vast majority of
approaches are target date where the asset manager adjusts asset allocation over 40 years ormore. Many believe that with NEST typically adopting a target date approach this concept willbecome more common. Schemes must satisfy themselves that regardless of the glide pathmechanism the period and flexibility of the de-risking process is appropriate and cost effective. Thisis a critical asset allocation decision.
n Target Date Solution n Not Target Date Solution
96%UK
US 94%
4%
6%
8.0 7.9
2010 2011
Figure 15: Asset Allocation for Plans Who Perceive Their Investment Consultant as Influential versus Plans Who Do Not Perceive Their Investment Consultant as Influential as at December 2010
n Cashn Bondsn Domestic
Equitiesn International
Equitiesn Property,
Commoditiesand Alternative Assets
UK US
10%
41%
36%5%
8%
2%
4%7%
43%
44%
14%
56%
25%
5% 4%
1%
12%
59%
24%
1.4%
1.2%
1.0%
0.8%
0.6%
0.4%
0.2%
0.0%20.0% 20.5% 21.0% 21.5% 22.0% 22.5% 23.0% 23.5% 24.0%
3-year annualised volatility (risk)
3-ye
aran
nuali
sed
retu
rn US Default AverageConsultant XConsultant YConsultant ZOther Investment ConsultantsNo Consultant Influential
Figures reported for those US respondents who cited a specific investment consultant as being influential in the design of theirdefault solution. Figures based on USD returns.
Figure 14a: Consultant Z Asset Allocation Figure 14b: Consultant X Asset Allocation
Asset allocation applies only to those plans with 3 year return and volatility history.
n Cashn Bondsn Domestic
Equitiesn International
Equitiesn Property,
Commoditiesand Alternative Assets
53%57%
14%6%
22% 26%8%
12%
1% 1%
Consultant Z Consultant X
Figure 14: 3-Year Risk and Return Outcome for US Investment Consultants as at December 2010 (Growth Phase)
Investment Consultant
not influential
InvestmentConsultantinfluential
Investment Consultant
not influential
InvestmentConsultantinfluential

21
DCISIONS | 2011 DEFAULT REPORT
20
Figure 20: Distribution of Investment Objectives
n Target Date n Target Return n Track Index n Other
20%UK
US
62% 14%
94%
4%
2%4%
PART III | AT RETIREMENT
Level annuity purchase remains most common
In the UK, the most common at retirement objective is purchase of a levelannuity, accounting for 50pc of plans. 25pc of plans target purchase of aninflation-linked annuity. With legislative changes leading to less annuitisation inthe future it is essential that those tasked with steering DC plans ensure thatthe ‘end game’ of their default strategy is appropriate both in terms of timing theretirement event accurately and the asset allocation at that point in time.
%0%3%0%0%4%0%0%3%0%0%0%1%0%0%0%0%0%0%0%0%0%0%0%0%1%0%0%1%0%0%0%
Figure 18: Distribution of Retirement Allocation Objective
UK 50% 25%
n Level Annuity n Index-Linked Annuity n Other Retirement Objective
25%
0%0%3%0%0%4%0%0%3%0%0%0%1%0%0%0%0%0%0%0%0%0%0%0%0%1%0%0%1%0%0%0%
Figure 19: Average Target Retirement Asset Allocation in UK Default Strategies by Retirement Allocation Objective
Level Annuity Index-Linked Annuity Other Retirement Objective
n Cash n Conventional Gilts n Index-Linked Gilts n Corporate Bonds
43%
25%
17%
25%
44%
24%
7%28%
36%
19%
17%
Objective Setting andResponsibility
The question of whether to empower consultants orasset managers with responsibility for asset allocationis growing in importance
The approach to objective setting in the UK is markedly different from the US.More than 60pc of UK plans target asset class benchmarks and employpassive strategies, virtually guaranteeing that they will achieve their objective.In contrast more than 90pc of the observed US plans follow a target date
strategy and it is far more common for responsibility for asset allocation to be delegated to the fundmanager. Evidence from the UK shows that where responsibility is delegated to fund managers, thelevel of diversification tends to be higher, with a beneficial impact on the risk return balance.Analysis conducted by DCisions on behalf of NEST, using data insights from CuBIT hasdemonstrated that increased volatility is associated with consumers reducing or ceasing to makecontributions. It is important to challenge the theoretical argument that long term returns frompure equity strategies are superior, and ensure that projections of benefit accumulation also takeaccount of the impact of individual lifetime saving behaviour.
15%

23
Investment consultants are increasingly in competitionwith asset managers to control asset allocationAs we have observed in previous publications, there is clear ‘co-opetition’between asset managers and consultants in the UK in the battle to controlasset allocation, and to capture the associated remuneration for this activity.More than 50pc of default strategies observed in the UK follow a static assetallocation, whereas in the US a significantly greater proportion of plans
delegate authority to the asset manager to oversee this process and respond more swiftly to marketconditions.Investment management fees are also generally higher in the US, despite this arguably being amore mature and competitive market than the UK. It is remarkable to see evidence of lower feesfor asset management in the UK, versus the US, despite the greater maturity and competitionin the US market. This may reflect the significantly higher influence of consultants in the UK marketand co-opetition for share of the total fees paid by schemes.
DCISIONS | 2011 DEFAULT REPORT
22
0%0%3%0%0%4%0%0%3%0%0%0%1%0%0%0%0%0%0%0%0%0%0%0%0%1%0%0%1%0%0%0%
Figure 23: Distribution of Plans and Assets by Fund Management Type
Active / Passive blend indicates those solutions that have a combination of active and passive sub-funds.
0%0%3%0%0%4%0%0%3%0%0%0%1%0%0%0%0%0%0%0%0%0%0%0%0%1%0%0%1%0%0%0%
Figure 24: Distribution of Plans and Assets by Asset Allocation Strategy
Static includes balanced strategies.
n Active n Passive n Active / Passive Blend
UK
US
UK
US
13% 67% 20% 15% 71% 14%
16% 54% 30% 34% 48% 18%
Distribution of Plans Distribution of Assets Under Management
n Dynamic n Static
UK
US
UK
US
30% 70% 21% 79%
89% 11% 87% 13%
Distribution of Plans Distribution of Assets Under Management
0%0%3%0%0%4%0%0%3%0%0%0%1%0%0%0%0%0%0%0%0%0%0%0%0%1%0%0%1%0%0%0%
Figure 21: Distribution of Entities Responsible for Asset Allocation
5.0%4.5%4.0%3.5%3.0%2.5%2.0%1.5%1.0%0.5%0.0%
15.0% 17.0% 19.0% 21.0% 23.0% 25.0%
3-year annualised volatility (risk)
3-ye
ar a
nnua
lised
retu
rn
5.0%4.5%4.0%3.5%3.0%2.5%2.0%1.5%1.0%0.5%0.0%
15.0% 17.0% 19.0% 21.0% 23.0% 25.0%
3-year annualised volatility (risk)
3-ye
ar a
nnua
lised
retu
rn Investment ConsultantInvestment ManagerPlatform Provider
0%0%3%0%0%4%0%0%3%0%0%0%1%0%0%0%0%0%0%0%0%0%0%0%0%1%0%0%1%0%0%0%
Figure 22: 3-Year Annualised Risk and Return Outcome for Entities Responsible for Asset Allocation as at December 2010 (Growth Phase)
UK figures based on GBP returns. US figures based on USD returns. The size of bubble indicates the market share in termsof number of schemes.
n Investment Consultant n Investment Manager n Platform Provider
UK
US
68%
37%
20% 12%
23% 40%
UK US

Consultant SatisfactionSchemes indicated a generally high level of satisfaction with their investment consultant, with only asmall degree of variation between different providers. An interesting picture is beginning to emergewhich suggests that the subjective satisfaction scores given by schemes in relation to their consultantmay be inversely related to the value delivered through default solution design. We will monitor thisclosely with a view to sharing more information in the future.
25
DCISIONS | 2011 DEFAULT REPORT
24
0%0%3%0%0%4%0%0%3%0%0%0%1%0%0%0%0%0%0%0%0%0%0%0%0%1%0%0%1%0%0%0%
Figure 25: Average Fees by Investment Approach (Index = 100 for Total Default Survey Average)
Index is the mean of all reported fees across both the US and UK default respondents. Active / Passive blend indicates thosesolutions that have a combination of active and passive sub-funds.
0%0%3%0%0%4%0%0%3%0%0%0%1%0%0%0%0%0%0%0%0%0%0%0%0%1%0%0%1%0%0%0%
Figure 26: Average Fees by Assets Under Management (Index = 100 for Total Default Survey Average)
Index is the mean of all reported fees across both the US and UK default respondents. For the UK population, ‘Lower AssetsUnder Management’ indicates plans with assets under management less than or equal to £50 million and ‘Higher Assets UnderManagement’ indicates plans with assets under management exceeding £50 million. For the US population, ‘Lower AssetsUnder Management’ indicates plans with assets under management less than or equal to $2 billion and ‘Higher Assets UnderManagement’ indicates plans with assets under management greater than $2 billion.
155
201
7659
148
79
n UK n US
Active Passive Active / Passive Blend
113
n UK n US
Lower Assets Under Management Higher Assets Under Management
110
85
97

27
Range of ChoiceAcross both trust and contract plans in the UK, the average number of fund choices is 42, versus 19in the US. Surprisingly, the average number of choices in the UK has trended upwards. This isexplained in part by a higher number of contract-based plans observed in this year’s report.
DCISIONS | 2011 DEFAULT REPORT
26
EngagementTo the extent that participation and investment decision making are reflective of engagement levels,US plans enjoy greater engagement with the consumer, with higher participation rates (averaging 83pc versus 69pc in the UK) and lower reliance on default investment strategies (averaging 25pcversus 79pc in the UK).
Figure 27: Cumulative Distribution of Participation Rates
Figure 28: Cumulative Distribution of Default Rates
n UK n US
n UK n US
01020304050
0%0%3%0%0%4%0%0%3%0%0%0%1%0%0%0%0%0%0%0%0%0%0%0%0%1%0%0%1%0%0%0%
Figure 29: Average Number of Investment Choices
28
n UK n US
2010 2011
23
42
19

29
Closing Observations –A Checklist to ConsiderIndividuals tasked with managing DC schemes face a significant responsibility and we offer thefollowing five point checklist to support ongoing risk management:
Review periodically the overall investment objective of your default strategy to ensure it is drivingthe right behaviours. Static asset class benchmarks have the advantage of being easy to achieve,but may not be in the best interests of employees.
Understand how much risk your employees are being exposed to and whether this is a reasonable match with their needs and in line with your aspirations as an employer.
Assess whether the return being generated is a fair reward for this level of risk, over the medium term.
Calibrate the asset allocation within your default strategy, during the growth, de-risking and at retirement phases to understand whether risk is being managed effectively.
Identify who is charged with controlling asset allocation decisions (the employer, trustee, consultant or asset manager), consider whether they are best placed to do so and ensure a suitable level of authority is delegated to them to enable timely and appropriate adjustments.
DCISIONS | 2011 DEFAULT REPORT
28
Contribution LevelsThe UK contribution rate has remained relatively stable at around 12pc comprising a two third, onethird split between employer and employee.
0%0%3%0%0%4%0%0%3%0%0%0%1%0%0%0%0%0%0%0%0%0%0%0%0%1%0%0%1%0%0%0%
Figure 30: Average UK Contribution Rates
3.7%
n Employer Contribution n Employee Contribution
Trust Contract
2010
Trust Contract
2011
8.0%
3.7%
8.1%
4.0%
8.2%
4.9%
8.4%
1
2
3
4
5

DCISIONS | 2011 DEFAULT REPORT
30
Instant, objective insight into the effectiveness of your defaultsolution. Contact us to learn more. To review a sample, please click here.
The Vault Scorecard

DCISIONS | 2011 DEFAULT REPORT
32
AllianceBernsteinHelping You Make the Most of DC
It is critical for both employees and employers that DC scheme members get the best possibleoutcome from their pension savings. That is why it is crucial that they get the highest returns from theirsavings without taking unnecessary risks.We can help members achieve these outcomes by providing investment solutions that can be usedeither as the default option in a DC scheme or as part of a default approach. The heart of our strategyis to maximise returns within the limits imposed by the risks that any individual ought to be taking attheir stage in life.
Solutions tailored to your membership’s needsWe recognise that not all schemes are alike and that objectives often vary. That’s why we’ve developeda broad suite of strategies to answer a range of needs. We provide blended investment solutions thatcan be used either as a target date fund range or as part of a lifestyle strategy. Any or all of them canbe white labelled, depending on your preferences. They can be customised or packaged to suit yourscheme’s needs and member demographics. They can use active or passive management styles inany combination of asset classes.
Five good reasons to use AB solutions• Diversification – unconstrained diversification of both asset classes and fund managers• Volatility management – smoothes the ride for DC investors• Flexibility – allows seamless changes as your scheme evolves• Cost-efficiency – competitive single-fund solutions• Accountability – creates peace of mind for scheme sponsors
Dynamic portfolio managementWhichever of our approaches you choose, you can rest assured that the strategy will be activelymanaged on a daily basis. And when you want to change any element of it, that can be done with theminimum of fuss and at very little cost, without disruption to your membership.
More informationIf you would like to find out more please contact us and we’d be delighted to provide further details.
About DCisionsDCisions gathers and analyses individual consumer level data regarding savings and investments.The resulting insight improves transparency and enables platforms, intermediaries, asset managers,sponsors, trustees and consumers to make better decisions. The company is also the leading providerof insight into DC default strategies and powers the FTSE DCisions Index Series.The company’s independence from investment management, record keeping and investment adviceis central to its value proposition.For more information please visit www.dcisions.com.
DCisions LimitedLiberty House222 Regent StreetLondon W1B 5TRUKTelephone: +44 20 7580 2367Email: [email protected]: www.dcisions.com
Note: All underlying fund factsheets aresourced from Financial Express or theasset managers directly.
Defined Contribution Investments
Contact: Tim BanksDirector, Sales and Client Relations, AllianceBernsteinDefined Contribution InvestmentsTelephone: 020 7959 4783Email: [email protected]

DCISIONS | 2011 DEFAULT REPORT
34
Terms and Conditions of UseThis document is licensed for the exclusive use of report respondents / authorised users, and may notbe distributed to third parties.The following Terms & Conditions apply:• DCisions Limited licenses to the authorised user / respondent the DCisions 2011 Default Report for
sole use by the employees of the authorised user / respondent’s DC pension plan.• DCisions does not permit the distribution of the DCisions 2011 Default Report in whole or in part to
any person for any purpose whatsoever other than as permitted by these Terms & Conditions.• Any reference to the DCisions 2011 Default Report for any reason in work presented by the
authorised user / respondent internally or externally must be attributed and referenced to DCisions. • The use of the DCisions logo is not permitted without the express permission of DCisions.• The license is offered on a non-refundable, non transferable basis.• DCisions makes no representations or gives any warranty (expressed or implied) in respect of this
report or the underlying data, and DCisions accepts no liability whatsoever including forconsequential losses arising from any errors or omissions in this report or the underlying data.
• The information contained in this report does not constitute financial advice and should not be reliedon as such. Past performance is no guide to future returns. Any decisions or action taken by you onthe basis of information provided in this report are at your sole discretion and risk and DCisionswould urge you to seek independent financial advice before proceeding with any investment.
• This agreement will be terminated with immediate effect if the authorised user commits to anymaterial breach of the agreement which cannot be remedied to DCisions’ satisfaction within 30 daysof written notice from DCisions or if the authorised user / respondent becomes insolvent.

Copyright © DCisions Limited 2011. All Rights Reserved. US Patent No. 7,844,527
For more information, please contact us at:DCisionsLiberty House | 222 Regent Street | London W1B 5TRP | +44 (0) 207 580 2367E | [email protected]