2011-2013 three year plan - datalogic - a world-class producer of
TRANSCRIPT

Movingahead
2011-2013
Three Year Plan
June 29th, 2011
© Copyright Datalogic 2007-2011© Copyright Datalogic 2007-2011
© Copyright Datalogic 2007-2011 22
DISCLAIMER
This document has been prepared by Datalogic S.p.A. (the "Company") for use during meetings with investors and financial analysts and is
solely for information purposes. The information set out herein has not been verified by an independent audit company.
Neither the Company nor any of its subsidiaries, affiliates, branches, representative offices (the “Group”), as well as any of their directors,
officers, employees, advisers or agents (the “Group Representatives”) accepts any responsibility for/or makes any representation or warranty,
express or implied, as to the accuracy, timeliness or completeness of the information set out herein or any other related information regarding
the Group, whether written, oral or in visual or electronic form, transmitted or made available.
This document may contain forward-looking statements about the Company and/or the Group based on current expectations and opinions
developed by the Company, as well as based on current plans, estimates, projections and projects of the Group. These forward-looking
statements are subject to significant risks and uncertainties (many of which are outside the control of the Company and/or the Group)
which could cause a material difference between forward-looking information and actual future results.
The information set out in this document is provided as of the date indicated herein. Except as required by applicable laws and regulations, the
Company assumes no obligation to provide updates of any of the aforesaid forward-looking statements.
Under no circumstances shall the Group and/or any of the Group Representatives be held liable (for negligence or otherwise)
for any loss or damage howsoever arising from any use of this document or its contents or otherwise in connection with the
document or the aforesaid forward-looking statements.
This document does not constitute an offer to sell or a solicitation to buy or subscribe to Company shares and neither this entire
document or a portion of it may constitute a recommendation to effect any transaction or to conclude any legal act of any kind whatsoever.
This document may not be reproduced or distributed, in whole or in part, by any person other than the Company.
By viewing and/or accepting a copy of this document, you agree to be bound by the foregoing limitations.

© Copyright Datalogic 2007-2011 33
THE GROUP
THREE YEAR PLAN
FINANCIAL DATA
APPENDIX

© Copyright Datalogic 2007-2011 4
World-class producer of bar code readers, data
collection mobile computers, RFID and vision
systems
Datalogic offers innovative solutions for a
comprehensive range of applications in the
manufacturing, retail, transportation & logistics
markets
2010 Revenues at 393 M Euro of which 68% in the
ADC Market and 23% in the Industrial Automation
Market
Founded in 1972 in Bologna, Italy
Listed on the STAR Segment of the Italian Stock
Exchange since 2001
2,000 employees
Direct presence in 30 countries worldwide selling
to +100 countries
+1,000 partners worldwide
Datalogic at a Glance
4

© Copyright Datalogic 2007-2011 55
Completed transformation into
3 divisions: Scanning, Mobile,
and Automation
Acquisition of
Datasensor SpA
Listing on the Milan
Stock Exchange
Acquisition of Minec
AB (Sweden)
Acquisition of Laservall
SpA (AO, I)
Acquisition of Informatics
Inc. (TX, U.S.A.)
Acquisition of PSC Inc.
(OR, U.S.A.)
REVENUES: ~15% 2001-2010 CAGR
2010 SALES REVENUES (393 M Euro) UP BY 26% VS 2009
A History of Growth
2001 2002 2003 20052004 2006 2007 2008 2009 2010
Acquisition of Evolution
Robotics Retail, USA

© Copyright Datalogic 2007-2011 6
Direct presence in 30 countries worldwide
7 Manufacturing Plants 9 R&D Centers
A Wide Geographical Footprint
2010 REVENUES – TOTAL €393M - BREAKDOWN BY AREA
EUROPE 40%
ITALY 11%
NORTH AMERICA 29%
ROW 7%
APAC 13%
6

© Copyright Datalogic 2007-2011 777
AUTOMATIC DATA CAPTURE (ADC) MARKET INDUSTRIAL AUTOMATION MARKET BUSINESS DEVELOPMENT
Datalogic Scanning
HQ Eugene, OR, USA
B. Parnell - CEO
Datalogic Mobile
HQ Bologna, Italy
B. Parnell - CEO
Datalogic Automation
HQ Bologna, Italy
G. P. Fedrigo - CEO
Business Development
HQ Bologna, Italy
M. Sacchetto - CEO
Hand Held Scanners
BUSINESS UNIT
Retail POS Scanners
BUSINESS UNIT
Mobile Computers
BUSINESS UNIT
Identification
PRODUCT GROUP
Sensors & Safety
PRODUCT GROUP
Vision
PRODUCT GROUP
Laser Marking
PRODUCT GROUP
SMB Barcode Solutions
Informatics, Inc. USA
BUSINESS UNIT
Vision Systems
Evolution Robotics Retail Inc. USA
BUSINESS UNIT
Self Shopping Solutions - EBS
BUSINESS UNIT
A Focused Organisation

© Copyright Datalogic 2007-2011 88
Innovative Solutions in Reference Markets…
TRANSPORTATION & LOGISTICS HEALTHCARE
RETAIL
2010 Revenues: 68% in
the ADC Market and
23% in the Industrial
Automation Market
MANUFACTURING

© Copyright Datalogic 2007-2011 9
Applications…to Better Serve Global Clients
More than 1,000 partners worldwide
Longstanding relations with the biggest retailers, couriers and automotive manufacturers in the world
Over 360 installations of Self Shopping in Europe
Over 1,000 reading stations installed in more than 100 airports worldwide

© Copyright Datalogic 2007-2011 1010
Stock and Governance
Market Segment: STAR MTA
Ticker: DAL
Reuters Code: DAL.MI
Bloomberg Code: DAL IM
Number of Shares Outstanding: 58,446,491
Share Par-Value: 0.52 Euro each
SHAREHOLDERS’ STRUCTUREDATALOGIC PRICE PERFORMANCE
Price (June 22,2011): 5.99 Euro
Market Cap (June 22th,2011): 350 M Euro
Specialist: Intermonte SIM
Auditing Company: Ernst & Young
68.40%
15.70%
6.40%
2.03%
7.50%
Hydra S.p.A.
Free Float
Tamburi Investment P.
D'Amico
Treasury Shares
2.5
3.5
4.5
5.5
6.5
7.5
Dec 09
Jan 10
Feb 10
Mar 10
Apr 10
May 10
Jun 10
Jul 10
Aug 10
Sep 10
Oct 10
Nov 10
Dec 10
Jan 11
Feb 11
Mar 11
Apr 11
May 11
Jun 11
Datalogic ftsemib

© Copyright Datalogic 2007-2011 1111
THE GROUP
THREE YEAR PLAN
FINANCIAL DATA
APPENDIX

12% 11%
22% 20%
66%
69%
2009A 2013E
POS RETAIL SCANNERS HAND HELD SCANNERS
MOBILE COMPUTERS
14% 6%
42%18%
15%
10% 13%
6%17%
9%
50%
2009A 2013E
STATIONARY BARCODE SCANNERS SENSORS
SAFETY VISION
LASERMARKING POTENTIAL ADDITIONAL MARKETS
2.3
6.3$B
Factors driving demand:
shift to field mobility deployments
need to increase efficiency and overcome scanning
errors at the point of sale
growing list of emerging applications in the government,
healthcare and retail sectors
increased adoption of core retail automation technologies
in emerging country markets
enterprises require more data than ever to effectively
manage their supply chains
12
Source VDC 2010 (base year 2009)
AUTOMATIC DATA CAPTURE (ADC)
ADDRESSABLE MARKET
Worldwide Market Trend: ADC and IA
Very fragmented industry with potential additional
markets worth $3B
Factors driving demand:
increasing demand for traceability of processes and
goods
supply chain streamlining
new regulations (e.g. traceability, safety and security)
increased adoption of technological solutions in
emerging markets
INDUSTRIAL AUTOMATION (IA)
ADDRESSABLE MARKET
$B
2.9
3.9
CAGR 8%
3.2
3.1
CAGR 8%

© Copyright Datalogic 2007-2011 1313
Datalogic Positioning in ADC Available Market
2009 ADC Available Market: 10% Market Share
Datalogic market shares
POS Retail Scanners
#1 WW – 31.5% mkt share
Handheld Scanners
#1 in EMEA - 30.7% mkt share
#3 WW -15.9% mkt share
Mobile Computers
#4 in EMEA - 7.9% mkt share
#4 WW - 4.0% mkt share
2009 ADC Available Market including POS Retail Scanners, Hand Held Scanners and Mobile Computers (Hand Held
and PDA) segments
Source VDC 2010 (base year 2009)
20
09
Ma
rke
t S
ha
re
$100 M $300 M $950 M
>30%
>10%
<2%
4%
$200 M
2009 Revenues
$50 M

© Copyright Datalogic 2007-2011 14
Datalogic Positioning in IA Available Market
2009 IA (Industrial Automation) Available Market:
4% Market Share
Datalogic market shares(*)
Industrial Stationary
Scanners
#2 in EMEA - 29% mkt share
#3 WW - 14.6% mkt share
2009 IA Available Market including Industrial Barcode Scanners, Imagers, Photoelectric Sensors, Safety Light
Curtains, Smart Cameras/Vision Sensors and Laser Marking segments
Source (*) VDC 2010 - Market Researches and Datalogic Automation Management's Best Estimate
20
09
Ma
rke
t S
ha
re 10%
>12%
5%
<2%
$50 M $100 M $200 M $300 M
2009 Revenues

© Copyright Datalogic 2007-2011 15
Major Achievements and New Challenges
Turnaround successfully completed:
Revenues growth above market average in 2010: + 26% vs. +8%
EBITDA margin at 13% in 2010 and at 14% in 1Q 2011
Robust free cash generation
Right sized cost structure
Fierce competition in the global market
Datalogic is ready to build a sustainable competitive advantage by
leveraging:
world class performance through best-in-class Supply Chain
Management
improved operational efficiency and global industrial footprint
Refresh of Datalogic Three Year Rolling Plan to extend targets to 2013

© Copyright Datalogic 2007-2011
EFFICIENCY AND
PRODUCTIVITY
STRATEGIC
POSITIONING
1616
The Four Strategic Drivers To Create Value
INNOVATION
Invest 7% in R&D to launch new products and platforms
Become a value-added solutions provider developing
software for intelligent products
Focus on Vision and Imaging technologies
25% of sales from new products (*)
Focus on two major markets:
Automatic Data Capture (ADC)
Industrial Automation (IA)
External growth through M&A activities, mainly in the
Industrial Automation market
INTERNATIONAL
EXPANSION
Expand emerging market (BRIC) presence through
strategic alliances and foreign investments
Increase penetration in large mature markets in North
America and Western Europe addressing High-End
products/solutions and higher technology businesses
World class performance through the global adoption of
best in class Supply Chain Management
Improve operational efficiency and leverage industrial
global footprint
Activate scale economies
(*) Sales from new products released during the past 2 calendar years divided by total sales

© Copyright Datalogic 2007-2011 1717
Industrial Automation Market: Strategy
Address a huge market worth over $6B in 2013, focusing
on Vision and Safety
Encourage external growth through acquisitions worth
approx. 100M Euro
Drive above market revenue growth of 12.5% CAGR vs.
2009-2013 CAGR of 8% projected for the Automation
market
Invest >25M Euro in R&D to sustain developments in the
promising markets of Vision, Safety, and to develop
Miniature and Subminiature technology for Sensors
and the new Fiber Laser technology
Further enhance trade working capital through
rationalization of SKU’s and inventory processes
reengineering
Adopt state of the art supply chain management to gain
efficiency and leverage the industrial global footprint
© Copyright Datalogic 2007-2011 18
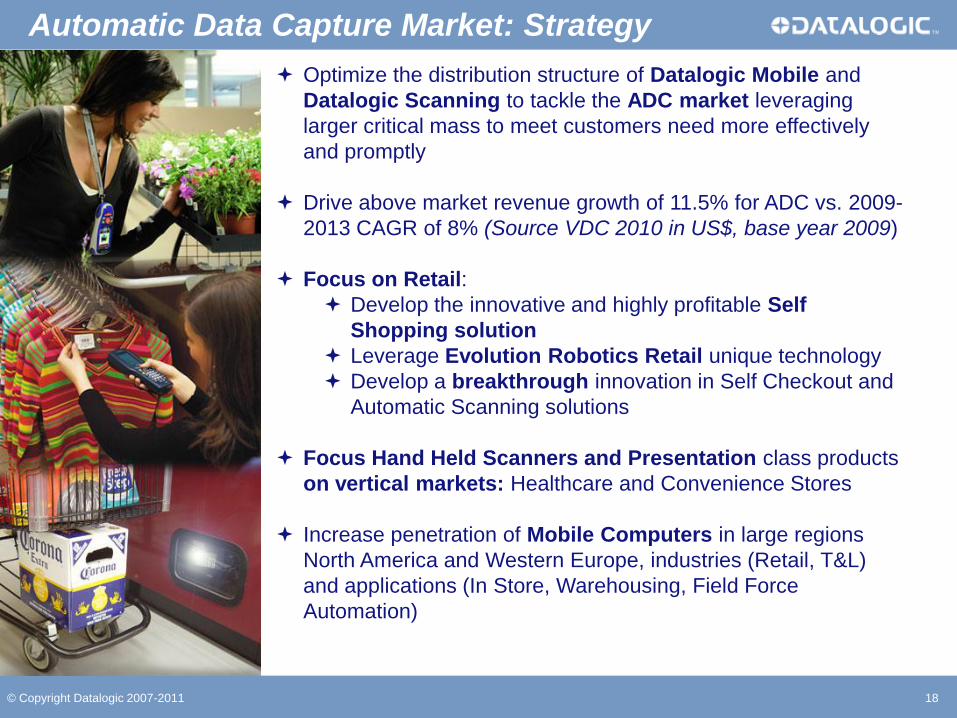
Optimize the distribution structure of Datalogic Mobile and
Datalogic Scanning to tackle the ADC market leveraging
larger critical mass to meet customers need more effectively
and promptly
Drive above market revenue growth of 11.5% for ADC vs. 2009-
2013 CAGR of 8% (Source VDC 2010 in US$, base year 2009)
Focus on Retail:
Develop the innovative and highly profitable Self
Shopping solution
Leverage Evolution Robotics Retail unique technology
Develop a breakthrough innovation in Self Checkout and
Automatic Scanning solutions
Focus Hand Held Scanners and Presentation class products
on vertical markets: Healthcare and Convenience Stores
Increase penetration of Mobile Computers in large regions
North America and Western Europe, industries (Retail, T&L)
and applications (In Store, Warehousing, Field Force
Automation)
Automatic Data Capture Market: Strategy
© Copyright Datalogic 2007-2011 1919
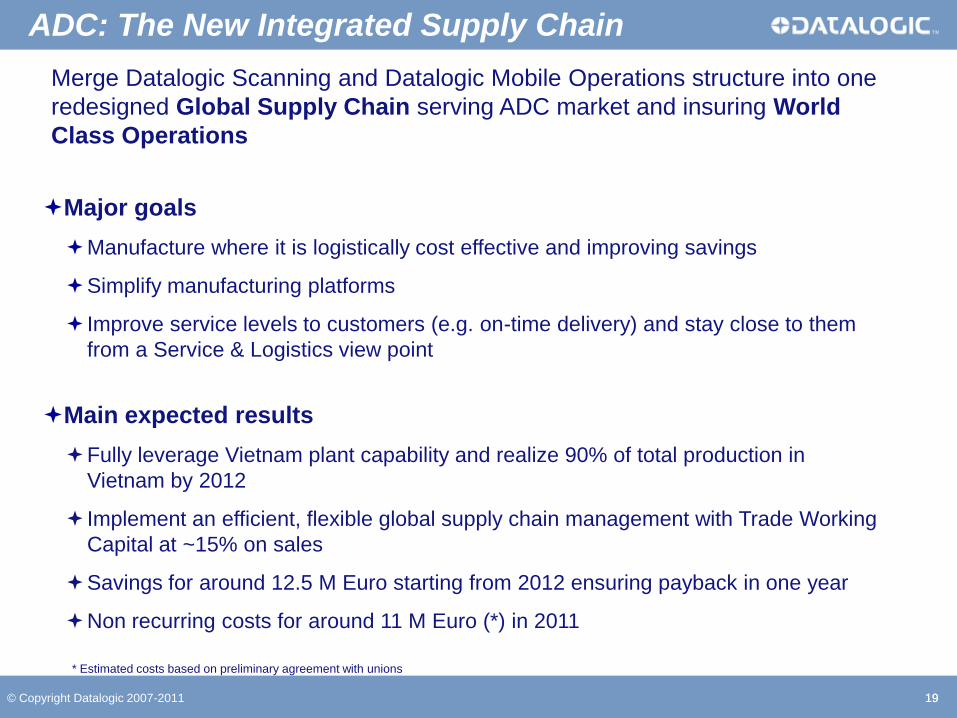
ADC: The New Integrated Supply Chain
Merge Datalogic Scanning and Datalogic Mobile Operations structure into one
redesigned Global Supply Chain serving ADC market and insuring World
Class Operations
Major goals
Manufacture where it is logistically cost effective and improving savings
Simplify manufacturing platforms
Improve service levels to customers (e.g. on-time delivery) and stay close to them
from a Service & Logistics view point
Main expected results
Fully leverage Vietnam plant capability and realize 90% of total production in
Vietnam by 2012
Implement an efficient, flexible global supply chain management with Trade Working
Capital at ~15% on sales
Savings for around 12.5 M Euro starting from 2012 ensuring payback in one year
Non recurring costs for around 11 M Euro (*) in 2011
* Estimated costs based on preliminary agreement with unions

© Copyright Datalogic 2007-2011 2020
ADC: The New Supply Chain Global Footprint
The new integrated Supply Chain will be focused and concentrated on manufacturing footprint and regional Logistic & Distribution centers
Logistic & Distribution Center scope
Manufacturing PlantManufacturing and Sourcing scope
Logistic & Distribution Center
Manufacturing secondary line / selective backup
capacity and EMEA L&D center
Potential localization at distributor site for the L&D center serving Americas
Slovakia
Vietnam
North
America
Manufacturing primary capacity and APAC L&D
center
© Copyright Datalogic 2007-2011
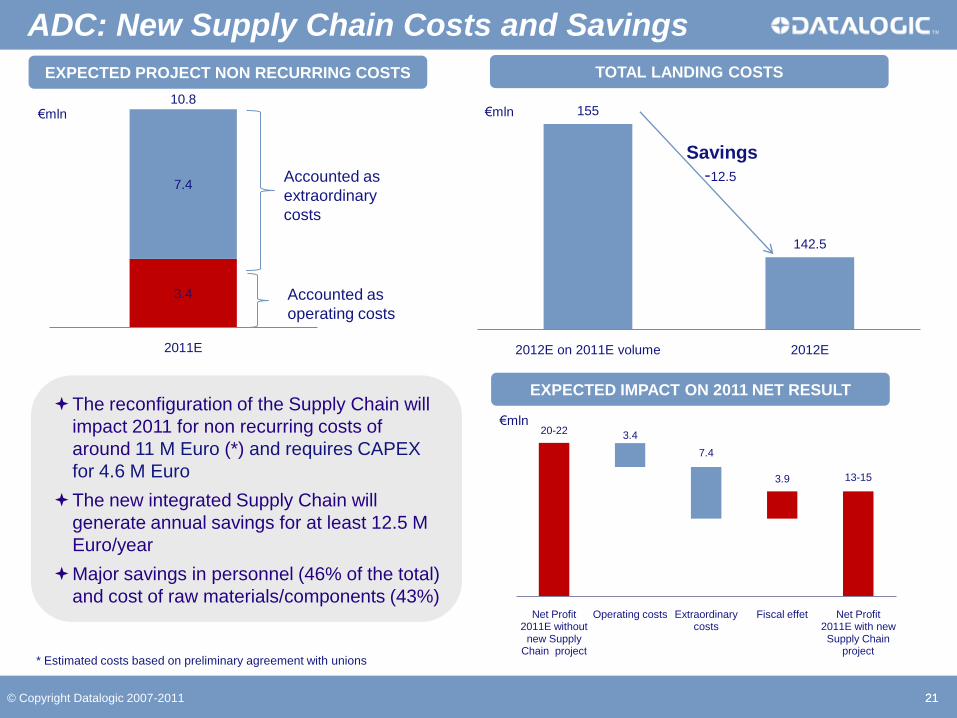
155
142.5
2012E on 2011E volume 2012E
€mln
2121
ADC: New Supply Chain Costs and Savings
3.4
7.4
2011E
10.8
Accounted as
operating costs
Accounted as
extraordinary
costs
Savings
-12.5
The reconfiguration of the Supply Chain will
impact 2011 for non recurring costs of
around 11 M Euro (*) and requires CAPEX
for 4.6 M Euro
The new integrated Supply Chain will
generate annual savings for at least 12.5 M
Euro/year
Major savings in personnel (46% of the total)
and cost of raw materials/components (43%)
€mln
EXPECTED PROJECT NON RECURRING COSTS TOTAL LANDING COSTS
EXPECTED IMPACT ON 2011 NET RESULT
€mln
* Estimated costs based on preliminary agreement with unions
20-22 3.4
7.4
3.9 13-15
Net Profit 2011E without
new Supply Chain project
Operating costs Extraordinary costs
Fiscal effet Net Profit 2011E with new Supply Chain
project

60-65
74-77
EBITDA
2012E Old 2012E New
© Copyright Datalogic 2007-2011 2222
2011-13 vs. 2010-12 Plan: Strong 2012 Target Progress
REVENUES GROWTH (*) EBITDA GROWTH (*)
€mln €mln
420-430
440-450
Revenues
2012E Old 2012E New
~5%~21%
NET PROFIT GROWTH (*)
23-25
38-40
Net Profit
2012E Old 2012E New
~ 63%€mln
Major improvements in 2012 targets from
old to new 3-Year Plan
Investments in the new integrated
Supply Chain allow strong recovery in
efficiency
* Growth calculated on the range average

© Copyright Datalogic 2007-2011
312
393
470-480
2009 2010 2013E
2323
Datalogic Group Three Year Plan 2011-2013
REVENUES GROWTH EBITDA GROWTH
€mln €mln
CAGR 2009-2013
>11%
19.7
49.8
80-85
6%
13%
17%-18%
2009 2010 2013E
EBITDA EBITDA Margin
CAGR 2009-2013
~ 45%
Datalogic Strategic Plan 2011-2013: strong organic profitability growth thanks to the new
integrated Supply Chain of Datalogic Scanning and Datalogic Mobile
Organic revenues target in the range of 470-480 M Euro, CAGR 2009-2013 >11%
Confirmed EBITDA CAGR 2009-2013 ~45% in the range of 80-85 M Euro
EBITDA margin from 12.7% in 2010 to 17-18% in 2013

© Copyright Datalogic 2007-2011
12.0%
-9.6%
14.0%
23%-24%
2008 2009 2010 2013E
2424
NFP* EVOLUTION ROE GROWTH
€mln
Strong cash generation and a positive Net Financial Position expected by 2013
Investment in CAPEX stable at around 2% of revenues per year
2013 ROE target around 23%-24%
* Net Financial Position gross of expected dividends and outflows for potential acquisitions
** Including acquisition of Evolution Robotics Retail completed in July 2010
-100
-76**
15-2091-96
2009 2010 Cash Flow 2013E
€mln
Datalogic Group Three Year Plan 2011-2013

© Copyright Datalogic 2007-2011 2525
Three Year Plan – Potential Upside
Potential upside for further acquisitions
A proven track record in integrating acquired companies
Strong commitment for external growth
Robust cash flow generation and Group financial strength allow to target additional 100 M
Euro revenues by external growth
Scouting for M&A activity to reinforce positioning in the Industrial Automation market is
currently ongoing
POTENTIAL UPSIDE ON REVENUES
312
393
470-480
570-580
2009 2010 2013E
€mlnCAGR 2009-2013
>11% Potential upside
from
acquisitions
© Copyright Datalogic 2007-2011 2626
THE GROUP
THREE YEAR PLAN
FINANCIAL DATA
APPENDIX

© Copyright Datalogic 2007-2011 272727
1Q 2011 Highlights
€000 1Q2010 1Q2011 Var %
Revenues 89,520 104,956 17.2%
Gross Operating Margin (GOM) 40,474 49,416 22.1%
Ord. Operating Profit
(EBITANR*)7,697 12,213 58.7%
Operating Profit (EBIT) 6,724 11,106 65.2%
EBT 6,213 8,188 31.8%
Net Income 4,135 5,659 36.9%
EBITDA 10,585 14,896 40.7%
*Ebitanr: earnings before interest, taxes, acquisition and non recurring
€ mln
Quarterly Growth
Revenues growth, +17% YoY and +3% QoQ, continues to beat the market
Strong EBITDA growth, +41% YOY, and improvement of profitability: EBITDA margin at 14.2%
R&D expenses stable at 6.5% on revenues
Jump of net profit to 5.7 M Euro from 4.1 M Euro recorded in 1Q 2010
73.1 76.0 76.0
86.9 89.5
101.3 100.4101.5 105.0
-0.5
4.3 7.1 8.810.6
15.312.9 10.9 14.9
-4.1 0.6 4.0 5.7 7.712.4
10 7.9 12.2
-0.7%
Q1 09 Q2 09 Q3 09 Q4 09 Q1 10 Q2 10 Q3 10 Q4 10 Q1 11
Revenues EBITDA EBITANR EBITDA MARGIN
14.2%

© Copyright Datalogic 2007-2011 28
(*) Ordinary Operating Profit before non recurring costs/revenues and amortization of intangible assets from acquisition (EBITANR)
Note:
The Exchange rate variance has been calculated on Sales/COGS/Operating expenses originally denominated in USD ($). The variance is the result of the
difference between March’10 Actual (1.383) and March’11 Actual (1.3680) €/USD exchange rate.
Therefore, this variance does not include the exchange rate effect on competitive scenario.
For Informatics and Evolution Robotics Retail (Business Development) it has been considered the overall impact on EBITANR.
(€000)Exch rate on sales + 400
Exch rate on DCOGS - 255
Exch rate on Op Exp - 173
Other revenues +85
Other variable costs +163
Direct Cogs -1,387
Vol. sales/Mix +6,691
Service sales +531
EBITANR * - 1Q 2011 Actual vs. Last Year
7,697
- 1,080
7,222
2,405
-28
-2,564-300
- 1,139
12,213
Act March 2010
Price Vol. Sales/Mix New Prod. Exch rate € vs $
Oper Exp Business Development
Other Act March 2011
© Copyright Datalogic 2007-2011 292929
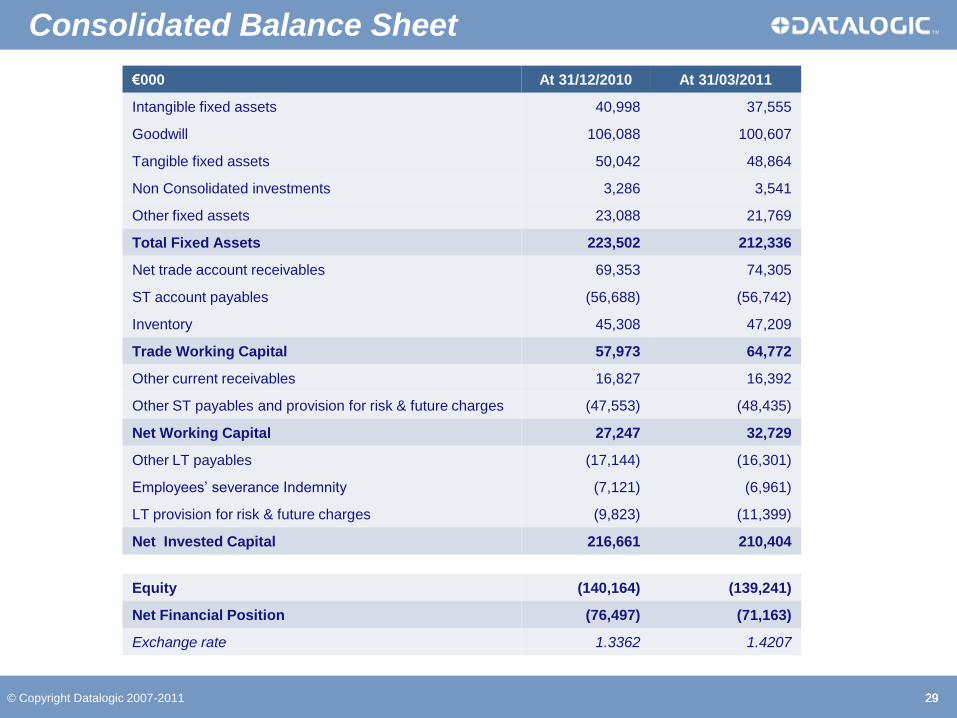
Consolidated Balance Sheet
€000 At 31/12/2010 At 31/03/2011
Intangible fixed assets 40,998 37,555
Goodwill 106,088 100,607
Tangible fixed assets 50,042 48,864
Non Consolidated investments 3,286 3,541
Other fixed assets 23,088 21,769
Total Fixed Assets 223,502 212,336
Net trade account receivables 69,353 74,305
ST account payables (56,688) (56,742)
Inventory 45,308 47,209
Trade Working Capital 57,973 64,772
Other current receivables 16,827 16,392
Other ST payables and provision for risk & future charges (47,553) (48,435)
Net Working Capital 27,247 32,729
Other LT payables (17,144) (16,301)
Employees’ severance Indemnity (7,121) (6,961)
LT provision for risk & future charges (9,823) (11,399)
Net Invested Capital 216,661 210,404
Equity (140,164) (139,241)
Net Financial Position (76,497) (71,163)
Exchange rate 1.3362 1.4207

30
(€000)
Acc. Receivable - 5,034
Inventory - 1,901
Acc. Payable +54
Net Income +5,659
Deprec&Amort +3,790
Provision bad debt +82
Net Debt Analysis: Dec. 2010 – March 2011
76,497 9,531 6,881 1,745 1,527 598 6,554
71,163
Net Debt Dec 10 Operating cash Flow Ch Trade NWC Capex Purch./sale own shares
tax payments Other Net Debt March 2011
Positive Cash flow Negative Cash Flow
Exchange rate effect +2,871
Personnel cost accrual - 382
Taxes +2,499
LT MIP +1,566

© Copyright Datalogic 2007-2011 3131
THE GROUP
THREE YEAR PLAN
FINANCIAL DATA
APPENDIX

© Copyright Datalogic 2007-2011 32
ADC Market: Datalogic Scanning Division
Handheld Scanners
#1 in EMEA, 30.7% mkt share
#3 Worldwide, 15.9% mkt share
POS Retail Scanners
#1 Worldwide, 31.5% mkt share
32
Source 2010 (base year 2009)
Over 5 million Datalogic handheld
scanners have been sold since 1998
and have been chosen by over
30,000 customers
Datalogic Magellan Scanner/Scales
have been installed by every one of
the Top Ten Retailers worldwide
Scanning Division: 181.4 M€ in 2010, 46% of Group Sales
32

© Copyright Datalogic 2007-2011 3333
Mobile Computers
#4 in EMEA, 7.9% mkt share
#4 Worldwide, 4.0% mkt share
Source 2010 (base year 2009)
ADC Market: Datalogic Mobile Division
Mobile Division: 87.6M€ in 2010, 22% of Group Sales
Datalogic Mobile – EBS
Self Shopping Solutions
#2 Worldwide, 26.0% mkt share
Over 360 installations in Europe!
#1 in Italy with 145 installations
#1 in Belgium with 96 installations
#2 in France with 110 installations
A full range of professional mobile solutions dedicated to the main target
application fields: Warehousing, Field Force Automation and Retail In-Store
solutions
33

© Copyright Datalogic 2007-2011 3434
A wide range of cutting edge solutions helping industries streamline processes in industrial
and logistics applications
Hundreds of applications for the major courier and logistics operators, +1,000 reading
stations installed in 100 airports worldwide
Laser Marking Sensors
Vision Safety &
Measurement
Industrial Stationary Scanners
#2 in EMEA, 29% mkt share
#3 Worldwide, 14.6% mkt share
Identification
IA Market: Datalogic Automation Division
Automation Division: 90.4 M€ in 2010, 23% of Group Sales
Source 2010 (base year 2009)
34

© Copyright Datalogic 2007-2011 3535
Business Development: Informatics
Complete Range of Easy-To-Use Barcoding Solutions
Barcoding solutions for the millions of Small – Medium Businesses
that increase productivity and profitability
Based in the US, serving over 275 thousand small and medium businesses!
Business Development (Informatics + EVO): 33.3 M€ in 2010, 9% of Group Sales
35

© Copyright Datalogic 2007-2011 3636
Scanning without using the barcode and RFID
Flagship products include LaneHawk BOB and LaneHawk InCart
Based in the US, serving over 1,200 grocery stores today
Over 14,000 lanes installed!
Business Development: Evolution Robotics Retail
July 1st, 2010 – Datalogic acquired 100% of Evolution Robotics Retail, Inc. (EVO)
a company located in California with unique expertise in visual pattern recognition
technology for use currently in retail loss prevention and productivity applications
36
© Copyright Datalogic 2007-2011 3737
Datalogic S.p.A.
Via Candini, 2
40012 Lippo di Calderara di Reno
Bologna – Italy
Tel. +39 051 3147011 – Fax +39 051 3147205
E-mail [email protected]
www.datalogic.com
This presentation contains statements that are neither reported financial results nor other historical information. These statements are forward-looking
statements. These forward-looking statements rely on a number of assumptions and are subject to a number of risks and uncertainties, many of which are
outside the control of Datalogic S.p.A., that could cause actual results to differ materially from those expressed in or implied by such statements, such as
future market conditions, currency fluctuations, the behavior of other market participants and the actions of governmental and state regulators
© 2011 Datalogic S.p.A. - All rights reserved. • Protected to the fullest extent under U.S. and international laws. • Copying, or altering of this document is
prohibited without express written consent from Datalogic S.p.A. Datalogic and the Datalogic logo are registered trademarks of Datalogic S.p.A. in many
countries, including the U.S.A. and the E.U. All other brand and product names may be trademarks of their respective owners.
Thank You!
.

© Copyright Datalogic 2007-2011 3838
We Welcome Your Questions!