2011-09-30 lakeland police (quarterly report)@315
TRANSCRIPT

City of LakelandPolice Officers'
Retirement System
3rd Quarter 2011

3rd Quarter 2011 Market Environment
Page 2
The Market EnvironmentMajor Market Index Performance
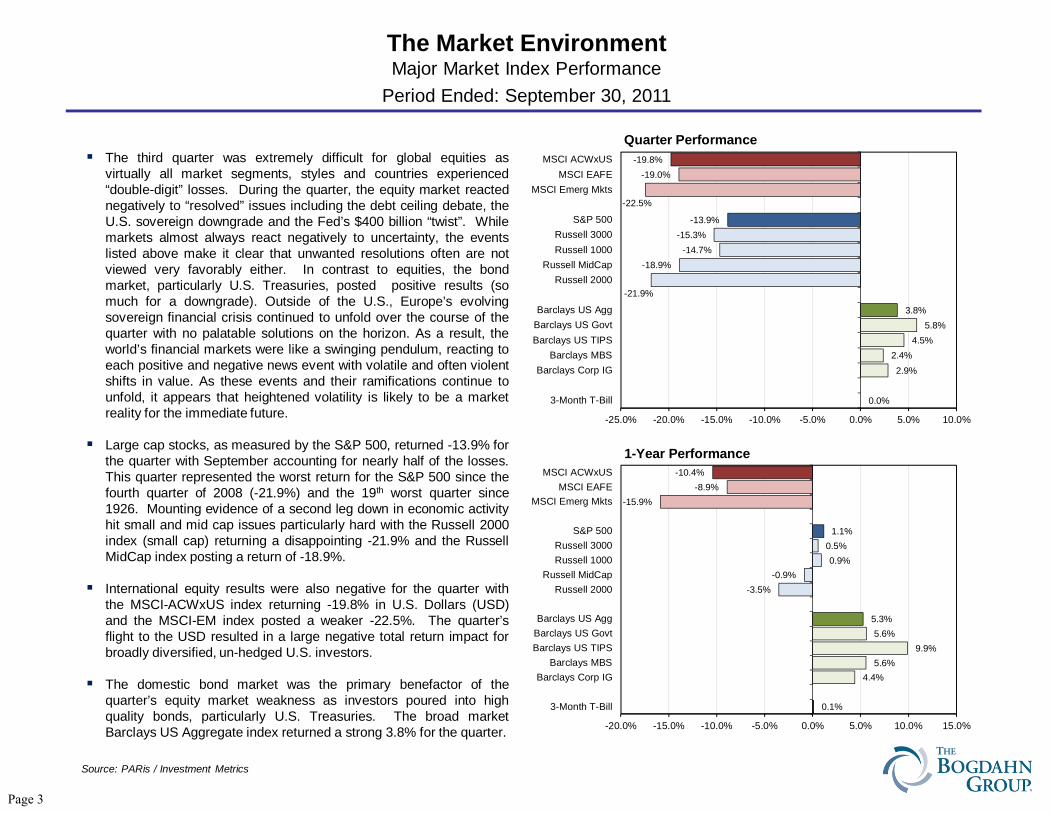
The third quarter was extremely difficult for global equities asvirtually all market segments, styles and countries experienced“double-digit” losses. During the quarter, the equity market reactednegatively to “resolved” issues including the debt ceiling debate, theU.S. sovereign downgrade and the Fed’s $400 billion “twist”. Whilemarkets almost always react negatively to uncertainty, the eventslisted above make it clear that unwanted resolutions often are notviewed very favorably either. In contrast to equities, the bondmarket, particularly U.S. Treasuries, posted positive results (somuch for a downgrade). Outside of the U.S., Europe’s evolvingsovereign financial crisis continued to unfold over the course of thequarter with no palatable solutions on the horizon. As a result, theworld’s financial markets were like a swinging pendulum, reacting toeach positive and negative news event with volatile and often violentshifts in value. As these events and their ramifications continue tounfold, it appears that heightened volatility is likely to be a marketreality for the immediate future.
Large cap stocks, as measured by the S&P 500, returned -13.9% forthe quarter with September accounting for nearly half of the losses.This quarter represented the worst return for the S&P 500 since thefourth quarter of 2008 (-21.9%) and the 19th worst quarter since1926. Mounting evidence of a second leg down in economic activityhit small and mid cap issues particularly hard with the Russell 2000index (small cap) returning a disappointing -21.9% and the RussellMidCap index posting a return of -18.9%.
International equity results were also negative for the quarter withthe MSCI-ACWxUS index returning -19.8% in U.S. Dollars (USD)and the MSCI-EM index posted a weaker -22.5%. The quarter’sflight to the USD resulted in a large negative total return impact forbroadly diversified, un-hedged U.S. investors.
The domestic bond market was the primary benefactor of thequarter’s equity market weakness as investors poured into highquality bonds, particularly U.S. Treasuries. The broad marketBarclays US Aggregate index returned a strong 3.8% for the quarter.
Period Ended: September 30, 2011
Source: PARis / Investment Metrics
0.0%
2.9%2.4%
4.5%5.8%
3.8%
-21.9%
-18.9%-14.7%
-15.3%-13.9%
-22.5%
-19.0%-19.8%
-25.0% -20.0% -15.0% -10.0% -5.0% 0.0% 5.0% 10.0%
3-Month T-Bill
Barclays Corp IGBarclays MBS
Barclays US TIPSBarclays US GovtBarclays US Agg
Russell 2000Russell MidCap
Russell 1000Russell 3000
S&P 500
MSCI Emerg MktsMSCI EAFE
MSCI ACWxUS
Quarter Performance
0.1%
4.4%5.6%
9.9%5.6%
5.3%
-3.5%-0.9%
0.9%0.5%
1.1%
-15.9%-8.9%
-10.4%
-20.0% -15.0% -10.0% -5.0% 0.0% 5.0% 10.0% 15.0%
3-Month T-Bill
Barclays Corp IGBarclays MBS
Barclays US TIPSBarclays US GovtBarclays US Agg
Russell 2000Russell MidCap
Russell 1000Russell 3000
S&P 500
MSCI Emerg MktsMSCI EAFE
MSCI ACWxUS
1-Year Performance
Page 3

The Market EnvironmentDomestic Equity Style Index Performance
Equity results were negative across the capitalization spectrum forthe quarter, but the style-based results were mixed. Growthoutperformed value in the broad and large cap segments of themarket. The Russell 1000 large cap style benchmarks recorded thelargest span with growth outperforming value by a margin of 310basis points. In the small and mid cap segments of the market,growth actually trailed value for the quarter. However, value’sadvantage over growth in the small and mid cap segments of themarket was less than 100 basis points for each segment.
Growth was able to outpace value in the large cap space due to thelarge cap growth benchmark’s over-weighted positions in theinformation technology (+19.1% vs. value) and consumer staples(+4.6% vs. value) sectors. Although each sector was negative forthe quarter, both were down much less than the broad index results.In contrast, financials, which represent a significant overweight in thelarge cap value benchmark (+21.9% vs. growth), were down morethan 22% for the quarter. Interestingly, focusing on the small capsegment of the market, financial sector performance was actuallyless negative than the information technology sector by 700 basispoints. As a result, the financially dominated small cap valuebenchmark was able to outpace the information technologydominated growth benchmark for the quarter.
Over the one-year period, growth benchmarks outperformed valuebenchmarks in all capitalization ranges. In the small cap segment ofthe market, both growth and value results were negative, but valuetrailed growth by a wide 490 basis points. Outside of small cap, thestyle differentials appear more visually pronounced since valueresults at each capitalization range were negative for the year, whilethe corresponding growth results were positive.
Source: PARis / Investment Metrics
Period Ended: September 30, 2011
-22.2%
-21.9%
-21.5%
-19.3%
-18.9%
-18.5%
-13.1%
-14.7%
-16.2%
-13.9%
-15.3%
-16.6%
-25.0% -20.0% -15.0% -10.0% -5.0% 0.0%
2000 Growth
2000 Index
2000 Value
MidCap Growth
MidCap Index
MidCap Value
1000 Growth
1000 Index
1000 Value
3000 Growth
3000 Index
3000 Value
Quarter Performance - Russell Style Series
-1.1%
-3.5%
-6.0%
0.8%
-0.9%
-2.4%
3.8%
0.9%
-1.9%
3.4%
0.5%
-2.2%
-8.0% -6.0% -4.0% -2.0% 0.0% 2.0% 4.0% 6.0%
2000 Growth
2000 Index
2000 Value
MidCap Growth
MidCap Index
MidCap Value
1000 Growth
1000 Index
1000 Value
3000 Growth
3000 Index
3000 Value
1-Year Performance - Russell Style Series
Page 4
Source: Thompson Financial
The Market EnvironmentGICS Sector Performance & (Sector Weight)
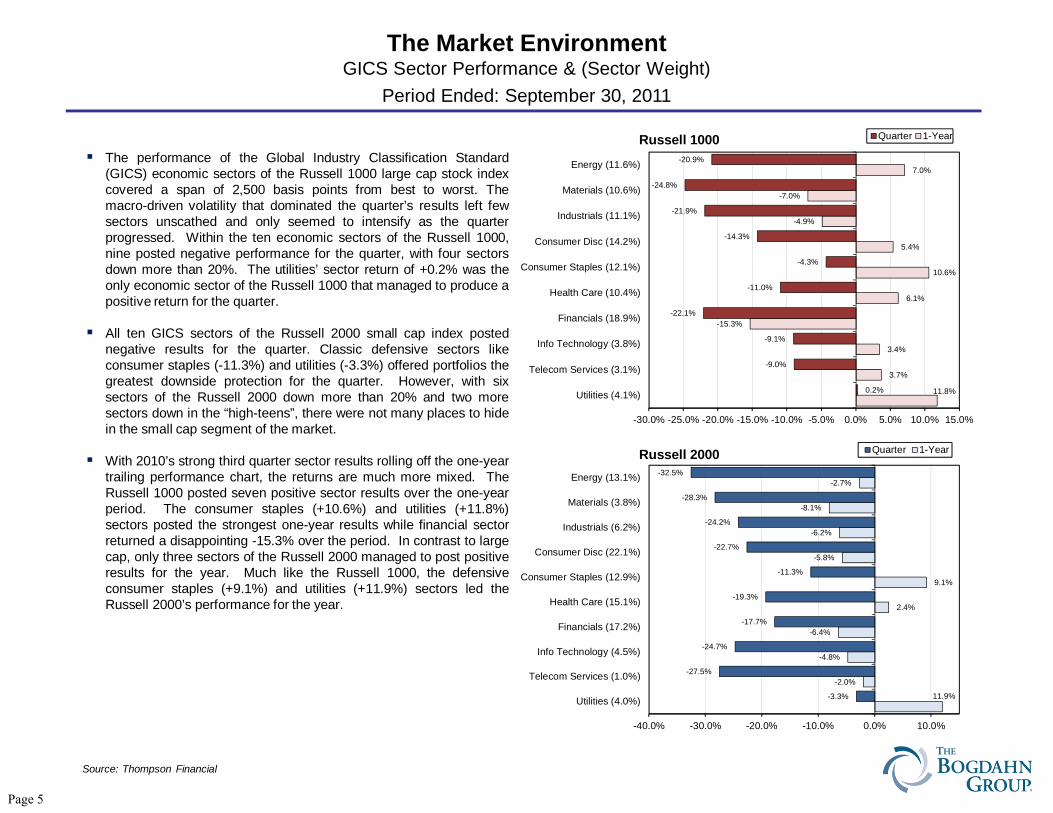
The performance of the Global Industry Classification Standard(GICS) economic sectors of the Russell 1000 large cap stock indexcovered a span of 2,500 basis points from best to worst. Themacro-driven volatility that dominated the quarter’s results left fewsectors unscathed and only seemed to intensify as the quarterprogressed. Within the ten economic sectors of the Russell 1000,nine posted negative performance for the quarter, with four sectorsdown more than 20%. The utilities’ sector return of +0.2% was theonly economic sector of the Russell 1000 that managed to produce apositive return for the quarter.
All ten GICS sectors of the Russell 2000 small cap index postednegative results for the quarter. Classic defensive sectors likeconsumer staples (-11.3%) and utilities (-3.3%) offered portfolios thegreatest downside protection for the quarter. However, with sixsectors of the Russell 2000 down more than 20% and two moresectors down in the “high-teens”, there were not many places to hidein the small cap segment of the market.
With 2010’s strong third quarter sector results rolling off the one-yeartrailing performance chart, the returns are much more mixed. TheRussell 1000 posted seven positive sector results over the one-yearperiod. The consumer staples (+10.6%) and utilities (+11.8%)sectors posted the strongest one-year results while financial sectorreturned a disappointing -15.3% over the period. In contrast to largecap, only three sectors of the Russell 2000 managed to post positiveresults for the year. Much like the Russell 1000, the defensiveconsumer staples (+9.1%) and utilities (+11.9%) sectors led theRussell 2000’s performance for the year.
Period Ended: September 30, 2011
11.8%
3.7%
3.4%
-15.3%
6.1%
10.6%
5.4%
-4.9%
-7.0%
7.0%
0.2%
-9.0%
-9.1%
-22.1%
-11.0%
-4.3%
-14.3%
-21.9%
-24.8%
-20.9%
-30.0% -25.0% -20.0% -15.0% -10.0% -5.0% 0.0% 5.0% 10.0% 15.0%
Utilities (4.1%)
Telecom Services (3.1%)
Info Technology (3.8%)
Financials (18.9%)
Health Care (10.4%)
Consumer Staples (12.1%)
Consumer Disc (14.2%)
Industrials (11.1%)
Materials (10.6%)
Energy (11.6%)
Russell 1000 Quarter 1-Year
11.9%
-2.0%
-4.8%
-6.4%
2.4%
9.1%
-5.8%
-6.2%
-8.1%
-2.7%
-3.3%
-27.5%
-24.7%
-17.7%
-19.3%
-11.3%
-22.7%
-24.2%
-28.3%
-32.5%
-40.0% -30.0% -20.0% -10.0% 0.0% 10.0%
Utilities (4.0%)
Telecom Services (1.0%)
Info Technology (4.5%)
Financials (17.2%)
Health Care (15.1%)
Consumer Staples (12.9%)
Consumer Disc (22.1%)
Industrials (6.2%)
Materials (3.8%)
Energy (13.1%)
Russell 2000 Quarter 1-Year
Page 5

The Market EnvironmentTop 10 Index Weights & Quarterly Performance for the Russell 1000 & 2000
Source: Thompson Financial
Period Ended: September 30, 2011
Top 10 Weighted Stocks Top 10 Weighted Stocks
Russell 1000 Symbol Weight Return Sector Russell 2000 Symbol Weight Return SectorExxon Mobil Corp XOM 2.93% -10.1% Energy Interdigital Inc IDCC 0.25% 14.3% Information TechnologyApple Inc AAPL 2.75% 13.6% Information Technology Mfa Financial Inc MFA 0.24% -9.9% FinancialsIBM IBM 1.64% 2.5% Information Technology Healthspring Inc HS 0.24% -20.9% Health CareChevron Corp CVX 1.57% -9.3% Energy Sothebys BID 0.23% -36.5% Consumer DiscretionaryMicrosoft Corp MSFT 1.52% -3.7% Information Technology Berry Petroleum Co BRY 0.23% -33.3% EnergyGeneral Electric Company GE 1.39% -18.4% Industrials Amer Campus Communities Inc ACC 0.23% 5.7% FinancialsJohnson & Johnson JNJ 1.39% -3.4% Health Care World Fuel Services Corp INT 0.23% -9.0% EnergyProcter & Gamble Co PG 1.37% 0.2% Consumer Staples Netlogic Microsystems Inc NETL 0.23% 19.0% Information TechnologyAT&T Inc T 1.36% -8.0% Telecomm Service Rosetta Resources Inc ROSE 0.23% -33.6% EnergyPfizer Inc PFE 1.16% -13.2% Health Care Mid Amer Apar Communities Inc MAA 0.22% -9.9% Financials
Top 10 Performing Stocks Top 10 Performing Stocks
Russell 1000 Symbol Weight Return Sector Russell 2000 Symbol Weight Return SectorMotorola Mobility Holdings Inc MMI 0.06% 71.4% Information Technology Harleysville Group Inc HGIC 0.03% 91.6% FinancialsPetrohawk Energy Corp HK 0.05% 56.9% Energy Apac Customer Services Inc APAC 0.02% 59.8% IndustrialsPharmasset Inc VRUS 0.04% 46.8% Health Care SFN Group Inc SFN 0.04% 54.0% IndustrialsEmdeon Inc EM 0.00% 43.2% Health Care Stamps.Com Inc STMP 0.02% 53.2% Information TechnologyAlexion Pharmaceuticals Inc ALXN 0.08% 36.2% Health Care Staar Surgical Co STAA 0.02% 47.2% Health CareGoodrich Corp GR 0.09% 26.8% Industrials Athenahealth Inc ATHN 0.18% 44.9% Health CareNalco Holding Co NLC 0.04% 25.9% Materials Global Industries Ltd GLBL 0.05% 44.5% EnergyBiomarin Pharmaceutical Inc BMRN 0.03% 17.1% Health Care FXCM Inc FXCM 0.02% 42.0% FinancialsNewmont Mining Corp NEM 0.23% 17.1% Materials Universal Display Corp PANL 0.14% 36.6% Information TechnologyKinetic Concepts Inc KCI 0.03% 14.3% Health Care Arch Chemicals Inc ARJ 0.10% 36.2% Materials
Bottom 10 Performing Stocks Bottom 10 Performing Stocks
Russell 1000 Symbol Weight Return Sector Russell 2000 Symbol Weight Return SectorDendreon Corp DNDN 0.02% -77.2% Health Care Ener1 Inc HEV 0.00% -87.5% IndustrialsTerex Corp TEX 0.02% -63.9% Industrials Pmi Group Inc PMI 0.01% -81.3% FinancialsAlpha Natural Resources Inc ANR 0.06% -61.1% Energy General Maritime Corp GMR 0.01% -80.7% EnergyManitowoc Co Inc MTW 0.01% -60.2% Industrials Eastman Kodak Co EK 0.06% -78.2% Consumer DiscretionaryAk Steel Holding Corp AKS 0.01% -58.3% Materials Motricity Inc MOTR 0.01% -78.1% Information TechnologySunpower Corp SPWRA 0.01% -58.1% Information Technology Broadwind Energy Inc BWEN 0.01% -77.9% IndustrialsNetflix Inc NFLX 0.09% -56.9% Consumer Discretionary Imperial Holdings Inc IFT 0.01% -76.4% FinancialsFirst Solar Inc FSLR 0.05% -52.2% Information Technology Gentiva Health Services Inc GTIV 0.03% -73.5% Health CareUnited States Steel Corp X 0.04% -52.1% Materials Pacific Biosciences Of Cal Inc PACB 0.02% -72.6% Health CareMonster Worldwide Inc MWW 0.01% -51.0% Information Technology Alliance Healthcare Services Inc AIQ 0.00% -70.0% Health Care
Page 6
The Market EnvironmentInternational and Regional Market Index Performance (Country Count)
Source: MSCI
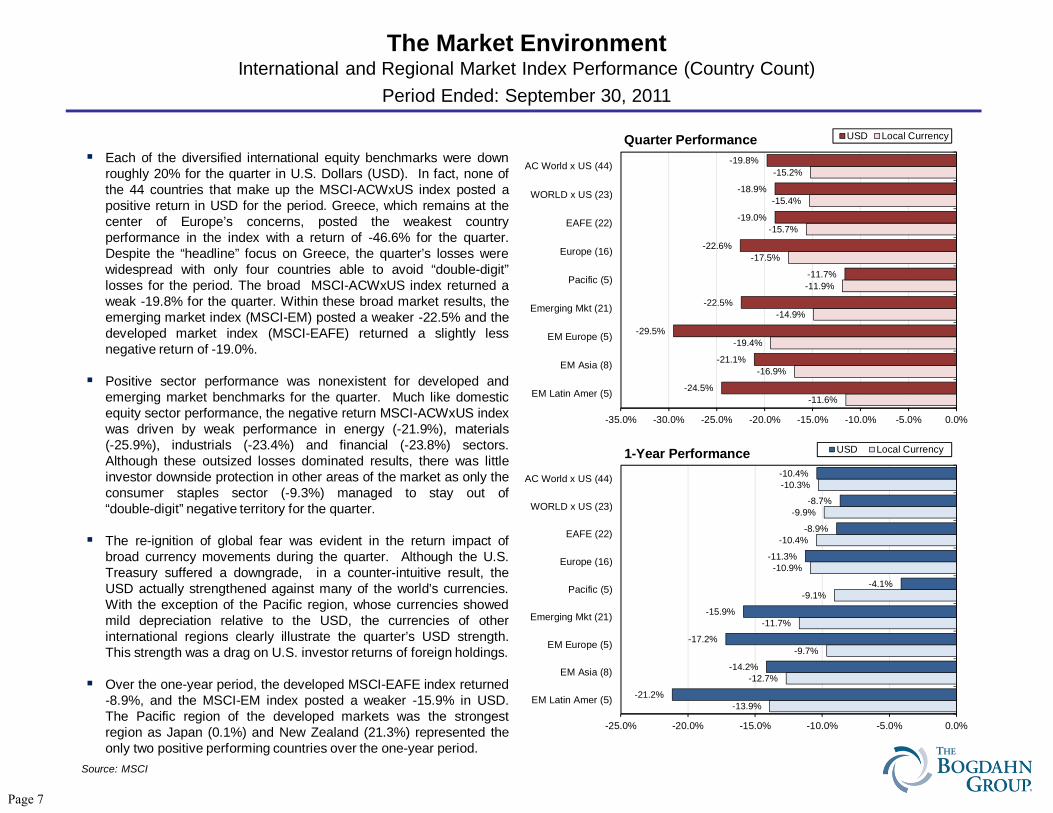
Each of the diversified international equity benchmarks were downroughly 20% for the quarter in U.S. Dollars (USD). In fact, none ofthe 44 countries that make up the MSCI-ACWxUS index posted apositive return in USD for the period. Greece, which remains at thecenter of Europe’s concerns, posted the weakest countryperformance in the index with a return of -46.6% for the quarter.Despite the “headline” focus on Greece, the quarter’s losses werewidespread with only four countries able to avoid “double-digit”losses for the period. The broad MSCI-ACWxUS index returned aweak -19.8% for the quarter. Within these broad market results, theemerging market index (MSCI-EM) posted a weaker -22.5% and thedeveloped market index (MSCI-EAFE) returned a slightly lessnegative return of -19.0%.
Positive sector performance was nonexistent for developed andemerging market benchmarks for the quarter. Much like domesticequity sector performance, the negative return MSCI-ACWxUS indexwas driven by weak performance in energy (-21.9%), materials(-25.9%), industrials (-23.4%) and financial (-23.8%) sectors.Although these outsized losses dominated results, there was littleinvestor downside protection in other areas of the market as only theconsumer staples sector (-9.3%) managed to stay out of“double-digit” negative territory for the quarter.
The re-ignition of global fear was evident in the return impact ofbroad currency movements during the quarter. Although the U.S.Treasury suffered a downgrade, in a counter-intuitive result, theUSD actually strengthened against many of the world’s currencies.With the exception of the Pacific region, whose currencies showedmild depreciation relative to the USD, the currencies of otherinternational regions clearly illustrate the quarter’s USD strength.This strength was a drag on U.S. investor returns of foreign holdings.
Over the one-year period, the developed MSCI-EAFE index returned-8.9%, and the MSCI-EM index posted a weaker -15.9% in USD.The Pacific region of the developed markets was the strongestregion as Japan (0.1%) and New Zealand (21.3%) represented theonly two positive performing countries over the one-year period.
Period Ended: September 30, 2011
-11.6%
-16.9%
-19.4%
-14.9%
-11.9%
-17.5%
-15.7%
-15.4%
-15.2%
-24.5%
-21.1%
-29.5%
-22.5%
-11.7%
-22.6%
-19.0%
-18.9%
-19.8%
-35.0% -30.0% -25.0% -20.0% -15.0% -10.0% -5.0% 0.0%
EM Latin Amer (5)
EM Asia (8)
EM Europe (5)
Emerging Mkt (21)
Pacific (5)
Europe (16)
EAFE (22)
WORLD x US (23)
AC World x US (44)
Quarter Performance USD Local Currency
-13.9%
-12.7%
-9.7%
-11.7%
-9.1%
-10.9%
-10.4%
-9.9%
-10.3%
-21.2%
-14.2%
-17.2%
-15.9%
-4.1%
-11.3%
-8.9%
-8.7%
-10.4%
-25.0% -20.0% -15.0% -10.0% -5.0% 0.0%
EM Latin Amer (5)
EM Asia (8)
EM Europe (5)
Emerging Mkt (21)
Pacific (5)
Europe (16)
EAFE (22)
WORLD x US (23)
AC World x US (44)
1-Year Performance USD Local Currency
Page 7

The Market EnvironmentU.S. Dollar International Index Attribution & Country Detail
Source: MSCI
Period Ended: September 30, 2011MSCI - EAFE Sector Weight Quarter Return 1-Year ReturnEnergy 8.2% -18.1% -2.7%Materials 10.0% -27.9% -12.4%Industrials 12.3% -22.1% -9.4%Consumer Discretionary 10.2% -20.0% -7.4%Consumer Staples 11.4% -8.6% 2.6%Health Care 9.7% -9.7% 3.2%Financials 22.1% -24.1% -19.8%Information Technology 5.0% -15.5% -8.2%Telecommunication Services 6.2% -11.3% -0.8%Utilities 4.9% -14.0% -12.2%Total 100.0% -19.0% -8.9%
MSCI - ACWIxUS Sector Weight Quarter Return 1-Year ReturnEnergy 10.9% -21.9% -8.1%Materials 11.9% -25.9% -13.7%Industrials 10.4% -23.4% -12.0%Consumer Discretionary 9.2% -20.0% -7.2%Consumer Staples 9.8% -9.3% 1.5%Health Care 7.0% -10.3% 2.7%Financials 23.4% -23.8% -19.0%Information Technology 6.5% -16.2% -9.8%Telecommunication Services 6.6% -10.7% -1.4%Utilities 4.3% -15.8% -13.2%Total 100.0% -19.8% -10.4%
MSCI - Emerging Mkt Sector Weight Quarter Return 1-Year ReturnEnergy 13.8% -25.8% -14.7%Materials 13.9% -27.1% -19.4%Industrials 6.6% -29.1% -25.4%Consumer Discretionary 8.1% -19.2% -5.3%Consumer Staples 7.5% -12.8% -3.7%Health Care 1.1% -17.6% -15.8%Financials 23.7% -25.9% -23.6%Information Technology 12.9% -16.6% -9.7%Telecommunication Services 8.8% -9.8% -3.7%Utilities 3.5% -24.2% -19.8%Total 100.0% -22.5% -15.9%
MSCI-EAFE MSCI-ACWIxUS Quarter 1- YearCountry Weight Weight Return ReturnJapan 23.1% 15.9% -6.4% 0.1%United Kingdom 22.2% 15.2% -15.4% -5.3%France 9.1% 6.2% -29.8% -16.8%Switzerland 8.6% 5.9% -17.5% -3.0%Australia 8.4% 5.8% -20.1% -8.9%Germany 7.7% 5.3% -31.0% -13.0%Spain 3.5% 2.4% -22.1% -17.1%Sweden 2.9% 2.0% -26.6% -16.2%Hong Kong 2.7% 1.9% -19.9% -17.2%Netherlands 2.4% 1.7% -21.8% -15.6%Italy 2.3% 1.6% -31.0% -24.7%Singapore 1.7% 1.2% -18.2% -11.4%Denmark 1.0% 0.7% -24.1% -16.7%Belgium 1.0% 0.7% -19.1% -15.1%Finland 0.9% 0.6% -26.1% -25.5%Norway 0.9% 0.6% -21.6% -7.3%Israel 0.7% 0.5% -25.4% -27.6%Austria 0.3% 0.2% -37.7% -24.6%Ireland 0.3% 0.2% -20.6% -0.6%Portugal 0.3% 0.2% -22.0% -14.4%Greece 0.2% 0.1% -46.6% -53.7%New Zealand 0.1% 0.1% -6.5% 21.3%Total EAFE Countries 100.0% 68.8% -19.0% -8.9%Canada 8.2% -18.8% -6.2%Total Developed Countries 77.0% -18.9% -8.7%China 3.9% -25.2% -23.9%Korea 3.4% -23.3% -6.0%Brazil 3.4% -26.9% -25.5%Taiwan 2.6% -17.7% -5.9%South Africa 1.8% -16.8% -9.5%India 1.7% -19.9% -25.1%Russia 1.5% -31.0% -11.5%Mexico 1.1% -19.7% -6.3%Malaysia 0.8% -17.0% -5.5%Indonesia 0.7% -11.0% 0.0%Thailand 0.4% -14.3% -7.3%Chile 0.4% -26.2% -21.7%Poland 0.4% -32.6% -21.6%Turkey 0.4% -15.6% -29.1%Colombia 0.2% -12.5% -11.9%Philippines 0.2% -6.9% -9.8%Peru 0.1% -4.7% -18.1%Czech Republic 0.1% -21.7% -6.5%Egypt 0.1% -20.7% -36.9%Hungary 0.1% -44.4% -38.4%Morocco 0.0% -9.2% -1.5%Total Emerging Countries 23.0% -22.5% -15.9%Total ACWIxUS Countries 100.0% -19.8% -10.4%
Page 8

The Market EnvironmentDomestic Bond Sector & Broad/Global Bond Market Performance
Source: Barclays Capital Live
The Merrill Lynch index data that has been historically used tocompose the fixed income sector charts has been replaced with dataprovided by Barclays Capital. We made this change in order toimprove the consistency of the dataset used in the MarketEnvironment section of the performance book. Given the similaritiesin the structure of these benchmarks, this change will not materiallyimpact any interpretation of results.
With the exception of non-investment grade debt (high yield),domestic broad fixed income results were positive during the quarter.The Barclays Aggregate bond index posted a return of 3.8%. Withinthe broad benchmark’s segments, the Treasury (6.5%), mortgage(2.4%) and corporate (2.9%) portions of the index all contributed tothe broad market performance. The dominant Treasury return wasaided by a general “flight to safety” on global fears as well as theanticipation of additional monetary stimulus by the Fed. Treasuryinflation protected securities (TIPS) were also a beneficiary of fallingrates during the quarter with a return of 4.5%. The quarter’spreference for quality is also clearly evident in the scaled creditbenchmark results. High quality AAA issues returned 4.2%, lowerquality Baa issues returned 2.2%, and high yield issues posted areturn of -6.1%. Outside of the U.S. market, the Barclays GlobalAggregate xUS benchmark posted a return of -0.7% for the quarterin USD. This global bond index number was also negativelyimpacted by the strength in the USD as the equivalent hedged indexreturned +2.6% for the quarter.
The trailing one-year returns were solid for the various broad andsector-based fixed income indices. Much like the quarter, one-yearfixed income results were dominated by the performance of Treasury(6.0%) and TIPS (9.9%) securities. Corporate credit results werealso strong over the year with all investment grade credits returningin excess of 4.0% for the period. The advantage of longer-durationportfolios in the trailing year’s falling interest rate environment isevident in the 110 basis point return differential between theBarclays Aggregate and the Barclays Intermediate Aggregatebenchmarks.
Period Ended: September 30, 2011
-0.7%
2.3%
3.8%
4.5%
2.9%
2.4%
6.5%
-6.1%
2.2%
2.9%
3.3%
4.2%
-8.0% -6.0% -4.0% -2.0% 0.0% 2.0% 4.0% 6.0% 8.0%
Global Agg x US
Intermediate Agg
Aggregate
TIPS
Corporate
Mortgage
Treasury
High Yield
Baa
A
AA
AAA
Quarter Performance
3.3%
4.2%
5.3%
9.9%
4.4%
5.6%
6.0%
1.8%
4.9%
4.4%
4.5%
5.5%
0.0% 2.0% 4.0% 6.0% 8.0% 10.0% 12.0%
Global Agg x US
Intermediate Agg
Aggregate
TIPS
Corporate
Mortgage
Treasury
High Yield
Baa
A
AA
AAA
1-Year Performance
AAA, AA, A, Baa, Treasury, Mortgage & Corporate benchmarks are sub-components of the Barclays Aggregate Index.
Page 9
The Market EnvironmentMarket Rate & Yield Curve Comparison
Source: Mortgage-X.com, US Department of Treasury & St. Louis Fed
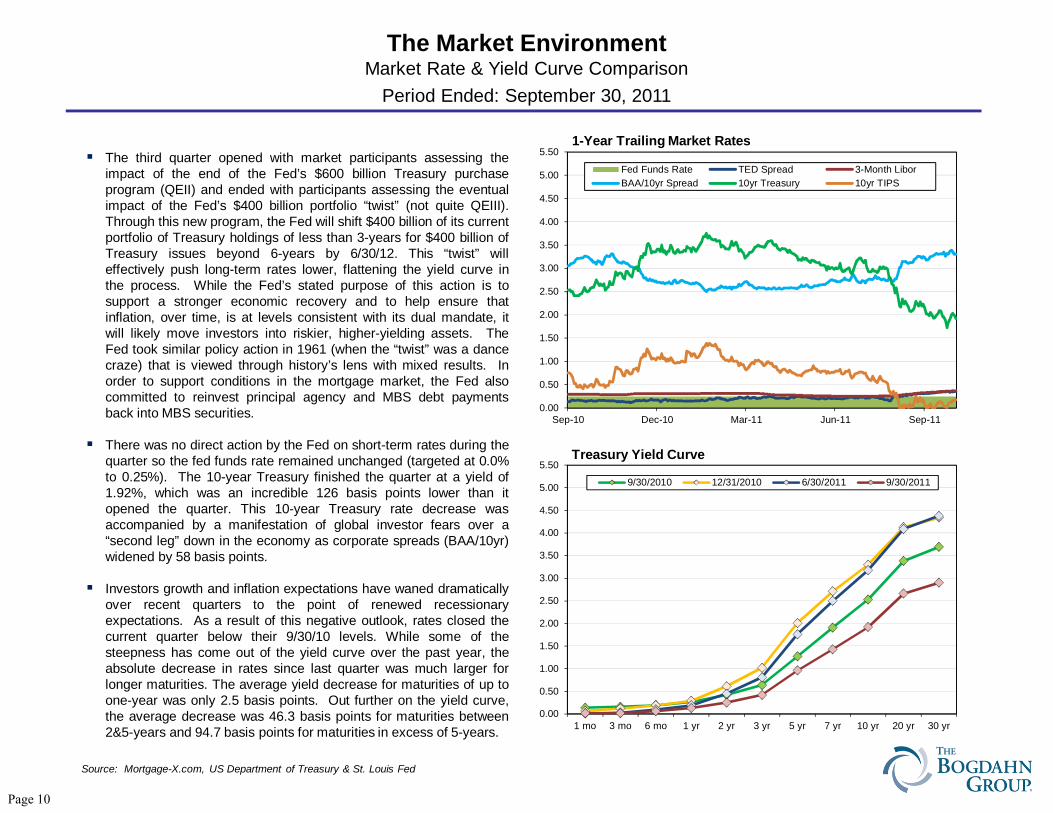
The third quarter opened with market participants assessing theimpact of the end of the Fed’s $600 billion Treasury purchaseprogram (QEII) and ended with participants assessing the eventualimpact of the Fed’s $400 billion portfolio “twist” (not quite QEIII).Through this new program, the Fed will shift $400 billion of its currentportfolio of Treasury holdings of less than 3-years for $400 billion ofTreasury issues beyond 6-years by 6/30/12. This “twist” willeffectively push long-term rates lower, flattening the yield curve inthe process. While the Fed’s stated purpose of this action is tosupport a stronger economic recovery and to help ensure thatinflation, over time, is at levels consistent with its dual mandate, itwill likely move investors into riskier, higher-yielding assets. TheFed took similar policy action in 1961 (when the “twist” was a dancecraze) that is viewed through history’s lens with mixed results. Inorder to support conditions in the mortgage market, the Fed alsocommitted to reinvest principal agency and MBS debt paymentsback into MBS securities.
There was no direct action by the Fed on short-term rates during thequarter so the fed funds rate remained unchanged (targeted at 0.0%to 0.25%). The 10-year Treasury finished the quarter at a yield of1.92%, which was an incredible 126 basis points lower than itopened the quarter. This 10-year Treasury rate decrease wasaccompanied by a manifestation of global investor fears over a“second leg” down in the economy as corporate spreads (BAA/10yr)widened by 58 basis points.
Investors growth and inflation expectations have waned dramaticallyover recent quarters to the point of renewed recessionaryexpectations. As a result of this negative outlook, rates closed thecurrent quarter below their 9/30/10 levels. While some of thesteepness has come out of the yield curve over the past year, theabsolute decrease in rates since last quarter was much larger forlonger maturities. The average yield decrease for maturities of up toone-year was only 2.5 basis points. Out further on the yield curve,the average decrease was 46.3 basis points for maturities between2&5-years and 94.7 basis points for maturities in excess of 5-years.
Period Ended: September 30, 2011
0.00
0.50
1.00
1.50
2.00
2.50
3.00
3.50
4.00
4.50
5.00
5.50
1 mo 3 mo 6 mo 1 yr 2 yr 3 yr 5 yr 7 yr 10 yr 20 yr 30 yr
Treasury Yield Curve
9/30/2010 12/31/2010 6/30/2011 9/30/2011
0.00
0.50
1.00
1.50
2.00
2.50
3.00
3.50
4.00
4.50
5.00
5.50
Sep-10 Dec-10 Mar-11 Jun-11 Sep-11
1-Year Trailing Market Rates
Fed Funds Rate TED Spread 3-Month LiborBAA/10yr Spread 10yr Treasury 10yr TIPS
Page 10

1,100
1,150
1,200
1,250
1,300
1,350
06/30 07/5 07/10 07/15 07/20 07/25 07/30 08/4 08/9 08/14 08/19 08/24 08/29 09/3 09/8 09/13 09/18 09/23 09/28
*S&P 500 3rd Quarter Total Return -13.87%
3rd Quarter by the Numbers 189.22 Cumulative Point Decline (-14.33%*)64 Trading Days33 Negative Days33 +/- 1% (51.6%)19 +/- 2.0% (29.7%)6 +/- 4.0% (9.4%)
Worst Day 8/8/11 -79.92 points (-6.66%)Best Day 8/9/11 + 53.07 points (+4.74%)
Open
Close
High
Low
Up Day
Close
Open
High
Low
Down Day
6/30/111,320.64
9/30/111,131.42
S&P 500 Price Index Level
The Market EnvironmentThe 3rd Quarter Domestic Equity Market at a Glance
Daily High/Low/Open/Close for the S&P 500 Price Index Through 9/30/11
September -7.03%August -5.43%July -2.03%Total Return
8/31
7/29
Page 11

The Market EnvironmentHow are you doing? How are we doing?
The 2011 Bogdahn Client Survey
Select one choice
Very Poor Poor Average Good Excellent
In an effort to better serve your needs, The Bogdahn Group isconducting its first client survey. The insights gathered from thisshort electronic study will be used to direct the allocation of firmresources as well as to enhance the effectiveness of our clientservice and communication.
If you do not receive an individual e-mail from the surveycompany, please participate by directing your browser tohttps://www.surveymonkey.com/s/BogdahnGroupClientSurvey.
We sincerely appreciate your participation. All responses will bekept strictly confidential.
1. Please rate your satisfaction with the structure and clarity of ourperformance report.
2. Please rate your satisfaction with the level of detail in ourperformance report.
3. Please rate your consultant’s ability to effectively communicate theinformation in the performance report.
4. Please rate your consultant’s ability to effectively communicateinvestment insights beyond those in the performance report.
5. Please rate the effort of your consultant to offer suggestions and/orsolutions to enhance your portfolio.
6. Please rate the outcomes of your consultant’s suggestions and/orinvestment solutions.
7. Please rate your consultant’s level of understanding of yourPlan/Fund’s unique needs.
8. Please rate the timeliness of your consultant’s responses to regularinquiries. (Our firm policy is to reply to all inquiries within 24 hours).
9. Please rate the detail provided in your consultant’s follow up toinquiries.
10. Please rate your overall satisfaction with The Bogdahn Group’sservices.10
9
8
7
6
5
4
3
2
1
The Bogdahn Client Survey link will be live through December 20, 2011.
Page 12

Total Fund Compliance: Yes No N/A
Equity Compliance: Yes No N/A
Fixed Income Compliance: Yes No N/A
Yes No N/A Yes No N/A Yes No N/A Yes No N/A Yes No N/AManager Compliance:
Lakeland Police Officers' Retirement System
Compliance Checklist as of September 30, 2011
The Total Plan return equaled or exceeded the 8% actuarial earnings assumption over the trailing three and five year periods.1. ✔
The Total Plan return equaled or exceeded the total plan benchmark over the trailing three and five year periods.2. ✔
The Total Plan return ranked within the top 40th percentile of its peer group over the trailing three and five year periods.3. ✔
Total domestic equity returns meet or exceed the benchmark over the trailing three and five year periods.1. ✔
Total domestic equity returns ranked within the top 40th percentile of its peer group over the trailing three and five year periods.2. ✔
The total equity allocation was less than 70% of the total plan assets at market. ✔3.Total foreign equity was less than 25% of the total plan assets at market. ✔4.
Total fixed income returns meet or exceed the benchmark over the trailing three and five year periods.1. ✔
Total fixed income returns ranked within the top 40th percentile of its peer group over the trailing three and five year periods.2. ✔
The average quality of the fixed portfolio was A or better. ✔3.No more than 15% of the fixed income portfolio was rated below BBB/Baa. ✔4.85% of all non government fixed income securities shall hold a rating in one of the four highest classifications of a major rating service. ✔5.Only 3 years used when 5 years is unavailable. Some managers do not have 3 years worth of history and are marked "N/A"
Manager outperformed the index over the trailing three and five year periods. ✔
Manager ranked within the top 40th percentile over trailing three and five year periods. ✔
Less than 4 consecutive quarters of under-performance relative to the benchmark. ✔
Three and five year down market capture ratio less than 100% ✔
Manager reports compliance with PFIA. ✔
✔
✔
✔
✔
✔
✔
✔
✔
✔
✔
✔
✔
✔
✔
✔
✔
✔
✔
✔
✔
Cornerstone Westwood
1.2.3.4.5.
Bowen, H. Sawgrass Baring
Page 13
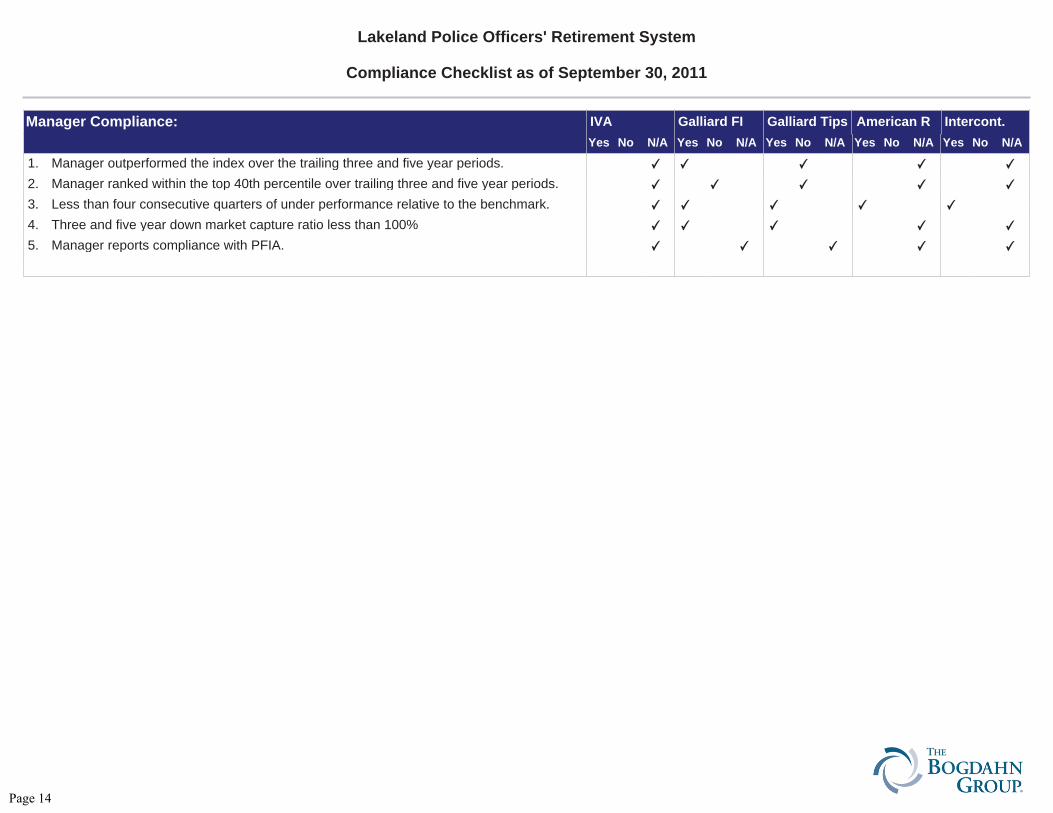
Yes No N/A Yes No N/A Yes No N/A Yes No N/A Yes No N/AManager Compliance:
Lakeland Police Officers' Retirement System
Compliance Checklist as of September 30, 2011
Manager outperformed the index over the trailing three and five year periods. ✔
Manager ranked within the top 40th percentile over trailing three and five year periods. ✔
Less than four consecutive quarters of under performance relative to the benchmark. ✔
Three and five year down market capture ratio less than 100% ✔
Manager reports compliance with PFIA. ✔
✔
✔
✔
✔
✔
✔
✔
✔
✔
✔
✔
✔
✔
✔
✔
✔
✔
✔
✔
✔
IVA Galliard FI
1.2.3.4.5.
Galliard Tips American R Intercont.
Page 14

Asset Allocation By Style - Current QuarterAsset Allocation By Style as of Jun - 2011
September 30, 2011 : $78,273,081
SegmentsMarket Value
($)Allocation
(%)
¢ Domestic Equity 34,620,166 44.2
¢ International Equity 11,793,052 15.1
¢ Domestic Fixed Income 21,151,344 27.0
¢ Global Fixed Income 3,939,864 5.0
¢ Real Estate 3,284,543 4.2
¢ Cash Equivalent 3,484,112 4.5
June 30, 2011 : $86,378,543
SegmentsMarket Value
($)Allocation
(%)
¢ Domestic Equity 40,857,919 47.3
¢ International Equity 13,449,083 15.6
¢ Domestic Fixed Income 21,281,549 24.6
¢ Global Fixed Income 4,275,851 5.0
¢ Real Estate 3,224,071 3.7
¢ Cash Equivalent 3,290,070 3.8
Lakeland Police Officers' Retirement SystemSeptember 30, 2011
Page 15
Allocation Differences
0.0% 2.0% 4.0% 6.0% 8.0% 10.0%-2.0 %-4.0 %-6.0 %-8.0 %-10.0 %
Mutual Fund Cash
Receipt & Disbursement
Intercontinental Real Estate
American Realty
Templeton Global Return
Galliard TIPS
Galliard Fixed Income
IVA International
Baring International
Sawgrass Large Growth
Bowen Hanes Large Core
Westwood All Cap Value
Cornerstone Large Value
0.0%
0.8%
0.5%
-1.3 %
0.0%
-3.4 %
2.7%
-0.3 %
0.4%
0.7%
-0.5 %
0.1%
0.3%
Market Value($)
Allocation(%)
Target(%)
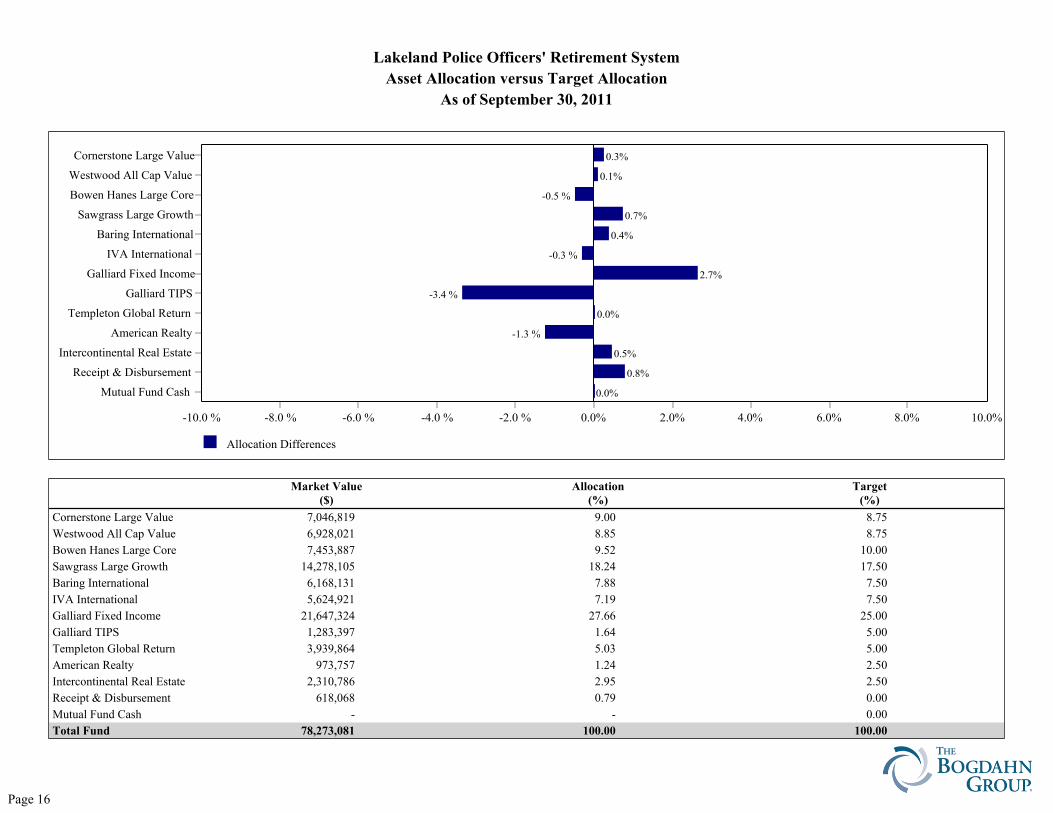
Cornerstone Large Value 7,046,819 9.00 8.75
Westwood All Cap Value 6,928,021 8.85 8.75
Bowen Hanes Large Core 7,453,887 9.52 10.00
Sawgrass Large Growth 14,278,105 18.24 17.50
Baring International 6,168,131 7.88 7.50
IVA International 5,624,921 7.19 7.50
Galliard Fixed Income 21,647,324 27.66 25.00
Galliard TIPS 1,283,397 1.64 5.00
Templeton Global Return 3,939,864 5.03 5.00
American Realty 973,757 1.24 2.50
Intercontinental Real Estate 2,310,786 2.95 2.50
Receipt & Disbursement 618,068 0.79 0.00
Mutual Fund Cash - - 0.00
Total Fund 78,273,081 100.00 100.00
Lakeland Police Officers' Retirement System
Asset Allocation versus Target Allocation
As of September 30, 2011
None
Page 16
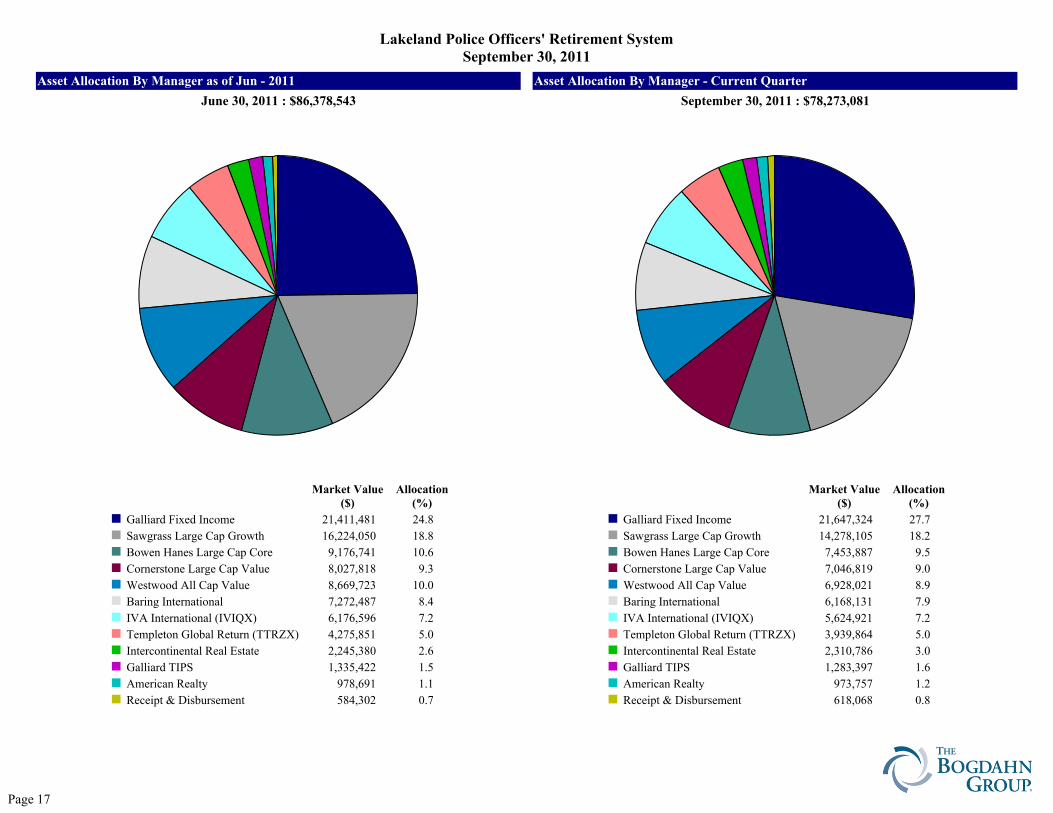
Asset Allocation By Manager as of Jun - 2011 Asset Allocation By Manager - Current Quarter
September 30, 2011 : $78,273,081
Market Value($)
Allocation(%)
¢ Galliard Fixed Income 21,647,324 27.7
¢ Sawgrass Large Cap Growth 14,278,105 18.2
¢ Bowen Hanes Large Cap Core 7,453,887 9.5
¢ Cornerstone Large Cap Value 7,046,819 9.0
¢ Westwood All Cap Value 6,928,021 8.9
¢ Baring International 6,168,131 7.9
¢ IVA International (IVIQX) 5,624,921 7.2
¢ Templeton Global Return (TTRZX) 3,939,864 5.0
¢ Intercontinental Real Estate 2,310,786 3.0
¢ Galliard TIPS 1,283,397 1.6
¢ American Realty 973,757 1.2
¢ Receipt & Disbursement 618,068 0.8
June 30, 2011 : $86,378,543
Market Value($)
Allocation(%)
¢ Galliard Fixed Income 21,411,481 24.8
¢ Sawgrass Large Cap Growth 16,224,050 18.8
¢ Bowen Hanes Large Cap Core 9,176,741 10.6
¢ Cornerstone Large Cap Value 8,027,818 9.3
¢ Westwood All Cap Value 8,669,723 10.0
¢ Baring International 7,272,487 8.4
¢ IVA International (IVIQX) 6,176,596 7.2
¢ Templeton Global Return (TTRZX) 4,275,851 5.0
¢ Intercontinental Real Estate 2,245,380 2.6
¢ Galliard TIPS 1,335,422 1.5
¢ American Realty 978,691 1.1
¢ Receipt & Disbursement 584,302 0.7
Lakeland Police Officers' Retirement SystemSeptember 30, 2011
Page 17

Sep-2011 Jun-2011 Mar-2011 Dec-2010 Sep-2010
($) % ($) % ($) % ($) % ($) %
Total Fund 78,273,081 100.00 86,378,543 100.00 85,262,758 100.00 82,956,153 100.00 79,609,546 100.00
Total Equity 47,499,885 60.68 55,547,415 64.31 55,773,228 65.41 53,711,229 64.75 50,176,152 63.03
Total Domestic Equity 35,706,833 45.62 42,098,332 48.74 42,627,886 50.00 40,959,086 49.37 38,073,887 47.83
Cornerstone Large Cap Value 7,046,819 9.00 8,027,818 9.29 8,574,620 10.06 8,304,820 10.01 7,754,868 9.74
Westwood All Cap Value 6,928,021 8.85 8,669,723 10.04 8,743,338 10.25 8,143,639 9.82 7,340,083 9.22
Bowen Hanes Large Cap Core 7,453,887 9.52 9,176,741 10.62 9,494,685 11.14 8,953,043 10.79 8,216,888 10.32
Sawgrass Large Cap Growth 14,278,105 18.24 16,224,050 18.78 15,815,244 18.55 15,557,584 18.75 14,762,047 18.54
Total International Equity 11,793,052 15.07 13,449,083 15.57 13,145,342 15.42 12,752,142 15.37 12,102,265 15.20
Baring International 6,168,131 7.88 7,272,487 8.42 7,131,003 8.36 6,936,118 8.36 12,102,265 15.20
IVA International (IVIQX) 5,624,921 7.19 6,176,596 7.15 6,014,339 7.05 5,816,024 7.01 - 0.00
Total Fixed Income 26,870,585 34.33 27,022,755 31.28 26,045,791 30.55 26,029,202 31.38 28,664,266 36.01
Total Domestic Fixed Income 22,930,721 29.30 22,746,904 26.33 25,542,417 29.96 26,029,202 31.38 28,664,266 36.01
Galliard Fixed Income 21,647,324 27.66 21,411,481 24.79 24,168,019 28.35 24,654,954 29.72 27,197,445 34.16
Galliard TIPS 1,283,397 1.64 1,335,422 1.55 1,374,399 1.61 1,374,248 1.66 1,466,821 1.84
Total Global Fixed Income 3,939,864 5.03 4,275,851 4.95 503,373 0.59 - 0.00 - 0.00
Templeton Global Return (TTRZX) 3,939,864 5.03 4,275,851 4.95 503,373 0.59 - 0.00 - 0.00
Total Real Estate 3,284,543 4.20 3,224,071 3.73 3,021,131 3.54 2,429,240 2.93 329,392 0.41
American Realty 973,757 1.24 978,691 1.13 843,432 0.99 338,501 0.41 329,392 0.41
Intercontinental Real Estate 2,310,786 2.95 2,245,380 2.60 2,177,699 2.55 2,090,739 2.52 - 0.00
Cash Accounts
Receipt & Disbursement 618,068 0.79 584,302 0.68 422,603 0.50 786,479 0.95 439,737 0.55
Mutual Fund Cash - 0.00 - 0.00 4 0.00 4 0.00 - 0.00
Lakeland Police Officers' Retirement System
Asset Allocation History by Portfolio
As of September 30, 2011
None
Page 18
Market ValueAs of
07/01/2011
NetTransfers
Contributions Distributions Fees ExpensesReturn OnInvestment
Market ValueAs of
09/30/2011
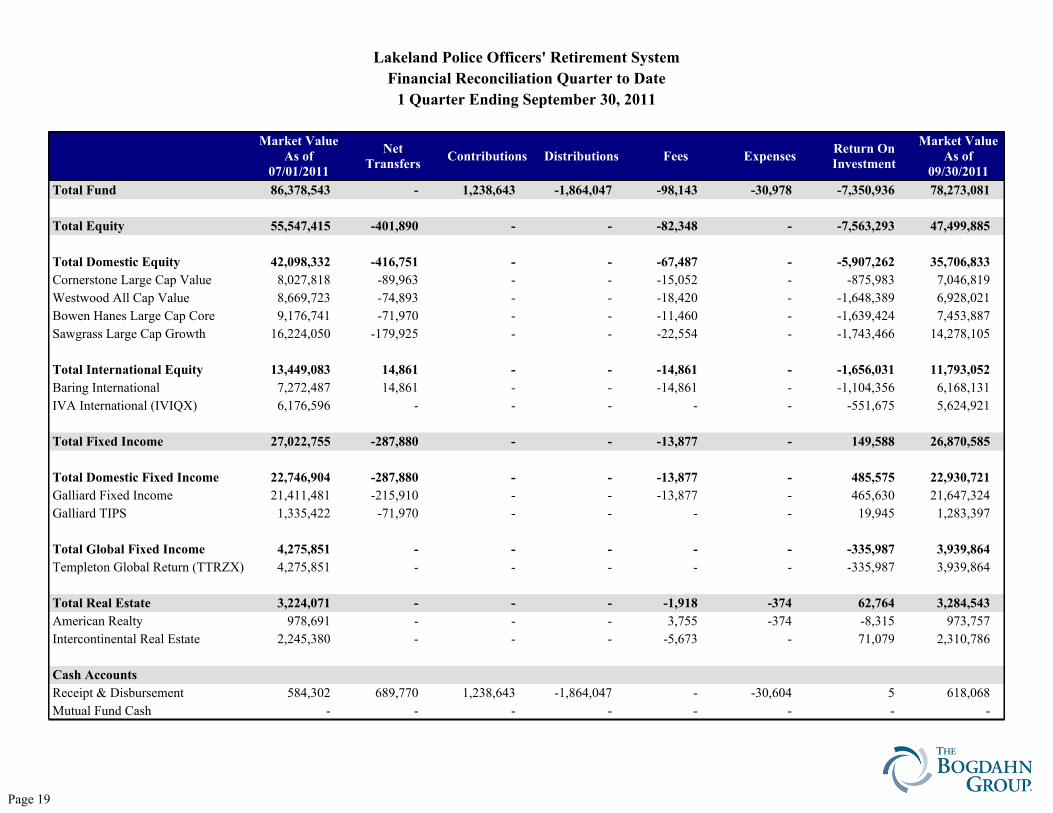
Total Fund 86,378,543 - 1,238,643 -1,864,047 -98,143 -30,978 -7,350,936 78,273,081
Total Equity 55,547,415 -401,890 - - -82,348 - -7,563,293 47,499,885
Total Domestic Equity 42,098,332 -416,751 - - -67,487 - -5,907,262 35,706,833
Cornerstone Large Cap Value 8,027,818 -89,963 - - -15,052 - -875,983 7,046,819
Westwood All Cap Value 8,669,723 -74,893 - - -18,420 - -1,648,389 6,928,021
Bowen Hanes Large Cap Core 9,176,741 -71,970 - - -11,460 - -1,639,424 7,453,887
Sawgrass Large Cap Growth 16,224,050 -179,925 - - -22,554 - -1,743,466 14,278,105
Total International Equity 13,449,083 14,861 - - -14,861 - -1,656,031 11,793,052
Baring International 7,272,487 14,861 - - -14,861 - -1,104,356 6,168,131
IVA International (IVIQX) 6,176,596 - - - - - -551,675 5,624,921
Total Fixed Income 27,022,755 -287,880 - - -13,877 - 149,588 26,870,585
Total Domestic Fixed Income 22,746,904 -287,880 - - -13,877 - 485,575 22,930,721
Galliard Fixed Income 21,411,481 -215,910 - - -13,877 - 465,630 21,647,324
Galliard TIPS 1,335,422 -71,970 - - - - 19,945 1,283,397
Total Global Fixed Income 4,275,851 - - - - - -335,987 3,939,864
Templeton Global Return (TTRZX) 4,275,851 - - - - - -335,987 3,939,864
Total Real Estate 3,224,071 - - - -1,918 -374 62,764 3,284,543
American Realty 978,691 - - - 3,755 -374 -8,315 973,757
Intercontinental Real Estate 2,245,380 - - - -5,673 - 71,079 2,310,786
Cash Accounts
Receipt & Disbursement 584,302 689,770 1,238,643 -1,864,047 - -30,604 5 618,068
Mutual Fund Cash - - - - - - - -
Lakeland Police Officers' Retirement System
Financial Reconciliation Quarter to Date
1 Quarter Ending September 30, 2011
None
Page 19
Market ValueAs of
10/01/2010
NetTransfers
Contributions Distributions Fees ExpensesReturn OnInvestment
Market ValueAs of
09/30/2011
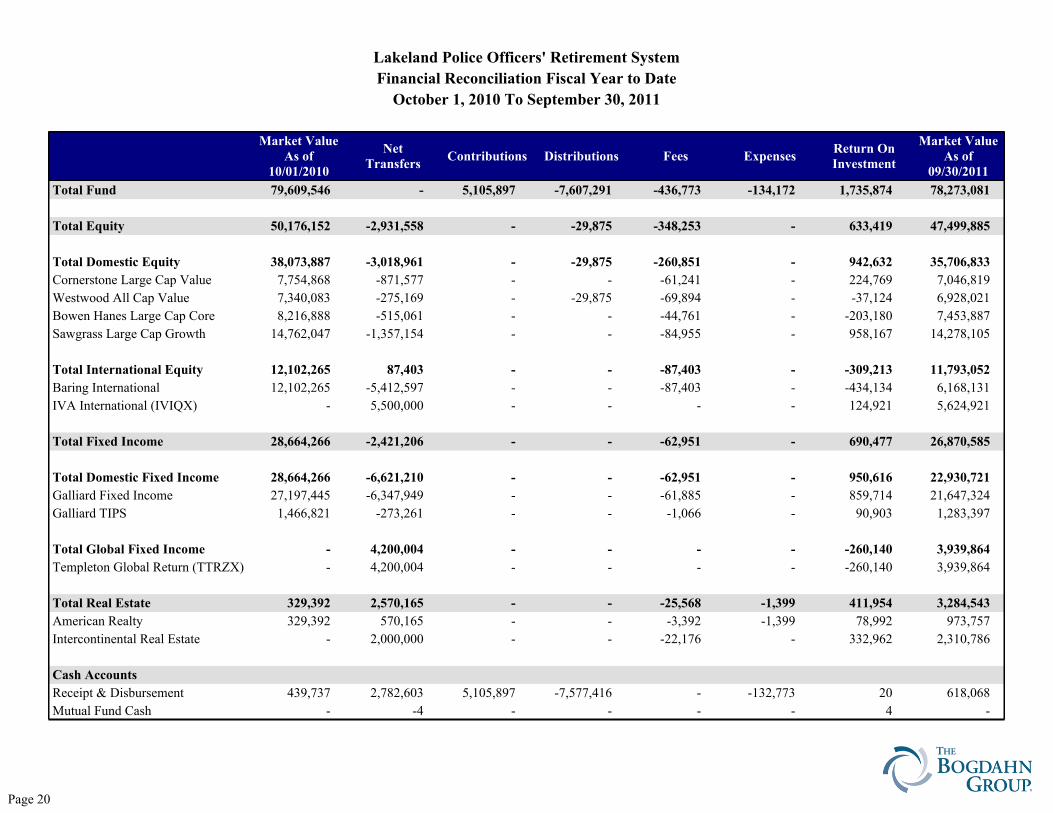
Total Fund 79,609,546 - 5,105,897 -7,607,291 -436,773 -134,172 1,735,874 78,273,081
Total Equity 50,176,152 -2,931,558 - -29,875 -348,253 - 633,419 47,499,885
Total Domestic Equity 38,073,887 -3,018,961 - -29,875 -260,851 - 942,632 35,706,833
Cornerstone Large Cap Value 7,754,868 -871,577 - - -61,241 - 224,769 7,046,819
Westwood All Cap Value 7,340,083 -275,169 - -29,875 -69,894 - -37,124 6,928,021
Bowen Hanes Large Cap Core 8,216,888 -515,061 - - -44,761 - -203,180 7,453,887
Sawgrass Large Cap Growth 14,762,047 -1,357,154 - - -84,955 - 958,167 14,278,105
Total International Equity 12,102,265 87,403 - - -87,403 - -309,213 11,793,052
Baring International 12,102,265 -5,412,597 - - -87,403 - -434,134 6,168,131
IVA International (IVIQX) - 5,500,000 - - - - 124,921 5,624,921
Total Fixed Income 28,664,266 -2,421,206 - - -62,951 - 690,477 26,870,585
Total Domestic Fixed Income 28,664,266 -6,621,210 - - -62,951 - 950,616 22,930,721
Galliard Fixed Income 27,197,445 -6,347,949 - - -61,885 - 859,714 21,647,324
Galliard TIPS 1,466,821 -273,261 - - -1,066 - 90,903 1,283,397
Total Global Fixed Income - 4,200,004 - - - - -260,140 3,939,864
Templeton Global Return (TTRZX) - 4,200,004 - - - - -260,140 3,939,864
Total Real Estate 329,392 2,570,165 - - -25,568 -1,399 411,954 3,284,543
American Realty 329,392 570,165 - - -3,392 -1,399 78,992 973,757
Intercontinental Real Estate - 2,000,000 - - -22,176 - 332,962 2,310,786
Cash Accounts
Receipt & Disbursement 439,737 2,782,603 5,105,897 -7,577,416 - -132,773 20 618,068
Mutual Fund Cash - -4 - - - - 4 -
Lakeland Police Officers' Retirement System
Financial Reconciliation Fiscal Year to Date
October 1, 2010 To September 30, 2011
None
Page 20

1Quarter
Oct-2010To
Sep-2011
1Year
3Years
5Years
SinceInception
InceptionDate
Total Fund (Net) -8.70 1.46 1.46 3.23 1.78 3.66 04/01/2004
Total Fund Policy -9.04 1.51 1.51 4.18 2.20 3.99
Difference 0.34 -0.05 -0.05 -0.95 -0.42 -0.33
Total Fund (Gross) -8.59 (22) 1.99 (19) 1.99 (19) 3.60 (59) 2.03 (51) 3.83 (54) 04/01/2004
Total Fund Policy -9.04 (30) 1.51 (25) 1.51 (25) 4.18 (40) 2.20 (42) 3.99 (48)
Difference 0.45 0.48 0.48 -0.58 -0.17 -0.16
All Public Plans-Total Fund Median -10.23 0.34 0.34 3.87 2.03 3.97
Total Equity -13.69 0.60 0.60 0.27 N/A -6.18 01/01/2008
Total Equity Policy -16.41 -2.27 -2.27 0.81 -1.41 -5.28
Difference 2.72 2.87 2.87 -0.54 N/A -0.90
Total Fixed Income 0.54 2.59 2.59 6.63 6.18 4.95 04/01/2004
Total Fixed Income Policy 2.30 4.22 4.22 6.98 6.14 4.79
Difference -1.76 -1.63 -1.63 -0.35 0.04 0.16
Total Real Estate 1.95 15.54 15.54 N/A N/A 15.54 10/01/2010
NCREIF ODCE 3.58 18.34 18.34 -6.38 0.02 18.34
Difference -1.63 -2.80 -2.80 N/A N/A -2.80
Lakeland Police Officers' Retirement System
Comparative Performance Trailing Returns
As of September 30, 2011
None
Returns for periods greater than one year are annualized.Current Total Fund Policy= 45% Russell 3000, 15% MSCI ACWI ex US, 30% Barclays Intermediate Aggregate, 5% Barclays US TIPs, 5% NCREIF ODCE.Current Total Equity Policy= 75% Russell 3000, & 25% MSCI ACWI ex US. Current Bowen Policy= 100% Russell 3000.
Page 21

Lakeland Police Officers' Retirement System
Comparative Performance Trailing Returns
As of September 30, 2011
None
1Quarter
Oct-2010To
Sep-2011
1Year
3Years
5Years
SinceInception
InceptionDate
Total Domestic Equity -14.12 1.58 1.58 0.04 -1.50 1.71 04/01/2004
Total Domestic Equity Policy -15.28 0.55 0.55 1.45 -0.92 2.56
Difference 1.16 1.03 1.03 -1.41 -0.58 -0.85
Cornerstone Large Cap Value -11.00 (9) 1.82 (18) 1.82 (18) N/A N/A 17.02 (43) 04/01/2009
Russell 1000 Value Index -16.20 (48) -1.89 (57) -1.89 (57) -1.52 (78) -3.53 (85) 16.80 (46)
Difference 5.20 3.71 3.71 N/A N/A 0.22
IM U.S. Large Cap Value Equity (SA+CF) -16.42 -1.50 -1.50 0.44 -1.50 16.50
Westwood All Cap Value -19.13 (80) -1.17 (43) -1.17 (43) N/A N/A 10.20 (71) 07/01/2009
Russell 3000 Value Index -16.63 (47) -2.22 (62) -2.22 (62) -1.62 (94) -3.50 (94) 11.04 (57)
Difference -2.50 1.05 1.05 N/A N/A -0.84
IM U.S. All Cap Value Equity (SA+CF) -16.98 -1.44 -1.44 1.58 -0.20 11.41
Bowen Hanes Large Cap Core -17.96 (89) -3.51 (89) -3.51 (89) 0.94 (63) N/A -2.84 (76) 04/01/2008
Russell 3000 Policy -15.28 (59) 0.55 (56) 0.55 (56) 1.32 (56) N/A -2.14 (62)
Difference -2.68 -4.06 -4.06 -0.38 N/A -0.70
IM U.S. Large Cap Core Equity (SA+CF) -14.94 0.96 0.96 1.51 -0.52 -1.64
Sawgrass Large Cap Growth -10.81 (10) 5.95 (13) 5.95 (13) 2.15 (60) N/A -0.68 (52) 04/01/2008
Russell 1000 Growth Index -13.14 (26) 3.78 (25) 3.78 (25) 4.69 (26) 1.62 (39) 0.53 (29)
Difference 2.33 2.17 2.17 -2.54 N/A -1.21
IM U.S. Large Cap Growth Equity (SA+CF) -14.62 1.03 1.03 2.96 0.95 -0.57
Returns for periods greater than one year are annualized.Current Total Fund Policy= 45% Russell 3000, 15% MSCI ACWI ex US, 30% Barclays Intermediate Aggregate, 5% Barclays US TIPs, 5% NCREIF ODCE.Current Total Equity Policy= 75% Russell 3000, & 25% MSCI ACWI ex US. Current Bowen Policy= 100% Russell 3000.
Page 22

Lakeland Police Officers' Retirement System
Comparative Performance Trailing Returns
As of September 30, 2011
None
1Quarter
Oct-2010To
Sep-2011
1Year
3Years
5Years
SinceInception
InceptionDate
Total International Equity -12.31 -2.55 -2.55 1.06 -0.53 5.39 04/01/2004
Total International Equity Policy -19.78 -10.42 -10.42 -0.37 -2.83 3.69
Difference 7.47 7.87 7.87 1.43 2.30 1.70
Baring International -15.19 (7) -6.58 (24) -6.58 (24) N/A N/A 16.29 (45) 04/01/2009
MSCI AC World ex USA -19.78 (43) -10.42 (70) -10.42 (70) 0.98 (52) -1.12 (52) 17.05 (37)
Difference 4.59 3.84 3.84 N/A N/A -0.76
IM International Large Cap Growth Equity (SA+CF) -20.11 -9.00 -9.00 1.10 -1.10 15.82
IVA International (IVIQX) -8.93 (1) N/A N/A N/A N/A 0.35 (1) 11/01/2010
MSCI AC World ex USA -19.78 (28) -10.42 (46) -10.42 (46) 0.98 (18) -1.12 (6) -13.38 (40)
Difference 10.85 N/A N/A N/A N/A 13.73
IM International Multi-Cap Value Equity (MF) -20.99 -10.77 -10.77 -2.21 -5.02 -14.31
Total Domestic Fixed Income 2.14 4.27 4.27 7.04 6.34 5.06 04/01/2004
Fixed Income Policy 2.30 4.22 4.22 6.98 6.14 4.79
Difference -0.16 0.05 0.05 0.06 0.20 0.27
Galliard Fixed Income 2.18 (37) 4.13 (28) 4.13 (28) 7.13 (78) N/A 5.99 (54) 04/01/2008
Barclays Capital Intermediate Aggregate 2.30 (33) 4.22 (20) 4.22 (20) 7.12 (79) 6.16 (63) 5.74 (63)
Difference -0.12 -0.09 -0.09 0.01 N/A 0.25
IM U.S. Intermediate Duration (SA+CF) 2.01 3.59 3.59 7.84 6.40 6.05
Galliard TIPS 1.46 (94) 6.78 (94) 6.78 (94) 5.83 (96) N/A 4.18 (96) 04/01/2008
Barclays Capital U.S. Treasury: U.S. TIPS 4.51 (65) 9.87 (36) 9.87 (36) 8.13 (67) 7.10 (68) 5.75 (69)
Difference -3.05 -3.09 -3.09 -2.30 N/A -1.57
IM U.S. TIPS (SA+CF) 4.73 9.78 9.78 8.42 7.24 5.92
Returns for periods greater than one year are annualized.Current Total Fund Policy= 45% Russell 3000, 15% MSCI ACWI ex US, 30% Barclays Intermediate Aggregate, 5% Barclays US TIPs, 5% NCREIF ODCE.Current Total Equity Policy= 75% Russell 3000, & 25% MSCI ACWI ex US. Current Bowen Policy= 100% Russell 3000.
Page 23

Lakeland Police Officers' Retirement System
Comparative Performance Trailing Returns
As of September 30, 2011
None
1Quarter
Oct-2010To
Sep-2011
1Year
3Years
5Years
SinceInception
InceptionDate
Total Global Fixed Income -7.86 N/A N/A N/A N/A -5.73 04/01/2011
Barclays Capital Global Aggregate 0.97 4.00 4.00 7.78 6.85 4.10
Difference -8.83 N/A N/A N/A N/A -9.83
Templeton Global Return (TTRZX) -7.86 (98) N/A N/A N/A N/A -5.73 (94) 04/01/2011
Barclays Capital Global Aggregate 0.97 (32) 4.00 (11) 4.00 (11) 7.78 (42) 6.85 (25) 4.10 (22)
Difference -8.83 N/A N/A N/A N/A -9.83
IM Global Fixed Income (MF) -1.44 1.44 1.44 7.38 5.78 1.30
Total Real Estate 1.95 15.54 15.54 N/A N/A 15.54 10/01/2010
NCREIF ODCE 3.58 18.34 18.34 -6.38 0.02 18.34
Difference -1.63 -2.80 -2.80 N/A N/A -2.80
American Realty -0.85 (100) 14.50 (93) 14.50 (93) N/A N/A 14.50 (93) 10/01/2010
NCREIF ODCE 3.58 (34) 18.34 (50) 18.34 (50) -6.38 (45) 0.02 (45) 18.34 (50)
Difference -4.43 -3.84 -3.84 N/A N/A -3.84
IM U.S. Open End Private Real Estate (SA+CF) 3.39 18.32 18.32 -8.53 -1.10 18.32
Intercontinental Real Estate 3.17 (59) 16.72 (77) 16.72 (77) N/A N/A 16.72 (77) 10/01/2010
NCREIF ODCE 3.58 (34) 18.34 (50) 18.34 (50) -6.38 (45) 0.02 (45) 18.34 (50)
Difference -0.41 -1.62 -1.62 N/A N/A -1.62
IM U.S. Open End Private Real Estate (SA+CF) 3.39 18.32 18.32 -8.53 -1.10 18.32
Returns for periods greater than one year are annualized.Current Total Fund Policy= 45% Russell 3000, 15% MSCI ACWI ex US, 30% Barclays Intermediate Aggregate, 5% Barclays US TIPs, 5% NCREIF ODCE.Current Total Equity Policy= 75% Russell 3000, & 25% MSCI ACWI ex US. Current Bowen Policy= 100% Russell 3000.
Page 24

Oct-2010To
Sep-2011
Oct-2009To
Sep-2010
Oct-2008To
Sep-2009
Oct-2007To
Sep-2008
Oct-2006To
Sep-2007
Oct-2005To
Sep-2006
Total Fund (Net) 1.46 9.66 -1.14 -14.56 16.20 9.45
Total Fund Policy 1.51 9.43 1.78 -12.68 12.92 8.49
Difference -0.05 0.23 -2.92 -1.88 3.28 0.96
Total Fund (Gross) 1.99 (19) 10.19 (46) -1.05 (74) -14.43 (62) 16.20 (18) 9.45 (34)
Total Fund Policy 1.51 (25) 9.43 (67) 1.78 (44) -12.68 (39) 12.92 (76) 8.49 (53)
Difference 0.48 0.76 -2.83 -1.75 3.28 0.96
All Public Plans-Total Fund Median 0.34 9.99 1.29 -13.67 14.39 8.59
Total Equity 0.60 11.73 -10.32 N/A N/A N/A
Total Equity Policy -2.27 10.07 -4.77 -22.82 17.84 11.62
Difference 2.87 1.66 -5.55 N/A N/A N/A
Total Fixed Income 2.59 7.74 9.69 5.51 5.50 3.78
Total Fixed Income Policy 4.22 7.52 9.25 4.33 5.47 3.58
Difference -1.63 0.22 0.44 1.18 0.03 0.20
Total Real Estate 15.54 N/A N/A N/A N/A N/A
NCREIF ODCE 18.34 6.97 -35.19 3.19 18.21 17.46
Difference -2.80 N/A N/A N/A N/A N/A
Lakeland Police Officers' Retirement System
Comparative Performance Fiscal Year Returns
As of September 30, 2011
None
Returns for periods greater than one year are annualized.Current Total Fund Policy= 45% Russell 3000, 15% MSCI ACWI ex US, 30% Barclays Intermediate Aggregate, 5% Barclays US TIPs, 5% NCREIF ODCE.Current Total Equity Policy= 75% Russell 3000, & 25% MSCI ACWI ex US. Current Bowen Policy= 100% Russell 3000.
Page 25

Lakeland Police Officers' Retirement System
Comparative Performance Fiscal Year Returns
As of September 30, 2011
NoneOct-2010
ToSep-2011
Oct-2009To
Sep-2010
Oct-2008To
Sep-2009
Oct-2007To
Sep-2008
Oct-2006To
Sep-2007
Oct-2005To
Sep-2006
Total Domestic Equity 1.58 11.75 -11.81 -22.43 19.41 10.83
Total Domestic Equity Policy 0.55 10.96 -6.42 -21.52 16.52 10.22
Difference 1.03 0.79 -5.39 -0.91 2.89 0.61
Cornerstone Large Cap Value 1.82 (18) 7.17 (73) N/A N/A N/A N/A
Russell 1000 Value Index -1.89 (57) 8.90 (54) -10.62 (83) -23.56 (71) 14.45 (69) 14.62 (25)
Difference 3.71 -1.73 N/A N/A N/A N/A
IM U.S. Large Cap Value Equity (SA+CF) -1.50 9.12 -5.87 -20.90 16.35 12.65
Westwood All Cap Value -1.17 (43) 9.59 (68) N/A N/A N/A N/A
Russell 3000 Value Index -2.22 (62) 9.15 (70) -10.79 (94) -22.70 (78) 13.73 (76) 14.55 (18)
Difference 1.05 0.44 N/A N/A N/A N/A
IM U.S. All Cap Value Equity (SA+CF) -1.44 10.74 -3.68 -19.98 16.80 10.47
Bowen Hanes Large Cap Core -3.51 (89) 13.42 (11) -6.03 (52) N/A N/A N/A
Russell 3000 Policy 0.55 (56) 11.11 (30) -6.91 (62) N/A N/A N/A
Difference -4.06 2.31 0.88 N/A N/A N/A
IM U.S. Large Cap Core Equity (SA+CF) 0.96 9.51 -5.88 -20.48 16.98 10.76
Sawgrass Large Cap Growth 5.95 (13) 14.36 (22) -12.03 (95) N/A N/A N/A
Russell 1000 Growth Index 3.78 (25) 12.65 (35) -1.85 (37) -20.88 (52) 19.35 (57) 6.04 (57)
Difference 2.17 1.71 -10.18 N/A N/A N/A
IM U.S. Large Cap Growth Equity (SA+CF) 1.03 11.25 -3.03 -20.55 20.19 6.77
Returns for periods greater than one year are annualized.Current Total Fund Policy= 45% Russell 3000, 15% MSCI ACWI ex US, 30% Barclays Intermediate Aggregate, 5% Barclays US TIPs, 5% NCREIF ODCE.Current Total Equity Policy= 75% Russell 3000, & 25% MSCI ACWI ex US. Current Bowen Policy= 100% Russell 3000.
Page 26

Lakeland Police Officers' Retirement System
Comparative Performance Fiscal Year Returns
As of September 30, 2011
NoneOct-2010
ToSep-2011
Oct-2009To
Sep-2010
Oct-2008To
Sep-2009
Oct-2007To
Sep-2008
Oct-2006To
Sep-2007
Oct-2005To
Sep-2006
Total International Equity -2.55 9.62 -3.39 -26.08 27.63 20.05
Total International Equity Policy -10.42 6.37 3.80 -30.13 25.38 19.65
Difference 7.87 3.25 -7.19 4.05 2.25 0.40
Baring International -6.58 (24) 9.62 (48) N/A N/A N/A N/A
MSCI AC World ex USA -10.42 (70) 8.00 (56) 6.43 (33) -29.97 (54) 31.06 (47) 19.36 (42)
Difference 3.84 1.62 N/A N/A N/A N/A
IM International Large Cap Growth Equity (SA+CF) -9.00 9.26 3.24 -29.35 30.50 18.65
IVA International (IVIQX) N/A N/A N/A N/A N/A N/A
MSCI AC World ex USA -10.42 (46) 8.00 (16) 6.43 (30) -29.97 (25) 31.06 (2) 19.36 (35)
Difference N/A N/A N/A N/A N/A N/A
IM International Multi-Cap Value Equity (MF) -10.77 2.95 3.07 -32.49 22.50 18.34
Total Domestic Fixed Income 4.27 7.74 9.18 5.08 5.50 3.78
Fixed Income Policy 4.22 7.52 9.25 4.33 5.47 3.58
Difference 0.05 0.22 -0.07 0.75 0.03 0.20
Galliard Fixed Income 4.13 (28) 7.79 (70) 9.54 (83) N/A N/A N/A
Barclays Capital Intermediate Aggregate 4.22 (20) 7.52 (79) 9.69 (82) 4.16 (34) 5.33 (69) 3.84 (59)
Difference -0.09 0.27 -0.15 N/A N/A N/A
IM U.S. Intermediate Duration (SA+CF) 3.59 8.27 11.53 3.21 5.49 3.91
Galliard TIPS 6.78 (94) 6.87 (96) 3.86 (90) N/A N/A N/A
Barclays Capital U.S. Treasury: U.S. TIPS 9.87 (36) 8.89 (78) 5.67 (66) 6.20 (63) 4.97 (65) 1.91 (85)
Difference -3.09 -2.02 -1.81 N/A N/A N/A
IM U.S. TIPS (SA+CF) 9.78 9.35 6.18 6.35 5.11 2.14
Returns for periods greater than one year are annualized.Current Total Fund Policy= 45% Russell 3000, 15% MSCI ACWI ex US, 30% Barclays Intermediate Aggregate, 5% Barclays US TIPs, 5% NCREIF ODCE.Current Total Equity Policy= 75% Russell 3000, & 25% MSCI ACWI ex US. Current Bowen Policy= 100% Russell 3000.
Page 27

Lakeland Police Officers' Retirement System
Comparative Performance Fiscal Year Returns
As of September 30, 2011
NoneOct-2010
ToSep-2011
Oct-2009To
Sep-2010
Oct-2008To
Sep-2009
Oct-2007To
Sep-2008
Oct-2006To
Sep-2007
Oct-2005To
Sep-2006
Total Global Fixed Income N/A N/A N/A N/A N/A N/A
Barclays Capital Global Aggregate 4.00 6.06 13.51 2.80 8.20 3.22
Difference N/A N/A N/A N/A N/A N/A
Templeton Global Return (TTRZX) N/A N/A N/A N/A N/A N/A
Barclays Capital Global Aggregate 4.00 (11) 6.06 (88) 13.51 (48) 2.80 (19) 8.20 (45) 3.22 (28)
Difference N/A N/A N/A N/A N/A N/A
IM Global Fixed Income (MF) 1.44 8.00 13.40 -1.41 7.59 2.53
Total Real Estate 15.54 N/A N/A N/A N/A N/A
NCREIF ODCE 18.34 6.97 -35.19 3.19 18.21 17.46
Difference -2.80 N/A N/A N/A N/A N/A
American Realty 14.50 (93) N/A N/A N/A N/A N/A
NCREIF ODCE 18.34 (50) 6.97 (47) -35.19 (53) 3.19 (52) 18.21 (56) 17.46 (55)
Difference -3.84 N/A N/A N/A N/A N/A
IM U.S. Open End Private Real Estate (SA+CF) 18.32 6.60 -33.44 3.47 18.53 18.08
Intercontinental Real Estate 16.72 (77) N/A N/A N/A N/A N/A
NCREIF ODCE 18.34 (50) 6.97 (47) -35.19 (53) 3.19 (52) 18.21 (56) 17.46 (55)
Difference -1.62 N/A N/A N/A N/A N/A
IM U.S. Open End Private Real Estate (SA+CF) 18.32 6.60 -33.44 3.47 18.53 18.08
Returns for periods greater than one year are annualized.Current Total Fund Policy= 45% Russell 3000, 15% MSCI ACWI ex US, 30% Barclays Intermediate Aggregate, 5% Barclays US TIPs, 5% NCREIF ODCE.Current Total Equity Policy= 75% Russell 3000, & 25% MSCI ACWI ex US. Current Bowen Policy= 100% Russell 3000.
Page 28

Plan Sponsor Peer Group Analysis - All Public Plans-Total Fund
Comparative Performance
-28.00
-25.00
-22.00
-19.00
-16.00
-13.00
-10.00
-7.00
-4.00
-1.00
2.00
5.00
8.00
11.00
14.00
17.00
20.00
23.00
26.00
29.00
Ret
urn
Oct-2010To
Sep-2011
Oct-2009To
Sep-2010
Oct-2008To
Sep-2009
Oct-2007To
Sep-2008
Oct-2006To
Sep-2007
¢ Total Fund (Gross) 1.99 (19) 10.19 (46) -1.05 (74) -14.43 (62) 16.20 (18)
Å Total Fund Policy 1.51 (25) 9.43 (67) 1.78 (44) -12.68 (39) 12.92 (76)
Median 0.34 9.99 1.29 -13.67 14.39
-20.00
-18.00
-16.00
-14.00
-12.00
-10.00
-8.00
-6.00
-4.00
-2.00
0.00
2.00
4.00
6.00
8.00
10.00
12.00
14.00
Ret
urn
1Quarter
Oct-2010To
Sep-2011
1Year
2Years
3Years
4Years
5Years
¢ Total Fund (Gross) -8.59 (22) 1.99 (19) 1.99 (19) 6.01 (24) 3.60 (59) -1.23 (66) 2.03 (51)
Å Total Fund Policy -9.04 (30) 1.51 (25) 1.51 (25) 5.40 (40) 4.18 (40) -0.32 (35) 2.20 (42)
Median -10.23 0.34 0.34 5.04 3.87 -0.78 2.03
1QuarterEnding
Jun-2011
1QuarterEnding
Mar-2011
1QuarterEnding
Dec-2010
1QuarterEnding
Sep-2010
1QuarterEnding
Jun-2010
1QuarterEnding
Mar-2010
Total Fund (Gross) 2.10 (4) 4.02 (53) 5.05 (87) 8.09 (73) -5.44 (36) 3.45 (75)
Total Fund Policy 1.16 (43) 3.83 (63) 6.25 (49) 8.59 (55) -5.82 (50) 3.66 (63)
All Public Plans-Total Fund Median 1.09 4.08 6.21 8.76 -5.82 3.82
Lakeland Police Officers' Retirement SystemTotal Fund (Gross)September 30, 2011
Page 29

Peer Group Scattergram - 3 Years
3 Yr Rolling Under/Over Performance - 5 Years
Peer Group Scattergram - 5 Years
3 Yr Rolling Percentile Ranking - 5 Years
Historical Statsistics - 3 Years
Historical Statsistics - 5 Years
0.0
25.0
50.0
75.0
100.0
Ret
urn
Per
cen
tile
Ra
nk
12/06 6/07 12/07 6/08 12/08 6/09 12/09 6/10 12/10 6/11 9/11
Total Period5-25
Count25-Median
CountMedian-75
Count75-95Count
¢ Total Fund (Gross) 19 0 (0%) 6 (32%) 10 (53%) 3 (16%)
Å Total Fund Policy 20 0 (0%) 9 (45%) 11 (55%) 0 (0%)Over Performance Under Performance Dec-2006 Sep-2011
-10.0
-5.0
0.0
5.0
10.0
15.0
To
tal
Fu
nd
(G
ross
) (%
)
-9.0 -6.0 -3.0 0.0 3.0 6.0 9.0 12.0 15.0
Total Fund Policy (%)
Over
Performance
Under
Performance
-3.00
0.00
3.00
6.00
Ret
urn
(%
)
0.00 2.00 4.00 6.00 8.00 10.00 12.00 14.00 16.00 18.00
Risk (Standard Deviation %)
ReturnStandardDeviation
¢ Total Fund (Gross) 3.60 12.37
Å Total Fund Policy 4.18 13.77
¾ Median 3.87 13.44
2.00
2.08
2.16
2.24
Ret
urn
(%
)
12.0 12.2 12.4 12.6 12.8 13.0 13.2 13.4
Risk (Standard Deviation %)
ReturnStandardDeviation
¢ Total Fund (Gross) 2.0 12.3
Å Total Fund Policy 2.2 12.9
¾ Median 2.0 13.2
TrackingError
UpMarketCapture
DownMarketCapture
AlphaInformation
RatioSharpeRatio
BetaDownside
Risk
Total Fund (Gross) 2.61 87.88 88.60 -0.15 -0.28 0.33 0.89 9.35
Total Fund Policy 0.00 100.00 100.00 0.00 N/A 0.35 1.00 10.0190 Day U.S. Treasury Bill 13.81 0.41 -0.71 0.22 -0.35 N/A 0.00 0.01
TrackingError
UpMarketCapture
DownMarketCapture
AlphaInformation
RatioSharpeRatio
BetaDownside
Risk
Total Fund (Gross) 2.73 97.18 98.77 -0.02 -0.09 0.09 0.93 8.83
Total Fund Policy 0.00 100.00 100.00 0.00 N/A 0.10 1.00 8.7490 Day U.S. Treasury Bill 12.95 8.68 -6.74 1.72 -0.10 N/A 0.00 0.00
Lakeland Police Officers' Retirement SystemTotal Fund (Gross)September 30, 2011
Page 30
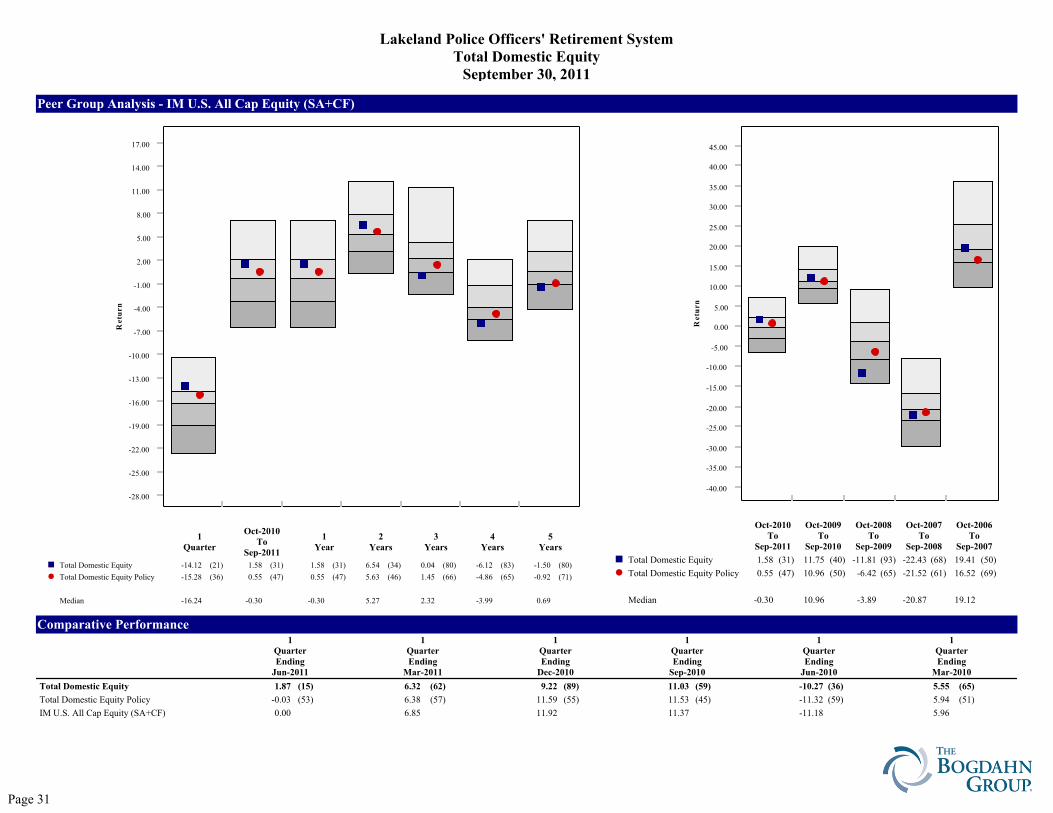
Peer Group Analysis - IM U.S. All Cap Equity (SA+CF)
Comparative Performance
-40.00
-35.00
-30.00
-25.00
-20.00
-15.00
-10.00
-5.00
0.00
5.00
10.00
15.00
20.00
25.00
30.00
35.00
40.00
45.00
Ret
urn
Oct-2010To
Sep-2011
Oct-2009To
Sep-2010
Oct-2008To
Sep-2009
Oct-2007To
Sep-2008
Oct-2006To
Sep-2007
¢ Total Domestic Equity 1.58 (31) 11.75 (40) -11.81 (93) -22.43 (68) 19.41 (50)
Å Total Domestic Equity Policy 0.55 (47) 10.96 (50) -6.42 (65) -21.52 (61) 16.52 (69)
Median -0.30 10.96 -3.89 -20.87 19.12
-28.00
-25.00
-22.00
-19.00
-16.00
-13.00
-10.00
-7.00
-4.00
-1.00
2.00
5.00
8.00
11.00
14.00
17.00
Ret
urn
1Quarter
Oct-2010To
Sep-2011
1Year
2Years
3Years
4Years
5Years
¢ Total Domestic Equity -14.12 (21) 1.58 (31) 1.58 (31) 6.54 (34) 0.04 (80) -6.12 (83) -1.50 (80)
Å Total Domestic Equity Policy -15.28 (36) 0.55 (47) 0.55 (47) 5.63 (46) 1.45 (66) -4.86 (65) -0.92 (71)
Median -16.24 -0.30 -0.30 5.27 2.32 -3.99 0.69
1QuarterEnding
Jun-2011
1QuarterEnding
Mar-2011
1QuarterEnding
Dec-2010
1QuarterEnding
Sep-2010
1QuarterEnding
Jun-2010
1QuarterEnding
Mar-2010
Total Domestic Equity 1.87 (15) 6.32 (62) 9.22 (89) 11.03 (59) -10.27 (36) 5.55 (65)
Total Domestic Equity Policy -0.03 (53) 6.38 (57) 11.59 (55) 11.53 (45) -11.32 (59) 5.94 (51)
IM U.S. All Cap Equity (SA+CF) 0.00 6.85 11.92 11.37 -11.18 5.96
Lakeland Police Officers' Retirement SystemTotal Domestic Equity
September 30, 2011
Page 31

Peer Group Scattergram - 3 Years
3 Yr Rolling Under/Over Performance - 5 Years
Peer Group Scattergram - 5 Years
3 Yr Rolling Percentile Ranking - 5 Years
Historical Statistics - 3 Years
Historical Statsistics - 5 Years
0.0
25.0
50.0
75.0
100.0
Ret
urn
Per
cen
tile
Ra
nk
12/06 6/07 12/07 6/08 12/08 6/09 12/09 6/10 12/10 6/11 9/11
Total Period5-25
Count25-Median
CountMedian-75
Count75-95Count
¢ Total Domestic Equity 19 0 (0%) 0 (0%) 8 (42%) 11 (58%)
Å Total Domestic Equity Policy 19 0 (0%) 0 (0%) 16 (84%) 3 (16%)Over Performance Under Performance Dec-2006 Sep-2011
-20.0
-10.0
0.0
10.0
20.0
To
tal
Do
me
stic
Eq
uit
y (%
)
-20.0 -16.0 -12.0 -8.0 -4.0 0.0 4.0 8.0 12.0 16.0 20.0
Total Domestic Equity Policy (%)
Over
Performance
Under
Performance
-6.00
0.00
6.00
12.00
Ret
urn
(%
)
12.00 15.00 18.00 21.00 24.00 27.00 30.00 33.00 36.00
Risk (Standard Deviation %)
ReturnStandardDeviation
¢ Total Domestic Equity 0.04 23.88
Å Total Domestic Equity Policy 1.45 25.22
¾ Median 2.32 25.77
-5.00
0.00
5.00
Ret
urn
(%
)
12.00 14.00 16.00 18.00 20.00 22.00 24.00 26.00 28.00 30.00 32.00
Risk (Standard Deviation %)
ReturnStandardDeviation
¢ Total Domestic Equity -1.50 20.14
Å Total Domestic Equity Policy -0.92 20.93
¾ Median 0.69 22.22
TrackingError
UpMarketCapture
DownMarketCapture
AlphaInformation
RatioSharpeRatio
BetaDownside
Risk
Total Domestic Equity 3.30 88.49 92.47 -1.37 -0.49 0.10 0.94 16.18
Total Domestic Equity Policy 0.00 100.00 100.00 0.00 N/A 0.17 1.00 16.3390 Day U.S. Treasury Bill 21.87 0.27 -0.41 0.22 -0.17 N/A 0.00 0.01
TrackingError
UpMarketCapture
DownMarketCapture
AlphaInformation
RatioSharpeRatio
BetaDownside
Risk
Total Domestic Equity 6.95 81.22 83.10 -0.57 -0.09 -0.08 0.91 14.53
Total Domestic Equity Policy 0.00 100.00 100.00 0.00 N/A -0.04 1.00 14.4490 Day U.S. Treasury Bill 18.92 3.60 -2.91 1.72 0.04 N/A 0.00 0.01
Lakeland Police Officers' Retirement SystemTotal Domestic Equity
September 30, 2011
Page 32

Peer Group Analysis - IM U.S. Large Cap Value Equity (SA+CF)
Comparative Performance
-40.00
-35.00
-30.00
-25.00
-20.00
-15.00
-10.00
-5.00
0.00
5.00
10.00
15.00
20.00
25.00
30.00
35.00
Ret
urn
Oct-2010To
Sep-2011
Oct-2009To
Sep-2010
Oct-2008To
Sep-2009
Oct-2007To
Sep-2008
Oct-2006To
Sep-2007
¢ Cornerstone Large Cap Value 1.82 (18) 7.17 (73) N/A N/A N/A
Å Russell 1000 Value Index -1.89 (57) 8.90 (54) -10.62 (83) -23.56 (71) 14.45 (69)
Median -1.50 9.12 -5.87 -20.90 16.35
-28.00
-25.00
-22.00
-19.00
-16.00
-13.00
-10.00
-7.00
-4.00
-1.00
2.00
5.00
8.00
11.00
14.00
Ret
urn
1Quarter
Oct-2010To
Sep-2011
1Year
2Years
3Years
4Years
5Years
¢ Cornerstone Large Cap Value -11.00 (9) 1.82 (18) 1.82 (18) 4.46 (40) N/A N/A N/A
Å Russell 1000 Value Index -16.20 (48) -1.89 (57) -1.89 (57) 3.36 (52) -1.52 (78) -7.57 (81) -3.53 (85)
Median -16.42 -1.50 -1.50 3.41 0.44 -5.64 -1.50
1QuarterEnding
Jun-2011
1QuarterEnding
Mar-2011
1QuarterEnding
Dec-2010
1QuarterEnding
Sep-2010
1QuarterEnding
Jun-2010
1QuarterEnding
Mar-2010
Cornerstone Large Cap Value 0.75 (26) 4.31 (89) 8.85 (83) 10.85 (47) -10.93 (35) 5.42 (65)
Russell 1000 Value Index -0.50 (61) 6.46 (48) 10.54 (49) 10.13 (65) -11.15 (40) 6.78 (29)
IM U.S. Large Cap Value Equity (SA+CF) -0.22 6.36 10.48 10.76 -11.64 5.94
Lakeland Police Officers' Retirement SystemCornerstone Large Cap Value
September 30, 2011
Page 33

Peer Group Analysis - IM U.S. All Cap Value Equity (SA+CF)
Comparative Performance
-40.00
-35.00
-30.00
-25.00
-20.00
-15.00
-10.00
-5.00
0.00
5.00
10.00
15.00
20.00
25.00
30.00
35.00
40.00
Ret
urn
Oct-2010To
Sep-2011
Oct-2009To
Sep-2010
Oct-2008To
Sep-2009
Oct-2007To
Sep-2008
Oct-2006To
Sep-2007
¢ Westwood All Cap Value -1.17 (43) 9.59 (68) N/A N/A N/A
Å Russell 3000 Value Index -2.22 (62) 9.15 (70) -10.79 (94) -22.70 (78) 13.73 (76)
Median -1.44 10.74 -3.68 -19.98 16.80
-28.00
-25.00
-22.00
-19.00
-16.00
-13.00
-10.00
-7.00
-4.00
-1.00
2.00
5.00
8.00
11.00
14.00
17.00
Ret
urn
1Quarter
Oct-2010To
Sep-2011
1Year
2Years
3Years
4Years
5Years
¢ Westwood All Cap Value -19.13 (80) -1.17 (43) -1.17 (43) 4.07 (57) N/A N/A N/A
Å Russell 3000 Value Index -16.63 (47) -2.22 (62) -2.22 (62) 3.31 (65) -1.62 (94) -7.38 (90) -3.50 (94)
Median -16.98 -1.44 -1.44 4.36 1.58 -3.99 -0.20
1QuarterEnding
Jun-2011
1QuarterEnding
Mar-2011
1QuarterEnding
Dec-2010
1QuarterEnding
Sep-2010
1QuarterEnding
Jun-2010
1QuarterEnding
Mar-2010
Westwood All Cap Value 0.24 (31) 8.26 (21) 12.62 (33) 13.12 (14) -12.19 (82) 5.69 (73)
Russell 3000 Value Index -0.68 (65) 6.47 (48) 10.92 (59) 10.10 (69) -11.09 (61) 7.05 (43)
IM U.S. All Cap Value Equity (SA+CF) -0.18 6.37 11.40 10.83 -10.60 6.52
Lakeland Police Officers' Retirement SystemWestwood All Cap Value
September 30, 2011
Page 34

Peer Group Analysis - IM U.S. Large Cap Core Equity (SA+CF)
Comparative Performance
-35.00
-30.00
-25.00
-20.00
-15.00
-10.00
-5.00
0.00
5.00
10.00
15.00
20.00
25.00
30.00
Ret
urn
Oct-2010To
Sep-2011
Oct-2009To
Sep-2010
Oct-2008To
Sep-2009
Oct-2007To
Sep-2008
Oct-2006To
Sep-2007
¢ Bowen Hanes Large Cap Core -3.51 (89) 13.42 (11) -6.03 (52) N/A N/A
Å Russell 3000 Policy 0.55 (56) 11.11 (30) -6.91 (62) N/A N/A
Median 0.96 9.51 -5.88 -20.48 16.98
-24.00
-22.00
-20.00
-18.00
-16.00
-14.00
-12.00
-10.00
-8.00
-6.00
-4.00
-2.00
0.00
2.00
4.00
6.00
8.00
10.00
12.00
14.00
Ret
urn
1Quarter
Oct-2010To
Sep-2011
1Year
2Years
3Years
4Years
5Years
¢ Bowen Hanes Large Cap Core -17.96 (89) -3.51 (89) -3.51 (89) 4.61 (58) 0.94 (63) N/A N/A
Å Russell 3000 Policy -15.28 (59) 0.55 (56) 0.55 (56) 5.70 (37) 1.32 (56) N/A N/A
Median -14.94 0.96 0.96 5.01 1.51 -4.31 -0.52
1QuarterEnding
Jun-2011
1QuarterEnding
Mar-2011
1QuarterEnding
Dec-2010
1QuarterEnding
Sep-2010
1QuarterEnding
Jun-2010
1QuarterEnding
Mar-2010
Bowen Hanes Large Cap Core -0.35 (75) 7.04 (34) 10.28 (70) 11.45 (36) -11.18 (40) 6.57 (13)
Russell 3000 Policy -0.03 (65) 6.38 (47) 11.59 (29) 11.53 (34) -11.32 (46) 5.94 (25)
IM U.S. Large Cap Core Equity (SA+CF) 0.47 6.30 10.89 11.03 -11.45 5.25
Lakeland Police Officers' Retirement SystemBowen Hanes Large Cap Core
September 30, 2011
Page 35

Peer Group Scattergram - 3 Years
3 Yr Rolling Under/Over Performance - 5 Years
Peer Group Scattergram - 5 Years
3 Yr Rolling Percentile Ranking - 5 Years
Historical Statistics - 3 Years
Historical Statsistics - 5 Years
0.0
25.0
50.0
75.0
100.0
Ret
urn
Per
cen
tile
Ra
nk
12/06 6/07 12/07 6/08 12/08 6/09 12/09 6/10 12/10 6/11 9/11
Total Period5-25
Count25-Median
CountMedian-75
Count75-95Count
¢ Bowen Hanes Large Cap Core 3 0 (0%) 1 (33%) 2 (67%) 0 (0%)
Å Russell 3000 Policy 3 0 (0%) 1 (33%) 2 (67%) 0 (0%)Under Performance Dec-2006 Sep-2011
1.0
2.0
3.0
4.0
Bo
wen
Ha
nes
La
rge
Ca
p C
ore
(%
)
0.5 1.0 1.5 2.0 2.5 3.0 3.5 4.0 4.5
Russell 3000 Policy (%)
Over
Performance
Under
Performance
-5.00
0.00
5.00
Ret
urn
(%
)
8.00 10.00 12.00 14.00 16.00 18.00 20.00 22.00 24.00 26.00 28.00 30.00
Risk (Standard Deviation %)
ReturnStandardDeviation
¢ Bowen Hanes Large Cap Core 0.94 26.95
Å Russell 3000 Policy 1.32 24.67
¾ Median 1.51 23.91
-6.00
-3.00
0.00
3.00
Ret
urn
(%
)
6.00 8.00 10.00 12.00 14.00 16.00 18.00 20.00 22.00 24.00 26.00
Risk (Standard Deviation %)
ReturnStandardDeviation
¢ Bowen Hanes Large Cap Core N/A N/A
Å Russell 3000 Policy N/A N/A
¾ Median -0.52 20.19
TrackingError
UpMarketCapture
DownMarketCapture
AlphaInformation
RatioSharpeRatio
BetaDownside
Risk
Bowen Hanes Large Cap Core 6.07 103.03 103.83 -0.15 -0.02 0.15 1.01 16.94
Russell 3000 Policy 0.00 100.00 100.00 0.00 N/A 0.16 1.00 15.9090 Day U.S. Treasury Bill 21.34 0.28 -0.42 0.22 -0.16 N/A 0.00 0.01
TrackingError
UpMarketCapture
DownMarketCapture
AlphaInformation
RatioSharpeRatio
BetaDownside
Risk
Bowen Hanes Large Cap Core N/A N/A N/A N/A N/A N/A N/A N/A
Russell 3000 Policy N/A N/A N/A N/A N/A N/A N/A N/A90 Day U.S. Treasury Bill N/A N/A N/A N/A N/A N/A N/A N/A
Lakeland Police Officers' Retirement SystemBowen Hanes Large Cap Core
September 30, 2011
Page 36

Peer Group Analysis - IM U.S. Large Cap Growth Equity (SA+CF)
Comparative Performance
-40.00
-35.00
-30.00
-25.00
-20.00
-15.00
-10.00
-5.00
0.00
5.00
10.00
15.00
20.00
25.00
30.00
35.00
40.00
Ret
urn
Oct-2010To
Sep-2011
Oct-2009To
Sep-2010
Oct-2008To
Sep-2009
Oct-2007To
Sep-2008
Oct-2006To
Sep-2007
¢ Sawgrass Large Cap Growth 5.95 (13) 14.36 (22) -12.03 (95) N/A N/A
Å Russell 1000 Growth Index 3.78 (25) 12.65 (35) -1.85 (37) -20.88 (52) 19.35 (57)
Median 1.03 11.25 -3.03 -20.55 20.19
-25.00
-22.00
-19.00
-16.00
-13.00
-10.00
-7.00
-4.00
-1.00
2.00
5.00
8.00
11.00
14.00
17.00
Ret
urn
1Quarter
Oct-2010To
Sep-2011
1Year
2Years
3Years
4Years
5Years
¢ Sawgrass Large Cap Growth -10.81 (10) 5.95 (13) 5.95 (13) 10.07 (12) 2.15 (60) N/A N/A
Å Russell 1000 Growth Index -13.14 (26) 3.78 (25) 3.78 (25) 8.12 (24) 4.69 (26) -2.39 (32) 1.62 (39)
Median -14.62 1.03 1.03 5.95 2.96 -3.33 0.95
1QuarterEnding
Jun-2011
1QuarterEnding
Mar-2011
1QuarterEnding
Dec-2010
1QuarterEnding
Sep-2010
1QuarterEnding
Jun-2010
1QuarterEnding
Mar-2010
Sawgrass Large Cap Growth 4.65 (2) 5.95 (48) 7.13 (97) 9.91 (90) -8.46 (8) 4.96 (45)
Russell 1000 Growth Index 0.76 (46) 6.03 (46) 11.83 (49) 13.00 (38) -11.75 (53) 4.65 (52)
IM U.S. Large Cap Growth Equity (SA+CF) 0.59 5.83 11.77 12.27 -11.63 4.71
Lakeland Police Officers' Retirement SystemSawgrass Large Cap Growth
September 30, 2011
Page 37

Peer Group Scattergram - 3 Years
3 Yr Rolling Under/Over Performance - 5 Years
Peer Group Scattergram - 5 Years
3 Yr Rolling Percentile Ranking - 5 Years
Historical Statistics - 3 Years
Historical Statsistics - 5 Years
0.0
25.0
50.0
75.0
100.0
Ret
urn
Per
cen
tile
Ra
nk
12/06 6/07 12/07 6/08 12/08 6/09 12/09 6/10 12/10 6/11 9/11
Total Period5-25
Count25-Median
CountMedian-75
Count75-95Count
¢ Sawgrass Large Cap Growth 3 0 (0%) 0 (0%) 2 (67%) 1 (33%)
Å Russell 1000 Growth Index 20 0 (0%) 8 (40%) 11 (55%) 1 (5%)Under Performance Dec-2006 Sep-2011
2.0
3.0
4.0
5.0
Saw
gra
ss L
arg
e C
ap
Gro
wth
(%
)
1.5 2.0 2.5 3.0 3.5 4.0 4.5 5.0
Russell 1000 Growth Index (%)
Over
Performance
Under
Performance
-5.00
0.00
5.00
10.00
Ret
urn
(%
)
10.00 12.00 14.00 16.00 18.00 20.00 22.00 24.00 26.00 28.00 30.00
Risk (Standard Deviation %)
ReturnStandardDeviation
¢ Sawgrass Large Cap Growth 2.15 20.17
Å Russell 1000 Growth Index 4.69 23.78
¾ Median 2.96 24.10
-4.00
0.00
4.00
Ret
urn
(%
)
8.00 10.00 12.00 14.00 16.00 18.00 20.00 22.00 24.00 26.00 28.00
Risk (Standard Deviation %)
ReturnStandardDeviation
¢ Sawgrass Large Cap Growth N/A N/A
Å Russell 1000 Growth Index 1.62 20.40
¾ Median 0.95 21.02
TrackingError
UpMarketCapture
DownMarketCapture
AlphaInformation
RatioSharpeRatio
BetaDownside
Risk
Sawgrass Large Cap Growth 6.49 70.15 74.80 -1.68 -0.50 0.20 0.77 12.54
Russell 1000 Growth Index 0.00 100.00 100.00 0.00 N/A 0.32 1.00 14.9590 Day U.S. Treasury Bill 20.65 0.27 -0.46 0.22 -0.32 N/A 0.00 0.01
TrackingError
UpMarketCapture
DownMarketCapture
AlphaInformation
RatioSharpeRatio
BetaDownside
Risk
Sawgrass Large Cap Growth N/A N/A N/A N/A N/A N/A N/A N/A
Russell 1000 Growth Index 0.00 100.00 100.00 0.00 N/A 0.09 1.00 13.7690 Day U.S. Treasury Bill 18.46 3.56 -3.17 1.73 -0.09 N/A 0.00 0.01
Lakeland Police Officers' Retirement SystemSawgrass Large Cap Growth
September 30, 2011
Page 38

Peer Group Analysis - IM International Equity (SA+CF+MF)
Comparative Performance
-60.00
-50.00
-40.00
-30.00
-20.00
-10.00
0.00
10.00
20.00
30.00
40.00
50.00
60.00
70.00
80.00
Ret
urn
Oct-2010To
Sep-2011
Oct-2009To
Sep-2010
Oct-2008To
Sep-2009
Oct-2007To
Sep-2008
Oct-2006To
Sep-2007
¢ Total International Equity -2.55 (6) 9.62 (45) -3.39 (87) -26.08 (15) 27.63 (52)
Å Total International Equity Policy -10.42 (42) 6.37 (60) 3.80 (54) -30.13 (42) 25.38 (63)
Median -11.35 8.44 4.58 -31.06 27.87
-31.00
-28.00
-25.00
-22.00
-19.00
-16.00
-13.00
-10.00
-7.00
-4.00
-1.00
2.00
5.00
8.00
11.00
14.00
17.00R
etu
rn
1Quarter
Oct-2010To
Sep-2011
1Year
2Years
3Years
4Years
5Years
¢ Total International Equity -12.31 (4) -2.55 (6) -2.55 (6) 3.35 (13) 1.06 (45) -6.54 (29) -0.53 (38)
Å Total International Equity Policy -19.78 (36) -10.42 (42) -10.42 (42) -2.39 (57) -0.37 (57) -8.82 (55) -2.83 (60)
Median -20.84 -11.35 -11.35 -1.74 0.48 -8.45 -1.91
1QuarterEnding
Jun-2011
1QuarterEnding
Mar-2011
1QuarterEnding
Dec-2010
1QuarterEnding
Sep-2010
1QuarterEnding
Jun-2010
1QuarterEnding
Mar-2010
Total International Equity 2.31 (23) 3.08 (43) 5.37 (86) 14.06 (87) -8.90 (23) 0.28 (85)
Total International Equity Policy 0.61 (61) 3.49 (32) 7.25 (55) 16.66 (63) -12.26 (55) 1.66 (52)
IM International Equity (SA+CF+MF) 1.03 2.74 7.40 17.48 -11.97 1.76
Lakeland Police Officers' Retirement SystemTotal International Equity
September 30, 2011
Page 39

Peer Group Scattergram - 3 Years
3 Yr Rolling Under/Over Performance - 5 Years
Peer Group Scattergram - 5 Years
3 Yr Rolling Percentile Ranking - 5 Years
Historical Statistics - 3 Years
Historical Statsistics - 5 Years
0.0
25.0
50.0
75.0
100.0
Ret
urn
Per
cen
tile
Ra
nk
12/06 6/07 12/07 6/08 12/08 6/09 12/09 6/10 12/10 6/11 9/11
Total Period5-25
Count25-Median
CountMedian-75
Count75-95Count
¢ Total International Equity 19 0 (0%) 12 (63%) 7 (37%) 0 (0%)
Å Total International Equity Policy 20 0 (0%) 1 (5%) 19 (95%) 0 (0%)Over Performance Under Performance Dec-2006 Sep-2011
-20.0
-10.0
0.0
10.0
20.0
30.0
To
tal
Int
ern
atio
na
l E
qu
ity
(%)
-20.0 -10.0 0.0 10.0 20.0 30.0
Total International Equity Policy (%)
Over
Performance
Under
Performance
-20.00
-10.00
0.00
10.00
Ret
urn
(%
)
0.00 4.00 8.00 12.00 16.00 20.00 24.00 28.00 32.00 36.00 40.00
Risk (Standard Deviation %)
ReturnStandardDeviation
¢ Total International Equity 1.06 25.14
Å Total International Equity Policy -0.37 28.97
¾ Median 0.48 29.97
-14.00
-7.00
0.00
7.00
Ret
urn
(%
)
-4.00 0.00 4.00 8.00 12.00 16.00 20.00 24.00 28.00 32.00 36.00 40.00
Risk (Standard Deviation %)
ReturnStandardDeviation
¢ Total International Equity -0.53 22.41
Å Total International Equity Policy -2.83 25.33
¾ Median -1.91 26.48
TrackingError
UpMarketCapture
DownMarketCapture
AlphaInformation
RatioSharpeRatio
BetaDownside
Risk
Total International Equity 6.31 93.00 88.78 1.39 0.18 0.16 0.92 17.82
Total International Equity Policy 0.00 100.00 100.00 0.00 N/A 0.10 1.00 18.2890 Day U.S. Treasury Bill 24.93 0.21 -0.41 0.21 -0.10 N/A 0.00 0.01
TrackingError
UpMarketCapture
DownMarketCapture
AlphaInformation
RatioSharpeRatio
BetaDownside
Risk
Total International Equity 8.01 90.49 83.26 2.11 0.27 0.00 0.89 15.90
Total International Equity Policy 0.00 100.00 100.00 0.00 N/A -0.09 1.00 16.7990 Day U.S. Treasury Bill 22.01 3.47 -2.44 1.71 0.09 N/A 0.00 0.01
Lakeland Police Officers' Retirement SystemTotal International Equity
September 30, 2011
Page 40

Peer Group Analysis - IM International Large Cap Growth Equity (SA+CF)
Comparative Performance
-50.00
-40.00
-30.00
-20.00
-10.00
0.00
10.00
20.00
30.00
40.00
50.00
60.00
Ret
urn
Oct-2010To
Sep-2011
Oct-2009To
Sep-2010
Oct-2008To
Sep-2009
Oct-2007To
Sep-2008
Oct-2006To
Sep-2007
¢ Baring International -6.58 (24) 9.62 (48) N/A N/A N/A
Å MSCI AC World ex USA -10.42 (70) 8.00 (56) 6.43 (33) -29.97 (54) 31.06 (47)
Median -9.00 9.26 3.24 -29.35 30.50
-28.00
-26.00
-24.00
-22.00
-20.00
-18.00
-16.00
-14.00
-12.00
-10.00
-8.00
-6.00
-4.00
-2.00
0.00
2.00
4.00
6.00
8.00
10.00
Ret
urn
1Quarter
Oct-2010To
Sep-2011
1Year
2Years
3Years
4Years
5Years
¢ Baring International -15.19 (7) -6.58 (24) -6.58 (24) 1.20 (31) N/A N/A N/A
Å MSCI AC World ex USA -19.78 (43) -10.42 (70) -10.42 (70) -1.64 (67) 0.98 (52) -7.85 (52) -1.12 (52)
Median -20.11 -9.00 -9.00 -0.05 1.10 -7.76 -1.10
1QuarterEnding
Jun-2011
1QuarterEnding
Mar-2011
1QuarterEnding
Dec-2010
1QuarterEnding
Sep-2010
1QuarterEnding
Jun-2010
1QuarterEnding
Mar-2010
Baring International 1.98 (48) 2.81 (59) 5.06 (92) 14.06 (89) -8.90 (17) 0.28 (82)
MSCI AC World ex USA 0.61 (82) 3.49 (41) 7.25 (63) 16.66 (45) -12.26 (66) 1.66 (49)
IM International Large Cap Growth Equity (SA+CF) 1.93 3.04 7.74 16.39 -11.77 1.55
Lakeland Police Officers' Retirement SystemBaring InternationalSeptember 30, 2011
Page 41

Peer Group Analysis - IM International Multi-Cap Value Equity (MF)
Comparative Performance
-50.00
-45.00
-40.00
-35.00
-30.00
-25.00
-20.00
-15.00
-10.00
-5.00
0.00
5.00
10.00
15.00
20.00
25.00
30.00
35.00
40.00
45.00
Ret
urn
Oct-2010To
Sep-2011
Oct-2009To
Sep-2010
Oct-2008To
Sep-2009
Oct-2007To
Sep-2008
Oct-2006To
Sep-2007
¢ IVA International (IVIQX) N/A N/A N/A N/A N/A
Å MSCI AC World ex USA -10.42 (46) 8.00 (16) 6.43 (30) -29.97 (25) 31.06 (2)
Median -10.77 2.95 3.07 -32.49 22.50
-28.00
-25.00
-22.00
-19.00
-16.00
-13.00
-10.00
-7.00
-4.00
-1.00
2.00
5.00
8.00
11.00
Ret
urn
1Quarter
Oct-2010To
Sep-2011
1Year
2Years
3Years
4Years
5Years
¢ IVA International (IVIQX) -8.93 (1) N/A N/A N/A N/A N/A N/A
Å MSCI AC World ex USA -19.78 (28) -10.42 (46) -10.42 (46) -1.64 (16) 0.98 (18) -7.85 (10) -1.12 (6)
Median -20.99 -10.77 -10.77 -4.02 -2.21 -10.88 -5.02
1QuarterEnding
Jun-2011
1QuarterEnding
Mar-2011
1QuarterEnding
Dec-2010
1QuarterEnding
Sep-2010
1QuarterEnding
Jun-2010
1QuarterEnding
Mar-2010
IVA International (IVIQX) 2.70 (4) 3.41 (56) N/A N/A N/A N/A
MSCI AC World ex USA 0.61 (68) 3.49 (53) 7.25 (48) 16.66 (53) -12.26 (20) 1.66 (56)
IM International Multi-Cap Value Equity (MF) 1.61 3.58 6.93 16.73 -14.41 1.87
Lakeland Police Officers' Retirement SystemIVA International (IVIQX)
September 30, 2011
Page 42

Peer Group Analysis - IM U.S. Broad Market Fixed Income (SA+CF+MF)
Comparative Performance
-16.00
-13.00
-10.00
-7.00
-4.00
-1.00
2.00
5.00
8.00
11.00
14.00
17.00
20.00
23.00
Ret
urn
Oct-2010To
Sep-2011
Oct-2009To
Sep-2010
Oct-2008To
Sep-2009
Oct-2007To
Sep-2008
Oct-2006To
Sep-2007
¢ Total Fixed Income 2.59 (75) 7.74 (90) 9.69 (78) 5.51 (3) 5.50 (23)
Å Total Fixed Income Policy 4.22 (50) 7.52 (91) 9.25 (81) 4.33 (7) 5.47 (24)
Median 4.19 10.05 12.51 -1.49 4.92
-6.00
-4.00
-2.00
0.00
2.00
4.00
6.00
8.00
10.00
12.00
14.00
Ret
urn
1Quarter
Oct-2010To
Sep-2011
1Year
2Years
3Years
4Years
5Years
¢ Total Fixed Income 0.54 (69) 2.59 (75) 2.59 (75) 5.13 (92) 6.63 (90) 6.35 (56) 6.18 (53)
Å Total Fixed Income Policy 2.30 (42) 4.22 (50) 4.22 (50) 5.86 (84) 6.98 (88) 6.31 (57) 6.14 (55)
Median 1.93 4.19 4.19 7.06 8.91 6.61 6.30
1QuarterEnding
Jun-2011
1QuarterEnding
Mar-2011
1QuarterEnding
Dec-2010
1QuarterEnding
Sep-2010
1QuarterEnding
Jun-2010
1QuarterEnding
Mar-2010
Total Fixed Income 2.25 (22) 0.74 (68) -0.94 (59) 2.31 (91) 2.81 (52) 1.25 (97)
Total Fixed Income Policy 2.17 (30) 0.48 (81) -0.75 (50) 2.07 (96) 2.92 (48) 1.81 (84)
IM U.S. Broad Market Fixed Income (SA+CF+MF) 1.94 1.00 -0.78 3.25 2.86 2.48
Lakeland Police Officers' Retirement SystemTotal Fixed IncomeSeptember 30, 2011
Page 43

Peer Group Scattergram - 3 Years
3 Yr Rolling Under/Over Performance - 5 Years
Peer Group Scattergram - 5 Years
3 Yr Rolling Percentile Ranking - 5 Years
Historical Statistics - 3 Years
Historical Statsistics - 5 Years
0.0
25.0
50.0
75.0
100.0
Ret
urn
Per
cen
tile
Ra
nk
12/06 6/07 12/07 6/08 12/08 6/09 12/09 6/10 12/10 6/11 9/11
Total Period5-25
Count25-Median
CountMedian-75
Count75-95Count
¢ Total Fixed Income 19 8 (42%) 5 (26%) 5 (26%) 1 (5%)
Å Total Fixed Income Policy 19 6 (32%) 5 (26%) 4 (21%) 4 (21%)Over Performance Dec-2006 Sep-2011
2.0
4.0
6.0
8.0
To
tal
Fix
ed I
nco
me
(%)
1.0 1.5 2.0 2.5 3.0 3.5 4.0 4.5 5.0 5.5 6.0 6.5 7.0 7.5 8.0 8.5
Total Fixed Income Policy (%)
Over
Performance
Under
Performance
-24.00
-12.00
0.00
12.00
Ret
urn
(%
)
-2.00 0.00 2.00 4.00 6.00 8.00 10.00 12.00 14.00 16.00
Risk (Standard Deviation %)
ReturnStandardDeviation
¢ Total Fixed Income 6.63 2.15
Å Total Fixed Income Policy 6.98 2.20
¾ Median 8.91 4.58
0.00
3.00
6.00
9.00
Ret
urn
(%
)
0.00 2.00 4.00 6.00 8.00 10.00 12.00 14.00
Risk (Standard Deviation %)
ReturnStandardDeviation
¢ Total Fixed Income 6.18 2.44
Å Total Fixed Income Policy 6.14 2.58
¾ Median 6.30 4.72
TrackingError
UpMarketCapture
DownMarketCapture
AlphaInformation
RatioSharpeRatio
BetaDownside
Risk
Total Fixed Income 1.68 93.67 89.40 1.57 -0.21 2.17 0.72 1.55
Total Fixed Income Policy 0.00 100.00 100.00 0.00 N/A 1.88 1.00 1.8490 Day U.S. Treasury Bill 3.52 1.55 -3.59 0.27 -1.88 N/A -0.01 0.01
TrackingError
UpMarketCapture
DownMarketCapture
AlphaInformation
RatioSharpeRatio
BetaDownside
Risk
Total Fixed Income 2.76 90.32 58.03 2.50 0.01 1.38 0.59 1.27
Total Fixed Income Policy 0.00 100.00 100.00 0.00 N/A 1.32 1.00 1.6190 Day U.S. Treasury Bill 3.29 16.53 -20.55 1.70 -1.32 N/A 0.00 0.01
Lakeland Police Officers' Retirement SystemTotal Fixed IncomeSeptember 30, 2011
Page 44

Peer Group Analysis - IM U.S. Broad Market Fixed Income (SA+CF+MF)
Comparative Performance
-35.00
-30.00
-25.00
-20.00
-15.00
-10.00
-5.00
0.00
5.00
10.00
15.00
20.00
25.00
30.00
35.00
40.00
45.00
Ret
urn
2010 2009 2008 2007 2006
¢ Total Domestic Fixed Income 5.49 (94) 8.65 (79) 3.71 (22) 7.29 (13) 4.53 (46)
Å Fixed Income Policy 6.15 (88) 6.94 (87) 4.18 (20) 7.37 (12) 4.10 (67)
Median 7.97 13.73 -3.86 5.68 4.44
-6.00
-4.00
-2.00
0.00
2.00
4.00
6.00
8.00
10.00
12.00
14.00
Ret
urn
1Quarter
Oct-2010To
Sep-2011
1Year
2Years
3Years
4Years
5Years
¢ Total Domestic Fixed Income 2.14 (46) 4.27 (49) 4.27 (49) 5.99 (82) 7.04 (88) 6.55 (52) 6.34 (49)
Å Fixed Income Policy 2.30 (42) 4.22 (50) 4.22 (50) 5.86 (84) 6.98 (88) 6.31 (57) 6.14 (55)
Median 1.93 4.19 4.19 7.06 8.91 6.61 6.30
1QuarterEnding
Jun-2011
1QuarterEnding
Mar-2011
1QuarterEnding
Dec-2010
1QuarterEnding
Sep-2010
1QuarterEnding
Jun-2010
1QuarterEnding
Mar-2010
Total Domestic Fixed Income 2.31 (16) 0.73 (69) -0.95 (59) 2.31 (91) 2.81 (52) 1.25 (97)
Total Fixed Income Policy 2.17 (30) 0.48 (81) -0.75 (50) 2.07 (96) 2.92 (48) 1.81 (84)
IM U.S. Broad Market Fixed Income (SA+CF+MF) 1.94 1.00 -0.78 3.25 2.86 2.48
Lakeland Police Officers' Retirement SystemTotal Domestic Fixed Income
September 30, 2011
Page 45
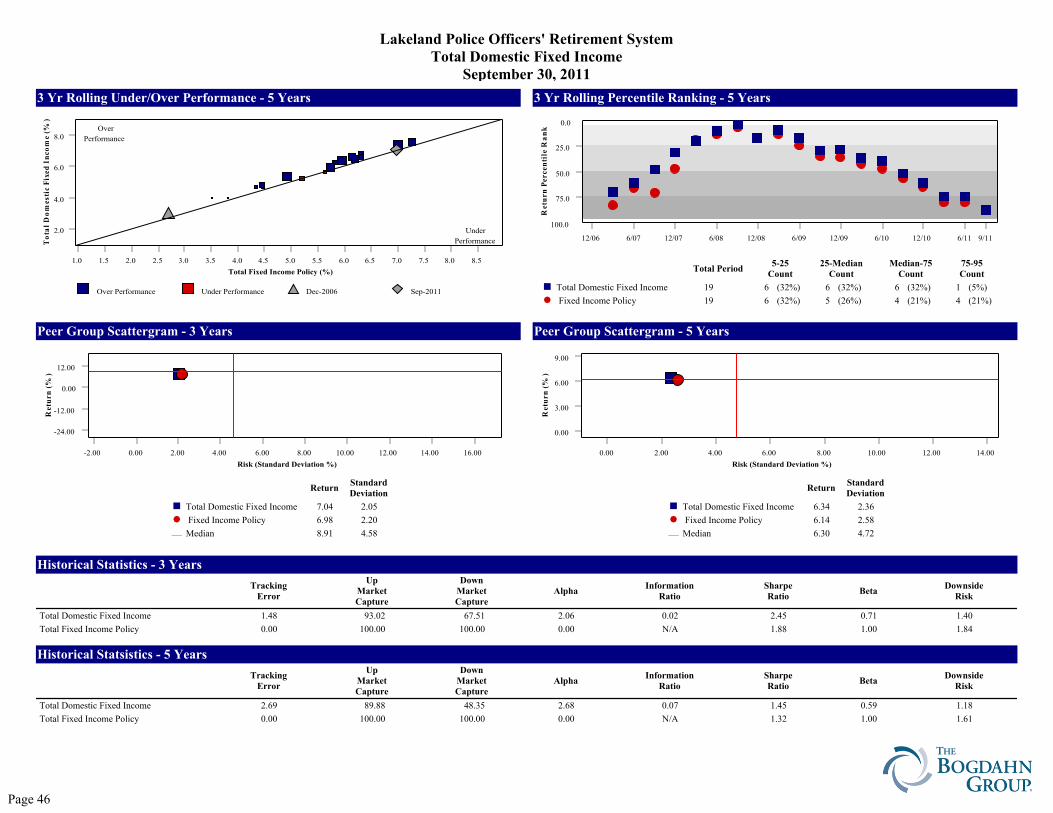
Peer Group Scattergram - 3 Years
3 Yr Rolling Under/Over Performance - 5 Years
Peer Group Scattergram - 5 Years
3 Yr Rolling Percentile Ranking - 5 Years
Historical Statistics - 3 Years
Historical Statsistics - 5 Years
0.0
25.0
50.0
75.0
100.0
Ret
urn
Per
cen
tile
Ra
nk
12/06 6/07 12/07 6/08 12/08 6/09 12/09 6/10 12/10 6/11 9/11
Total Period5-25
Count25-Median
CountMedian-75
Count75-95Count
¢ Total Domestic Fixed Income 19 6 (32%) 6 (32%) 6 (32%) 1 (5%)
Å Fixed Income Policy 19 6 (32%) 5 (26%) 4 (21%) 4 (21%)Over Performance Under Performance Dec-2006 Sep-2011
2.0
4.0
6.0
8.0
To
tal
Do
mes
tic
Fix
ed I
nco
me
(%)
1.0 1.5 2.0 2.5 3.0 3.5 4.0 4.5 5.0 5.5 6.0 6.5 7.0 7.5 8.0 8.5
Total Fixed Income Policy (%)
Over
Performance
Under
Performance
-24.00
-12.00
0.00
12.00
Ret
urn
(%
)
-2.00 0.00 2.00 4.00 6.00 8.00 10.00 12.00 14.00 16.00
Risk (Standard Deviation %)
ReturnStandardDeviation
¢ Total Domestic Fixed Income 7.04 2.05
Å Fixed Income Policy 6.98 2.20
¾ Median 8.91 4.58
0.00
3.00
6.00
9.00
Ret
urn
(%
)
0.00 2.00 4.00 6.00 8.00 10.00 12.00 14.00
Risk (Standard Deviation %)
ReturnStandardDeviation
¢ Total Domestic Fixed Income 6.34 2.36
Å Fixed Income Policy 6.14 2.58
¾ Median 6.30 4.72
TrackingError
UpMarketCapture
DownMarketCapture
AlphaInformation
RatioSharpeRatio
BetaDownside
Risk
Total Domestic Fixed Income 1.48 93.02 67.51 2.06 0.02 2.45 0.71 1.40
Total Fixed Income Policy 0.00 100.00 100.00 0.00 N/A 1.88 1.00 1.8490 Day U.S. Treasury Bill 3.52 1.55 -3.59 0.27 -1.88 N/A -0.01 0.01
TrackingError
UpMarketCapture
DownMarketCapture
AlphaInformation
RatioSharpeRatio
BetaDownside
Risk
Total Domestic Fixed Income 2.69 89.88 48.35 2.68 0.07 1.45 0.59 1.18
Total Fixed Income Policy 0.00 100.00 100.00 0.00 N/A 1.32 1.00 1.6190 Day U.S. Treasury Bill 3.29 16.53 -20.55 1.70 -1.32 N/A 0.00 0.01
Lakeland Police Officers' Retirement SystemTotal Domestic Fixed Income
September 30, 2011
Page 46

Peer Group Analysis - IM U.S. Intermediate Duration (SA+CF)
Comparative Performance
-6.00
-4.00
-2.00
0.00
2.00
4.00
6.00
8.00
10.00
12.00
14.00
16.00
18.00
20.00
Ret
urn
Oct-2010To
Sep-2011
Oct-2009To
Sep-2010
Oct-2008To
Sep-2009
Oct-2007To
Sep-2008
Oct-2006To
Sep-2007
¢ Galliard Fixed Income 4.13 (28) 7.79 (70) 9.54 (83) N/A N/A
Å Barclays Capital Intermediate Aggregate 4.22 (20) 7.52 (79) 9.69 (82) 4.16 (34) 5.33 (69)
Median 3.59 8.27 11.53 3.21 5.49
-2.00
-1.00
0.00
1.00
2.00
3.00
4.00
5.00
6.00
7.00
8.00
9.00
10.00
11.00
12.00R
etu
rn
1Quarter
Oct-2010To
Sep-2011
1Year
2Years
3Years
4Years
5Years
¢ Galliard Fixed Income 2.18 (37) 4.13 (28) 4.13 (28) 5.94 (49) 7.13 (78) N/A N/A
Å Barclays Capital Intermediate Aggregate 2.30 (33) 4.22 (20) 4.22 (20) 5.86 (56) 7.12 (79) 6.37 (61) 6.16 (63)
Median 2.01 3.59 3.59 5.93 7.84 6.61 6.40
1QuarterEnding
Jun-2011
1QuarterEnding
Mar-2011
1QuarterEnding
Dec-2010
1QuarterEnding
Sep-2010
1QuarterEnding
Jun-2010
1QuarterEnding
Mar-2010
Galliard Fixed Income 2.28 (6) 0.63 (46) -1.00 (42) 2.34 (80) 2.84 (52) 1.29 (95)
Barclays Capital Intermediate Aggregate 2.17 (17) 0.48 (69) -0.75 (28) 2.07 (90) 2.92 (45) 1.81 (57)
IM U.S. Intermediate Duration (SA+CF) 2.00 0.60 -1.09 2.78 2.85 1.85
Lakeland Police Officers' Retirement SystemGalliard Fixed Income
September 30, 2011
Page 47

Peer Group Scattergram - 3 Years
3 Yr Rolling Under/Over Performance - 5 Years
Peer Group Scattergram - 5 Years
3 Yr Rolling Percentile Ranking - 5 Years
Historical Statistics - 3 Years
Historical Statsistics - 5 Years
0.0
25.0
50.0
75.0
100.0
Ret
urn
Per
cen
tile
Ra
nk
12/06 6/07 12/07 6/08 12/08 6/09 12/09 6/10 12/10 6/11 9/11
Total Period5-25
Count25-Median
CountMedian-75
Count75-95Count
¢ Galliard Fixed Income 3 0 (0%) 0 (0%) 2 (67%) 1 (33%)
Å Barclays Capital Intermediate Aggregate 20 0 (0%) 7 (35%) 12 (60%) 1 (5%)Over Performance Dec-2006 Sep-2011
5.0
6.0
7.0
Ga
llia
rd F
ixed
In
com
e (%
)
4.5 5.0 5.5 6.0 6.5 7.0 7.5
Barclays Capital Intermediate Aggregate (%)
Over
Performance
Under
Performance
3.00
6.00
9.00
Ret
urn
(%
)
1.20 1.60 2.00 2.40 2.80 3.20 3.60 4.00 4.40 4.80 5.20 5.60 6.00
Risk (Standard Deviation %)
ReturnStandardDeviation
¢ Galliard Fixed Income 7.13 2.09
Å Barclays Capital Intermediate Aggregate 7.12 2.42
¾ Median 7.84 3.32
2.80
4.20
5.60
7.00
Ret
urn
(%
)
1.80 2.10 2.40 2.70 3.00 3.30 3.60 3.90 4.20 4.50 4.80 5.10 5.40
Risk (Standard Deviation %)
ReturnStandardDeviation
¢ Galliard Fixed Income N/A N/A
Å Barclays Capital Intermediate Aggregate 6.16 2.63
¾ Median 6.40 3.44
TrackingError
UpMarketCapture
DownMarketCapture
AlphaInformation
RatioSharpeRatio
BetaDownside
Risk
Galliard Fixed Income 1.35 90.08 50.63 1.75 -0.01 2.56 0.75 1.26
Barclays Capital Intermediate Aggregate 0.00 100.00 100.00 0.00 N/A 2.12 1.00 1.4590 Day U.S. Treasury Bill 3.18 1.62 -3.96 0.25 -2.12 N/A -0.01 0.01
TrackingError
UpMarketCapture
DownMarketCapture
AlphaInformation
RatioSharpeRatio
BetaDownside
Risk
Galliard Fixed Income N/A N/A N/A N/A N/A N/A N/A N/A
Barclays Capital Intermediate Aggregate 0.00 100.00 100.00 0.00 N/A 1.46 1.00 1.2890 Day U.S. Treasury Bill 2.98 16.81 -24.63 1.71 -1.46 N/A 0.00 0.01
Lakeland Police Officers' Retirement SystemGalliard Fixed Income
September 30, 2011
Page 48

Peer Group Analysis - IM U.S. TIPS (SA+CF)
Comparative Performance
2.00
3.00
4.00
5.00
6.00
7.00
8.00
9.00
10.00
11.00
12.00
13.00
14.00
Ret
urn
Oct-2010To
Sep-2011
Oct-2009To
Sep-2010
Oct-2008To
Sep-2009
Oct-2007To
Sep-2008
Oct-2006To
Sep-2007
¢ Galliard TIPS 6.78 (94) 6.87 (96) 3.86 (90) N/A N/A
Å Barclays Capital U.S. TIPS 9.87 (36) 8.89 (78) 5.67 (66) 6.20 (63) 4.97 (65)
Median 9.78 9.35 6.18 6.35 5.11
-1.00
0.00
1.00
2.00
3.00
4.00
5.00
6.00
7.00
8.00
9.00
10.00
11.00
12.00
13.00
Ret
urn
1Quarter
Oct-2010To
Sep-2011
1Year
2Years
3Years
4Years
5Years
¢ Galliard TIPS 1.46 (94) 6.78 (94) 6.78 (94) 6.82 (95) 5.83 (96) N/A N/A
Å Barclays Capital U.S. TIPS 4.51 (65) 9.87 (36) 9.87 (36) 9.38 (63) 8.13 (67) 7.64 (72) 7.10 (68)
Median 4.73 9.78 9.78 9.56 8.42 7.80 7.24
1QuarterEnding
Jun-2011
1QuarterEnding
Mar-2011
1QuarterEnding
Dec-2010
1QuarterEnding
Sep-2010
1QuarterEnding
Jun-2010
1QuarterEnding
Mar-2010
Galliard TIPS 2.80 (94) 2.39 (3) -0.01 (15) 1.76 (98) 2.24 (94) 0.53 (85)
Barclays Capital U.S. TIPS 3.66 (31) 2.08 (56) -0.65 (37) 2.48 (72) 3.82 (61) 0.56 (73)
IM U.S. TIPS (SA+CF) 3.58 2.11 -0.72 2.67 3.89 0.71
Lakeland Police Officers' Retirement SystemGalliard TIPS
September 30, 2011
Page 49

Peer Group Scattergram - 3 Years
3 Yr Rolling Under/Over Performance - 5 Years
Peer Group Scattergram - 5 Years
3 Yr Rolling Percentile Ranking - 5 Years
Historical Statistics - 3 Years
Historical Statsistics - 5 Years
0.0
25.0
50.0
75.0
100.0
Ret
urn
Per
cen
tile
Ra
nk
12/06 6/07 12/07 6/08 12/08 6/09 12/09 6/10 12/10 6/11 9/11
Total Period5-25
Count25-Median
CountMedian-75
Count75-95Count
¢ Galliard TIPS 3 0 (0%) 0 (0%) 0 (0%) 3 (100%)
Å Barclays Capital U.S. TIPS 20 0 (0%) 0 (0%) 14 (70%) 6 (30%)Under Performance Dec-2006 Sep-2011
4.0
6.0
8.0
Ga
llia
rd T
IP
S (%
)
2.5 3.0 3.5 4.0 4.5 5.0 5.5 6.0 6.5 7.0 7.5 8.0 8.5 9.0 9.5
Barclays Capital U.S. TIPS (%)
Over
Performance
Under
Performance
6.00
8.00
10.00
Ret
urn
(%
)
2.80 3.00 3.20 3.40 3.60 3.80 4.00 4.20 4.40 4.60 4.80 5.00 5.20 5.40
Risk (Standard Deviation %)
ReturnStandardDeviation
¢ Galliard TIPS 5.83 4.32
Å Barclays Capital U.S. TIPS 8.13 4.73
¾ Median 8.42 4.25
5.00
6.00
7.00
8.00
Ret
urn
(%
)
3.80 4.00 4.20 4.40 4.60 4.80 5.00 5.20 5.40 5.60 5.80
Risk (Standard Deviation %)
ReturnStandardDeviation
¢ Galliard TIPS N/A N/A
Å Barclays Capital U.S. TIPS 7.10 5.40
¾ Median 7.24 5.25
TrackingError
UpMarketCapture
DownMarketCapture
AlphaInformation
RatioSharpeRatio
BetaDownside
Risk
Galliard TIPS 3.19 67.87 63.20 0.23 -0.73 0.94 0.69 4.14
Barclays Capital U.S. TIPS 0.00 100.00 100.00 0.00 N/A 0.96 1.00 5.6190 Day U.S. Treasury Bill 8.31 0.88 -1.24 0.27 -0.96 N/A -0.01 0.01
TrackingError
UpMarketCapture
DownMarketCapture
AlphaInformation
RatioSharpeRatio
BetaDownside
Risk
Galliard TIPS N/A N/A N/A N/A N/A N/A N/A N/A
Barclays Capital U.S. TIPS 0.00 100.00 100.00 0.00 N/A 0.73 1.00 4.9290 Day U.S. Treasury Bill 7.50 8.49 -9.75 1.74 -0.73 N/A 0.00 0.01
Lakeland Police Officers' Retirement SystemGalliard TIPS
September 30, 2011
Page 50

Peer Group Analysis - IM Global Fixed Income (MF)
Comparative Performance
-30.00
-25.00
-20.00
-15.00
-10.00
-5.00
0.00
5.00
10.00
15.00
20.00
25.00
30.00
35.00
40.00
45.00
50.00
Ret
urn
2010 2009 2008 2007 2006
¢ Total Global Fixed Income N/A N/A N/A N/A N/A
Å Barclays Capital Global Aggregate 5.54 (67) 6.93 (85) 4.79 (14) 9.48 (18) 6.64 (37)
Median 6.39 12.17 -2.75 7.72 5.66
-10.00
-8.00
-6.00
-4.00
-2.00
0.00
2.00
4.00
6.00
8.00
10.00
12.00
14.00
16.00R
etu
rn
1Quarter
Oct-2010To
Sep-2011
1Year
2Years
3Years
4Years
5Years
¢ Total Global Fixed Income -7.86 (98) N/A N/A N/A N/A N/A N/A
Å Barclays Capital Global Aggregate 0.97 (32) 4.00 (11) 4.00 (11) 5.02 (47) 7.78 (42) 6.51 (28) 6.85 (25)
Median -1.44 1.44 1.44 4.79 7.38 5.26 5.78
1QuarterEnding
Jun-2011
1QuarterEnding
Mar-2011
1QuarterEnding
Dec-2010
1QuarterEnding
Sep-2010
1QuarterEnding
Jun-2010
1QuarterEnding
Mar-2010
Total Global Fixed Income 2.31 (49) N/A N/A N/A N/A N/A
Barclays Capital Global Aggregate 3.10 (16) 1.24 (66) -1.33 (56) 7.30 (56) -0.04 (54) -0.27 (94)
IM Global Fixed Income (MF) 2.28 1.56 -1.10 7.43 0.41 1.33
Lakeland Police Officers' Retirement SystemTotal Global Fixed Income
September 30, 2011
Page 51

Peer Group Analysis - IM Global Fixed Income (MF)
Comparative Performance
-30.00
-25.00
-20.00
-15.00
-10.00
-5.00
0.00
5.00
10.00
15.00
20.00
25.00
30.00
35.00
40.00
45.00
50.00
Ret
urn
2010 2009 2008 2007 2006
¢ Templeton Global Return (TTRZX) N/A N/A N/A N/A N/A
Å Barclays Capital Global Aggregate 5.54 (67) 6.93 (85) 4.79 (14) 9.48 (18) 6.64 (37)
Median 6.39 12.17 -2.75 7.72 5.66
-10.00
-8.00
-6.00
-4.00
-2.00
0.00
2.00
4.00
6.00
8.00
10.00
12.00
14.00
16.00R
etu
rn
1Quarter
Oct-2010To
Sep-2011
1Year
2Years
3Years
4Years
5Years
¢ Templeton Global Return (TTRZX) -7.86 (98) N/A N/A N/A N/A N/A N/A
Å Barclays Capital Global Aggregate 0.97 (32) 4.00 (11) 4.00 (11) 5.02 (47) 7.78 (42) 6.51 (28) 6.85 (25)
Median -1.44 1.44 1.44 4.79 7.38 5.26 5.78
1QuarterEnding
Jun-2011
1QuarterEnding
Mar-2011
1QuarterEnding
Dec-2010
1QuarterEnding
Sep-2010
1QuarterEnding
Jun-2010
1QuarterEnding
Mar-2010
Templeton Global Return (TTRZX) 2.31 (49) N/A N/A N/A N/A N/A
Barclays Capital Global Aggregate 3.10 (16) 1.24 (66) -1.33 (56) 7.30 (56) -0.04 (54) -0.27 (94)
IM Global Fixed Income (MF) 2.28 1.56 -1.10 7.43 0.41 1.33
Lakeland Police Officers' Retirement SystemTempleton Global Return (TTRZX)
September 30, 2011
Page 52

Peer Group Analysis - IM U.S. Open End Private Real Estate (SA+CF)
Comparative Performance
-70.00
-60.00
-50.00
-40.00
-30.00
-20.00
-10.00
0.00
10.00
20.00
30.00
40.00
Ret
urn
Oct-2010To
Sep-2011
Oct-2009To
Sep-2010
Oct-2008To
Sep-2009
Oct-2007To
Sep-2008
Oct-2006To
Sep-2007
¢ Total Real Estate 15.54 (91) N/A N/A N/A N/A
Å NCREIF ODCE 18.34 (50) 6.97 (47) -35.19 (53) 3.19 (52) 18.21 (56)
Median 18.32 6.60 -33.44 3.47 18.53
-19.00
-16.00
-13.00
-10.00
-7.00
-4.00
-1.00
2.00
5.00
8.00
11.00
14.00
17.00
20.00
23.00
26.00
29.00
Ret
urn
1Quarter
Oct-2010To
Sep-2011
1Year
2Years
3Years
4Years
5Years
¢ Total Real Estate 1.95 (100) 15.54 (91) 15.54 (91) N/A N/A N/A N/A
Å NCREIF ODCE 3.58 (30) 18.34 (50) 18.34 (50) 12.51 (37) -6.38 (47) -4.08 (47) 0.02 (47)
Median 3.39 18.32 18.32 11.73 -8.53 -5.13 -1.10
1QuarterEnding
Jun-2011
1QuarterEnding
Mar-2011
1QuarterEnding
Dec-2010
1QuarterEnding
Sep-2010
1QuarterEnding
Jun-2010
1QuarterEnding
Mar-2010
Total Real Estate 3.18 (88) 5.00 (39) 4.60 (45) N/A N/A N/A
NCREIF ODCE 4.62 (53) 4.01 (69) 4.99 (31) 5.45 (53) 4.32 (30) 0.75 (44)
IM U.S. Open End Private Real Estate (SA+CF) 4.79 4.49 4.55 5.90 3.47 0.68
Lakeland Police Officers' Retirement SystemTotal Real Estate
September 30, 2011
Page 53

Peer Group Analysis - IM U.S. Open End Private Real Estate (SA+CF)
Comparative Performance
-70.00
-60.00
-50.00
-40.00
-30.00
-20.00
-10.00
0.00
10.00
20.00
30.00
40.00
Ret
urn
Oct-2010To
Sep-2011
Oct-2009To
Sep-2010
Oct-2008To
Sep-2009
Oct-2007To
Sep-2008
Oct-2006To
Sep-2007
¢ American Realty 14.50 (90) N/A N/A N/A N/A
Å NCREIF ODCE 18.34 (50) 6.97 (47) -35.19 (53) 3.19 (52) 18.21 (56)
Median 18.32 6.60 -33.44 3.47 18.53
-19.00
-16.00
-13.00
-10.00
-7.00
-4.00
-1.00
2.00
5.00
8.00
11.00
14.00
17.00
20.00
23.00
26.00
29.00
Ret
urn
1Quarter
Oct-2010To
Sep-2011
1Year
2Years
3Years
4Years
5Years
¢ American Realty -0.85 (100) 14.50 (90) 14.50 (90) N/A N/A N/A N/A
Å NCREIF ODCE 3.58 (30) 18.34 (50) 18.34 (50) 12.51 (37) -6.38 (47) -4.08 (47) 0.02 (47)
Median 3.39 18.32 18.32 11.73 -8.53 -5.13 -1.10
1QuarterEnding
Jun-2011
1QuarterEnding
Mar-2011
1QuarterEnding
Dec-2010
1QuarterEnding
Sep-2010
1QuarterEnding
Jun-2010
1QuarterEnding
Mar-2010
American Realty 2.91 (92) 8.58 (4) 3.35 (85) N/A N/A N/A
NCREIF ODCE 4.62 (53) 4.01 (69) 4.99 (31) 5.45 (53) 4.32 (30) 0.75 (44)
IM U.S. Open End Private Real Estate (SA+CF) 4.79 4.49 4.55 5.90 3.47 0.68
Lakeland Police Officers' Retirement SystemAmerican Realty
September 30, 2011
Page 54

Peer Group Analysis - IM U.S. Open End Private Real Estate (SA+CF)
Comparative Performance
-70.00
-60.00
-50.00
-40.00
-30.00
-20.00
-10.00
0.00
10.00
20.00
30.00
40.00
Ret
urn
Oct-2010To
Sep-2011
Oct-2009To
Sep-2010
Oct-2008To
Sep-2009
Oct-2007To
Sep-2008
Oct-2006To
Sep-2007
¢ Intercontinental Real Estate 16.72 (70) N/A N/A N/A N/A
Å NCREIF ODCE 18.34 (50) 6.97 (47) -35.19 (53) 3.19 (52) 18.21 (56)
Median 18.32 6.60 -33.44 3.47 18.53
-19.00
-16.00
-13.00
-10.00
-7.00
-4.00
-1.00
2.00
5.00
8.00
11.00
14.00
17.00
20.00
23.00
26.00
29.00
Ret
urn
1Quarter
Oct-2010To
Sep-2011
1Year
2Years
3Years
4Years
5Years
¢ Intercontinental Real Estate 3.17 (59) 16.72 (70) 16.72 (70) N/A N/A N/A N/A
Å NCREIF ODCE 3.58 (30) 18.34 (50) 18.34 (50) 12.51 (37) -6.38 (47) -4.08 (47) 0.02 (47)
Median 3.39 18.32 18.32 11.73 -8.53 -5.13 -1.10
1QuarterEnding
Jun-2011
1QuarterEnding
Mar-2011
1QuarterEnding
Dec-2010
1QuarterEnding
Sep-2010
1QuarterEnding
Jun-2010
1QuarterEnding
Mar-2010
Intercontinental Real Estate 3.36 (87) 4.43 (54) 4.81 (42) N/A N/A N/A
NCREIF ODCE 4.62 (53) 4.01 (69) 4.99 (31) 5.45 (53) 4.32 (30) 0.75 (44)
IM U.S. Open End Private Real Estate (SA+CF) 4.79 4.49 4.55 5.90 3.47 0.68
Lakeland Police Officers' Retirement SystemIntercontinental Real Estate
September 30, 2011
Page 55

Total Fund Policy Total Fixed Income Policy
Russell 3000 Policy (Bowen Hanes)
Allocation Mandate Weight (%)
Mar-2004
ML US Corporate Master Investment Grade 100.00
Sep-2004
BofA Merrill Lynch US Corp & Gov 1-10 Yrs 100.00
Apr-2008
Barclays Capital Intermediate Aggregate 87.50
Barclays Capital U.S. Treasury: U.S. TIPS 12.50
Jul-2009
Barclays Capital Intermediate Aggregate 100.00
Allocation Mandate Weight (%)
Jan-1976
S&P 500 60.00
ML US Corporate Master Investment Grade 40.00
Sep-2004
Russell 3000 Index 50.00
MSCI EAFE Index 10.00
BofA Merrill Lynch US Corp & Gov 1-10 Yrs 40.00
Apr-2008
Russell 3000 Index 50.00
MSCI EAFE Index 10.00
Barclays Capital Intermediate Aggregate 35.00
Barclays Capital U.S. Treasury: U.S. TIPS 5.00
Jul-2009
Russell 3000 Index 45.00
MSCI EAFE Index 15.00
Barclays Capital Intermediate Aggregate 40.00
Jan-2010
Russell 3000 Index 45.00
MSCI AC World ex USA 15.00
Barclays Capital Intermediate Aggregate 35.00
Barclays Capital U.S. Treasury: U.S. TIPS 5.00
Oct-2010
Russell 3000 Index 45.00
MSCI AC World ex USA 15.00
Barclays Capital Intermediate Aggregate 30.00
Barclays Capital U.S. Treasury: U.S. TIPS 5.00
NCREIF OEDC (Monthly) 5.00
Allocation Mandate Weight (%)
Mar-2008
S&P 500 100.00
Jan-2010
Russell 3000 Index 100.00
Lakeland Police Officers' Retirement System
Benchmark History
As of September 30,2011
Page 56
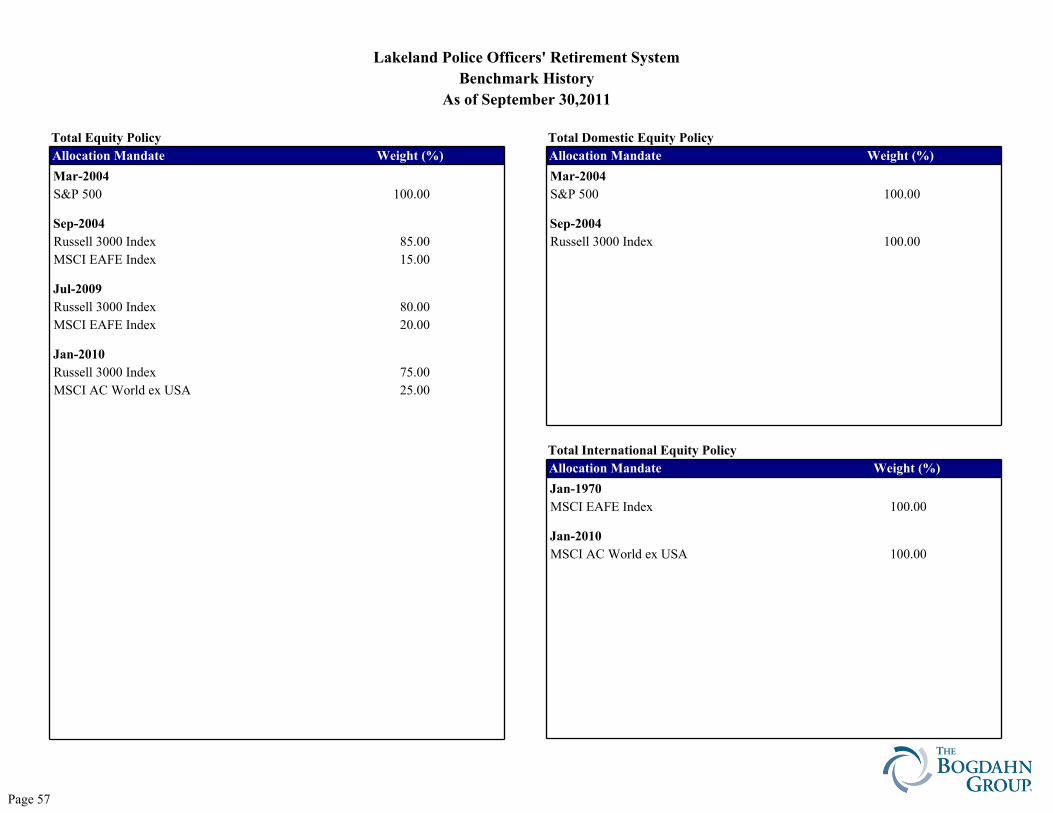
Total Equity Policy Total Domestic Equity Policy
Total International Equity Policy
Allocation Mandate Weight (%)
Mar-2004
S&P 500 100.00
Sep-2004
Russell 3000 Index 100.00
Allocation Mandate Weight (%)
Mar-2004
S&P 500 100.00
Sep-2004
Russell 3000 Index 85.00
MSCI EAFE Index 15.00
Jul-2009
Russell 3000 Index 80.00
MSCI EAFE Index 20.00
Jan-2010
Russell 3000 Index 75.00
MSCI AC World ex USA 25.00
Allocation Mandate Weight (%)
Jan-1970
MSCI EAFE Index 100.00
Jan-2010
MSCI AC World ex USA 100.00
Lakeland Police Officers' Retirement System
Benchmark History
As of September 30,2011
Page 57
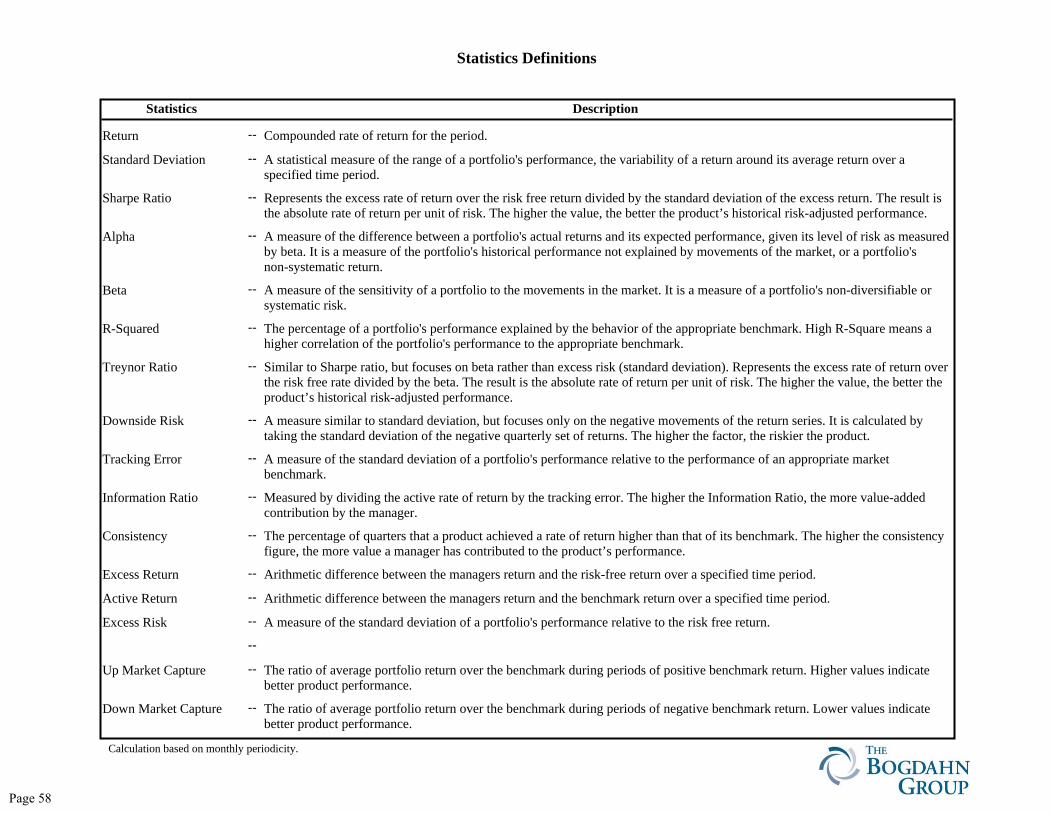
Statistics Description
Return Compounded rate of return for the period.--
Standard Deviation A statistical measure of the range of a portfolio's performance, the variability of a return around its average return over aspecified time period.
--
Sharpe Ratio Represents the excess rate of return over the risk free return divided by the standard deviation of the excess return. The result isthe absolute rate of return per unit of risk. The higher the value, the better the product’s historical risk-adjusted performance.
--
Alpha A measure of the difference between a portfolio's actual returns and its expected performance, given its level of risk as measuredby beta. It is a measure of the portfolio's historical performance not explained by movements of the market, or a portfolio'snon-systematic return.
--
Beta A measure of the sensitivity of a portfolio to the movements in the market. It is a measure of a portfolio's non-diversifiable orsystematic risk.
--
R-Squared The percentage of a portfolio's performance explained by the behavior of the appropriate benchmark. High R-Square means ahigher correlation of the portfolio's performance to the appropriate benchmark.
--
Treynor Ratio Similar to Sharpe ratio, but focuses on beta rather than excess risk (standard deviation). Represents the excess rate of return overthe risk free rate divided by the beta. The result is the absolute rate of return per unit of risk. The higher the value, the better theproduct’s historical risk-adjusted performance.
--
Downside Risk A measure similar to standard deviation, but focuses only on the negative movements of the return series. It is calculated bytaking the standard deviation of the negative quarterly set of returns. The higher the factor, the riskier the product.
--
Tracking Error A measure of the standard deviation of a portfolio's performance relative to the performance of an appropriate marketbenchmark.
--
Information Ratio Measured by dividing the active rate of return by the tracking error. The higher the Information Ratio, the more value-addedcontribution by the manager.
--
Consistency The percentage of quarters that a product achieved a rate of return higher than that of its benchmark. The higher the consistencyfigure, the more value a manager has contributed to the product’s performance.
--
Excess Return Arithmetic difference between the managers return and the risk-free return over a specified time period.--
Active Return Arithmetic difference between the managers return and the benchmark return over a specified time period.--
Excess Risk A measure of the standard deviation of a portfolio's performance relative to the risk free return.--
--
Up Market Capture The ratio of average portfolio return over the benchmark during periods of positive benchmark return. Higher values indicatebetter product performance.
--
Down Market Capture The ratio of average portfolio return over the benchmark during periods of negative benchmark return. Lower values indicatebetter product performance.
--
Statistics Definitions
Calculation based on monthly periodicity.
Page 58