2010 trpm4 differentially regulates th1 and th2 function by altering calcium signaling and nfat...
DESCRIPTION
TRPM4TRANSCRIPT
of February 2, 2015.This information is current as
NFAT LocalizationFunction by Altering Calcium Signaling and Trpm4 Differentially Regulates Th1 and Th2
M. AllenK. Scott Weber, Kai Hildner, Kenneth M. Murphy and Paul
http://www.jimmunol.org/content/185/5/2836doi: 10.4049/jimmunol.1000880July 2010;
2010; 185:2836-2846; Prepublished online 23J Immunol
MaterialSupplementary
0.DC1.htmlhttp://www.jimmunol.org/content/suppl/2010/07/21/jimmunol.100088
Referenceshttp://www.jimmunol.org/content/185/5/2836.full#ref-list-1
, 21 of which you can access for free at: cites 41 articlesThis article
Subscriptionshttp://jimmunol.org/subscriptions
is online at: The Journal of ImmunologyInformation about subscribing to
Permissionshttp://www.aai.org/ji/copyright.htmlSubmit copyright permission requests at:
Email Alertshttp://jimmunol.org/cgi/alerts/etocReceive free email-alerts when new articles cite this article. Sign up at:
Print ISSN: 0022-1767 Online ISSN: 1550-6606. Immunologists, Inc. All rights reserved.Copyright © 2010 by The American Association of9650 Rockville Pike, Bethesda, MD 20814-3994.The American Association of Immunologists, Inc.,
is published twice each month byThe Journal of Immunology
at Universidad de C
hile on February 2, 2015http://w
ww
.jimm
unol.org/D
ownloaded from
at U
niversidad de Chile on February 2, 2015
http://ww
w.jim
munol.org/
Dow
nloaded from
The Journal of Immunology
Trpm4 Differentially Regulates Th1 and Th2 Function byAltering Calcium Signaling and NFAT Localization
K. Scott Weber,* Kai Hildner,† Kenneth M. Murphy,*,‡ and Paul M. Allen*
Th cell subsets have unique calcium (Ca2+) signals when activated with identical stimuli. The regulation of these Ca2+ signals
and their correlation to the biological function of each T cell subset remains unclear. Trpm4 is a Ca2+-activated cation channel that
we found is expressed at higher levels in Th2 cells compared with Th1 cells. Inhibition of Trpm4 expression increased Ca2+ influx
and oscillatory levels in Th2 cells and decreased influx and oscillations in Th1 cells. This inhibition of Trpm4 expression also
significantly altered T cell cytokine production and motility. Our experiments revealed that decreasing Trpm4 levels divergently
regulates nuclear localization of NFATc1. Consistent with this, gene profiling did not show Trpm4-dependent transcriptional
regulation, and T-bet and GATA-3 levels remain identical. Thus, Trpm4 is expressed at different levels in Th cells and plays
a distinctive role in T cell function by differentially regulating Ca2+ signaling and NFATc1 localization. The Journal of Immu-
nology, 2010, 185: 2836–2846.
Tcell interactions with Ag initiate a cascade of signalingevents that lead to an increase in intracellular calcium(Ca2+) concentrations. TCR-stimulated influx of Ca2+ is
required for T cell activation and downstream effector functions,such as gene expression, cell motility, and cytokine production(1, 2). The amplitude, duration, and kinetics of the Ca2+ signalencode information that plays an important role in altering theefficiency and specificity of gene expression, T cell motility, andsubsequent T cell function (3–5).Activation of polarized Th1 or Th2 cells results in the production
of a discrete subset of cytokines that helps orchestrate the involve-ment of numerous immune cells. Th1 cells help clear intracellularpathogens by secreting IFN-g and promoting macrophage acti-vation. Th2 cells aid in the clearance of parasites by secretingIL-4, IL-5, and IL-13 and promoting Ab-mediated immunity byactivating mast and B cells (6, 7). Besides distinct cytokine produc-tion, Th cell subsets exhibit unique intracellular Ca2+ patterns afterstimulation with identical Ag. Th2 cells have lower sustained Ca2+
levels and fewer oscillations compared with Th1 cells (8–11). Thebiological importance of these unique intracellular Ca2+ signals inTh cells remains unclear.Ca2+ influx oscillations in T cells are proposed to be due to
a cyclical interaction of Ca2+ release from intracellular stores andthe Ca2+ release-activated Ca2+ (CRAC) channel and Ca2+-activated K+ current (Kca) channels in the plasma membrane (2,
12). Analysis of the differences in Th cell Ca2+ signaling hasshown Th1 cells have increased functional Kca channels and
Th2 cells have an increased rate of cytosolic Ca2+ clearance
(11). More recent work using Jurkat T cells provided evidence
that Ca2+ influx and oscillations are also regulated by Trpm4,
a sodium (Na+) channel that mediates cell membrane depolariza-
tion (13).In electrically nonexcited cells, such as T cells and mast cells,
Trpm4 depolarizes the cell membrane by transporting Na+ into
the cell, and this inhibits Ca2+ ions from entering the cell by de-
creasing the driving force of CRAC-mediated Ca2+ influx (13–15).
Trpm4 has also been shown to play important roles in IgE-dependent
mast cell activation and anaphylactic responses, IL-2 production in
Jurkat T cells, dendritic cell migration, and the initiation of hemor-
rhages caused by spinal cord injury (13, 15–17). Our examination by
expression microarray, RT-PCR, and Western blot revealed that
Trpm4 is expressed at higher levels in Th2 cells compared with
Th1 cells, and lead us to hypothesize that Trpm4 plays a role in
the different Ca2+ influx patterns and cytokine differences between
Th cell subsets.To test the hypothesis that Trpm4 regulates the unique in-
tracellular Ca2+ signaling in Th cells, we inhibited Trpm4 ex-
pression levels using either Trpm4 small interfering RNA (siRNA)
or a Trpm4 dominant-negative (DN) mutant. The Trpm4 mutant is
missing the first 177 aa at the N terminus and has been shown to
successfully inhibit Trpm4 in Jurkat cells in a DN manner (13).
Inhibition of Trpm4 expression in Th2 cells resulted in an increase
in Ca2+ influx and oscillations compared with controls, whereas
the opposite was seen with Th1 cells. Th2 cells with Trpm4 ex-
pression inhibited were less motile when compared with controls,
and the converse was true in Th1 cells. ELISPOT analysis revealed
significant changes in IL-2, IL-4, and IFN-g production in Th1
and Th2 cells when Trpm4 expression was inhibited. Examination
of expression microarrays did not reveal Trpm4-dependent tran-
scriptional regulation. We did not see differences in the transcrip-
tion factor T-bet or GATA-3, but Trpm4 significantly affected
NFATc1 nuclear localization in Th1 and Th2 cells. Together, these
findings show Trpm4 affects Th1 and Th2 cellular motility and
cytokine production through differential regulation of Ca2+ signal-
ing and NFATc1 localization.
*Department of Pathology and Immunology and ‡Howard Hughes Medical Institute,Washington University School of Medicine, St. Louis, MO 63110; and †University ofErlangen-Nuremberg, University Hospital Erlangen, Erlangen, Germany
Received for publication March 17, 2010. Accepted for publication June 22, 2010.
This work was supported by National Institutes of Health grants (to P.M.A.). K.S.W.was supported in part by a National Institutes of Health training grant.
The sequences presented in this article have been submitted to the National Centerfor Biotechnology Information Gene Expression Omnibus Web site under accessionnumber GSE21996.
Address correspondence and reprint requests to Dr. Paul M. Allen, WashingtonUniversity School of Medicine, 425 South Euclid Avenue, Campus Box 8118, St.Louis, MO 63110. E-mail address: [email protected]
The online version of this article contains supplemental material.
Abbreviations used in this paper: CRAC, Ca2+ release-activated Ca2+ channel; DN,dominant negative; Kca, Ca
2+-activated K+ current; siRNA, small interfering RNA.
Copyright� 2010 by TheAmericanAssociation of Immunologists, Inc. 0022-1767/10/$16.00
www.jimmunol.org/cgi/doi/10.4049/jimmunol.1000880
at Universidad de C
hile on February 2, 2015http://w
ww
.jimm
unol.org/D
ownloaded from
Materials and MethodsT cell isolation and maintenance
T cells were isolated and maintained, as previously published (10). In brief,primary 2.102 T cells were isolated from the spleens of RAG1-deficient2.102 TCR-transgenic mice (18) and T cells were enriched using CD4+
beads and magnetic cell sorting (Miltenyi Biotec, Auburn, CA). CBA/Jmice were purchased from The Jackson Laboratory (Bar Harbor, ME), andspleen cells, containing the endogenous Hbd epitope that stimulates2.102 cells, were isolated and irradiated (2000 rad) for use as APCs. Allmice used in this study were between 5 and 10 wk of age. The 2.102T cells (1 3 106) and irradiated CBA/J spleen cells (5 3 106) were addedto a 12-well cell culture plate with the addition of the T cell-specificcytokines and Abs described below. Primary T cells were cultivated inmedia containing IMDM supplemented with 2 mM GlutaMAX (InvitrogenLife Technologies, Carlsbad, CA), 5 3 1025 M 2-ME, 10% fetal calfserum, and 50 mg/ml gentamicin.
T cell polarization
T cells were polarized to Th1 or Th2 cells in vitro by the addition ofthe following: 1) 10 ng/ml IL-12 (R&D Systems, Minneapolis, MN) and10 mg/ml anti–IL-4 mAb (clone 11B11) for Th1 cell polarization; 2)10 ng/ml IL-4 (R&D Systems) and anti–IL-12 mAb [TOSH hybridomasupernatant (19)] for Th2 cell polarization. IL-2 (100 U) was added to themedia 48 h after initial stimulation, and T cell cultures were split 1:2. Cellswere restimulated after 7 d in culture, and the same cytokines and Abs de-scribed above were added again. The polarized T cells were used on day 14.
Constructs
The DN form of the Trpm4 gene (missing the first 177 amino-terminalamino acids) was amplified from the full-length gene in the Trpm4-pBlue vector and digested and ligated into the pMI-DsR vector (Trpm4-IRES-DsRed) using the EcoRI and MfeI sites.
Transfection and cell sorting
Tcellswere retrovirally transfected, as previouslydescribed (20). Inbrief, thePlatinum-E packaging cell line (a gift of T. Kitamura, University of Tokyo,Tokyo, Japan) was transfected with 30 mg retroviral construct DNA withLipofectamine 2000 (Invitrogen), and viral supernatant was collected 48 hafter transfection. For T cell activation, 3–5 3 105 T cells were stimulatedwith 6.53 106 irradiated B6.K splenocytes loaded with 10 mMHb64–76. At20 and 24 h after activation, retroviral supernatant was added to the T cellcultures and spun for 45 min at 1800 rpm at 25˚C in the presence of Lip-ofectamine 2000 (Invitrogen) and 125 U/ml IL-2. At 5 d after activation,T cells were sorted for equivalent levels of DsRed using the cells sorted ona MoFlow cell sorter (DakoCytomation, Fort Collins, CO).
siRNA experiments
siRNA specific for Trpm4 or Thy1 was purchased from Dharmacon(Lafayette, CO) and prepared according to the manufacturer’s instructions.Thy1 was chosen as a control because it is a cell surface protein not in-volved with calcium influx and its levels can be easily evaluated using flowcytometry. T cells were polarized, as described above, and the siRNAwasperformed using the Amaxa mouse T cell Nucleofector kit (Lonza, Wal-kersville, MD). Briefly, six million T cells were resuspended in 100 mlNucleofector solution and placed in a cuvette with 4 mg Trpm4 or Thy1siRNA and electroporated with the CD4+ Amaxa Nucleofector mouse CD4T cell program. Electroporated cells were incubated in Nucleofector me-dium for 4 h and then washed and grown in IMDM. Electroporated cellswere used in experiments 48 h after the siRNA transfection.
Ca2+ imaging
Ca2+ imaging was performed, as published previously (10). In brief, im-mediately before imaging, polarized T cells were incubated with 1 mMfura 2-AM (Molecular Probes, Eugene, OR) for 30 min at 37˚C in Ringersimaging solution (150 mM NaCl, 10 mM glucose, 5 mM HEPES, 5 mMKCl, 1 mM MgCl2, 2 mM CaCl2), washed, and then incubated in Ringerssolution for another 30 min at 37˚C. After washing, 100,000 fura 2-loadedT cells were pipetted onto 100,000 adherent APCs (Hi7-Ek) that had beenloaded with 1 mM Hb64–76 overnight. The Hb64–76 peptide was synthesizedusing standard Fmoc chemistry, purified by reverse-phase HPLC, and con-firmed using MALDI mass spectrometry, as has been previously described(21). The location of the APCs and T cells was monitored by visualizingthe cells with transmitted light as well as DsRed every 3 s. All imaging wasdone in 8-chamber coverglass slides (Lab-Tek; Nalge Nunc International,Rochester, NY).
Ca2+ imaging was performed at 37˚C using a temperature-controlledenvironmental chamber on a Zeiss axiovert 200M microscope equippedwith a xenon arc lamp. Fura 2-loaded cells were excited using 340 and380 excitation filters (71000a set; Chroma Technology, Rockingham, VT)and a polychroic mirror (73100bs; Chroma Technology). Fluorescence waspassed through a 5106 40-wide band emission filter (Chroma Technology)and captured by a Cascade 512B camera (Roper Scientific, Tucson, AZ).Ratio measurements (340:380) were recorded at 3-s intervals over 30 minusing a 320 Fluar objective (Zeiss, Oberkochen, Germany; N.A. 0.75).
Western blots
T cell lysates were boiled for 5 min at 100˚C and resolved on a 10% SDS-PAGE gel (∼5 3 106 cells/sample) and transferred onto a nitrocellulosemembrane (Bio-Rad, Hercules, CA). The blots were blocked with 1:1PBS:blocking buffer (LI-CORBiosciences, Lincoln, NE) for 1 h and probed(1:1000 in PBS-Tween) with primary Abs (rabbit polyclonal anti-Trpm4;ab63080-100 (Abcam, Cambridge, MA) or mouse monoclonal anti-GAPDH; AM4300, Ambion, Austin, TX) overnight at 4˚C. The membraneswere probed (1:10,000 in PBS-Tween + SDS) with secondary Abs (goatanti-rabbit 680 or goat anti-mouse 800; LI-COR Biosciences) for 1 h atroom temperature. Bands were visualized and quantified with the Odysseyinfrared imaging system (LI-COR Biosciences).
Cytokine measurements
T cell cytokine expression was assessed by ELISPOT. T cells were stim-ulated for 24 h with irradiated splenocytes or Hi7-Ek cells. ELISPOTmeasurement of cytokine levels was performed by 24-h T cell stimulationwith at least three replicates in 96-well Multiscreen Immobilon-P plates(Millipore, Bedford, MA) that had been coated overnight with anti–IL-4 (clone 11B11; eBioscience), anti–IFN-g (clone R4-6A2; eBioscience,San Diego, CA), or anti–IL-2 (clone JES6-5H4; BioXCell, West Lebanon,NH), and labeled with biotinylated anti–IL-4 (BVD6-24G2; eBioscience),anti–IFN-g (XMG1.2; eBioscience), or anti–IL-2 (JES6-5H4; Biolegend,San Diego, CA) and streptavadin-conjugated HRP (Southern Biotechnol-ogy Associates, Birmingham, AL). Plates were developed with 5-bromo-4-chloro-3-indolyl phosphate/NBT (Sigma-Aldrich, St. Louis, MO) andscanned on a CTL Immunospot reader. Data was analyzed using CTLImmunospot 4.0 (Cellular Technology, Shaker Heights, OH).
Gene expression analysis
For microarray analysis, RNA was isolated using RNeasy kits (Qiagen,Valencia, CA), and gene expression analysis was performed using mouseexpression 430 2.0 arrays (Affymetrix, Santa Clara, CA). Data were nor-malized and expression values were modeled using DNA-Chip Analyzer(www.dchip.org) (22). For quantitative real-time PCR analysis, total RNAand cDNAwere prepared from T cells with the RNeasy Mini Kit (Qiagen)and Superscript II reverse transcriptase (Invitrogen), according to manu-facturer’s directions. The SYBR Green PCR master mix and an ABI7000machine (Applied Biosystems, Foster City, CA) were used according to themanufacturer’s instructions. PCR conditions were 2 min at 50˚C and 10min at 95˚C, followed by 40 two-step cycles consisting of 15 s at 95˚C and1 min at 60˚C. The values of each sample were normalized to b-actin.
NFATc1 nuclear localization
T cells were washed and incubated with 1 mM SYTO13 (Molecular Probes)for 20 min at room temperature to stain the nucleus. A total of 2 3 105
T cells/sample was stimulated by Hi7 cells (1 mM Hb64–76) for 20 min at37˚C in 8-chamber coverglass slides (Lab-Tek; Nalge Nunc International).Cells were fixed with 100 ml BD Cytofix (BD Biosciences, San Jose, CA)for 20 min at room temperature and washed twice with PBS. Cells werepermeabilized for 10 min at room temperature in 2% Triton X-100, andthen cells were stained (1:100) for 1 h at room temperature in 100 mlpermeabilization buffer (0.5% saponin and 1% BSA) with the NFATc1primary Ab (7A6; Santa Cruz Biotechnology, Santa Cruz, CA). Cells werethen washed and stained (1:200) in 100 ml permeabilization buffer with thesecondary Ab (goat anti-mouse Alexa Fluor 546; Molecular Probes). Aftertwo washes, the cells were resuspended in imaging buffer (1% humanserum albumin, 1 mM CaCl2, 2 mMMgCl2) and viewed using an OlympusFluoview 1000 confocal microscope at 37˚C with a 360 PlanApo N oilobjective (Olympus, Melville, NY; N.A. 1.42). Quantification of nuclearlocalization was performed using the Olympus Fluoview software (coloc-alization function).
Data analysis
Fluorescent images were analyzed using MetaMorph (Molecular Devices,Sunnyvale, CA) and the 340:380 ratio is displayed on a pseudocolor scale,
The Journal of Immunology 2837
at Universidad de C
hile on February 2, 2015http://w
ww
.jimm
unol.org/D
ownloaded from
with calculations done on randomly selected cells. SDs were calculated bymeasuring the sy.x value, the SD of the vertical distances of the data pointsfrom the regression line (GraphPad Prism; GraphPad, San Diego, CA). Thelinear regression line was fit using the 10- to 25-min time point data. Mea-suring aspects of T cellular motility were performed by tracking the centerof fura 2 fluorescence with Pic Viewer Software (J. Dempster, University ofStrathclyde, Glasgow, Scotland) (23). Only cells with tracks longer than 10min were used in the analysis. All significant values were determined usingthe unpaired two-tailed Student t test or a Mann-Whitney rank sum test(GraphPad).
Online supplemental videos
SupplementalVideo1showscalciuminfluxofcontrolTh2cells (Thy1siRNA)as they are activated by Hi-7 I-Ek cells presenting the Hb64–76 peptide.Supplemental Video 2 shows calcium influx of Th2 cells with Trpm4 siRNAas they are activated by Hi-7 I-Ek cells presenting the Hb64–76 peptide.Supplemental Video 3 shows calcium influx of control Th1 cells (Thy1siRNA) as they are activated by Hi-7 I-Ek cells presenting the Hb64–76 pep-tide. Supplemental Video 4 shows calcium influx of Th1 cells with Trpm4siRNA as they are activated byHi-7 I-Ek cells presenting theHb64–76 peptide.
ResultsTrpm4 expression levels are higher in Th2 cells relative to Th1
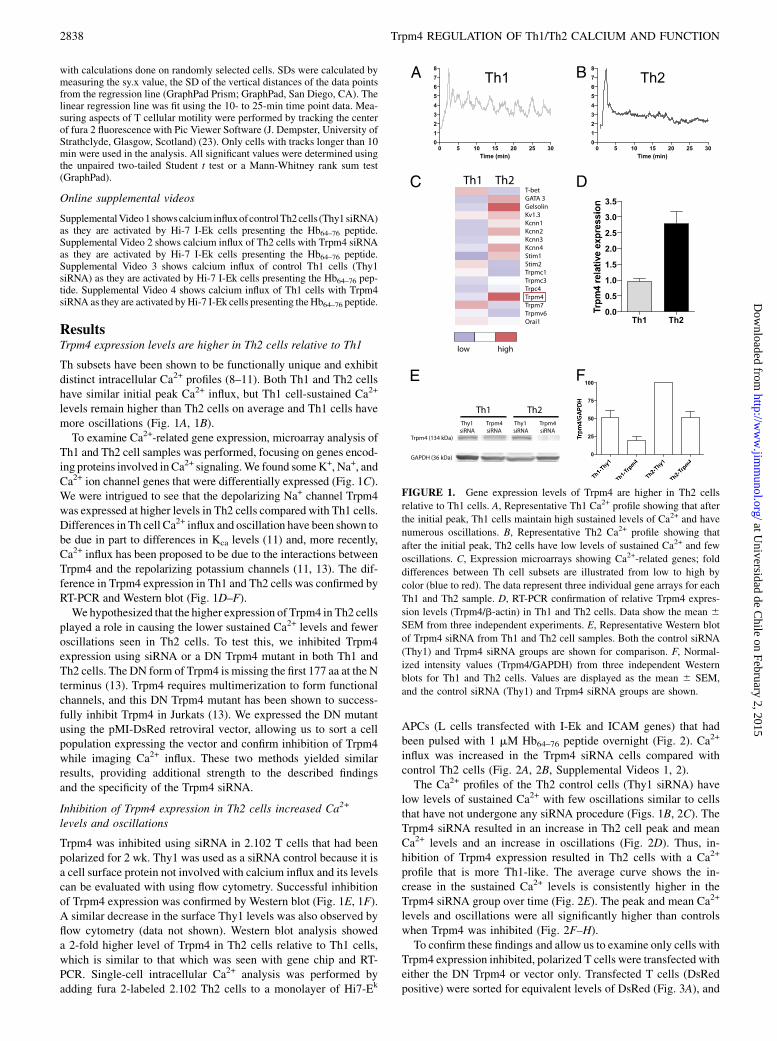
Th subsets have been shown to be functionally unique and exhibitdistinct intracellular Ca2+ profiles (8–11). Both Th1 and Th2 cellshave similar initial peak Ca2+ influx, but Th1 cell-sustained Ca2+
levels remain higher than Th2 cells on average and Th1 cells havemore oscillations (Fig. 1A, 1B).To examine Ca2+-related gene expression, microarray analysis of
Th1 and Th2 cell samples was performed, focusing on genes encod-ing proteins involved in Ca2+ signaling.We found someK+, Na+, andCa2+ ion channel genes that were differentially expressed (Fig. 1C).We were intrigued to see that the depolarizing Na+ channel Trpm4was expressed at higher levels in Th2 cells compared with Th1 cells.Differences in Th cell Ca2+ influx and oscillation have been shown tobe due in part to differences in Kca levels (11) and, more recently,Ca2+ influx has been proposed to be due to the interactions betweenTrpm4 and the repolarizing potassium channels (11, 13). The dif-ference in Trpm4 expression in Th1 and Th2 cells was confirmed byRT-PCR and Western blot (Fig. 1D–F).We hypothesized that the higher expression of Trpm4 in Th2 cells
played a role in causing the lower sustained Ca2+ levels and feweroscillations seen in Th2 cells. To test this, we inhibited Trpm4expression using siRNA or a DN Trpm4 mutant in both Th1 andTh2 cells. The DN form of Trpm4 is missing the first 177 aa at the Nterminus (13). Trpm4 requires multimerization to form functionalchannels, and this DN Trpm4 mutant has been shown to success-fully inhibit Trpm4 in Jurkats (13). We expressed the DN mutantusing the pMI-DsRed retroviral vector, allowing us to sort a cellpopulation expressing the vector and confirm inhibition of Trpm4while imaging Ca2+ influx. These two methods yielded similarresults, providing additional strength to the described findingsand the specificity of the Trpm4 siRNA.
Inhibition of Trpm4 expression in Th2 cells increased Ca2+
levels and oscillations
Trpm4 was inhibited using siRNA in 2.102 T cells that had beenpolarized for 2 wk. Thy1 was used as a siRNA control because it isa cell surface protein not involved with calcium influx and its levelscan be evaluated with using flow cytometry. Successful inhibitionof Trpm4 expression was confirmed by Western blot (Fig. 1E, 1F).A similar decrease in the surface Thy1 levels was also observed byflow cytometry (data not shown). Western blot analysis showeda 2-fold higher level of Trpm4 in Th2 cells relative to Th1 cells,which is similar to that which was seen with gene chip and RT-PCR. Single-cell intracellular Ca2+ analysis was performed byadding fura 2-labeled 2.102 Th2 cells to a monolayer of Hi7-Ek
APCs (L cells transfected with I-Ek and ICAM genes) that hadbeen pulsed with 1 mM Hb64–76 peptide overnight (Fig. 2). Ca2+
influx was increased in the Trpm4 siRNA cells compared withcontrol Th2 cells (Fig. 2A, 2B, Supplemental Videos 1, 2).The Ca2+ profiles of the Th2 control cells (Thy1 siRNA) have
low levels of sustained Ca2+ with few oscillations similar to cellsthat have not undergone any siRNA procedure (Figs. 1B, 2C). TheTrpm4 siRNA resulted in an increase in Th2 cell peak and meanCa2+ levels and an increase in oscillations (Fig. 2D). Thus, in-hibition of Trpm4 expression resulted in Th2 cells with a Ca2+
profile that is more Th1-like. The average curve shows the in-crease in the sustained Ca2+ levels is consistently higher in theTrpm4 siRNA group over time (Fig. 2E). The peak and mean Ca2+
levels and oscillations were all significantly higher than controlswhen Trpm4 was inhibited (Fig. 2F–H).To confirm these findings and allow us to examine only cells with
Trpm4 expression inhibited, polarized T cells were transfected witheither the DN Trpm4 or vector only. Transfected T cells (DsRedpositive) were sorted for equivalent levels of DsRed (Fig. 3A), and
FIGURE 1. Gene expression levels of Trpm4 are higher in Th2 cells
relative to Th1 cells. A, Representative Th1 Ca2+ profile showing that after
the initial peak, Th1 cells maintain high sustained levels of Ca2+ and have
numerous oscillations. B, Representative Th2 Ca2+ profile showing that
after the initial peak, Th2 cells have low levels of sustained Ca2+ and few
oscillations. C, Expression microarrays showing Ca2+-related genes; fold
differences between Th cell subsets are illustrated from low to high by
color (blue to red). The data represent three individual gene arrays for each
Th1 and Th2 sample. D, RT-PCR confirmation of relative Trpm4 expres-
sion levels (Trpm4/b-actin) in Th1 and Th2 cells. Data show the mean 6SEM from three independent experiments. E, Representative Western blot
of Trpm4 siRNA from Th1 and Th2 cell samples. Both the control siRNA
(Thy1) and Trpm4 siRNA groups are shown for comparison. F, Normal-
ized intensity values (Trpm4/GAPDH) from three independent Western
blots for Th1 and Th2 cells. Values are displayed as the mean 6 SEM,
and the control siRNA (Thy1) and Trpm4 siRNA groups are shown.
2838 Trpm4 REGULATION OF Th1/Th2 CALCIUM AND FUNCTION
at Universidad de C
hile on February 2, 2015http://w
ww
.jimm
unol.org/D
ownloaded from
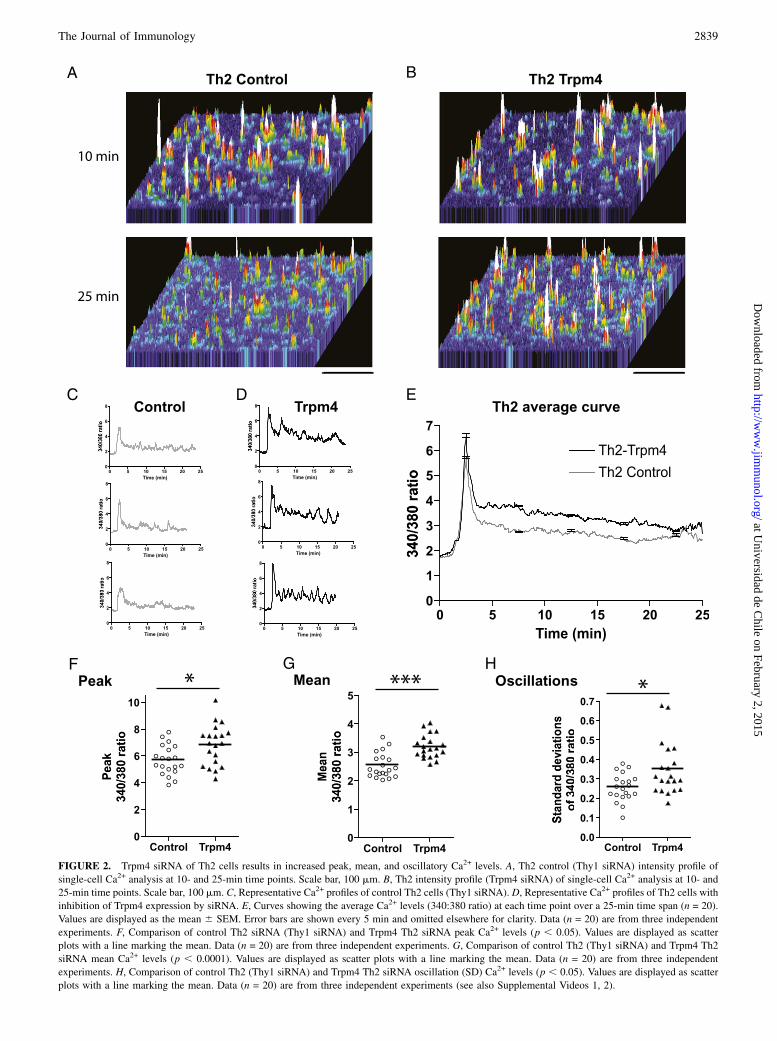
FIGURE 2. Trpm4 siRNA of Th2 cells results in increased peak, mean, and oscillatory Ca2+ levels. A, Th2 control (Thy1 siRNA) intensity profile of
single-cell Ca2+ analysis at 10- and 25-min time points. Scale bar, 100 mm. B, Th2 intensity profile (Trpm4 siRNA) of single-cell Ca2+ analysis at 10- and
25-min time points. Scale bar, 100 mm. C, Representative Ca2+ profiles of control Th2 cells (Thy1 siRNA). D, Representative Ca2+ profiles of Th2 cells with
inhibition of Trpm4 expression by siRNA. E, Curves showing the average Ca2+ levels (340:380 ratio) at each time point over a 25-min time span (n = 20).
Values are displayed as the mean 6 SEM. Error bars are shown every 5 min and omitted elsewhere for clarity. Data (n = 20) are from three independent
experiments. F, Comparison of control Th2 siRNA (Thy1 siRNA) and Trpm4 Th2 siRNA peak Ca2+ levels (p , 0.05). Values are displayed as scatter
plots with a line marking the mean. Data (n = 20) are from three independent experiments. G, Comparison of control Th2 (Thy1 siRNA) and Trpm4 Th2
siRNA mean Ca2+ levels (p , 0.0001). Values are displayed as scatter plots with a line marking the mean. Data (n = 20) are from three independent
experiments. H, Comparison of control Th2 (Thy1 siRNA) and Trpm4 Th2 siRNA oscillation (SD) Ca2+ levels (p , 0.05). Values are displayed as scatter
plots with a line marking the mean. Data (n = 20) are from three independent experiments (see also Supplemental Videos 1, 2).
The Journal of Immunology 2839
at Universidad de C
hile on February 2, 2015http://w
ww
.jimm
unol.org/D
ownloaded from
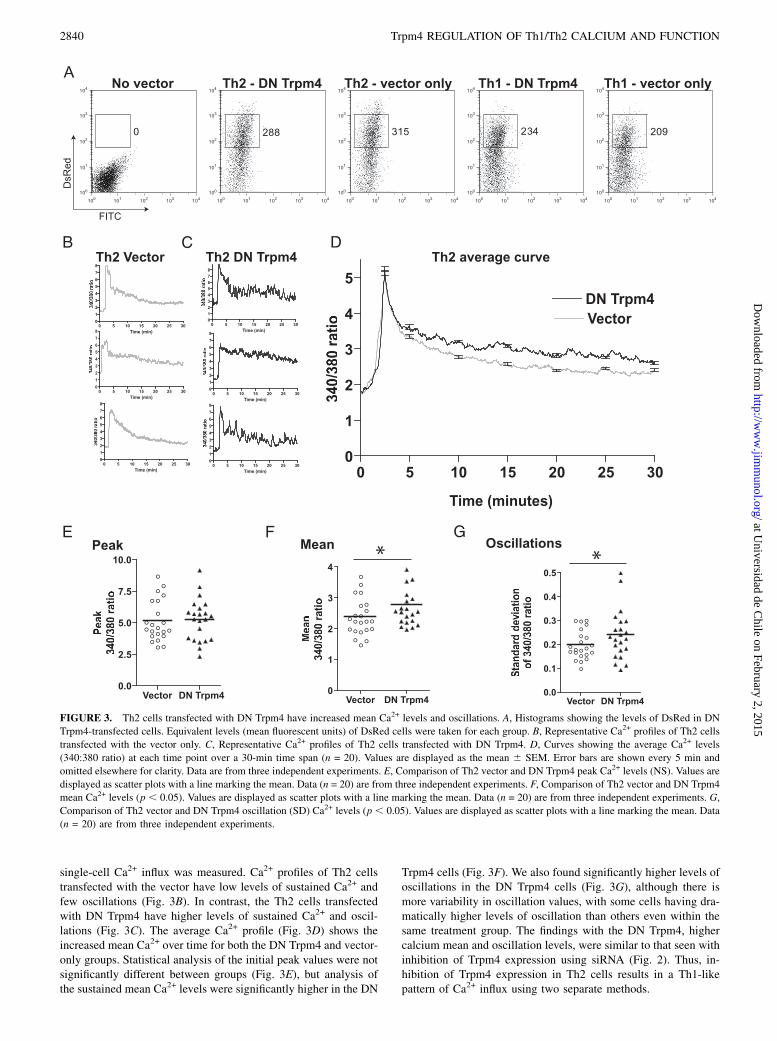
single-cell Ca2+ influx was measured. Ca2+ profiles of Th2 cellstransfected with the vector have low levels of sustained Ca2+ andfew oscillations (Fig. 3B). In contrast, the Th2 cells transfectedwith DN Trpm4 have higher levels of sustained Ca2+ and oscil-lations (Fig. 3C). The average Ca2+ profile (Fig. 3D) shows theincreased mean Ca2+ over time for both the DN Trpm4 and vector-only groups. Statistical analysis of the initial peak values were notsignificantly different between groups (Fig. 3E), but analysis ofthe sustained mean Ca2+ levels were significantly higher in the DN
Trpm4 cells (Fig. 3F). We also found significantly higher levels ofoscillations in the DN Trpm4 cells (Fig. 3G), although there ismore variability in oscillation values, with some cells having dra-matically higher levels of oscillation than others even within thesame treatment group. The findings with the DN Trpm4, highercalcium mean and oscillation levels, were similar to that seen withinhibition of Trpm4 expression using siRNA (Fig. 2). Thus, in-hibition of Trpm4 expression in Th2 cells results in a Th1-likepattern of Ca2+ influx using two separate methods.
FIGURE 3. Th2 cells transfected with DN Trpm4 have increased mean Ca2+ levels and oscillations. A, Histograms showing the levels of DsRed in DN
Trpm4-transfected cells. Equivalent levels (mean fluorescent units) of DsRed cells were taken for each group. B, Representative Ca2+ profiles of Th2 cells
transfected with the vector only. C, Representative Ca2+ profiles of Th2 cells transfected with DN Trpm4. D, Curves showing the average Ca2+ levels
(340:380 ratio) at each time point over a 30-min time span (n = 20). Values are displayed as the mean 6 SEM. Error bars are shown every 5 min and
omitted elsewhere for clarity. Data are from three independent experiments. E, Comparison of Th2 vector and DN Trpm4 peak Ca2+ levels (NS). Values are
displayed as scatter plots with a line marking the mean. Data (n = 20) are from three independent experiments. F, Comparison of Th2 vector and DN Trpm4
mean Ca2+ levels (p , 0.05). Values are displayed as scatter plots with a line marking the mean. Data (n = 20) are from three independent experiments. G,
Comparison of Th2 vector and DN Trpm4 oscillation (SD) Ca2+ levels (p , 0.05). Values are displayed as scatter plots with a line marking the mean. Data
(n = 20) are from three independent experiments.
2840 Trpm4 REGULATION OF Th1/Th2 CALCIUM AND FUNCTION
at Universidad de C
hile on February 2, 2015http://w
ww
.jimm
unol.org/D
ownloaded from

Inhibition of Trpm4 expression in Th1 cells decreases Ca2+
levels and oscillations
Because inhibiting Trpm4 expression in Th2 cells resulted ina dramatic change to a Th1-like calcium profile, we determined toexamine the effects of inhibition of Trpm4 expression inTh1 cells. The level of Trpm4 expression in Th1 cells is ∼3-foldlower than that of Th2 cells (Fig. 1D). We examined the role ofTrpm4 in Th1-polarized 2.102 cells by inhibiting Trpm4 expressionwith siRNA. In contrast to what was seen in Th2 cells, inhibition ofTrpm4 expression in Th1 cells resulted in a decrease in Ca2+ influx(Fig. 4). Ca2+ influx was lower in the Trpm4 siRNA cells comparedwith control cells (Fig. 4A, 4B, Supplemental Videos 3, 4). The Th1control cells (Thy1 siRNA) have frequent oscillations and highersustained levels of Ca2+ (Fig. 4C), and the Trpm4 siRNA results indecreased mean Ca2+ levels (Fig. 4D, 4E). The peak and mean Ca2+
levels and oscillations are all significantly lower when Trpm4 ex-pression is inhibited compared with the control (Fig. 4F–H).Polarized Th1 cells were transfected with DN Trpm4 or the
vector to confirm the Trpm4 siRNA findings and to examineonly cells expressing the DN Trpm4. Transfected T cells (DsRedpositive) were sorted, and single-cell Ca2+ influx was measured.The Ca2+ profile of the Th1 cells transfected with vector hashigher mean levels of Ca2+ and frequent oscillations (Fig. 5A).
Transfection with DN Trpm4 results in a decrease in Ca2+ influxand fewer oscillations (Fig. 5B). The Th1 average curve showsconsistently lower levels of sustained Ca2+ levels when Trpm4 isinhibited (Fig. 5C). The peak and mean Ca2+ levels are bothsignificantly lower with the transfection of DN Trpm4 (Fig. 5D,5E). Statistical analysis of oscillations also shows a significantlylower value with the transfection of DN Trpm4 (Fig. 5F). Inhibi-tion of Trpm4 expression with the DN construct showed a similarphenotype as seen with the Trpm4 siRNA (Fig. 4). Thus, inhibi-tion of Trpm4 expression in Th1 cells results in a significantlylower level of Ca2+ influx using two separate methods.
Inhibition of Trpm4 expression alters Th cell velocity andmotility
The divergent Ca2+ patterns in Th1 and Th2 cells seen whenTrpm4 expression was inhibited were intriguing, and to determinethe biological effects, we examined T cell motility. T cell mo-tility has been reported to correlate with Ca2+ levels (3). Higherlevels of Ca2+ prolong the interactions that cells have with Agin vitro and in vivo and result in altered gene expression andT cell function (5). Th2 cells have been shown to be significantlymore motile compared with Th1 cells (10). Our analysis showedthat there is a decrease in Th2 cell track length when Trpm4
FIGURE 4. Trpm4 siRNA of Th1 cells
results in decreased peak, mean, and oscilla-
tory Ca2+ levels. A, Th1 control (Thy1 siRNA)
intensity profile of single-cell Ca2+ analysis at
10- and 25-min time points. Scale bar, 100 mm.
B, Th1 Trpm4 intensity profile of single-cell
Ca2+ analysis at 10- and 25-min time points.
Scale bar, 100 mm. C, Representative Ca2+ pro-
files of control Th1 cells (Thy1 siRNA). D,
Representative Ca2+ profiles of Th1 cells with
siRNA for Trpm4. E, Curves showing the av-
erage Ca2+ levels (340:380 ratio) at each time
point over a 25-min time span (n = 20). Values
are displayed as the mean 6 SEM. Error bars
are shown every 5 min and omitted elsewhere
for clarity. Data (n = 20) are from three inde-
pendent experiments. F, Comparison of control
Th1 (Thy1 siRNA) and Trpm4 Th1 siRNA
peak Ca2+ levels (p , 0.0001). Values are dis-
played as scatter plots with a line marking the
mean. Data (n = 20) are from three indepen-
dent experiments. G, Comparison of control
Th1 (Thy1 siRNA) and Trpm4 Th1 siRNA
mean Ca2+ levels (p , 0.0001). Values are
displayed as scatter plots with a line marking
the mean. Data are from three independent
experiments. H, Comparison of control Th1
(Thy1 siRNA) and Trpm4 Th1 siRNA oscilla-
tion Ca2+ levels (p , 0.001). Values are dis-
played as scatter plots with a line marking the
mean. Data (n = 20) are from three indepen-
dent experiments (see also Supplemental Vid-
eos 3, 4).
The Journal of Immunology 2841
at Universidad de C
hile on February 2, 2015http://w
ww
.jimm
unol.org/D
ownloaded from
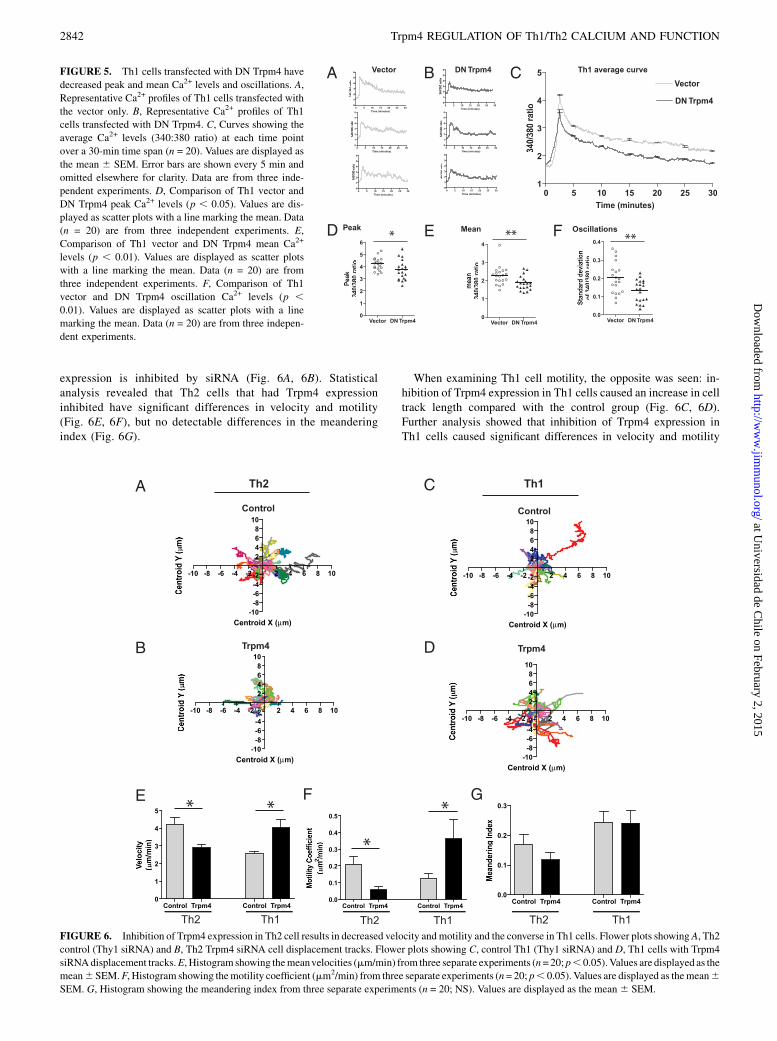
expression is inhibited by siRNA (Fig. 6A, 6B). Statisticalanalysis revealed that Th2 cells that had Trpm4 expressioninhibited have significant differences in velocity and motility(Fig. 6E, 6F), but no detectable differences in the meanderingindex (Fig. 6G).
When examining Th1 cell motility, the opposite was seen: in-hibition of Trpm4 expression in Th1 cells caused an increase in celltrack length compared with the control group (Fig. 6C, 6D).Further analysis showed that inhibition of Trpm4 expression inTh1 cells caused significant differences in velocity and motility
FIGURE 5. Th1 cells transfected with DN Trpm4 have
decreased peak and mean Ca2+ levels and oscillations. A,
Representative Ca2+ profiles of Th1 cells transfected with
the vector only. B, Representative Ca2+ profiles of Th1
cells transfected with DN Trpm4. C, Curves showing the
average Ca2+ levels (340:380 ratio) at each time point
over a 30-min time span (n = 20). Values are displayed as
the mean 6 SEM. Error bars are shown every 5 min and
omitted elsewhere for clarity. Data are from three inde-
pendent experiments. D, Comparison of Th1 vector and
DN Trpm4 peak Ca2+ levels (p , 0.05). Values are dis-
played as scatter plots with a line marking the mean. Data
(n = 20) are from three independent experiments. E,
Comparison of Th1 vector and DN Trpm4 mean Ca2+
levels (p , 0.01). Values are displayed as scatter plots
with a line marking the mean. Data (n = 20) are from
three independent experiments. F, Comparison of Th1
vector and DN Trpm4 oscillation Ca2+ levels (p ,0.01). Values are displayed as scatter plots with a line
marking the mean. Data (n = 20) are from three indepen-
dent experiments.
FIGURE 6. Inhibition of Trpm4 expression in Th2 cell results in decreased velocity andmotility and the converse in Th1 cells. Flower plots showing A, Th2
control (Thy1 siRNA) and B, Th2 Trpm4 siRNA cell displacement tracks. Flower plots showing C, control Th1 (Thy1 siRNA) and D, Th1 cells with Trpm4
siRNAdisplacement tracks.E, Histogram showing themeanvelocities (mm/min) from three separate experiments (n=20; p, 0.05).Values are displayed as the
mean6SEM.F, Histogram showing themotility coefficient (mm2/min) from three separate experiments (n= 20; p, 0.05). Values are displayed as themean6SEM. G, Histogram showing the meandering index from three separate experiments (n = 20; NS). Values are displayed as the mean 6 SEM.
2842 Trpm4 REGULATION OF Th1/Th2 CALCIUM AND FUNCTION
at Universidad de C
hile on February 2, 2015http://w
ww
.jimm
unol.org/D
ownloaded from
values (Fig. 6E, 6F), but no difference in the meandering index(Fig. 6G). Thus, the changes in Ca2+ influx caused by inhibition ofTrpm4 expression were large enough to affect motility. Higherlevels of Ca2+ influx in Th2 cells with inhibition of Trpm4 ex-pression correlated with decreased motility. Lower levels of Ca2+
influx in Th1 cells with inhibition of Trpm4 expression correlatedwith increased motility.
Inhibition of Trpm4 expression alters Th1 and Th2 cellcytokine production
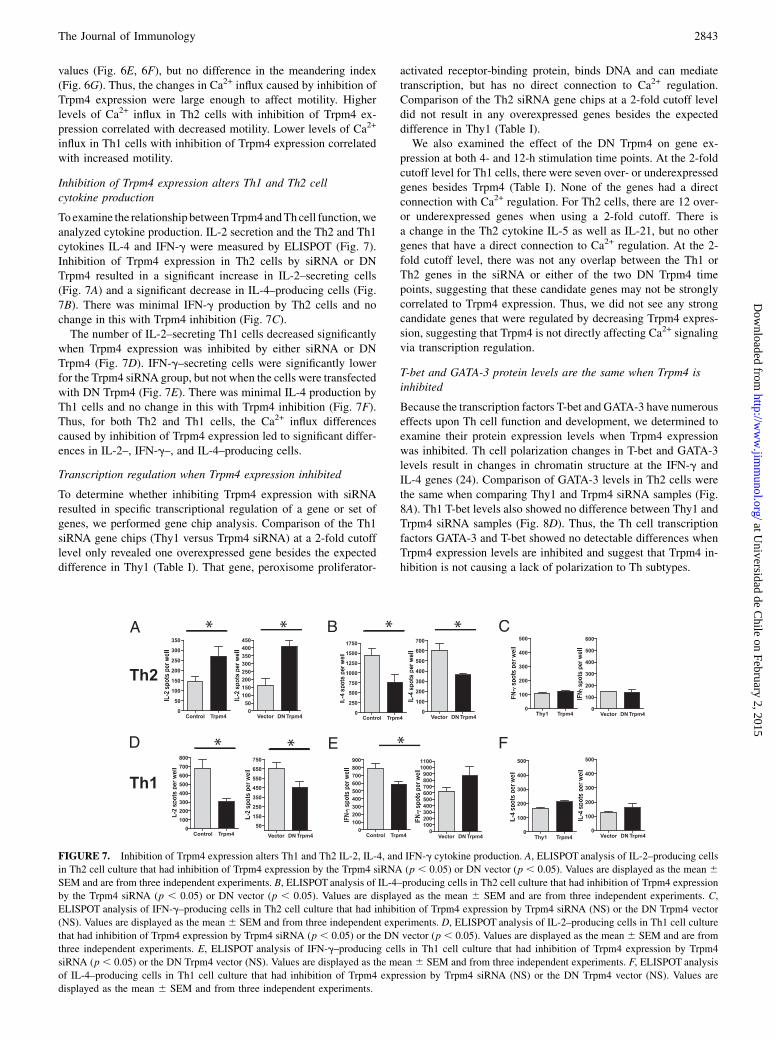
Toexamine the relationship betweenTrpm4andThcell function,weanalyzed cytokine production. IL-2 secretion and the Th2 and Th1cytokines IL-4 and IFN-g were measured by ELISPOT (Fig. 7).Inhibition of Trpm4 expression in Th2 cells by siRNA or DNTrpm4 resulted in a significant increase in IL-2–secreting cells(Fig. 7A) and a significant decrease in IL-4–producing cells (Fig.7B). There was minimal IFN-g production by Th2 cells and nochange in this with Trpm4 inhibition (Fig. 7C).The number of IL-2–secreting Th1 cells decreased significantly
when Trpm4 expression was inhibited by either siRNA or DNTrpm4 (Fig. 7D). IFN-g–secreting cells were significantly lowerfor the Trpm4 siRNA group, but not when the cells were transfectedwith DN Trpm4 (Fig. 7E). There was minimal IL-4 production byTh1 cells and no change in this with Trpm4 inhibition (Fig. 7F).Thus, for both Th2 and Th1 cells, the Ca2+ influx differencescaused by inhibition of Trpm4 expression led to significant differ-ences in IL-2–, IFN-g–, and IL-4–producing cells.
Transcription regulation when Trpm4 expression inhibited
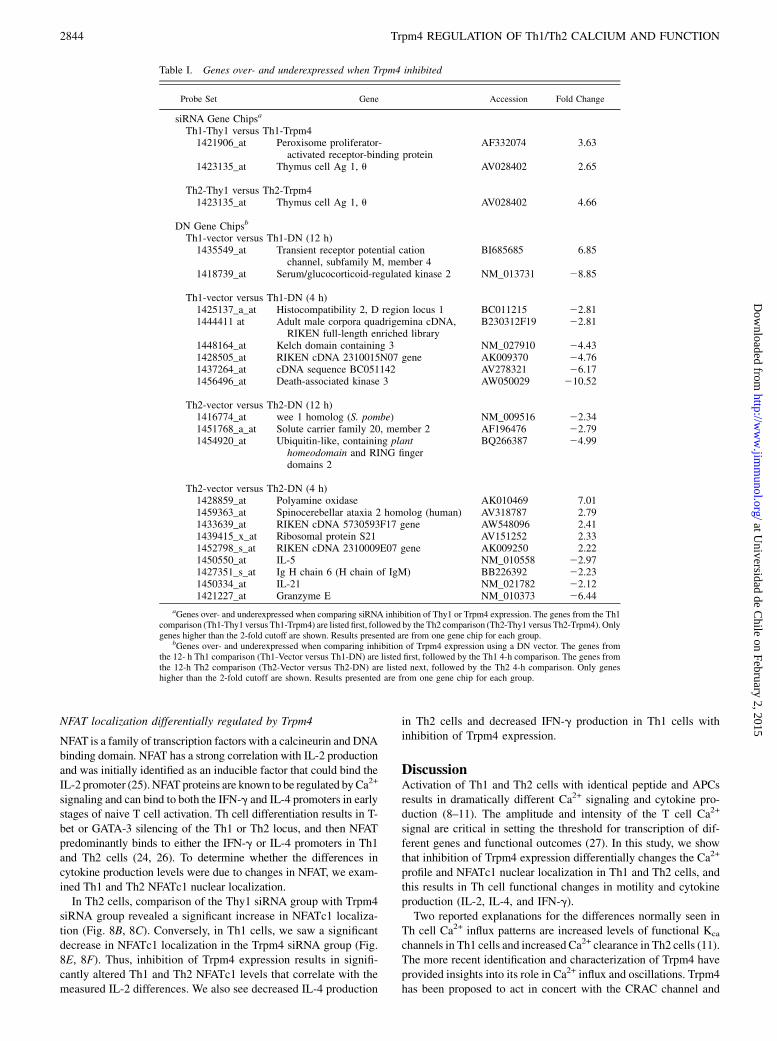
To determine whether inhibiting Trpm4 expression with siRNAresulted in specific transcriptional regulation of a gene or set ofgenes, we performed gene chip analysis. Comparison of the Th1siRNA gene chips (Thy1 versus Trpm4 siRNA) at a 2-fold cutofflevel only revealed one overexpressed gene besides the expecteddifference in Thy1 (Table I). That gene, peroxisome proliferator-
activated receptor-binding protein, binds DNA and can mediatetranscription, but has no direct connection to Ca2+ regulation.Comparison of the Th2 siRNA gene chips at a 2-fold cutoff leveldid not result in any overexpressed genes besides the expecteddifference in Thy1 (Table I).We also examined the effect of the DN Trpm4 on gene ex-
pression at both 4- and 12-h stimulation time points. At the 2-foldcutoff level for Th1 cells, there were seven over- or underexpressedgenes besides Trpm4 (Table I). None of the genes had a directconnection with Ca2+ regulation. For Th2 cells, there are 12 over-or underexpressed genes when using a 2-fold cutoff. There isa change in the Th2 cytokine IL-5 as well as IL-21, but no othergenes that have a direct connection to Ca2+ regulation. At the 2-fold cutoff level, there was not any overlap between the Th1 orTh2 genes in the siRNA or either of the two DN Trpm4 timepoints, suggesting that these candidate genes may not be stronglycorrelated to Trpm4 expression. Thus, we did not see any strongcandidate genes that were regulated by decreasing Trpm4 expres-sion, suggesting that Trpm4 is not directly affecting Ca2+ signalingvia transcription regulation.
T-bet and GATA-3 protein levels are the same when Trpm4 isinhibited
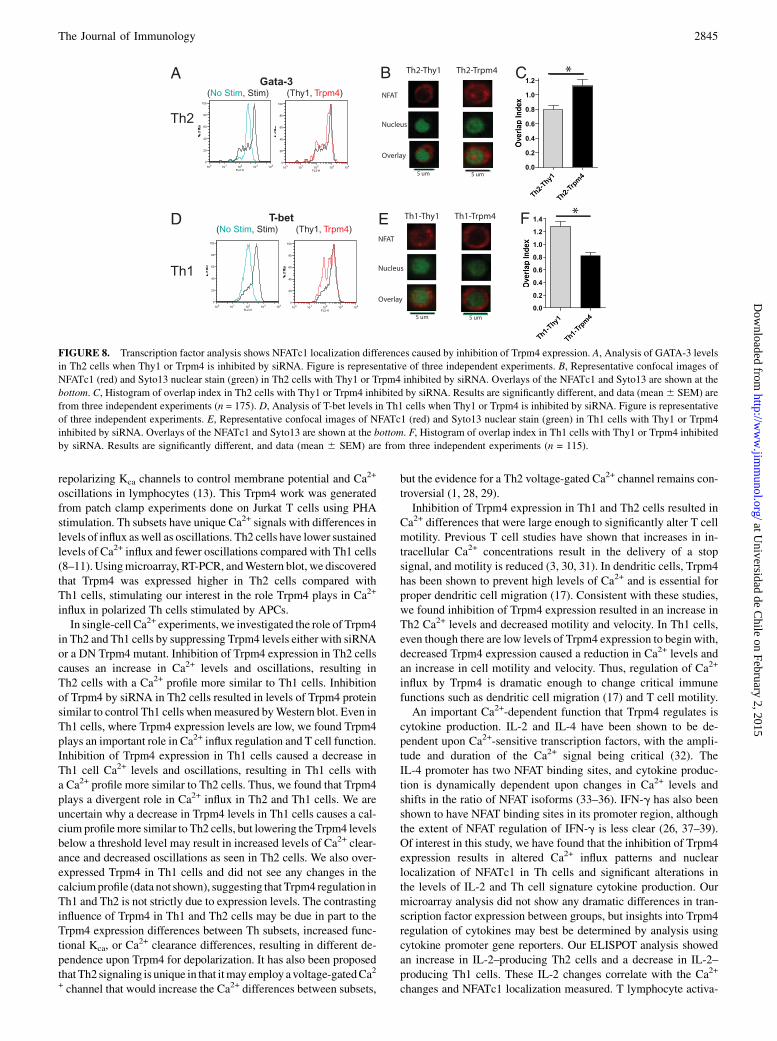
Because the transcription factors T-bet and GATA-3 have numerouseffects upon Th cell function and development, we determined toexamine their protein expression levels when Trpm4 expressionwas inhibited. Th cell polarization changes in T-bet and GATA-3levels result in changes in chromatin structure at the IFN-g andIL-4 genes (24). Comparison of GATA-3 levels in Th2 cells werethe same when comparing Thy1 and Trpm4 siRNA samples (Fig.8A). Th1 T-bet levels also showed no difference between Thy1 andTrpm4 siRNA samples (Fig. 8D). Thus, the Th cell transcriptionfactors GATA-3 and T-bet showed no detectable differences whenTrpm4 expression levels are inhibited and suggest that Trpm4 in-hibition is not causing a lack of polarization to Th subtypes.
FIGURE 7. Inhibition of Trpm4 expression alters Th1 and Th2 IL-2, IL-4, and IFN-g cytokine production. A, ELISPOT analysis of IL-2–producing cells
in Th2 cell culture that had inhibition of Trpm4 expression by the Trpm4 siRNA (p , 0.05) or DN vector (p , 0.05). Values are displayed as the mean 6SEM and are from three independent experiments. B, ELISPOT analysis of IL-4–producing cells in Th2 cell culture that had inhibition of Trpm4 expression
by the Trpm4 siRNA (p , 0.05) or DN vector (p , 0.05). Values are displayed as the mean 6 SEM and are from three independent experiments. C,
ELISPOT analysis of IFN-g–producing cells in Th2 cell culture that had inhibition of Trpm4 expression by Trpm4 siRNA (NS) or the DN Trpm4 vector
(NS). Values are displayed as the mean 6 SEM and from three independent experiments. D, ELISPOT analysis of IL-2–producing cells in Th1 cell culture
that had inhibition of Trpm4 expression by Trpm4 siRNA (p , 0.05) or the DN vector (p , 0.05). Values are displayed as the mean 6 SEM and are from
three independent experiments. E, ELISPOT analysis of IFN-g–producing cells in Th1 cell culture that had inhibition of Trpm4 expression by Trpm4
siRNA (p , 0.05) or the DN Trpm4 vector (NS). Values are displayed as the mean 6 SEM and from three independent experiments. F, ELISPOT analysis
of IL-4–producing cells in Th1 cell culture that had inhibition of Trpm4 expression by Trpm4 siRNA (NS) or the DN Trpm4 vector (NS). Values are
displayed as the mean 6 SEM and from three independent experiments.
The Journal of Immunology 2843
at Universidad de C
hile on February 2, 2015http://w
ww
.jimm
unol.org/D
ownloaded from
NFAT localization differentially regulated by Trpm4
NFAT is a family of transcription factors with a calcineurin and DNAbinding domain. NFAT has a strong correlation with IL-2 productionand was initially identified as an inducible factor that could bind theIL-2 promoter (25). NFAT proteins are known to be regulated byCa2+
signaling and can bind to both the IFN-g and IL-4 promoters in earlystages of naive T cell activation. Th cell differentiation results in T-bet or GATA-3 silencing of the Th1 or Th2 locus, and then NFATpredominantly binds to either the IFN-g or IL-4 promoters in Th1and Th2 cells (24, 26). To determine whether the differences incytokine production levels were due to changes in NFAT, we exam-ined Th1 and Th2 NFATc1 nuclear localization.In Th2 cells, comparison of the Thy1 siRNA group with Trpm4
siRNA group revealed a significant increase in NFATc1 localiza-tion (Fig. 8B, 8C). Conversely, in Th1 cells, we saw a significantdecrease in NFATc1 localization in the Trpm4 siRNA group (Fig.8E, 8F). Thus, inhibition of Trpm4 expression results in signifi-cantly altered Th1 and Th2 NFATc1 levels that correlate with themeasured IL-2 differences. We also see decreased IL-4 production
in Th2 cells and decreased IFN-g production in Th1 cells withinhibition of Trpm4 expression.
DiscussionActivation of Th1 and Th2 cells with identical peptide and APCsresults in dramatically different Ca2+ signaling and cytokine pro-duction (8–11). The amplitude and intensity of the T cell Ca2+
signal are critical in setting the threshold for transcription of dif-ferent genes and functional outcomes (27). In this study, we showthat inhibition of Trpm4 expression differentially changes the Ca2+
profile and NFATc1 nuclear localization in Th1 and Th2 cells, andthis results in Th cell functional changes in motility and cytokineproduction (IL-2, IL-4, and IFN-g).Two reported explanations for the differences normally seen in
Th cell Ca2+ influx patterns are increased levels of functional Kca
channels in Th1 cells and increased Ca2+ clearance in Th2 cells (11).The more recent identification and characterization of Trpm4 haveprovided insights into its role in Ca2+ influx and oscillations. Trpm4has been proposed to act in concert with the CRAC channel and
Table I. Genes over- and underexpressed when Trpm4 inhibited
Probe Set Gene Accession Fold Change
siRNA Gene Chipsa
Th1-Thy1 versus Th1-Trpm41421906_at Peroxisome proliferator-
activated receptor-binding proteinAF332074 3.63
1423135_at Thymus cell Ag 1, u AV028402 2.65
Th2-Thy1 versus Th2-Trpm41423135_at Thymus cell Ag 1, u AV028402 4.66
DN Gene Chipsb
Th1-vector versus Th1-DN (12 h)1435549_at Transient receptor potential cation
channel, subfamily M, member 4BI685685 6.85
1418739_at Serum/glucocorticoid-regulated kinase 2 NM_013731 28.85
Th1-vector versus Th1-DN (4 h)1425137_a_at Histocompatibility 2, D region locus 1 BC011215 22.811444411 at Adult male corpora quadrigemina cDNA,
RIKEN full-length enriched libraryB230312F19 22.81
1448164_at Kelch domain containing 3 NM_027910 24.431428505_at RIKEN cDNA 2310015N07 gene AK009370 24.761437264_at cDNA sequence BC051142 AV278321 26.171456496_at Death-associated kinase 3 AW050029 210.52
Th2-vector versus Th2-DN (12 h)1416774_at wee 1 homolog (S. pombe) NM_009516 22.341451768_a_at Solute carrier family 20, member 2 AF196476 22.791454920_at Ubiquitin-like, containing plant
homeodomain and RING fingerdomains 2
BQ266387 24.99
Th2-vector versus Th2-DN (4 h)1428859_at Polyamine oxidase AK010469 7.011459363_at Spinocerebellar ataxia 2 homolog (human) AV318787 2.791433639_at RIKEN cDNA 5730593F17 gene AW548096 2.411439415_x_at Ribosomal protein S21 AV151252 2.331452798_s_at RIKEN cDNA 2310009E07 gene AK009250 2.221450550_at IL-5 NM_010558 22.971427351_s_at Ig H chain 6 (H chain of IgM) BB226392 22.231450334_at IL-21 NM_021782 22.121421227_at Granzyme E NM_010373 26.44
aGenes over- and underexpressed when comparing siRNA inhibition of Thy1 or Trpm4 expression. The genes from the Th1comparison (Th1-Thy1 versus Th1-Trpm4) are listed first, followed by the Th2 comparison (Th2-Thy1 versus Th2-Trpm4). Onlygenes higher than the 2-fold cutoff are shown. Results presented are from one gene chip for each group.
bGenes over- and underexpressed when comparing inhibition of Trpm4 expression using a DN vector. The genes fromthe 12- h Th1 comparison (Th1-Vector versus Th1-DN) are listed first, followed by the Th1 4-h comparison. The genes fromthe 12-h Th2 comparison (Th2-Vector versus Th2-DN) are listed next, followed by the Th2 4-h comparison. Only geneshigher than the 2-fold cutoff are shown. Results presented are from one gene chip for each group.
2844 Trpm4 REGULATION OF Th1/Th2 CALCIUM AND FUNCTION
at Universidad de C
hile on February 2, 2015http://w
ww
.jimm
unol.org/D
ownloaded from
repolarizing Kca channels to control membrane potential and Ca2+
oscillations in lymphocytes (13). This Trpm4 work was generatedfrom patch clamp experiments done on Jurkat T cells using PHAstimulation. Th subsets have unique Ca2+ signals with differences inlevels of influx as well as oscillations. Th2 cells have lower sustainedlevels of Ca2+ influx and fewer oscillations compared with Th1 cells(8–11). Usingmicroarray, RT-PCR, andWestern blot, we discoveredthat Trpm4 was expressed higher in Th2 cells compared withTh1 cells, stimulating our interest in the role Trpm4 plays in Ca2+
influx in polarized Th cells stimulated by APCs.In single-cell Ca2+ experiments, we investigated the role of Trpm4
in Th2 and Th1 cells by suppressing Trpm4 levels either with siRNAor a DN Trpm4 mutant. Inhibition of Trpm4 expression in Th2 cellscauses an increase in Ca2+ levels and oscillations, resulting inTh2 cells with a Ca2+ profile more similar to Th1 cells. Inhibitionof Trpm4 by siRNA in Th2 cells resulted in levels of Trpm4 proteinsimilar to control Th1 cells whenmeasured byWestern blot. Even inTh1 cells, where Trpm4 expression levels are low, we found Trpm4plays an important role in Ca2+ influx regulation and T cell function.Inhibition of Trpm4 expression in Th1 cells caused a decrease inTh1 cell Ca2+ levels and oscillations, resulting in Th1 cells witha Ca2+ profile more similar to Th2 cells. Thus, we found that Trpm4plays a divergent role in Ca2+ influx in Th2 and Th1 cells. We areuncertain why a decrease in Trpm4 levels in Th1 cells causes a cal-cium profilemore similar to Th2 cells, but lowering the Trpm4 levelsbelow a threshold level may result in increased levels of Ca2+ clear-ance and decreased oscillations as seen in Th2 cells. We also over-expressed Trpm4 in Th1 cells and did not see any changes in thecalciumprofile (data not shown), suggesting that Trpm4 regulation inTh1 and Th2 is not strictly due to expression levels. The contrastinginfluence of Trpm4 in Th1 and Th2 cells may be due in part to theTrpm4 expression differences between Th subsets, increased func-tional Kca, or Ca
2+ clearance differences, resulting in different de-pendence upon Trpm4 for depolarization. It has also been proposedthatTh2 signaling is unique in that itmay employ avoltage-gatedCa2+ channel that would increase the Ca2+ differences between subsets,
but the evidence for a Th2 voltage-gated Ca2+ channel remains con-troversial (1, 28, 29).Inhibition of Trpm4 expression in Th1 and Th2 cells resulted in
Ca2+ differences that were large enough to significantly alter T cellmotility. Previous T cell studies have shown that increases in in-tracellular Ca2+ concentrations result in the delivery of a stopsignal, and motility is reduced (3, 30, 31). In dendritic cells, Trpm4has been shown to prevent high levels of Ca2+ and is essential forproper dendritic cell migration (17). Consistent with these studies,we found inhibition of Trpm4 expression resulted in an increase inTh2 Ca2+ levels and decreased motility and velocity. In Th1 cells,even though there are low levels of Trpm4 expression to begin with,decreased Trpm4 expression caused a reduction in Ca2+ levels andan increase in cell motility and velocity. Thus, regulation of Ca2+
influx by Trpm4 is dramatic enough to change critical immunefunctions such as dendritic cell migration (17) and T cell motility.An important Ca2+-dependent function that Trpm4 regulates is
cytokine production. IL-2 and IL-4 have been shown to be de-pendent upon Ca2+-sensitive transcription factors, with the ampli-tude and duration of the Ca2+ signal being critical (32). TheIL-4 promoter has two NFAT binding sites, and cytokine produc-tion is dynamically dependent upon changes in Ca2+ levels andshifts in the ratio of NFAT isoforms (33–36). IFN-g has also beenshown to have NFAT binding sites in its promoter region, althoughthe extent of NFAT regulation of IFN-g is less clear (26, 37–39).Of interest in this study, we have found that the inhibition of Trpm4expression results in altered Ca2+ influx patterns and nuclearlocalization of NFATc1 in Th cells and significant alterations inthe levels of IL-2 and Th cell signature cytokine production. Ourmicroarray analysis did not show any dramatic differences in tran-scription factor expression between groups, but insights into Trpm4regulation of cytokines may best be determined by analysis usingcytokine promoter gene reporters. Our ELISPOT analysis showedan increase in IL-2–producing Th2 cells and a decrease in IL-2–producing Th1 cells. These IL-2 changes correlate with the Ca2+
changes and NFATc1 localization measured. T lymphocyte activa-
FIGURE 8. Transcription factor analysis shows NFATc1 localization differences caused by inhibition of Trpm4 expression. A, Analysis of GATA-3 levels
in Th2 cells when Thy1 or Trpm4 is inhibited by siRNA. Figure is representative of three independent experiments. B, Representative confocal images of
NFATc1 (red) and Syto13 nuclear stain (green) in Th2 cells with Thy1 or Trpm4 inhibited by siRNA. Overlays of the NFATc1 and Syto13 are shown at the
bottom. C, Histogram of overlap index in Th2 cells with Thy1 or Trpm4 inhibited by siRNA. Results are significantly different, and data (mean6 SEM) are
from three independent experiments (n = 175). D, Analysis of T-bet levels in Th1 cells when Thy1 or Trpm4 is inhibited by siRNA. Figure is representative
of three independent experiments. E, Representative confocal images of NFATc1 (red) and Syto13 nuclear stain (green) in Th1 cells with Thy1 or Trpm4
inhibited by siRNA. Overlays of the NFATc1 and Syto13 are shown at the bottom. F, Histogram of overlap index in Th1 cells with Thy1 or Trpm4 inhibited
by siRNA. Results are significantly different, and data (mean 6 SEM) are from three independent experiments (n = 115).
The Journal of Immunology 2845
at Universidad de C
hile on February 2, 2015http://w
ww
.jimm
unol.org/D
ownloaded from
tion and NFAT-dependent IL-2 production are well studied andhave been shown to be closely tied to the shape and intensity ofthe Ca2+ signal (4, 40). Changes in IL-2 levels influence T cellproliferation, memory cell formation, and regulation of inflamma-tory immune response (41). We also found a decrease in Th2 pro-duction of its signature cytokine IL-4 and no changes in IFN-gproduction. In Th1 cells, we saw no changes in IL-4 productionand a decrease in the production of its signature cytokine IFN-gthat correlates with the decreased levels of NFATc1 measured.In summary, in this study we report for the first time a divergent
role for Trpm4 regulation of Th2 and Th1 function by altering Ca2+
signaling and NFATc1 nuclear localization. We found that Trpm4expression levels were higher in Th2 cells compared with Th1cells. Two independent methods, siRNA and a DN construct, wereused to inhibit Trpm4 expression. We found that inhibition ofTrpm4 expression resulted in increases in Ca2+ levels and NFATc1nuclear localization in Th2 cells as well as decreased cell motility,increased IL-2 production, and decreased IL-4 production. Inhibi-tion of Trpm4 expression in Th1 cells caused a decrease in Ca2+
levels and NFATc1 nuclear localization, resulting in an increasein cell motility, and a decrease in IL-2 and IFN-g production.Thus, the differential regulation of Th cell Ca2+ influx andNFATc1 localization by Trpm4 provide a novel means in whichTh cell Ca2+ signaling, NFATc1 nuclear localization, and subse-quent biological functions are controlled.
AcknowledgmentsWe thank Dario Vignali for providing the pMI-DsR vector and Stephan Phil-
ipp and Marc Freichel for providing the Trpm4-pBlue vector. We also thank
members of the Allen laboratory for helpful comments and suggestions and
Celeste Morley and Gerald Morris for critically reading this manuscript. We
also thank the Alvin J. Siteman Cancer Center at Washington University
School of Medicine and Barnes-Jewish Hospital for the use of the High
Speed Cell Sorter Core (NIH P30 CA91842).
DisclosuresThe authors have no financial conflicts of interest.
References1. Feske, S. 2007. Calcium signalling in lymphocyte activation and disease. Nat.
Rev. Immunol. 7: 690–702.2. Parekh, A. B., and J. W. Putney, Jr. 2005. Store-operated calcium channels.
Physiol. Rev. 85: 757–810.3. Negulescu, P. A., T. B. Krasieva, A. Khan, H. H. Kerschbaum, and
M. D. Cahalan. 1996. Polarity of T cell shape, motility, and sensitivity to antigen.Immunity 4: 421–430.
4. Lewis, R. S. 2001. Calcium signaling mechanisms in T lymphocytes. Annu. Rev.Immunol. 19: 497–521.
5. Bhakta, N. R., D. Y. Oh, and R. S. Lewis. 2005. Calcium oscillations regulatethymocyte motility during positive selection in the three-dimensional thymicenvironment. Nat. Immunol. 6: 143–151.
6. Mosmann, T. R., H. Cherwinski, M. W. Bond, M. A. Giedlin, and R. L. Coffman.1986. Two types of murine helper T cell clone. I. Definition according to profilesof lymphokine activities and secreted proteins. J. Immunol. 136: 2348–2357.
7. Abbas, A. K., K. M. Murphy, and A. Sher. 1996. Functional diversity of helperT lymphocytes. Nature 383: 787–793.
8. Gajewski, T. F., S. R. Schell, and F. W. Fitch. 1990. Evidence implicating uti-lization of different T cell receptor-associated signaling pathways by TH1 andTH2 clones. J. Immunol. 144: 4110–4120.
9. Sloan-Lancaster, J., T. H. Steinberg, and P. M. Allen. 1997. Selective loss of thecalcium ion signaling pathway in T cells maturing toward a T helper 2phenotype. J. Immunol. 159: 1160–1168.
10. Weber, K. S., M. J. Miller, and P. M. Allen. 2008. Th17 cells exhibit a distinctcalcium profile from Th1 and Th2 cells and have Th1-like motility and NF-ATnuclear localization. J. Immunol. 180: 1442–1450.
11. Fanger, C. M., A. L. Neben, and M. D. Cahalan. 2000. Differential Ca2+ influx,KCa channel activity, and Ca2+ clearance distinguish Th1 and Th2 lymphocytes.J. Immunol. 164: 1153–1160.
12. Dolmetsch, R. E., and R. S. Lewis. 1994. Signaling between intracellular Ca2+
stores and depletion-activated Ca2+ channels generates [Ca2+]i oscillations inT lymphocytes. J. Gen. Physiol. 103: 365–388.
13. Launay, P.,H.Cheng, S. Srivatsan,R. Penner, A. Fleig, and J. P. Kinet. 2004. TRPM4regulates calcium oscillations after T cell activation. Science 306: 1374–1377.
14. Vig, M., and J. P. Kinet. 2009. Calcium signaling in immune cells. Nat. Immunol.10: 21–27.
15. Vennekens, R., J. Olausson, M. Meissner, W. Bloch, I. Mathar, S. E. Philipp,F. Schmitz, P. Weissgerber, B. Nilius, V. Flockerzi, and M. Freichel. 2007. In-creased IgE-dependent mast cell activation and anaphylactic responses in micelacking the calcium-activated nonselective cation channel TRPM4. Nat. Immu-nol. 8: 312–320.
16. Barbet, G., M. Demion, I. C. Moura, N. Serafini, T. Leger, F. Vrtovsnik,R. C. Monteiro, R. Guinamard, J. P. Kinet, and P. Launay. 2008. The calcium-activated nonselective cation channel TRPM4 is essential for the migration butnot the maturation of dendritic cells. Nat. Immunol. 9: 1148–1156.
17. Gerzanich, V., S. K. Woo, R. Vennekens, O. Tsymbalyuk, S. Ivanova, A. Ivanov,Z. Geng, Z. Chen, B. Nilius, V. Flockerzi, et al. 2009. De novo expression of Trpm4initiates secondary hemorrhage in spinal cord injury. Nat. Med. 15: 185–191.
18. Grakoui, A., D. L. Donermeyer, O. Kanagawa, K. M. Murphy, and P. M. Allen.1999. TCR-independent pathways mediate the effects of antigen dose and alteredpeptide ligands on Th cell polarization. J. Immunol. 162: 1923–1930.
19. Tripp, C. S., O. Kanagawa, and E. R. Unanue. 1995. Secondary response toListeria infection requires IFN-g but is partially independent of IL-12.J. Immunol. 155: 3427–3432.
20. Kao, H., J. Lin, D. R. Littman, A. S. Shaw, and P. M. Allen. 2008. Regulatedmovement of CD4 in and out of the immunological synapse. J. Immunol. 181:8248–8257.
21. Donermeyer, D. L., K. S. Weber, D. M. Kranz, and P. M. Allen. 2006. The studyof high-affinity TCRs reveals duality in T cell recognition of antigen: specificityand degeneracy. J. Immunol. 177: 6911–6919.
22. Li, C., and W. H. Wong. 2001. Model-based analysis of oligonucleotide arrays:expression index computation and outlier detection. Proc. Natl. Acad. Sci. USA98: 31–36.
23. Zinselmeyer, B. H., J. Dempster, A. M. Gurney, D. Wokosin, M. Miller, H. Ho,O. R. Millington, K. M. Smith, C. M. Rush, I. Parker, et al. 2005. In situ character-ization ofCD4+T cell behavior inmucosal and systemic lymphoid tissues during theinduction of oral priming and tolerance. J. Exp. Med. 201: 1815–1823.
24. Ansel, K. M., D. U. Lee, and A. Rao. 2003. An epigenetic view of helper T celldifferentiation. Nat. Immunol. 4: 616–623.
25. Shaw, J. P., P. J. Utz, D. B. Durand, J. J. Toole, E. A. Emmel, and G. R. Crabtree.1988. Identification of a putative regulator of early T cell activation genes.Science 241: 202–205.
26. Macian, F. 2005. NFAT proteins: key regulators of T-cell development andfunction. Nat. Rev. Immunol. 5: 472–484.
27. Crabtree, G. R. 2001. Calcium, calcineurin, and the control of transcription. J.Biol. Chem. 276: 2313–2316.
28. Badou, A., M. Savignac, M. Moreau, C. Leclerc, R. Pasquier, P. Druet, andL. Pelletier. 1997. HgCl2-induced interleukin-4 gene expression in T cellsinvolves a protein kinase C-dependent calcium influx through L-type calciumchannels. J. Biol. Chem. 272: 32411–32418.
29. Gomes, B., M. Savignac, M. Moreau, C. Leclerc, P. Lory, J. C. Guery, andL. Pelletier. 2004. Lymphocyte calcium signaling involves dihydropyridine-sensitive L-type calcium channels: facts and controversies. Crit. Rev. Immunol.24: 425–447.
30. Delon, J., N. Bercovici, R. Liblau, and A. Trautmann. 1998. Imaging antigenrecognition by naive CD4+ T cells: compulsory cytoskeletal alterations forthe triggering of an intracellular calcium response. Eur. J. Immunol. 28: 716–729.
31. Donnadieu, E., G. Bismuth, and A. Trautmann. 1995. The intracellular Ca2+
concentration optimal for T cell activation is quite different after ionomycin orCD3 stimulation. Pflugers Arch. 429: 546–554.
32. Dolmetsch, R. E., R. S. Lewis, C. C. Goodnow, and J. I. Healy. 1997. Differentialactivation of transcription factors induced by Ca2+ response amplitude and du-ration. Nature 386: 855–858.
33. Kiani, A., J. P. Viola, A. H. Lichtman, and A. Rao. 1997. Down-regulation ofIL-4 gene transcription and control of Th2 cell differentiation by a mechanisminvolving NFAT1. Immunity 7: 849–860.
34. Yoshida, H., H. Nishina, H. Takimoto, L. E. Marengere, A. C. Wakeham,D. Bouchard, Y. Y. Kong, T. Ohteki, A. Shahinian, M. Bachmann, et al. 1998.The transcription factor NF-ATc1 regulates lymphocyte proliferation and Th2cytokine production. Immunity 8: 115–124.
35. Wenner, C. A., S. J. Szabo, and K. M. Murphy. 1997. Identification of IL-4promoter elements conferring Th2-restricted expression during T helper cell sub-set development. J. Immunol. 158: 765–773.
36. Hogan, P. G., L. Chen, J. Nardone, and A. Rao. 2003. Transcriptional regulationby calcium, calcineurin, and NFAT. Genes Dev. 17: 2205–2232.
37. Sweetser, M. T., T. Hoey, Y. L. Sun, W. M. Weaver, G. A. Price, andC. B. Wilson. 1998. The roles of nuclear factor of activated T cells and ying-yang 1 in activation-induced expression of the interferon-gamma promoter inT cells. J. Biol. Chem. 273: 34775–34783.
38. Rincon, M., and R. A. Flavell. 1997. Transcription mediated by NFAT is highlyinducible in effector CD4+ T helper 2 (Th2) cells but not in Th1 cells. Mol. Cell.Biol. 17: 1522–1534.
39. Avni, O., D. Lee, F. Macian, S. J. Szabo, L. H. Glimcher, and A. Rao. 2002.TH cell differentiation is accompanied by dynamic changes in histone acetylationof cytokine genes. Nat. Immunol. 3: 643–651.
40. Dolmetsch, R. E., K. Xu, and R. S. Lewis. 1998. Calcium oscillations increasethe efficiency and specificity of gene expression. Nature 392: 933–936.
41. Hoyer, K. K., H. Dooms, L. Barron, and A. K. Abbas. 2008. Interleukin-2 in thedevelopment and control of inflammatory disease. Immunol. Rev. 226: 19–28.
2846 Trpm4 REGULATION OF Th1/Th2 CALCIUM AND FUNCTION
at Universidad de C
hile on February 2, 2015http://w
ww
.jimm
unol.org/D
ownloaded from