2010 national investor survey - property metrics national investor survey december 2010 introduction...
TRANSCRIPT

2010 National Investor Survey
Compiled by Valuation & Advisory Services

© 2010, CB Richard Ellis, Inc.
Page 2
Specia
l Rep
ort: 2
010 N
atio
na
l Inve
stor Su
rvey
Decem
ber 20
10
INTRODUCTION
The National Investor Survey is a publication of the Valuation & Advisory Services division of CB Richard Ellis,
Inc. This survey contains investment criteria responses from more than 200 investors spread among various
property types. A statistically reliable survey for the real estate property types most in demand (office, industrial
properties, retail properties, and apartments) was achieved through a high number of responses for these
property types.
The responses were compiled between June and August 2010. Those who responded represent a cross section
of the national real estate investment community. The results are summarized below.
Survey Responses-All Property Types
Class A Class B Class C Going In Rates
Low 4.75% 5.75% 6.50% High 11.00% 12.00% 13.00% Avg. 7.63% 8.59% 9.75%
Terminal Rates Low 5.25% 6.25% 7.25% High 11.00% 13.00% 14.00% Avg. 8.04% 8.90% 10.14%
Discount Rates Low 7.00% 7.75% 9.00% High 14.00% 13.00% 14.00% Avg. 9.51% 10.35% 11.67%
Source: CBRE Investor Survey
National Cap Rate Trend
6.00%
7.00%
8.00%
9.00%
10.00%
11.00%
12.00%
13.00%
Office Multi-Housing Industrial Retail Hotels
Source: CBRE Investor Survey

© 2010, CB Richard Ellis, Inc.
Page 3
Specia
l Rep
ort: 2
010 N
atio
na
l Inve
stor Su
rvey
Decem
ber 20
10
A summary of results from the CB Richard Ellis, Inc.-National Investor Survey since 1991 for overall
capitalization rates for all responses by property type is illustrated above. Investor’s expectations of rent,
expense and inflation growth rates are summarized below.
Survey Responses-All Property Types
Class A Class B Class C Growth Rates
Rent- Year 1 0.70% 0.65% 0.45% Rent- Year 2 1.82% 1.68% 1.49% Rent- Year 3 2.91% 2.70% 2.10% Expenses- Year 1 2.56% 2.56% 2.48% Expenses- Year 2 2.70% 2.70% 2.67% Expenses- Year 3 2.75% 2.74% 2.73% Inflation- Year 1 2.32% 2.31% 2.15% Inflation- Year 2 2.65% 2.65% 2.60% Inflation- Year 3 2.67% 2.68% 2.62%
Source: CBRE Investor Survey
National Projected Growth Rates
0
0.5
1
1.5
2
2.5
3
3.5
A 0.7 1.82 2.91 2.56 2.7 2.75 2.32 2.65 2.67
B 0.65 1.68 2.7 2.56 2.7 2.74 2.31 2.65 2.68
C 0.45 1.49 2.1 2.48 2.67 2.73 2.15 2.6 2.62
Rent Year 1
Rent Year 2
Rent Year 3
Expense Year 1
Expense Year 2
Expnese Year 3
Inflation Year 1
Inflation Year 2
Inflation Year 3
Source: CBRE Investor Survey

© 2010, CB Richard Ellis, Inc.
Page 4
Specia
l Rep
ort: 2
010 N
atio
na
l Inve
stor Su
rvey
Decem
ber 20
10
Marketing/Exposure Time
Federal guidelines require appraisers to analyze and report a reasonable exposure period for properties
appraised. In this survey, we again asked for specific exposure times by property type.
Survey Responses-All Property Types
Class A Class B Class C Marketing Period (Mos.)
Low 1 1 1 High 12 12 18 Avg. 4.79 5.65 6.95
Source: CBRE Investor Survey
Marketing Time
Low Low Low
High High
High
0
5
10
15
20
Mo
nth
s
Low 1 1 1
High 12 12 18
Average 4.79 5.65 6.95
Class A Class B Class C
Source: CBRE Investor Survey
Average exposure times for Class A properties have increased from 4.9 months in 2005, to 5.9 months in 2007
to 6.5 months in 2009. During 2010, average Class A exposure times decreased to 4.79 months. Class B and C
properties had longer average exposure times of 5.65 and 6.95 months, respectively. Most respondents perceive
a typical exposure period for all types of real estate to be around six months if priced properly.

© 2010, CB Richard Ellis, Inc.
Page 5
Specia
l Rep
ort: 2
010 N
atio
na
l Inve
stor Su
rvey
Decem
ber 20
10
Building Class Definitions
The CBRE National Investor Survey includes criteria differentiated by property type and class (A, B and C).
Within the survey the three classes of property are defined as follows:
Class A Property - Top-quality, institutional-grade properties, generally defined as properties in major
metropolitan areas with values in excess of $10,000,000 that are characterized by strong credit tenancy.
Class B Property - Average-quality, non-institutional-grade properties with average credit tenancy. These
properties are typically characterized by second tier locations within the market, or by lower quality of
construction relative to Class A properties.
Class C Property - Low-quality, developer/speculator-type properties (valued-added scenarios, tenant
leasing/absorption issues, capital expenditures pending). These definitions are provided for general
discussion purposes only, as these definitions can vary depending upon the unique characteristics of
individual markets.
Investment Rate Trends
The National Investor Survey in 2010 indicated average cap rates increased from 8.4% to 8.53% for all
property types and classes. The increase was the greatest in Class C investment product increasing from 9.42%
to 9.75%. For Class A assets we continue to see downward pressure on cap rates, based on limited supply and
investor demand. Overall National Investment Activity, according to Real Capital Analytics, is up by 80%
compared to a year ago to $54.0 billion in 2010 year-to-date compared to $30.3 billion for the same period
in 2009. The following charts illustrate the changes in overall rates since 1994 as well as the spread between
going in and terminal rates over the same period. Overall the Survey participants are cautiously optimistic with
respect to a real estate recovery. But the mood has definitely improved from a year ago, especially with more
stabilized rents and with investment activity increasing.
Cap Rate Trends
6.00%
7.00%
8.00%
9.00%
10.00%
11.00%
12.00%
13.00%
Class A Class B Class C Average Source: CBRE National Investor Survey

© 2010, CB Richard Ellis, Inc.
Page 6
Specia
l Rep
ort: 2
010 N
atio
na
l Inve
stor Su
rvey
Decem
ber 20
10
Overall Rate and Terminal Rate Spread
0.00%
0.10%
0.20%
0.30%
0.40%
0.50%
0.60%
0.70%
0.80%
Class A Class B Class C Average
Source: CBRE National Investor Survey
The spread between going-in cap rates and terminal cap rates appears to be stabilizing. As illustrated in the
chart below, the discount rate has slightly increased between 2009 and 2010.
Discount Rate Trends
7.00%
8.00%
9.00%
10.00%
11.00%
12.00%
13.00%
14.00%
15.00%
16.00%
17.00%
Class A Class B Class C Average Source: CBRE National Investor Survey
The long term view of the survey respondents present a similar story as the cap rate trends, as evident by the
same patterns seen in the discount rate trends for all property types and classes.

© 2010, CB Richard Ellis, Inc.
Page 7
Specia
l Rep
ort: 2
010 N
atio
na
l Inve
stor Su
rvey
Decem
ber 20
10
CBRE Service: Assessment & Consulting Services
CB Richard Ellis Assessment & Consulting Services
(ACS) offers a full range of environmental, property
condition, seismic and construction related services
associated with commercial real estate acquisition,
finance, development and surveillance. Using its
nationwide network of experienced professionals and
its national quality control program, CB Richard Ellis
provides its clients a high quality product produced in
a timely manner at a reasonable cost. Typical Services
provided by CB Richard Ellis include:
AAI/ASTM E 1527-05 Compliant Phase I
Environmental Site Assessments
Asbestos, Lead-Based Paint and Radon Surveys
Construction Document and Cost Reviews (DCRs)
Construction Progress Monitoring (CPM)
Inspections
Phase II Subsurface Assessments
Property Condition Assessments
Seismic Studies/Probable Maximum Loss
Evaluations
Surveillance and Servicing Inspections
Tier I and Tier II ADA Surveys
Our field staff average over 10 years of direct
environmental, property condition or construction
experience and include a mixture of engineers,
architects, geologists, construction managers and
environmental professionals located across the
country. The use of local professionals allows us to
better understand the properties we are assessing. For
the property condition assessment reports, this local
knowledge means a better understanding of regional
construction types, building codes, natural concerns,
such as expansive soils, and local cost structures. For
the environmental assessments reports, this local
knowledge means a better knowledge of the unique
environmental concerns in an area, better access to
historical resources and an understanding of local
and state regulations.
Richard Dagnall Senior Managing Director Assessment & Consulting Services Leader T 713.888.4739 [email protected]
About CBRE’s Valuation & Advisory Services
CBRE Valuation & Advisory Services (VAS) is a nationwide organization of experienced professionals,
providing appraisal and consulting services to a broad-based local and national clientele. With a
professional staff of over 375 appraisers and a local presence in over 50 major metro areas,
Valuation & Advisory Services focuses on the needs of our clients with a commitment to providing a
high quality product produced in a timely manner at a reasonable cost.

© 2010, CB Richard Ellis, Inc.
Page 8
Specia
l Rep
ort: 2
010 N
atio
na
l Inve
stor Su
rvey
Decem
ber 20
10
MULTI-FAMILY
Industry sentiment on the condition of quarterly apartment metrics released by the National Multi Housing
Council (NMHC) shows multi-family market buoyancy despite the continued overshadowing specter of a
sluggish economic recovery. Evidenced by strong responses in the last two NMHC surveys indicating
widespread improvement over the last six months, demand for apartment residences has substantially
increased thanks to modest improvements in the job market and continued decline in homeownership rates.
The U.S. housing market continues to be challenged with an increasing number of foreclosures and buyers
preferring to rent than to own until they are convinced that the housing market has bottomed out.
Recovery in the apartment sector is coming from a variety of different sources, but nonetheless is equating to
comparatively more aggressive rent pricing and the consideration of development options among operators.
With job numbers, albeit, meaningfully improved, still not supporting all of the current demand, anecdotal
evidence as to what are the remaining demand generators include the decline of the doubling-down
phenomenon as renters elect to ditch roommates in favor of one-bedroom units, portions of the Gen Y
demographic moving out of their parents residences, single-family shadow renters returning to the apartment
market and individuals that have sold their homes opting to rent in what is otherwise an uncertain economy.
The following is a summary of multi-family investment criteria.
New multi-housing supply has been limited, and with demand increasing, we anticipate further vacancy rates to remain
low for the next couple of years until the housing market starts to recover and consumer confidence is restored.
Class A Class B Class C Going In Rates
Low 4.75% 5.75% 6.50% High 8.50% 10.00% 13.00% Avg. 6.31% 7.18% 8.58%
Terminal Rates Low 5.25% 6.25% 7.25% High 8.50% 10.00% 13.00% Avg. 6.84% 7.71% 9.03%
Discount Rates Low 7.00% 8.00% 9.00% High 10.25% 11.00% 14.00% Avg. 8.76% 9.60% 10.81%
Growth Rates Rent-Year 1 1.38% 1.69% 1.63% Rent-Year 2 2.60% 2.81% 2.96% Rent-Year 3 3.35% 3.26% 3.17% Expenses-Year 1 2.55% 2.71% 2.81% Expenses-Year 2 2.58% 2.74% 2.85% Expenses-Year 3 2.58% 2.71% 2.79% Inflation-Year 1 2.18% 2.28% 2.26% Inflation-Year 2 2.49% 2.58% 2.64% Inflation-Year 3 2.56% 2.61% 2.69%
Class A Class B Class C Marketing Period (Mos.)
Low 1 1 1 High 6 9 12 Avg. 3.56 3.89 4.35
Source: CBRE Investor Survey

© 2010, CB Richard Ellis, Inc.
Page 9
Specia
l Rep
ort: 2
010 N
atio
na
l Inve
stor Su
rvey
Decem
ber 20
10
INDUSTRIAL
Experts expect a resumption of positive net absorption. With construction expected to remain low, they expect
vacancy to increase slightly in the near term, after which availability will slowly decline. In addition, rents will
continue to decline in the short term. Consumer spending is expected to remain sluggish and businesses
remain wary of hiring workers and building inventories—all of which will work to prevent a robust recovery.
The economic recovery will need to be in full swing prior to the industrial sector returning to previous levels.
Given the still-existing slack in the market, experts don’t foresee a rental recovery reaching completion until
2014, at which time demand drivers will have made a full recovery and allowed the real estate markets to once
again move forward. The following is a summary of industrial investment criteria.
Business Parks Industrial R&D Warehouse/Distribution Class A Class B Class C Class A Class B Class C Class A Class B Class C Going In Rates
Low 6.50% 7.00% 8.50% 7.00% 8.00% 9.00% 6.00% 7.00% 8.00% High 9.75% 10.75% 11.25% 11.00% 11.50% 11.25% 9.50% 10.25% 11.25% Avg. 8.18% 9.10% 9.88% 8.77% 9.36% 10.16% 7.74% 8.79% 9.80%
Terminal Rates Low 7.50% 8.00% 9.00% 8.00% 8.50% 9.00% 6.75% 7.00% 8.50% High 10.00% 11.00% 11.50% 11.00% 11.50% 11.75% 9.50% 10.50% 11.50% Avg. 8.70% 9.54% 10.25% 9.00% 9.53% 10.47% 8.09% 8.73% 10.00%
Discount Rates Low 8.00% 9.00% 9.50% 8.00% 9.00% 9.50% 8.00% 9.00% 9.50% High 11.00% 12.00% 12.75% 14.00% 12.00% 12.75% 10.75% 11.50% 12.75% Avg. 9.70% 10.42% 11.45% 10.46% 10.62% 11.69% 9.33% 9.93% 11.28%
Growth Rates Rent-Year 1 0.42% 0.33% 0.30% 0.17% 0.44% 0.00% 0.81% 0.80% 0.75% Rent-Year 2 1.00% 1.42% 1.10% 1.25% 1.44% 1.00% 2.18% 1.77% 1.32% Rent-Year 3 2.43% 2.67% 1.81% 1.83% 2.56% 1.88% 3.61% 2.69% 1.75% Expenses-Year 1 2.51% 2.51% 2.41% 2.83% 2.79% 3.00% 2.47% 2.42% 2.13% Expenses-Year 2 2.51% 2.51% 2.41% 2.83% 2.79% 3.00% 2.55% 2.50% 2.25% Expenses-Year 3 2.51% 2.51% 2.41% 2.83% 2.79% 3.00% 2.55% 2.50% 2.25% Inflation-Year 1 2.01% 2.17% 2.01% 2.33% 2.50% 2.50% 2.22% 2.19% 1.75% Inflation-Year 2 2.34% 2.51% 2.41% 2.67% 2.78% 3.00% 2.50% 2.52% 2.25% Inflation-Year 3 2.34% 2.51% 2.41% 2.67% 2.80% 3.00% 2.50% 2.53% 2.25%
Marketing Period (Mos.) Low 3 3 3 3 3 3 3 3 3 High 12 12 18 6 9 12 6 9 12 Avg. 6.17 7.17 9.00 5.00 6.60 7.50 5.30 6.00 7.33
Source: CBRE Investor Survey

© 2010, CB Richard Ellis, Inc.
Page 10
Specia
l Rep
ort: 2
010 N
atio
na
l Inve
stor Su
rvey
Decem
ber 20
10
OFFICE
The office market turned positive for the first time in 18 months during the second quarter of 2010. However,
demand remains very weak and at the present rate will not be sufficient to bring down the market vacancy rate.
The construction pipeline shows few signs of life as only holdovers from the pre-recession development cycle
remain, primarily in downtown markets where vacancy rates are still rising. The vacancy rate is likely to rise
further this year as demand will be too weak to outpace even the few new deliveries still expected over the next
couple of quarters.
Experts believe that once vacancy rates crest next year they will slowly return to equilibrium levels that support
moderate rent inflation that will match price increases in broader markets. The excessive slack in the job market
will make it difficult for office rents to recover in the near term; as they are looking at a demand-side recovery.
Over the past two years, employers shed more employees than space, and as a result have which allows for
future growth as the economy improves. Growth should start to accelerate in 2011, allowing rents to stabilize
and finally turn positive in a few markets after more than two years of decline. Although a full recovery remains
more than two years away for the office market, it will certainly be more comfortable to be on the upside of the
downturn. The following is a summary of office investment criteria.
Office investment was the most active in 2010 with just over $17.7 billion in transactions year to date. Cap
rates for the past two quarters have dropped slightly but still remain higher than 2007 levels.
Suburban Offices Urban Offices Class A Class B Class C Class A Class B Class C Going In Rates
Low 7.00% 7.50% 8.50% 5.50% 6.75% 8.00% High 10.00% 11.00% 12.00% 10.00% 10.50% 11.00% Avg. 8.21% 9.02% 10.03% 7.20% 8.32% 9.58%
Terminal Rates Low 7.00% 7.50% 8.50% 5.75% 7.00% 8.00% High 10.00% 11.00% 12.00% 9.00% 11.00% 12.00% Avg. 8.49% 9.12% 10.18% 7.48% 8.40% 9.68%
Discount Rates Low 8.00% 8.25% 9.00% 7.00% 7.75% 9.00% High 12.00% 13.00% 14.00% 10.25% 11.00% 13.00% Avg. 9.54% 10.50% 11.82% 8.92% 9.93% 11.70%
Growth Rates Rent-Year 1 0.52% 0.55% -0.18% 0.35% -0.04% -0.29% Rent-Year 2 1.61% 1.38% 1.36% 2.32% 2.12% 1.86% Rent-Year 3 3.39% 3.17% 2.86% 3.76% 3.65% 3.07% Expenses-Year 1 2.65% 2.55% 2.36% 2.82% 2.85% 2.71% Expenses-Year 2 2.85% 2.74% 2.73% 2.94% 2.92% 2.86% Expenses-Year 3 2.89% 2.79% 2.82% 2.94% 2.92% 2.86% Inflation-Year 1 2.63% 2.48% 2.32% 2.69% 2.69% 2.43% Inflation-Year 2 2.83% 2.74% 2.73% 2.94% 2.92% 2.86% Inflation-Year 3 2.83% 2.79% 2.73% 2.94% 2.92% 2.86%
Source: CBRE Investor Survey
© 2010, CB Richard Ellis, Inc.
Page 11
Specia
l Rep
ort: 2
010 N
atio
na
l Inve
stor Su
rvey
Decem
ber 20
10
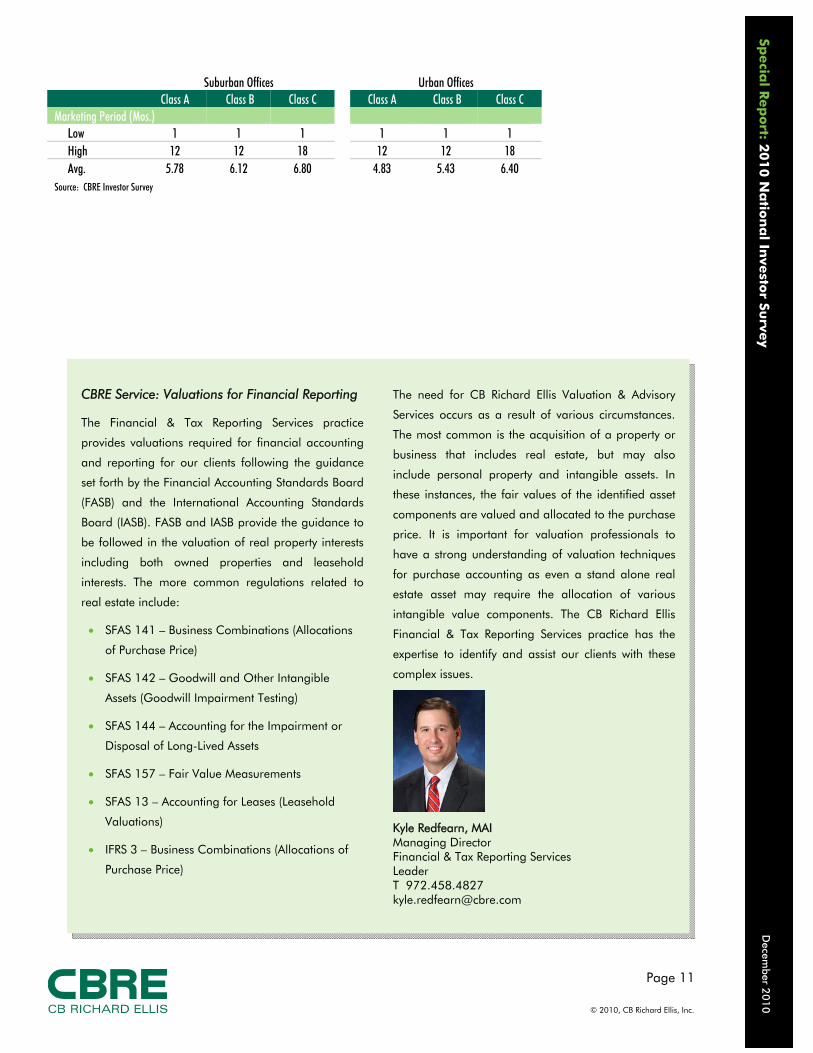
Suburban Offices Urban Offices Class A Class B Class C Class A Class B Class C Marketing Period (Mos.)
Low 1 1 1 1 1 1 High 12 12 18 12 12 18 Avg. 5.78 6.12 6.80 4.83 5.43 6.40
Source: CBRE Investor Survey
CBRE Service: Valuations for Financial Reporting
The Financial & Tax Reporting Services practice
provides valuations required for financial accounting
and reporting for our clients following the guidance
set forth by the Financial Accounting Standards Board
(FASB) and the International Accounting Standards
Board (IASB). FASB and IASB provide the guidance to
be followed in the valuation of real property interests
including both owned properties and leasehold
interests. The more common regulations related to
real estate include:
SFAS 141 – Business Combinations (Allocations
of Purchase Price)
SFAS 142 – Goodwill and Other Intangible
Assets (Goodwill Impairment Testing)
SFAS 144 – Accounting for the Impairment or
Disposal of Long-Lived Assets
SFAS 157 – Fair Value Measurements
SFAS 13 – Accounting for Leases (Leasehold
Valuations)
IFRS 3 – Business Combinations (Allocations of
Purchase Price)
The need for CB Richard Ellis Valuation & Advisory
Services occurs as a result of various circumstances.
The most common is the acquisition of a property or
business that includes real estate, but may also
include personal property and intangible assets. In
these instances, the fair values of the identified asset
components are valued and allocated to the purchase
price. It is important for valuation professionals to
have a strong understanding of valuation techniques
for purchase accounting as even a stand alone real
estate asset may require the allocation of various
intangible value components. The CB Richard Ellis
Financial & Tax Reporting Services practice has the
expertise to identify and assist our clients with these
complex issues.
Kyle Redfearn, MAI Managing Director Financial & Tax Reporting Services Leader T 972.458.4827 [email protected]

© 2010, CB Richard Ellis, Inc.
Page 12
Specia
l Rep
ort: 2
010 N
atio
na
l Inve
stor Su
rvey
Decem
ber 20
10
RETAIL The retail industry recently exhibited some encouraging signs. Retail sales growth is back in positive territory on
a year-over-year basis, with each subsector (housing, discretionary and necessities) recording positive growth.
Retail sales have weakened slightly in recent months and we are beginning to see signs of fragility in the
consumer recovery, but although consumers have become a bit cautious recently, retail fundamentals continue
to indicate that we are getting closer to a recovery. After historic absorption declines in 2008 and 2009, there is
a lot of ground for absorption to make up. Thankfully, oversupply will not be a concern as completion levels
are projected to remain below historic levels (and close to zero) for the next couple of years for the majority of
retail center types.
Regional Malls Power Centers Community Centers Class A Class B Class C Class A Class B Class C Class A Class B Class C Going In Rates
Low 6.25% 7.00% 8.00% 7.00% 7.50% 8.00% 6.00% 7.50% 9.00% High 9.00% 8.50% 11.25% 9.25% 10.25% 12.00% 9.75% 10.75% 12.00% Avg. 7.54% 7.88% 9.81% 7.94% 8.92% 10.14% 7.90% 8.88% 10.27%
Terminal Rates Low 6.75% 7.00% 8.50% 7.50% 8.00% 8.50% 7.00% 7.75% 9.50% High 9.75% 9.00% 11.50% 10.00% 11.00% 12.75% 10.00% 11.00% 12.00% Avg. 8.08% 8.19% 10.13% 8.53% 9.28% 10.68% 8.36% 9.27% 10.73%
Discount Rates Low 8.00% 9.50% 10.50% 8.00% 8.50% 10.00% 8.00% 8.75% 10.00% High 10.25% 11.00% 12.50% 11.00% 12.00% 13.00% 11.00% 12.00% 13.00% Avg. 9.13% 10.31% 11.50% 9.76% 10.59% 11.59% 9.52% 10.31% 11.88%
Growth Rates Rent-Year 1 0.25% -0.33% -1.25% 0.33% 0.08% -0.17% 0.22% 0.17% -0.14% Rent-Year 2 0.63% 0.17% -0.25% 1.58% 0.67% 0.67% 1.44% 1.56% 0.79% Rent-Year 3 1.75% 1.67% 0.50% 2.67% 1.42% 0.92% 2.56% 2.72% 1.71% Expenses-Year 1 3.00% 3.00% 3.00% 2.33% 2.33% 2.33% 2.22% 2.22% 2.00% Expenses-Year 2 3.00% 3.00% 3.00% 2.67% 2.67% 2.67% 2.56% 2.56% 2.43% Expenses-Year 3 3.00% 3.00% 3.00% 2.67% 2.67% 2.67% 2.78% 2.78% 2.71% Inflation-Year 1 2.25% 2.00% 2.00% 2.17% 2.17% 2.17% 2.33% 2.33% 2.14% Inflation-Year 2 3.00% 3.00% 3.00% 2.67% 2.67% 2.67% 2.78% 2.78% 2.71% Inflation-Year 3 3.00% 3.00% 3.00% 2.67% 2.67% 2.67% 2.78% 2.78% 2.71%
Marketing Period (Mos.) Low 3 3 6 1 2 2 2 2 2 High 12 9 12 6 9 12 12 12 18 Avg. 6.25 6.00 9.00 3. 25 5.00 5.75 5.57 6.63 8.83
Source: CBRE Investor Survey

© 2010, CB Richard Ellis, Inc.
Page 13
Specia
l Rep
ort: 2
010 N
atio
na
l Inve
stor Su
rvey
Decem
ber 20
10
Neighborhood Centers Strip Centers Class A Class B Class C Class A Class B Class C Going In Rates
Low 6.00% 7.00% 8.00% 7.50% 7.75% 8.00% High 10.00% 11.00% 12.00% 10.00% 12.00% 13.00% Avg. 7.80% 8.71% 9.79% 8.70% 9.67% 10.72%
Terminal Rates Low 6.50% 7.50% 8.50% 8.00% 8.25% 9.50% High 10.00% 12.00% 13.00% 11.00% 13.00% 14.00% Avg. 8.22% 9.08% 10.33% 9.17% 10.13% 11.45%
Discount Rates Low 8.00% 8.50% 9.00% 9.00% 9.50% 11.00% High 13.00% 12.00% 14.00% 12.00% 13.00% 14.00% Avg. 9.77% 10.52% 11.98% 10.38% 11.29% 12.48%
Growth Rates Rent-Year 1 0.66% 0.32% 0.03% 0.33% 0.15% -0.06% Rent-Year 2 1.66% 1.35% 1.10% 0.83% 0.90% 0.44% Rent-Year 3 2.55% 2.41% 1.63% 1.33% 1.65% 0.63% Expenses-Year 1 2.55% 2.50% 2.43% 2.28% 2.35% 2.19% Expenses-Year 2 2.74% 2.71% 2.67% 2.56% 2.60% 2.50% Expenses-Year 3 2.84% 2.82% 2.80% 2.56% 2.60% 2.50% Inflation-Year 1 2.56% 2.50% 2.43% 2.00% 2.11% 1.86% Inflation-Year 2 2.78% 2.75% 2.71% 2.38% 2.44% 2.29% Inflation-Year 3 2.78% 2.75% 2.71% 2.38% 2.44% 2.29%
Marketing Period (Mos.) Low 1 2 2 1 2 2 High 12 12 18 12 12 18 Avg. 4.13 5.63 7.60 4.89 5.82 7.33
Source: CBRE Investor Survey

© 2010, CB Richard Ellis, Inc.
Page 14
Specia
l Rep
ort: 2
010 N
atio
na
l Inve
stor Su
rvey
Decem
ber 20
10
HOTEL
Although there are some positive signs of recovery, the lodging industry will continue to face noteworthy
challenges during the foreseeable future. The U.S. economy, while rebounding, is not expected to see
unemployment drop below nine percent until 2011, and the housing market continues to be weak. Corporate
travel spending, particularly for group meeting and convention business, continues to be muted, and consumer
confidence is volatile, but we have started to see an increase in business travel in 2010 which will help the
battered hotel sector. Labor issues, particularly the escalating costs of employee benefits, exert negative
pressure on profits. Terrorism, both overseas and domestic, clearly remains high on the risk scale. The recent
oil-spill in the gulf, while representing just a mere fraction of overall oil consumption in the US, may exert
upward pressure on energy prices, which could impact travel. On the positive side, relatively low interest rates
and limited inflation appear as if they will remain stable over the near term. Moreover, the overall conditions
in the capital markets have improved dramatically during the very recent past, and the overall sales pace is
accelerating. Further, transient related travel is increasing and demand growth will be positive in 2010.
Barring any major global setbacks, the lodging market will continue its slow but steady recovery. The hotel
sector is a good barometer of the economy. It is usually the first to experience a downturn in a recession and
usually the quickest out of a recession. Most of the investment demand for hotels has been in the Full Service
hotels; this is reflective in the lower cap rates.

© 2010, CB Richard Ellis, Inc.
Page 15
Specia
l Rep
ort: 2
010 N
atio
na
l Inve
stor Su
rvey
Decem
ber 20
10
All Hotels Full Service Hotels Class A Class B Class C Class A Class B Class C Going In Rates
Low 5.00% 6.00% 7.00% 6.00% 6.50% 9.00% High 10.00% 11.00% 13.00% 10.00% 11.00% 12.00% Avg. 8.59% 9.27% 10.43% 8.61% 9.09% 10.33%
Terminal Rates Low 6.00% 7.00% 8.00% 7.50% 8.00% 9.50% High 11.00% 12.00% 13.00% 10.00% 11.00% 12.00% Avg. 9.09% 9.61% 10.93% 9.07% 9.34% 10.50%
Discount Rates Low 8.00% 9.00% 10.00% 10.00% 11.25% 11.50% High 14.00% 16.00% 18.00% 14.00% 16.00% 18.00% Avg. 11.74% 12.48% 13.30% 12.38% 13.04% 14.25%
Growth Rates Rent-Year 1 4.08% 2.75% 1.71% 4.00% 2.75% 1.33% Rent-Year 2 7.00% 6.25% 4.57% 6.60% 6.25% 3.67% Rent-Year 3 4.42% 4.38% 3.71% 4.20% 4.13% 3.33% Expenses-Year 1 2.90% 2.86% 2.86% 2.88% 2.83% 2.83% Expenses-Year 2 3.00% 3.00% 3.00% 3.00% 3.00% 3.00% Expenses-Year 3 3.00% 3.00% 3.00% 3.00% 3.00% 3.00% Inflation-Year 1 2.22% 2.43% 2.29% 2.33% 2.50% 2.17% Inflation-Year 2 2.78% 3.14% 3.00% 3.17% 3.33% 3.00% Inflation-Year 3 3.56% 4.00% 3.86% 4.33% 4.33% 4.00%
Marketing Period (Mos.) Low 3 3 3 3 3 3 High 10 5 7 10 5 5 Avg. 5.36 4.75 5.00 5.60 4.50 4.33
Source: CBRE Investor Survey

© 2010, CB Richard Ellis, Inc.
Page 16
Specia
l Rep
ort: 2
010 N
atio
na
l Inve
stor Su
rvey
Decem
ber 20
10
Luxury/Resort Hotels Limited Service Hotels Class A Class B Class C Class A Class B Class C Going In Rates
Low 5.00% 6.00% 7.00% 8.00% 9.00% 10.00% High 9.00% 8.50% 9.00% 10.00% 11.00% 13.00% Avg. 7.00% 7.25% 8.00% 9.30% 10.17% 11.33%
Terminal Rates Low 6.00% 7.00% 8.00% 8.00% 10.00% 10.50% High 9.00% 9.00% 10.00% 11.00% 12.00% 13.00% Avg. 7.75% 8.00% 9.00% 9.69% 10.50% 12.00%
Discount Rates Low 8.00% 9.00% 10.00% 10.00% 11.00% 12.00% High 12.00% 13.00% 14.00% 13.00% 13.50% 14.50% Avg. 10.25% 11.00% 12.00% 11.93% 12.38% 13.00%
Growth Rates Rent-Year 1 4.50% 5.00% 4.00% 4.00% 2.00% 1.33% Rent-Year 2 9.00% 12.00% 10.00% 6.60% 4.33% 3.67% Rent-Year 3 5.50% 7.00% 6.00% 4.20% 3.83% 3.33% Expenses-Year 1 3.00% 3.00% 3.00% 2.88% 2.83% 2.83% Expenses-Year 2 3.00% 3.00% 3.00% 3.00% 3.00% 3.00% Expenses-Year 3 3.00% 3.00% 3.00% 3.00% 3.00% 3.00% Inflation-Year 1 3.00% 3.00% 3.00% 1.75% 2.17% 2.17% Inflation-Year 2 3.00% 3.00% 3.00% 2.38% 3.00% 3.00% Inflation-Year 3 3.00% 3.00% 3.00% 3.25% 4.00% 4.00%
Marketing Period (Mos.) Low 3 5 5 3 5 5 High 3 5 5 10 5 7 Avg. 3.00 5.00 5.00 5.60 5.00 5.67
Source: CBRE Investor Survey

© 2010, CB Richard Ellis, Inc.
Page 17
Specia
l Rep
ort: 2
010 N
atio
na
l Inve
stor Su
rvey
Decem
ber 20
10
OTHER
General Investments Net-Leased Investments Self-Storage Class A Class B Class C Class A Class B Class C Class A Class B Class C Going In Rates
Low 7.50% 8.00% 9.50% 5.60% 7.00% 8.00% 7.00% 8.00% 9.50% High 10.00% 11.00% 12.00% 9.00% 11.00% 13.00% 9.25% 10.25% 12.00% Avg. 8.59% 9.47% 10.88% 7.84% 8.69% 10.18% 8.40% 9.35% 10.65%
Terminal Rates Low 8.00% 9.00% 10.00% 7.50% 8.00% 8.50% 7.25% 8.50% 10.00% High 10.00% 11.50% 12.50% 9.00% 11.00% 13.00% 9.50% 10.50% 13.00% Avg. 9.00% 10.00% 11.25% 8.24% 9.11% 10.41% 8.78% 9.80% 11.15%
Discount Rates Low 9.00% 10.80% 11.80% 8.75% 9.00% 10.50% 9.00% 10.00% 11.00% High 11.00% 12.00% 13.00% 10.25% 12.00% 14.00% 11.00% 12.00% 14.00% Avg. 10.32% 11.32% 12.34% 9.52% 10.34% 11.73% 10.05% 11.00% 12.21%
Growth Rates Rent-1 0.88% 0.75% 0.83% 0.58% 0.83% 1.13% 0.80% 0.30% 0.20% Rent-2 1.75% 1.63% 1.17% 1.50% 1.42% 1.38% 1.30% 1.00% 1.00% Rent-3 2.13% 2.00% 1.67% 2.08% 1.67% 1.75% 2.40% 2.30% 1.90% Expenses-Year 1 2.75% 2.75% 2.67% 2.75% 2.67% 2.63% 2.00% 2.00% 2.00% Expenses-Year 2 2.75% 2.75% 2.67% 2.83% 2.75% 2.75% 2.40% 2.40% 2.40% Expenses-Year 3 2.75% 2.75% 2.67% 2.83% 2.75% 2.75% 3.00% 3.00% 3.00% Inflation-Year 1 2.00% 2.00% 1.67% 2.20% 2.10% 1.67% 1.60% 1.60% 1.60% Inflation-Year 2 2.50% 2.50% 2.33% 2.60% 2.50% 2.33% 2.20% 2.20% 2.20% Inflation-Year 3 2.50% 2.50% 2.33% 2.60% 2.50% 2.33% 2.40% 2.40% 2.40%
Marketing Period (Mos.)
Low 4 6 6 1 1 4 3 6 6 High 12 12 18 6 9 12 6 12 12 Avg. 7.33 8.00 10.00 4.20 4.50 7.00 5.00 9.00 10.20
Source: CBRE Investor Survey
© 2010, CB Richard Ellis, Inc.
Page 18
Specia
l Rep
ort: 2
010 N
atio
na
l Inve
stor Su
rvey
Decem
ber 20
10
SCOPE OF SERVICES
Accurate and reliable valuations are critical to the success of every real estate investment. CBRE Valuation &
Advisory Services (VAS) delivers high-quality valuations that help clients make the right real estate decisions.
The Valuation & Advisory Services group is a nationwide is a nationwide organization of experienced
professionals, providing appraisal and consulting services to a broad-based local and national clientele. With a
professional staff of more than 375 appraisers and a local presence in more than 50 major metro areas, VAS
focuses on the needs of our clients with a commitment to providing a high-quality product produced in a timely
manner at a reasonable cost.
As part of CBRE’s broad platform of real estate services, Valuation & Advisory Services has the human and
technological resources to help solve any valuation-related real estate problem you may face. A variety of
investment and commercial banks, corporations, pension funds, investors, property owners, REITs and
government agencies from around the globe have used our services to satisfy their business needs. All CBRE
reporting conforms to the Appraisal Institute and the Uniform Standards of Professional Appraisal Practice.
Our services range from single-asset valuations to our industry-leading valuations of multi-market, multi-
property portfolios. We are equally adept at evaluating office, retail, industrial, hotel, multi-family and special-
use properties. VAS professionals focus on a specific property type or service to become experts in their field.
Our appraisal professionals also specialize in specific geographic markets, resulting in superior local market
knowledge.
For financial and tax reporting purposes, CBRE VAS and our alliance partners are able to provide a single
point-of-contact for comprehensive valuation needs including real estate, machinery and equipment, inventory,
business valuation and intangible asset appraisals. Our appraisal reports are compliant with USPAP, FIRREA
and the Sarbanes-Oxley Act and will satisfy all financial reporting needs, including the emerging mark-to-
market accounting requirements.
CB Richard Ellis Assessment & Consulting Services (ACS) offers a full range of environmental, property
condition, seismic and construction related services associated with commercial real estate acquisition, finance,
development and surveillance. Our professionals average more than 10 years of experience and include
geologists, civil, mechanical, structural and chemical engineers, architects, construction managers, LEED®
Accredited Professionals and environmental professionals. This mixture of backgrounds and significant level of
experience assures our clients of a high level of knowledge and expertise.
FOR MORE INFORMATION CONTACT:
Thomas B. McDonnell, MAI, CCIM
President, Valuation & Advisory Services Chicago, Illinois [email protected] T 312 233 8669 F 312 233 8660 www.cbre.com/Thomas.McDonnell
Michael R. Rowland, MAI, MRICS
Senior Managing Director, Intermountain Region Phoenix, Arizona [email protected] T 602 735 5508 F 602 735 5613 www.cbre.com/Michael.Rowland
Donald R. Spradlin, MAI
Senior Managing Director, Southern California Los Angeles, California [email protected] T 213.613.3654 F 213.613.3131 www.cbre.com/Donald.Spradlin
Raymond Wong
Director, Americas Research Operations Toronto, Ontario [email protected] T 416 815 2353 F 416 362 8085 www.cbre.ca/Raymond.Wong

© 2010, CB Richard Ellis, Inc.
Page 19
Specia
l Rep
ort: 2
010 N
atio
na
l Inve
stor Su
rvey
Decem
ber 20
10
VAS CONTACTS BY REGION
Business Line Leader Thomas B. McDonnell, MAI, CCIM President, Corp. Appraisal Services 311 South Wacker Drive, 4th Floor Chicago, IL 60606 T 312.233.8669 F 312.233.8660 [email protected]
Hospitality & Gaming Group Daniel H. Lesser, MAI, CRE, CHA Senior Managing Director Industry Leader One Penn Plaza, Suite 1835 New York City, NY 10119 T 212.207.6064 F 212.207.6169 [email protected]
Financial & Tax Reporting Services Kyle Redfearn, MAI Managing Director 5430 LBJ Freeway, Suite 1100 Dallas, TX 75240 T 972.458.4827 F 972.458.4981 [email protected]
Assessment & Consulting Services Richard Dagnall Senior Managing Director 2700 Post Oak Blvd., Suite 225 Houston, TX 77056 T 713.888.4739 F 713.840.6649 [email protected]
Pacific Northwest Scott F. Biethan, MAI, CRE, FRICS Senior Managing Director Hospitality & Gaming Group- Co-Manager 1420 5th Ave., Suite 440 Seattle, WA 98101 T 206.292.6198 F 206.292.1601 [email protected]
Northern California Elizabeth Champagne, MAI, MRICS Senior Managing Director Platform Leader, GCS- VAS Liaison for New Accounts 350 Sansome Street, Suite 840 San Francisco, CA 94104 T 415.986.7395 F 415.986.6862 [email protected]
Southern California Donald R. Spradlin, MAI Senior Managing Director 355 South Grand Ave 12th Floor Los Angeles, CA 90071 T 213.613.3654 F 213.613.3131 [email protected]
Intermountain Michael R. Rowland, MAI, MRICS Senior Managing Director 2415 East Camelback Road Phoenix, AZ 85016 T 602.735.5508 F 602.735.5613 [email protected]
North Central P. Linas Norusis, MAI, MRICS Senior Managing Director 311 South Wacker Drive, 4th Floor Chicago, IL 60606 T 312.233.8662 F 312.233.8660 [email protected]
South Central Stephen D. DuPlantis, MAI Senior Managing Director 2700 Post Oak Blvd., Suite 250 Houston, TX 77056 T 713.840.6625 F 713.840.6649 [email protected]
Southeast Ronald A. Neyhart, MAI Senior Managing Director 3280 Peachtree Road Suite 1400 Atlanta, GA 30305 T 404.812.5020 F 404.812.5051 [email protected]
Northeast Michael R. Pecorino, MAI, FRICS, CRE Senior Managing Director One Penn Plaza, Suite 1835 New York, NY 10119 T 212.207.6102 F 212.207.6069 [email protected]
New England Webster A. Collins, MAI, CRE Executive Vice President/Partner 111 Huntington Avenue 12th Floor Boston, MA 02199 T 617.912.7025 F 617.912.6901 [email protected]

© 2010, CB Richard Ellis, Inc.
Page 20
Specia
l Rep
ort: 2
010 N
atio
na
l Inve
stor Su
rvey
Decem
ber 20
10
VAS CONTACTS BY OFFICE Albuquerque 6100 Uptown Blvd. Ste. 300 Albuquerque, NM 87110 John M. Poland, MAI T 505.837.4952 [email protected]
Atlanta 3280 Peachtree Road, Ste. 1400 Atlanta, GA 30305 Ronald A. Neyhart, MAI T 404.812.5020 [email protected]
Austin 100 Congress, Ste. 500 Austin, TX 78701 David O. Thibodeaux, MAI T 512.499.4928 [email protected]
Birmingham One Chase Corporate Center Suite 400 Birmingham, AL 35244 Barry Harvill T 205.313.6565 [email protected]
Boca Raton 5355 Town Center Rd., Ste. 701 Boca Raton, FL 33486 James E. Agner, MAI, SGA T 305.381.6480 [email protected]
Boston 111 Huntington Avenue 12th Floor Boston, MA 02199 Harris Collins, MAI T 617.912.6912 [email protected] Steven Kaye, MAI, CRE T 617.912.6950 [email protected]
Carlsbad 5780 Fleet Street, Suite 300 Carlsbad, CA 92008 Richard West, MAI T 760.438.8526 [email protected]
Charlotte 201 S. College Street, Ste. 1900 Charlotte, NC 28244 Murray Williams, MAI T 704.331.1282 [email protected]
Chicago 311 South Wacker Drive 4th Floor Chicago, IL 60606 Les J. Linder, MAI, CCIM T 312.233.8665 [email protected]
Cincinnati 201 East Fifth Street, Suite 1330 Cincinnati, OH 45202 Steven Hodge, MAI T 513.369.1368 [email protected]
Cleveland 200 Public Square, Ste. 2560 Cleveland, OH 43215 Steven Hodge, MAI T 513.369.1368 [email protected]
Colorado Springs 121 S. Tejon, Suite 201 Colorado Springs, CO 80903 Brent D. Hedrick T 719.325.0030 [email protected]
Columbus 280 N. High St., Ste. 1700 Columbus, OH 43215 Steven Hodge, MAI T 513.369.1368 [email protected]
Dallas 5430 LBJ Freeway, Suite 1100 Dallas, TX 75240 Julius M. Blatt, MAI T 972.458.4919 [email protected]
Denver 1225 17th Street, Suite 1570 Denver, CO 80202 Thomas D. Baroch, MAI T 303.628.7474 [email protected]
Des Moines 1055 Jordan Creek Pkwy. Suite 210 West Des Moines, IA 50266 Chris Jenkins, MAI, CCIM T 515.273.3390 [email protected]
Detroit 2000 Town Center, Suite 625 Southfield, MI 48075 Marshall A. Brulez, MAI T 248.351.2070 [email protected]
Fayetteville 438 E. Millsap, Suite 204 Fayetteville, AR 72703 Stephen Cosby, MAI T 479.442.7401 [email protected]
Fort Collins 116 North College Ave., Ste. 9 Fort Collins, CO 80524 Alexander K. Kovacs, MAI T 970.223.4343 [email protected]
Grand Rapids 99 Monroe Ave NW, Suite 202 Grand Rapids, MI 49503 William T. Loker T 616.808.3530 [email protected]
Greensboro 101 CentrePort Drive, Ste. 160 Greensboro, NC 27409 Jeffrey Skeahan, MAI T 336.714.0388 [email protected]
Hartford CityPlace I 185 Asylum Street, 27th Floor Hartford, CT 06103 Louis B. Pellegrino, MAI T 860.987.4769 [email protected]
Honolulu 1003 Bishop Street, Suite 1800 Honolulu, HI 96813 Donald R. Spradlin, MAI T 213.613.3654 [email protected]
Houston 2700 Post Oak Blvd., Suite 250 Houston, TX 77056 Bruce Bailey, MAI T 713.888.4701 [email protected]
Indianapolis 101 West Washington Street Suite 1000 East Indianapolis, IN 46204 Christopher E. Jarvis, MAI T 317.269.1110 [email protected]
Jacksonville 225 Water Street, Suite 110 Jacksonville, FL 32202 Thomas E. Zorn, MAI T 904.633.2618 [email protected]
Kansas City 4717 Grand Ave, Suite 500 Kansas City, MO 64112 Christopher Williams, MAI T 816.968.5818 [email protected]
Las Vegas 3993 Howard Hughes Pkwy. Suite 720 Las Vegas, NV 89169 Clay Carson T 702.933.6761 [email protected]
Little Rock 425 W Capitol, Suite 1535 Little Rock, AR 72201 Stephen Cosby, MAI T 479.442.7401 ext. 3 [email protected]
Long Island 88 Froehlich Farm Blvd. Suite 100 Woodbury, NY 11797 Kevin Broderick T 516.714.2733 [email protected] Helene B. Jacobson, MAI T 212.207.6106 [email protected]
Los Angeles 355 South Grand Ave 12th Floor Los Angeles, CA 90071 J. Berick Treidler T 213.613.3601 [email protected]
Madison 10 East Doty, Suite 410 Madison, WI 53703 Mark Letscher T 414.274.1640 [email protected]
Miami 777 Brickell Ave, Suite 910 Miami, FL 33131 James E. Agner, MAI, SGA T 305.381.6480 [email protected]
Milwaukee 777 E. Wisconsin Ave. Suite 3250 Milwaukee, WI 53202 Dave Wagner, MAI, ASA, MRICS T 414.274.1660 [email protected]
Minneapolis 81 South 9th Street, Suite 410 Minneapolis, MN 55402 Michael J. Moynagh, MAI T 612.336.4239 [email protected]
Nashville 150 4th Ave. North, Ste. 1620 Nashville, TN 37219 Scott A. Watts T 615.248.1132 [email protected]
New York City One Penn Plaza, Suite 1835 New York, NY 10022 Helene B. Jacobson, MAI T 212.207.6106 [email protected]
Newport Beach 3501 Jamboree Road, Suite 100 Newport Beach, CA 92660 Mark R. Prottas, MAI T 949.725.8411 [email protected]
Norfolk 150 West Main Street, Ste. 1100 Norfolk, VA 23510 Thomas O. McCoy, MAI T 757.228.1855 [email protected]
Omaha 14301 FNB Pkwy., Suite 100 Omaha, NE 68154 Michael J. Moynagh, MAI T 612.336.4239 [email protected]
Ontario 4141 Inland Empire Blvd. Ste 100 Ontario, CA 91764 Timothy G. Mings, MAI T 909.418.2250 [email protected]
Orlando 189 S. Orange Ave., Ste. 1900 Orlando, FL 32801 Brian L. Finnell, MAI, CCIM T 407.839.3117 [email protected]
Philadelphia 50 S. 16th Street, Suite 3000 Philadelphia, PA 19102 John J. Lynch, MAI T 215.561.8905 [email protected] John B. Rush, MAI T 215.561.8926 [email protected]
Phoenix 2415 East Camelback Road Phoenix, AZ 85016 Gavin J. McPhie T 602.735.5261 [email protected]
Portland 1300 SW 5th Avenue, Suite 200 Portland, OR 97201 Scott F. Biethan, MAI, CRE, FRICS T 206.292.6198 [email protected]
Raleigh 6501 Weston Pkwy., Ste. 190 Cary, NC 27513 Bryan M. Beel T 919.831.8194 [email protected]
Reno 5190 Neil Road, Suite 460 Reno, NV 89502 James A. Fogelberg T 775.823.6932 [email protected]
Richmond 7501 Boulders View Dr., Ste. 600 Richmond, VA 23225 Matthew B. Mitchell T 804.267.7251 [email protected] Jerrold Harvey, MAI T 703.734.4759 [email protected]
Sacramento 555 Capital Mall, Suite 100 Sacramento, CA 95814 Donna J. Whitaker, MAI T 916.446.8253 [email protected]
Saddle Brook Park 80 West, Plaza Two 250 Pehle Avenue, Suite 600 Saddle Brook, NJ 07663 Matthew Victor T 210.712.5680 [email protected]
St. Louis 8235 Forsyth Blvd. Suite 1000 Clayton, MO 63105 Doug A. Zink, MAI, CCIM T 314.655.5906 [email protected]
Salt Lake City 2755 E. Cottonwood Pkwy. Suite 100 Salt Lake City, UT 84121 Micheal E. Miller, MAI T 801.930.6107 [email protected]
San Antonio 601 NW Loop 410, Suite 350 San Antonio, TX 78216 David O. Thibodeaux, MAI T 512.499.4928 [email protected]
San Diego 4365 Executive Drive, Ste. 1600 San Diego, CA 92121 Mark T. Remick T 858.546.4675 [email protected]
San Francisco 350 Sansome Street, Suite 840 San Francisco, CA 94104 Elizabeth Champagne, MAI, MRICS T 415.986.7395 [email protected]
San Jose 255 W. Santa Clara St. Ste 1050 San Jose, CA 95113 Ken Cantrell T 408.453.7408 [email protected] Gene Williams, MAI, CCIM, MRICS T 408.453.7439 [email protected]
Seattle 1420 5th Ave., Suite 440 Seattle, WA 98101 Whitney B. Haucke, MAI, CPA T 206.292.6006 [email protected]
Tampa 101 E. Kennedy Blvd., Ste. 3140 Tampa, FL 33602 John Fabian, MAI T 813.261.4513 [email protected]
Tucson 3719 North Campbell Ave Tucson, AZ 85719 Gavin J. McPhie T 602.735.5261 [email protected]
Walnut Creek 2175 N. California Blvd. Suite 300 Walnut Creek, CA 94596 Robert D. Hensley, MAI T 925.296.7740 [email protected]
Washington D.C. 8270 Greensboro Drive Suite 1000 McLean, VA 22102 Jerrold Harvey, MAI T 703.734.4759 [email protected]
West Palm Beach 4400 PGA Boulevard, Suite 102 Palm Beach Gardens, FL 33410 James E. Agner, MAI, SGA T 305.381.6480 [email protected]