2010 national conference on health statistics
DESCRIPTION
2010 National Conference on Health Statistics. Exploring NHIS Data by Census Division. Deborah Rose Ph.D. National Center for Health Statistics Research Data Center. August 16, 2010 Omni Shoreham Hotel, Washington, DC. - PowerPoint PPT PresentationTRANSCRIPT

2010 National Conference on Health Statistics
Deborah Rose Ph.D. National Center for Health Statistics
Research Data Center
Exploring NHIS Data by Census Division
August 16, 2010Omni Shoreham Hotel, Washington,
DC
The previous presentations have covered some of the formal aspects of the NCHS RDC.
This presentation is more exploratory, to help you think about what YOU can do with restricted data at the RDC.

Restricted Data at the NCHS/RDC
Frequently requested types of data include:• Small geographic areas• Sensitive information• Mortality and linked mortality files• Exact dates • Small race/ethnicity groups• Genetic data
Restricted Geographic Data
Frequently used geographic areas include:• State• County• Census tract

Geographic Data in the National Health Interview
Survey (NHIS)The sampling frame for the NHIS allows public use
estimates to be made for:• The whole United States• The four Census Regions
State is a restricted variable, and:• State is not a level in the NHIS sample frame• Some states are not included in the sample• Some states are too small for stable estimates• Using state in analysis may violate confidentiality

A Methodological Research Question
What can we use when Region is too large, and State is too small?
Division may allow for finer detail than Region, without violating confidentiality.
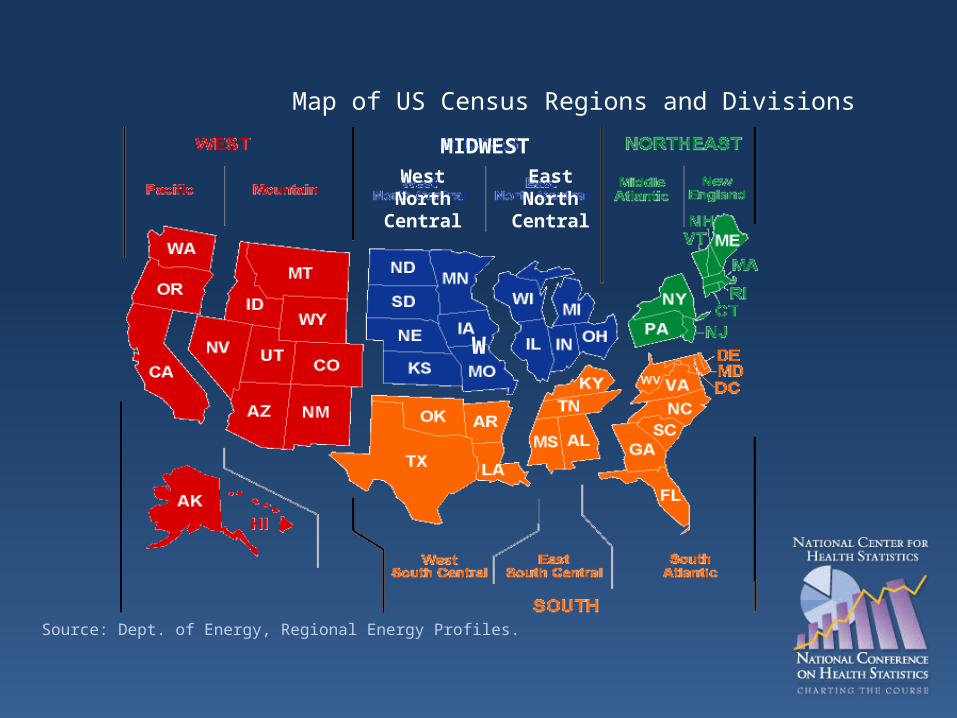
Source: Dept. of Energy, Regional Energy Profiles.
Map of US Census Regions and DivisionsMIDWEST
WestNorth Central
W
EastNorth Central

Source: US Census Bureau
US Census Region US Census Division States
Region 1: Northeast 1. New England CT, ME, MA, NH, RI, VT
2. Middle Atlantic NY, NJ, PA
Region 2: Midwest 3. East North Central IN, IL, MI, OH, WI
4. West North Central IA, KS, MN, MO, NE, ND, SDRegion 3: South 5. South Atlantic DE, MD, WV, DC, VA, NC, SC, GA, FL
6. East South Central MS , AL, TN, KY
7. West South Central TX, OK, AR, LA
Region 4: West 8. Mountain MT, ID, WY, NV, UT, CO, AZ,NM
9. Pacific CA, OR, WA, AK, HI
Census Divisions

Goal
To compare the use of Region with Division to review the prevalence of selected covariates and five chronic disease conditions.
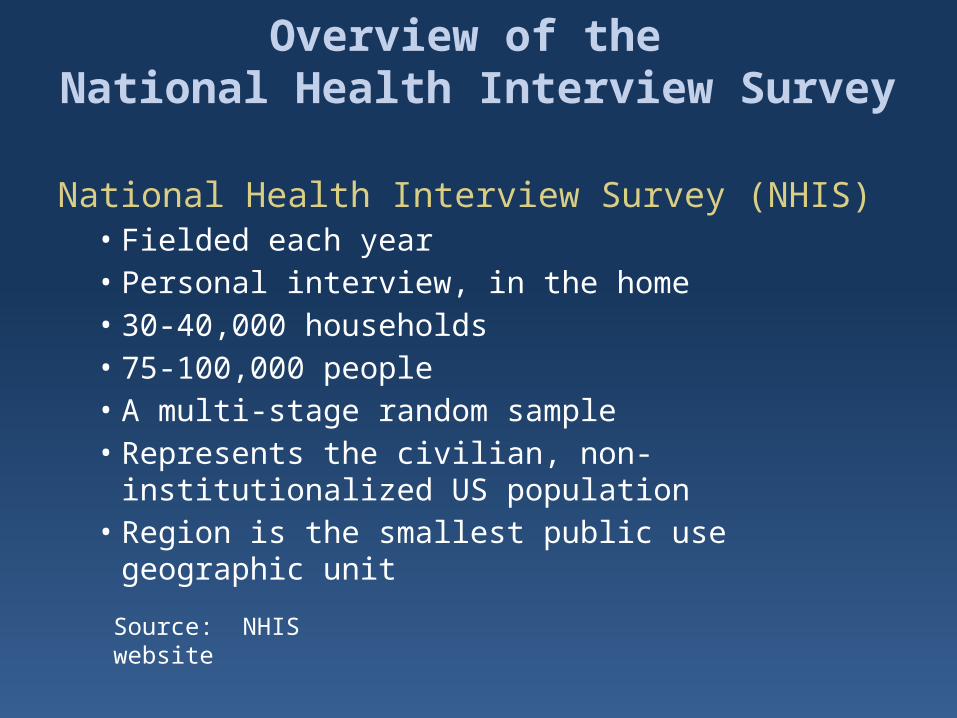
Overview of the National Health Interview Survey
National Health Interview Survey (NHIS)• Fielded each year• Personal interview, in the home• 30-40,000 households• 75-100,000 people• A multi-stage random sample• Represents the civilian, non-institutionalized US
population• Region is the smallest public use geographic unit
Source: NHIS website
Notes
• Estimates were calculated from the 2009 NHIS Sample Adult file, using the Sample Adult weight.
• Estimates by Division are not representative of the US population because Division is not part of the NHIS sampling frame.
• This work is exploratory. Relationships have not been tested for statistical significance.
Demographic and smoking variables
• Sex• Race/ethnicity• Cigarette smoking status• Current smoking
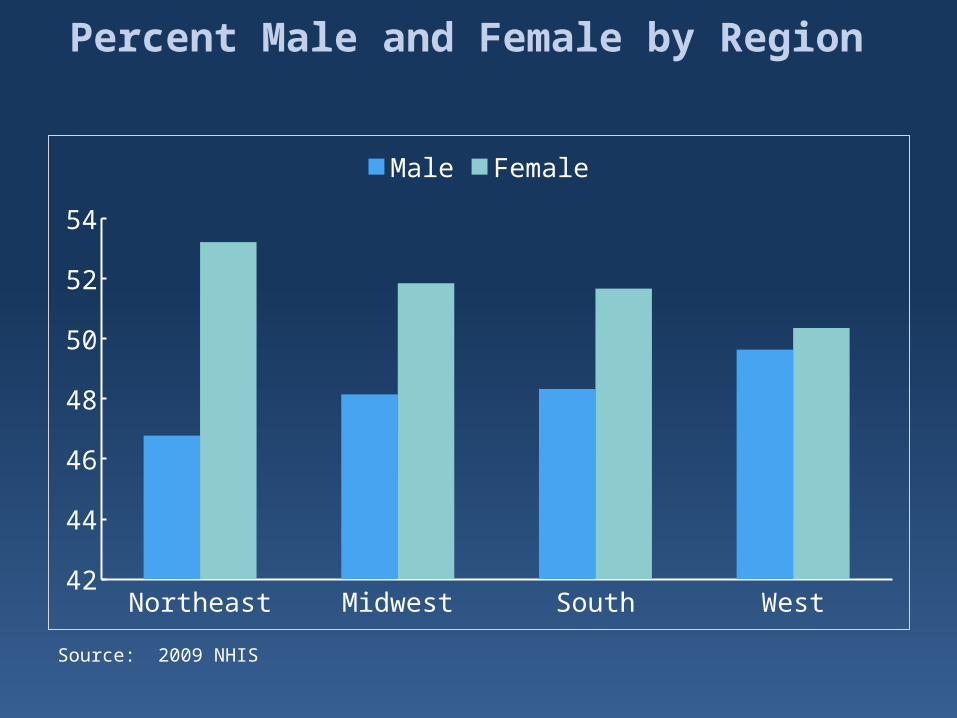
Percent Male and Female by Region
Source: 2009 NHIS
Northeast Midwest South West42
44
46
48
50
52
54Male Female
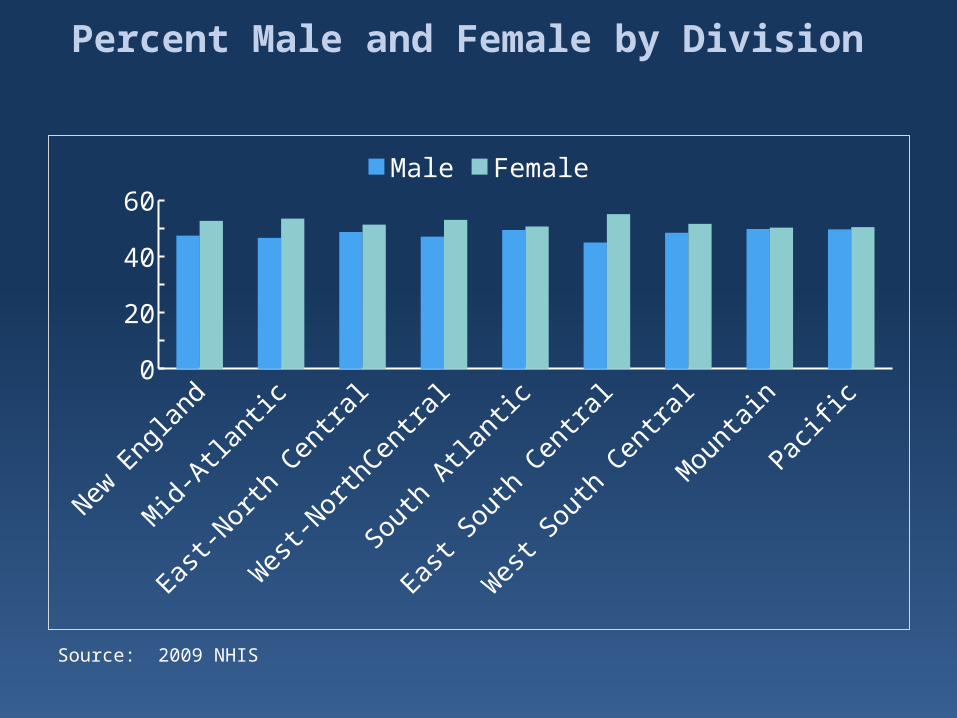
Percent Male and Female by Division
Source: 2009 NHIS
New En
gland
Mid-Atl
antic
East-
North C
entra
l
West-Nort
hCen
tral
South
Atlanti
c
East
South
Centra
l
West So
uth Cen
tral
Mounta
inPa
cific
0102030405060
Male Female

Smoking Statusby Region
Source: 2009 NHIS
Northeast Midwest South West010203040506070
Current Former Never
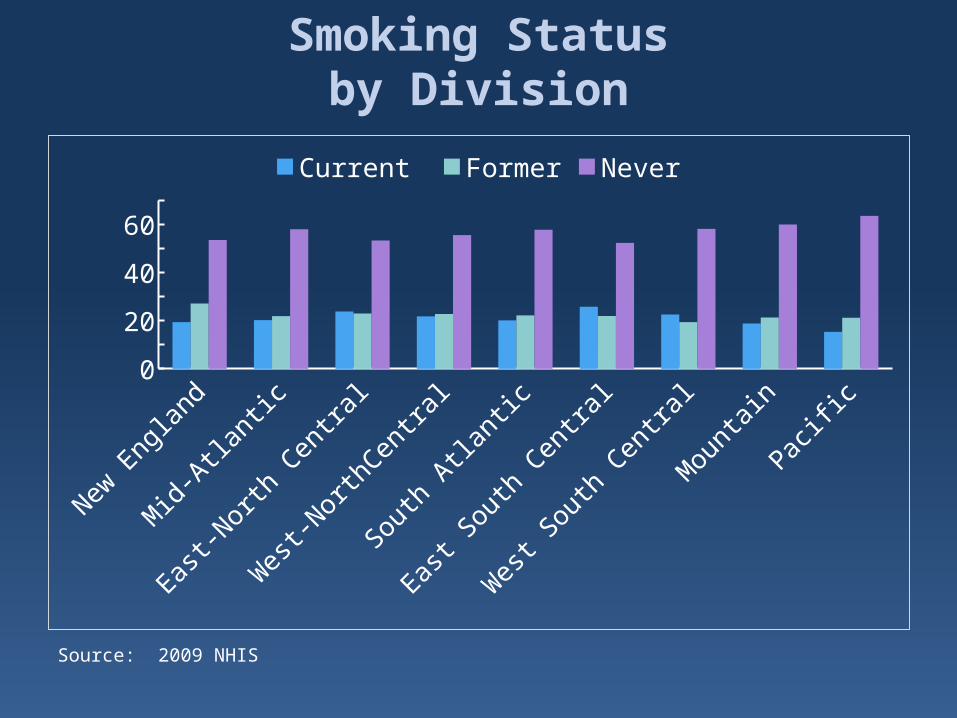
Smoking Statusby Division
Source: 2009 NHIS
New En
gland
Mid-Atl
antic
East-
North C
entra
l
West-Nort
hCen
tral
South
Atlanti
c
East
South
Centra
l
West So
uth Cen
tral
Mounta
inPa
cific
0
20
40
60
Current Former Never

Prevalence of Current Smokingby Region
Source: 2009 NHIS
Northeast Region
Midwest Region
South Region West Region0
5
10
15
20
25
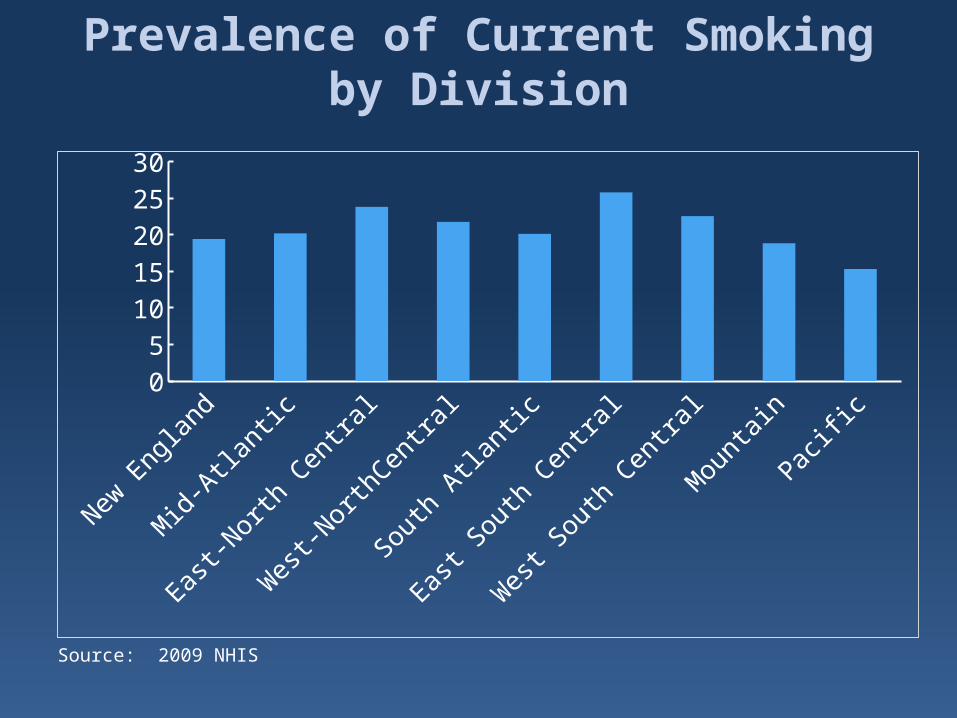
Prevalence of Current Smokingby Division
Source: 2009 NHIS
New En
gland
Mid-Atla
ntic
East-
North C
entra
l
West-Nort
hCen
tral
South
Atlanti
c
East
South
Centra
l
West So
uth Cen
tral
Mounta
inPa
cific
05
1015202530

Prevalence of Current Smokingby Region and Division
Source: 2009 NHIS
Northe
ast Reg
ion
Mid-Atl
antic
Midwest
Region
West-Nort
hCen
tral
South
Region
East
South
Centra
l
Mounta
in0
10
20
30Current Smoking
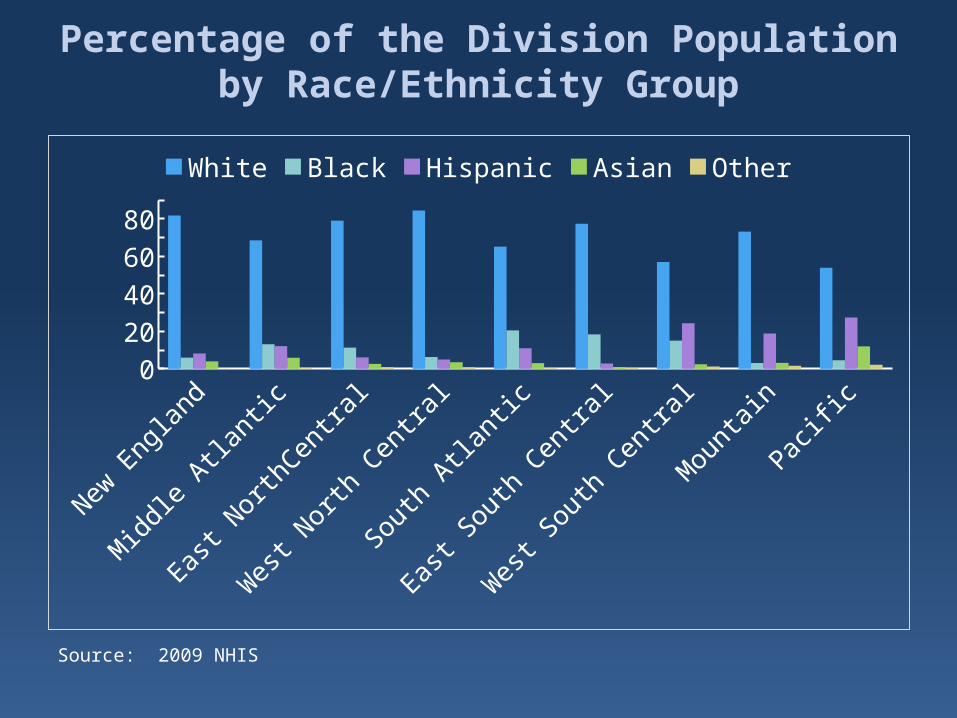
Percentage of the Division Populationby Race/Ethnicity Group
Source: 2009 NHIS
New En
gland
Middle
Atlanti
c
East
NorthC
entra
l
West Nort
h Cen
tral
South
Atlanti
c
East
South
Centra
l
West So
uth Cen
tral
Mounta
inPa
cific
020406080
White Black Hispanic Asian Other

The Percentage of a Race/Ethnicity Group in Each Division
Source: 2009 NHIS
New En
gland
Middle
Atlanti
c
East
NorthC
entra
l
West Nort
h Cen
tral
South
Atlanti
c
East
South
Centra
l
West So
uth Cen
tral
Mounta
inPa
cific
010203040
White Black Hispanic Asian Other

Selected conditions from the 2009 NHIS Core Questionnaire
Have you EVER been told by a doctor or other health professional that you had:
. . . Coronary heart disease . . . Hypertension . . . A stroke . . . Diabetes . . . Asthma
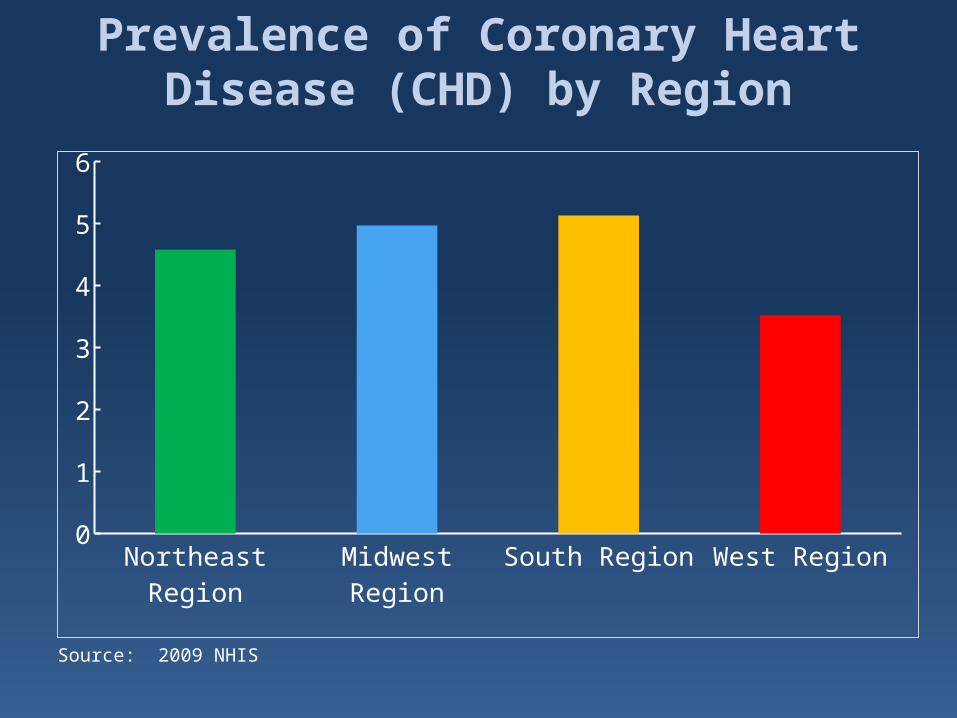
Prevalence of Coronary Heart Disease (CHD) by Region
Source: 2009 NHIS
Northeast Region
Midwest Region
South Region West Region0
1
2
3
4
5
6
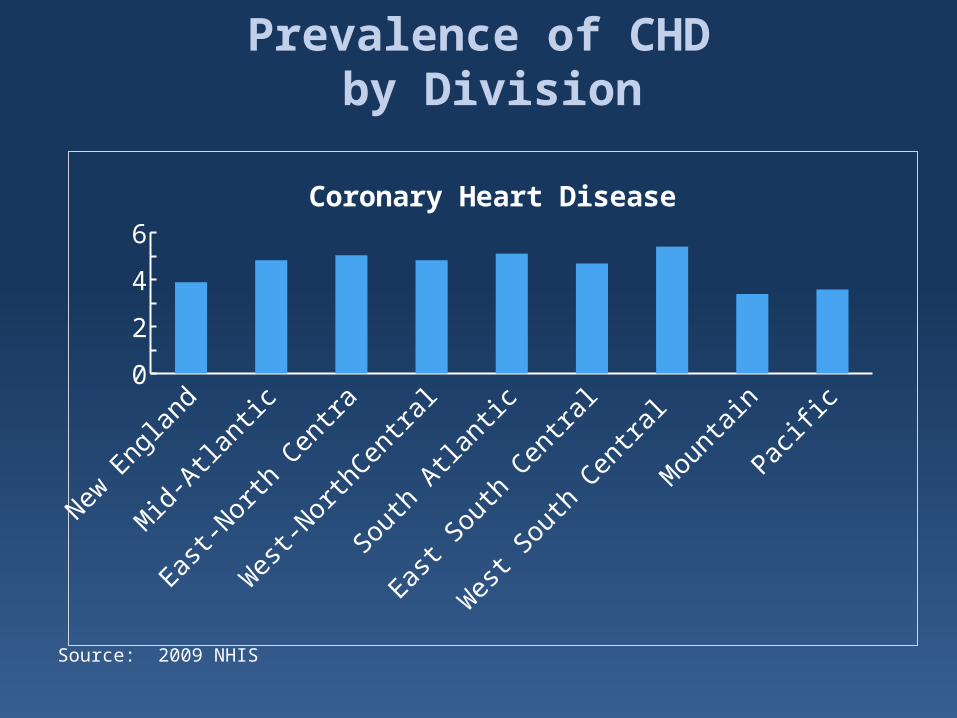
Prevalence of CHD by Division
Source: 2009 NHIS
New En
gland
Mid-Atl
antic
East-
North C
entra
West-Nort
hCen
tral
South
Atlanti
c
East
South
Centra
l
West So
uth Cen
tral
Mounta
inPa
cific
0
2
4
6Coronary Heart Disease

Prevalence of CHDby Region and Division
Source: 2009 NHIS
Northe
ast Reg
ion
Mid-Atl
antic
Midwest
Region
West-Nort
hCen
tral
South
Region
East
South
Centra
l
Mounta
in0
2
4
6Coronary Heart Disease
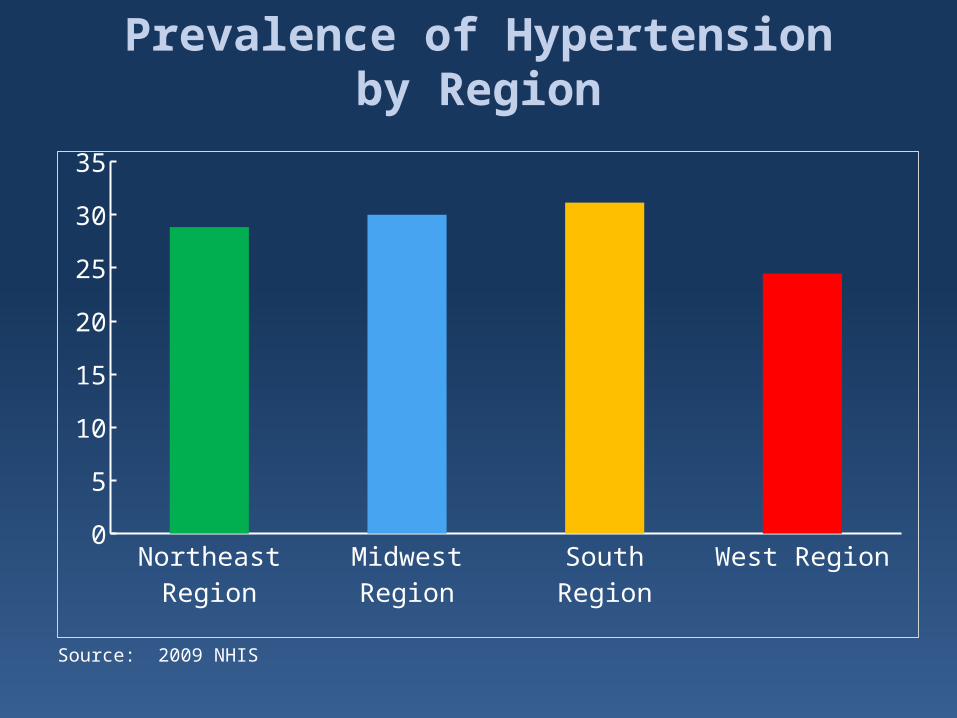
Prevalence of Hypertensionby Region
Source: 2009 NHIS
Northeast Region
Midwest Region
South Region West Region05
101520253035

Prevalence of Hypertension by Division
Source: 2009 NHIS
New En
gland
Mid-Atl
antic
East-
North C
entra
West-Nort
hCen
tral
South
Atlanti
c
East
South
Centra
l
West-So
uth Cen
tral
Mounta
inPa
cific
010203040
Hypertension

Prevalence of Hypertensionby Region and Division
Source: 2009 NHIS
Northe
ast Reg
ion
Mid-Atl
antic
Midwest
Region
West-Nort
hCen
tral
South
Region
East
South
Centra
l
Mounta
in0
10203040
Hypertension

Prevalence of Strokeby Region
Source: 2009 NHIS
Northeast Region
Midwest Region
South Region West Region00.5
11.5
22.5
33.5
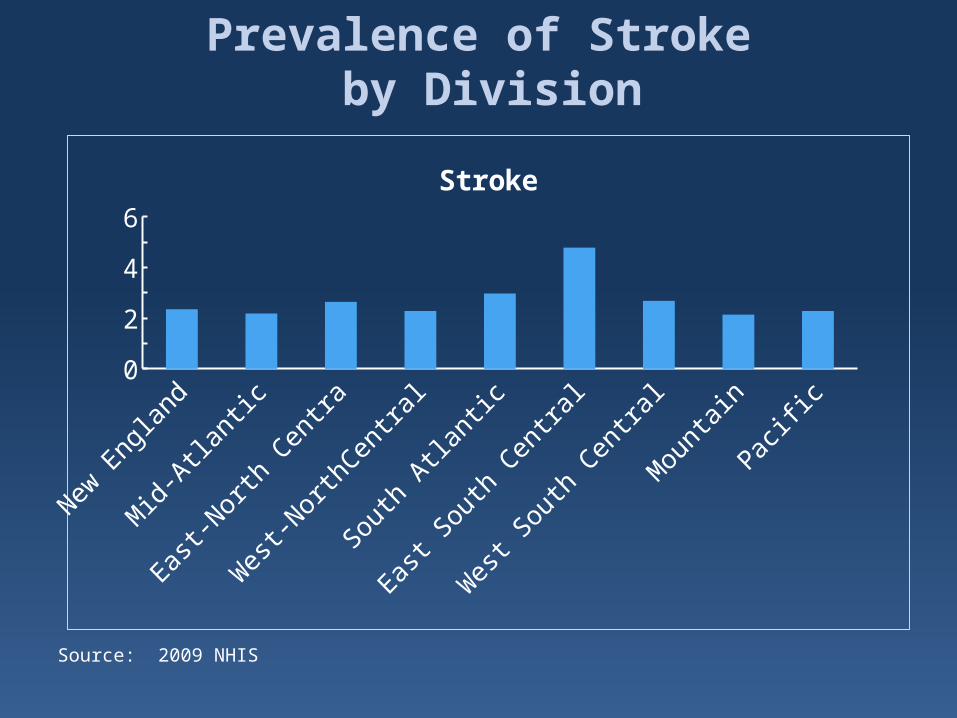
Prevalence of Stroke by Division
Source: 2009 NHIS
New En
gland
Mid-Atl
antic
East-
North C
entra
West-Nort
hCen
tral
South
Atlanti
c
East
South
Centra
l
West So
uth Cen
tral
Mounta
inPa
cific
0
2
4
6Stroke

Prevalence of Strokeby Region and Division
Source: 2009 NHIS
Northe
ast Reg
ion
Mid-Atl
antic
Midwest
Region
West-Nort
hCen
tral
South
Region
East
South
Centra
l
Mounta
in0
2
4
6 Stroke
An area in the southeast part of the United States with a high prevalence of stroke.
The East South Central Division is in the stroke belt.
Stroke Belt

Prevalence of Diabetesby Region
Source: 2009 NHIS
Northeast Region
Midwest Region
South Region West Region0
2
4
6
8
10
12
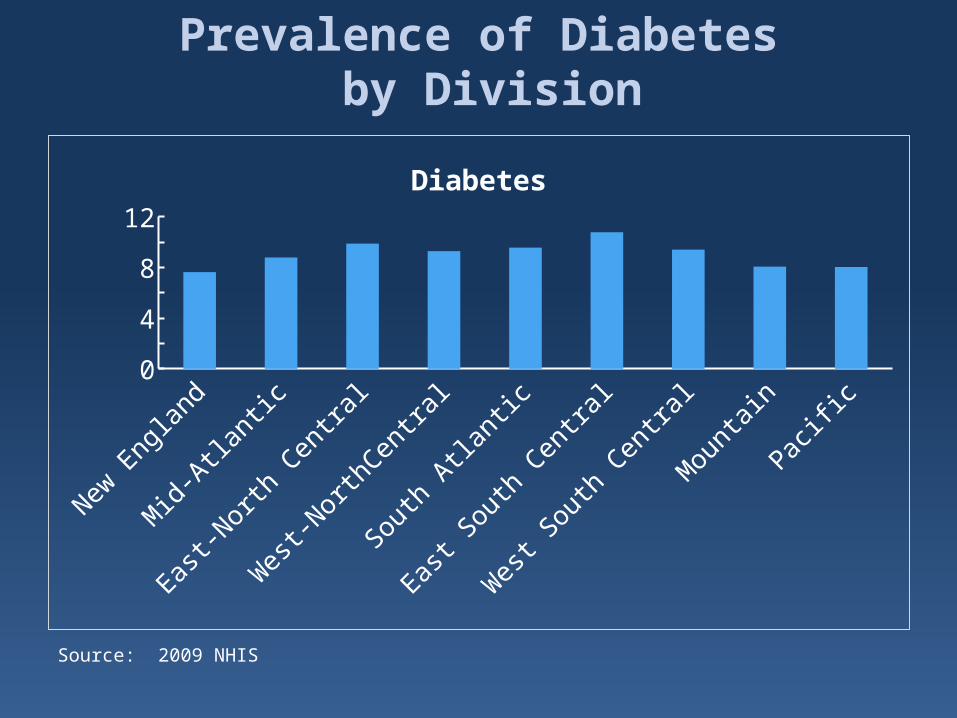
Prevalence of Diabetes by Division
Source: 2009 NHIS
New En
gland
Mid-Atl
antic
East-
North C
entra
l
West-Nort
hCen
tral
South
Atlanti
c
East
South
Centra
l
West So
uth Cen
tral
Mounta
inPa
cific
0
4
8
12Diabetes

Prevalence of Diabetesby Region and Division
Source: 2009 NHIS
Northe
ast Reg
ion
Mid-Atl
antic
Midwest
Region
West-Nort
hCen
tral
South
Region
East
South
Centra
l
Mounta
in0
4
8
12Diabetes
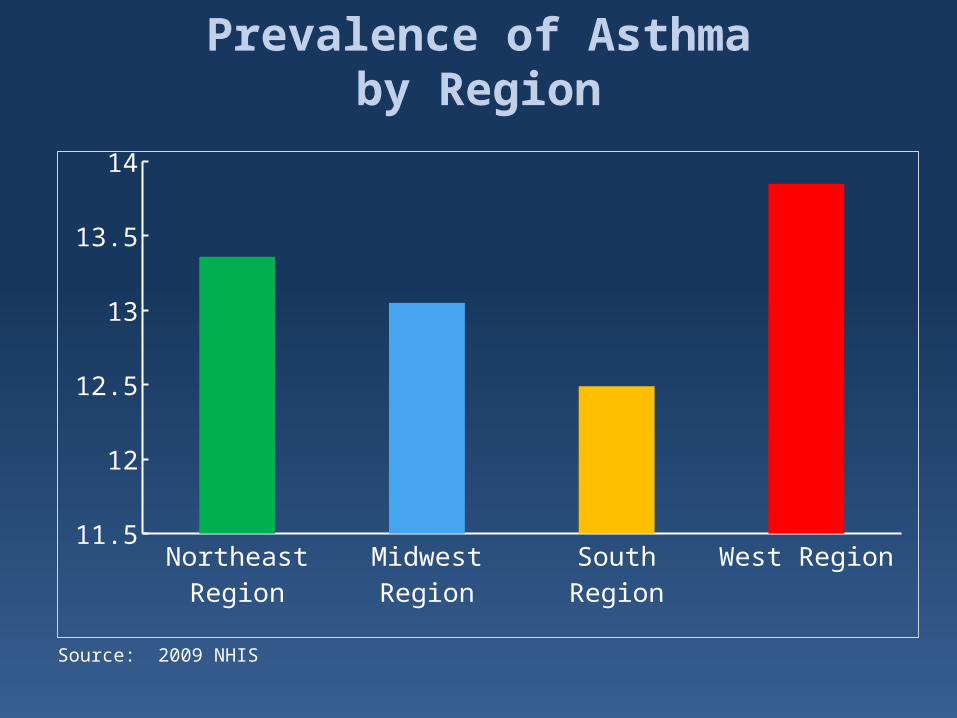
Prevalence of Asthmaby Region
Source: 2009 NHIS
Northeast Region
Midwest Region
South Region
West Region11.5
12
12.5
13
13.5
14
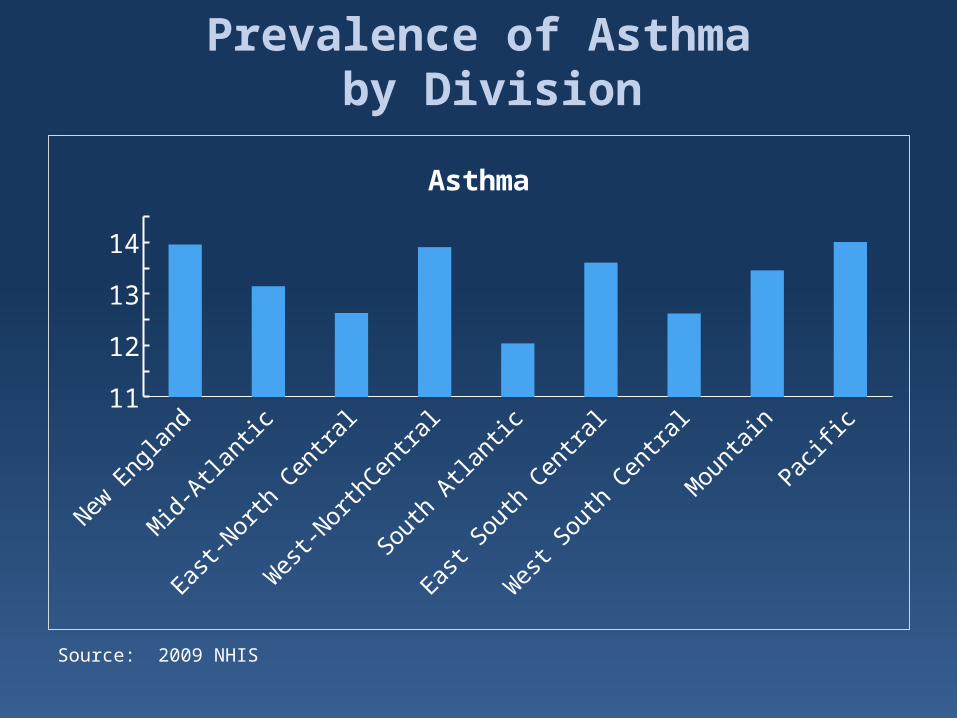
Prevalence of Asthma by Division
Source: 2009 NHIS
New England
Mid-Atlantic
East-N
orth Centra
l
West-North
Central
South Atla
ntic
East So
uth Central
West So
uth Central
Mountain
Pacific11
11.512
12.513
13.514
14.5Asthma

Prevalence of Asthmaby Region and Division
Source: 2009 NHIS
Northe
ast Reg
ion
Mid-Atl
antic
Midwest
Region
West-Nort
hCen
tral
South
Region
East
South
Centra
l
Mounta
in11
12
13
14
Asthma
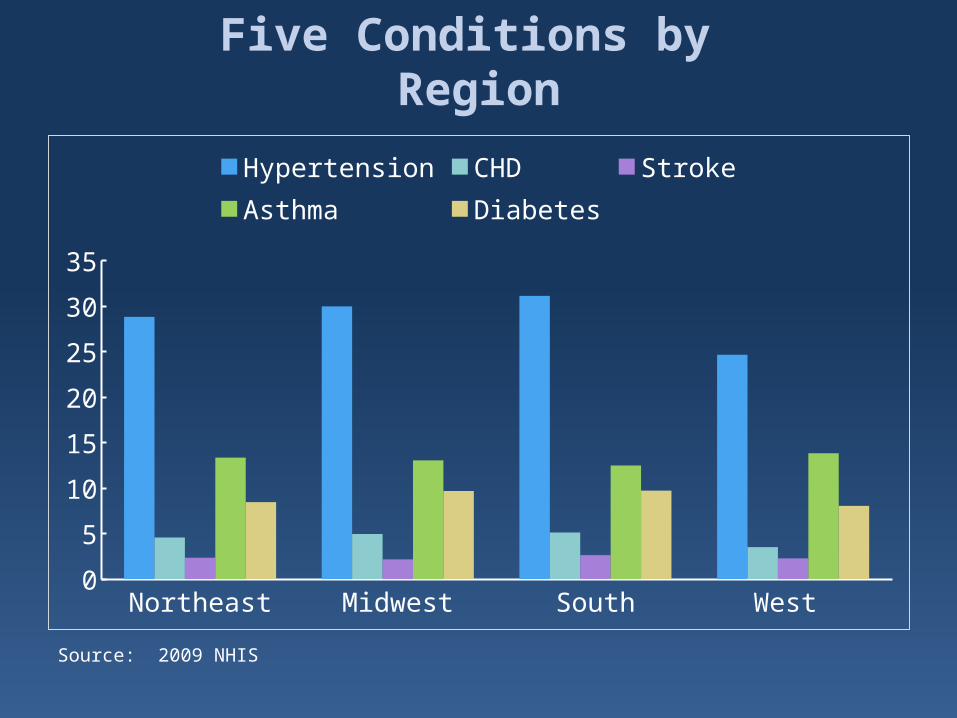
Five Conditions by Region
Source: 2009 NHIS
Northeast Midwest South West 05
101520253035
Hypertension CHD StrokeAsthma Diabetes

Five Conditions by Division
Source: 2009 NHIS
New En
gland
Middle
Atlanti
c
East
NorthC
entra
l
West Nort
h Cen
tral
South
Atlanti
c
East
South
Centra
l
West So
uth Cen
tral
Mounta
inPa
cific
010203040
Hypertension CHD StrokeAsthma Diabetes
Summary and Conclusions
Displaying chronic conditions and covariates by Division can reveal more detail than showing them by Region.

Reaching the RDC from the NCHS Homepage
Or, go directly to the NCHS/RDC home page:
http://www.cdc.gov/rdc


To learn more about the geocode data available at the NCHS / RDC:
• Click on “Step 1: Types of Data”• On the next page, pick “Restricted
Data”• Click on “Geocodes by NCHS
Survey”
We look forward to seeing you soon!