2010 lei executive summary final - vancouver fraser port · pdf...
TRANSCRIPT
PARTNERING)TO)PROVIDE)SUSTAINABLE)SOLUTIONS
Execu&ve(Summary:
PORT)METRO)VANCOUVER)2010
LANDSIDE)EMISSION)INVENTORY
March)26,)2012.
SLE)Project)504910)
Submi1ed(to:
Vancouver)Fraser)Port)Authority
100)The)Pointe,)999)Canada)Place
Vancouver,)BC))V6C)3T4

Port%Metro%Vancouver%
2010%Landside%Emissions%Inventory%
! ! !
504910!/!March!26,!2012! ES21!
!
!
EXECUTIVE%SUMMARY%
Port!Metro!Vancouver!was!the!first!port!in!Canada!to!complete!what!is!now!formally!defined!as!a!port!
emissions! inventory,! for! the! 2005! calendar! year.! Since! this! time! a! Ports! Emissions! Inventory! Protocol!
(Ports!Protocol)!has!been!developed!for!Transport!Canada,!based!in!large!part!on!the!Vancouver!work.!
SNC2Lavalin!Inc.,!Environment!Division!(SLE)!was!commissioned!by!Port!Metro!Vancouver!to!complete!a!
port!emissions!inventory!for!2010,!consistent!with!the!Ports!Protocol!as!well!as!best!practices!for!port!
emissions!assessment!in!North!America.!
On!January!1,!2008,!after!nearly!one!hundred!and!fifty!years!of!existing!separately,!the!Fraser!River!Port!
Authority,! North! Fraser! Port! Authority! and! Vancouver! Port! Authority! amalgamated! as! the! Vancouver!
Fraser!Port!Authority,!doing!business!as!Port!Metro!Vancouver!(PMV).!The!2010!port!inventory,!referred!
to! as! the! Landside! Emissions! Inventory! (LEI),! is! representative! of! the! activities! and! emissions! of! over!
100!PMV!tenants! situated!along! the!north!and!south!shores!of! the!Burrard! Inlet,! the!north!and!south!
arms! of! the! Fraser! River! and! Roberts! Bank! in! Delta.! PMV! (the! Port)! is! situated! in!Metro! Vancouver,!
British!Columbia,!just!north!of!the!US!state!of!Washington,!as!shown!in!Figure!ES21.!The!locations!of!the!
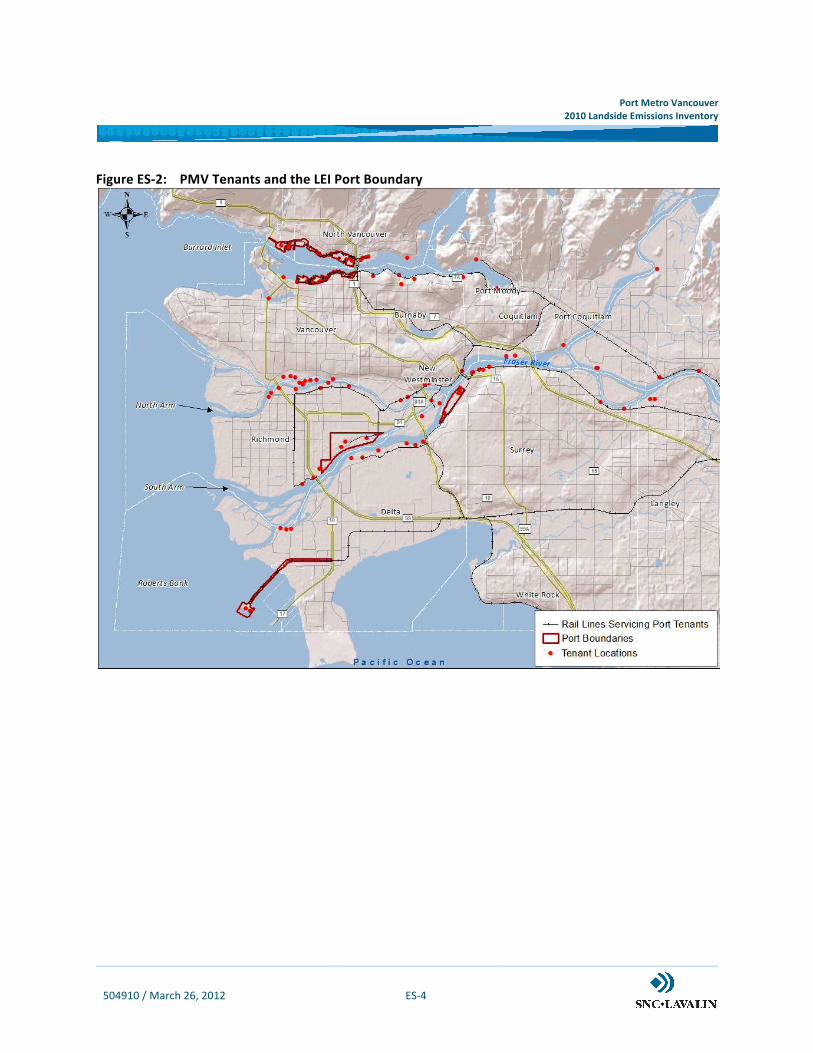
PMV!tenants!included!in!the!2010!LEI!are!shown!in!Figure!ES22.!
The! 2005! LEI! includes! the! activities! and! emissions! from! the! Burrard! Inlet! and! Roberts! Bank! tenants,!
which! make! up! less! than! half! of! the! tenants! of! the! 2010! LEI! by! number! (although! several! of! these!
facilities! are! very! large).! The! previous! inventory! includes! Cargo! Handling! Equipment! (CHE),! Rail!
locomotives! and! Trucking! as! the! major! landside! source! groups,! consistent! with! inventory! efforts!
conducted!by!several!of!the!major!US!ports.!This!study,!the!2010!LEI,! includes!the!2005!source!groups!
and!additional!groups!as!identified!in!Table!ES21.!The!Onroad!Vehicles!group!encompasses!trucks!as!well!
as!other!licensed!vehicles!that!support!Port!activities!(buses,!taxis).!The!Admin!group!includes!buildings!
as!well!as!compound!lighting.!The!expanded!set!of!sources!facilitates!a!wider!evaluation!of!energy!use!
and!emissions!at!the!Port!for!2010.!
Table%ESC1:% 2005%and%2010%LEI%Source%Groups%
Source%Group% 2005%LEI% 2010%LEI%
Cargo!Handling!Equipment! Yes! Yes!
Onroad!Vehicles!Trucks! Yes! Yes!
All!Licensed!vehicles! No! Yes!
Rail!Tenant!owned!! Yes! Yes!
Provincial!and!National! Yes! Yes!
Administration!! No! Yes!
!
! !

Port%Metro%Vancouver%
2010%Landside%Emissions%Inventory%
! ! !
504910!/!March!26,!2012! ES22!
!
!
The!2010!LEI! includes!estimates!of!Common!Air!Contaminants! (CACs),! including!nitrogen!oxides!(NOx),!
sulphur! oxides! (SOx),! carbon! monoxide! (CO),! volatile! organic! compounds! (VOCs),! total! suspended!
particulate!matter! (PM,! including! fractions!with!aerodynamic!diameter!10!microns!or! less! 2!PM10,! and!
diameter!2.5!microns!or!less!2!PM2.5),!and!ammonia!(NH3),!Greenhouse!Gases!(GHGs),!including!carbon!
dioxide!(CO2),!methane!(CH4)!and!nitrous!oxide!(N2O)!and!select!air!toxics.! In!addition!to!air!emissions!
estimates,!energy!consumption!(including!electricity)!was!captured.!
The!Ports!Protocol! requires!estimates!of!commercial!marine!vessel!emissions.!Marine!sources!at!PMV!
are! being! addressed! within! a! larger! marine! emissions! inventory! project! that! is! being! conducted! by!
Environment!Canada,!scheduled!for!completion!in!Spring!2012.!By!leveraging!the!marine!inventory,!PMV!
will!have!a!complete!activity!and!emissions!profile! for!all!of!the!significant!mobile!emission!sources!at!
the!Port.!
As! shown! in! Figure! ES22,! there! are! five! zones! of! relatively! high! Port2related! rail! and! trucking! activity.!
These!zones,!referred!to!as!intermodal!zones,!are!included!within!a!defined!Port!Boundary!that!is!used!
by!the!Port!to!define!its!emissions!footprint.!The!Ports!Protocol!includes!a!definition!of!a!Port!Boundary!
as!well!as!a!Terminal!/!Facility!Boundary!that!captures!activities!and!emissions!on!tenant!grounds!only.!
An!‘Airshed!Boundary’!is!also!used!for!the!2010!LEI!to!examine!the!impacts!of!Port!operations!within!the!
Lower!Fraser!Valley!(LFV)!of!British!Columbia!(as!outlined!in!Figure!ES21).!The!three!LEI!boundaries!and!
included!sources!are!described!as!follows:!
Terminal! /! Facility!Boundary:!All! CHE,!Onroad!Vehicle,! Rail! and!Admin!activities! that!occur!on!
tenant!grounds,!including!vehicle!queuing!that!may!occur!at!facility!gates;!
Port!Boundary:!All!CHE,!Onroad!Vehicle,!Rail!and!Admin!activities!within!the!Terminal!/!Facility!
Boundary!and!additional!Onroad!Vehicle!and!Rail!activities!in!the!associated!intermodal!zones;!
and!
Airshed!Boundary:!All!CHE,!Onroad!Vehicle,!Rail!and!Admin!activities!within!the!Port!Boundary!
and!additional!Onroad!Vehicle!and!Rail!activities!within!the!Canadian!portion!of!the!LFV.!
The!three!boundaries!are!hierarchical!such!that! the!Airshed!Boundary! includes!all!activities!within!the!
Port!Boundary,!which!includes!the!activities!within!the!Terminal!/!Facility!Boundary.!It!should!be!noted!
that!both!the!Port!Boundary!and!the!Airshed!Boundary!are!entirely!unique!for!the!Port!and!cannot!be!
used!to!compare!activities!and!emissions!to!those!at!other!Canadian!ports.!
!
! !

Port%Metro%Vancouver%
2010%Landside%Emissions%Inventory%
! ! !
504910!/!March!26,!2012! ES23!
!
!
Figure%ESC1:% Port%Metro%Vancouver%in%Southern%British%Columbia%
%
% %
Port%Metro%Vancouver%
2010%Landside%Emissions%Inventory%
! ! !
504910!/!March!26,!2012! ES24!
!
!
Figure%ESC2:% PMV%Tenants%and%the%LEI%Port%Boundary%
%! !

Port%Metro%Vancouver%
2010%Landside%Emissions%Inventory%
! ! !
504910!/!March!26,!2012! ES25!
!
!
There!are!a!number!of!other!unique! scope! items! for! the!2010! LEI,! some!of!which!were!developed! in!
reflection!of! the!project! stakeholders! that! include! the!Port! tenants,!Metro!Vancouver! (MV),!Transport!
Canada!(TC)!and!Environment!Canada!(EC).!In!addition!to!energy!and!emission!estimates!within!the!three!
defined!boundaries,!the!following!items!are!included!in!the!2010!LEI!scope:!
Forecasts!for!the!years!2015,!2020!and!2025!accounting!for!the!expected!Port!growth!as!well!as!
regulatory!fuel!and!engine!emissions!standards!in!effect!in!future!years;!
Evaluation!of!the!effect!of!Port!and!tenant!Emission!Reduction!Initiatives!(ERIs);!and,!
Spatially!allocated!emission!estimates!for!the!Canadian!portion!of!the!LFV.!
PMV%Emission%Estimates%
Tables!ES22!and!ES23!provide!the!2010!LEI!CAC!and!GHG!estimates!to!the!Terminal!/!Facility!Boundary!
and!the!Port!Boundary,!respectively.!
Table%ESC2:%PMV%2010%LEI:%Estimates%By%Source%Group%within%Terminal%/%Facility%Boundary%(tonnes)*%
Source%Group%
Common%Air%Contaminants%(CACs)% Greenhouse%Gases%(GHGs)%
NOx% SOx% CO% VOCs% PM10% PM2.5% NH3% CO2% CH4% N2O%
Admin! 9.0! 0.1! 4.9! 0.5! 0.5! 0.5! 0.3! 6,587! 0.1! 0.2!
CHE! 643.4! 0.8! 773.8! 83.4! 40.9! 39.7! 1.1! 65,624! 8.0! 22.9!
Onroad! 43.3! 0.2! 104.6! 14.0! 1.0! 0.6! 1.9! 13,483! 0.7! 0.4!
Rail! 72.4! 0.2! 11.3! 3.9! 2.2! 2.1! 0.5! 4,478! 0.2! 1.6!
TOTAL% 768.1% 1.3% 894.5% 101.8% 44.7% 43.0% 3.7% 90,171% 9.0% 25.2%
*!‘Onroad’!represents!the!Onroad!Vehicles!group.!
!
Table%ESC3:%PMV%2010%LEI:%Estimates%By%Source%Group%within%Port%Boundary%(tonnes)%
Source%Group%
Common%Air%Contaminants%(CACs)% Greenhouse%Gases%(GHGs)%
NOx% SOx% CO% VOCs% PM10% PM2.5% NH3% CO2% CH4% N2O%
Admin! 9.0! 0.1! 4.9! 0.5! 0.5! 0.5! 0.3! 6,587! 0.1! 0.2!
CHE! 643.4! 0.8! 773.8! 83.4! 40.9! 39.7! 1.1! 65,624! 8.0! 22.9!
Onroad! 89.9! 0.3! 112.1! 15.7! 1.7! 1.2! 2.0! 18,711! 0.8! 0.4!
Rail! 202.7! 0.8! 22.8! 8.3! 6.4! 5.9! 1.2! 10,944! 0.6! 4.3!
TOTAL% 945.0% 2.0% 913.5% 107.9% 49.5% 47.3% 4.5% 101,865% 9.5% 27.9%
!
Port%Metro%Vancouver%
2010%Landside%Emissions%Inventory%
! ! !
504910!/!March!26,!2012! ES26!
!
!
Port!emissions!are!dominated!by!CHE,!which!are!used!entirely!within!the!Terminal!/!Facility!Boundary.!
The!Rail!and!Onroad!Vehicle!groups!do!not!make!up!a! large!portion!of!the!total!Port!emissions!within!
this! boundary! but! become!more! significant! within! the! Port! Boundary! due! to! movements! within! the!
intermodal!zones.!Administration!(Admin)!emissions,!evaluated!for!the!first!time!in!the!2010!LEI,!were!
found!to!have!the!least!significance!for!all!air!contaminants!evaluated.!
Trends%in%Port%Emissions%and%Energy%Consumption%
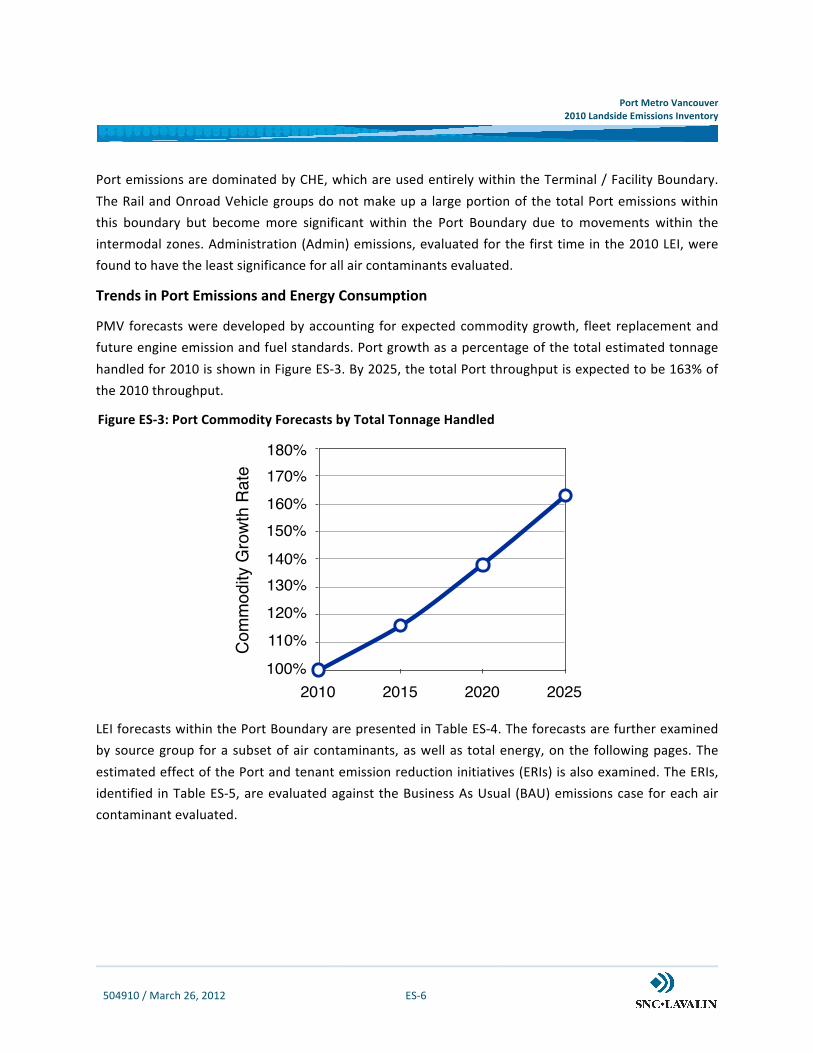
PMV!forecasts!were!developed!by!accounting! for!expected!commodity!growth,! fleet! replacement!and!
future!engine!emission!and!fuel!standards.!Port!growth!as!a!percentage!of!the!total!estimated!tonnage!
handled!for!2010!is!shown!in!Figure!ES23.!By!2025,!the!total!Port!throughput!is!expected!to!be!163%!of!
the!2010!throughput.!
Figure%ESC3:%Port%Commodity%Forecasts%by%Total%Tonnage%Handled%
!
LEI!forecasts!within!the!Port!Boundary!are!presented!in!Table!ES24.!The!forecasts!are!further!examined!
by!source!group!for!a!subset!of!air!contaminants,!as!well!as! total!energy,!on!the! following!pages.!The!
estimated!effect!of!the!Port!and!tenant!emission!reduction!initiatives!(ERIs)!is!also!examined.!The!ERIs,!
identified! in!Table!ES25,!are!evaluated!against!the!Business!As!Usual! (BAU)!emissions!case!for!each!air!
contaminant!evaluated.!
% %
Co
mm
od
ity G
row
th R
ate
2010 2015 2020 2025
100%
120%
130%
140%
110%
150%
170%
180%
160%
Figure ES–3

Port%Metro%Vancouver%
2010%Landside%Emissions%Inventory%
! ! !
504910!/!March!26,!2012! ES27!
!
!
Table%ESC4:%2010%LEI%Forecasts%to%the%Port%Boundary%(tonnes)%
Inventory%
Year%
Common%Air%Contaminants%(CACs)% Greenhouse%Gases%(GHGs)% Energy%
(TJ)%NOx% SOx% CO% VOCs% PM10% PM2.5% NH3% CO2% CH4% N2O%
2010! 945.0! 2.0! 913.5! 107.9! 49.5! 47.3! 4.5! 101,865! 9.5! 27.9! 2,050!
2015! 678.5! 1.2! 649.8! 70.9! 34.7! 32.9! 5.2! 113,330! 8.5! 31.5! 2,280!
2020! 616.6! 1.5! 356.1! 67.9! 29.2! 27.3! 6.8! 146,511! 10.3! 41.3! 2,820!
2025! 569.0! 1.8! 355.3! 71.0! 23.5! 21.6! 8.5! 182,872! 12.3! 52.0! 3,410!
!
Table%ESC5:%Identification%of%Port%and%Tenant%Emission%Reduction%Initiatives%(ERIs)%at%PMV%
%Reduction%Initiative% Effect%on%LEI%Estimates%
Inventory%
Years%Affected%
Completed%
Initiatives%
Genset!or!hybrid!switch!locomotives! Lower!fuel!use!and!all!emissions!! 2010!–!2025!
Diesel!particulate!filter! Lower!CAC!emissions! 2010!2!2025!
Use!of!variable2speed!cranes!for!container!handling! Lower!fuel!use!and!all!emissions! 2010!–!2025!
Use!of!hybrid!cranes!for!container!handling! Lower!fuel!use!and!all!emissions! 2010!–!2025!
PMV!Truck!Licensing!System!(TLS)! Lower!CAC!emissions! 2010!2!2025!
Planned%Initiatives%
Electrification!of!truck!reefer!units!on!facility!grounds! Lower!fuel!use!and!all!emissions! 2015!–!2025!
Use!of!hybrid!tractors! Lower!fuel!use!and!all!emissions! 2015!–!2025!
Use!of!genset!switch!locomotives! Lower!fuel!use!and!all!emissions! 2015!–!2025!
Use!of!electric!vehicles! Lower!fuel!use!and!all!emissions! 2015!–!2025!
Use!of!electric!forklifts! Lower!fuel!use!and!all!emissions! 2015!–!2025!
Replacement!of!large!diesel!generator!by!connecting!to!grid! Lower!fuel!use!and!all!emissions! 2015!–!2025!
%
" "
Port%Metro%Vancouver%
2010%Landside%Emissions%Inventory%
! ! !
504910!/!March!26,!2012! ES28!
!
!
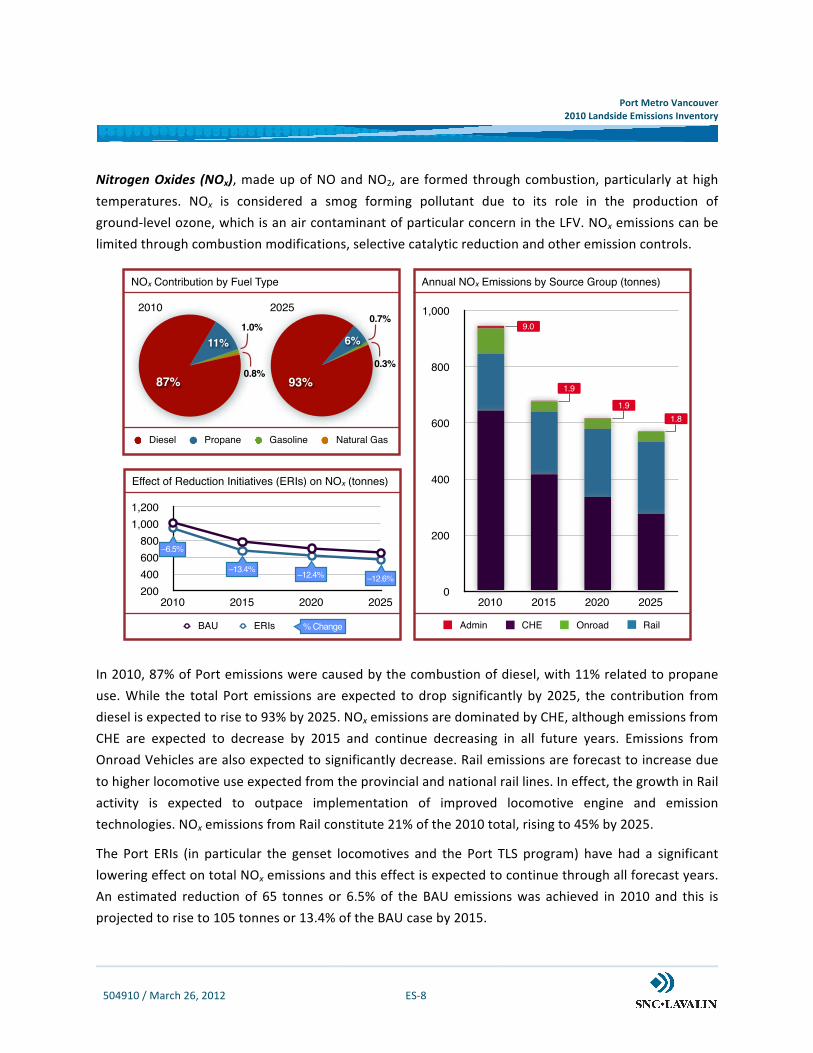
Nitrogen"Oxides" (NOx),"made!up!of!NO!and!NO2,!are! formed!through!combustion,!particularly!at!high!
temperatures.! NOx! is! considered! a! smog! forming! pollutant! due! to! its! role! in! the! production! of!
ground2level!ozone,!which!is!an!air!contaminant!of!particular!concern!in!the!LFV.!NOx!emissions!can!be!
limited!through!combustion!modifications,!selective!catalytic!reduction!and!other!emission!controls.!!
!!
In!2010,!87%!of!Port!emissions!were!caused!by!the!combustion!of!diesel,!with!11%!related!to!propane!
use.!While! the! total! Port! emissions! are! expected! to!drop! significantly! by! 2025,! the! contribution! from!
diesel!is!expected!to!rise!to!93%!by!2025.!NOx!emissions!are!dominated!by!CHE,!although!emissions!from!
CHE! are! expected! to! decrease! by! 2015! and! continue! decreasing! in! all! future! years.! Emissions! from!
Onroad!Vehicles!are!also!expected!to!significantly!decrease.!Rail!emissions!are!forecast!to!increase!due!
to!higher!locomotive!use!expected!from!the!provincial!and!national!rail!lines.!In!effect,!the!growth!in!Rail!
activity! is! expected! to! outpace! implementation! of! improved! locomotive! engine! and! emission!
technologies.!NOx!emissions!from!Rail!constitute!21%!of!the!2010!total,!rising!to!45%!by!2025.!
The! Port! ERIs! (in! particular! the! genset! locomotives! and! the! Port! TLS! program)! have! had! a! significant!
lowering!effect!on!total!NOx!emissions!and!this!effect!is!expected!to!continue!through!all!forecast!years.!
An! estimated! reduction! of! 65! tonnes! or! 6.5%!of! the! BAU!emissions!was! achieved! in! 2010! and! this! is!
projected!to!rise!to!105!tonnes!or!13.4%!of!the!BAU!case!by!2015.!
Figure ES–NO
Annual NOx Emissions by Source Group (tonnes)
0
200
400
600
800
1,000
2010 2015 2020 2025
Effect of Reduction Initiatives (ERIs) on NOx (tonnes)
200
400
600
800
1,000
1,200
2010 2015 2020 2025
NOx Contribution by Fuel Type
2010
11%
87%0.8%
1.0%
2025
6%
93%
Diesel Propane Gasoline Natural Gas
0.3%
0.7%
BAU ERIs % Change
–13.4%
9.0
1.9
1.9
1.8
–6.5%
–12.4% –12.6%
Admin CHE Onroad Rail

Port%Metro%Vancouver%
2010%Landside%Emissions%Inventory%
! ! !
504910!/!March!26,!2012! ES29!
!
!
Sulphur" Oxides" (SOx)! are! formed! in! the! atmosphere! from! the! combustion! of! sulphur! bearing! fuels.!
Canadian!Sulphur!in!Fuel!Standards!have!dramatically!reduced!SOx!emissions!from!all!land!based!mobile!
equipment! in! the! country! such! that!mobile! sources! are! no! longer! considered! a!major! source! of! SOx!
emissions!in!many!urban!communities.!
!%
SOx!emissions!from!the!Port!have!decreased!from!an!estimate!of!27!tonnes!in!2005!(not!shown!here)!to!
approximately!2! tonnes! in!2010.!The!2005!estimate!did!not! include!the!Fraser!River! tenants,!meaning!
that! the! effective! decline! in! Port! emissions! from! 2005! is! likely! over! 95%.! SOx! emissions! are! largely!
attributed!to!diesel!use!in!2010!with!the!Rail!and!CHE!source!groups!dominating!the!Port!totals.!!
The!last!of!the!planned!fuel!regulations!to!affect!the!Port!sources!will!be!effective!by!2012!for!Rail.!By!
this! year,! all! diesel! consumed! at! the! Port! by! land2based! equipment! will! have! a! sulphur! content! of!
15!parts!per!million!(ppm)!or!less.!Rail!SOx!emissions!are!expected!to!drop!from!0.82!tonnes!in!2010!to!
0.12!tonnes!in!2015.!!
The!Port!ERIs!have!resulted!in!a!2010!reduction!in!SOx!emissions!of!approximately!0.01!tonnes!or!0.7%!
of!the!BAU!emissions.!This!reduction!is!expected!to!climb!to!0.03!tonnes!or!2.1%!of!BAU!emissions!by!
2015.!These! reductions!are!primarily!driven!by! the!genset! locomotives!but!are!also! influenced!by! the!
electric!forklifts!and!hybrid!cranes.!
Figure ES–SO
Annual SOx Emissions by Source Group (tonnes)
0
0.5
1.0
1.5
2.0
2010 2015 2020 2025
Effect of Reduction Initiatives (ERIs) on SOx (tonnes)
1.0
1.2
1.4
1.6
1.8
2.0
2010 2015 2020 2025
BAU ERIs
SOx Contribution by Fuel Type
Diesel Propane Gasoline Natural Gas
2010
22%
72%
2025
34%
59%
2.3% 4.0%
–2.1%
–2.0%
–2.0%
% Change
–0.7%
Admin CHE Onroad Rail
3.4%3.4%

Port%Metro%Vancouver%
2010%Landside%Emissions%Inventory%
! ! !
504910!/!March!26,!2012! ES210!
!
!
Volatile" Organic" Compounds" (VOCs)! are! made! up! of! an! extensive! list! of! organic! hydrocarbons!
considered!harmful!to!human!health!or!the!environment.!VOC!emissions!are!caused!by!biogenic!sources!
and! solvent! evaporation! as! well! as! the! incomplete! combustion! of! fossil! fuels.! VOCs! as! a! group! are!
considered!a!smog!forming!pollutant!due!to!their!role!in!the!production!of!ground2level!ozone.!Engine!
emissions!of!VOCs!can!be!limited!through!improved!combustion!conditions!as!well!as!emission!controls!
such!as!catalytic!converters.!
!!
VOC! emissions! have! been! steadily! declining! from! the! mobile! sector! since! the! 1980s! when! emission!
controls! for! light! duty! Onroad! Vehicles! gained! widespread! use.! VOC! emissions! from! the! Port! are!
expected! to! decrease! by! 2015! with! the! introduction! of! newer! CHE! with! lower! emission! rates.! VOC!
emissions! from! the! Port! are! forecast! to! begin! increasing! from! 2020! with! the! higher! throughputs!
expected.!
The! Port! ERIs! have! had! a! significant! lowering! effect! on! VOC! emissions! and! this! effect! is! expected! to!
continue!in!future!years.!Genset!locomotives!were!found!to!be!the!primary!contributor!to!a!decrease!of!
4.2!tonnes!(or!3.7%!of!BAU!emissions)!in!2010.!This!reduction!is!expected!to!grow!to!7.3!tonnes!or!9.3%!
of!BAU!emissions!by!2015.!
" "
Figure ES–VOC
Annual Emissions of VOCs by Source Group (tonnes)
0
25
50
75
100
125
2010 2015 2020 2025
Contribution of VOCs by Fuel Type
Diesel Propane Gasoline Natural Gas
2010
7%32%
61%
2025
5%
24%
71%
Effect of Reduction Initiatives (ERIs) on VOCs (tonnes)
40
60
80
100
120
2010 2015 2020 2025
BAU ERIs
0.10% 0.01%
–9.3% –9.0%–8.5%
% Change
0.04 0.040.04
0.48
–3.7%
Admin CHE Onroad Rail

Port%Metro%Vancouver%
2010%Landside%Emissions%Inventory%
! ! !
504910!/!March!26,!2012! ES211!
!
!
Carbon" Monoxide" (CO)! emissions! are! released! by! the! incomplete! combustion! of! fossil! fuels.! CO!
emissions! from!the!mobile! sector!have!greatly!declined!since! the!1980s!when!emission!controls!were!
widely! adopted! to! light! duty! vehicles.! CO! is! considered! a! significant! hazard! to! human! health! at! high!
enough!concentrations.!Engine!emissions!of!CO!can!be!limited!through!improved!combustion!conditions!
and!emission!controls!such!as!catalytic!converters.!
!
CO!emission!rates!are!relatively!low!from!diesel!engines!and!the!majority!of!the!2010!estimates!relate!to!
propane!use,!even!though!total!propane!consumption!is!much!less!than!diesel.!Emissions!due!to!diesel!
and!gasoline!use!were!also!significant!in!2010.!CO!emissions!from!the!Port!have!significantly!decreased!
since!2005!and!are!projected!to!further!decrease!to!less!than!half!of!the!2010!total!by!2020.!!
Approximately!12! tonnes!or!1.3%!of!BAU!emissions!of!CO!were!avoided! in!2010!due! to! the!Port!ERIs!
(notably!the!genset!locomotives!and!Port!TLS!program).!This!total!is!expected!to!grow!to!31!tonnes!(or!
4.6%!of!BAU!emissions)!by!2015!with!the!additional!Port!ERIs!that!are!planned.!
" "
Figure ES–CO
Annual CO Emissions by Source Group (tonnes)
0
200
400
600
800
1,000
2010 2015 2020 2025
Effect of Reduction Initiatives (ERIs) on CO (tonnes)
0
200
400
600
800
1,000
2010 2015 2020 2025
BAU ERIs
CO Contribution by Fuel Type
Diesel Propane Gasoline Natural Gas
2010
12%
54%30%
2025
17%
43%
38%
1.6%3.8%
% Change
4.9
3.1
3.13.1
–1.3%
–4.6%
–6.5% –6.1%
Admin CHE Onroad Rail
Port%Metro%Vancouver%
2010%Landside%Emissions%Inventory%
! ! !
504910!/!March!26,!2012! ES212!
!
!
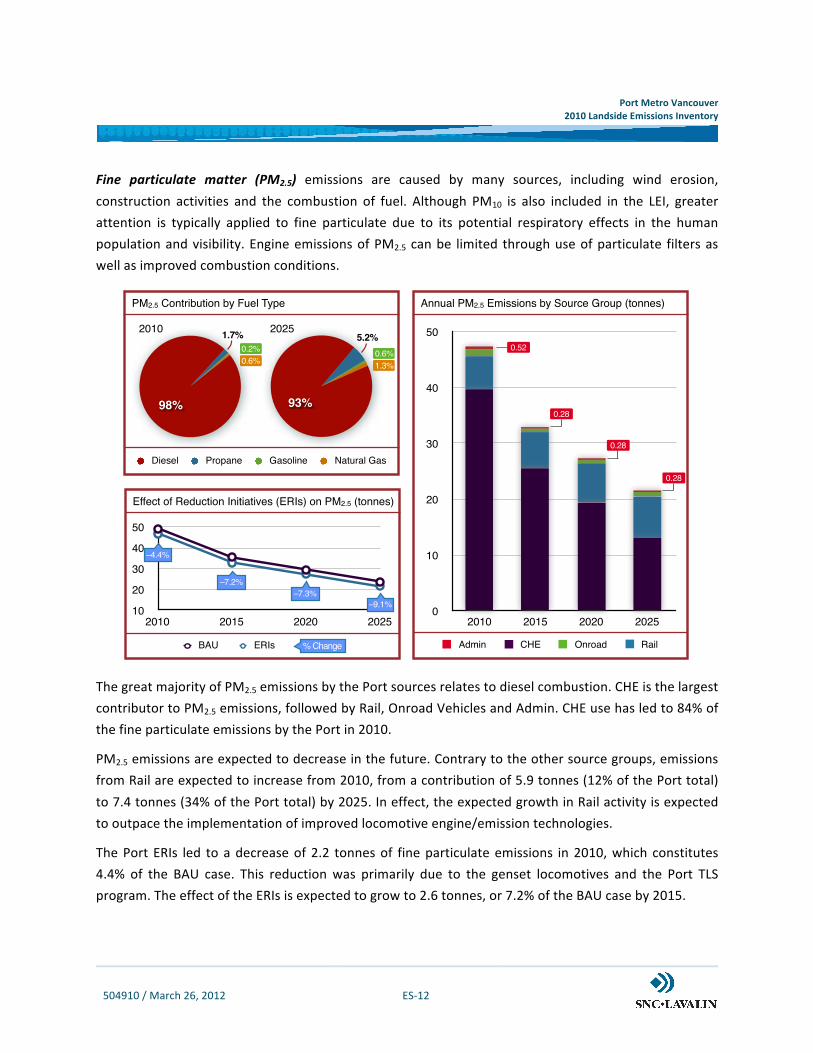
Fine" particulate" matter" (PM2.5)! emissions! are! caused! by! many! sources,! including! wind! erosion,!
construction! activities! and! the! combustion! of! fuel.! Although! PM10! is! also! included! in! the! LEI,! greater!
attention! is! typically! applied! to! fine! particulate! due! to! its! potential! respiratory! effects! in! the! human!
population!and!visibility.!Engine!emissions!of!PM2.5! can!be! limited! through!use!of!particulate! filters!as!
well!as!improved!combustion!conditions.!
!
The!great!majority!of!PM2.5!emissions!by!the!Port!sources!relates!to!diesel!combustion.!CHE!is!the!largest!
contributor!to!PM2.5!emissions,!followed!by!Rail,!Onroad!Vehicles!and!Admin.!CHE!use!has!led!to!84%!of!
the!fine!particulate!emissions!by!the!Port!in!2010.!
PM2.5!emissions!are!expected!to!decrease!in!the!future.!Contrary!to!the!other!source!groups,!emissions!
from!Rail!are!expected!to!increase!from!2010,!from!a!contribution!of!5.9!tonnes!(12%!of!the!Port!total)!
to!7.4!tonnes!(34%!of!the!Port!total)!by!2025.!In!effect,!the!expected!growth!in!Rail!activity!is!expected!
to!outpace!the!implementation!of!improved!locomotive!engine/emission!technologies.!
The!Port!ERIs! led! to!a!decrease!of!2.2! tonnes!of! fine!particulate!emissions! in!2010,!which! constitutes!
4.4%! of! the! BAU! case.! This! reduction!was! primarily! due! to! the! genset! locomotives! and! the! Port! TLS!
program.!The!effect!of!the!ERIs!is!expected!to!grow!to!2.6!tonnes,!or!7.2%!of!the!BAU!case!by!2015.!
Figure ES–PM2.5
Annual PM2.5 Emissions by Source Group (tonnes)
0
10
20
30
40
50
2010 2015 2020 2025
Effect of Reduction Initiatives (ERIs) on PM2.5 (tonnes)
10
20
30
40
50
2010 2015 2020 2025
BAU ERIs
PM2.5 Contribution by Fuel Type
Diesel Propane Gasoline Natural Gas
2010
98%
1.7%2025
93%
0.2%
0.6%
5.2%
0.6%
1.3%
–7.2%
% Change
0.52
0.28
0.28
0.28
–4.4%
–7.3%
–9.1%
Admin CHE Onroad Rail

Port%Metro%Vancouver%
2010%Landside%Emissions%Inventory%
! ! !
504910!/!March!26,!2012! ES213!
!
!
GHG" emissions,! as! represented! by! equivalent! carbon! dioxide! (CO2e)," are! primarily! caused! by! the!
combustion!of!carbon!bearing!fuels.!Engine!emissions!of!GHGs!can!be!limited!through!improved!engine!
efficiencies,! improved! terminal! layout,! operational! efficiencies,! as! well! as! operator! driving! habits!
(Onroad!Vehicles).!
!
The! majority! of! GHG! emissions! from! the! Port! relate! to! diesel! combustion,! making! CHE! the! largest!
contributor! of! the! four! source! groups,! followed! by! Onroad! Vehicles,! Rail! and! Admin.! A! total! of! 111!
kilotonnes!were! released! in! 2010! and! this! amount! is! forecast! to! increase! to! 199! kilotonnes! by! 2025.!
Increased!emissions!are!expected!from!each!of!the!sources!groups,!with!the!exception!of!Admin.!
The!Port!and!tenant!ERIs!achieved!a!reduction!of!approximately!1,200!tonnes!of!GHGs,!or!1.1%!of!the!
BAU!emissions,!in!2010.!The!reduced!emissions!were!primarily!due!to!the!genset!locomotives!and!hybrid!
cranes.! The! effect! of! the! ERIs! is! expected! to!more! than! double! by! 2015! when! the! planned! ERIs! are!
realized!by!2015.!!
" "
Figure ES–GHG
Annual CO2e Emissions by Source Group (tonnes)
0
50,000
100,000
150,000
200,000
2010 2015 2020 2025
Effect of Reduction Initiatives (ERIs) on CO2e (tonnes)
50,000
100,000
150,000
200,000
250,000
2010 2015 2020 2025
BAU ERIs
CO2e Contribution by Fuel Type
Diesel Propane Gasoline
Natural Gas Electricity
2010
13%
77%
2025
12%
80%
2.6%
4.0%
4.1%
2.4%
2.2%
3.2%
–2.1%
% Change
–2.2%
–2.3%–1.1%
Admin CHE Onroad Rail
Port%Metro%Vancouver%
2010%Landside%Emissions%Inventory%
! ! !
504910!/!March!26,!2012! ES214!
!
!
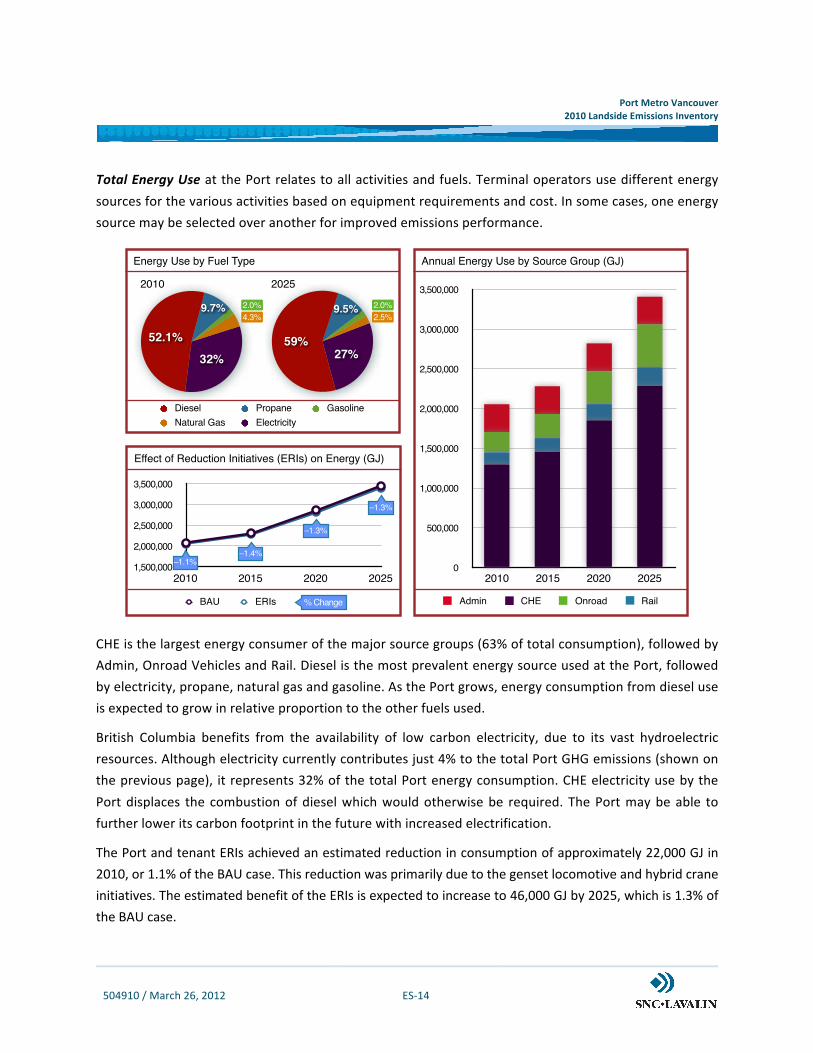
Total"Energy"Use"at!the!Port!relates!to!all!activities!and!fuels.!Terminal!operators!use!different!energy!
sources!for!the!various!activities!based!on!equipment!requirements!and!cost.!In!some!cases,!one!energy!
source!may!be!selected!over!another!for!improved!emissions!performance.!!
!
CHE!is!the!largest!energy!consumer!of!the!major!source!groups!(63%!of!total!consumption),!followed!by!
Admin,!Onroad!Vehicles!and!Rail.!Diesel!is!the!most!prevalent!energy!source!used!at!the!Port,!followed!
by!electricity,!propane,!natural!gas!and!gasoline.!As!the!Port!grows,!energy!consumption!from!diesel!use!
is!expected!to!grow!in!relative!proportion!to!the!other!fuels!used.!!
British! Columbia! benefits! from! the! availability! of! low! carbon! electricity,! due! to! its! vast! hydroelectric!
resources.!Although!electricity!currently!contributes!just!4%!to!the!total!Port!GHG!emissions!(shown!on!
the!previous!page),! it!represents!32%!of!the!total!Port!energy!consumption.!CHE!electricity!use!by!the!
Port!displaces! the! combustion!of!diesel!which!would!otherwise!be! required.!The!Port!may!be!able! to!
further!lower!its!carbon!footprint!in!the!future!with!increased!electrification.!!
The!Port!and!tenant!ERIs!achieved!an!estimated!reduction!in!consumption!of!approximately!22,000!GJ!in!
2010,!or!1.1%!of!the!BAU!case.!This!reduction!was!primarily!due!to!the!genset!locomotive!and!hybrid!crane!
initiatives.!The!estimated!benefit!of!the!ERIs!is!expected!to!increase!to!46,000!GJ!by!2025,!which!is!1.3%!of!
the!BAU!case.% %
Figure ES–Energ
Annual Energy Use by Source Group (GJ)
0
500,000
1,000,000
1,500,000
2,000,000
2,500,000
3,000,000
3,500,000
2010 2015 2020 2025
Effect of Reduction Initiatives (ERIs) on Energy (GJ)
1,500,000
2,000,000
2,500,000
3,000,000
3,500,000
2010 2015 2020 2025
BAU ERIs
Energy Use by Fuel Type
Diesel Propane Gasoline
Natural Gas Electricity
2010
32%
9.7%
52.1%
2025
27%
9.5%
59%
2.0%
4.3%
2.0%
2.5%
–1.3%
% Change
–1.1%–1.4%
–1.3%
Admin CHE Onroad Rail

Port%Metro%Vancouver%
2010%Landside%Emissions%Inventory%
! ! !
504910!/!March!26,!2012! ES215!
!
!
Port%–%Related%Activities%in%the%Lower%Fraser%Valley%
Regional!activities,!energy!consumption!and!emissions!that!can!be!attributed!to!PMV!operations!beyond!
the! facility! gates! were! evaluated! during! the! 2010! LEI! through! transportation! modelling! of! Rail! and!
Onroad!Vehicles!within! an! ‘Airshed!Boundary’! consisting!of! the!Canadian!portion!of! the! Lower! Fraser!
Valley! (LFV).! Figure! ES24! provides! an! illustration! of! the! energies! associated!with! Port! operations! and!
where!these!energies!are!expended.!
Figure%ESC4:%Port%Energy%Consumption%within%the%LFV%%
!! !
Airshed Boundary
Port Boundary
Terminal/Facility Boundary
Die
se
l
Pro
pa
ne
Ga
so
line
Na
tura
l G
as
Ele
ctr
icity
En
erg
y C
on
su
mp
tio
n (
TJ)
2010 2025
Figure ES–4
0
5,000
6,000
7,000
8,000
3,000
2,000
1,000
4,000D
iese
l
Pro
pa
ne
Ga
so
line
Na
tura
l G
as
Ele
ctr
icity
4,339
656
198 88 48
7,245
910
32585 78
Port%Metro%Vancouver%
2010%Landside%Emissions%Inventory%
! ! !
504910!/!March!26,!2012! ES216!
!
!
The! majority! of! energy! consumption! for! the! Port! relates! to! diesel! use! and! over! half! of! the! diesel!
consumed!is!done!so!outside!of!the!Port!Boundary.!Energy!consumption!from!diesel!use!is!expected!to!
rise! from! approximately! 4,300! TJ! (1! terajoule! =! 1012! joules)! in! 2010! to! almost! 7,300! TJ! by! 2025.!
Port!electricity!consumption,!evaluated!for!the!first!time!during!the!2010!LEI,!totals!approximately!180!
GWh!or!660!TJ!for!2010.!This!amount,!equivalent!to!the!annual!electricity!consumption!of!approximately!
17,000! homes! in! BC,! is! not! large! in! comparison! to! some! of! the! significant! industrial! facilities! in! the!
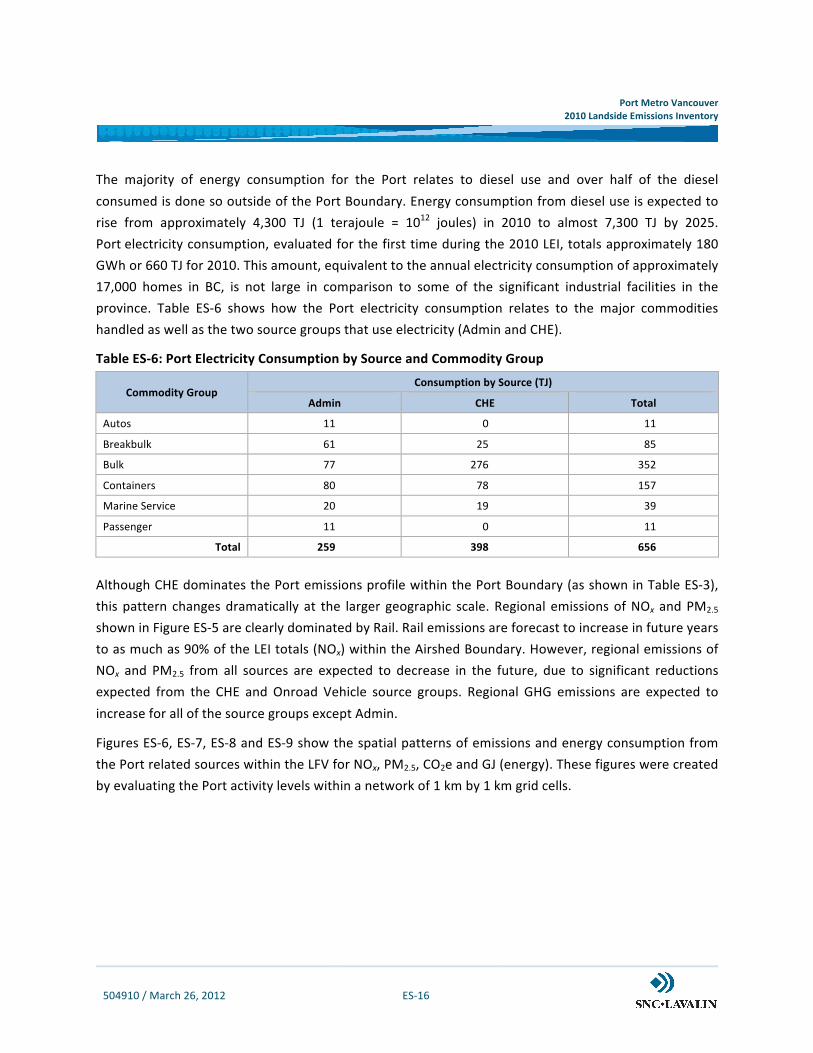
province.! Table! ES26! shows! how! the! Port! electricity! consumption! relates! to! the! major! commodities!
handled!as!well!as!the!two!source!groups!that!use!electricity!(Admin!and!CHE).!
Table%ESC6:%Port%Electricity%Consumption%by%Source%and%Commodity%Group%
Commodity%Group%Consumption%by%Source%(TJ)%
Admin% CHE% Total%
Autos! 11! 0! 11!
Breakbulk! 61! 25! 85!
Bulk! 77! 276! 352!
Containers! 80! 78! 157!
Marine!Service! 20! 19! 39!
Passenger! 11! 0! 11!
Total% 259% 398% 656%
!
Although!CHE!dominates!the!Port!emissions!profile!within!the!Port!Boundary!(as!shown!in!Table!ES23),!
this!pattern! changes!dramatically! at! the! larger! geographic! scale.!Regional! emissions!of!NOx! and!PM2.5!
shown!in!Figure!ES25!are!clearly!dominated!by!Rail.!Rail!emissions!are!forecast!to!increase!in!future!years!
to!as!much!as!90%!of!the!LEI!totals!(NOx)!within!the!Airshed!Boundary.!However,!regional!emissions!of!
NOx! and! PM2.5! from! all! sources! are! expected! to! decrease! in! the! future,! due! to! significant! reductions!
expected! from! the! CHE! and! Onroad! Vehicle! source! groups.! Regional! GHG! emissions! are! expected! to!
increase!for!all!of!the!source!groups!except!Admin.!
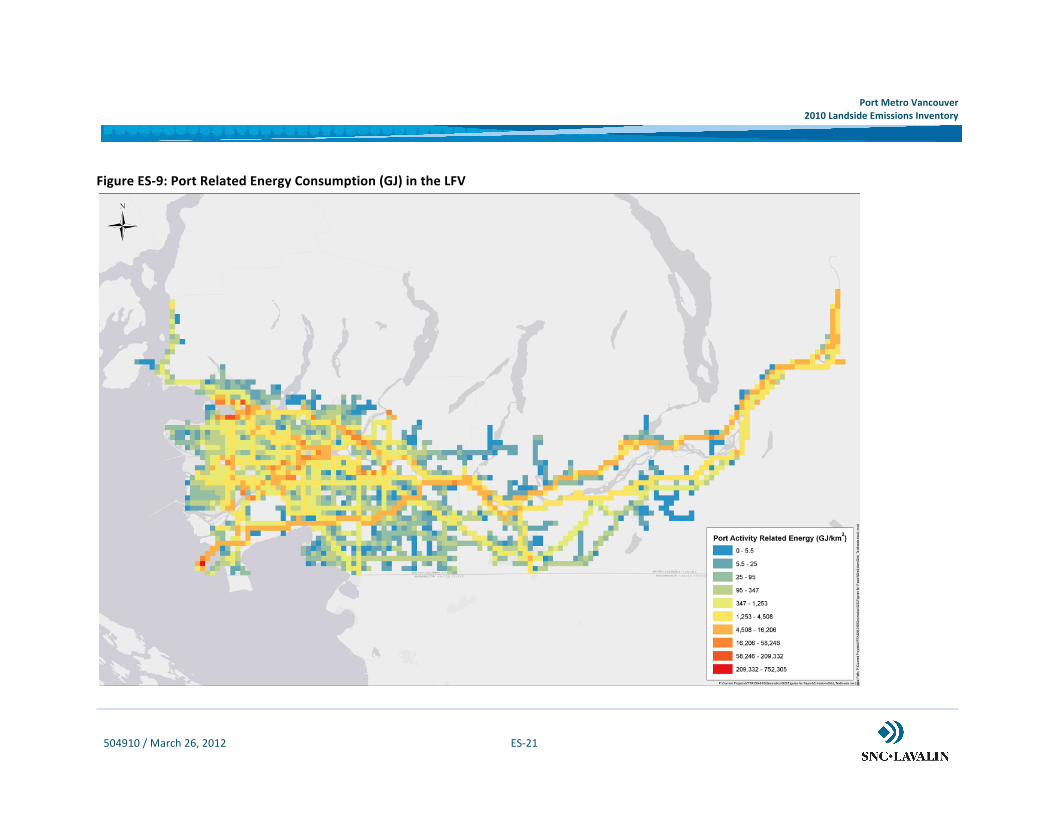
Figures!ES26,!ES27,!ES28!and!ES29!show!the!spatial!patterns!of!emissions!and!energy!consumption!from!
the!Port!related!sources!within!the!LFV!for!NOx,!PM2.5,!CO2e!and!GJ!(energy).!These!figures!were!created!
by!evaluating!the!Port!activity!levels!within!a!network!of!1!km!by!1!km!grid!cells.!
% %

Port%Metro%Vancouver%
2010%Landside%Emissions%Inventory%
! ! !
504910!/!March!26,!2012! ES217!
!
!
Figure%ESC5:%PortCrelated%Emissions%in%the%LFV%by%Source%Group%%
%
2010 2015 2020 20250
2,000
3,000
4,000
5,000
1,000
NOx Emissions (tonnes)
2010 2015 2020 2025
PM2.5 Emissions (tonnes)
0
50
75
100
125
25
150
2010 2015 2020 2025
CO2e Emissions (tonnes)
0
400,000
600,000
800,000
200,000
Figure ES–5
Admin CHE
Onroad Rail

!
! ! !
504910!/!March!26,!2012! ES218!
!
!
Figure'ES*6:'Port'Related'NOx'Emissions'in'the'LFV'
' '

Port'Metro'Vancouver'
2010'Landside'Emissions'Inventory'
!
! ! !
504910!/!March!26,!2012! ES219!
!
!
Figure'ES*7:'Port'Related'PM2.5'Emissions'in'the'LFV'
' '

Port'Metro'Vancouver'
2010'Landside'Emissions'Inventory'
!
! ! !
504910!/!March!26,!2012! ES220!
!
!
Figure'ES*8:'Port'Related'CO2e'Emissions'in'the'LFV'
'
' '
Port'Metro'Vancouver'
2010'Landside'Emissions'Inventory'
!
! ! !
504910!/!March!26,!2012! ES221!
!
!
Figure'ES*9:'Port'Related'Energy'Consumption'(GJ)'in'the'LFV'
'
Port Metro Vancouver
2010 Landside Emissions Inventory
504910 / March 26, 2012 ES-22
Conclusion
The 2010 LEI constitutes a revised baseline encompassing all of the Port tenants within the LFV engaged
in marine trade. Significant reductions in CAC emissions have been realized at PMV since the Port began
assessing its emissions in 2006 (for the 2005 baseline year). The Port’s Air Action Program includes
strategies for CHE and Trucks and the annual CAC emissions from these sources are expected to
decrease in future years, even with the Port growth expected. The effect of the Port and tenant
emission reduction initiatives were evaluated, including the purchase of new, non conventional terminal
equipment such as hybrid cranes and genset switch locomotives. These and additional planned
initiatives will continue to be effective in future years, reducing the Port’s emissions footprint by as
much as 13% (NOx) over the business as usual case.
The Port’s TLS program, which added environmental requirements in 2008 following the 2005 LEI, was
estimated to have reduced NOx emissions by 19 tonnes and PM2.5 emissions by 0.5 tonnes within the
Port Boundary during 2010. The impact of this program throughout the LFV was estimated to be
218 and 5 tonnes for NOx and PM2.5 respectively. Considering emissions within the LEI Airshed Boundary,
the TLS program had the greatest impact of the 11 Port and tenant initiatives assessed as part of the
project.
The 2010 LEI provides a greater understanding of the Port’s emissions within the larger community. NOx,
and PM2.5 are considered regional pollutants and contribute to the formation of secondary
contaminants such as ground-level ozone as well as reduced visibility. The LEI estimates to the Airshed
Boundary show that Rail emissions of NOx and PM2.5 dominate the Port’s regional emissions profile and
imply that effective emission reduction planning in conjunction with the National Rail operators will be
needed to continue reducing emissions in the region. Developing and implementing a rail emission
reduction strategy that can be as effective as the TLS program will be a significant challenge.
Port-related CAC emissions are decreasing and this trend will continue through future years. For Sulphur
Oxides (SOx), total Port emissions have already declined to a small fraction of amounts released in
previous years, largely due to the implementation of Canadian Sulphur in Fuel Standards since 2005.
However, Port-related GHG emissions are forecast to increase within each of the LEI boundaries. GHGs
will continue to receive attention as potentially the most relevant environmental issue in Canada during
the next decade and beyond. Limiting emissions of GHGs as the Port grows is an additional challenge for
the Port that will require collaboration with the Port’s partners as well as governmental agencies.
By encompassing activity, energy consumption and emission estimates to the Airshed Boundary, the
2010 LEI provides valuable insight with which the Port can focus its environmental planning efforts at a
scale and level of detail where maximum benefits may be achieved.