2010 annual report - lg chem
TRANSCRIPT

LG Chem2010 Annual Report
2010 An
nu
al Report
LG Twin Towers, 20, Yeouido-dong, Yeongdeungpo-gu, Seoul 150-721, Korea Tel_ 82-2-3773-7227 Corporate Website_ www.lgchem.com

About LG ChemLG Chem is Korea’s first – and largest vertically integrated – chemical company. Founded in 1947, we have emerged as one of the world’s top 30 chemical makers over the past six decades by consistently delivering petrochemicals and information technology & electronic materials that improve the quality of life for people everywhere.
Backed by a growing production, marketing, and R&D operations network around the world, LG Chem is now poised to make its mark globally. As we continue to transit our existing business portfolio to value-added fields, we are paying more attention to our information technology & electronic materials division, a key element of our future growth, as we actively pursue opportunities in new materials fields. We believe these strategies for growth will power our next step forward, while also enhancing our reputation for bringing unique materials and solutions to life.
02 Business Divisions04 Financial Highlights06 Message from the Ceo08 Management's Discussion & Analysis14 Message from the CFo17 Report of Independent Auditors18 Consolidated Statements of Financial Position20 Consolidated Statements of Income21 Consolidated Statements of
Comprehensive income22 Consolidated Statements of Changes
in Shareholders’ equity23 Consolidated Statements of
Cash Flows24 Notes to Consolidated Financial
Statements82 Board of Directors83 2011 IR Plan
Contents
* This report was organized on a consolidated basis. Please refer to the separate audit report for non-consolidated financial statements.
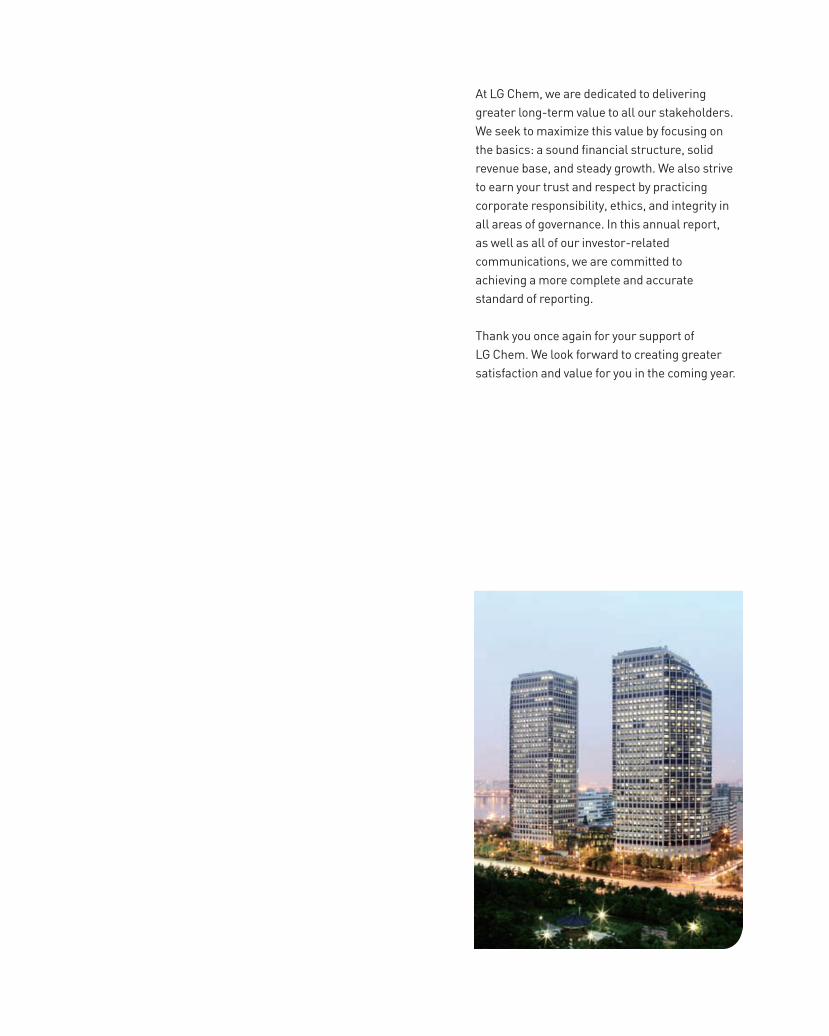
At LG Chem, we are dedicated to delivering greater long-term value to all our stakeholders. We seek to maximize this value by focusing on the basics: a sound financial structure, solid revenue base, and steady growth. We also strive to earn your trust and respect by practicing corporate responsibility, ethics, and integrity in all areas of governance. In this annual report, as well as all of our investor-related communications, we are committed to achieving a more complete and accurate standard of reporting.
Thank you once again for your support of LG Chem. We look forward to creating greater satisfaction and value for you in the coming year.
2
LG C
hem
Ann
ual R
epor
t 201
0
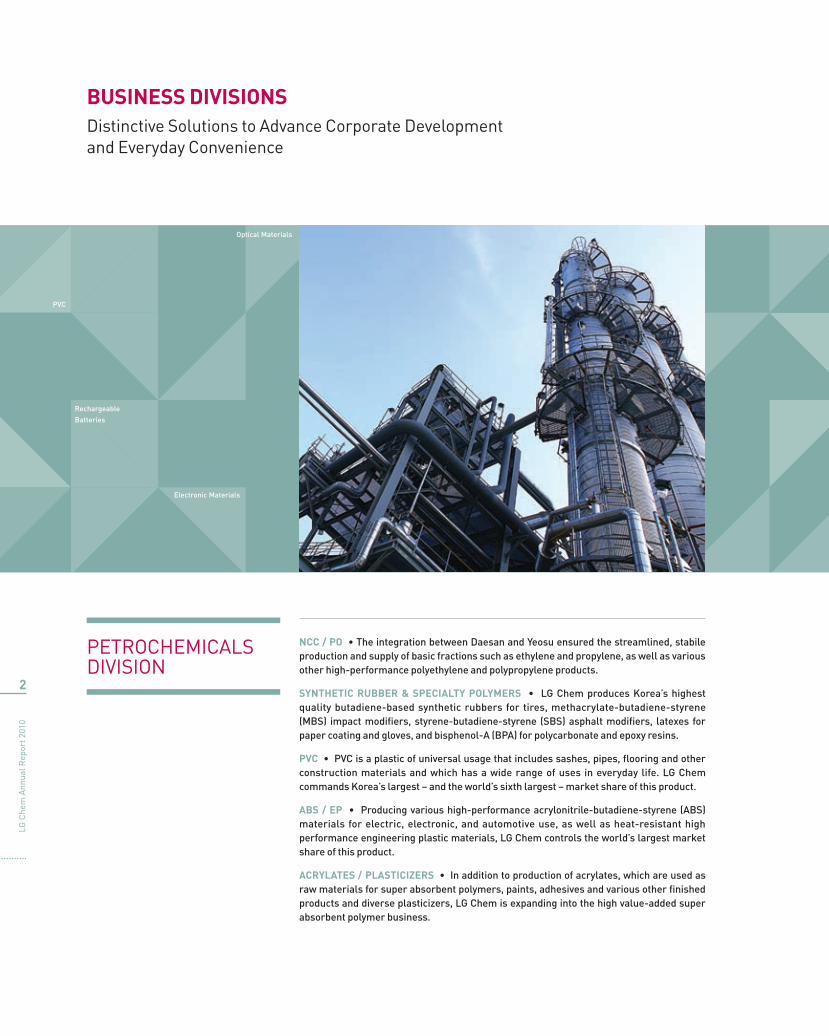
PeTRoChemICALs DIvIsIon
nCC / Po • The integration between Daesan and Yeosu ensured the streamlined, stabile production and supply of basic fractions such as ethylene and propylene, as well as various other high-performance polyethylene and polypropylene products.
synthetiC RubbeR & sPeCiALty PoLymeRs • LG Chem produces Korea’s highest quality butadiene-based synthetic rubbers for tires, methacrylate-butadiene-styrene (MBS) impact modifiers, styrene-butadiene-styrene (SBS) asphalt modifiers, latexes for paper coating and gloves, and bisphenol-A (BPA) for polycarbonate and epoxy resins.
PVC • PVC is a plastic of universal usage that includes sashes, pipes, flooring and other construction materials and which has a wide range of uses in everyday life. LG Chem commands Korea’s largest – and the world’s sixth largest – market share of this product.
Abs / eP • Producing various high-performance acrylonitrile-butadiene-styrene (ABS) materials for electric, electronic, and automotive use, as well as heat-resistant high performance engineering plastic materials, LG Chem controls the world’s largest market share of this product.
ACRyLAtes / PLAstiCizeRs • In addition to production of acrylates, which are used as raw materials for super absorbent polymers, paints, adhesives and various other finished products and diverse plasticizers, LG Chem is expanding into the high value-added super absorbent polymer business.
business diVisionsDistinctive solutions to Advance Corporate Development and everyday Convenience
PVC
Rechargeable
Batteries
optical Materials
electronic Materials

3
IT & eLeCTRonIC mATeRIALsDIvIsIon
ReChARGeAbLe bAtteRies • LG Chem’s product line-up of lithium-ion batteries and lithium-ion polymer batteries ranges from small batteries for mobile devices to advanced automotive batteries.
oPtiCAL mAteRiALs • LG Chem leads the global optical materials market with its advanced production capacity of core optical materials for displays, including polarizers.
eLeCtRoniC mAteRiALs • With its advance technologies in photoresists, strippers for LCDs, toners, organic light emitting diode (oLeD) materials, cathode materials and circuit board materials, LG Chem offers differentiated solutions for the electronic materials sector.
FiLm • LG Chem produces a number of high-performance films, including LCD-BLU (liquid crystal device-back light unit), semiconductor films, and touch panel materials.
LG Chem is dedicated to the advancement of corporate development and of everyday convenience by producing and supplying leading petrochemical, information technology & electronic materials and solutions worldwide. With distinctive products and solutions that are the result of years of experience and technology development, LG Chem has grown to become a global solutions partner, striving to support the success of customers and the advancement of the petrochemicals and information technology & electronic materials industries.
NCC / Po
Synthetic Rubber &Specialty polymers
ABS / eP
Acrylates / Plasticizers
Film
Business D
ivisions

4
LG C
hem
Ann
ual R
epor
t 201
0
FinAnCiAL hiGhLiGhts
ConsoLidAted(in KRW billions)
sALes
600
1,200
1,800
2,400
3,000
600
1,200
1,800
2,400
3,000
19,471 15,521
4,000
8,000
12,000
16,000
20,000
10 09
3,000
6,000
9,000
12,000
15,000
1,000
2,000
3,000
4,000
5,000
2,000
4,000
6,000
8,000
10,000
totAL Assets
12,673
10
10,531
09
oPeRAtinG PRoFit
2,821
10
2,098
09
totAL LiAbiLites
4,830
10
4,604
09
net inCome
2,120
10
1,539
09
totAL eQuity
7,843
10
5,927
09

5
(in shares)
tRAdinG VoLume
1,000K
750,000
500,000
250,000
0
2010.01 2010.02 2010.03 2010.04 2010.05 2010.06 2010.07 2010.08 2010.09 2010.10 2010.11 2010.12
(in KRW millions)
Key FiGuRes
operating profit margin
Return on equity
Debt to equity
Total issued common shares
earnings per share in won
Stock price in won at year end
Dividend per common share in won
2009
13.5%
27.3%
40.7%
66,271,100
19,846
228,500
3,500
2010
14.5%
31.9%
26.8%
66,271,100
29,345
391,000
4,000
Financial highlights
(in KRW)
stoCK PRiCe
2010.01 2010.02 2010.03 2010.04 2010.05 2010.06 2010.07 2010.08 2010.09 2010.10 2010.11 2010.12
425,000
400,000
375,000
350,000
325,000
300,000
275,000
250,000
225,000
200,000
0

6
LG C
hem
Ann
ual R
epor
t 201
0
messAGe FRom the Ceo
It is with a great deal of pride that I can say LG Chem recorded the highest business results in its history last year. Sales reached KRW 19,471.4 billion and operating profit stood at 28,213 billion, marking a 25 percent and 35 percent rise, respectively, over 2009.
I believe this is the result of our diligent attention to Speed Management, which is based on a clear vision and strong will to achieve our goals. However, none of this would have been possible without your encouragement and support.
By business division, LG Chem’s Petrochemicals Division has significantly enhanced its profitability by strengthening its cost competitiveness based on its ability to operate cutting-edge facilities, while also increasing the portion of its premium products. At the same time, our IT & electronic Materials Division secured a leading position in the polarizer business in markets around the world. In addition, it solidified cost leadership through innovation carried out with its processes and materials, and expanded its business portfolio, including a pilot investment in oLeD lighting technology. LG Chem’s battery business saw outstanding growth in the
Respected shareholders and customers:

7
global market as well, gaining a competitive edge through the development of differentiated materials, as it raised productivity at all its facilities. Furthermore, LG Chem’s push for new businesses to act as future growth engines began crystalizing in 2010.
The construction of factories to produce glass substrates for LCD panels has been proceeding smoothly, too. In fact, LG Chem has been solidifying its leading position in markets around the world by signing more contracts with major automakers, while also beginning construction of a factory in the United States.
As we build on past successes, we aim to become a leading global company. To this end, LG Chem has set forth a three-point Speed Management mission: to pursue global leadership in core businesses; to create greater customer value; and to reinforce global organizational competencies.
To begin, we will secure global leadership in our core businesses by strengthening our business competitiveness. By securing cost leadership, product leadership, and market leadership, LG Chem will surpass the competition as it expands the scope of its focus and furthers its leading position in core businesses. Moreover, we will gain an early competitive edge in new businesses such as automotive batteries and glass substrates for LCD panels.
Second, we will create customer value that matches the highest global standards in order to provide our customers with top value and ensure the highest satisfaction. By providing differentiated solutions for our customers, we will ensure that they are as competitive as possible. Additionally, by combining our innovative process technologies and R&D
competencies, we will develop a more advanced technology than anyone else. This will turn LG Chem into a technology company that plays a leading role in customer value and one which has the highest quality products on the market.
Finally, we will strengthen our organizational competencies to realize outstanding business results on a consistent basis. To that end we will make sure that employees want to work at every LG Chem workplace by enabling them to set challenging goals which they will ultimately achieve.
In closing, I would like to express my sincere appreciation for the unwavering support and encouragement shown by all of our customers and investors over the past year. Not resting on past successes from 2010, we are committing ourselves to work even harder in the future as we aim to become a leading global company that customers and markets truly want to be associated with.
We appreciate your constant support and encouragement.Thank you.
Peter bahnsuk Kim I vice Chairman & Ceo
Not resting on past successes from 2010, we are committing ourselves to work even harder in the future as we aim to become a leading global company that customers
and markets truly want to be associated with.
message from
the Ceo

8
LG C
hem
Ann
ual R
epor
t 201
0
mAnAGement’s disCussion & AnALysis
LG Chem has grown into the nation’s leading petrochemical corporation since its founding in 1947. In 2010, new businesses that the company has long been preparing as future growth engines began taking shape in meaningful ways.
To begin, LG Chem is expanding its IT & electronic Materials Division to include clean energy businesses, while furthering profitability and growth of its traditional core business, the Petrochemicals Division. Consequently, LG Chem was able to achieve its highest net income ever, more than KRW 2 trillion, in 2010.
Despite aggressive expansionary measures taken by nations around the world to revive economies in the wake of the 2009 financial crisis, global economic recovery was slower than expected in 2010 due mostly to financial instability in europe.
Although faced with these and other market challenges, LG Chem was still able to greatly improve profitability in the Petrochemicals Division as a result of growing demand in emerging markets like China and India, a stable petrochemical market that saw a steady rise in the price of oil, and differentiated premium products which the company’s competition could not offer.
While the IT & electronic Materials Division experienced sagging demand in the second half of 2010 due to declining utilization rate that was a result of an inventory adjustment of major products that included LCDs, the Division did see brisk demand in the first half of 2010, in part because of the Winter olympics and the FIFA World Cup in South Africa.
even with all these challenges, LG Chem achieved solid growth and maintained strong relationships with major clients. Indeed, the company saw its highest performance ever in sales and operating profit, posting 25.5 and 34.5 percent growth rates, respectively, to reach KRW 19,471.4 billion and KRW 2,821.3 billion on an IFRS basis. Also, net income increased 42.9 percent, reaching KRW 2,199.8 billion.
By division, the Petrochemicals Division enjoyed favorable market conditions, with rising demand in emerging markets such as China and India.
Through an increase in the proportion of premium products and a wide range of innovative business solutions, Petrochemicals Division continued to strengthen cost competitiveness and enhance customer value. As a result, it witnessed a 28.2 percent growth in sales, reaching KRW 14,525.5 billion, and a 41.7 percent rise in operating profit, reaching KRW 2,278.9 billion.
All five businesses in LG Chem’s Petrochemicals Division recorded remarkable growth in profitability throughout 2010. In particular, its acryl and plasticizer business continued to enjoy high profit levels, while the synthetic rubber & specialty polymer business witnessed significant improvements in profitability due in part to the rise of natural rubber prices.
Despite the decrease in utilization rate as a result of weak IT demand in the second half of 2010, the IT & electronic Materials Division saw an increase in sales and operating profit, posting 18.1 and 18.4 percent rises in growth rates, respectively, to reach KRW 4,903.0 billion
2010 oVeRVIeW
diVisionAL sALes Petrochemicals IT & electronic Materials
2010
25.2%
74.8%
2009
26.8%
73.2%
diVisionAL oPeRAtinG PRoFit Petrochemicals IT & electronic Materials
2010
20.8%
79.2%
2009
24%
76.0%

9
and KRW 600.1 billion in 2010 due to the addition of super-wide lines for polarizer plates, operational excellence, and strengthened cost leadership.
With its polarizing business, LG Chem became the world’s leader both in name and substance, leaving Japanese competitors behind in terms of sales and profits. This was made possible because of constant cost leadership activities, which included innovating the work process and materials after achieving the industry’s top line speed and establishing a super-wide line.
LG Chem’s battery business market share rose significantly as its stake in strategic customers such as Nokia, HP, and Apple increased. This was accomplished through an aggressive production capacity increase and enhanced communication with strategic customers. In addition, LG Chem was able to sign deals with 10 leading auto manufacturers that included GM, Renault, Volvo, and Ford in the automotive battery business, one of the company’s future growth engines. In fact, LG Chem began providing batteries for GM’s Chevrolet Volt from the third quarter of 2010, and expects sales in its automotive battery business to soar as some of the company’s biggest clients, including Hyundai and Renault, prepare for the release of new cars that make use of its automotive batteries.
Furthermore, things have been going well with the LCD glass business ever since LG Chem started its full-scale investment into the business. The first line, which was established after an initial investment of KRW 430 billion, is scheduled to be finished in the first half of 2011. Commercial production will start in 2012 after all the necessary tests and client’s spec-in process take place.
Moreover, LG Chem will continue to pursue Speed Management to respond to changing market trends, while developing new products such as 3D retarders and oLeD materials before any other company.
In 2010, LG Chem made a total of KRW 1.7 trillion, out of which KRW 560 billion was invested in the Petrochemicals Division, KRW 948 billion in the IT & electronic Materials Division, and KRW 193.1 billion for common expenses. In 2011, LG Chem will continue investments such as these in order to strengthen competitiveness in traditional businesses and secure future growth engines.
Additionally, LG Chem acquired the remaining residual equity in LG-Dow Polycarbonate on october 1, 2010 and completed the merger on April 1, 2011. This was carried out with the aim of securing more cost leadership and increasing market dominance by maximizing synergy between businesses and completing the company’s vertical integration, which will ultimately maximize shareholder value.
Through continuous innovation based on superb production infrastructure that is based around its operational excellence, LG Chem will continue working hard to realize its vision of becoming a leading global company that is centered on petrochemicals, consumer and automotive batteries, and information technology & electronic materials.
managem
ent’s Discussion &
Analysis
shARehoLdeR ComPosition (Common stock)
LG Corp. Korean Individuals & Institutions Foreign Shareholders
2010
34.86%
31.61%
39.69%
33.53%
2009
26.78%
33.53%

10
LG C
hem
Ann
ual R
epor
t 201
0
mAnAGement’s disCussion & AnALysis
FINANCIAL INFoRMATIoN
FinAnCiAL stRuCtuRe
As cash flow improved due to significantly better achievements than the previous year, consolidated debt-to-equity ratio and leverage ratio were reduced 16.1 percentage points and 13.9 percentage points, respectively, over the year, to 61.6 percent and 26.8 percent as of the end of 2010.
In 2011, LG Chem plans to invest mostly into result-oriented and highly profitable businesses, such as LCD glass substrates, HeV/eV batteries, 3D retarders, and polymer batteries, all of which will help secure future engines for constant growth.
LG Chem will make prudent investment decisions, restructure less profitable businesses, and manage working capital more efficiently by not investing past the amount of internal cash flow and making continuous efforts to improve the company’s financial structure.
eQuity
As of December 31, 2010, the LG Corp. held 33.53 percent of LG Chem’s outstanding shares, with foreign investors holding 34.86 percent and domestic institutional and individual investors holding 31.61 percent.
Debt to equity (%)
Interest coverage multiple (X)
Return on assets (%)
Return on equity (%)
2010
26.8
46.2
19.0
31.9
2009
40.7
20.2
14.8
27.3
mAjoR FinAnCiAL indiCAtoRs
Common stock
Preferred stock
Total
Total Shares Issued
66,271,100
7,628,921
73,900,021
Paid-in Capital
(in KRW billions)
331.4
38.1
369.5
Foreign Investor Holdings (%)
34.86
25.87
33.93
stoCK inFoRmAtion (as of Dec. 31, 2010)
61.6 77.7
20
40
60
80
100
10 09
totAL LiAbiLity to eQuity RAtio (%)
26.8 40.7
20
40
60
80
100
10 09
debt to eQuity RAtio (%)
11
managem
ent’s Discussion &
Analysis
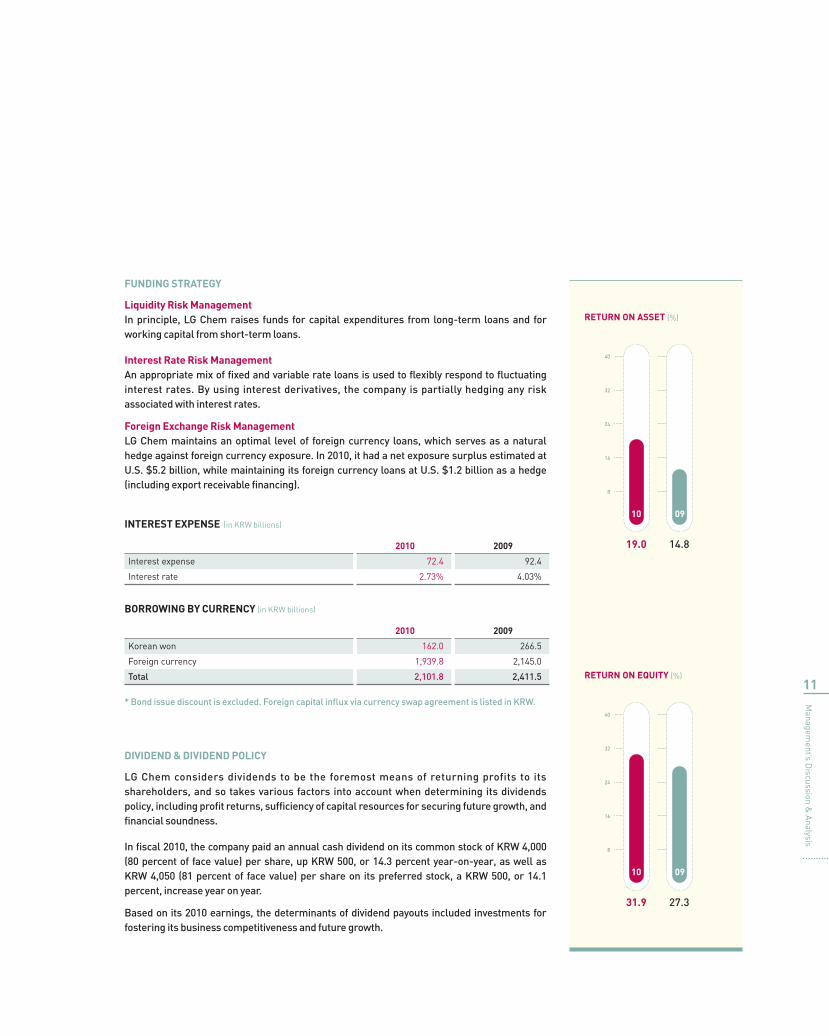
FundinG stRAteGy
Liquidity Risk managementIn principle, LG Chem raises funds for capital expenditures from long-term loans and for working capital from short-term loans.
interest Rate Risk managementAn appropriate mix of fixed and variable rate loans is used to flexibly respond to fluctuating interest rates. By using interest derivatives, the company is partially hedging any risk associated with interest rates.
Foreign exchange Risk managementLG Chem maintains an optimal level of foreign currency loans, which serves as a natural hedge against foreign currency exposure. In 2010, it had a net exposure surplus estimated at U.S. $5.2 billion, while maintaining its foreign currency loans at U.S. $1.2 billion as a hedge (including export receivable financing).
diVidend & diVidend PoLiCy
LG Chem considers dividends to be the foremost means of returning profits to its shareholders, and so takes various factors into account when determining its dividends policy, including profit returns, sufficiency of capital resources for securing future growth, and financial soundness.
In fiscal 2010, the company paid an annual cash dividend on its common stock of KRW 4,000 (80 percent of face value) per share, up KRW 500, or 14.3 percent year-on-year, as well as KRW 4,050 (81 percent of face value) per share on its preferred stock, a KRW 500, or 14.1 percent, increase year on year.
Based on its 2010 earnings, the determinants of dividend payouts included investments for fostering its business competitiveness and future growth.
Interest expense
Interest rate
2009
92.4
4.03%
2010
72.4
2.73%
inteRest exPense (in KRW billions)
* Bond issue discount is excluded. Foreign capital influx via currency swap agreement is listed in KRW.
Korean won
Foreign currency
Total
2009
266.5
2,145.0
2,411.5
2010
162.0
1,939.8
2,101.8
boRRowinG by CuRRenCy (in KRW billions)
19.0 14.8
8
16
24
32
40
10 09
RetuRn on Asset (%)
31.9 27.3
8
16
24
32
40
10 09
RetuRn on eQuity (%)

12
LG C
hem
Ann
ual R
epor
t 201
0
mAnAGement’s disCussion & AnALysis
LG Chem is committed to enhancing shareholder value by enhancing the competitiveness of its core businesses and generating solid profits at a steady pace, while also maintaining dividends at a substantial level that can ensure the financial soundness of the company and meet shareholder expectations.
CAPitAL exPendituRes
In 2010, LG Chem’s total investments amounted to KRW 1.7 trillion on a consolidated basis. The company continued readjusting its business portfolio to focus on specialty products in the Petrochemicals Division, with major investments including the 100 thousand-ton expansion of its Yeosu NCC, the takeover of the remaining shares in LG-Dow PC, as well as smaller though still new investments in SBS and debottlenecking. Including its investment in LCD glass and its automotive batteries businesses, LG Chem invested a total of KRW 820 billion into battery production in the IT & electronic Materials Division.
In 2011, LG Chem will channel all its available resources into expanding its existing businesses and securing future growth engines to follow through on its goal of becoming a leading global company. Investments in the petrochemicals business will focus on the expansion of facilities, such as the 15 thousand-ton expansion of its Daesan NCC, as well as its BR and SAP facilities. In the IT & electronic Materials Division, the company will increase its investments in LCD glass, automotive batteries, and 3D retarders.
Although total investment has increased greatly over the previous year, LG Chem always ensures that this number never exceeds the cash flow generated from operating activity going in the past several years, while at the same time helping bring about its vision of becoming a leading global company.
2011 outLooK
With the likelihood of interest rate hikes, the appreciation of the Korean won, and continued instability in the Middle east in 2011, the global economy seems to be highly volatile. Amid the uncertainties forecast to abound in the business environment, LG Chem will continue to hone its
net income (in KRW million)
ePs (in KRW)
Total dividends (in KRW million)
Dividend payout ratio (%)
DPo at face, common (%)
DPo at face, preferred (%)
Dividend yield ratio, common (%)
Dividend yield ratio, preferred (%)
2010
2,199,765
29,345
279,988
13.7
80
81
1.02
2.55
2009
1,539,197
19,846
210,584
17.1
70
71
1.53
4.30
diVidend summARy
29,345 19,846
6,000
12,000
18,000
24,000
30,000
10 09
ePs (in KRW)
13.7 17.1
4
8
12
16
20
10 09
diVidend PAyout RAtio (%)

13
managem
ent’s Discussion &
Analysis
competitiveness in its traditional businesses in an effort to expand overall profit and keep promoting new businesses.
Although there are still concerns about weak demand of polyolefin products in the Petrochemicals Division, LG Chem continues to expand its proportion of Po specialty products based on its unique competitiveness.
Supply and demand remains steady for downstream product lines, including acrylate/plasticizers, synthetic rubber, and ABS/eP. Furthermore, the company is improving its cost leadership by carrying on with its cost competitiveness enhancement initiatives, as well as diversifying its product portfolio and ensuring the highest operational excellence at all its facilities to maximize its profit structure.
With the IT & electronics Division, LG Chem is concentrating on enhancing its market dominance in existing businesses and normalizing its future growth engine businesses early on.
In 2010, its battery business enjoyed significant growth in its global market share, with more than a 50 percent increase in output due to the expansion of certain facilities and a stable customer base. Sales volume is also expected to grow based on an increased capacity of polymer batteries, a stable customer base, and increased demand of tablet PCs.
The automotive battery business is expecting a substantial amount of sales with major automakers such as GM, Renault, Hyundai, and Kia. In 2011, the Division plans to increase its research and development personnel and its investment into the sector to maintain its leading position as the market grows. In addition, the company secured market leadership by reaching out to customers that its competitors have not approached.
With the optical & display materials business, the company will maintain higher profitability than its competitors and strengthen its leading position in its global market share by operating new items such as the 3D retarder, super-wide line of polarizers, while also carrying out cost-cutting measures that include internalizing raw materials and enhancing productivity.
In terms of its investment in the LCD glass business, which is currently taking place, LG Chem will take every necessary step to achieve its goal, with its first unit slated to be completed in the first half of 2011 and to begin commercial production in 2012. LG Chem plans to attain visible results in a short period of time by accelerating the business process.
LG Chem will seek operational excellence in its core businesses and centralize its resources with new businesses to reinforce the necessary momentum for future growth. In addition, it will continue to adhere to Speed Management in 2011 in order to grow as a leading global company.
Based on its accumulated experience over the years, LG Chem will spare no effort in realizing the very best performance results through its three-pronged mission of Speed Management:
• Pursuing excellence in core businesses• Innovating customer value• Reinforcing the organization’s global competencies
560 948290 553
200
400
600
800
1,000
10 1009 09
diVisionAL CAPitAL inVestment(in KRW billions)
Petrochemicals
1.02 2.551.53 4.30
1
2
3
4
5
10 1009 09
diVidend yieLd RAtio (%)
Common Preferred
it & electronic materials
14
LG C
hem
Ann
ual R
epor
t 201
0
messAGe FRom the CFo
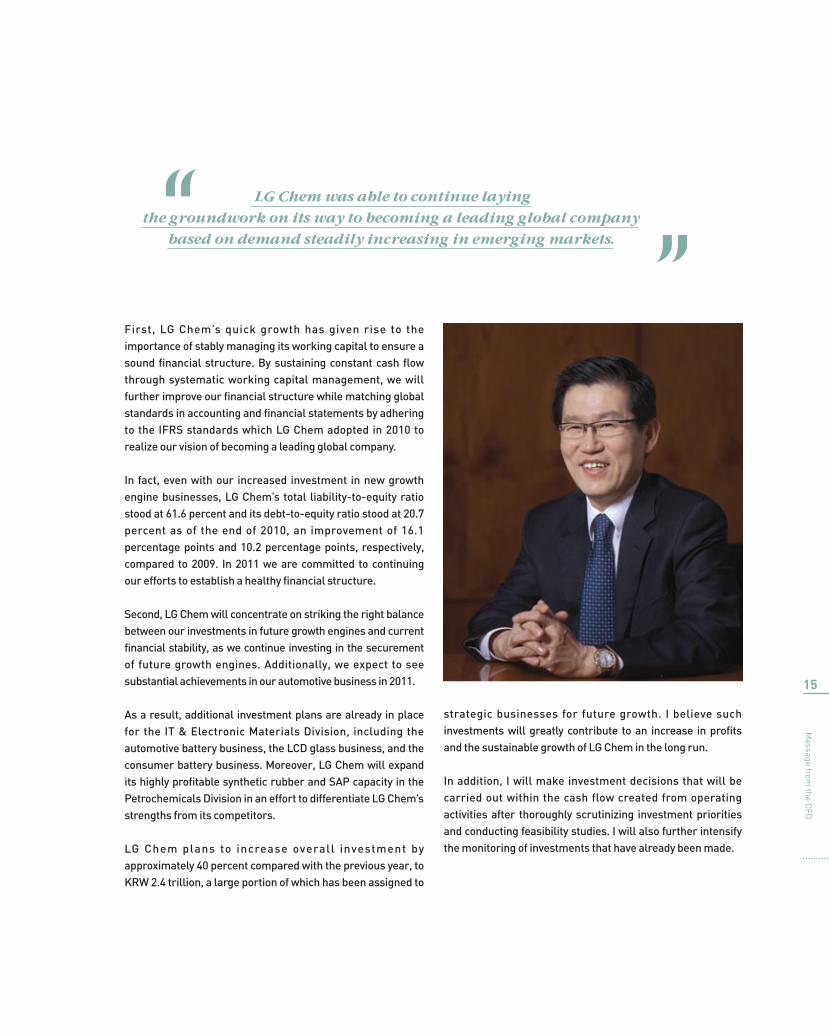
In 2010, there was a great deal of uncertainty in the business landscape due to slow economic recovery internationally and the financial crisis in europe. Despite these challenges, LG Chem was able to continue laying the groundwork on its way to becoming a leading global company based on demand steadily increasing in emerging markets, a diversified business portfolio, and an excellent ability to generate profits.
LG Chem is doing its utmost to establish itself as a globally competitive company by strengthening traditional core business such as its Petrochemicals Division, which maintains high profitability by taking full advantage of its operating excellence, as well as its diverse portfolio, and the IT & electronic Materials Division, which enjoys the greatest market share in the global market. In addition, LG Chem is enhancing its market leadership in the electric car battery business, an exciting future growth engine for the company.
As a result of these efforts, LG Chem realized its best performance in sales, 25.5 percent, or KRW 19,471.4 billion, and operating profit, 34.5 percent, or KRW 2,821.3 billion, on an International Financial Reporting Standards (IFRS) basis.
In addition to the growth that the Petrochemicals and the IT & electronic Materials Divisions witnessed in 2010, a significant amount of money was invested in LG Chem’s automotive battery business and its LCD glass business. Thus, the responsibility of the CFo was more important than ever in making timely, accurate decisions about investments, and also minimizing market vulnerability risks in an uncertain financial market environment.
In terms of its international credit rating, Moody’s increased LG Chem’s rating from Baa1 to A3, while S&P increased it
from BBB+ to A-, citing its high profitability and consistent cash generation capacity.
As part of an initiative to improve its competitive edge through the creation of synergy with the ABS/eP business and vertical integration, LG Chem took over the remaining residual equity from LG DoW Polycarbonate Ltd., which, up until then, had been co-managed along with DoW. Furthermore, LG Chem signed additional contracts with major automakers that included Renault, Volvo, Ford, GM, Hyundai, and Kia, bringing LG Chem one step closer to fully realizing future growth engines. With its stock price up 71 percent since the end of 2009, LG Chem has positioned itself as Korea’s top chemical company and one of the country’s top five companies in terms of market capitalization.
In 2011, the business environment is expected to be challenging, as interest rate hikes are expected, the Korean won is forecast to appreciate, and oil prices are set to go up amid uncertainties in the Middle east.
As LG Chem’s CFo, I am committed to ensuring that the company continues on its current trajectory and with just as many formidable achievements in 2011 as in the year prior. While aiming to create a synergy effect between business operations and management, we also hope to maintain the financial stability and efficient risk management worthy of a leading global company. Consequently, we are maximizing our support for new business sectors, such as our automotive battery and LCD glass businesses, helping to accelerate their growth in line with the company’s traditional core divisions. To accomplish this, we have come up with the following initiatives to focus on in 2011.
Respected shareholders and customers:
15
First, LG Chem’s quick growth has given rise to the importance of stably managing its working capital to ensure a sound financial structure. By sustaining constant cash flow through systematic working capital management, we will further improve our financial structure while matching global standards in accounting and financial statements by adhering to the IFRS standards which LG Chem adopted in 2010 to realize our vision of becoming a leading global company.
In fact, even with our increased investment in new growth engine businesses, LG Chem’s total liability-to-equity ratio stood at 61.6 percent and its debt-to-equity ratio stood at 20.7 percent as of the end of 2010, an improvement of 16.1 percentage points and 10.2 percentage points, respectively, compared to 2009. In 2011 we are committed to continuing our efforts to establish a healthy financial structure.
Second, LG Chem will concentrate on striking the right balance between our investments in future growth engines and current financial stability, as we continue investing in the securement of future growth engines. Additionally, we expect to see substantial achievements in our automotive business in 2011.
As a result, additional investment plans are already in place for the IT & electronic Materials Division, including the automotive battery business, the LCD glass business, and the consumer battery business. Moreover, LG Chem will expand its highly profitable synthetic rubber and SAP capacity in the Petrochemicals Division in an effort to differentiate LG Chem’s strengths from its competitors.
LG Chem plans to increase overall investment by approximately 40 percent compared with the previous year, to KRW 2.4 trillion, a large portion of which has been assigned to
strategic businesses for future growth. I believe such investments will greatly contribute to an increase in profits and the sustainable growth of LG Chem in the long run.
In addition, I will make investment decisions that will be carried out within the cash flow created from operating activities after thoroughly scrutinizing investment priorities and conducting feasibility studies. I will also further intensify the monitoring of investments that have already been made.
message from
the CFo
LG Chem was able to continue laying the groundwork on its way to becoming a leading global company
based on demand steadily increasing in emerging markets.

16
LG C
hem
Ann
ual R
epor
t 201
0
Third, LG Chem will improve its global internal control process by running overseas subsidiaries in a more systematic manner. Today, both our overseas production base and customer base are expanding at a brisk pace and in proportion to our growth as a leading global company.
By diversifying our business portfolio, from petrochemicals based around China and other Asian countries to the IT & electronic Materials Division, LG Chem’s overseas business grew in scope and became more varied this past year. one example of this has been our investment in a factory for automotive batteries in the U.S.
We are also planning to enhance the systematic monitoring of our overseas business, while doing everything we can to minimize risks in capital management, bond management, and insurance.
Finally, we will maximize shareholder value. In spite of the delayed global economic recovery in 2010, LG Chem’s stock price still rose significantly due to our future growth engine plans, which include automotive batteries and LCD glass, and LG Chem’s traditional core businesses, which saw revived demand in newly emerging markets. As a reflection of such solid growth, dividends for 2010 increased by KRW 500 per share, to KRW 4,000 for common shares and KRW 4,050 for preferred shares.
Nevertheless, we are expecting stock markets to be highly volatile in 2011 because of persistent instability in the Middle east, projected austerity measures from the Chinese government, and a global recession in the aftermath of the devastating earthquake and tsunami in Japan. However, we do believe that LG Chem will gain significant market valuation
to match its status as leading technology company that realizes customer value if we can maintain our excellent business results in competitive core businesses and normalize new businesses early on.
every employee at LG Chem, including senior management, will do their utmost to further enhance shareholder value, while proactively reflecting investors’ opinions in our business operations.
As a result of all our efforts, LG Chem won a top prize at the 10th Korean IR Awards last year. In 2011, we will continue to engage in more active communication with investors and IR activities, securing the trust of investors as a company they want to invest in.
suk-jeh Cho I President & CFo
We will continue to engage in more active communication with investors and IR activities, securing
the trust of investors as a company they want to invest in.

17
www.samil.comLS Yongsan Tower, 191, Hangangno 2-ga,
Yongsan-gu Seoul 140-702, KoReA(Yongsan P.o. Box 266, 140-600)
We have audited the accompanying consolidated statements of financial position of LG Chem, Ltd. and its subsidiaries (collectively the “Company”) as of December 31, 2010 and 2009, and the related consolidated statements of income, comprehensive income, changes in shareholders’ equity and cash flows for the years then ended, expressed in Korean won. These consolidated financial statements are the responsibility of the Company’s management. our responsibility is to express an opinion on these consolidated financial statements based on our audits. We did not audit the financial statements of Ningbo LG Yongxing Chemical Co., Ltd. and certain other consolidated subsidiaries, whose financial statements represent 22% of the Company’s consolidated total assets as of December 31, 2010 (2009: 18%), and represent 22% of the Company’s consolidated total revenue for the year ended December 31, 2010 (2009: 17%). These financial statements were audited by other auditors whose reports have been furnished to us, and our opinion, insofar as it relates to the amounts included for these subsidiaries, is based solely on the reports of the other auditors.
We conducted our audits in conformity with auditing standards generally accepted in the Republic of Korea. Those standards require that we plan and perform the audit to obtain reasonable assurance about whether the financial statements are free of material misstatement. An audit includes examining, on a test basis, evidence supporting the amounts and disclosures in the financial statements. An audit also includes assessing the accounting principles used and significant estimates made by management, as well as evaluating the overall financial statement presentation. We believe that our audits and the reports of the other auditors provide a reasonable basis for our opinion.
In our opinion, based on our audits and the reports of other auditors, the consolidated financial statements referred to above present fairly, in all material respects, the financial position of LG Chem, Ltd. and its subsidiaries as of December 31, 2010 and 2009, and the results of their operations, change in its shareholders’ equity and their cash flows for the years then ended in conformity with International Financial Reporting Standards as adopted by the Republic of Korea (“Korean IFRS”).
Auditing standards and their application in practice vary among countries. The procedures and practices used in the Republic of Korea to audit such consolidated financial statements may differ from those generally accepted and applied in other countries. Accordingly, this report is for use by those who are informed about Korean auditing standards and their application in practice.
This report is effective as of March 10, 2011, the audit report date. Certain subsequent events or circumstances, which may occur between the audit report date
and the time of reading this report, could have a material impact on the accompanying consolidated financial statements and notes thereto. Accordingly, the
readers of the audit report should understand that there is a possibility that the above audit report may have to be revised to reflect the impact of such subsequent
events or circumstances, if any.
RePoRt oF indePendent AuditoRs
Report of Independent A
uditors
Seoul, KoreaMarch 11, 2010
To the Board of Directors and Shareholders of LG Chem, Ltd.

18
LG C
hem
Ann
ual R
epor
t 201
0
(in millions of Korean won)
* The accompanying notes are an integral part of these consolidated financial statements.
ConsoLidAted stAtements oF FinAnCiAL Position deCembeR 31, 2010 And 2009, And jAnuARy 1, 2009
Assets
Current assets
Cash and cash equivalents
Trade receivables
other receivables
Prepaid income taxes
other financial assets
other current assets
Inventories
Total current assets
Non-current assets
Trade receivables
other receivables
other financial assets
Investments in associates
Deferred income tax assets
Property, plant and equipment
Intangible assets
other non-current assets
Total non-current assets
Total assets
Liabilities and equity
Current liabilities
Trade payables
other payables
Borrowings
other financial liabilities
Provisions
Current income tax liabilities
other current liabilities
Total current liabilities
Non-current liabilities
other payables
Borrowings
other financial liabilitiess
Defined benefit liability
Deferred income tax liabilities
other non-current liabilities
Total non-current liabilities
Total liabilities
december 31, 2009
₩ 1,106,596
2,285,743
165,666
4,072
378
117,121
1,597,571
₩ 5,277,147
40
20,026
22,179
219,505
16,333
4,775,350
162,159
37,853
5,253,445
₩ 10,530,592
1,095,966
679,155
1,832,657
39
5,293
200,295
93,433
₩ 3,906,838
29,485
577,917
35,024
54,389
-
250
697,065
₩ 4,603,903
january 1, 2009
₩ 513,664
1,992,788
222,702
-
-
95,518
1,808,792
₩ 4,633,464
220
31,946
53,961
241,629
46,405
4,988,332
188,864
55,431
5,606,788
₩ 10,240,252
595,270
633,015
1,986,376
-
-
357,809
90,040
₩ 3,662,510
5,881
1,135,841
26,961
65,372
-
37
1,234,092
₩ 4,896,602
december 31, 2010
₩ 1,368,034
2,529,962
78,015
3,379
2,194
127,609
2,182,484
₩ 6,291,677
-
20,737
4,183
213,572
45,289
5,872,040
180,115
45,846
6,381,782
₩ 12,673,459
1,302,563
821,435
1,620,581
20,535
4,949
409,658
97,671
₩ 4,277,392
47,792
480,510
1,545
8,136
14,249
-
552,232
₩ 4,829,624
notes
3, 6, 7
3, 6, 8, 35
3, 6, 8
3, 6, 9
16
12
3, 6, 8
3, 6, 8
3, 6, 9
1, 5, 13
31
14
15
16
3, 6, 35
3, 6, 35
3, 6, 17
3, 6, 9
18
31
20
3, 6, 35
3, 6, 17
3, 6, 9
19
31

19
(in millions of Korean won)
* The accompanying notes are an integral part of these consolidated financial statements.
ConsoLidAted stAtements oF FinAnCiAL Position deCembeR 31, 2010 And 2009, And jAnuARy 1, 2009
Financial statements
equity
equity attributable to owners of the parent
share capital
Capital surplus
other components of equity
Accumulated other comprehensive income(expense)
Retained earnings
Non-controlling interests
Total equity
Total liabilities and equity
december 31, 2009
₩ 369,500
1,157,736
(479,564)
(74,557)
₩ 4,836,099
5,809,214
117,475
5,926,689
₩ 10,530,592
january 1, 2009
₩ 419,500
1,314,549
(14,600)
(18,385)
₩ 3,544,810
5,245,874
97,776
5,343,650
₩ 10,240,252
december 31, 2010
₩ 369,500
1,157,772
(15,699)
(62,017)
₩ 6,253,917
7,703,473
140,362
7,843,835
₩ 12,673,459
notes
1, 22
24
23

20
LG C
hem
Ann
ual R
epor
t 201
0
ConsoLidAted stAtements oF inCome yeARs ended deCembeR 31, 2010 And 2009
(in millions of Korean won, except per share amounts)
Revenue
Cost of sales
Gross profit
Selling, general and administrative expenses
other operating income
other operating expenses
operating profit
Non-operating income/expenses
Financial income
Financial expenses
share of profit of associates
other non-operating expenses
Profit before Income tax
Income tax expense
Profit from continuing operations
Loss from discontinued operations
Profit for the year
Attributable to:
owners of the parent
non-controlling interests
earnings per share for profit attributable
to owners of the parent company (in won)
earnings per share for profit attributable to
the ordinary equity holders of the company
Basic and diluted earnings per share
for profit from continuing operations
Basic and diluted earnings per share
for profit for the year
earnings per share for profit attributable to
the preferred equity holders of the company
Basic and diluted earnings per share
for profit from continuing operations
Basic and diluted earnings per share
for profit for the year
2009
₩ 15,520,813
(12,260,974)
3,259,839
(1,018,421)
526,684
(670,353)
₩ 2,097,749
184,729
(236,005)
(19,842)
(11,239)
₩ (82,357)
2,015,392
(443,179)
1,572,213
(33,016)
₩ 1,539,197
1,508,546
30,651
20,274
19,846
20,322
₩ 19,894
2010
₩ 19,471,450
(15,472,600)
3,998,850
(1,158,929)
445,585
(464,178)
₩ 2,821,328
137,481
(182,931)
55,459
(12,900)
₩ (2,891)
2,818,437
(618,672)
2,199,765
-
₩ 2,199,765
2,158,256
41,509
29,345
29,345
29,395
₩ 29,395
notes
5, 35
26, 35
25, 26, 35
28
26, 29
5
5, 30
5, 30
5, 13
5
31
34
32
* The accompanying notes are an integral part of these consolidated financial statements.

21
Financial statements
ConsoLidAted stAtements oF ComPRehensiVe inCome yeARs ended deCembeR 31, 2010 And 2009
(in millions of Korean won)
Profit for the year
other comprehensive income
Actuarial loss on defined benefit liability
Currency translation differences
Cash flow hedges
others
Income tax effect relating to components of
other comprehensive income
other comprehensive income for the year, net of tax
Total comprehensive income for the year
Attributable to:
owners of the parent
non-controlling interests
2009
₩ 1,539,197
(10,272)
(55,678)
12,488
(15,072)
(2,018)
₩ (70,552)
₩ 1,468,645
1,448,888
₩ 19,757
2010
₩ 2,199,765
(17,771)
7,390
5,795
798
828
₩ (2,960)
₩ 2,196,805
2,154,721
₩ 42,084
notes
19
* The accompanying notes are an integral part of these consolidated financial statements.

22
LG C
hem
Ann
ual R
epor
t 201
0
* The accompanying notes are an integral part of these consolidated financial statements.
ConsoLidAted stAtements oF ChAnGes in shARehoLdeRs' eQuityyeARs ended deCembeR 31, 2010 And 2009
(in millions of Korean won)
Balance at January 1, 2009
Comprehensive income:
Profit for the year
Actuarial loss on defined
benefit liability
Currency translation
differences
Cash flow hedges
others, net of tax
Total comprehensive income
Transactions with owners:
Fair value of non-cash assets
distributed due to spin-off
Purchase of treasury share
Disposal of treasury share
Dividends
Acquisition of subsidiary
others
Total transactions with
owners
Balance at December 31,
2009
Balance at January 1, 2010
Comprehensive income:
Profit for the year
Actuarial loss on defined
benefit liability
Currency translation
differences
Cash flow hedges
others, net of tax
Total comprehensive income
Transactions with owners:
Loss on capital reduction
Dividends
others
Total transactions with
owners
Balance at December 31,
2010
notes
19
22
22
19
shareCapita
₩419,500
-
-
-
-
-
-
(50,000)
-
-
-
-
-
₩(50,000)
₩369,500
369,500
-
-
-
-
-
-
-
-
-
-
₩369,500
Capital surplus
₩1,314,549
-
-
-
-
-
-
(155,216)
-
-
-
-
(1,597)
₩(156,813)
₩1,157,736
1,157,736
-
-
-
-
-
-
-
-
36
36
₩1,157,772
₩(14,600)
-
-
-
-
-
-
(464,272)
(2,293)
1,785
-
-
(184)
₩(464,964)
₩(479,564)
(479,564)
-
-
-
-
-
-
464,272
-
(407)
463,865
₩(15,699)
Retained earnings
₩3,544,810
1,508,546
(8,058)
-
-
-
₩1,500,488
-
-
-
(209,202)
-
3
₩(209,199)
₩4,836,099
4,836,099
2,158,256
(16,075)
-
-
-
₩2,142,181
(464,272)
(257,752)
(2,339)
(724,363)
₩6,253,917
total
₩5,245,874
1,508,546
(8,058)
(45,830)
8,735
(14,505)
₩1,448,888
(674,060)
(2,293)
1,785
(209,202)
-
(1,778)
₩(885,548)
₩5,809,214
5,809,214
2,158,256
(16,075)
7,056
4,571
913
₩2,154,721
-
(257,752)
(2,710)
(260,462)
₩7,703,473
₩97,776
30,651
-
(10,075)
-
(819)
₩19,757
(6,008)
-
-
(1,392)
6,925
417
₩(58)
₩117,475
117,475
41,509
-
575
-
-
₩42,084
-
(22,217)
3,020
(19,197)
₩140,362
totalequity
₩5,343,650
1,539,197
(8,058)
(55,905)
8,735
(15,324)
₩1,468,645
(680,068)
(2,293)
1,785
(210,594)
6,925
(1,361)
₩(885,606)
₩5,926,689
5,926,689
2,199,765
(16,075)
7,631
4,571
913
₩2,196,805
-
(279,969)
310
(279,659)
₩7,843,835
₩(18,385)
-
-
(45,830)
8,735
(14,505)
₩(51,600)
(4,572)
-
-
-
-
-
₩(4,572)
₩(74,557)
(74,557)
-
-
7,056
4,571
913
₩12,540
-
-
-
-
₩(62,017)
other Components
of equity
non-controllinginterests
Accumulatedother
Comprehensiveincome
Attributable to owners of the parent

23
Financial statements
* The accompanying notes are an integral part of these consolidated financial statements.
ConsoLidAted stAtements oF CAsh FLows yeARs ended deCembeR 31, 2010 And 2009
(in millions of Korean won)
Cash flows from operating activities
Cash generated from operations
Interest received
Interest paid
Dividends received
Income taxes paid
Net cash generated from operating activities
Cash flows from investing activities
Decrease in other receivables
Decrease in non-current other receivables
Decrease in non-current other financial assets
Proceeds from disposal of property, plant and equipment
Proceeds from disposal of intangible assets
Decrease in other non-current assets
Increase in other receivables
Increase in non-current other receivables
Increase in non-current other financial assets
Acquisition of subsidiary, net of cash acquired
Acquisition of investments in associates
Purchases of property, plant and equipment
Purchases of intangible assets
Increase in other non-current assets
Net cash used in investing activities
Cash flows from financing activities
Proceeds from borrowings
Proceeds from issuance of debentures
Proceeds from settlement of derivatives
Capital increase from non-controlling interests
Repayments of borrowings
Purchase of treasury shares
Dividends
Net cash used in financing activities
Cash flows from spin-off
Net increase in cash and cash equivalents
Cash and cash equivalents at beginning of the year
exchange gains on cash and cash equivalents
Cash and cash equivalents at the end of the year
2009
₩ 2,886,497
24,018
(115,004)
1,408
(585,814)
₩ 2,211,105
150,632
3,402
7,250
37,271
727
229
(106,798)
(4,530)
(3,893)
-
(20,146)
(1,099,333)
(23,543)
(173)
₩ (1,058,905)
142,285
298,653
28,442
6,925
(598,743)
(2,293)
(210,584)
₩ (335,315)
(231,391)
585,494
513,664
7,438
₩ 1,106,596
2010
₩ 2,985,720
25,547
(81,889)
1,196
(423,384)
₩ 2,507,190
285,614
7,869
617
5,080
182
-
(189,958)
(13,023)
(612)
(61,972)
(14,210)
(1,617,231)
(24,304)
-
₩ (1,621,948)
231,776
-
-
3,437
(579,627)
-
(279,988)
₩ (624,402)
-
260,840
1,106,596
598
₩ 1,368,034
notes
36
37

24
LG C
hem
Ann
ual R
epor
t 201
0
deCembeR 31, 2010 And 2009, And jAnuARy 1, 2009
notes to the ConsoLidAted FinAnCiAL stAtements
1. GeneRAL inFoRmAtionGeneral information about LG Chem, Ltd. (the “Parent Company”) and its subsidiaries (collectively “the Company”) is as follows:
1.1 the PARent ComPAnyThe Parent Company was spun off on April 1, 2001, from LG Chem Investment Ltd. (formerly LG Chemical Ltd.), engaged in the petrochemicals, industrial materials, and information and electronic materials business. It completed its registration process on April 3, 2001. The Parent Company’s shares have been listed on the Korea Stock exchange since April 25, 2001.
The Parent Company merged with LG Daesan Petrochemical Ltd. on January 1, 2006, and with LG Petrochemical Co., Ltd. on November 1, 2007, and spun off its Industrial Materials segment to LG Hausys, Ltd. on April 1, 2009.
As of December 31, 2010, the Parent Company has its manufacturing facilities in Yeosu, Cheongju, Ulsan, Naju, Iksan, Daesan, ochang and Gimcheon.
The Parent Company is authorized to issue 292 million shares of ordinary shares with par value of ₩5,000 per share. As of December 31, 2010, the Parent Company has issued 66,271,100 ordinary shares (₩331,356 million) and 7,628,921 preferred shares (₩38,144 million). The largest shareholder of the Parent Company is LG Corp., which owns 33.53% of the Parent Company’s ordinary shares. Preferred shareholders have no voting rights but are entitled to receive dividends at a rate 1% more than those paid to ordinary shareholders.
1.2 business oVeRViewThe Company is engaged in petrochemicals business, and information and electronic materials business. The Company is also engaged in the manufacturing and distribution of medium and large-sized batteries for electric vehicles.
Petrochemical business is an upstream supplier of raw materials and a large processing industry that produces, mainly using Naphtha, a variety of primary petrochemicals and their derivatives such as ethylene, propylene, butadiene (olefin petrochemicals) and benzene, xylene, toluene, and others (aromatic petrochemicals), as well as synthetic resin, synthetic rubber and synthetic components made from these primary petrochemicals. The Company’s main products are ethylene, polyethylene, propylene, synthetic rubber, polyvinyl chloride (PVC), plasticizer, acrylate, acrylonitrile -butadiene-styrene (ABS), epoxy resin, and others.
Information and electronic materials business manufactures and supplies a variety of display materials such as polarizer, sensitized material, PDP filter and toners along with lithium-ion batteries for cell phone, laptop computers and electric vehicles. Presently, the medium and large battery division for electronic vehicles supplies its products to domestic car manufacturing companies. To maintain its dominant position in the North American battery market, the Company is currently constructing new manufacturing facilities in North America which will manufacture medium and large-sized batteries for HeV / eV. The Company is also preparing the mass production of Liquid Crystal Display Glass based on the source technology licensed from SCHoTT Solar, Inc., a Germany-based company, combining with its high-quality production techniques.
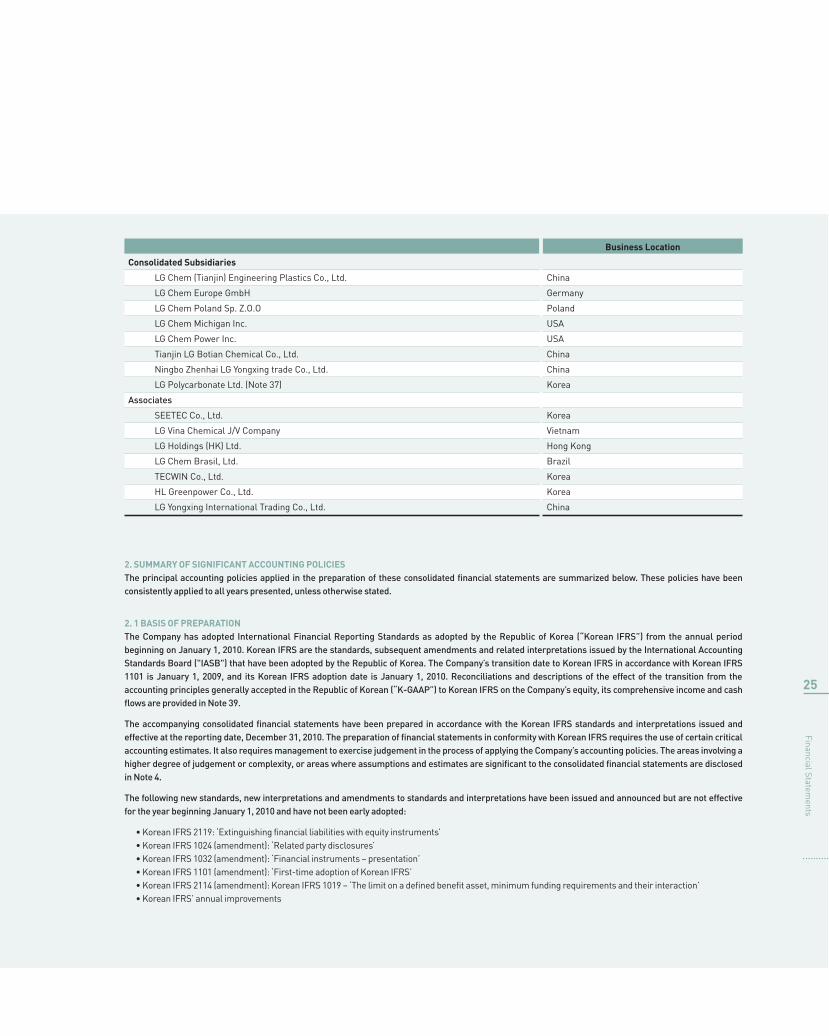
1.3 ConsoLidAted subsidiARies And AssoCiAtesConsolidated subsidiaries and associates are as follows:
Consolidated subsidiaries
Tianjin LG Dagu Chemical Co., Ltd.
ningbo LG Yongxing Chemical Co., Ltd.
LG Chemical hong Kong Ltd.
LG Chem America, Inc.
LG Chemical India Pvt. Ltd.
LG Polymer India Pvt. Ltd.
LG Chemical (Guangzhou) engineering Plastics Co., Ltd.
LG Chem (nanjing) Information & electronics materials Co., Ltd.
LG Chem (Taiwan), Ltd.
LG Chem Display materials (Beijing) Co., Ltd.
Tianjin LG Bohai Chemical Co., Ltd.
LG Chem (China) Investment Co., Ltd.
business Location
China
China
hong Kong
UsA
India
India
China
China
Taiwan
China
China
China
25
Financial statements
2. summARy oF siGniFiCAnt ACCountinG PoLiCiesThe principal accounting policies applied in the preparation of these consolidated financial statements are summarized below. These policies have been consistently applied to all years presented, unless otherwise stated.
2. 1 bAsis oF PRePARAtionThe Company has adopted International Financial Reporting Standards as adopted by the Republic of Korea (“Korean IFRS”) from the annual period beginning on January 1, 2010. Korean IFRS are the standards, subsequent amendments and related interpretations issued by the International Accounting Standards Board ("IASB") that have been adopted by the Republic of Korea. The Company’s transition date to Korean IFRS in accordance with Korean IFRS 1101 is January 1, 2009, and its Korean IFRS adoption date is January 1, 2010. Reconciliations and descriptions of the effect of the transition from the accounting principles generally accepted in the Republic of Korean (“K-GAAP”) to Korean IFRS on the Company’s equity, its comprehensive income and cash flows are provided in Note 39.
The accompanying consolidated financial statements have been prepared in accordance with the Korean IFRS standards and interpretations issued and effective at the reporting date, December 31, 2010. The preparation of financial statements in conformity with Korean IFRS requires the use of certain critical accounting estimates. It also requires management to exercise judgement in the process of applying the Company’s accounting policies. The areas involving a higher degree of judgement or complexity, or areas where assumptions and estimates are significant to the consolidated financial statements are disclosed in Note 4.
The following new standards, new interpretations and amendments to standards and interpretations have been issued and announced but are not effective for the year beginning January 1, 2010 and have not been early adopted:
• Korean IFRs 2119: ‘extinguishing financial liabilities with equity instruments’ • Korean IFRs 1024 (amendment): ‘Related party disclosures’ • Korean IFRs 1032 (amendment): ‘Financial instruments – presentation’ • Korean IFRs 1101 (amendment): ‘First-time adoption of Korean IFRs’• Korean IFRs 2114 (amendment): Korean IFRs 1019 – ‘The limit on a defined benefit asset, minimum funding requirements and their interaction’• Korean IFRs’ annual improvements
Consolidated subsidiaries
LG Chem (Tianjin) engineering Plastics Co., Ltd.
LG Chem europe Gmbh
LG Chem Poland sp. Z.o.o
LG Chem michigan Inc.
LG Chem Power Inc.
Tianjin LG Botian Chemical Co., Ltd.
ningbo Zhenhai LG Yongxing trade Co., Ltd.
LG Polycarbonate Ltd. (note 37)
Associates
seeTeC Co., Ltd.
LG vina Chemical J/v Company
LG holdings (hK) Ltd.
LG Chem Brasil, Ltd.
TeCWIn Co., Ltd.
hL Greenpower Co., Ltd.
LG Yongxing International Trading Co., Ltd.
business Location
China
Germany
Poland
UsA
UsA
China
China
Korea
Korea
vietnam
hong Kong
Brazil
Korea
Korea
China

26
LG C
hem
Ann
ual R
epor
t 201
0
deCembeR 31, 2010 And 2009, And jAnuARy 1, 2009
notes to the ConsoLidAted FinAnCiAL stAtements
2.2 ConsoLidAtionThe Company has prepared the consolidated financial statements in accordance with Korean IFRS 1027, ‘Consolidated and separate financial statements’.
(1) SubsidiariesSubsidiaries are all entities (including special purpose entities) over which the Company has the power to govern the financial and operating policies, generally accompanying a shareholding of more than one half of the voting rights. The existence and effect of potential voting rights that are currently exercisable or convertible are considered when assessing whether the Company controls another company. Subsidiaries are fully consolidated from the date on which control is transferred to the Company. They are de-consolidated from the date that control ceases.
The Company uses acquisition method of accounting to account for business combination. The consideration transferred for the acquisition of a subsidiary is the fair values of the assets transferred, liabilities incurred and equity interests issued by the Company. The consideration transferred includes the fair value of any asset or liability resulting from a contingent consideration arrangement. Acquisition-related costs are expensed as incurred. Identifiable assets acquired and liabilities and contingent liabilities assumed in a business combination are measured initially at their fair values at the acquisition date. on an acquisition-by-acquisition basis, the Company recognizes any non-controlling interest in the acquiree either at fair value or at the non-controlling interest’s proportionate share of the acquiree’s identifiable net assets.
The excess of the consideration transferred, the amount of any non-controlling interest in the acquiree and the acquisition-date fair value of any previous equity interest in the acquiree over the fair value of the Company’s share of the identifiable net assets acquired is recorded as goodwill. If this is less than the fair value of the net assets of the subsidiary acquired in the case of a bargain purchase, the difference is recognized directly in the statement of income.
Inter-company transactions, balances and unrealized gains and losses on transactions between consolidated companies are eliminated. Accounting policies of subsidiaries have been changed where necessary to ensure consistency with policies adopted by the Company.
(2) AssociatesAssociates are all entities over which the Company has significant influence but not control, generally accompanying a shareholding of between 20% and 50% of the voting rights. Investments in associates are accounted for using the equity method of accounting and are initially recognized at cost. The Company’s investment in associates includes goodwill identified on acquisition, net of any accumulated impairment loss (Note 2.15).
The Company’s share of its associates’ post-acquisition profits or losses is recognized in the statement of income, and its share of post-acquisition movements in reserves is recognized in reserves. The cumulative post-acquisition movements are adjusted against the carrying amount of the investment. When the Company’s share of losses in an associate equals or exceeds its interest in the associate, including any other unsecured receivables, the Company does not recognize further losses, unless it has incurred obligations or made payments on behalf of the associate.
Unrealized gains on transactions between the Company and its associates are eliminated to the extent of the Company’s interest in the associates. Unrealized losses are also eliminated unless the transaction provides evidence of an impairment of the asset transferred. Accounting policies of associates have been changed where necessary to ensure consistency with policies adopted by the Company. If the ownership interest in an associate is reduced but significant influence is retained, only a proportionate share of the amounts previously recognized in other comprehensive income are reclassified to profit or loss where appropriate.
(3) Joint ventureA joint venture is a contractual arrangement whereby two or more parties (venturers) undertake an economic activity that is subject to joint control. As with associates, investments in jointly controlled entities are accounted for using the equity method of accounting and are initially recognized at cost. The Company’s investment in jointly controlled entities includes goodwill identified on acquisition, net of any accumulated impairment loss (Note 2.15).
(4) Transactions with non-controlling interestsThe Company treats transactions with non-controlling interests as transactions with equity owners of the Company. For purchases from non-controlling interests, the difference between any consideration paid and the relevant share acquired of the carrying value of net assets of the subsidiary is recorded in equity. Gains and losses on disposals to non-controlling interests are also recognized in equity. When the Company ceases to have control, any retained interest in the entity is remeasured to its fair value, with the change in carrying amount recognized in profit or loss.
2.3 seGment RePoRtinGoperating segments are reported in a manner consistent with the internal reporting provided to the chief operating decision-maker. The chief operating decision-maker, who is responsible for allocating resources and assessing performance of the operating segments, has been identified as the Corporate Management Committee that makes strategic decisions.

27
Financial statements
2.4 FoReiGn CuRRenCy tRAnsLAtion(1) Functional and presentation currencyItems included in the financial statements of each of the Company’s entities are measured using the currency of the primary economic environment in which the entity operates (‘the functional currency’). The consolidated financial statements are presented in ‘Korean won’, which is the Parent Company’s functional and the Company’s presentation currency.
(2) Transactions and balancesForeign currency transactions are translated into the functional currency using the exchange rates prevailing at the dates of the transactions or valuation where items are re-measured. Foreign exchange gains and losses resulting from the settlement of such transactions and from the translation at year-end exchange rates of monetary assets and liabilities denominated in foreign currencies are recognized in the statement of income.
Foreign exchange gains and losses that relate to borrowings and cash and cash equivalents are presented in the statement of income within ‘financial income or expenses’. All other foreign exchange gains and losses are presented in the statement of income within ‘other operating income or expenses’.
Changes in the fair value of monetary securities denominated in foreign currency classified as available-for-sale are analyzed between translation differences resulting from changes in the amortized cost of the security and other changes in the carrying amount of the security. Translation differences related to changes in amortized cost are recognized in profit or loss, and other changes in carrying amount are recognized in other comprehensive income.
Translation differences on non-monetary financial assets and liabilities, such as equities held at fair value through profit or loss, are recognized in the statement of income as part of the fair value gain or loss. Translation differences on non-monetary financial assets, such as equities classified as available-for-sale, are included in other comprehensive income.
(3) Consolidated companiesThe results and financial position of all the consolidated entities that have a functional currency different from the presentation currency are translated as follows:
i) Assets and liabilities for each statement of financial position presented are translated at the closing rate at the date of that statement of financial position;ii) Income and expenses for each statement of income are translated at average exchange rates (unless this average is not a reasonable approximation of the cumulative effect of the rates prevailing on the transaction dates, in which case income and expenses are translated at the rate on the dates of the transactions); andiii) All resulting exchange differences are recognized in other comprehensive income.
on consolidation, exchange differences arising from the translation of the net investment in foreign operations, and of borrowings and other currency instruments designated as hedges of such investments, are taken to other comprehensive income. When the Company ceases to control the subsidiary including foreign operations, accumulated exchange differences that were recorded in equity are recognized in the statement of income as part of the gain or loss on sale.
Goodwill and fair value adjustments arising on the acquisition of a foreign entity are treated as assets and liabilities of the foreign entity and translated at the closing rate.
2.5 CAsh And CAsh eQuiVALentsCash and cash equivalents includes cash in hand, deposits held at call with banks, other short-term highly liquid investments with original maturities of three months or less.
2.6 FinAnCiAL instRuments
2.6.1 CLAssiFiCAtionThe Company classifies its financial instruments in the following categories: financial assets and liabilities at fair value through profit or loss, loans and receivables, available-for-sale financial assets, held-to-maturity investments, and other financial liabilities at amortized cost. The classification depends on the purpose for which the financial instruments were acquired and the nature of the instruments. Management determines the classification of its financial instruments at initial recognition.
(1) Financial assets and liabilities at fair value through profit or lossFinancial assets and liabilities at fair value through profit or loss are financial instruments held for trading. Financial assets and liabilities are classified in this category if acquired or incurred principally for the purpose of selling or repurchasing it in the near term. Derivatives that are not subject to hedge accounting and financial instruments having embedded derivatives are also included in this category.

28
LG C
hem
Ann
ual R
epor
t 201
0
deCembeR 31, 2010 And 2009, And jAnuARy 1, 2009
notes to the ConsoLidAted FinAnCiAL stAtements
(2) Loans and receivablesLoans and receivables are non-derivative financial assets with fixed or determinable payments that are not quoted in an active market. They are included in current assets, except for maturities greater than 12 months after the end of the reporting period. These are classified as non-current assets. The Company’s loans and receivables are presented as ‘cash and cash equivalents’, ‘trade receivables’, and ‘other receivables’ in the statement of financial position.
(3) Held-to-maturity financial assetsHeld-to-maturity financial assets are non-derivative financial assets with fixed or determinable payments and fixed maturities that the Company’s management has the positive intention and ability to hold to maturity. Held-to-maturity financial assets are included in non-current assets, except for those with maturities less than 12 months from the end of the reporting period, which are classified as current assets.
(4) Available-for-sale financial assetsAvailable-for-sale financial assets are non-derivatives that are either designated in this category or not classified in any of the other categories. They are included in non-current assets unless the investment matures or management intends to dispose of it within 12 months of the end of the reporting period. The Company’s available-for-sale financial assets are included in ‘other financial assets’ in the statement of financial position.
(5) Financial liabilities measured at amortized costThe Company classifies non-derivative financial liabilities as financial liabilities measured at amortized cost except for financial liabilities at fair value through profit or loss or financial liabilities that arise when a transfer of a financial asset does not qualify for derecognition. In this case the transferred asset continues to be recognised and a financial liability is measured as the consideration received. Financial liabilities measured at amortized cost are included in non-current liabilities, except for maturities less than 12 months after the end of the reporting period, which are classified as current liabilities.
2.6.2 ReCoGnition And meAsuRementRegular purchases and sales of financial assets are recognized on the trade date, the date on which the Company commits to purchase or sell the asset. Investments are initially recognized at fair value plus transaction costs for all financial assets not carried at fair value through profit or loss. Financial assets carried at fair value through profit or loss is initially recognized at fair value, and transaction costs are expensed in the statement of income. Financial assets are derecognized when the rights to receive cash flows from the investments have been expired or have been transferred and the Company has transferred substantially all risks and rewards of ownership. Available-for-sale financial assets and financial assets at fair value through profit or loss are subsequently carried at fair value. Loans and receivables are subsequently carried at amortized cost using the effective interest method.
Gains or losses arising from changes in the fair value of the financial assets at fair value through profit or loss category are presented in the statement of income within ‘financial income or expenses’ in the period in which they arise. Dividend income from financial assets at fair value through profit or loss is recognized in the statement of income when the Company’s right to receive payments is established.
Changes in the fair value of monetary and non-monetary securities classified as available-for-sale financial assets are recognized in ‘other comprehensive income’. When securities classified as available-for-sale financial assets are sold or impaired, the accumulated fair value adjustments recognized in equity are recognized in the statement of income.
Interest on available-for-sale financial assets calculated using the effective interest method is recognized in the statement of income as part of ‘financial income’. Dividends on available-for-sale equity instruments are recognized in the statement of income as part of ‘financial income’ when the Company’s right to receive payments is established.
2.6.3 oFFsettinG FinAnCiAL instRumentsFinancial assets and liabilities are offset and the net amount is reported in the statement of financial position when there is a legally enforceable right to offset the recognized amounts and there is an intention to settle on a net basis, or realize the asset and settle the liability simultaneously.
2.6.4 imPAiRment oF FinAnCiAL Assets(1) Assets carried at amortized costThe Company assesses at the end of each reporting period whether there is objective evidence that a financial asset or a group of financial assets is impaired. A financial asset or a group of financial assets is impaired and impairment losses are incurred only if there is objective evidence of impairment as a result of one or more events that occurred after the initial recognition of the asset (a ‘loss event’) and that loss event (or events) has an impact on the estimated future cash flows of the financial asset or group of financial assets that can be reliably estimated.
29
Financial statements
The criteria that the Company uses to determine that there is objective evidence of an impairment loss include:- significant financial difficulty of the issuer or obligor;- A breach of contract, such as a default or delinquency in interest or principal payments;- For economic or legal reasons relating to the borrower’s financial difficulty, granting to the borrower a concession that the lender would not otherwise consider;- It becomes probable that the borrower will enter bankruptcy or other financial reorganization;- The disappearance of an active market for that financial asset because of financial difficulties; or- observable data indicating that there is a measurable decrease in the estimated future cash flows from a portfolio of financial assets since the initial recognition of those assets, although the decrease cannot yet be identified with the individual financial assets in the portfolio, including:
1) Adverse changes in the payment status of borrowers in the portfolio; and2) national or local economic conditions that correlate with defaults on the assets in the portfolio.
The Company first assesses whether objective evidence of impairment exists.
The amount of the loss is measured as the difference between the asset’s carrying amount and the present value of estimated future cash flows (excluding future credit losses that have not been incurred) discounted at the financial asset’s original effective interest rate. The carrying amount of the asset is reduced and the amount of the loss is recognized in the statement of income. If a loan and receivable or held-to-maturity financial asset has a variable interest rate, the discount rate for measuring any impairment loss is the current effective interest rate determined under the contract. As a practical expedient, the Company may measure impairment on the basis of an instrument’s fair value using an observable market price.
If, in a subsequent period, the amount of the impairment loss decreases and the decrease can be related objectively to an event occurring after the impairment was recognized (such as an improvement in the debtor’s credit rating), the reversal of the previously recognized impairment loss is recognized in the statement of income.
(2) Assets classified as available for saleThe Company assesses at the end of each reporting period whether there is objective evidence that a financial asset or a group of financial assets is impaired. For debt securities, the Company uses the criteria provided in (1) above. In the case of equity investments classified as available-for-sale financial assets, a significant or prolonged decline in the fair value of the security below its cost is also evidence that the assets are impaired. If such evidence exists for available-for-sale financial assets, the cumulative loss-measured as the difference between the acquisition cost and the current fair value, less any impairment loss on that financial asset previously recognized in profit or loss, is removed from equity and recognized in the statement of income. Impairment losses recognized in the statement of income on equity instruments are not reversed through the statement of income. If, in a subsequent period, the fair value of a debt instrument classified as available-for-sale financial assets increases and the increase can be objectively related to an event occurring after the impairment loss was recognized in profit or loss, the impairment loss is reversed through the statement of income.
2.7 deRiVAtiVe FinAnCiAL instRuments Derivatives are initially recognized at fair value on the date a derivative contract is entered into and are subsequently re-measured at their fair value. The resulting gain or loss is recognized in the statement of income within ‘other operating income and expenses’ or ‘financial income or expenses’ depending on the nature of transactions.
The effective portion of changes in the fair value of derivatives that are designated and qualified as cash flow hedges is recognized in other comprehensive income. The gain or loss relating to the ineffective portion is recognized immediately in the statement of income within ‘other operating income or expenses’ or ‘financial income or expenses’.
Amounts accumulated in equity are reclassified as profit or loss in the periods when the hedged item affects profit or loss. When a forecast transaction is no longer expected to occur, the cumulative gain or loss that was reported in equity is immediately transferred to the statement of income within ‘other operating income or expenses’ or ‘financial income or expenses’.
2.8 tRAde ReCeiVAbLesTrade receivables are amounts due from customers for merchandise sold or services performed in the ordinary course of business. If collection is expected in one year or less, they are classified as current assets. If not, they are presented as non-current assets.
Trade receivables are recognized initially at fair value and subsequently measured at amortized cost using the effective interest method, less provision for impairment.

30
LG C
hem
Ann
ual R
epor
t 201
0
deCembeR 31, 2010 And 2009, And jAnuARy 1, 2009
notes to the ConsoLidAted FinAnCiAL stAtements
The assets’ residual values and useful lives are reviewed, and adjusted if appropriate, at the end of each reporting period. An asset’s carrying amount is written down immediately to its recoverable amount if the asset’s carrying amount is greater than its estimated recoverable amount (Note 2.15). Gains or losses on disposals are determined by comparing the proceeds with the carrying amount and are recognized within ‘other operating income or expenses’ in the statement of income.
2.11 boRRowinG CostsThe Company capitalizes borrowing costs that are directly attributable to the acquisition or construction of a qualifying asset as part of the cost of that asset during the period to prepare the asset for its intended use. The Company recognizes other borrowing costs as an expense in the period in which it incurs them.
2.12 GoVeRnment GRAntsGrants from the government are recognized at their fair value where there is a reasonable assurance that the grant will be received and the Company will comply with all attached conditions.
Government grants relating to costs are deferred and recognized in the statement of income over the period necessary to match them with the costs that they are intended to compensate.
Government grants relating to property, plant and equipment are presented as a deduction of related assets and are credited to depreciation over the estimated useful lives of the related assets.
2.13 intAnGibLe Assets(1) GoodwillGoodwill relating to the acquisition of subsidiary is included in intangible assets and goodwill relating to the acquisition of associates is included in “investments in associates”. Goodwill is tested annually for impairment and carried at cost less accumulated impairment losses. Impairment losses on goodwill are not reversed.
(2) Industrial property rightsIndustrial property rights are shown at historical cost. Industrial property rights have a finite useful life and are carried at cost less accumulated amortization. Amortization is calculated using the straight-line method to allocate the cost of industrial property rights over their estimated useful lives of five to ten years.
2.9 inVentoRiesInventories are stated at the lower of cost and net realizable value. Cost is determined using weighted average cost method except goods in transit which is determined using the specific identification method. The cost of finished goods and work in progress comprises raw materials, direct labor, other direct costs and related production overheads based on normal operating capacity. It excludes borrowing costs. Net realizable value is the estimated selling price in the ordinary course of business, less applicable variable selling expenses.
2.10 PRoPeRty, PLAnt And eQuiPmentAll property, plant and equipment are stated at historical cost or deemed cost less depreciation. Historical cost or deemed cost includes expenditure that is directly attributable to the acquisition of the items.
Subsequent costs are included in the asset’s carrying amount or recognized as a separate asset, as appropriate, only when it is probable that future economic benefits associated with the item will flow to the Company and the cost of the item can be measured reliably. The carrying amount of the replaced part is derecognized. All other repairs and maintenance are charged to the statement of income during the financial period in which they are incurred.
Land is not depreciated. Depreciation on other assets is calculated using the straight-line method to allocate their cost less residual values over their estimated useful lives, as follows:
Buildings
structures
machinery
others
estimated useful lives
25 - 50 years
15 - 50 years
6 - 15 years
1 - 6 years

31
Financial statements
(3) other intangible assetsother intangible assets such as software which meet the definition of an intangible asset are amortized using the straight-line method over their estimated useful lives of six to 20 years when the assets are available for use. Membership rights are regarded as intangible assets with indefinite useful lives and not amortized as there is no foreseeable limit to the period over which the asset is expected to generate net cash inflows for the entity. All membership rights are tested annually for impairment and stated at cost less accumulated impairment losses.
2.14 ReseARCh And deVeLoPmentCosts associated with research are recognized as an expense as incurred. Costs that are identifiable, controllable and directly attributable to development projects are recognized as intangible assets when the following criteria are met:
- It is technically feasible to complete the development project so that it will be available for use;- management intends to complete the development project and use or sell it;- There is an ability to use or sell the development project;- It can be demonstrated how the development project will generate probable future economic benefits;- Adequate technical, financial and other resources to complete the development and to use or sell the development project are available; and- The expenditure attributable to the development project during its development can be reliably measured.
other development expenditures that do not meet these criteria are recognized as an expense as incurred. Development costs previously recognized as an expense are not recognized as an asset in a subsequent period. Capitalized development costs that are recognized as intangible assets are amortized using the straight-line method over their estimated useful lives of three to six years when the assets are available for use and are tested for impairment.
2.15 imPAiRment oF non-FinAnCiAL AssetsAssets that have an indefinite useful life, for example goodwill, are not subject to amortization and are tested annually for impairment. Assets that are subject to amortization are reviewed for impairment whenever events or changes in circumstances indicate that the carrying amount may not be recoverable. An impairment loss is recognized for the amount by which the asset’s carrying amount exceeds its recoverable amount. The recoverable amount is the higher of an asset’s fair value less costs to sell and value in use. For the purposes of assessing impairment, assets are grouped at the lowest levels for which there are separately identifiable cash flows (cash-generating units). Non-financial assets other than goodwill that suffered impairment are reviewed for possible reversal of the impairment at each reporting date.
2.16 tRAde PAyAbLesTrade payables are obligations to pay for goods or services that have been acquired in the ordinary course of business from suppliers. Trade payables are classified as current liabilities if payment is due within one year or less. If not, they are presented as non-current liabilities.
Trade payables are recognized initially at fair value and subsequently measured at amortized cost using the effective interest method.
2.17 boRRowinGsBorrowings are recognized initially at fair value, net of transaction costs incurred. Borrowings are subsequently carried at amortized cost; any difference between the proceeds (net of transaction costs) and the redemption value is recognized as ‘financial expenses’ in the statement of income over the borrowing period using the effective interest method.
Borrowings are classified as current liabilities unless the Company has an unconditional right to defer settlement of the liability for at least 12 months after the end of the reporting period. Terms of a liability that could, at the option of the counterparty, result in its settlement by the issue of equity instruments do not affect its classification.
2.18 CuRRent And deFeRRed inCome tAxThe tax expense for the period comprises current and deferred tax. Tax is recognized in the statement of income, except to the extent that it relates to items recognized in other comprehensive income or directly in equity. In this case, the tax is also recognized in other comprehensive income or directly in equity, respectively.
The current income tax charge is calculated on the basis of the tax laws enacted or substantively enacted at reporting date in the countries where the Company operates and generates taxable income. The Company periodically evaluates positions taken in tax returns with respect to situations in which applicable tax regulation is subject to interpretation. It establishes provisions where appropriate on the basis of amounts expected to be paid to the tax authorities.

32
LG C
hem
Ann
ual R
epor
t 201
0
deCembeR 31, 2010 And 2009, And jAnuARy 1, 2009
notes to the ConsoLidAted FinAnCiAL stAtements
Deferred income tax is recognized on temporary differences arising between the tax bases of assets and liabilities and their carrying amounts in the consolidated financial statements. It represents future tax consequences that will arise when recovering or settling the carrying amount of its assets and liabilities. However, the deferred income tax is not accounted for if it arises from initial recognition of an asset or liability in a transaction other than a business combination that at the time of the transaction affects neither accounting nor taxable profit or loss. Deferred income tax is determined using tax rates (and laws) that have been enacted or substantially enacted by the end of the reporting period and are expected to apply when the related deferred income tax asset is realised or the deferred income tax liability is settled.
Deferred income tax assets are recognized only to the extent that it is probable that future taxable profit will be available against which the temporary differences can be utilised.
Deferred income tax liabilities are provided on temporary differences arising on investments in subsidiaries, joint ventures, and associates, except for deferred income tax liability where the timing of the reversal of the temporary difference is controlled by the Company and it is probable that the temporary difference will not be reversed in the foreseeable future. Deferred income tax assets arising from these assets are recognized only to the extent that it is probable that the temporary difference will be reversed in the foreseeable future and taxable profit will be available against which the temporary difference can be utilised.
Deferred income tax assets and liabilities are offset when there is a legally enforceable right to offset current tax assets against current tax liabilities and when the deferred income tax assets and liabilities relate to income taxes levied by the same taxation authority on either the taxable entity or different taxable entities where there is an intention either to settle the balances on a net basis or to realise the asset and settle the liability simultaneously.
2.19 PRoVisionsProvisions are recognized when: the Company has a present legal or constructive obligation as a result of past events; it is probable that an outflow of resources will be required to settle the obligation; and the amount has been reliably estimated. Provisions are not recognized for future operating losses.
Where there are a number of similar obligations, the likelihood that an outflow will be required in settlement is determined by considering the class of obligations as a whole. A provision is recognized even if the likelihood of an outflow with respect to any one item included in the same class of obligations may be small.
Provisions are measured at the present value of the expenditures expected to be required to settle the obligation using a pre-tax rate that reflects current market assessments of the time value of money and the risks specific to the obligation. The increase in the provision due to passage of time is recognized as interest expense.
2.20 emPLoyee beneFitsThe Company operates various pension schemes. The schemes are generally funded through payments to insurance companies or trustee-administered funds, determined by periodic actuarial calculations. The Company operates both defined contribution and defined benefit plans.
A defined contribution plan is a pension plan under which the Company pays fixed contributions into a separate fund. The Company has no legal or constructive obligations to pay further contributions even if the fund does not hold sufficient assets to pay all employees the benefits relating to employee service in the current and prior periods. For the defined contribution plan, the Company pays contributions to publicly or privately administered pension insurance plans on a mandatory, contractual or voluntary basis. The Company has no further payment obligations once the contributions have been paid. The contributions are recognized as employee benefit expense when they are due. Prepaid contributions are recognized as an asset to the extent that a cash refund or a reduction in the future payments is available.
A defined benefit plan is a pension plan that is not a defined contribution plan. Typically defined benefit plans define an amount of pension benefit that an employee will receive on retirement, usually dependent on one or more factors such as age, years of service and compensation. The liability recognized in the statement of financial position in respect of the defined benefit pension plan is the present value of the defined benefit obligation at the end of the reporting period less the fair value of plan assets, together with adjustments for unrecognized past-service costs. The defined benefit liability is calculated annually by independent actuaries using the projected unit credit method. The present value of the defined benefit obligation is determined by discounting the estimated future cash outflows using interest rates of high-quality corporate bonds that are denominated in the currency in which the benefits will be paid, and that have terms to maturity approximating the terms of the related pension liability.
Actuarial gains and losses arising from experience adjustments and changes in actuarial assumptions are charged or credited to other comprehensive income in the period in which they arise. Actuarial gains and losses recognized in other comprehensive income are immediately recognized in retained earnings and are not recognized in profit or loss in a subsequent period.

33
Financial statements
2.21 shARe CAPitALordinary shares and preferred shares without mandatory redemption obligation are classified as equity. Incremental costs directly attributable to the issue of new shares or options are shown in equity as a deduction, net of tax, from the proceeds.
Where any consolidated company purchases the Company’s equity share capital, the consideration paid, including any directly attributable incremental costs is deducted from equity attributable to the Company’s equity holders until the shares are cancelled or reissued. Where such shares are subsequently reissued, any consideration received is included in equity attributable to the Company’s equity holders.
2.22 ReVenue ReCoGnitionRevenue comprises the fair value of the consideration received or receivable for the sale of goods in the ordinary course of the Company’s activities. Revenue is shown net of value-added tax, returns, rebates and discounts and after eliminating sales within the Company.
The Company recognizes revenue when the amount of revenue can be reliably measured, it is probable that future economic benefits will flow to the Company and when specific criteria have been met for each of the Company’s activities as described below. The Company bases its estimates on historical results, taking into consideration the type of customer, the type of transaction and the terms of each arrangement.
(a) Sales of goodsSales of goods are recognized upon delivery of products to customers. Delivery does not occur until the products have been delivered to the specified location, the risks of obsolescence and loss have been transferred to the customer, and either the customer has accepted the products in accordance with the sales contract, the acceptance provisions have lapsed, or the Company has objective evidence that all criteria for acceptance have been satisfied. The Company recognises provisions for product warranties and sales returns based on reasonable expectation reflecting warranty obligation and sales return rates incurred historically.
(b) Interest incomeInterest income is recognized using the effective interest method. When a loan and receivable is impaired, the Company reduces the carrying amount to its recoverable amount, and continues unwinding the discount as interest income. Interest income on impaired receivables is recognized using the original effective interest rate.
(c) Dividend incomeDividend income is recognized when the right to receive payment is established.
2.23 LeAsesLeases in which a significant portion of the risks and rewards of ownership are retained by the lessor are classified as operating leases. Payments made under operating leases (net of any incentives received from the lesser) are charged to the statement of income on a straight-line basis over the lease term.
Leases of property, plant and equipment where the Company has substantially all the risks and rewards of ownership is classified as finance leases. Finance leases are capitalized at the commencement of the lease at the lower of the fair value of the leased property and the present value of the minimum lease payments.
each lease payment is allocated between the liability and finance charges so as to achieve a constant rate on the finance balance outstanding. The corresponding rental obligations, net of finance charges, are recognized as ‘finance lease liabilities’. The interest element of the finance cost is charged to the statement of income over the lease term so as to produce a constant periodic rate of interest on the remaining balance of the liability for each period. The property, plant and equipment acquired under finance leases are depreciated over the shorter of the useful life of the asset and the lease term (Note 17).
2.24 diVidend distRibutionDividend liability is recognized in the financial statements when the dividends are approved by the Company’s shareholders.
2.25 non-CuRRent Assets (oR disPosAL GRouP) heLd FoR sALe And disContinued oPeRAtions The Company classifies a non-current asset (or disposal groups) as held for sale if its carrying amount will be recovered principally through a sale transaction and the sale is highly probable. Non-current assets (or disposal groups) are stated at the lower of carrying amount and fair value less costs to sell.
When a component of the Company that either has been disposed of, or is classified as held for sale, i) represents a separate major line of business or geographical area of operations, or ii) is point of a single co-ordinated plan to dispose of a separate major line of business or geographical area of operations, or iii) is a subsidiary acquired exclusively with a view to resale, that component is classified as a discontinued operation. The Company separately discloses a
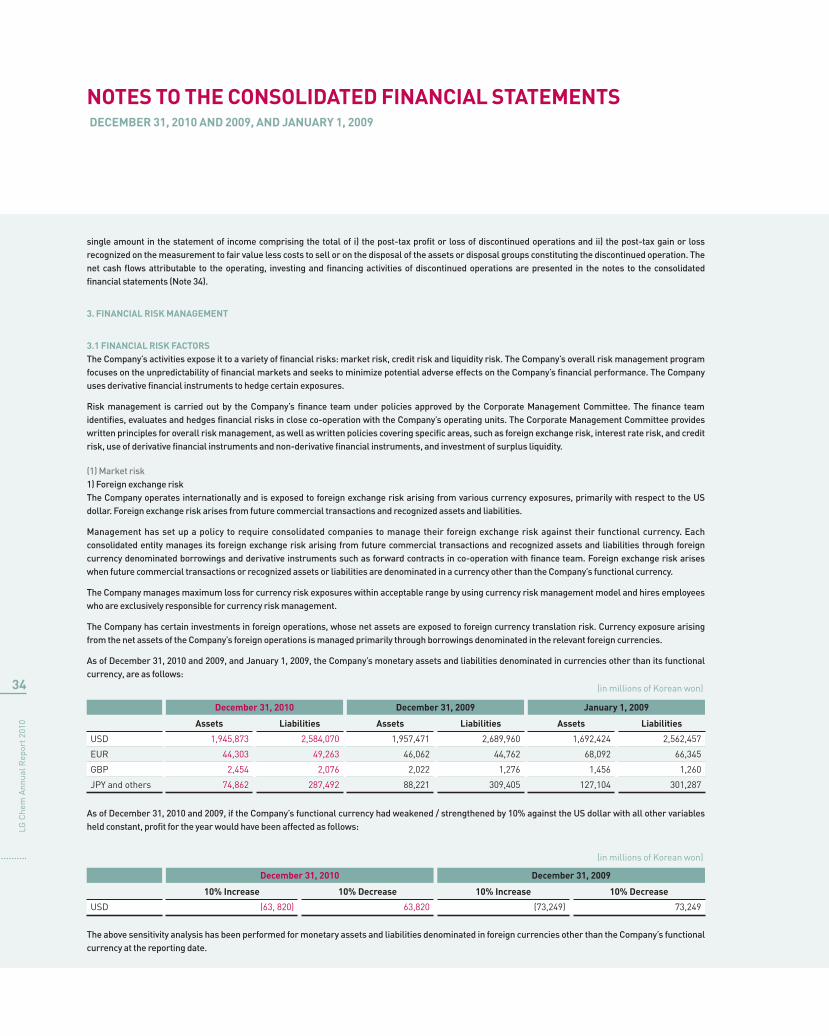
34
LG C
hem
Ann
ual R
epor
t 201
0
deCembeR 31, 2010 And 2009, And jAnuARy 1, 2009
notes to the ConsoLidAted FinAnCiAL stAtements
As of December 31, 2010 and 2009, if the Company’s functional currency had weakened / strengthened by 10% against the US dollar with all other variables held constant, profit for the year would have been affected as follows:
single amount in the statement of income comprising the total of i) the post-tax profit or loss of discontinued operations and ii) the post-tax gain or loss recognized on the measurement to fair value less costs to sell or on the disposal of the assets or disposal groups constituting the discontinued operation. The net cash flows attributable to the operating, investing and financing activities of discontinued operations are presented in the notes to the consolidated financial statements (Note 34).
3. FinAnCiAL RisK mAnAGement
3.1 FinAnCiAL RisK FACtoRsThe Company’s activities expose it to a variety of financial risks: market risk, credit risk and liquidity risk. The Company’s overall risk management program focuses on the unpredictability of financial markets and seeks to minimize potential adverse effects on the Company’s financial performance. The Company uses derivative financial instruments to hedge certain exposures.
Risk management is carried out by the Company’s finance team under policies approved by the Corporate Management Committee. The finance team identifies, evaluates and hedges financial risks in close co-operation with the Company’s operating units. The Corporate Management Committee provides written principles for overall risk management, as well as written policies covering specific areas, such as foreign exchange risk, interest rate risk, and credit risk, use of derivative financial instruments and non-derivative financial instruments, and investment of surplus liquidity.
(1) Market risk 1) Foreign exchange riskThe Company operates internationally and is exposed to foreign exchange risk arising from various currency exposures, primarily with respect to the US dollar. Foreign exchange risk arises from future commercial transactions and recognized assets and liabilities.
Management has set up a policy to require consolidated companies to manage their foreign exchange risk against their functional currency. each consolidated entity manages its foreign exchange risk arising from future commercial transactions and recognized assets and liabilities through foreign currency denominated borrowings and derivative instruments such as forward contracts in co-operation with finance team. Foreign exchange risk arises when future commercial transactions or recognized assets or liabilities are denominated in a currency other than the Company’s functional currency.
The Company manages maximum loss for currency risk exposures within acceptable range by using currency risk management model and hires employees who are exclusively responsible for currency risk management.
The Company has certain investments in foreign operations, whose net assets are exposed to foreign currency translation risk. Currency exposure arising from the net assets of the Company’s foreign operations is managed primarily through borrowings denominated in the relevant foreign currencies.
As of December 31, 2010 and 2009, and January 1, 2009, the Company’s monetary assets and liabilities denominated in currencies other than its functional currency, are as follows:
(in millions of Korean won)
(in millions of Korean won)
UsD
eUR
GBP
JPY and others
UsD
Assets
1,945,873
44,303
2,454
74,862
10% increase
(63, 820)
10% decrease
63,820
Liabilities
2,584,070
49,263
2,076
287,492
Assets
1,957,471
46,062
2,022
88,221
10% increase
(73,249)
10% decrease
73,249
Liabilities
2,689,960
44,762
1,276
309,405
Assets
1,692,424
68,092
1,456
127,104
Liabilities
2,562,457
66,345
1,260
301,287
The above sensitivity analysis has been performed for monetary assets and liabilities denominated in foreign currencies other than the Company’s functional currency at the reporting date.
december 31, 2010
december 31, 2010
december 31, 2009
december 31, 2009
january 1, 2009

35
Financial statements
(in millions of Korean won)
Loans and receivables
Financial assets at fair
value through profit or loss
Available-for-sale financial
assets
hedging derivatives
Total
₩4,004,041
2,194
4,183
-
₩4,010,418
₩(7,293)
-
-
-
₩(7,293)
₩3,996,748
2,194
4,183
-
₩4,003,125
₩3,592,071
378
4,182
17,997
₩3,614,628
₩(14,000)
-
-
-
₩(14,000)
₩3,578,071
378
4,182
17,997
₩3,600,628
₩2,810,050
-
2,116
51,845
₩2,864,011
₩(48,730)
-
-
-
₩(48,730)
₩2,761,320
-
2,116
51,845
₩2,815,281
2) Cash flow and fair value interest rate riskThe Company’s interest rate risk arises from non-current borrowings. Borrowings issued at variable rates expose the Company to cash flow interest rate risk which is partially offset by currency swap. In addition, borrowings issued at fixed rates expose the Company to fair value interest rate risk. As of December 31, 2010 and 2009, the Company’s borrowings at variable rate were denominated in Korean won and foreign currencies.
The Company analyses its interest rate exposure on a dynamic basis. Various scenarios are simulated taking into consideration refinancing, renewal of existing positions, alternative financing and hedging. Based on these scenarios, the Company calculates the impact on profit and loss of a defined interest rate shift. For each simulation, the same interest rate shift is used for all currencies. The scenarios are run only for liabilities that represent the major interest-bearing positions.
Based on the simulations performed, the impact on profit for the year of a 0.1% shift would be a maximum increase of ₩1,796 million (2009: ₩2,037 million) or decrease of ₩1,796 million (2009: ₩2,037 million), respectively.
Based on the various scenarios, the Company manages its cash flow interest rate risk by using floating-to-fixed interest rate currency swaps. Such currency swaps have the economic effect of converting borrowings from floating rates to fixed rates that are lower than those available if the Company borrowed at floating rates directly.
(2) Credit riskCredit risk is managed on a group basis. Credit risk arises from cash and cash equivalents, derivative financial instruments and deposits with banks and financial institutions, as well as credit exposures to customers, including outstanding receivables and committed transactions. As of December 31, 2010 and 2009 and January 1, 2009, the maximum degrees of credit exposures are as follows:
The Company has established the following policies and procedures to manager credit risks.
To manage credit risks relating to trade receivables, the Company evaluates the credit rating of customers and determines credit limit for each customer based on the information provided by credit rating agencies and other available financial information before commencing business with customers. The credit risks relating to trade receivables are also mitigated by insurance contracts, collaterals as well payment guarantees.
The Company has entered into export insurance contracts with Korea export Insurance Corporation to mitigate credit risks relating to export trade receivables to overseas customers. The Company is also provided with collaterals by customers depending on their credit rating or payment guarantees from the customers’ financial institutions as necessary.
The Company has deposited its cash and cash equivalent and other long-term deposits in several financial institutions such as Woori Bank and Shinhan Bank. The Company has also entered into derivative contracts with several financial institutions. The Company maintains business relationship with those financial institutions with high credit ratings evaluated by independent credit rating institutions and accordingly, credit risks associated with these financial institutions are limited.
december 31, 2010 december 31, 2009 january 1, 2009
Accumulated impairment
loss
After impairment(maximum exposure)
before impairment
Accumulated impairment
loss
After impairment(maximum exposure)
before impairment
Accumulated impairment
loss
After impairment(maximum exposure)
before impairment

36
LG C
hem
Ann
ual R
epor
t 201
0
deCembeR 31, 2010 And 2009, And jAnuARy 1, 2009
notes to the ConsoLidAted FinAnCiAL stAtements
(3) Liquidity riskCash flow forecasting is performed by consolidated subsidiaries and aggregated by corporate finance team. Finance team monitors rolling forecasts of the Company’s liquidity requirements to ensure it has sufficient cash to meet operational needs while maintaining sufficient headroom on its undrawn committed borrowing facilities at all times so that the Company does not breach borrowing limits or covenants on any of its borrowing facilities. Such forecasting takes into consideration the Company’s debt financing plans, covenant compliance, compliance with internal statement of financial position ratio targets and, if applicable external regulatory or legal requirements - for example, currency restrictions.
The Company’s finance team invests surplus cash in interest-bearing current accounts, time deposits, and money market deposits, choosing instruments with appropriate maturities or sufficient liquidity to provide sufficient head-room as determined by the above-mentioned forecasts.
The table below analyses the Company’s financial liabilities into relevant maturity groupings based on the remaining period at the reporting date to the contractual maturity date.
(in millions of Korean won)
(in millions of Korean won)
(in millions of Korean won)
Borrowings (excluding finance lease liabilities)
Finance lease liabilities
hedging derivatives
Trade and other payables
Total
Borrowings (excluding finance lease liabilities)
Finance lease liabilities
hedging derivatives
Trade and other payables
Total
Borrowings (excluding finance lease liabilities)
Finance lease liabilities
hedging derivatives
Trade and other payables
Total
Less than 1 year
₩ 1,618,769
1,812
20,535
2,123,998
₩ 3,765,114
Less than 1 year
₩ 1,830,998
1,659
39
1,775,121
₩ 3,607,817
Less than 1 year
₩ 1,984,858
1,518
-
1,228,285
₩ 3,214,661
between 1 and 2 years
₩ 331,453
1,978
-
47,792
₩ 381,223
between 1 and 2 years
₩ 303,904
1,812
35,024
29,485
₩ 370,225
between 1 and 2 years
₩ 752,153
1,623
-
5,881
₩ 759,657
between 2 and 5 years
₩ 141,845
5,234
1,545
-
₩ 148,624
between 2 and 5 years
₩ 263,763
7,212
-
-
₩ 270,975
between 2 and 5 years
₩ 369,246
3,708
26,961
-
₩ 399,915
over 5 years
-
-
-
-
-
over 5 years
₩ 1,226
-
-
-
₩ 1,226
over 5 years
₩ 3,759
5,352
-
-
₩ 9,111
december 31, 2010
december 31, 2009
january 1, 2009
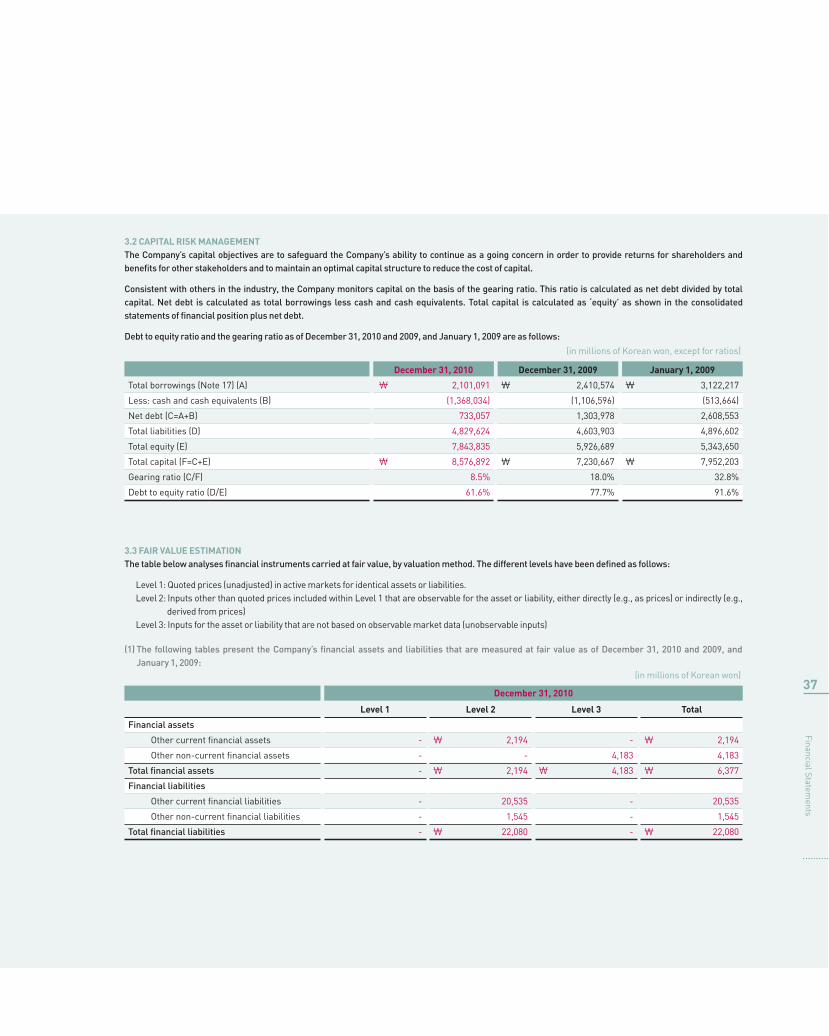
37
Financial statements
3.2 CAPitAL RisK mAnAGementThe Company’s capital objectives are to safeguard the Company’s ability to continue as a going concern in order to provide returns for shareholders and benefits for other stakeholders and to maintain an optimal capital structure to reduce the cost of capital.
Consistent with others in the industry, the Company monitors capital on the basis of the gearing ratio. This ratio is calculated as net debt divided by total capital. Net debt is calculated as total borrowings less cash and cash equivalents. Total capital is calculated as ‘equity’ as shown in the consolidated statements of financial position plus net debt.
Debt to equity ratio and the gearing ratio as of December 31, 2010 and 2009, and January 1, 2009 are as follows:
3.3 FAiR VALue estimAtionThe table below analyses financial instruments carried at fair value, by valuation method. The different levels have been defined as follows:
Level 1: Quoted prices (unadjusted) in active markets for identical assets or liabilities.Level 2: Inputs other than quoted prices included within Level 1 that are observable for the asset or liability, either directly (e.g., as prices) or indirectly (e.g.,
derived from prices)Level 3: Inputs for the asset or liability that are not based on observable market data (unobservable inputs)
(1) The following tables present the Company’s financial assets and liabilities that are measured at fair value as of December 31, 2010 and 2009, and January 1, 2009:
(in millions of Korean won)
(in millions of Korean won, except for ratios)
Financial assets
other current financial assets
other non-current financial assets
Total financial assets
Financial liabilities
other current financial liabilities
other non-current financial liabilities
Total financial liabilities
Total borrowings (note 17) (A)
Less: cash and cash equivalents (B)
net debt (C=A+B)
Total liabilities (D)
Total equity (e)
Total capital (F=C+e)
Gearing ratio (C/F)
Debt to equity ratio (D/e)
december 31, 2009
₩ 2,410,574
(1,106,596)
1,303,978
4,603,903
5,926,689
₩ 7,230,667
18.0%
77.7%
Level 1
-
-
-
-
-
-
Level 2
₩ 2,194
-
₩ 2,194
20,535
1,545
₩ 22,080
Level 3
-
4,183
₩ 4,183
-
-
-
total
₩ 2,194
4,183
₩ 6,377
20,535
1,545
₩ 22,080
january 1, 2009
₩ 3,122,217
(513,664)
2,608,553
4,896,602
5,343,650
₩ 7,952,203
32.8%
91.6%
december 31, 2010
₩ 2,101,091
(1,368,034)
733,057
4,829,624
7,843,835
₩ 8,576,892
8.5%
61.6%
december 31, 2010
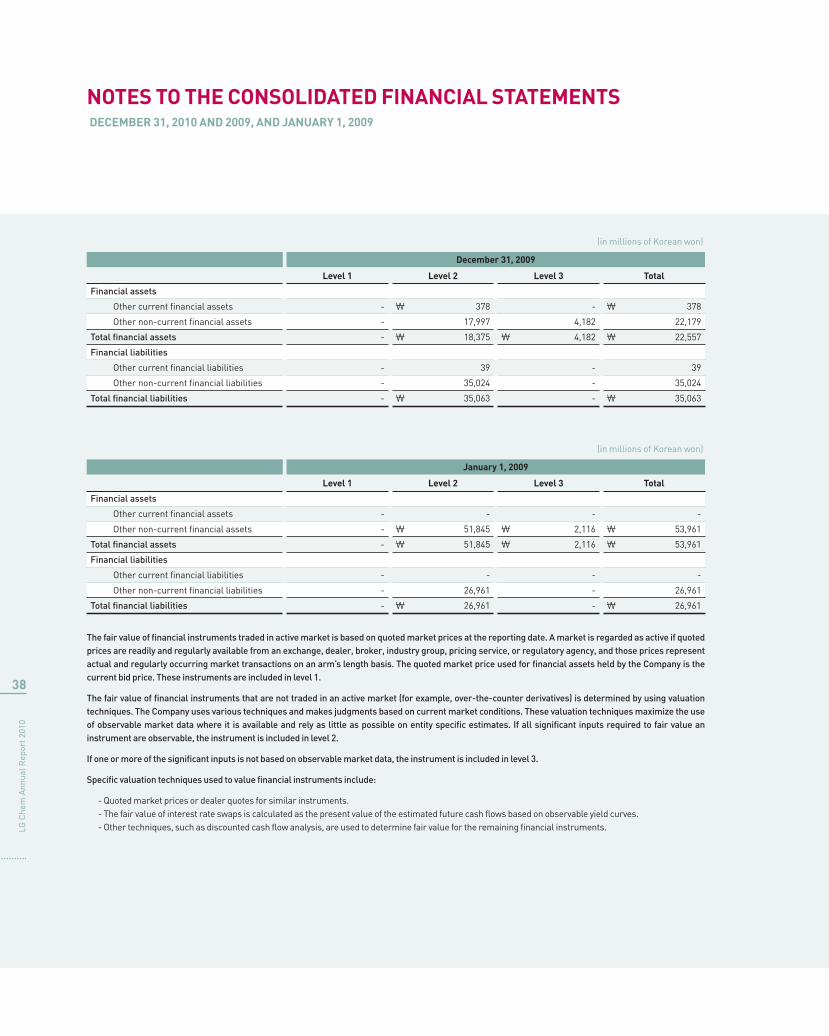
38
LG C
hem
Ann
ual R
epor
t 201
0
deCembeR 31, 2010 And 2009, And jAnuARy 1, 2009
notes to the ConsoLidAted FinAnCiAL stAtements
The fair value of financial instruments traded in active market is based on quoted market prices at the reporting date. A market is regarded as active if quoted prices are readily and regularly available from an exchange, dealer, broker, industry group, pricing service, or regulatory agency, and those prices represent actual and regularly occurring market transactions on an arm’s length basis. The quoted market price used for financial assets held by the Company is the current bid price. These instruments are included in level 1.
The fair value of financial instruments that are not traded in an active market (for example, over-the-counter derivatives) is determined by using valuation techniques. The Company uses various techniques and makes judgments based on current market conditions. These valuation techniques maximize the use of observable market data where it is available and rely as little as possible on entity specific estimates. If all significant inputs required to fair value an instrument are observable, the instrument is included in level 2.
If one or more of the significant inputs is not based on observable market data, the instrument is included in level 3.
Specific valuation techniques used to value financial instruments include:
- Quoted market prices or dealer quotes for similar instruments.- The fair value of interest rate swaps is calculated as the present value of the estimated future cash flows based on observable yield curves.- other techniques, such as discounted cash flow analysis, are used to determine fair value for the remaining financial instruments.
(in millions of Korean won)
Financial assets
other current financial assets
other non-current financial assets
Total financial assets
Financial liabilities
other current financial liabilities
other non-current financial liabilities
Total financial liabilities
Level 1
-
-
-
-
-
-
Level 2
-
₩ 51,845
₩ 51,845
-
26,961
₩ 26,961
Level 3
-
₩ 2,116
₩ 2,116
-
-
-
total
-
₩ 53,961
₩ 53,961
-
26,961
₩ 26,961
(in millions of Korean won)
Financial assets
other current financial assets
other non-current financial assets
Total financial assets
Financial liabilities
other current financial liabilities
other non-current financial liabilities
Total financial liabilities
Level 1
-
-
-
-
-
-
Level 2
₩ 378
17,997
₩ 18,375
39
35,024
₩ 35,063
Level 3
-
4,182
₩ 4,182
-
-
-
total
₩ 378
22,179
₩ 22,557
39
35,024
₩ 35,063
december 31, 2009
january 1, 2009

39
Financial statements
4. CRitiCAL ACCountinG estimAtes And AssumPtionsThe Company makes estimates and assumptions concerning the future. estimates and assumptions are continually evaluated and are based on historical experience and other factors, including expectations of future events that are believed to be reasonable under the circumstances. The resulting accounting estimates will, by definition, seldom equal the related actual results. The estimates and assumptions that have a significant risk of causing a material adjustment to the carrying amounts of assets and liabilities after the end of the reporting period are addressed below.
(1) estimated impairment of goodwillThe Company tests annually whether goodwill has suffered any impairment in accordance with the accounting policy stated in Note 2.15. The recoverable amounts of cash-generating units have been determined based on value-in-use calculations. These calculations require the use of estimates.
(2) Income taxesThe Company is subject to income taxes in numerous jurisdictions. Significant judgment is required in determining the worldwide provision for income taxes. There are many transactions and calculations for which the ultimate tax determination is uncertain. The Company recognizes liabilities for anticipated tax audit issues based on estimates of whether additional taxes will be due. Where the final tax outcome of these matters is different from the amounts that were initially recorded, such differences will impact the current and deferred income tax assets and liabilities in the period in which such determination is made.
(3) Fair value of financial instrumentsThe fair value of financial instruments that are not traded in an active market is determined by using valuation techniques. The Company uses its judgment to select a variety of methods and make assumptions that are mainly based on market conditions existing at the end of each reporting period.
(4) ProvisionsThe Company recognizes provisions for product warranties and sales return as of the reporting date as described in Note 18. The amounts are estimated based on historical data.
(5) Defined Benefit LiabilityThe present value of the defined benefit liability depends on a number of factors that are determined on an actuarial basis using a number of assumptions. The assumptions used in determining the net cost (income) for pensions include the discount rate. Any changes in these assumptions will impact the carrying amount of the defined benefit liability. The Company determines the appropriate discount rate at the end of each year. This is the interest rate that is used to determine the present value of estimated future cash outflows expected to be required to settle the defined benefit liability. In determining the appropriate discount rate, the Company considers the interest rates of high-quality corporate bonds that are denominated in the currency in which the benefits will be paid, and that have terms to maturity approximating the terms of the related pension liability. other key assumptions for defined benefit liability are based in part on current market conditions. Additional information is disclosed in Note 19.
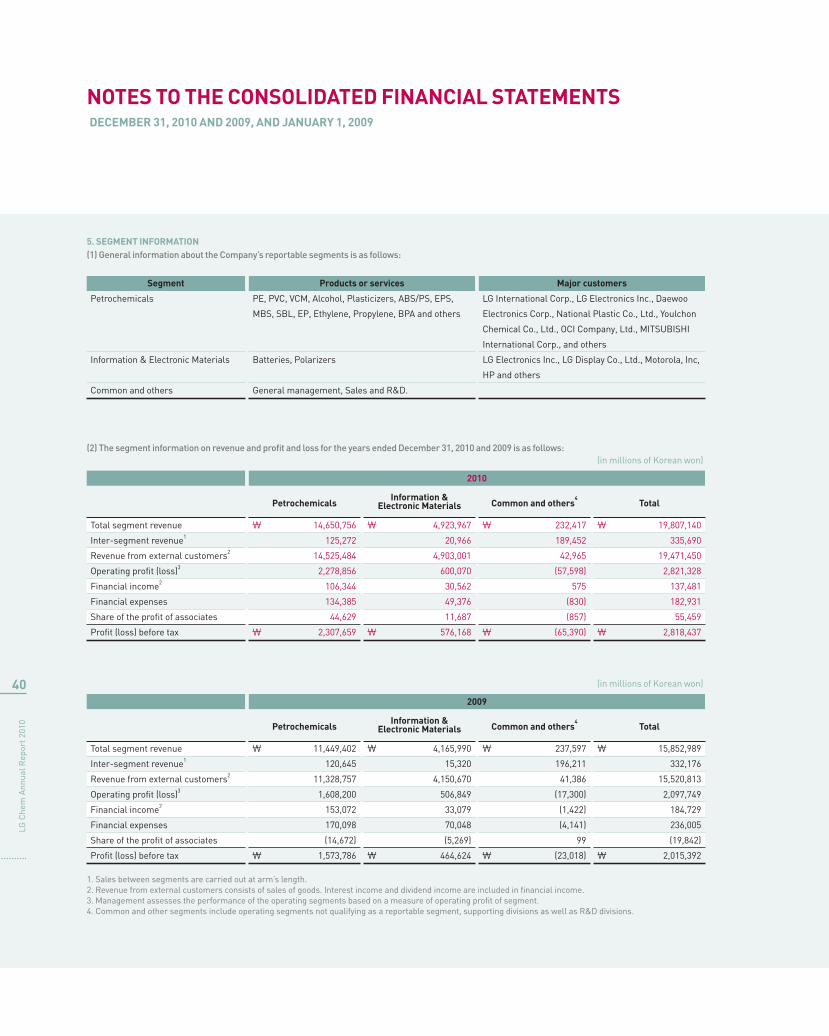
40
LG C
hem
Ann
ual R
epor
t 201
0
deCembeR 31, 2010 And 2009, And jAnuARy 1, 2009
notes to the ConsoLidAted FinAnCiAL stAtements
(in millions of Korean won)
(in millions of Korean won)
Total segment revenue
Inter-segment revenue1
Revenue from external customers2
operating profit (loss)3
Financial income2
Financial expenses
share of the profit of associates
Profit (loss) before tax
Total segment revenue
Inter-segment revenue1
Revenue from external customers2
operating profit (loss)3
Financial income2
Financial expenses
share of the profit of associates
Profit (loss) before tax
Petrochemicals
₩ 14,650,756
125,272
14,525,484
2,278,856
106,344
134,385
44,629
₩ 2,307,659
Petrochemicals
₩ 11,449,402
120,645
11,328,757
1,608,200
153,072
170,098
(14,672)
₩ 1,573,786
information & electronic materials
₩ 4,923,967
20,966
4,903,001
600,070
30,562
49,376
11,687
₩ 576,168
information & electronic materials
₩ 4,165,990
15,320
4,150,670
506,849
33,079
70,048
(5,269)
₩ 464,624
Common and others4
₩ 232,417
189,452
42,965
(57,598)
575
(830)
(857)
₩ (65,390)
Common and others4
₩ 237,597
196,211
41,386
(17,300)
(1,422)
(4,141)
99
₩ (23,018)
total
₩ 19,807,140
335,690
19,471,450
2,821,328
137,481
182,931
55,459
₩ 2,818,437
total
₩ 15,852,989
332,176
15,520,813
2,097,749
184,729
236,005
(19,842)
₩ 2,015,392
2010
2009
(2) The segment information on revenue and profit and loss for the years ended December 31, 2010 and 2009 is as follows:
1. sales between segments are carried out at arm’s length.2. Revenue from external customers consists of sales of goods. Interest income and dividend income are included in financial income.3. management assesses the performance of the operating segments based on a measure of operating profit of segment.4. Common and other segments include operating segments not qualifying as a reportable segment, supporting divisions as well as R&D divisions.
5. seGment inFoRmAtion (1) General information about the Company’s reportable segments is as follows:
segment
Petrochemicals
Information & electronic materials
Common and others
Products or services
Pe, PvC, vCm, Alcohol, Plasticizers, ABs/Ps, ePs,
mBs, sBL, eP, ethylene, Propylene, BPA and others
Batteries, Polarizers
General management, sales and R&D.
major customers
LG International Corp., LG electronics Inc., Daewoo
electronics Corp., national Plastic Co., Ltd., Youlchon
Chemical Co., Ltd., oCI Company, Ltd., mITsUBIshI
International Corp., and others
LG electronics Inc., LG Display Co., Ltd., motorola, Inc,
hP and others

41
Financial statements
(3) The segment information on assets and liabilities as of December 31, 2010 and 2009, and January 1, 2009 is as follows:
(4) The segment information on assets and liabilities as of December 31, 2010 and 2009, and January 1, 2009 is as follows:
(in millions of Korean won)
(in millions of Korean won)
(in millions of Korean won)
Total assets for the segment1
Investments in associates
Additions to non-current assets2
Total liabilities for the segment1
Total assets for the segment1
Investments in associates
Additions to non-current assets2
Total liabilities for the segment1
Total assets for the segment1
Investments in associates
Additions to non-current assets2
Total liabilities for the segment1
Petrochemicals
₩ 8,887,468
1,393
3,836,934
₩ 3,330,780
Petrochemicals
₩ 6,166,078
4,029
3,217,306
₩ 2,381,418
Petrochemicals
₩4,409,126
-
2,848,730
₩2,247,536
information & electronic materials
₩ 3,139,715
-
1,937,197
₩ 1,350,256
information & electronic materials
₩ 2,793,542
-
1,562,588
₩ 1,329,161
information & electronic materials
₩1,987,575
-
1,302,773
₩996,284
Common and others
₩ 646,276
212,179
323,870
₩ 148,588
Common and others
₩ 1,570,972
215,476
195,468
₩ 893,324
Common and others
₩3,115,741
241,629
538,452
₩1,185,173
total
₩ 12,673,459
213,572
6,098,001
₩ 4,829,624
total
₩ 10,530,592
219,505
4,975,362
₩ 4,603,903
discontinuedoperations
₩727,810
-
542,672
₩467,609
total
₩10,240,252
241,629
5,232,627
₩4,896,602
december 31, 2010
december 31, 2009
january 1, 2009
Korea*
China
south east Asia
America
Western europe
others
eliminations
Total
2010
₩ 8,720,224
8,906,641
1,209,587
1,155,349
538,186
2,051,111
(3,109,648)
₩ 19,471,450
2009
₩ 6,968,975
7,431,791
770,187
897,772
413,926
1,516,458
(2,478,296)
₩ 15,520,813
1. Assets and liabilities are measured in a manner consistent with those in the financial statements and allocated on the basis of segment operation.2. Financial instruments and deferred tax assets are excluded.
(in millions of Korean won)
* Domestic sales include the exports made through local letters of credit.
(5) There is no external customer attributing to more than 10% of total revenue for the years ended December 31, 2010 and 2009.

42
LG C
hem
Ann
ual R
epor
t 201
0
deCembeR 31, 2010 And 2009, And jAnuARy 1, 2009
notes to the ConsoLidAted FinAnCiAL stAtements
6. FinAnCiAL instRuments by CAteGoRy(1) Categorizations of financial instruments are as follows:
(in millions of Korean won)
(in millions of Korean won)
Loans and receivables
₩ 1,368,034
2,529,962
78,015
-
20,737
-
₩ 3,996,748
Assets at fair value through profit or loss
-
-
-
2,194
-
-
₩ 2,194
hedging derivation
-
-
-
-
-
20,535
1,545
₩ 22,080
Liabilities at amortized cost
₩ 1,302,563
821,435
1,620,581
480,510
47,792
-
-
₩ 4,272,881
Assets classified as available-for-sale
-
-
-
-
-
4,183
₩ 4,183
total
₩ 1,368,034
2,529,962
78,015
2,194
20,737
4,183
₩ 4,003,125
total
₩ 1,302,563
821,435
1,620,581
480,510
47,792
20,535
1,545
₩ 4,294,961
december 31, 2010
december 31, 2010
Financial assets
Cash and cash equivalents
Trade receivables
other receivables
other financial assets
other non-current receivables
other non-current financial assets
Total
Financial liabilities
Trade payables
other payables
Borrowings(current)
Borrowings(non-current)
other non-current payables
other financial liabilities
other non-current financial liabilities
Total
(in millions of Korean won)
Financial assets
Cash and cash equivalents
Trade receivables
other receivables
other financial assets
Trade receivables(non-current)
other non-current receivables
other non-current financial assets
Total
Loans and receivables
₩1,106,596
2,285,743
165,666
-
40
20,026
-
₩3,578,071
Assets at fair value through profit or loss
-
-
-
378
-
-
-
₩378
hedging derivation
-
-
-
-
-
-
17,997
₩17,997
Assets classified as available-for-sale
-
-
-
-
-
-
4,182
₩4,182
total
₩1,106,596
2,285,743
165,666
378
40
20,026
22,179
₩3,600,628
december 31, 2009
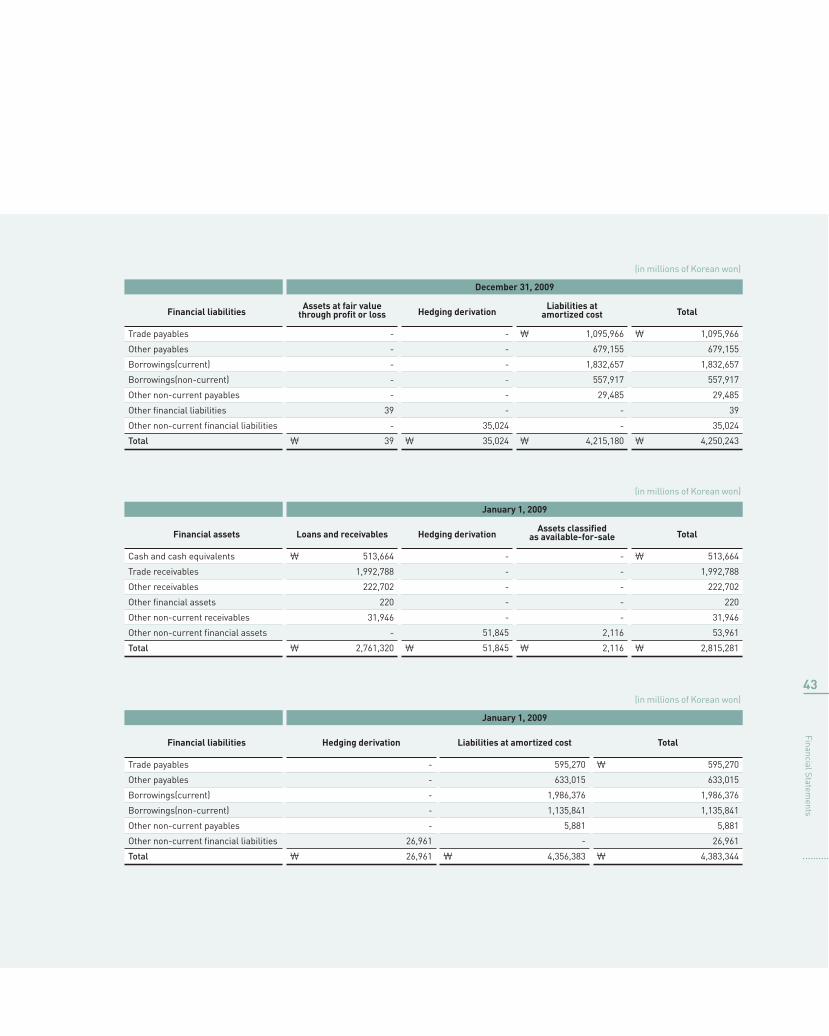
43
Financial statements
(in millions of Korean won)
(in millions of Korean won)
(in millions of Korean won)
Assets at fair value through profit or loss
-
-
-
-
-
39
-
₩ 39
Loans and receivables
₩ 513,664
1,992,788
222,702
220
31,946
-
₩ 2,761,320
hedging derivation
-
-
-
-
-
-
35,024
₩ 35,024
hedging derivation
-
-
-
-
-
51,845
₩ 51,845
hedging derivation
-
-
-
-
-
26,961
₩ 26,961
Liabilities at amortized cost
595,270
633,015
1,986,376
1,135,841
5,881
-
₩ 4,356,383
Liabilities at amortized cost
₩ 1,095,966
679,155
1,832,657
557,917
29,485
-
-
₩ 4,215,180
Assets classified as available-for-sale
-
-
-
-
-
2,116
₩ 2,116
total
₩ 1,095,966
679,155
1,832,657
557,917
29,485
39
35,024
₩ 4,250,243
total
₩ 513,664
1,992,788
222,702
220
31,946
53,961
₩ 2,815,281
total
₩ 595,270
633,015
1,986,376
1,135,841
5,881
26,961
₩ 4,383,344
december 31, 2009
january 1, 2009
january 1, 2009
Financial liabilities
Trade payables
other payables
Borrowings(current)
Borrowings(non-current)
other non-current payables
other financial liabilities
other non-current financial liabilities
Total
Financial assets
Cash and cash equivalents
Trade receivables
other receivables
other financial assets
other non-current receivables
other non-current financial assets
Total
Financial liabilities
Trade payables
other payables
Borrowings(current)
Borrowings(non-current)
other non-current payables
other non-current financial liabilities
Total
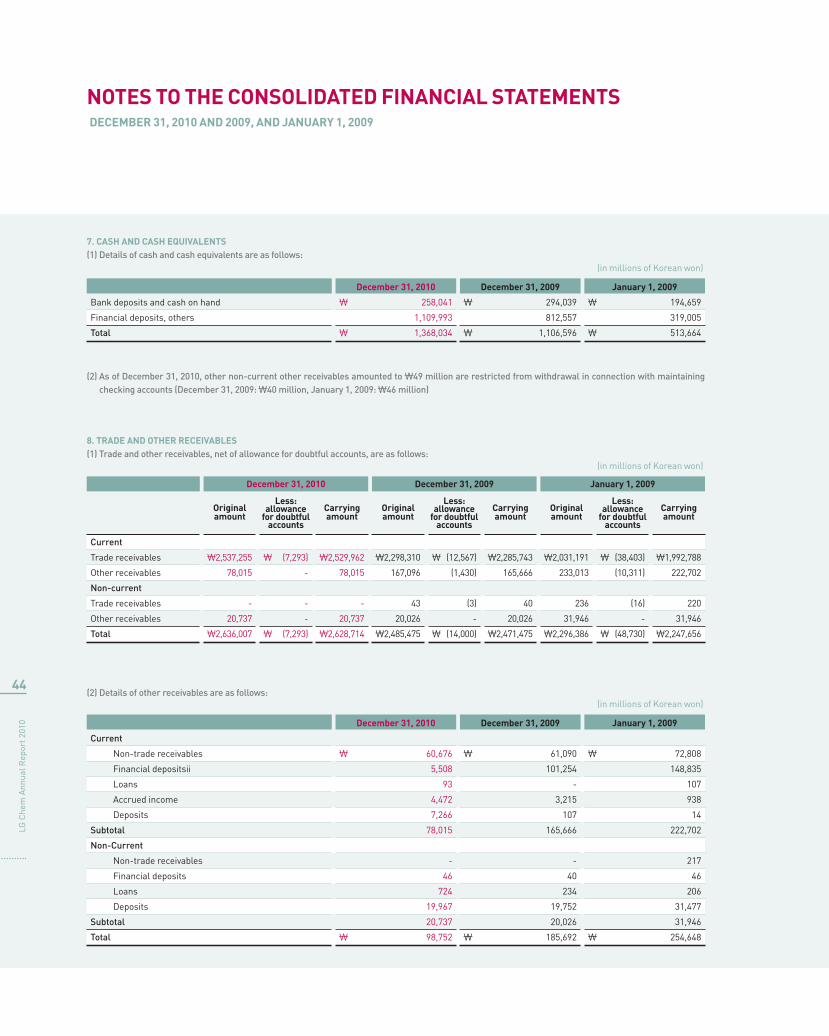
44
LG C
hem
Ann
ual R
epor
t 201
0
deCembeR 31, 2010 And 2009, And jAnuARy 1, 2009
notes to the ConsoLidAted FinAnCiAL stAtements
(in millions of Korean won)
(in millions of Korean won)
Bank deposits and cash on hand
Financial deposits, others
Total
Current
non-trade receivables
Financial depositsii
Loans
Accrued income
Deposits
Subtotal
Non-Current
non-trade receivables
Financial deposits
Loans
Deposits
Subtotal
Total
december 31, 2009
₩ 294,039
812,557
₩ 1,106,596
december 31, 2009
₩ 61,090
101,254
-
3,215
107
165,666
-
40
234
19,752
20,026
₩ 185,692
january 1, 2009
₩ 194,659
319,005
₩ 513,664
january 1, 2009
₩ 72,808
148,835
107
938
14
222,702
217
46
206
31,477
31,946
₩ 254,648
december 31, 2010
₩ 258,041
1,109,993
₩ 1,368,034
december 31, 2010
₩ 60,676
5,508
93
4,472
7,266
78,015
-
46
724
19,967
20,737
₩ 98,752
(in millions of Korean won)
Current
Trade receivables
other receivables
Non-current
Trade receivables
other receivables
Total
₩2,537,255
78,015
-
20,737
₩2,636,007
₩(7,293)
-
-
-
₩(7,293)
₩2,529,962
78,015
-
20,737
₩2,628,714
₩2,298,310
167,096
43
20,026
₩2,485,475
₩(12,567)
(1,430)
(3)
-
₩(14,000)
₩2,285,743
165,666
40
20,026
₩2,471,475
₩2,031,191
233,013
236
31,946
₩2,296,386
₩(38,403)
(10,311)
(16)
-
₩(48,730)
₩1,992,788
222,702
220
31,946
₩2,247,656
december 31, 2010 december 31, 2009 january 1, 2009
Less: allowance
for doubtful accounts
Carrying amount
originalamount
Less: allowance
for doubtful accounts
Carrying amount
originalamount
Less: allowance
for doubtful accounts
Carrying amount
originalamount
7. CAsh And CAsh eQuiVALents(1) Details of cash and cash equivalents are as follows:
(2) As of December 31, 2010, other non-current other receivables amounted to ₩49 million are restricted from withdrawal in connection with maintaining checking accounts (December 31, 2009: ₩40 million, January 1, 2009: ₩46 million)
8. tRAde And otheR ReCeiVAbLes(1) Trade and other receivables, net of allowance for doubtful accounts, are as follows:
(2) Details of other receivables are as follows:

45
Financial statements
(in millions of Korean won)
(in millions of Korean won)
Up to 3 months
3 to 6 months
over 6 months
Total
other financial assets
Derivatives (note 11)
Available-for-sale (note 10)
Less: current portions
Total
other financial liabilities
Derivatives (note 11)
Less: current
Total
december 31, 2009
₩ 2,099,854
181,187
17,269
₩ 2,298,310
december 31, 2009
₩ 18,375
4,182
(378)
₩ 22,179
35,063
(39)
₩ 35,024
january 1, 2009
₩ 1,855,162
139,495
36,534
₩ 2,031,191
january 1, 2009
₩ 51,845
2,116
-
₩ 53,961
26,961
-
₩ 26,961
december 31, 2010
₩ 2,465,462
66,641
5,152
₩ 2,537,255
december 31, 2010
₩ 2,194
4,183
(2,194)
₩ 4,183
22,080
(20,535)
₩ 1,545
(3) The aging analysis of these trade and other receivables is as follows:
(4) The movements in bad debt allowance for the years ended December 31, 2010 and 2009 are as follows:
(5) The fair values of trade and other receivables are same as their carrying amounts.
9. otheR FinAnCiAL Assets And LiAbiLities(1) Details of other financial assets and liabilities are as follows:
(in millions of Korean won)
Beginning balance
Addition
Reversal
Write-off
Business combination
spin-off
exchange differences
ending balance
Current
₩12,567
-
(1,146)
(4,775)
554
-
93
₩7,293
Non-current
₩3
-
(3)
-
-
-
-
-
trade receivables
Current
₩1,430
-
-
(1,430)
-
-
-
-
Non-current
-
-
-
-
-
-
-
-
other receivables
Current
₩38,403
7,291
(2,820)
(4,463)
-
(26,290)
446
₩12,567
Non-current
₩16
-
(13)
-
-
-
-
₩3
trade receivables
Current
₩10,311
2,283
-
-
-
(11,613)
(1)
₩1,430
Non-current
-
-
-
-
-
-
-
-
other receivables
2010 2009

46
LG C
hem
Ann
ual R
epor
t 201
0
deCembeR 31, 2010 And 2009, And jAnuARy 1, 2009
notes to the ConsoLidAted FinAnCiAL stAtements
10. FinAnCiAL Assets CLAssiFied As AVAiLAbLe-FoR-sALe(1) The movements in financial assets classified as available-for-sale for the years ended December 31, 2010 and 2009, are as follows:
(2) Financial assets classified as available-for-sale consist of listed and unlisted equity securities. The unlisted equity securities are measured at cost as their fair values cannot be measured reliably.
(3) As of December 31, 2010, none of these financial assets classified as available-for-sale is either overdue or impaired. In 2009, ₩182 million of impairment losses were recognized for unlisted equity securities.
11. deRiVAtiVe FinAnCiAL instRuments(1) Details of derivative financial assets and liabilities are as follows:
(in millions of Korean won)
Beginning balance
exchange differences
Additions
Disposals
Reclassification
spin-off
Impairment
ending balance
2009
₩ 2,116
(10)
2,980
(1,806)
1,280
(196)
(182)
₩ 4,182
2010
₩ 4,182
2
7
(8)
-
-
-
₩ 4,183
(in millions of Korean won)
Current
Interest rate swaps-cash flow hedges
Forward foreign exchange contract-
held-for-trading
Total
Non- current
Interest rate swaps-cash flow hedges
Assets
₩-
2,194
₩2,194
-
Liabilities
₩20,535
-
₩20,535
₩1,545
Assets
-
₩378
₩378
₩17,997
Liabilities
-
₩39
₩39
₩35,024
Assets
-
-
-
₩51,845
Liabilities
-
-
-
₩26,961
december 31, 2010 december 31, 2009 january 1, 2009

47
Financial statements
(2) Details of derivative financial contracts are as follows:
Classification
Forward foreign
exchange contract
Currency swap
Interest rate swap
Classification
Forward foreign
exchange contract
Currency swap
Classification
Currency swap
Contractor
Korea exchange Bank
and 15 other banks
BTmU
BTmU
hsBC
hsBC
Contractor
shinhan Bank and
12 other banks
Woori Bank*
InG Bank
BTmU
BTmU
Contractor
hana Bank
Woori Bank*
InG Bank
BoA*
BTmU
BTmU
Contract date
2010.12.10,
various
2008.12.19
2008.12.19
2006.10.11
2007.06.15
Contract date
2010.12.10,
various
2006.07.20
2006.07.20
2008.12.19
2008.12.19
Contract date
2006.04.13
2006.07.20
2006.07.20
2008.01.10
2008.12.19
2008.12.19
Contract amount(in thousands)
Us$ 10,000,
various
¥ 5,000,000
¥ 5,000,000
₩ 12,000,000
Us$ 18,000
Contract amount(in thousands)
Us$ 5,000,
various
Us$ 50,000
Us$ 50,000
¥ 5,000,000
¥ 5,000,000
Contract amount(in thousands)
Us$ 52,029
Us$ 50,000
Us$ 50,000
Us$ 50,000
¥ 5,000,000
¥ 5,000,000
Contract period
2010.12.10 ~ 2011.01.04,
various
2008.12.19 ~ 2011.12.19
2008.12.19 ~ 2011.12.19
2006.10.11 ~ 2013.09.05
2007.06.15 ~ 2013.09.05
Contract period
2009.11.27 ~ 2010.02.26,
various
2006.07.20 ~ 2011.07.20
2006.07.20 ~ 2010.07.20
2008.12.19 ~ 2011.12.19
2008.12.19 ~ 2011.12.19
Contract period
2006.04.13 ~ 2009.04.13
2006.07.20 ~ 2011.07.20
2006.07.20 ~ 2010.07.20
2008.01.10 ~ 2012.01.10
2008.12.19 ~ 2011.12.19
2008.12.19 ~ 2011.12.19
Contract terms
1145.66/Us$, various
₩15.53/¥
₩15.67/¥
Received: 3 month CD, Paid: 4.61%
Received: 3 month Libor Paid: 5.59%
Contract terms
₩1173.10 / Us$, various
₩944.00/Us$
₩944.30/Us$
₩15.53/¥
₩15.67/¥
Contract terms
₩961.00/Us$
₩944.00/Us$
₩944.30/Us$
₩939.80/Us$
₩15.53/¥
₩15.67/¥
december 31, 2010
december 31, 2009
january 1, 2009
* The contract was been terminated in 2009.
(3) Trading derivative is classified as a current asset or liability. The fair values of a hedging derivative is classified as a non-current asset or liability if the remaining maturity of the hedged item is more than 12 months and, a current asset or liability, if the remaining maturity of the hedged item is less than 12 months.
(4) There was no ineffectiveness to be recorded from cash flow hedges.
* The contract was terminated in 2009.

48
LG C
hem
Ann
ual R
epor
t 201
0
deCembeR 31, 2010 And 2009, And jAnuARy 1, 2009
notes to the ConsoLidAted FinAnCiAL stAtements
(in millions of Korean won)
merchandise
Finished products
semi-finished products
Work-in-process
Raw materials
supplies
materials-in-transit
Total
originalamount
₩60,028
1,019,709
268,895
1,032
571,525
60,331
209,300
₩2,191,420
Valuationallowance
₩(17)
(7,852)
-
-
(976)
-
-
₩(8,936)
Carrying amount
₩60,520
1,011,857
268,895
1,032
570,549
60,331
209,300
₩2,182,484
originalamount
₩45,933
707,365
185,221
595
458,571
53,987
152,796
₩1,604,468
Valuationallowance
₩(325)
(5,879)
-
-
(693)
-
-
₩(6,897)
Carrying amount
₩45,608
701,486
185,221
595
457,878
53,987
152,796
₩1,597,571
originalamount
₩117,704
868,298
192,624
494
428,559
51,761
172,853
₩1,832,293
Valuationallowance
₩(398)
(22,682)
-
-
(421)
-
-
₩(23,501)
Carrying amount
₩117,306
845,616
192,624
494
428,138
51,761
172,853
₩1,808,792
december 31, 2010 december 31, 2009 january 1, 2009
(in millions of Korean won)
Beginning balance
Acquisitions
share of profit of associates
share of other comprehensive income of associates
Reclassification to subsidiaries
Dividends
spin-off
others
ending balance
2009
₩ 241,629
20,146
(19,842)
(21,157)
-
(21)
(1,164)
(86)
₩ 219,505
2010
₩ 219,505
14,210
55,459
(181)
(74,562)
(862)
-
3
₩ 213,572
12. inVentoRies(1) Details of inventories are as follows:
(2) The cost of inventories recognised as expense and included in ‘Cost of Sales’ amounted to ₩ 13,170,727 million (2009: ₩ 9,967,258 million).
13. inVestments in AssoCiAtes(1) Changes in the carrying amount of investments in associates for the years ended December 31, 2010 and 2009, are as follows:

49
Financial statements
(in millions of Korean won)
(in millions of Korean won)
LG vina Chemical Company Ltd.
LG Polycarbonate Ltd.1
hL Greenpower Co., Ltd
LG holdings (hK) Ltd.
TeCWIn Co., Ltd.
seeTeC Co., Ltd.
LG Chem Brasil, Ltd.
LG Yongxing International Trade
Co., Ltd.
Total
LG vina Chemical Company Ltd.
LG Polycarbonate Ltd. 1
LG holdings (hK) Ltd.
TeCWIn Co., Ltd.
seeTeC Co., Ltd.
LG Chem Brasil, Ltd.
m. Dohmen s.A. 2
LG Yongxing International Trade
Co., Ltd.
ningbo Zhenhai LG Yongxing trade
Co., Ltd. 3
Total
Country
vietnam
Korea
Korea
hong Kong
Korea
Korea
Brazil
China
ownership (%)
40
50
49
26
20
50
100
90
Country
vietnam
Korea
hong Kong
Korea
Korea
Brazil
europe
China
China
ownership (%)
40
50
26
20
50
100
-
90
100
Assets
₩ 21,722
314,754
30,287
389,907
39,477
362,133
159
171
₩1,158,610
Liabilities
₩ 11,101
167,262
3,033
190,297
18,950
47,268
262
10
₩438,183
Assets
₩14,575
290,794
380,233
29,707
355,794
159
-
173
855
₩1,072,290
Liabilities
₩6,654
176,133
189,125
12,290
84,727
262
-
173
-
₩469,364
Revenue
₩72,120
399,027
1,875
32,117
70,987
395,423
-
-
₩971,549
Profit (loss) for the year
₩4,891
32,520
(1,746)
7,787
2,572
43,714
-
(13)
₩89,725
Revenue
₩47,355
365,799
35,072
53,622
407,434
233
23,936
-
-
₩933,451
Profit (loss) for the year
₩4,467
(1,218)
1,087
2,991
(20,075)
(83)
(2,286)
(14)
-
₩(15,131)
2010
2009
(2) Financial information of associates follows:
1. Reclassified from investment in associate to a subsidiary since the Company acquired control over LG Polycarbonate Ltd on october 1, 2010 (note 37). 2. Transferred to LG hausys, Ltd. on April 1, 2009 due to spin-off.3. established in 2009 and has been reclassified as a subsidiary in 2010.

50
LG C
hem
Ann
ual R
epor
t 201
0
deCembeR 31, 2010 And 2009, And jAnuARy 1, 2009
notes to the ConsoLidAted FinAnCiAL stAtements
14. PRoPeRty, PLAnt And eQuiPment(1) Changes in the carrying amounts of property, plant and equipment for the years ended December 31, 2010 and 2009, are as follows:
(in millions of Korean won)
Beginning balance
Cost
Accumulated
depreciation
Accumulated
impairment
Acquisitions/
Transfer
Disposals/
Transfer
exchange
differences
Depreciation
Impairment
Business
combination
ending balance
Cost
Accumulated
depreciation
Accumulated
impairments
Land
₩432,093
432,093
-
-
170
(77)
(155)
-
-
11,380
443,411
443,411
-
-
buildings
₩1,045,559
1,272,910
(220,508)
(6,843)
179,657
(2,842)
240
(33,668)
(4,228)
27,572
1,212,290
1,475,425
(258,901)
₩(4,234)
structures
₩341,582
586,626
(245,037)
(7)
26,500
(1,548)
2,733
(26,769)
-
11,279
353,777
632,000
(278,216)
₩(7)
machinery
₩2,222,794
5,955,011
(3,721,524)
(10,693)
728,284
(9,156)
10,342
(505,948)
(15,537)
99,015
2,529,794
6,928,120
(4,372,096)
₩(26,230)
Vehicles
₩11,498
36,447
(24,949)
-
1,914
(115)
(1,165)
(3,678)
-
-
8,454
34,440
(25,986)
-
tools
₩117,350
312,697
(191,315)
(4,032)
70,990
(957)
160
(42,447)
-
-
145,096
374,325
(225,197)
₩(4,032)
equipment
₩46,629
159,618
(112,888)
(101)
28,623
(1,876)
473
(16,023)
-
68
57,894
179,962
(121,967)
₩(101)
others
₩10,667
17,978
(7,311)
-
77,386
(232)
201
(26,371)
-
-
61,651
94,668
(33,017)
-
Construction-in-progress
₩482,796
517,592
-
(34,796)
1,328,426
(923,220)
2,569
-
-
149
890,720
925,516
-
₩(34,796)
machinery-in-transit
₩64,382
64,382
-
-
284,814
(180,243)
-
-
-
-
168,953
168,953
-
-
total
₩4,775,350
9,355,354
(4,523,532)
(56,472)
2,726,764
(1,120,266)
15,398
(654,904)
(19,765)
149,463
5,872,040
11,256,820
(5,315,380)
₩(69,400)
2010

51
Financial statements
(in millions of Korean won)
Beginning balance
Cost
Accumulated
depreciation
Accumulated
impairment
Decrease due to
spin-off
Acquisitions/
Transfer
Disposals/
Transfer
exchange
differences
Depreciation
Impairment
ending balance
Cost
Accumulated
depreciation
Accumulated
impairment
Land
₩506,101
506,101
-
-
(72,518)
4,231
(4,210)
(1,511)
-
-
432,093
432,093
-
-
buildings
₩1,116,763
1,353,061
(236,298)
-
(136,537)
124,729
(1,652)
(14,870)
(33,219)
(9,655)
1,045,559
1,272,910
(220,508)
₩(6,843)
structures
₩370,143
606,342
(236,192)
(7)
(13,059)
16,442
(419)
(4,291)
(27,137)
(97)
341,582
586,626
(245,037)
₩(7)
machinery
₩2,276,478
6,091,639
(3,806,863)
(8,298)
(185,777)
656,324
(40,295)
(36,642)
(435,858)
(11,436)
2,222,794
5,955,011
(3,721,524)
₩(10,693)
Vehicles
₩13,844
39,555
(25,711)
-
(2,011)
1,893
(380)
1,732
(3,580)
-
11,498
36,447
(24,949)
-
tools
₩205,566
526,737
(317,192)
(3,979)
(92,083)
63,550
(14,714)
1,841
(46,751)
(59)
117,350
312,697
(191,315)
₩(4,032)
equipment
₩65,461
203,583
(138,105)
(17)
(15,714)
18,963
(2,357)
(983)
(18,646)
(95)
46,629
159,618
(112,888)
₩(101)
others
₩12
13
(1)
-
(20)
17,988
(1)
252
(7,564)
-
10,667
17,978
(7,311)
-
Construction-in-progress
₩353,332
353,332
-
-
(34,097)
902,586
(702,426)
(1,803)
-
(34,796)
482,796
517,592
-
₩(34,796)
machinery-in-transit
₩80,632
80,632
-
-
(11,303)
159,935
(164,882)
-
-
-
64,382
64,382
-
-
total
₩4,988,332
9,760,995
(4,760,362)
(12,301)
(563,119)
1,966,641
(931,336)
(56,275)
(572,755)
(56,138)
4,775,350
9,355,354
(4,523,532)
₩(56,472)
2009
(2) Borrowing costs amounting to ₩ 18,622 million (2009: ₩ 9,270 million) are capitalized.
(3) As of December 31, 2010, certain property, plant and equipment have been pledged as collaterals for certain bank loans for up to a maximum of ₩ 8,787 million (December 31, 2009: ₩ 391,387 million, January 1, 2009: ₩ 429,171 million).
(4) As of December 31, 2010, the Company has a finance lease agreement on certain property, plant and equipment at the MTBe factory. The carrying amount of leased assets and depreciation are as follows:
The said agreement is non-cancellable finance lease agreements. The lease term is 15 years, and the Company has the title of the leased assets.
(in millions of Korean won)
Carrying amount
Depreciation
2009
₩ 4,405
₩ 2,182
2010
₩ 2,223
₩ 2,182

52
LG C
hem
Ann
ual R
epor
t 201
0
deCembeR 31, 2010 And 2009, And jAnuARy 1, 2009
notes to the ConsoLidAted FinAnCiAL stAtements
(5) Depreciation of property, plant and equipment was classified as follows:(in millions of Korean won)
(in millions of Korean won)
Cost of sales
selling general and administrative expenses
others*
Total
Cost of sales
selling, general and administrative expenses
others*
Total
2009
₩ 488,800
40,344
43,611
₩ 572,755
2009
₩ 6,791
9,381
764
₩ 16,936
2010
₩ 612,529
41,654
721
₩ 654,904
2010
₩ 5,540
12,387
-
₩ 17,927
(in millions of Korean won)
(in millions of Korean won)
Beginning balance
Acquisitions/Transfer
Disposals/Transfer
exchange differences
Amortization
ending balance
Beginning balance
Acquisitions/Transfer
Disposals/Transfer
exchange differences
Amortization
Impairment
Decrease due to spin-off
ending balance
development costs
₩ 24,300
9,412
(2)
-
(7,912)
₩ 25,798
development costs
₩ 46,747
8,429
(265)
(57)
(9,756)
(16,948)
(3,850)
₩ 24,300
industrial property rights
₩ 47,205
12,086
(642)
67
(3,008)
₩ 55,708
industrial property rights
₩ 32,360
24,289
(802)
(847)
(3,544)
-
(4,251)
₩ 47,205
Goodwill
₩ 33,415
-
-
-
-
₩ 33,415
Goodwill
₩ 33,415
-
-
-
-
-
-
₩ 33,415
memberships
₩ 46,747
2,196
(236)
536
-
₩ 49,243
memberships
₩ 57,570
-
-
-
-
-
(10,823)
₩ 46,747
others
₩ 10,492
12,010
(29)
485
(7,007)
₩ 15,951
total
₩162,159
35,704
(909)
1,088
(17,927)
₩180,115
others
₩ 18,772
(3,488)
(80)
561
(3,636)
-
(1,637)
₩ 10,492
total
₩188,864
29,230
(1,147)
(343)
(16,936)
(16,948)
(20,561)
₩162,159
2010
2009
* Amounts capitalized to development costs and charged to discontinued operations are included.
15. intAnGibLe Assets(1) Changes in the carrying amount of intangible assets for the years ended December 31, 2010 and 2009, are as follows:
(2) Amortization of intangible assets was classified as follows:
* Amounts charged to discontinued operations are included.

53
Financial statements
(in millions of Korean won)
CGus
Goodwill recorded from the acquisition of LG Petrochemical Co., Ltd.
nCC
Po
special resin
synthetic rubber
Petrochemistry BPA
Subtotal
Goodwill recorded form the acquisition of SAP business
Acrylic business
Subtotal
Total
Carrying amount
₩ 4,724
977
255
600
1,637
₩ 8,193
25,222
25,222
₩ 33,415
(3) Impairment tests for goodwill
Goodwill is allocated to the Company’s cash-generating units (CGUs) identified according to operating segment. The carrying amounts of allocated goodwill
by CGUs are as follows:
The recoverable amounts of CGUs have been determined based on value-in-use calculations. These calculations use pre-tax cash flow projections based on financial budgets approved by management covering a five-year period. Cash flows beyond the five-year period are estimated using 0% of expected growth rate.
Management determined budgeted eBIT margin based on past performance and its expectations of market development. The discount rates used are pre-tax and reflect specific risks relating to the relevant operating segments. Discount rate used for value-in-use calculations for the current year is 12.82%. The recoverable amounts based on value-in-use calculations exceed carrying amounts and accordingly, no impairments were recognized for the year ended December 31, 2010.
(in millions of Korean won)
Current
Advances to suppliers
Prepaid expenses
Prepaid income taxes
Prepaid value added tax
others
Total
Non-current
Long-term prepaid expenses
other investment assets
Total
december 31, 2009
₩ 40,247
21,742
-
50,311
4,821
₩ 117,121
37,547
306
₩ 37,853
january 1, 2009
₩ 23,959
32,696
599
24,292
13,972
₩ 95,518
53,192
2,239
₩ 55,431
december 31, 2010
₩ 26,919
26,207
-
66,670
7,813
₩ 127,609
45,819
27
₩ 45,846
16. otheR CuRRent And non-CuRRent Assets(1) Details of other current and non-current assets are as follows:

54
LG C
hem
Ann
ual R
epor
t 201
0
deCembeR 31, 2010 And 2009, And jAnuARy 1, 2009
notes to the ConsoLidAted FinAnCiAL stAtements
17. boRRowinGsDetails of borrowings are as follows:
(1) Current borrowings(in millions of Korean won)
notes discounted1
Bank loans2
Current maturities of long-term debts
Debentures
Bank loans
Finance lease liabilities
Total
bank
shinhan Bank, others
China Bank, others
Woori security
shinhan Bank, others
hyundai oil Bank
Annual interest rate(%) at 12. 31, 2010
Libor+1.3, various
Libor+0.8, various
3Tibor+3.00
Libor+0.36, various
9.00
december 31, 2010
₩862,290
397,597
139,461
219,421
1,812
₩1,620,581
december 31, 2009
₩949,353
343,792
158,294
379,559
1,659
₩1,832,657
january 1, 2009
₩818.916
501,478
506,271
158,193
1,518
₩ 1,986,376
Carring Amount
(in millions of Korean won)
1. Debentures
Won currency debentures
Foreign currency debentures1
Subtotal
2. Bank loans
Won currency loans
Foreign currency loans
Subtotal
3. Finance lease liabilities
Finance lease liabilities 2
Subtotal
Total
bank
Woori security
Woori security
Kookmin Bank,
others
KDB, others
hyundai oil Bank
Annual interest rate(%)
4.85
3Tibor+3.0
3.00, various
Libor+0.36,
various
9.00
maturity
2012.04.29
2011.12.19
2011.09.15~2020.03.21
2010.10.01~2015.10.15
2014.10.29
total amount
₩149,531
139,461
₩288,992
2,996
540,192
₩543,188
9,024
₩9,024
₩841,204
Current maturities
-
139,461
₩139,461
1,133
218,288
₩219,421
1,812
₩1,812
₩360,694
Long-term debts
₩149,531
-
₩149,531
1,863
321,904
₩323,767
7,212
₩7,212
₩480,510
december 31, 2010
1. notes discounted that are not yet due.2. Bank loans are secured by certain property, plant and equipment (note 14).
(2) Non-current borrowings

55
Financial statements
(in millions of Korean won)
1. Debentures
Won currency debentures
Foreign currency debentures1
Subtotal
2. Bank loans
Won currency loans
Foreign currency loans
Subtotal
3. Finance lease liabilities
Finance lease liabilities 2
Subtotal
Total
bank
Woori security
Woori security
Kookmin Bank,
others
KDB, others
hyundai oil Bank
Annual interest rate(%)
4.5~4.85
Libor+0.26~
Tibor+3.00
0~3.25
Libor+0.3,
various
9.00
maturity
2010.03.16~2012.04.29
2010.09.17~2011.12.19
2010.06.15~2020.03.21
2015.10.15
2014.10.29
total amount
₩ 249,399
184,354
₩ 433,753
5,792
667,201
₩ 672,993
10,683
₩10,683
₩1,117,429
Current maturities
₩99,926
58,368
₩158,294
2,795
376,764
₩379,559
1,659
₩1,659
₩539,512
Long-term debts
₩149,473
125,986
₩275,459
2,997
290,437
₩293,434
9,024
₩9,024
₩577,917
december 31, 2009
(in millions of Korean won)
1. Debentures
Won currency debentures
Won currency debentures
Foreign currency debentures1
Subtotal
2. Bank loans
Won currency loans
Foreign currency loans
Subtotal
3. Finance lease liabilities
Finance lease liabilities 2
Subtotal
Total
bank
Woori Bank, others
Woori security
Woori security
Kookmin Bank,
others
KDB, others
hyundai oil Bank
Annual interest rate(%)
3.5~5.02
5.02~5.32
Libor+0.26~
Tibor+3.00
3.00~4.25,
CD+0.6
Libor+0.3,
various
9.00
maturity
2009.04.26~2013.10.27
2009.04.13~2009.05.30
2009.09.23~2011.12.19
2010.06.15~2020.03.21
2010.02.27~2015.10.15
2014.10.29
total amount
₩458,824
100,000
308,595
₩867,419
9,914
912,289
₩922,203
12,201
₩12,201
₩1,801,823
Current maturities
₩299,438
100,000
106,833
₩506,271
1,926
156,267
₩158,193
1,518
₩1,518
₩665,982
Long-term debts
₩159,386
-
201,762
₩361,148
2,997
756,022
₩764,010
10,683
10,683
₩1,135,841
january 1, 2009
1. Floating rate notes issued on march 20, 2007, were repaid on september 17, 2010, the maturity date. 2. Finance lease liabilities are liabilities associated with sales and leaseback arrangements of property, plant and equipment of mTBe factory (note 14).

56
LG C
hem
Ann
ual R
epor
t 201
0
deCembeR 31, 2010 And 2009, And jAnuARy 1, 2009
notes to the ConsoLidAted FinAnCiAL stAtements
(in millions of Korean won)
Debentures
Bank loans
Finance lease liabilities
Total
Carrying amount
₩149,531
323,767
7,212
₩480,510
Fair value1
₩153,716
323,574
7,197
₩487,537
Carrying amount
₩275,459
293,434
9,024
₩577,917
Fair value1
₩276,247
292,716
8,948
₩577,911
Carrying amount
₩361,148
764,010
10,683
₩1,135,841
Fair value1
₩350,276
762,840
10,326
₩1,123,442
december 31, 2010 december 31, 2009 january 1, 2009
(in millions of Korean won)
Beginning balance
Amortization
Increase
Repayment
Decrease due to spin-off
exchange difference
ending balance
2009
₩ 867,419
1,342
298,653
(506,887)
(209,172)
(17,602)
₩ 433,753
2010
₩ 433,753
533
-
(158,380)
-
13,086
₩ 288,992
(3) Carrying amounts and fair values of non-current borrowings are as follows:
1. Fair values are based on cash flows discounted using Korean won currency note yield (AA+) in the same credit grade with the Company, and borrowing rate quoted by People’s Bank of China and others.
(4) Changes in the carrying amount of debentures for the years ended December 31, 2010 and 2009, are as follows:
(5) Lease liabilities are effectively secured as the rights to the leased assets revert to the lessor in the event of default.
(6) The present value of finance lease liabilities is as follows:(in millions of Korean won)
Within 1 year
1 to 5 years
over 5 years
₩2,481
8,157
-
₩669
945
-
₩1,812
7,212
-
₩2,481
10,637
-
₩822
1,613
-
₩1,659
9,024
-
₩2,480
9,922
₩3,196
₩962
2,313
₩122
₩1,518
7,609
₩3,074
december 31, 2010 december 31, 2009 january 1, 2009
minimum lease
payments
Future finance costs
Present value
minimum ease
payments
Future finance costs
Present value
minimum ease
payments
Future finance costs
Present value

57
Financial statements
(in millions of Korean won)
(in millions of Korean won)
Beginning balance
Additions
Reversals
ending balance
Beginning balance
Additions
Decrease due to spin-off
ending balance
sales returns 1
₩ 3,501
-
(679)
₩ 2,822
sales returns 1
-
3,501
-
₩ 3,501
warranty 2
₩ 1,792
335
-
₩ 2,127
warranty 2
-
5,131
(3,339)
₩ 1,792
total
₩ 5,293
335
(679)
₩ 4,949
total
-
8,632
(3,339)
₩ 5,293
2010
2009
18. PRoVisions Changes in the carrying amount of provisions for the years ended December 31, 2010, and 2009, are as follows:
1. sales return provisions have been accrued for the estimated sales return determined based on historical experience.2. Warranty provisions have been accrued for the estimated warranty service costs to be incurred based on the terms of warranty and historical experience.
(in millions of Korean won)
Current service cost1
Interest cost
expected return on plan assets
Loss from discontinued operations
Curtailment of plan
Past service cost
Total, included in employee benefit expenses
2009
₩ 38,256
12,595
(5,672)
(3,173)
-
-
₩ 42,006
2010
₩ 37,260
10,730
(7,621)
-
7,967
(8,834)
₩ 39,502
(in millions of Korean won)
Present value of obligations*
Fair value of plan assets
Liability in the statement of financial position
december 31, 2009
₩ 219,256
(164,867)
₩ 54,389
january 1, 2009
₩ 248,479
(183,107)
₩ 65,372
december 31, 2010
₩ 162,363
(154,227)
₩ 8,136
19. deFined beneFit LiAbiLity(1)The amounts recognized in the statements of financial position are as follows:
* The present value of retirement benefit obligations is net of existing contributions to the national Pension Plan of ₩1,052 million for the year ended December 31, 2010 (December 31, 2009: ₩1,926 million, January 1,2009: ₩2,756 million).
(2) The amounts recognized in the statements of income for the years ended December 31, 2010 and 2009, are as follows:
1. The above amounts excluded ₩127 million (2009: ₩1,436 million) of expenses capitalized to construction in progress and development costs.

58
LG C
hem
Ann
ual R
epor
t 201
0
deCembeR 31, 2010 And 2009, And jAnuARy 1, 2009
notes to the ConsoLidAted FinAnCiAL stAtements
(in millions of Korean won)
(in millions of Korean won)
(in millions of Korean won)
Cost of sales
selling, general and administrative expenses
Total
Actuarial losses before tax
Income tax effect
Actuarial losses after tax
Beginning balance
Transfer in
Current service cost
Interest expense
Actuarial losses(before tax)
Benefits paid
spin-off
Business combination
Curtailment of plan
settlement of plan
Past service cost
exchange differences
ending balance
2009
₩ 28,505
13,501
₩ 42,006
2009
₩ (10,272)
2,214
₩ (8,058)
2009
₩ 248,479
1,766
36,519
12,595
12,340
(39,414)
(53,029)
-
-
-
-
-
₩ 219,256
2010
₩ 30,366
9,136
₩ 39,502
2010
₩ (17,771)
1,696
₩ (16,075)
2010
₩ 219,256
452
37,387
10,730
16,769
(34,741)
-
3,300
7,967
(90,067)
(8,834)
144
₩ 162,363
(3) The amounts recognized in the statement of income for the years ended December 31, 2010 and 2009, are as follows:
(4) Actuarial gains and losses recognized as other comprehensive income for the years ended December 31, 2010 and 2009, are as follows:
As of December 31, 2010, ₩24,133 million (December 31, 2009: ₩8,058 million; January 1, 2009: ₩ Nil) of accumulated actuarial losses are included in other comprehensive income.
(5) Changes in the carrying amount of defined benefit obligations for the years ended December 31, 2010 and 2009, are as follows:

59
Financial statements
(in millions of Korean won)
Beginning balance
expected return on plan assets
Actuarial gains/(losses) (before tax)
employer contributions
Benefits paid
spin-off
Business combination
settlements of plan
ending balance
2009
₩ 183,107
5,672
2,068
33,000
(22,470)
(36,510)
-
-
₩ 164,867
2010
₩ 164,867
7,621
(1,002)
52,500
(20,388)
-
2,501
(51,872)
₩ 154,227
(in millions of Korean won)
Discount rate
expected return on plan assets
Future salary increase
december 31, 2009
5.7%
5.0%
3.6%
january 1, 2009
6.8%
3.7%
3.6%
december 31, 2010
5.7%
4.3%
4.7%
(6) Changes in the fair value of plan assets for the years ended December 31, 2010 and 2009, are as follows:
(7) The actual return on plan assets was ₩6,619 million (2009: ₩7,740 million).
(8) The principal actuarial assumptions used are as follows:
(in millions of Korean won)
equity instruments
Time deposits
Insurance contracts
with guaranteed yield
Total 1
Amount
29,669
54,901
69,657
₩154,227
Proportion
20%
36%
44%
100%
Amount
-
-
164,867
₩164,867
Proportion
0%
0%
100%
100%
Amount
-
-
183,107
₩183,107
Proportion
0%
0%
100%
100%
december 31, 2010 december 31, 2009 january 1, 2009
(10) Plan assets consist of:
1. Based on management’s estimation, the expected contributions to plan assets for the year ending December 31, 2011 are ₩20,498 million.
(in millions of Korean won)
Discount rate:
Increase(decrease) of defined benefit obligations
decrease by 1%
₩ 14,638
increase by 1%
₩ (12,651)
(9) The sensitivity analysis for changes in key actuarial assumptions is as follows:

60
LG C
hem
Ann
ual R
epor
t 201
0
deCembeR 31, 2010 And 2009, And jAnuARy 1, 2009
notes to the ConsoLidAted FinAnCiAL stAtements
(in millions of Korean won)
Present value of defined benefit obligations
Fair value of plan assets
Deficit in the plan
experience adjustments on plan liabilities
experience adjustments on plan assets
december 31, 2009
₩ 219,256
(164,867)
54,389
(4,674)
₩ 2,068
december 31, 2010
₩ 162,363
(154,227)
8,136
(20,393)
₩ (1,002)
(in millions of Korean won)
(Korean won in millions, foreign currencies in millions)
Advances from customers
Dividends payable
value added tax withheld
Withholding
Advance income
others
total
Classification
Limit of bank overdraft
Limit of the import letters of credit
Limit of the local letters of credit
Limit of discount of notes from export
Limit of derivative financial instruments
Limit of loan arrangements
Limit of discount of other notes
Comprehensive lines of credit
december 31, 2009
₩ 32,331
61
-
40,880
9,991
10,170
₩ 93,433
KRw
64,000
-
-
-
-
30,500
210,000
1,554,500
usd
32
23
-
445
30
225
-
1,070
Cny
435
-
1,840
-
-
-
-
-
euR
32
-
-
-
-
-
-
-
inR
-
-
-
-
-
561
-
5,001
PLn
-
-
-
-
-
1
-
-
january 1, 2009
₩ 28,184
51
(21)
49,068
10,833
1,925
₩ 90,040
december 31, 2010
₩ 28,188
43
2,111
35,121
10,609
21,599
₩ 97,671
(11) The amounts of experience adjustments on the defined benefit obligations and the plan assets are as follows:
20. otheR CuRRent LiAbiLitiesother current liabilities consist of:
21. Commitments And ContinGenCies
(1) The Company and the newly established company, LG Hausys Ltd., are jointly liable for the obligations outstanding as of April 1, 2009, the spin-off date.
(2) As of December 31, 2010 and 2009, the Company has been provided with guarantees from the Seoul Guarantee Insurance for the execution of supply contracts.
(3) As of December 31, 2010, the Company has provided one blank promissory note to the Korea National oil Corporation as collateral in relation to petroleum import surcharges.
(4) As of December 31, 2010, the Company has various specific and comprehensive line of credit agreements with several financial institutions, as follows:

61
Financial statements
(5) As of December 31, 2010, the Company has entered into B2B purchase arrangements with several financial institutions.
(6) As of December 31, 2010, the Company has been named as a plaintiff for 30 legal actions involving ₩9,812 million in claims and defendant for 16 legal actions with ₩5,570 million in claims. The ultimate outcome of these cases cannot be determined at this time.
(7) As of December 31, 2010, the Company has entered into technology license agreements with KBR and other companies for the production of polymer and rubber products. Further, the Company has entered into manufacture and production technical contracts with exxon Mobile and others.
(8) The Company has entered into a license agreement with LG Corp. to use trademarks on the products that the Company manufactures and sells, and on the services the Company provides in relation to its business.
(9) As of December 31, 2010, the Company has a long-term purchase contract for certain raw materials and was provided with a US$ 68 million guarantee for this contract. Further, as of December 31, 2010, the Company provided a US$ 17 million guarantee in regard to a purchase contract for certain raw materials.
(10) As of the reporting date, the Company has guaranteed the repayment of various obligations of its subsidiaries and associates. The outstanding balance of such guarantees as of December 31, 2010, amounts to US$ 170 million, eUR 1 million and PLN 32,000 million (total equivalent to ₩207,744 million) (2009: US$ 155 million, eUR 3 million and PLN 32 million, total equivalent to ₩199,533 million). Details of guarantees provided as of December 31, 2010 and 2009, are as follows:
(in millions of Korean won)
Guarantor
The Parent Company
LG Chem (China) Investment Co., Ltd.
Guarantee beneficiary
LG Chem (nanjing) Information & electronics
materials Co., Ltd.
〃
〃
LG Chem Poland sp.Zoo.
LG Chem America, Inc.
LG Chem michigan, Inc.
LG Chem Power, Inc.
LG Chem Power, Inc.
LG Chem Display materials Co., Ltd.
Amount of
guarantee
₩66,455
22,778
34,167
13,731
5,695
39,862
11,389
11,389
2,278
₩207,744
Financial institution
Bank of China
Woori Bank
export-Import Bank of Korea
nordea Bank
Bank of America
Bank of America
Woori Bank
Comerica Bank
Agricultural Bank of China
outstanding loan
amount
₩66,455
22,778
34,167
8,865
-
20,272
3,417
2,278
2,278
₩160,510
2010

62
LG C
hem
Ann
ual R
epor
t 201
0
deCembeR 31, 2010 And 2009, And jAnuARy 1, 2009
notes to the ConsoLidAted FinAnCiAL stAtements
(in millions of Korean won)
Guarantor
The Parent Company
LG Chem (China) Investment Co., Ltd.
Guarantee beneficiary
LG Chem (nanjing) Information & electronics
materials Co., Ltd.
〃
〃
Tianjin LG Bohai Chemical Co., Ltd.
LG Chem Poland sp.Z.o.o.
LG hausys America, Inc.
LG Chem America, Inc.
LG Chem michigan, Inc.
LG Chem Display materials Co., Ltd.
Amount of
guarantee
₩68,129
23,352
35,028
3,892
17,989
29,540
11,676
5,838
4,089
₩199,533
Financial institution
Bank of China
Woori Bank
export-Import Bank of Korea
export-Import Bank of Korea
nordea Bank
Kookmin Bank
Bank of America
Bank of America
Agricultural Bank of China
outstanding loan
amount
₩63,377
23,352
35,028
3,892
11,261
29,540
-
3,503
4,089
₩174,042
2009
Property, plant and equipment
december 31, 2009
₩ 887,183
december 31, 2010
₩ 1,136,056
(in millions of Korean won)
January 1, 2009
spin-off
December 31, 2009
offset of loss on capital reduction
December 31, 2010
number of shares
₩75,238,770
(8,967,670)
66,271,100
-
₩66,271,100
Amount
₩376,194
(44,838)
331,356
-
₩331,356
number of shares
₩8,661,251
(1,032,330)
7,628,921
-
₩7,628,921
Amount
₩43,306
(5,162)
38,144
-
₩38,144
share premium
₩1,052,640
(155,216)
897,424
-
₩897,424
Loss on capital reduction
-
(464,272)
(464,272)
464,272
-
ordinary shares Preferred shares
22. eQuity(1) Changes in share capital and share premium are as follows:
(in millions of Korean won)(11) Capital expenditure contracted for at the end of the year but not yet incurred is as follows:
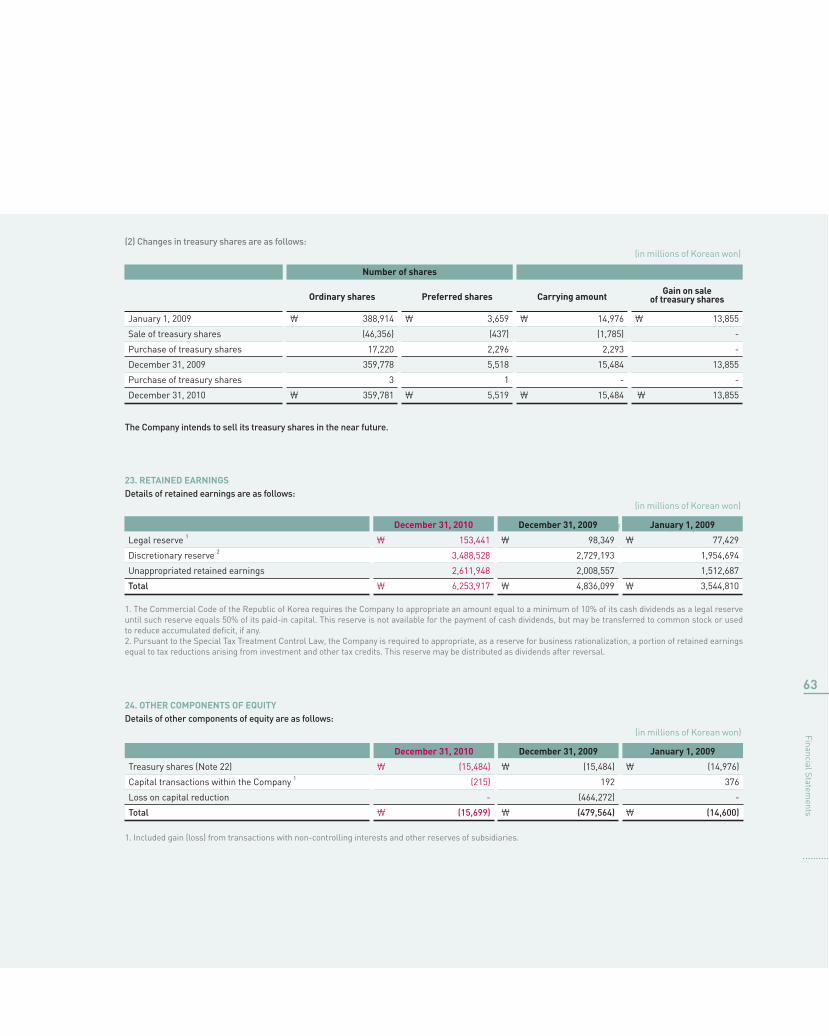
63
Financial statements
(in millions of Korean won)
January 1, 2009
sale of treasury shares
Purchase of treasury shares
December 31, 2009
Purchase of treasury shares
December 31, 2010
ordinary shares
₩ 388,914
(46,356)
17,220
359,778
3
₩ 359,781
Preferred shares
₩ 3,659
(437)
2,296
5,518
1
₩ 5,519
Carrying amount
₩ 14,976
(1,785)
2,293
15,484
-
₩ 15,484
Gain on sale of treasury shares
₩ 13,855
-
-
13,855
-
₩ 13,855
number of shares
(2) Changes in treasury shares are as follows:
The Company intends to sell its treasury shares in the near future.
(in millions of Korean won)
Treasury shares (note 22)
Capital transactions within the Company 1
Loss on capital reduction
Total
december 31, 2009
₩ (15,484)
192
(464,272)
₩ (479,564)
january 1, 2009
₩ (14,976)
376
-
₩ (14,600)
december 31, 2010
₩ (15,484)
(215)
-
₩ (15,699)
24. otheR ComPonents oF eQuityDetails of other components of equity are as follows:
1. Included gain (loss) from transactions with non-controlling interests and other reserves of subsidiaries.
(in millions of Korean won)
(in millions of Korean won, except for ratios)Legal reserve 1
Discretionary reserve 2
Unappropriated retained earnings
Total
december 31, 2009
₩ 98,349
2,729,193
2,008,557
₩ 4,836,099
january 1, 2009
₩ 77,429
1,954,694
1,512,687
₩ 3,544,810
december 31, 2010
₩ 153,441
3,488,528
2,611,948
₩ 6,253,917
23. RetAined eARninGsDetails of retained earnings are as follows:
1. The Commercial Code of the Republic of Korea requires the Company to appropriate an amount equal to a minimum of 10% of its cash dividends as a legal reserve until such reserve equals 50% of its paid-in capital. This reserve is not available for the payment of cash dividends, but may be transferred to common stock or used to reduce accumulated deficit, if any.2. Pursuant to the special Tax Treatment Control Law, the Company is required to appropriate, as a reserve for business rationalization, a portion of retained earnings equal to tax reductions arising from investment and other tax credits. This reserve may be distributed as dividends after reversal.
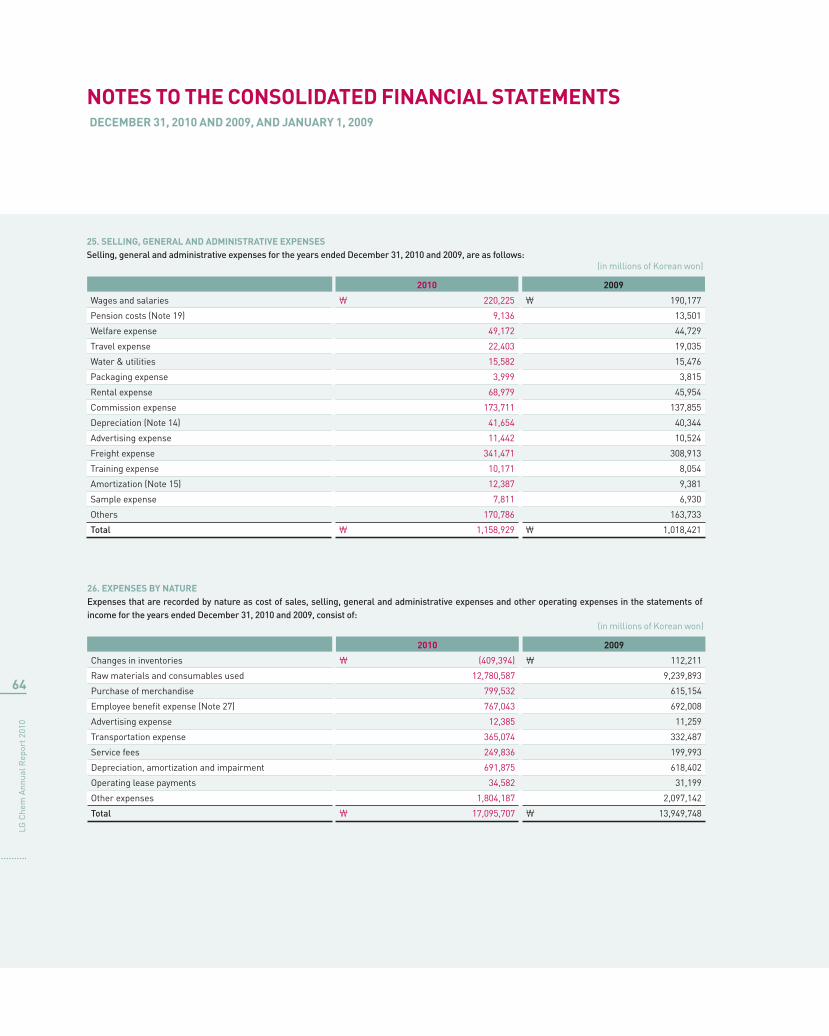
64
LG C
hem
Ann
ual R
epor
t 201
0
deCembeR 31, 2010 And 2009, And jAnuARy 1, 2009
notes to the ConsoLidAted FinAnCiAL stAtements
(in millions of Korean won)
Changes in inventories
Raw materials and consumables used
Purchase of merchandise
employee benefit expense (note 27)
Advertising expense
Transportation expense
service fees
Depreciation, amortization and impairment
operating lease payments
other expenses
Total
2009
₩ 112,211
9,239,893
615,154
692,008
11,259
332,487
199,993
618,402
31,199
2,097,142
₩ 13,949,748
2010
₩ (409,394)
12,780,587
799,532
767,043
12,385
365,074
249,836
691,875
34,582
1,804,187
₩ 17,095,707
26. exPenses by nAtuReexpenses that are recorded by nature as cost of sales, selling, general and administrative expenses and other operating expenses in the statements of income for the years ended December 31, 2010 and 2009, consist of:
(in millions of Korean won)
Wages and salaries
Pension costs (note 19)
Welfare expense
Travel expense
Water & utilities
Packaging expense
Rental expense
Commission expense
Depreciation (note 14)
Advertising expense
Freight expense
Training expense
Amortization (note 15)
sample expense
others
Total
2009
₩ 190,177
13,501
44,729
19,035
15,476
3,815
45,954
137,855
40,344
10,524
308,913
8,054
9,381
6,930
163,733
₩ 1,018,421
2010
₩ 220,225
9,136
49,172
22,403
15,582
3,999
68,979
173,711
41,654
11,442
341,471
10,171
12,387
7,811
170,786
₩ 1,158,929
25. seLLinG, GeneRAL And AdministRAtiVe exPensesSelling, general and administrative expenses for the years ended December 31, 2010 and 2009, are as follows:

65
Financial statements
(in millions of Korean won)
(in millions of Korean won)
Wages and salaries
Pension costs (note 19)
others
Total
Foreign exchange gain
Gain on foreign currency translation
Gain on disposal of property, plant and equipment
Gain on disposal of intangible assets
others
Total
2009
₩ 605,058
42,006
44,944
₩ 692,008
2009
₩ 467,098
29,230
490
696
29,170
₩ 526,684
2010
₩ 679,633
39,502
47,908
₩ 767,043
2010
₩ 387,502
18,712
4,667
-
34,704
₩ 445,585
27. emPLoyee beneFit exPense
28. otheR oPeRAtinG inComeDetails of other operating income for the years ended December 31, 2010 and 2009, are as follows:
(in millions of Korean won)
Foreign exchange loss
Loss on foreign currency translation
Loss on disposal of property, plant and equipment
Loss on disposal of intangible assets
Impairment loss on property, plant and equipment
Impairment loss on intangible assets
others
Total
2009
₩ 477,676
20,904
27,246
1,116
56,138
16,948
70,325
₩ 670,353
2010
₩ 392,481
16,433
12,080
727
19,765
-
22,692
₩ 464,178
29. otheR oPeRAtinG exPensesDetail of other operating expenses for the years ended December 31, 2010 and 2009, are as follows:

66
LG C
hem
Ann
ual R
epor
t 201
0
deCembeR 31, 2010 And 2009, And jAnuARy 1, 2009
notes to the ConsoLidAted FinAnCiAL stAtements
(in millions of Korean won)
(in millions of Korean won)
(in millions of Korean won)
Interest on bank overdraft and borrowings
Interest on finance lease liabilities
Interest on debentures
other interest expenses
Capitalized interest for qualifying assets
Total
Bank deposits
Financial assets classified as available- for- sale
other loans and receivables
Total
Financial income
Interest income1
Dividend income
Foreign exchange gain
Gain on foreign currency translation
Gain on settlement of trading derivatives
Gain on settlement of hedging derivatives
Gain on valuation of trading derivatives
Gain on valuation of hedging derivatives
others
Total
Financial expense
Interest expense 2
Foreign exchange loss
Loss on foreign exchange translations
Loss on settlement of trading derivatives
Loss on valuation of trading derivatives
Loss on settlement of hedging derivatives
others
Total
2009
₩ 68,023
962
26,429
17,729
(9,270)
₩ 103,873
2009
₩ 18,219
613
238
₩ 19,070
2009
₩ 19,070
567
78,450
50,497
-
31,474
-
378
4,293
184,729
103,873
84,962
1,906
-
22,136
23,113
15
₩ 236,005
2010
₩ 57,020
822
8,994
13,336
(18,922)
₩ 61,250
2010
₩ 26,406
11
273
₩ 26,690
2010
₩ 26,690
279
59,940
20,328
9,995
2,415
2,194
13,426
2,214
137,481
61,250
74,072
16,793
29,199
-
1,118
499
₩ 182,931
30. FinAnCiAL inCome And exPenseDetails of financial income and expense for the years ended December 31, 2010 and 2009, are as follows:
1. Details of interest income are as follows:
2. Details of interest expense are as follows:

67
Financial statements
(in millions of Korean won)
(in millions of Korean won)
Current tax on profit for the year
Adjustments in respect of prior years
Deferred tax
Subtotal
Current tax charged directly to equity
Income tax expense
Current tax
Actuarial loss on defined benefit liability
Deferred tax
other consolidated comprehensive income
Actuarial loss on defined benefit liability
Cash flow hedges
Currency translation differences
Total
2009*
₩ 423,255
5,475
3,508
432,238
-
₩ 432,238
2009
₩ -
(252)
2,214
(3,753)
(227)
₩ (2,018)
2010
₩ 608,333
24,493
(18,064)
614,762
3,910
₩ 618,672
2010
₩ 3,910
115
(2,214)
(1,224)
241
₩ (3,082)
31. inCome tAxes(1) Details of income tax expense are as follows:
(2) The income taxes charged directly to other comprehensive income during the years ended December 31, 2010 and 2009, are as follows:
* Includes income tax expense related to discontinued operations.
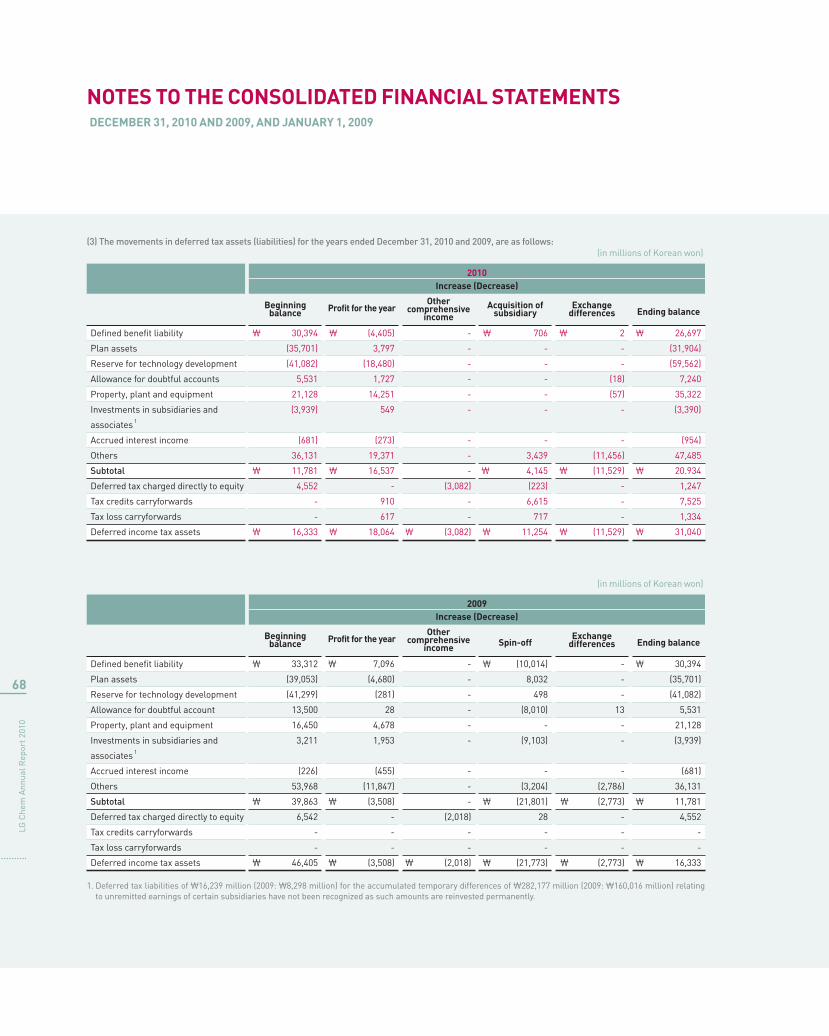
68
LG C
hem
Ann
ual R
epor
t 201
0
deCembeR 31, 2010 And 2009, And jAnuARy 1, 2009
notes to the ConsoLidAted FinAnCiAL stAtements
(in millions of Korean won)
(in millions of Korean won)
Defined benefit liability
Plan assets
Reserve for technology development
Allowance for doubtful accounts
Property, plant and equipment
Investments in subsidiaries and
associates 1
Accrued interest income
others
Subtotal
Deferred tax charged directly to equity
Tax credits carryforwards
Tax loss carryforwards
Deferred income tax assets
Defined benefit liability
Plan assets
Reserve for technology development
Allowance for doubtful account
Property, plant and equipment
Investments in subsidiaries and
associates 1
Accrued interest income
others
Subtotal
Deferred tax charged directly to equity
Tax credits carryforwards
Tax loss carryforwards
Deferred income tax assets
₩30,394
(35,701)
(41,082)
5,531
21,128
(3,939)
(681)
36,131
₩11,781
4,552
-
-
₩16,333
₩33,312
(39,053)
(41,299)
13,500
16,450
3,211
(226)
53,968
₩39,863
6,542
-
-
₩46,405
₩ (4,405)
3,797
(18,480)
1,727
14,251
549
(273)
19,371
₩16,537
-
910
617
₩18,064
₩7,096
(4,680)
(281)
28
4,678
1,953
(455)
(11,847)
₩(3,508)
-
-
-
₩(3,508)
-
-
-
-
-
-
-
-
-
(3,082)
-
-
₩(3,082)
-
-
-
-
-
-
-
-
-
(2,018)
-
-
₩(2,018)
₩706
-
-
-
-
-
-
3,439
₩4,145
(223)
6,615
717
₩11,254
₩(10,014)
8,032
498
(8,010)
-
(9,103)
-
(3,204)
₩(21,801)
28
-
-
₩(21,773)
₩2
-
-
(18)
(57)
-
-
(11,456)
₩(11,529)
-
-
-
₩(11,529)
-
-
-
13
-
-
-
(2,786)
₩(2,773)
-
-
-
₩(2,773)
₩26,697
(31,904)
(59,562)
7,240
35,322
(3,390)
(954)
47,485
₩20.934
1,247
7,525
1,334
₩31,040
₩30,394
(35,701)
(41,082)
5,531
21,128
(3,939)
(681)
36,131
₩11,781
4,552
-
-
₩16,333
2010
2009
increase (decrease)
increase (decrease)
Profit for the yearbeginningbalance
other comprehensive
incomeAcquisition of
subsidiaryexchange
differences ending balance
Profit for the yearbeginningbalance
other comprehensive
income spin-offexchange
differences ending balance
(3) The movements in deferred tax assets (liabilities) for the years ended December 31, 2010 and 2009, are as follows:
1. Deferred tax liabilities of ₩16,239 million (2009: ₩8,298 million) for the accumulated temporary differences of ₩282,177 million (2009: ₩160,016 million) relating to unremitted earnings of certain subsidiaries have not been recognized as such amounts are reinvested permanently.

69
Financial statements
(in millions of Korean won)
(in millions of Korean won)
Profit before income tax
Profit before income tax from continuing operations
Loss before income tax from discontinued operations
Tax calculated based on applicable tax rate1
Tax adjustments
Income not subject to tax
expenses not deductible for tax purposes
Unrecognized deferred income tax for temporary differences
in the current year
Tax credit
others
Income tax expense2
effective tax rate60(income tax expense/profit before income tax)
Profit attributable to ordinary shares 1
Profit from continuing operations attributable to ordinary shares
Loss from discontinued operations attributable to ordinary shares
Weighted average number of ordinary shares outstanding 2
Basic earnings per ordinary share (in won)
earnings per ordinary share from continuing operations
earnings(losses) per ordinary share from discontinued operations
2009
₩ 1,971,435
2,015,392
(43,957)
466,745
(34,507)
(11,982)
5,693
(308)
(45,677)
17,767
₩ 432,238
21.93%
2009
₩ 1,351,814
1,381,022
(29,208)
68,116,575
19,846
20,274
₩ (428)
2010
₩ 2,818,437
2,818,437
-
663,321
(44,649)
(4,516)
8,998
(97)
(78,627)
29,593
₩ 618,672
21.95%
2010
₩ 1,934,166
1,934,166
-
65,911,322
29,345
29,345
-
(4) The reconciliation between income tax expense and accounting profit is as follows:
1. The weighted average applicable tax rate on profit before income tax is 23.54% (2009: 23.68%).2. Income tax related to discontinued operations is included.
(5) Realization of the future tax benefits related to the deferred tax assets is dependent on many factors, including the Company’s ability to generate taxable income within the period during which the temporary differences reverse, the outlook of the economic environment, and the overall future industry outlook. Management periodically considers these factors in reaching its conclusion. The Company did not recognize deferred income tax assets of ₩7,942 million (2009: ₩1,409 million) for the tax loss carryforwards of ₩26,943 million (2009: ₩3,748 million).
32. eARninGs PeR shAReBasic earnings per share is calculated by dividing the profit attributable to shareholders of the Parent Company by the weighted average number of shares in issue excluding shares purchased by the Parent Company and held as treasury shares. As of the reporting date, the Parent Company has no potential ordinary shares. Preferred shares have a right to participate in the profits of the Parent Company. These participation rights have been considered in presenting the ePS for ordinary shares and preferred shares.
(1) Basic earnings per share attributable to the owners of the Parent Company for years ended December 31, 2010 and 2009, is computed as follows:

70
LG C
hem
Ann
ual R
epor
t 201
0
deCembeR 31, 2010 And 2009, And jAnuARy 1, 2009
notes to the ConsoLidAted FinAnCiAL stAtements
(in millions of Korean won)
Profit from continuing operations
ordinary shares dividends (A)
Preferred shares dividends (B)
Undistributed earnings from continuing operations
Continuing operations available for ordinary shares (C)
Continuing operations available for preferred shares (D)
Profit from continuing operations attributable to ordinary shares (A+C)
Profit from continuing operations attributable to preferred shares (B+D)
Loss from discontinued operations
Discontinued operations attributable to ordinary shares
Discontinued operations attributable to preferred shares
2009
₩ 1,541,134
230,689
27,063
1,283,382
1,150,333
133,049
1,381,022
160,112
(32,586)
(29,208)
₩ (3,378)
2010
₩ 2,158,256
263,645
30,875
1,863,736
1,670,521
193,215
1,934,166
224,090
-
-
-
(in millions of Korean won)
(in millions of Korean won)
Period
2010.01.01~2010.12.31
2010.12.31~2010.12.31
number of shares
₩ 7,623,403
(1)
number of days
₩ 365
1
number of shares x days
₩ 2,782,542,095
(1)
₩ 2,782,542,094
2010
2010
Period
2010.01.01~2010.12.31
2010.12.31~2010.12.31
number of shares
₩ 65,911,322
(3)
number of days
₩ 365
1
number of shares x days
₩ 24,057,632,530
(3)
₩ 24,057,632,527
ordinary shares
Beginning
Purchase of treasury shares
Total
Preferred shares
Beginning
Purchase of treasury shares
Total
2. Weighted average numbers of shares are calculated as follows:
Weighted average number of ordinary shares outstanding: 24,057,632,527 / 365 = 65,911,322 shares
Weighted average number of preferred shares outstanding: 2,782,542,094 / 365 = 7,623,403 shares
(in millions of Korean won)
Profit attributable to preferred shares1
Profit from continuing operations attributable to preferred shares
Loss from discontinued operations attributable to preferred shares
Weighted average number of preferred shares outstanding2
Basic earnings per preferred share (in won)
earnings per preferred share from continuing operations
earnings(loss) per preferred share from discontinued operations
2009
₩ 156,734
160,112
(3,378)
7,878,573
19,894
20,322
₩ (428)
2010
₩ 224,090
224,090
-
7,623,403
29,395
29,395
-
1. Profit attributable to ordinary and preferred shares are as follows:
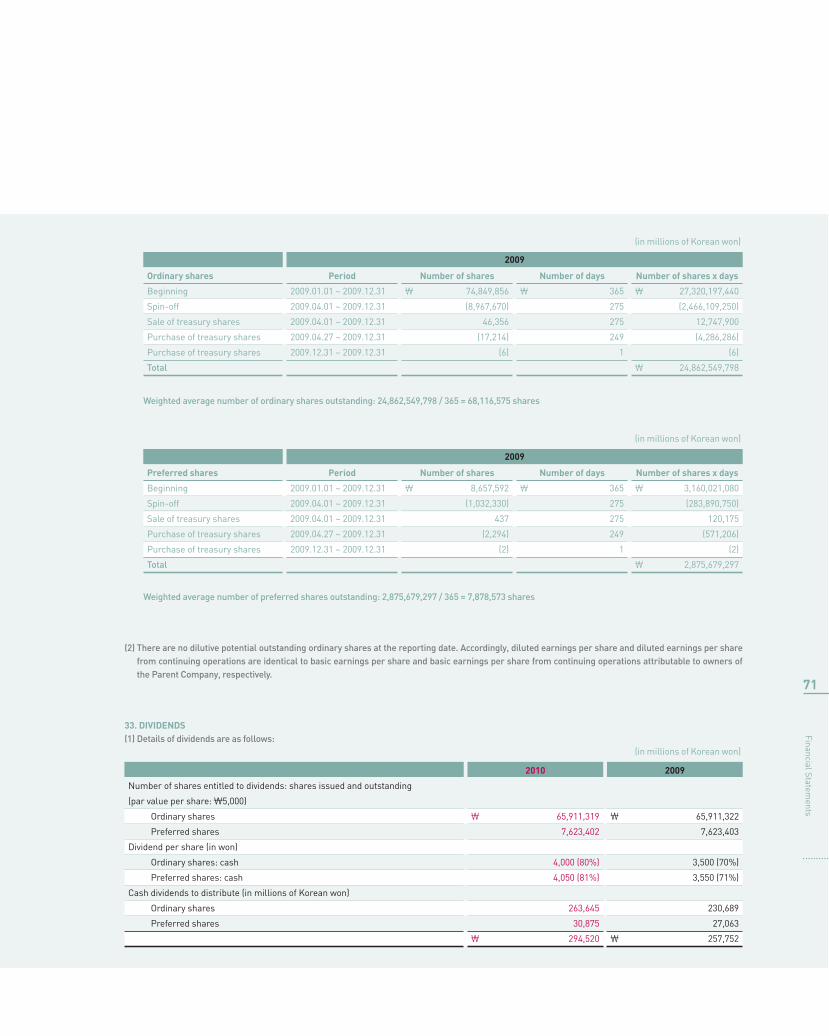
71
Financial statements
(in millions of Korean won)
(in millions of Korean won)
Period
2009.01.01 ~ 2009.12.31
2009.04.01 ~ 2009.12.31
2009.04.01 ~ 2009.12.31
2009.04.27 ~ 2009.12.31
2009.12.31 ~ 2009.12.31
Period
2009.01.01 ~ 2009.12.31
2009.04.01 ~ 2009.12.31
2009.04.01 ~ 2009.12.31
2009.04.27 ~ 2009.12.31
2009.12.31 ~ 2009.12.31
number of shares
₩ 74,849,856
(8,967,670)
46,356
(17,214)
(6)
number of shares
₩ 8,657,592
(1,032,330)
437
(2,294)
(2)
number of days
₩ 365
275
275
249
1
number of days
₩ 365
275
275
249
1
number of shares x days
₩ 27,320,197,440
(2,466,109,250)
12,747,900
(4,286,286)
(6)
₩ 24,862,549,798
number of shares x days
₩ 3,160,021,080
(283,890,750)
120,175
(571,206)
(2)
₩ 2,875,679,297
2009
2009
ordinary shares
Beginning
spin-off
sale of treasury shares
Purchase of treasury shares
Purchase of treasury shares
Total
Preferred shares
Beginning
spin-off
sale of treasury shares
Purchase of treasury shares
Purchase of treasury shares
Total
(in millions of Korean won)
number of shares entitled to dividends: shares issued and outstanding
(par value per share: ₩5,000)
ordinary shares
Preferred shares
Dividend per share (in won)
ordinary shares: cash
Preferred shares: cash
Cash dividends to distribute (in millions of Korean won)
ordinary shares
Preferred shares
2009
₩ 65,911,322
7,623,403
3,500 (70%)
3,550 (71%)
230,689
27,063
₩ 257,752
2010
₩ 65,911,319
7,623,402
4,000 (80%)
4,050 (81%)
263,645
30,875
₩ 294,520
Weighted average number of ordinary shares outstanding: 24,862,549,798 / 365 = 68,116,575 shares
Weighted average number of preferred shares outstanding: 2,875,679,297 / 365 = 7,878,573 shares
(2) There are no dilutive potential outstanding ordinary shares at the reporting date. Accordingly, diluted earnings per share and diluted earnings per share from continuing operations are identical to basic earnings per share and basic earnings per share from continuing operations attributable to owners of the Parent Company, respectively.
33. diVidends(1) Details of dividends are as follows:

72
LG C
hem
Ann
ual R
epor
t 201
0
deCembeR 31, 2010 And 2009, And jAnuARy 1, 2009
notes to the ConsoLidAted FinAnCiAL stAtements
(in millions of Korean won)
(in millions of Korean won)
Dividends (A)
Profit for the year attributable to owners of the parent company (B)
Dividend payout ratio (A/B)
Revenue
Cost of sales
Gross profit
selling, general and administrative expenses
other operating income
other operating expenses
operating loss
Financial income
Financial expenses
share of loss of associates
other non-operating expenses
Loss before income tax
Income tax expense
Loss after income tax
2009
₩ 257,752
1,508,546
17.09%
2010
₩ 294,520
2,158,256
13.65%
2009
₩ 416,081
(338,267)
77,814
(105,249)
4,723
(11,804)
(34,516)
13,891
(22,959)
(171)
(202)
(43,957)
10,941
₩ (33,016)
(in Korean won)
ordinary shares
₩ 4,000
391,000
1.02%
Preferred shares
₩ 4,050
159,000
2.55%
ordinary shares
₩ 3,500
228,500
1.53%
Preferred shares
₩ 3,550
82,500
4.30%
2010 2009
Dividend per share (A)
market value at the end of year (B)
Dividend yield ratio (A/B)
(2) Dividend payout ratios for the years ended December 31, 2010 and 2009 are as follows:
(3) Dividend yield ratios for the years ended December 31, 2010 and 2009, are as follows:
34. disContinued oPeRAtions(1) Pursuant to a resolution of the Board of Directors on December 2, 2008, and an approval by the shareholders on January 23, 2009, the Company spun off
its Industrial Materials segment to the newly established LG Hausys, Ltd. on April 1, 2009. The consolidated financial statements have been prepared in accordance with Korean IFRIC 2117, ‘Distributions of Non-cash Assets to owners’.
(2) The statement of income for discontinued operations is as follows:

73
Financial statements
(in millions of Korean won)
(in millions of Korean won)
Wages and salaries
Pension costs
other long-term employee benefits
Total
operating cash flows
Investing cash flows
Financing cash flows
Total cash flows
2009
₩ 51,055
2,122
10,200
₩ 63,377
2010
₩ 33,768
2,621
11,625
₩ 48,014
2009
₩ (23,554)
(20,201)
25,270
₩ (18,485)
(in millions of Korean won)
sales
₩ 2
128,534
-
17,691
₩ 146,227
Purchases
₩ 42,705
217,036
48,014
588,844
₩ 896,599
sales
-
151,746
-
11,606
₩ 163,352
Purchases
₩ 37,677
197,346
63,377
416,273
₩ 714,673
2010 2009
entities with significant influence over
the Company1
Associates
Key management
others 2
Total
(in millions of Korean won)
entities with significant influence over
the Company1
Associates
Key management
others 2
Total
Receivables
₩5,541
1,325
-
31,100
₩37,966
Payables
₩6,923
18,961
51,768
142,247
₩ 219,899
Receivables
₩ 5,276
16,783
-
30,717
₩ 52,776
Payables
₩1,943
18,329
36,438
102,868
₩159,578
Receivables
₩7,723
15,877
-
39,032
₩62,632
Payables
₩6,024
9,885
53,640
63,322
₩132,871
december 31, 2010 december 31, 2009 january 1, 2009
(3) Cash flows from the discounted operations are as follows:
35. ReLAted PARty tRAnsACtions(1) Significant transactions, which occurred in the ordinary course of business with related parties for the years ended December 31, 2010 and 2009, and the related account balances as of December 31, 2010 and 2009, and January 1, 2009 are summarized as follows:
1. The largest shareholder of the Company is LG Corp., which owns 33.53% of the Company’s ordinary shares (note 1). 2. Includes LG Corp.’s subsidiaries.
(2) Compensation for key management officers of the Company for the years ended December 31, 2010 and 2009, consists of:
Key management includes directors and audit committee members having duties and responsibilities over planning, operations and controlling of the Company’s business activities.

74
LG C
hem
Ann
ual R
epor
t 201
0
deCembeR 31, 2010 And 2009, And jAnuARy 1, 2009
notes to the ConsoLidAted FinAnCiAL stAtements
(in millions of Korean won)
(in millions of Korean won)
Profit before income tax
Adjustments for:
Depreciation
Amortization
Pension costs
Financial income
Financial expense
Foreign exchange differences
Gain on disposal of property, plant and equipment
Loss on disposal of property, plant and equipment
Gain on disposal of intangible assets
Loss on disposal of intangible assets
other expenses
Inventories
Trade receivables
other receivables
settlement of derivatives
Trade payables
other payables
Defined benefit liability
other cash flows from operations
Cash generated from operations
Transfer of construction-in-progress
Transfer of machinery-in-transit
Reclassification of current maturities of borrowings
Gain(loss) on valuation of derivatives recognized as other comprehensive income
2009*
₩ 1,971,435
567,885
16,936
45,179
(109,615)
116,379
(150,654)
(759)
33,998
(696)
1,116
115,688
60,291
(644,117)
(15,878)
11,807
726,707
183,100
(56,273)
13,968
₩ 2,886,497
2009
₩ 702,426
164,882
539,512
₩ 12,488
2010
₩ 2,818,437
654,183
17,927
39,502
(76,611)
112,592
(19,435)
(4,667)
12,080
-
727
(40,810)
(533,932)
(155,999)
7,689
(18,866)
125,009
160,014
(111,821)
(299)
₩ 2,985,720
2010
₩ 923,165
180,242
360,694
₩ 5,795
(3) The receivables from related parties are mainly from sales transactions. The receivables are unsecured in nature and bear no interest. There are no provisions held against receivables from related parties (2009: Nil).
(4) Details of the guarantees provided by the Company for related parties at the reporting date are disclosed in Note 21.
36. CAsh GeneRAted FRom oPeRAtions(1) Reconciliation between operating profit and net cash inflow (outflow) from operating activities for the years ended December 31, 2010 and 2009, follows:
* Discontinued operating income is included.
(2) The principal non-cash transactions for the years ended December 31, 2010 and 2009, are as follows:

75
Financial statements
(in millions of Korean won)
I. Current assets
Cash and cash equivalents
Trade receivables
Inventories
other current assets
II. non-current assets
Property, plant and equipment
other non-current assets
Total assets (A)
I. Current liabilities
II. non-current liabilities
Total liabilities (B)
Fair value of net assets (C=A-B)
Consideration transferred (D)1
Gain from a bargain purchase (C-D)
Fair value
₩ 144,560
12,398
71,343
39,656
21,163
171,313
149,463
21,850
315,873
114,286
52,908
167,194
148,679
148,554
₩ 125
Acquiree’s carrying amount
₩ 144,560
12,398
71,343
39,656
21,163
170,194
148,344
21,850
314,754
114,286
52,976
167,262
₩
37. business CombinAtionIn order to enhance business efficiency as well as to create synergy effect, based on the resolution of the board of directors on July 1, 2010, on october 1, 2010, the Company acquired the remaining 50% of the share capital of LG Polycarbonate Ltd. (the “Acquiree”), in which the Company had previously owned 50% of the share capital. As the acquisition was accounted for using the acquisition method in accordance with Korean IFRS 1103, the assets acquired and liabilities assumed from the acquisition were measured at fair value.
(1) Details of the identifiable assets and liabilities as of october 1, 2010, arising from the acquisition are as follows :
1. Consideration transferred consists of the fair value of the previously held equity interest(₩ 74,184 million) and the cash consideration paid for the additional acquisition of the remaining share capital (₩ 74,370 million).
(2) The Company re-measured its previously held equity interest in the acquiree at its acquisition-date fair value. The acquisition-date fair value and the related loss recognized in the consolidated statement of income amounted to ₩74,184 million and ₩498 million, respectively.
(3) The ₩125 million of gain from a bargain purchase was recognized as other operating income in the consolidated statement of income from the above business combination. The gain from a bargain purchase was recognized as cost of acquisition was less than the fair value of the net assets acquired.
(4) The fair value of trade and other receivables acquired from LG Polycarbonate Ltd. is ₩75,119 million. The gross contractual amount for these trade and other receivables is ₩75,774 million, of which ₩655 million is expected to be uncollectible.
(in millions of Korean won)
Trade receivables
other receivables
Total
Gross contractual amount
₩ 71,998
3,776
₩ 75,774
Amount expected to be uncollectible
₩ 655
-
₩ 655
Fair value
₩ 71,343
3,776
₩ 75,119
(5) The acquired business contributed revenues of ₩97,932 million and net loss of ₩3,912 million for the Company for the period from october 1, 2010 to December 31, 2010.
(6) If the acquisition had occurred on January 1, 2010, the consolidated revenue and consolidated profit for the year ended December 31, 2010, would have increased by ₩228,071 million and ₩6,003 million, respectively.

76
LG C
hem
Ann
ual R
epor
t 201
0
deCembeR 31, 2010 And 2009, And jAnuARy 1, 2009
notes to the ConsoLidAted FinAnCiAL stAtements
38. APPRoVAL oF FinAnCiAL stAtementsThe consolidated financial statements for the year ended December 31, 2010, were approved by the Board of Directors on February 22, 2011.
39. tRAnsition to KoReAn iFRs
39.1 the FiRst AdoPtion oF KoReAn iFRsThe Company’s transition date to Korean IFRS is January 1, 2009, and adoption date is January 1, 2010. The financial statements for the year beginning January 1, 2009, are the first annual financial statements compliant with Korean IFRS. The reporting date of consolidated financial statements is December 31, 2010.
39.2 exemPtions eLeCted by the ComPAnyThe Company has elected to apply the following optional exemptions from full retrospective application.
1) Business combinationThe Company has not retrospectively applied Korean IFRS 1103 to the business combinations that took place prior to the transition date of January 1, 2009.
2) Cumulative translation differences The Company has elected to set the previously accumulated cumulative translation to zero at January 1, 2009. These exemptions are applied to all foreign operations in accordance with Korean IFRS 1101.
3) Deemed cost Certain items of property, plant and equipment were previously revalued under K-GAAP in accordance with the Asset Revaluation Act before the year 2000. For these assets, the Company has elected to use the K-GAAP revaluations as their deemed cost at the date of the revaluation.
39.3 iFRs mAndAtoRy exCePtionsSet out below are the applicable mandatory exceptions in IFRS 1 applied in the conversion from Korean GAAP to IFRS.
1) exception for de-recognition of financial assets and liabilitiesFinancial assets and liabilities derecognized before January 1, 2004, shall not be recognized in accordance with Korean IFRS. The Company applied the derecognition requirements in IAS 39 Financial Instruments: Recognition and Measurement prospectively for transactions occurring on or after January 1, 2004. The Company did not apply the derecognition requirements in IAS 39 retrospectively from a date of the entity’s choosing, earlier than January 1, 2004.
2) exception for estimatesThe Company’s estimates in accordance with IFRSs at the date of transition to IFRSs were consistent with estimates made for the same date in accordance with previous GAAP (after adjustments to reflect any difference in accounting policies), unless there is objective evidence that those estimates were in error.
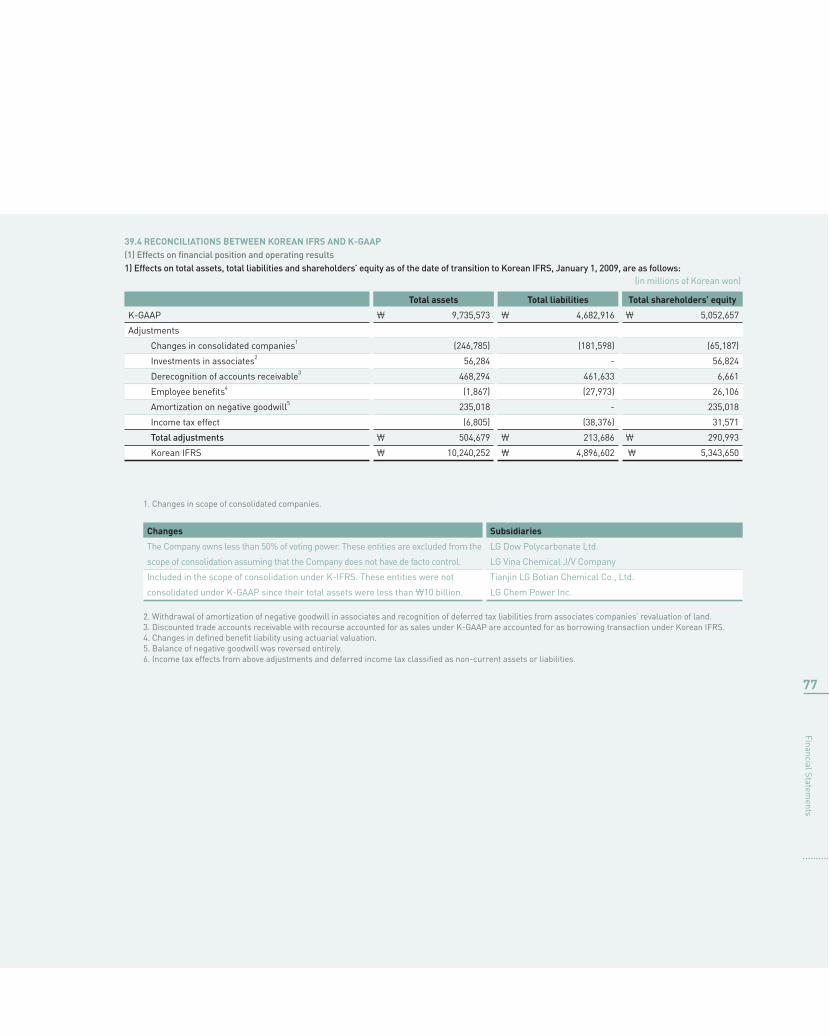
77
Financial statements
(in millions of Korean won)
K-GAAP
Adjustments
Changes in consolidated companies1
Investments in associates2
Derecognition of accounts receivable3
employee benefits4
Amortization on negative goodwill5
Income tax effect
Total adjustments
Korean IFRs
total liabilities
₩ 4,682,916
(181,598)
-
461,633
(27,973)
-
(38,376)
₩ 213,686
₩ 4,896,602
total shareholders’ equity
₩ 5,052,657
(65,187)
56,824
6,661
26,106
235,018
31,571
₩ 290,993
₩ 5,343,650
total assets
₩ 9,735,573
(246,785)
56,284
468,294
(1,867)
235,018
(6,805)
₩ 504,679
₩ 10,240,252
Changes
The Company owns less than 50% of voting power. These entities are excluded from the
scope of consolidation assuming that the Company does not have de facto control.
Included in the scope of consolidation under K-IFRs. These entities were not
consolidated under K-GAAP since their total assets were less than ₩10 billion.
subsidiaries
LG Dow Polycarbonate Ltd.
LG vina Chemical J/v Company
Tianjin LG Botian Chemical Co., Ltd.
LG Chem Power Inc.
1. Changes in scope of consolidated companies.
2. Withdrawal of amortization of negative goodwill in associates and recognition of deferred tax liabilities from associates companies’ revaluation of land.3. Discounted trade accounts receivable with recourse accounted for as sales under K-GAAP are accounted for as borrowing transaction under Korean IFRs.4. Changes in defined benefit liability using actuarial valuation.5. Balance of negative goodwill was reversed entirely.6. Income tax effects from above adjustments and deferred income tax classified as non-current assets or liabilities.
39.4 ReConCiLiAtions between KoReAn iFRs And K-GAAP(1) effects on financial position and operating results1) effects on total assets, total liabilities and shareholders’ equity as of the date of transition to Korean IFRS, January 1, 2009, are as follows:

78
LG C
hem
Ann
ual R
epor
t 201
0
deCembeR 31, 2010 And 2009, And jAnuARy 1, 2009
notes to the ConsoLidAted FinAnCiAL stAtements
(in millions of Korean won)
K-GAAP
Adjustments
Changes in consolidated companies1
Investments in associates2
Derecognition of accounts receivable3
employee benefits4
Withdrawal of amortization on negative goodwill5
Withdrawal of amortization on goodwill6
spin-off7
Income tax effect8
others
Total adjustments
Korean IFRs
Comprehensive income
₩ 1,468,952
2,902
(2,642)
(1,795)
(5,580)
(39,170)
5,130
2,227
22,011
(1,390)
₩ (18,307)
₩ 1,468,645
net income
₩ 1,533,169
4,613
(2,642)
(1,795)
4,692
(39,170)
5,130
2,227
34,169
(1,196)
₩ 6,028
₩ 1,539,197
3) effects on net income and comprehensive income for 2009 are as follows:
1. Changes in scope of consolidated companies.2. Withdrawal of amortization of goodwill and negative goodwill in associates.3. Interests from the derecognition of accounts receivable.4. Changes in defined benefit liability from using actuarial valuation.5. Cancellation of negative goodwill amortization 6. Cancellation of goodwill amortization.7. effect from the application of Korean IFRIC 2117, ‘Distribution of non-cash assets to owners’, for the spin-off of Industrial materials segment.8. Income tax effects from above adjustments
(in millions of Korean won)
K-GAAP
Adjustments
Changes in consolidated companies1
Investments in associates2
Derecognition of accounts receivable3
employee benefits4
Amortization on negative goodwill5
Withdrawal of amortization on goodwill6
Income tax effect8
others
Total adjustments
Korean IFRs
total liabilities
₩ 4,313,839
(147,863)
-
522,555
(16,167)
-
-
(74,024)
(437)
₩ 284,064
₩ 4,603,903
total shareholders’ equity
₩ 5,658,034
(56,591)
54,182
4,866
14,452
195,848
5,130
50,331
437
₩ 268,655
₩ 5,926,689
total assets
₩ 9,977,873
(204,454)
54,182
527,421
(1,715)
195,848
5,130
(23,693)
-
₩ 552,719
₩ 10,530,592
2) effects on total assets, total liabilities and shareholders’ equity as of December 31, 2009, are as follows:
1. Changes in scope of consolidated companies.2. Withdrawal of amortization of negative goodwill in associates and recognition of deferred tax liabilities from associates companies’ revaluation of land. 3. Discounted trade accounts receivable with recourse accounted for as sales under K-GAAP are accounted for as borrowing transaction under Korean IFRs.4. Changes in defined benefit liability using actuarial valuation5. Balance of negative goodwill was reversed entirely.6. Cancellation of goodwill amortization.7. Income tax effects from above adjustments and deferred income tax classified as non-current assets or liabilities.

79
Financial statements
(2) The principal Korean IFRS transition effects presented by the Company in the statements of cash flows for the year ended December 31, 2009, were as follows: According to Korean IFRS, cash flows of the related income (expenses) and assets (liabilities) are adjusted to separately disclose the cash flows from interest received, interest paid and cash payments of income taxes that were not presented separately under K-GAAP. And the effects of the change in exchange rate on cash and cash equivalents held or due in a foreign currency are presented separately from cash flows from operating, investing and financing activities.
Cash flows from operating and financing activities are adjusted respectively because some transactions are treated as borrowings with collateralised trade receivables, which were treated as a selling transaction under K-GAAP. Also, other Korean IFRS transition effects are reflected on cash flows if they have an effect on cash flow.

80
LG C
hem
Ann
ual R
epor
t 201
0
RePoRt oF indePendent ACCountAnts' ReView oF inteRnAL ACCountinG ContRoL system
to the PResident oFLG Chem, Ltd.
We have reviewed the accompanying management’s report on the operations of the Internal Accounting Control System (“IACS”) of LG Chem, Ltd. (the “Company”) as of December 31, 2010. The Company’s management is responsible for designing and operating IACS and for its assessment of the effectiveness of IACS. our responsibility is to review the management’s report on the operations of the IACS and issue a report based on our review. The management’s report on the operations of the IACS of the Company states that “based on its assessment of the operations of the IACS as of December 31, 2010, the Company’s IACS has been designed and is operating effectively as of December 31, 2010, in all material respects, in accordance with the IACS standards established by the Internal Accounting Control System operations Committee (IACSoC) of the Korea Listed Companies Association.”
our review was conducted in accordance with the IACS review standards established by the Korean Institute of Certified Public Accountants. Those standards require that we plan and perform, in all material respects, the review of management’s report on the operations of the IACS to obtain a lower level of assurance than an audit. A review is to obtain an understanding of a company’s IACS and consists principally of inquiries of management and, when deemed necessary, a limited inspection of underlying documents, which is substantially less in scope than an audit.
A company’s IACS is a system to monitor and operate those policies and procedures designed to provide reasonable assurance regarding the reliability of financial reporting and the preparation of financial statements for external purposes in accordance with accounting principles generally accepted in the Republic of Korea. Because of its inherent limitations, IACS may not prevent or detect a material misstatement of the financial statements. Also, projections of any evaluation of effectiveness to future periods are subject to the risk that controls may become inadequate because of changes in conditions, or that the degree of compliance with the policies or procedures may deteriorate.
Based on our review, nothing has come to our attention that causes us to believe that management’s report on the operations of the IACS, referred to above, is not presented fairly, in all material respects, in accordance with the IACS standards established by IACSoC.
our review is based on the Company’s IACS as of December 31, 2010, and we did not review management’s assessment of its IACS subsequent to December 31, 2010. This report has been prepared pursuant to the Acts on external Audit for Stock Companies in Korea and may not be appropriate for other purposes or for other users.
samil PricewaterhouseCoopersMarch 10, 2011

81
Financial Statements
RepoRt on the opeRations of the inteRnal accounting contRol system
to the BoaRd of diRectoRs and audit committee of lg chem, ltd.
I, as the Internal Accounting Control Officer (“IACO”) of LG Chem, Ltd. (“the Company”), assessed the status of the design and operations of the Company’s internal accounting control system (“IACS”) for the year ended December 31, 2010.
The Company’s management including IACO is responsible for designing and operating IACS. I, as the IACO, assessed whether the IACS has been effectively designed and is operating to prevent and detect any error or fraud which may cause any misstatement of the financial statements, for the purpose of establishing the reliability of financial reporting and the preparation of financial statements for external purposes. I, as the IACO, applied the IACS standard for the assessment of design and operations of the IACS.
Based on the assessment on the operations of the IACS, the Company’s IACS has been effectively designed and is operating as of December 31, 2010, in all material respects, in accordance with the IACS standards.
suk-Jeh cho, Internal Accounting Control System Officer
peter Bahnsuk Kim, Chief Executive Officer
January 28, 2011

82
LG C
hem
Ann
ual R
epor
t 201
0
deCembeR 31, 2010 And 2009
boARd oF diReCtoRs
❼ ❺ ❷
❻ ❸ ❶ ❹
❶ Peter bahnsuk Kim Vice Chairman & Ceo LG Chem, Ltd.
❷ yu-sig Kang Vice Chairman & Ceo LG Corp.
❸ suk-jeh Cho President & CFo LG Chem, Ltd.
❹ il-jin Park President, IJ International
❺ Ki-myoung nam Professor, Law School, Chungnam National University
❻ seung-mo oh Professor, School of Chemical and Biological engineering Seoul National University
❼ se-jin Kim President, Korea Asset Pricing
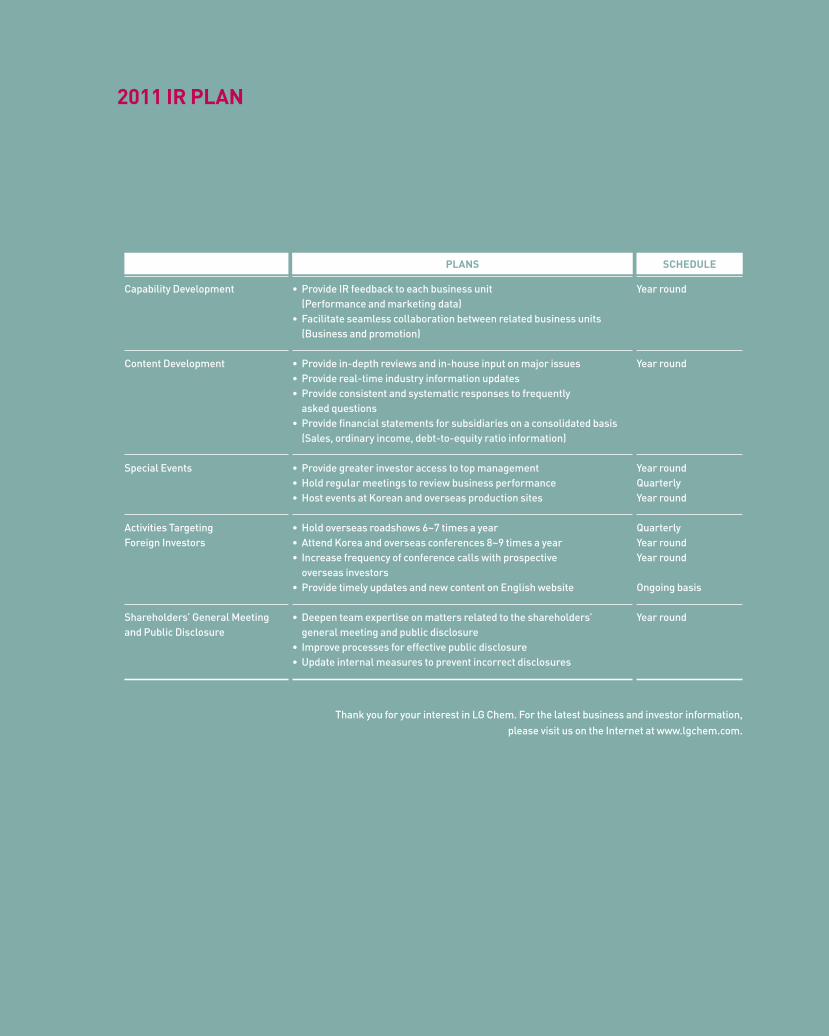
2011 iR PLAn
• Provide IR feedback to each business unit (Performance and marketing data)
• Facilitate seamless collaboration between related business units (Business and promotion)
• Provide in-depth reviews and in-house input on major issues• Provide real-time industry information updates• Provide consistent and systematic responses to frequently asked questions• Provide financial statements for subsidiaries on a consolidated basis
(Sales, ordinary income, debt-to-equity ratio information)
• Provide greater investor access to top management• Hold regular meetings to review business performance• Host events at Korean and overseas production sites
• Hold overseas roadshows 6~7 times a year• Attend Korea and overseas conferences 8~9 times a year• Increase frequency of conference calls with prospective overseas investors• Provide timely updates and new content on english website
• Deepen team expertise on matters related to the shareholders’ general meeting and public disclosure
• Improve processes for effective public disclosure• Update internal measures to prevent incorrect disclosures
Capability Development
Content Development
Special events
Activities Targeting Foreign Investors
Shareholders’ General Meeting and Public Disclosure
Year round
Year round
Year roundQuarterlyYear round
QuarterlyYear roundYear round
ongoing basis
Year round
PLAns sCheduLe
Thank you for your interest in LG Chem. For the latest business and investor information, please visit us on the Internet at www.lgchem.com.

LG Chem2010 Annual Report
2010 An
nu
al Report
LG Twin Towers, 20, Yeouido-dong, Yeongdeungpo-gu, Seoul 150-721, Korea Tel_ 82-2-3773-7227 Corporate Website_ www.lgchem.com