20081111streangthing adaptive capacity of water supply...2008/11/11 · chilung river 5 point3.6...
TRANSCRIPT

Strengthening Adaptive Capacity of
Water Supply Systems to Climate Change- the Danshuei River Watershed
Prof. Ching-pin Tung (童慶斌)Bioenvironmental Systems Engineering
National Taiwan University
Prof. Pao-shan YU (游保杉)Hydraulic and Ocean EngineeringNational Cheng Kung University
Prof. Ming-hsu Li (李明旭)Institute of Hydrological and Oceanic SciencesNational Central University

Sustainable Development Laboratory Bioenvironmental Systems Engineering
Contents
� Background and Goals
� Analysis of Current Hydrology
� Assessment of Climate Change Impacts
� Adaptations
� Final Remarks

Sustainable Development Laboratory Bioenvironmental Systems Engineering
Background
� Extensive development requires more resources
and discharges more pollutants, which may
degrade eco-environment.
� Sustainable development requires to meet the
needs of both current and future generations.
� Development of sustainable watershed
management plans is crucial, and changing
climate is the most important challenge and
should be seriously considered.
Sustainable Development Laboratory Bioenvironmental Systems Engineering
� Water resources engineering is designed
according to physical rules and statistic
information derived from historical observation.
� Those statistics are assumed to be constant in
design process.

Sustainable Development Laboratory Bioenvironmental Systems Engineering
� Climate not only changes but also is changing.
� Can hydrological statistics be constants?
� Can water resources systems still provide reliable
services in future?
� How and what should we do?

Sustainable Development Laboratory Bioenvironmental Systems Engineering
Goals of our study
� Evaluating the reliability of water supply
systems.
� Identifying effective strategies to strengthen
adaptive capacity of water supply systems,
which can
� Continuously support social and economic
developments and
� Sustainably conserve eco-environment

Sustainable Development Laboratory Bioenvironmental Systems Engineering
Study Area
- the Dan-Shuei River Watershed
Sindian River
Dahan River
Keelung River
Shih-Men Reservoir
Fei-Tsui Reservoir
• Three major Tributaries
• Sindian River
• Dahan River
• Keelung River
• Two reservoirs
• Shih-Men Reservoir
• Fei-Tsui Reservoir

Sustainable Development Laboratory Bioenvironmental Systems Engineering
Taipei District
Keelung DistrictBanxin District
Taoyuan District
Dahan River
Shih-Men
Reservoir
Fei-Tsui
ReservoirSindian River
Keelung RiverSansia River
(Dahan River)
(Figures provided by Prof. Li)

Analysis of Current Hydrology

Sustainable Development Laboratory Bioenvironmental Systems Engineering
y = 0.0974x - 1770
5
10
15
20
25
30
1960 1965 1970 1975 1980 1985 1990 1995 2000 2005YearYearYearYearRainfall Intensity(mm/day)Rainfall Intensity(mm/day)Rainfall Intensity(mm/day)Rainfall Intensity(mm/day) Rainfall IntensityLinear Fit
y = 0.0773x - 132.870
5
10
15
20
25
30
35
1961 1966 1971 1976 1981 1986 1991 1996 2001 2006YearYearYearYearRainfall Intensity(mm/day)Rainfall Intensity(mm/day)Rainfall Intensity(mm/day)Rainfall Intensity(mm/day) Rainfall IntensityLinear Fity = 0.0377x - 59.335
0
5
10
15
20
25
30
1960 1965 1970 1975 1980 1985 1990 1995 2000 2005YearYearYearYearRainfall Intensity(mm/day)Rainfall Intensity(mm/day)Rainfall Intensity(mm/day)Rainfall Intensity(mm/day) Rainfall IntensityLinear Fit
y = 0.0299x - 34.7690
5
10
15
20
25
30
35
40
45
50
1960 1970 1980 1990 2000YearYearYearYearRainfall Intensity(mm/day)Rainfall Intensity(mm/day)Rainfall Intensity(mm/day)Rainfall Intensity(mm/day) Rainfall IntensityLinear Fit
Trend of Rainfall Intensity
[Prof. Li (李明旭李明旭李明旭李明旭), NCU]
淡水站淡水站淡水站淡水站 基隆站基隆站基隆站基隆站
竹子湖站竹子湖站竹子湖站竹子湖站台北站台北站台北站台北站
Sustainable Development Laboratory Bioenvironmental Systems Engineering
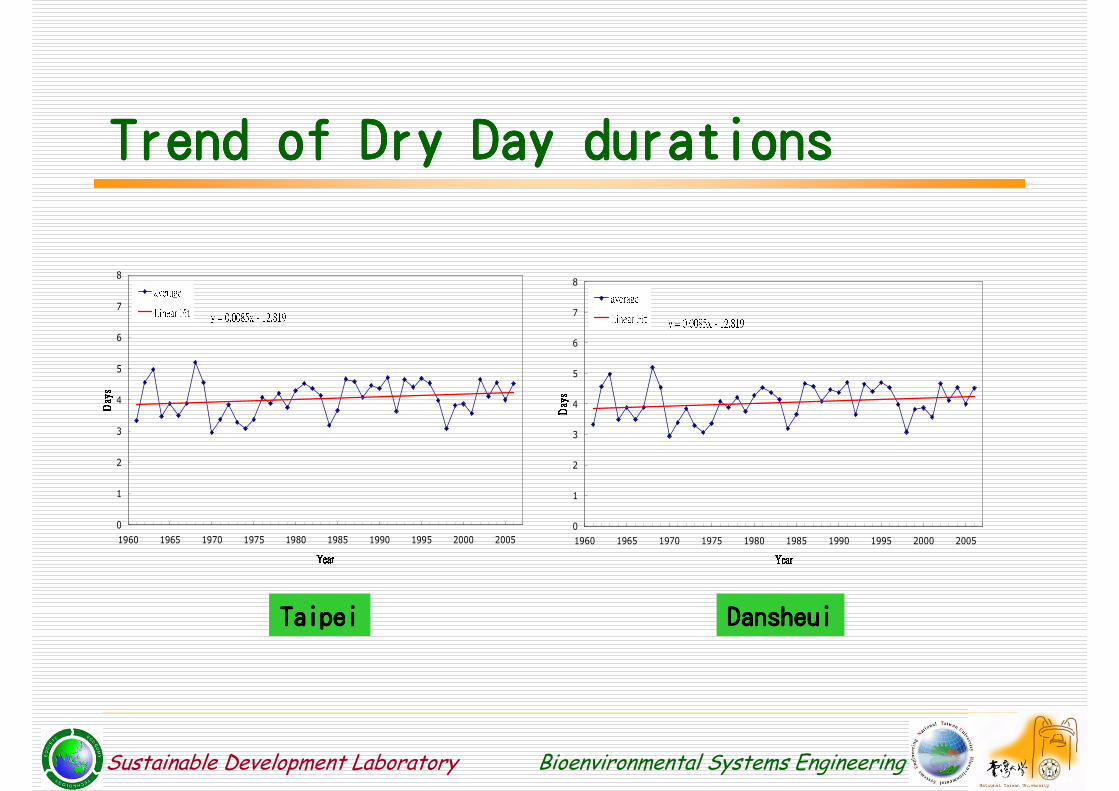
Trend of Dry Day durationsTrend of Dry Day durationsTrend of Dry Day durationsTrend of Dry Day durations
y = 0.0085x - 12.819
0
1
2
3
4
5
6
7
8
1960 1965 1970 1975 1980 1985 1990 1995 2000 2005YearYearYearYearDaysDaysDaysDays
averageLinear Fit y = 0.0085x - 12.819
0
1
2
3
4
5
6
7
8
1960 1965 1970 1975 1980 1985 1990 1995 2000 2005YearYearYearYearDaysDaysDaysDays
averageLinear Fit
TaipeiTaipeiTaipeiTaipei DansheuiDansheuiDansheuiDansheui
Sustainable Development Laboratory Bioenvironmental Systems Engineering
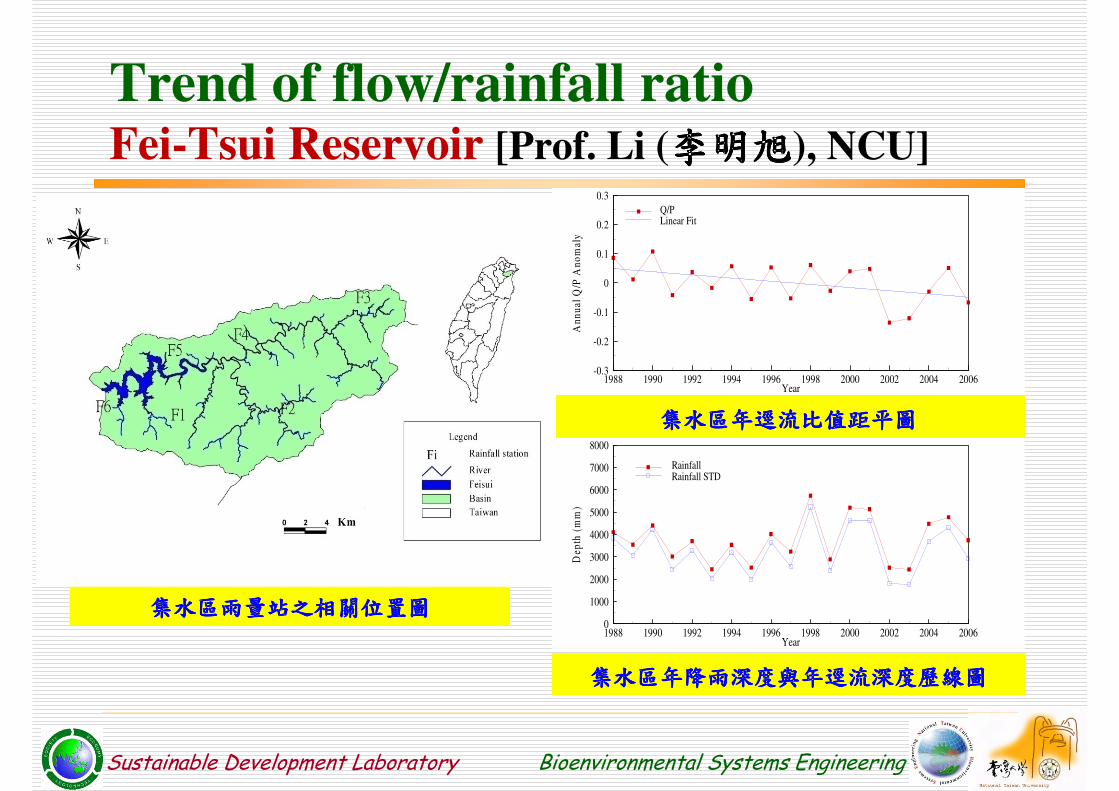
Trend of flow/rainfall ratioFei-Tsui Reservoir [Prof. Li (李明旭李明旭李明旭李明旭), NCU]
Year
An
nu
alQ
/PA
no
mal
y
1988 1990 1992 1994 1996 1998 2000 2002 2004 2006-0.3
-0.2
-0.1
0
0.1
0.2
0.3
Q/PLinear Fit
Year
Dep
th(m
m)
1988 1990 1992 1994 1996 1998 2000 2002 2004 20060
1000
2000
3000
4000
5000
6000
7000
8000
RainfallRainfall STD
集水區年逕流比值距平圖集水區年逕流比值距平圖集水區年逕流比值距平圖集水區年逕流比值距平圖
集水區年降雨深度與年逕流深度歷線圖集水區年降雨深度與年逕流深度歷線圖集水區年降雨深度與年逕流深度歷線圖集水區年降雨深度與年逕流深度歷線圖
集水區雨量站之相關位置圖集水區雨量站之相關位置圖集水區雨量站之相關位置圖集水區雨量站之相關位置圖

Assessment of Climate Change Impacts

Sustainable Development Laboratory Bioenvironmental Systems Engineering
Methodology
� Development of systematic tools to identify
vulnerable components of water supply systems
� Natural components
� Atmosphere - climate and weather
� Hydrosphere - Stream flows, groundwater
� Human components
� Facility – reservoirs, treatment plants, distribution
systems
� Management plans – demands and operations

Sustainable Development Laboratory Bioenvironmental Systems Engineering
Procedures
GCM Predictions
Downscaling
Future
Climate Scenarios
Weather Generation Hydrological Model
Impact Inoformation
for Decision Making
# # # #TO01
TO05
TO04
TO10
TO02
TO06
TO03
TO07
TO08
TO09
TO11
KY01KY02
KY03
KY04
KY05
KY06
ChuLin
TouChen
RuiFeng
SiChou
0 10 20 Km
N
EW
S
-6
-5
-4
-3
-2
-1
0
1
2
3
4
5
6 短期 中期 長期 氣候預設情境流量增減模擬個數
Water Supply System
Dynamics Model
FeiCui
Reservoir
ZhiTan Dam
QinTan Weir
BeiShi river 1
B point 1
NanShi r iver
FeiCui Rule Flow
XinDian river 1
ZhiTan Supply
XinDian river 2
QinTan Supply
FeiCui Rule A
FeiCui Rule B
FeiCui Rule C
FeiCui Power
Station
FeiCui Volume
Depth
<ZhiTan Total
Supply>
<QinTan Total
Supply>
ZhiTan Dam
Volume Depth
QinTan Weir
volume depth
ZhiTan Dam
Overflow
QinTan Weir
Overflow
ZhiTan Dam Max
Volume
QinTan Weir Max
Volume
FeiCui OverflowFeiCui Reservoir
Operation Rules Flow FeiCui Reservoir
Volume Max
ZhiTan Aqueduct
Max Capacity
ZhiTan WTP Max
Capacity
QinTan Aqueduct
Max CapacityQinTan WTP Max
Capacity
B point 2
XinDian river 3QinTan Weir
Side flow
<the tendays of
year>
<BeiShi river 1>
<NanShi river>
FeiCui Reservoir
flow

Sustainable Development Laboratory Bioenvironmental Systems Engineering
Downscaling Methods
� Simple Downscaling
� Climate changes of a local area are assumed the same as the nearest grid point
� Statistical Downscaling
� Finding the statistical relationships between regional climate and local climate.

Sustainable Development Laboratory Bioenvironmental Systems Engineering
Future Climate Scenarios
Simple Downscaling SDSM
GCMs
CGCM2
ECHAM4
HADCM3
CCSR/NIES
R30(GFDL)
CSIRO-Mk2
HADCM3
SRES A2、B2 A2、B2

Impacts on Stream Flows[Prof. Yu (游保杉游保杉游保杉游保杉), NCKU]

Sustainable Development Laboratory Bioenvironmental Systems Engineering
HBV Model
� Parameters� FC(Field Capacity)
� β、LP (Parameter)
� UZL(Outflow height)
� Recession Coefficient
� K0 (UZL)
� K1 (upper tank)
� K2 (lower tank)
� Ce (coefficient of ET)
� PERC (Percolation)
Lower
response tank
Upper
response tank
Slz
Soil
moisture
Evapotranspiration
Ssm
Rainfall
Suz
UZL
Slow responseQuick response
Runoff(Q)
Q0=K0
(Suz-UZL)
Q d=K 2
S lz
Q1=K1
Suz PERC
Qs
Lower
response tank
Upper
response tank
SlzSlz
Soil
moisture
Evapotranspiration
Ssm
Rainfall
Evapotranspiration
Ssm
Rainfall
Suz
UZL
Suz
UZL
Slow responseQuick response
Runoff(Q)
Q0=K0
(Suz-UZL)
Q d=K 2
S lz
Q1=K1
Suz
Slow responseQuick response
Runoff(Q)
Q0=K0
(Suz-UZL)
Q d=K 2
S lz
Q1=K1
Suz PERCPERC
QsQs

Sustainable Development Laboratory Bioenvironmental Systems Engineering
0 20 40 60 80 100
(%)
0
4
8
12
16
20
Flo
w (
mm
/day
)
Scenarios
A2
B2
Simulation
Impacts on Stream FlowsDry Period [Prof. Yu (游保杉游保杉游保杉游保杉), NCKU]
� FeiFeiFeiFei----Tsui Reservoir InflowsTsui Reservoir InflowsTsui Reservoir InflowsTsui Reservoir Inflows
Simple Downscaling SDSM Downscaling
0 20 40 60 80 100
(%)
0
4
8
12
16
20
Flo
w (
mm
/day
)
Scenarios
HAD3_A2
HAD3_B2
Simulation

Sustainable Development Laboratory Bioenvironmental Systems Engineering
0 20 40 60 80 100
(%)
0
10
20
30
40
Flo
w (
mm
/day
)
Scenarios
HAD3_A2
HAD3_B2
Simulation
Impacts on Stream FlowsWet Period [Prof. Yu (游保杉游保杉游保杉游保杉), NCKU]
� Keelung riverKeelung riverKeelung riverKeelung river
SDSM Downscaling
0 20 40 60 80 100
(%)
0
10
20
30
40
Flo
w (
mm
/day
)
Scenarios
A2
B2
Simulation
Simple Downscaling

Impacts on Reservoir(C.P. Tung)
圖片來源:海洋大學河海工程系
http://wrm.hre.ntou.edu.tw/wrm/dss/resr/wk.htm
(圖片來源:水利署十河局網站)

Sustainable Development Laboratory Bioenvironmental Systems Engineering
Less Active Storage
More space for flood mitigation
Flood Mitigation
232234236238240242244246248250252254
0 2 4 6 8 10 12 14 16 18 20 22 24 26 28 30 32 34 36 38 40 42 44 46 48 小時水庫水位(公尺) 壩頂標高操作上可容忍的高度HAD_A2_短期HAD_A2_中期HAD_B2_短期HAD_B2_中期HADCM3_A2_短期HADCM3_A2_中期HADCM3_B2_短期HADCM3_B2_中期月份蓄水量(百萬立方公
尺) 下限蓄水量嚴重下限蓄水量25percentile
average
75percentile
1
0
1
1 1
1
2 2 543
Less space for flood mitigation
More Active Storage
Water Supply
?

Sustainable Development Laboratory Bioenvironmental Systems Engineering
Modifications of Operational Rules due
to More Extreme Events_HADCM3

Impacts on Water Supply(C.P. Tung)
Sindian River
Dahan River
Keelung River
Shih-Men
Reservoir
Fei-Tsui Reservoir

Sustainable Development Laboratory Bioenvironmental Systems Engineering
Agriculture
Water Supply System Dynamics Model
- the Sindian and Dahan River
Feitsui
Reservoir
Chih-Tan
Dam
Ching-tan
DamSansia
Weir
Yuan-
Shan
Weir
Bei
shie
Nan
shie
Taipei
District
Taoyuan
District
Shihmen
Canal
Shihmen
Reservoir
Hou-Chiu
WeirTaoyuan
Canal
Sansia
River
Banxin
District
Dah
an
River Channel

Sustainable Development Laboratory Bioenvironmental Systems Engineering
Agriculture
Water Supply System Dynamics Model
- the Sindian and Dahan River
Chih-Tan
Feitsui
Reservoir
Chih-Tan
Dam
Ching-tan
DamSansia
Weir
Yuan-
Shan
WeirGungkuan
Changshin
Pingzheng
Shihmen
Danan
Banxin
Bei
shie
Nan
shie
Taipei
District
Lungtan
Taoyuan
District
Shihmen
Canal
Shihmen
Reservoir
Hou-Chiu
WeirTaoyuan
Canal
Sansia
River
Banxin
District
Dah
an
Treatment
PlantRiver Channel
Withdraw Ditch

Sustainable Development Laboratory Bioenvironmental Systems Engineering
Fei-Tsui
Reservoir
Chih-Tan
Dam
Ching-Tan
Weir
Pei
Pei-Shih Riverdownstream
Hsin-Tien River
upstream
Hsin-Tien River
Hsin-Tien Riverdownstream
Nan
Chih-Tan WTP
AqueductChang-Hsing
WTPKung-Kuan
WTP
Operation Rules:
1997-2013
Rule-up
Rule-down
Rule-down
seriously
volume-depth
overflow
<Nan><Total Water
Demand>
Power Station
CT Max Capacity
CH Max Capacity
KK Max
Capacity
CT 4th
capacity
CT 5th-add
capacity
<Total Water Demand>
CT Aqueduct
Capacity
Aqueduct
Capacity<Total Water
Demand><Chih-Tan WTP>
<days of year>
water to dilute
pollution
delay
<volume-depth>
combined point
separate point
The Sindian Water Supply System
Dynamics Model

Sustainable Development Laboratory Bioenvironmental Systems Engineering
Keelung Water Supply System
Dynamics Model
point3.1
ChiLung
River 1
JuiFang WTP
point3.3
ChiLung
River 2
TungShih
Keng Weir
TSK River
HsiShih
Reservoir HS River
point3.2
NuanNuan River
TSK overflow TSK water right
HS overflow
HS water right
abstraction NN2
abstraction NN1
TSK tendays
water rightpoint 3.4
ChiLungRiver 3
abstraction NN3
HsinShan
Reservoir
ChiLung
River 4
PaTu
abstraction
HsinShan
WTP
abstraction
NN4
AnLe WTP
AnLe
abstraction
point 3.6
point 3.7
MaSu River2
ChungFu WTP
MaSu River 1
point 3.9 MaLing
Keng Weir
ChiLungRiver 6
MLK water rightMLK River
LiuTu WTP
MaSu River3
point 3.10
ChiLungRiver 7
YuJui Weir
YJ River
YJ water right
point 3.11
point 3.12
ChiLung
River 8
ChiLungRiver 9
abstraction
CH1 PaoChang
Keng WeirPCK River
PCK water right
abstractionCH2
ChiLung
River 10
KangHao
Keng WeirKHK River 2KHK River 1
PaiYun WTP
KungLiao
Weir
ShuangRiver
S water right
KungLiao WTP
ChiLung inflow
TSK inflow
HS inflow
NN1 Max
Capacity
NN2 Max
CapacityMaSu inflow
YJ overflow
MLK overflow
PCK overflow
S overflow
<the ? month of year>
<JF Max
Capacity>
<Proportion of NN
WTP Responsibility>
PT tendays water right
NN3 Max
Capacity
<Proportion of NN
WTP Responsibility>
<abstraction
NN1><abstraction NN2>
<Proportion of JF
WTP Responsibility>
<LT Max
Capacity>
MLK inflow
<Proportion of LT
WTP Responsibility>
MLK tendays
water right
PCK tendays
water right
<the ? month of year>
PCK inflow
YJ tendays
water right
<Proportion of CH
WTP Responsibility>
CH1 Max
Capacity
CH2 Max
Capacity
<Proportion of CH
WTP Responsibility>
<abstraction
CH1>
YJ inflow
KHK inflow
<Proportion of PY
WTP Responsibility> <PY Max Capacity>
<Proportion ofCF WTP
Responsibility>
<CF Max
Capacity>
NN4 Max
Capacity
<Proportion of HS
WTP Responsibility>
<Proportion ofAL WTP
Responsibility>
<PT tendays
water right> NN4<NN4>
PT MaxCapacity
TaWuLun River
<AL Max
Capacity>
<HS MaxCapacity>
S inflow
<KL Max
Capacity>
<Proportion of KL
WTP Responsibility>
S tendays
water right
<the ? month of year>
point 3.5
ChilungRiver 5
point3.6

Sustainable Development Laboratory Bioenvironmental Systems Engineering
Current Water Supply Capability
(1991~2001, unit: 104 CMD)
District
W/O Ban I Project W/ Ban I Project
Demand Supply Demand Supply
Taipei 220.9 282.0220.9
348.752.6(支援板新支援板新支援板新支援板新)
Banxin 70.6 52.252.6(臺北支援臺北支援臺北支援臺北支援)
69.318.0
Taoyuan 66.8 108.9 66.8 108.9
Keelung 22.9 36.3 22.9 36.3

Sustainable Development Laboratory Bioenvironmental Systems Engineering
Trend of Water Supply CapacitySRES-A2-Simple Downscaling
-6
-4
-2
0
2
4
6
台北 板新 桃園 基隆
0%~-5%
-5%~-10%
<-10%
0~5%
5%~10%
>10%
Taipei Banxin Taoyuan Keelung

Sustainable Development Laboratory Bioenvironmental Systems Engineering
Trend of Water Supply CapacitySRES-B2-Simple Downscaling
-6
-4
-2
0
2
4
6
Taipei Banxin Taoyuan Keelung
0%~-5%
-5%~-10%
<-10%
0~5%
5%~10%
>10%

Sustainable Development Laboratory Bioenvironmental Systems Engineering
-6
-4
-2
0
2
4
6
台北 板新 桃園 基隆
0%~-5%
-5%~-10%
<-10%
0~5%
5%~10%
>10%
SDSM降尺度 A2情境 環境承載力變化趨勢
Trend of Water Supply CapacitySRES-A2-SDSM Downscaling

Sustainable Development Laboratory Bioenvironmental Systems Engineering
-6
-4
-2
0
2
4
6
台北 板新 桃園 基隆
0%~-5%
-5%~-10%
<-10%
0~5%
5%~10%
>10%
SDSM降尺度 B2情境 環境承載力變化趨勢
Trend of Water Supply CapacitySRES-B2-SDSM Downscaling

Sustainable Development Laboratory Bioenvironmental Systems Engineering
Ability to Meet Water Demand
� The Taipei District
� Water supply for the Taipei is still sufficient for
next 20~30 years, and it can deliver extra water to
other districts.
� The Banxin District
� The ability of water supply of the Banxin district
may decrease due to reduced streamflows in dry
periods. Water delivered from the Taipei district
will be a very important strategy.

Sustainable Development Laboratory Bioenvironmental Systems Engineering
� The Taoyuan district
� Water supply may decrease due to lower flows in
dry periods.
� Water demand increases significantly, which causes
more water shortage.
� Water demand management is very important.
More water sources and new facility may also be
required for the district.

Sustainable Development Laboratory Bioenvironmental Systems Engineering
� The Keelung District
� Although the ability of water supply may
increase in the Keelung district, significant
increase of demand may still result in water
deficit.
� Currently, the utilization rate of the Keelung
river is still low, more water treatment facility
could be installed to increase water supply.

Adaptations

Sustainable Development Laboratory Bioenvironmental Systems Engineering
Principles to Strengthen Adaptive
Strategies
� Identify the most vulnerable components and their
corresponding strategies.
� Insufficient water resources?
� Less flexible water management plan?
� Too many water demands?
� Develop an early warning systems to trigger actions.

Sustainable Development Laboratory Bioenvironmental Systems Engineering
Key points on Strengthening Adaptive
Capacity of Water Supply Systems
� Demand Management� Water Saving
� Land Planning
� Water Management Ability� Connecting different systems
� Natural conservation
� New Water Sources & Facility� Groundwater
� Rainfall Harvesting
� New Treatment Facility

Sustainable Development Laboratory Bioenvironmental Systems Engineering
Early Warning Systems to
Strengthen Adaptive Capacity
Action
Warning
Strengthen
Adaptive
Capacity
(a)
(b)
(c)
time
time
time
High Vulnerability
Shortage Warning
Reduce
Demand
Adaptative Capacity
Adaptative Capacity
Adaptative Capacity

Sustainable Development Laboratory Bioenvironmental Systems Engineering
Early Warning and Risk
Management Systems
Systems Time Scale Responses
Real time Hourly, Daily Operational Measures
Seasonal Season, Half year Management
Near-term Several years Management
Long-term Ten years Planning Management

Long-term Planning Adaptations to
Changing Climate
Ranking Adaptation Strategies

Sustainable Development Laboratory Bioenvironmental Systems Engineering
Decision making on Adaptation
Actions
� Taking actions depends on several factors,
including
(1)Time left to take action,
(2)Uncertainty,
(3)Effectiveness in reducing risk & vulnerability,
(4)Costs (regret or non-regret)
Action = F(T, U, E, C)
� Ranking Tool: Analytic Hierarchy Process

Sustainable Development Laboratory Bioenvironmental Systems Engineering
Example of AHP Analysis
45
Principle
GOALRanking Adaptive
Strategies in Taoyuan
Ranking Adaptive
Strategies in Taoyuan
AlternativeTa-Han River Southern
Re-allocation
(SRA)
Ta-Han River Southern
Re-allocation
(SRA)
Lung-Tan Water
Treatment Plant
Expansion(WTPE)
Lung-Tan Water
Treatment Plant
Expansion(WTPE)
Desalination Plant
(DP)
Desalination Plant
(DP)
Cost-BenefitCost-Benefit TimeTime EffectivenessEffectiveness UncertaintyUncertainty
Justice Vulnerability ReversableNo-Regret

Sustainable Development Laboratory Bioenvironmental Systems Engineering46
CostCostCostCost----BenefitBenefitBenefitBenefit TimeTimeTimeTime EffectivenessEffectivenessEffectivenessEffectiveness UncertaintyUncertaintyUncertaintyUncertainty
0.374 0.208 0.296 0.122
Weightings of all Principles
Weightings of all Alternatives
SRASRASRASRA WTPEWTPEWTPEWTPE DPDPDPDP
CostCostCostCost----BenefitBenefitBenefitBenefit 0.367 0.572 0.061
TimeTimeTimeTime 0.214 0.393 0.393
EffectivenessEffectivenessEffectivenessEffectiveness 0.293 0.266 0.442
UncertaintyUncertaintyUncertaintyUncertainty 0.379 0.152 0.469
Ranking
SRASRASRASRA WTPEWTPEWTPEWTPE DPDPDPDP
0.315 0.393 0.292
Lung-Tan Water Treatment Plant Expansion (WTPE)
is the best of the three assessed Adaptative strategies in Taoyuan.
Results
Sustainable Development Laboratory Bioenvironmental Systems Engineering

Sustainable Development Laboratory Bioenvironmental Systems Engineering
Functions
� Analyzing historical hydrological data
� Preparing climate scenarios (10 GCMs and 3 SRES
scenarios)
� Generate daily weather data
� Simulate impacts on stream flows (the HBV and
GWLF models)
� Simulate Impacts on water supply systems (Link to
a pre-developed system dynamics model, VENSIM)
� Rank adaptation strategies (Analytic Hierarchy
Process)
Sustainable Development Laboratory Bioenvironmental Systems Engineering
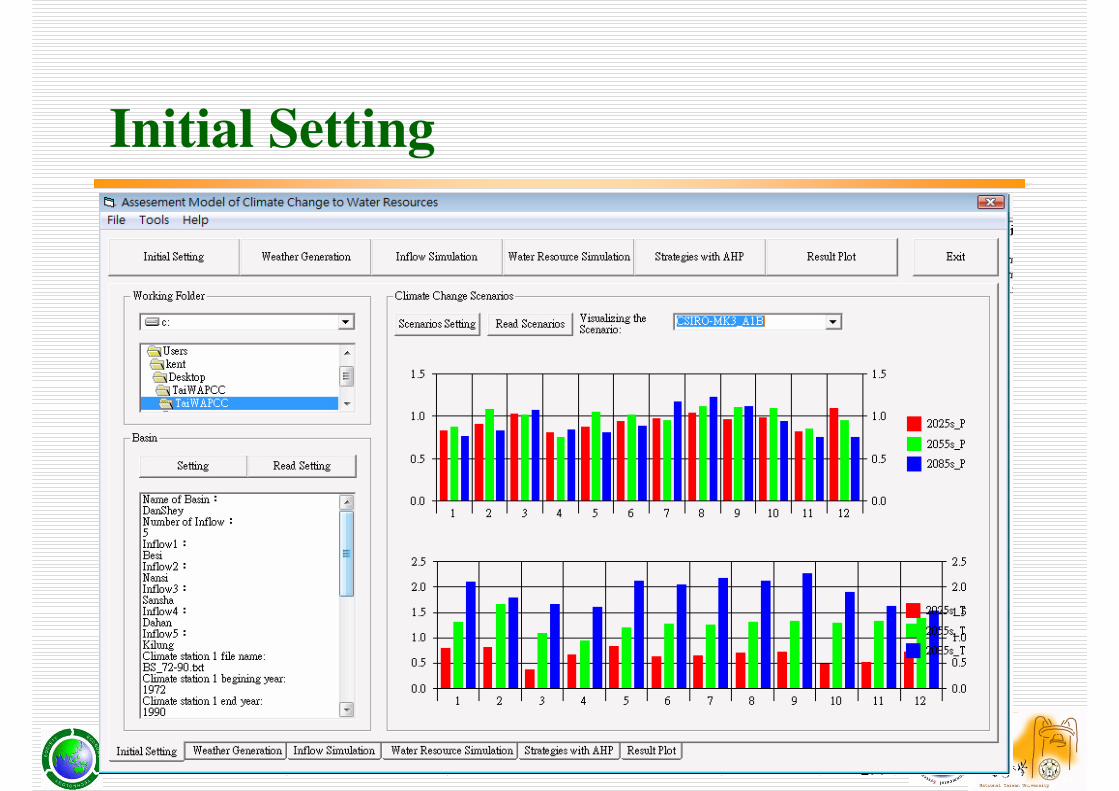
Initial Setting

Sustainable Development Laboratory Bioenvironmental Systems Engineering
Weather Generator

Sustainable Development Laboratory Bioenvironmental Systems Engineering
HBV MODEL

Sustainable Development Laboratory Bioenvironmental Systems Engineering
More functions will be added
� Better statistical downscaling methods
� Better impact simulation on water resource systems
� Agricultural Water Demands
� Groundwater
� Rainfall Harvesting Systems
� Water Quality
� Better water resources management tools
� Conjunction uses of surface and ground water
� Modification on reservoir operational rules

Seasonal Forecasts and Responses to
Climate Variability
1. Forecasts on water demand and supply
2. More flexible management strategies

Sustainable Development Laboratory Bioenvironmental Systems Engineering
Seasonal Climate Forecasts
Level
Beginning time
Ending time
Groundwater Reservoir
StreamflowIrrigation
Demand

Sustainable Development Laboratory Bioenvironmental Systems Engineering
Seasonal Storage Forecasts - January, February, March (JFM, 2002)
0
50000
100000
150000
200000
250000
1 2 3 4 5 6 7 8 9 10 11 12 13 14 15 16 17 18 19 20 21 22 23 24 25 26 27 28 29 30 31 32 33 34 35 36旬
蓄水
量(千
立方公
尺)
上限 下限 嚴重下限 預測低水位 預測高水位

Sustainable Development Laboratory Bioenvironmental Systems Engineering
Seasonal Storage Forecasts
- February, March, April (FMA , 2002)
0
50000
100000
150000
200000
250000
1 2 3 4 5 6 7 8 9 10 11 12 13 14 15 16 17 18 19 20 21 22 23 24 25 26 27 28 29 30 31 32 33 34 35 36旬
蓄水量
(千立方公
尺)
上限 下限 嚴重下限 預測低水位 預測高水位

Sustainable Development Laboratory Bioenvironmental Systems Engineering
Seasonal Storage Forecasts - March, April, May (MAM, 2002)
-50000
0
50000
100000
150000
200000
250000
1 2 3 4 5 6 7 8 9 10 11 12 13 14 15 16 17 18 19 20 21 22 23 24 25 26 27 28 29 30 31 32 33 34 35 36旬
蓄水
量(千
立方
公尺)
上限 下限 嚴重下限 預測低水位 預測高水位

Sustainable Development Laboratory Bioenvironmental Systems Engineering

Sustainable Development Laboratory Bioenvironmental Systems Engineering
Benefits of Applying Seasonal
Information
Year
Actual Estimate
Benefits(100 Million)
Stop Farming
Area
(ha)
Money paid
to Farmers(100 Million)
Stop Farming
Area
(ha)
Money
paid to
Farmers(100 Million)
200210,439(3月休耕月休耕月休耕月休耕)
4,700(5月休耕月休耕月休耕月休耕)11.8 (11.3) 10,556.4 7.7 + 4.1( +3.6)
2003 24,749 14.9 (10.6)case 1 0 0 +14.9(+10.6)
case 2 7037.6 4.2 +10.7( +6.4)
2004 36,730 22.0 (27.9) 21,112.8 12.7 + 9.3(+15.2)
2006 24,597 16.6 (13.8) 0 0 +16.6(+13.8)
Total:::: +55.6(+49.6)B/C = NT$4,960,000,000/NT$285,000 = 17,403

Sustainable Development Laboratory Bioenvironmental Systems Engineering
Final Remarks
� Sustainable uses of water resources is our goal.
The abilities to evaluate climate change and to
strengthen adaptive capacity are very important to
reach the goal.
� Uncertainty is the major constraint on taking
actions. Early warning and risk management
systems are very important for adapting to future
climate.
